Bus Rapid Transit System, Ahmedabad GIDB, GoG · PDF fileBus Rapid Transit System, Ahmedabad...
40
Bus Rapid Transit System, Ahmedabad GIDB, GoG 4.1. Introduction to Public Transport System 4.2. AMTS – Organization, Structure and Performance 4.3. Regional Transportation System – G.S.R.T.C 4.4. Railways 4.5. Intermediate Public Transport Modes 4.6. Private Bus Operation Chapter 4 Public Transportation System in the city
Transcript of Bus Rapid Transit System, Ahmedabad GIDB, GoG · PDF fileBus Rapid Transit System, Ahmedabad...

Bus Rapid Transit System, Ahmedabad GIDB, GoG
4.1. Introduction to Public Transport System
4.2. AMTS – Organization, Structure and Performance
4.3. Regional Transportation System – G.S.R.T.C
4.4. Railways
4.5. Intermediate Public Transport Modes
4.6. Private Bus Operation
Chap
ter 4
Pub
lic T
rans
port
atio
n S
yste
m in
the
city

Bus Rapid Transit System, Ahmedabad GIDB, GoG
AMC & AUDA 5-1 CEPT University
4. PUBLIC TRANSPORTATION SYSTEM IN THE CITY
4.1 Introduction to the Public Transport System
The Ahmedabad Municipal Transport Service (AMTS) functioning under the Ahmedabad Municipal Corporation (AMC), is responsible for providing the public transportation system in the city. The responsibility of providing inter-city state operations lies with Gujarat State Road Transport Corporation (GSRTC). Over the years, the AMTS has seen a rapid decline in its ridership levels, on account of stiff competition from rising two-wheeler ownership levels, lack of route rationalization and inability to upgrade its infrastructure to cater to the existing public transport demand in the city. The inability of AMTS to cater to the city’s demand has resulted in people shifting to auto-rickshaw, the shared auto-rickshaw (chakdas) and two wheelers.
4.2 AMTS - Organization, Structure and Performance
AMTS came into being on 1st April 1947 with a fleet of 112 buses when the municipal administration declared nationalization of the private companies that were plying buses in the city. The AMTS was established under the provision of Bombay Provisional Municipal Act, 1949, which functions as one of the main wings of the corporation.
4.2.1 Management and Administration
The organization is under the administrative control of a statutory committee viz., Transport Committee formed by General Board of AMC. However, the financial control lies with the General Board of the AMC. The AMTS has no capital base and AMC is providing financial assistance to AMTS, on requirement basis, in the form of an interest-bearing loans. The Transport Committee comprise of nine members, including Chairman; drawn from various fields, one of them being AMC’s Standing Committee Chairman. These members need not necessarily be elected Municipal Corporators. Transport Manager who exercises all administrative and operational powers under the control and supervision of Transport Committee heads the administration of AMTS. The Transport Manager, however, is not a member of Transport Committee.
4.2.2 Level of Operations and Coverage
AMTS caters to 2.5 lakh trips every day. About 150 routes are in operation with a fleet size of 540 buses. Fleet utilization has been consistently low. The average load factor has decreased and the number of cancelled service kms has increased.
AMTS bus route lengths average about 17 kms and range from about a minimum to 5km to a maximum of 57 kms. About 55 percent of buses operate on routes with lengths of 10 to 20 kms, with a running time of 30 to 90 minutes. The AMTS average bus stop spacing is 410

Bus Rapid Transit System, Ahmedabad GIDB, GoG
AMC & AUDA 5-2 CEPT University
meters which is convenient for passengers, but results in longer travel time and delays. In the absence of faster bus services, average operating speed of AMTS is between 15-20 kmph.
Though the primary duty of AMTS was to provide bus-services only within the municipal area, the AMTS gradually expanded its services to the areas on the outer periphery of municipal limits with the increased dependency of the city and peripheral areas with each other. As a result the operational area of AMTS grew to as high as 375 sq. kms. compared to the earlier 198 sq. kms. area of the city.
Table 4-1: Level of Operations of AMTS (1948-2005) Year-ending 31st March
Fleet-size (Buses) No. of Routes Service kms
per day Buses per lakh of population
No. of passengers per day
1948 205 38 15000 26 109024 1951 188 57 19755 21 153004 1961 337 100 44038 27 333865 1971 525 164 75757 33 541096 1981 610 205 96685 30 786301 1991 756 248 111452 24 619726 1995 705 180 115123 19 625479 1996 724 170 119563 19 683607 1997 820 164 134192 21 800822 1998 882 166 141726 22 791370 1999 882 132 150134 22 799321 2000 942 144 155675 22 757852 2001 886 140 151245 21 678861 2002 801 136 124375 18 574257 2003 687 115 81802 15 385682 2004 601 110 76028 13 325378 2005 540 117 77411 11 349653
Source: AMTS
A foremost reason for the decline in number of passengers is the decline in number of short-distance passengers due to the rise in fares and decline in the service. A significant decline in the AMTS fleet and services coupled with a significant growth in IPT modes like Auto-Rickshaw or Chhakda has been the main reasons for the decline in the market-share of AMTS.
At present AMTS have bus terminals at eleven locations in the city: Lal Darwaja, Kalupur, Sarangpur Maninagar, Hatkeshwar, Vasna, Memnagar and Vadaj being the prominent ones. A repair and maintenance workshop is located at Jamalpur, which caters to the needs of the entire AMTS fleet. The AMTS has not been able to keep up with the growing bus demand and has been operating age-old buses, which has led to an increase in their operational and maintenance expenditure and reduced efficiency. Frequent breakdowns are common phenomena.
Table 4-2: Existing AMTS Fleet % Fleet by Age in Years Year
1-4 5-8 9-10 11 & Above Fleet Size Buses on Road
1981 19.67 26.23 14.75 39.39 610 513 1991 27.38 13.89 8.86 49.87 750 594 2001 7 37 6 51 886 729
2005-March 0.55 31.30 37.04 31.11 540 371 2005-June 0.39 12.06 52.17 35.37 506 -
Source: AMTS

Bus Rapid Transit System, Ahmedabad GIDB, GoG
AMC & AUDA 5-3 CEPT University
Map 4-1: AMTS Route Network
Derived From: AMTS

Bus Rapid Transit System, Ahmedabad GIDB, GoG
AMC & AUDA 5-4 CEPT University
4.2.3 Acquisition, Replacement and Composition of Fleet
Since 2000 onwards, there has been a steady decline in the fleet. Apart from the total fleet, the over-aged fleet within the total fleet (I. e. the fleet having completed its life) has increased considerably in the recent years, resulting into unreliability in services as well as increased cost of repairs & maintenance. The share of over-aged buses in the fleet is high with an average age of 11.5 years. This has been reflected in decline in the fleet-utilization (Refer Table 4-3).
Table 4-3: Average Fleet Utilization of AMTS
Year Average fleet held
Average fleet on road
% age fleet utilization
Avg. Age of fleet (Years)
Average Age of Fleet
( Kms) 1991-2 744 612 82.26 12.06 736216 1992-3 741 593 80.03 12.01 746922 1993-4 753 604 80.21 13.26 815047 1994-5 715 589 82.38 14.44 891214 1995-6 708 598 84.46 14.10 879939 1996-7 779 659 84.60 11.56 729090 1997-8 852 693 81.34 10.48 673227 1998-9 882 738 83.67 11.48 728739 1999-0 903 752 83.28 11.75 742000 2000-1 905 729 80.55 11.82 716746 2001-2 869 630 72.50 11.54 673672 2002-3 743 410 55.18 10.94 N.A. 2003-4 620 382 61.61 10.47 - 2004-5 551 371 67.33 11.54 - Source: AMTS
The table indicates that the fleet-utilization ranging between 80 % to 84% during 90’s, remarkably declined during the recent four years to as low as at 67%.
Table 4-4: Year-wise Service-km to Scheduled km, Average Breakdowns, Bus Accidents and Average age of bus
Year Service-km to Scheduled km
(%)
Average Daily
Breakdowns
Average Breakdowns per 10000 km. Run
Bus Accidents/ lakh km.
Average Age of Bus
1961-62 N.A. 16 3.07 6.54 N.A. 1970-71 N.A. 72 9.13 4.47 N.A. 1980-81 88.35 71 7.38 1.85 9.8 1990-91 90.48 53 4.61 1.52 11.21 1991-92 94.2 51 4.26 1.41 12.06 2000-01 89.21 69 4.34 0.82 11.82
2005 80.96 52 6.39 0.72 11.54 Source: AMTS
4.2.4 Route Structure and Network
The structure and network of routes play an important role. The bus routes are more of an evolution over a period rather than based on any systematic study of travel demand. In Ahmedabad too the routes of AMTS are historically inherited and are adjusted/ patched up

Bus Rapid Transit System, Ahmedabad GIDB, GoG
AMC & AUDA 5-5 CEPT University
with the passage of time. Consequently, though the city has grown rapidly, both on eastern as well as western periphery, a large no. of routes still continue to terminate or pass through the walled city viz., at Laldarwaja or Kalupur.
AMTS extends its operations over an area of 250 sq.kms with a fleet of 540 buses per day. A majority of the bus routes are structured around the work centers that used to exist in and around the wall city. But the scenario now has changed with development of major sub-centers on the western parts of city, in addition to the new commercial development along roads such as C.G.Road, 132’ ring road and S.G.Highway. These places have also become the new entertainment destinations with upcoming malls and multiplexes. The existing AMTS route structure falls short of catering to these new developments. Moreover, in catering to a large area, the services are spread thinly and buses have to cover large distances irrespective of a sustainable demand along the route throughout. This has also led to longer journey times and waiting times at the bus stops. AMTS route lengths average about 17 kms and range from 5 kms to 57 kms. About 55 per cent of buses operate on route having lengths of 10 to 20 kms, having a running time of 30 to 90 minutes.
The average speed of an AMTS bus is 15km/hr and the average waiting time at bus stops is around 15 minutes (Louis Berger, 2000). Moreover the inefficient road network and buses plying on parallel routes have worsened the situation.
The bus trip demand analysis for the year 20001 indicates a favorable bus traffic volume along the 132’ ring road, ISKCON Temple-Kalupur and Thaltej - Kalupur. The high passenger volume seen along Ashram road is primarily because of the fact that it serves as a thoroughfare stretch for the all the bus routes plying from the bus terminals on the eastern side to the western part. The Old NH-8 stretch between Naroda and Narol also has a high travel demand. This route caters to the low-income groups residing along the Naroda-Narol highway and employed in various industrial estates beyond the highway, such as Naroda, Odhav and Vatva.
1 The year 2000 has been considered as the base year for demand projections as AMTS had the maximum buses plying on road in its entire history in this year.

Bus Rapid Transit System, Ahmedabad GIDB, GoG
AMC & AUDA 5-6 CEPT University
Fig 4-1: AMTS-All Routes
23
M
a
T
Derived From: AMTS
Most of the bus routes invariably pass through the walled city area and hence the city center is well connected to most parts of the city (Refer Fig.4-3). In 2000, of the 11,800 trips that the buses performed per day, 10,600 trips enter the Walled City. Of the 164 routes that AMTS operated, 113 routes (70%) originate or terminate in the Walled City, as three of the eleven bus terminals are located in the walled city itself. These three terminals cater to the city center, S.T. Depot and the Kalupur railway station. But areas, which are located in AUDA jurisdiction on the western periphery, do not have good bus connectivity with the eastern city considering the fact that there are a large number of west to east trips that occur in the city, due to location of industrial areas and work centers in the eastern parts of the city.
4.2.5 Fares and Occupancy Levels:
The AMTS has been realizing the average effective fare in an increasing mode on account of periodical fare-rises. However, these rises have not been adequate enough to break-even
Naroda
Concentration of Bus routes in Walled City

Bus Rapid Transit System, Ahmedabad GIDB, GoG
AMC & AUDA 5-7 CEPT University
the operations of AMTS. The details of fares realized, average lead of commuters and occupancy levels of AMTS over a period are given in table below:
Table 4-5: Year-wise Fare Levels and Occupancy Ratio
Source: AMTS
The table clearly reveals that there has been a steady decline in the occupancy ratio from around 71% during 1991-92 to around 54 % during 2004-05. This is indicative of the fact that AMTS has remarkably lost patronage to its services.
4.2.6 Financial Performance
The AMTS, as is common with other City Transport services in the nation, records losses in its operations. Some of the reasons contributory the losses could be a lack of political will to raise fares corresponding to the increase in the input prices, providing concessional travel facilities to large number of students, non-payment of travel charges by police personnel in the city, subsidized bus-travel facilities to senior citizens and physically challenged personnel, etc. besides typical unidirectional movement of commuters in the morning peak and evening peak, late night and early morning services, lower speed of buses resulting into lower productivity of personnel as well as buses, etc.
Table 4-6: Financial Performance of AMTS Year-ending Traffic
Revenue Other
Revenue Total Revenue Gross Costs Deficit
1982 1156.97 37.94 1194.91 1474.70 279.79 1991 2506.98 340.27 2847.25 3761.03 913.78 1992 3202.83 428.80 3632.63 4436.32 803.68 1993 3510.21 208.35 3718.56 4951.54 1272.98 1994 4264.94 313.19 4536.22 5501.60 965.38 1995 4572.08 187.19 4759.27 5766.99 1007.72 1996 4937.76 367.36 5305.12 6169.03 863.91
Year Average fare realized per seat km. in paise
Average passenger lead (kms) (Pass.kms / no.ofpassenger)
Occupancy Ratio (%)
1990-1 9.75 6.69 58.91 1991-2 12.04 7.16 70.83 1992-3 13.40 7.16 65.25 1993-4 14.97 7.51 63.01 1994-5 16.36 7.63 62.30 1995-6 16.98 7.77 66.85 1996-7 17.41 7.71 68.52 1997-8 19.54 7.68 62.49 1998-9 19.61 7.69 59.30 1999-0 19.80 7.80 55.72
2000-01 22.17 7.95 53.08 2001-02 24.92 7.90 54.21 2002-03 24.28 7.92 57.19 2003-04 24.42 7.82 49.99 2004-05 - 8.09 54.74

Bus Rapid Transit System, Ahmedabad GIDB, GoG
AMC & AUDA 5-8 CEPT University
Year-ending Traffic Revenue
Other Revenue Total Revenue Gross Costs Deficit
1997 5723.76 283.96 6007.72 7528.44 1520.72 1998 6921.90 234.75 7156.65 8723.21 1566.56 1999 7420.92 295.41 7716.33 10286.04 2569.71 2000 7685.09 356.01 8041.10 12214.01 4172.98 2001 8223.14 318.64 8541.78 13752.29 5210.51 2002 7607.96 448.99 8056.95 11996.53 3939.58 2003 4734.33 250.37 4984.70 10134.53 5149.84 2004 4548.37 1181.85* 5730.22 11161.79 5431.58 2005 5266.78 328.35 5595.13 9618.61 4023.48
Source: AMTS
* 114 old buses sold as steel scrap
On account of these losses from year to year, as at the end of year 2002-03 the accumulated losses to AMTS were as high as Rs.34960 lakhs.
Table 4-7: Financial Performance of AMTS Year Personnel Fuel &
oil Spare parts Depreciation Loan
charges Lease rent
/fees Rates &
taxes Others Total
80-81 147.3 69.7 43.0 20.0 40.0 0.00 9.7 16.7 346.4 90-91 462.0 148.5 77.4 21.9 109.5 27.8 18.2 59.2 924.5 91-92 487.6 173.9 91.7 15.5 137.9 50.3 19.5 77.9 1054.3 92-93 580.6 193.4 105.0 16.4 157.8 90.4 23.6 58.0 1225.2 93-94 591.0 219.7 111.3 13.8 168.4 103.8 23.7 37.9 1269.6 94-95 668.4 242.7 127.7 13.5 186.1 59.8 26.3 47.9 1372.4 95-96 756.8 239.5 124.8 14.8 159.1 52.6 26.1 36.0 1409.7 96-97 782.1 274.9 130.9 9.6 165.9 101.8 33.0 38.8 1537.0 97-98 803.8 321.9 127.0 10.3 177.6 154.7 29.8 61.2 1686.3 98-99 1008.1 326.7 105.4 10.8 200.0 158.7 19.1 48.3 1877.1 99-00 1135.6 394.7 113.2 8.4 252.0 165.1 31.5 43.2 2143.7 00-01 1305.2 501.3 108.7 8.4 324.3 168.2 24.0 20.9 2419.2 01-02 1307.1 572.1 103.7 8.5 435.2 112.0 28.3 75.7 2642.6 02-03 1715.3 614.4 110.5 11.4 798.0 91.0 27.5 26.2 3394.3 % rise
over 90-91 271.3 313.7 42.8 (-)47.9 628.8 227.3 51.1 (-)55.7 267.1
% rise over 97-98
113.4 90.9 (-)13.0 10.7 349.3 41.2 (-)7.7 (-)57.2 101.3
Source: AMTS
4.2.7 Decline in Patronage:
It was after the year 2000, that the bus patronage levels in AMTS started to decline drastically, due to insufficient bus fleet to cater to the ever-increasing needs of the population in the city, and stiff competition from intermediate modes of transport such as shared auto-rickshaws plying on the same routes as the buses. The fleet size of AMTS has come down from 886 buses in 2001 to 540 in 2005.

Bus Rapid Transit System, Ahmedabad GIDB, GoG
AMC & AUDA 5-9 CEPT University
Table 4-8: Decline in AMTS Patronage levels
Year Approximate
Population covered by AMTS (In Lakhs)
Fleet Size
Average Number of
Buses on road
Population to Bus ratio
Estimated Person
Trips/day (lakhs)
Person Trips/day (lakhs) by
AMTS
% Trips/day using AMTS
1961-62 12 - 294 4102 - - - 1970-71 17 - 432 4030 - - - 1980-81 27 610 513 5267 31.7 7.86 25 1990-91 35 750 594 5973 42.7 6.20 15 2000-01 43 886 729 5898 60.0 6.78 11
2005 47 540 371 12668 - 3.50 -
Source: AMTS
Fig 4-2 : Decline in Bus Patronage Levels
Source: IPTS Study
T rave l M ode
0%
10%
20%
30%
40%
50%
W alk Cy cle 2 W Car Auto B us Train
Y r. 2000
Y r.2003
Bus RidershipYr.2000 8.5 lakhs/d Yr.2003 5.6 lakhs/d---------------------------
Reduction 2.9 lakhs/d
T rave l M ode
0%
10%
20%
30%
40%
50%
W alk Cy cle 2 W Car Auto B us Train
Y r. 2000
Y r.2003
Bus RidershipYr.2000 8.5 lakhs/d Yr.2003 5.6 lakhs/d---------------------------
Reduction 2.9 lakhs/d
Derived From: AMTS, IPTS Study by Louis Berger, 2000.
The bus patronage declined very sharply from 2001 to 2003 by almost 5% with a comparable increase in the two-wheeler ownership.
4.2.8 Up gradation Plans-CNG Routes:
The State Government has approved 126 routes that could have CNG/LPG as fuel to meet the Bharat -II norms. Of these AMTS has so far introduced about 97 CNG buses on some of the routes in the city since 9th April 2005. The operators have been asked to ply their buses on per km basis on these routes. The contract is of five years duration with option of additional 2 years. According the contract the minimum distance to be covered by the operators in a day is 233 kms. AMC has reserved the rights of advertising with them, (as a means of revenue generation).
Table 4-9: Routes on which CNG Buses have been introduced Private Operators Sr.No. Route Nos
Mini Bus Conventional Bus AMTS Bus
1 1 2 - - 2 4 2 - - 3 5 2 - - 4 18 4 - - 5 31 10 - -

Bus Rapid Transit System, Ahmedabad GIDB, GoG
AMC & AUDA 5-10 CEPT University
Private Operators Sr.No. Route Nos Mini Bus Conventional Bus
AMTS Bus
6 34/5 5 - - 7 52/2 15 5 - 8 71/1 10 - - 9 89/3 10 - -
10 137 S 10 - - 11 146/1 10 - - 12 200 0 0 3 13 300 0 9 0
Total 80 14 3 Total CNG Fleet 97 Buses
Source: AMTS
4.2.9 Observations:
The total absence of capital base to finance various capital expenditure, both for replacement of worn out buses as also for expansion in fleet to meet with the growing needs of the city, has severely eroded financial health of AMTS by requiring it to resort to a very costly alternative of lease-finance and interest-bearing loans from AMC.
The AMTS is also required to cater to the social responsibilities in terms of providing subsidized travel facilities to large number of students, movement of police personnel in the city, physical challenged personnel, senior citizens, etc. without any reimbursement of amount of subsidy. This social responsibility, which is not obligatory on AMTS, causes unnecessary burden on its financial health.
Considerable time lag in AMTS decision on revision in fares commensurate with increase in input-prices and the actual approval by State Government, for its implementation, results in heavy losses in intervening period.
The clear absence of any effective monitoring system has resulted in the ongoing deterioration in operational efficiency including remarkable erosion in fleet utilization and occupancy - ratio of buses operated.
The poor enforcement in controlling the IPT modes of three wheelers and allowing them to operate as virtually stage carriage vehicle in contravention of legal provisions as also on roads prohibited for such operations has greatly eroded into legitimate revenue of AMTS. In number of cases these 3-wheelers operate as parallel services, carry stage-to-stage passengers on per head fare, besides overloading to very unsafe levels.
The inadequate infrastructure facilities such as full fledged depots as profit centers, also act as constraint to the efficient management of services.
4.3 Regional Transportation System-GSRTC:
GSRTC bus services are a very important component of regional travel focused on Ahmedabad. Overall 20 percent of study area trips and 80 percent of trips beyond the study

Bus Rapid Transit System, Ahmedabad GIDB, GoG
AMC & AUDA 5-11 CEPT University
area are carried by GSRTC buses. GSRTC run buses form a vital component of the transportation system of the city. They bring in sizable number of commuters from surrounding towns and villages, and most of these commuters avail of the city’s public transportation system once they terminate their journey at one of the many GSRTC drop-off points. These buses connect Sanand, Kalol, Dehgam and Bareja and other major locations with the strategic areas in Ahmedabad in a radial pattern. Everyday, approximately 200,000 (two-way) passengers arrive at the central business district in GSRTC buses and 180,000 of these leave the terminal to reach their final destination by a mode other than GSRTC bus.2
Table 4-10: GSRTC Operation from the City Sr. No. Location No. of Buses
1 Gandhinagar 330 2 Mehemdabad 179 3 Bareja 40 4 Kalol 330 5 Sanand 153 6 Dehgam 217
Source: IPTS Study, Louis Berger, 2000.
The public transportation system for the city needs to be integrated with the regional transport service to have an efficient transfer of commuters from the regional transportation service onto the city transportation service. The GSRTC has identified some locations in the city where they have planned to develop terminals, to decongest the existing GSRTC terminal located at Geeta Mandir. These interception terminals could be effectively interlinked with the public transportation system. The five main corridors by which GSRTC buses come to the city center are (Refer Map 4-2):
- Naroda-Dehgam, Naroda Himmatnagar
- Sarkhej-Bavla-Bapunagar-Rajkot-Jamnagar, Sarkhej-Viramgam
- Kalol-Mehsana
- Bareja-Baroda
- Odhav-Kapadvanj
4.4 Railways:
The railway network is broadly divided into the broad gauge and meter gauge railway lines (Refer Map 4-3). The Kalupur and Maninagar Railway stations cater to about 100 inter-state trains, out of which around 10 are commuter services. The total passenger traffic flow at Kalupur station is around 25,000 daily commuters and 22,000 long distance travelers.
2 Louis Berger, Feasibility Study on Ahmedabad Integrated Public Transit System, 2000.

Bus Rapid Transit System, Ahmedabad GIDB, GoG
AMC & AUDA 5-12 CEPT University
Kalupur and Maninagar railway stations are reasonably well connected to different parts of the city through the bus service. The only rail link between the western and eastern parts of the city across the river is a rail bridge between Sabarmati and Shahibaug. The trains arriving from Bhavnagar and Surendranagar take the meter gauge route from Vejalpur-Gandhigram-Sabarmati-Kalupur. Most of the passengers tend to get off at Gandhigram station itself as the time taken by rail to reach Kalupur from Gandhigram is around one hour, whereas it is much lesser by road. Approximately 50,000 trips are generated from Kalupur station.
Map 4-2: GSRTC routes in the city
Derived from: IPTS Study by Louis Berger, 2000.

Bus Rapid Transit System, Ahmedabad GIDB, GoG
AMC & AUDA 5-13 CEPT University
Map 4-3: Showing Railway Network
Derived from: IPTS Study by Louis Berger, 2000
4.5 Intermediate Public Transport Modes:
The intermediate modes for public transport such as the shared auto rickshaws known as “Chakdas” have proved to be stiff competition for the AMTS buses. They ply on the same

Bus Rapid Transit System, Ahmedabad GIDB, GoG
AMC & AUDA 5-14 CEPT University
routes as AMTS at comparative fares. Some of the major routes where these shared auto rickshaws (6-8 seater and 3 seater) ply are as follows:
- Hatkeshwar
- Civil-Wadaj
- Vadaj-Naranpura
- Narol-Naroda
- Narol-Sarkhej
- Vasna-Naranpura.
4.6 Private Bus Operation
Even though private buses are only supposed to operate from point to point they often pick up and drop off passengers along the way. About 35,000 to 40,000 passengers leave and an equal number arrive by private bus in the study area each day. About 1,000 long distance buses are operated daily from Ahmedabad. Private bus operators normally provide bus service from Gitamandir (near the CBS), Paldi, Shahibagh, Shahpur/Dehligate, Kankaria/Maninagar, and Bapunagar.

Bus Rapid Transit System, Ahmedabad GIDB, GoG
5.1. Introduction
5.2. Socio- Economic Characteristics
5.3. Travel Characteristics
5.4. Spatial Pattern of Passenger Movement
5.5. Summary
Ch
apte
r 5
Trav
el C
hara
cter
istic
s

Bus Rapid Transit System, Ahmedabad GIDB, GoG
AMC & AUDA 5-1 CEPT University
5. TRAVEL CHARACTERISTICS
5.1 Introduction
Travel patterns, defined in terms of trip rate, mode choice, geographical distribution etc., are the guiding principles in determining the system needs. These are determined by household / person characteristics such as income, age, sex, occupation, vehicle ownership etc., This chapter, after a brief description of critical household characteristics, attempts to describe the travel characteristics in Ahmedabad based on the IPTS Survey in 2000 and Metro Study survey in 2003.
The system needs include roadway, transit, bicycle, and pedestrian facilities, as well as services and programs that promote the use of alternate modes and other measures intended to improve the efficient use of transportation facilities.
5.2 Socio-Economic Characteristics
5.2.1 Age wise distribution of Population
As per the survey, 80% of the total population is in the active age groups. About 58% of the population are in the working age group years and another 29% in the age-group of students. About 8% of the population belongs to retired and old age category.
5.2.2 Activity Status
As presented in table below about one third of the persons are workers, about one fifth are learners who mainly contribute to two major purposes of travel; work and education. Of the 30 % workers dependency on private service or own business is in almost equal proportion (together 25-28%) with only about 4 percent engaged in government service.
Table 5-1: Distribution of Persons by Activity Status Occupation
Area govt. service
% age
private service
% age business %
ageun-
employed%
age student % age
house-wife
% age Others %
age
total % age
Walled city 8208 2 47199 13 55575 16 13307 4 70309 20 113327 32 46817 13 354743 100
AMC west 37594 5 79850 11 99842 13 22519 3 168114 22 233662 31 114200 15 755780 100
AMC east 84978 3 366688 15 267391 11 122712 5 512170 20 771237 31 374947 15 2500123 100
Remainder 121411 5 203333 9 350853 15 103109 4 474312 20 704589 30 363545 16 2321151 100
Total 252191 4 697070 12 773660 13 261648 4 1224905 21 182281 31 899509 15 5931798 100
Source: GIDB IPTS Study (2000) by LBA

Bus Rapid Transit System, Ahmedabad GIDB, GoG
AMC & AUDA 5-2 CEPT University
Fig 5-1: House Hold Distribution in Selected Cities
5.2.3 Income Distribution
Vehicle ownership, mode choice and expenditure on transport are dependent on the income levels of the household. The income data available from 2000 study reveals that nearly two third of the population of Ahmedabad falls under the category classified as economically weaker section and low-income group.
Table 5-2: Distribution of Income levels in the study area
Area Economically
Weaker Sections
%age Low
Income Group
%age Middle Income Group
%age High
Income Group
%age total
Walled city 19777 28 32871 47 14960 21 2520 4 70128 AMC west 29438 19 56870 36 47500 30 24993 16 158802 AMC East 170870 35 210974 43 89611 18 20494 4 491948
Rest of the study area
157883 32 200043 40 99176 20 41275 8 498376
Study area average
377967 31 500758 41 251247 21 89282 7 1219254
Source: GIDB IPTS Study (2000) by LBA
There are a large number of households with low-income and hence the dependence on walk and bicycle continue to be significant. Bus as mode of transport also has a potential. Similar trends have been observed in the recent survey of GIDB Metro Study (2003) by DMRC. The distribution is more balanced when compared to Surat and Bangalore.
Table 5-3: Distribution of Household According To Monthly Income
SL. NO. Income groups Number of individuals in sampled households Percentage
1 <= Rs5000 2232 42.54 2 Rs 5001-Rs 10000 1790 34.11 3 Rs 10001-Rs15000 625 11.91 4 Rs 15001-Rs 20000 303 5.77 5 > Rs 20000 276 5.26 6 No response 21 1.4 Total 5247 100
Source: DMRC (2003)

Bus Rapid Transit System, Ahmedabad GIDB, GoG
AMC & AUDA 5-3 CEPT University
Map 5-1: Income group wise Distribution of Population
EWS Households
LIG Households
MIG Households
HIG Households
Derived from GIDB IPTS Study (2000) by LBA

Bus Rapid Transit System, Ahmedabad GIDB, GoG
AMC & AUDA 5-4 CEPT University
5.2.4 Vehicle Ownership
Vehicle ownership indicates the socio economic status of the household. Surveys reveal that nearly 95 five percent of the households falling in the category of high income group own a motorized vehicle in comparison to the 76 percent under middle income and 43 percent in low income group. Under the economically weaker sections and low income groups the most common mode of vehicle owned is the bicycle. The table below enumerates the vehicle ownership percentage of the households falling under the different income group categories.
Table 5-4: Household Vehicle availability within Income groups
Source: GIDB IPTS Study (2000) by LBA
Fig 5-2: Income and Vehicle Ownership
0%
20%
40%
60%
80%
100%
120%
%Tr
ips
in e
ach
Inco
me
Gro
up
EWS<=2500
LIG 2501-5500
M IG 5501-10000
HIG>=10001
Total
Car+Motor Scooter+BicycleNo Vehicle
Derived from GIDB IPTS Study (2000) by LBA
Household Vehicle Availability Household Income (Rs./month)
No Vehicle Bicycle Motor Scooter+ Car+ Total
EWS <=2500 40% 47% 13% 1% 100%
LIG 2501-5500 19% 38% 41% 2% 100%
MIG 5501-10000 7% 17% 66% 10% 100%
HIG >=10001 2% 3% 66% 29% 100%
Total 21% 34% 39% 5% 100%

Bus Rapid Transit System, Ahmedabad GIDB, GoG
AMC & AUDA 5-5 CEPT University
Map 5-2: Spatial Distribution of Households by type of vehicle ownership
No-Vehicle Owning Households Bicycle Owning Households
2-Wheeler Owning Households
Car Owning Households
Derived from GIDB IPTS Study (2000) by LBA

Bus Rapid Transit System, Ahmedabad GIDB, GoG
AMC & AUDA 5-6 CEPT University
5.3 Travel Characteristics
5.3.1 Trip Rate
The per capita trip rate including walk, as per AMTS/CEPT (1992) was 1.2, GIDB IPTS 2000) was 1.1 trips per day, GIDB Metro study by DMRC (2003) was 1.16. The same excluding walk was 0.72. Per capita motorized trip rate was 0.52.
Table 5-5: Trips Rates and % Distribution of Trips
Per Capita Trip Purpose Total Trips % of Total
Trips Trip Rate Return Home 3211352 49.00% 0.541
Work 1722572 26.30% 0.290 Education 1137061 17.40% 0.192 Shopping 175033.7 2.70% 0.030
Recreation 26870.95 0.40% 0.005 Social 186810.2 2.90% 0.031
Religious 56694.41 0.90% 0.010 Medical 18664.23 0.30% 0.003 Other 13463.41 0.20% 0.002 Total 6548522 100.00% 1.104
Derived from GIDB IPTS Study (2000) by LBA
5.3.2 Trip Purpose
If we leave aside the return home trips, which forms half of the trips performed, work trips constitute over half of the trips performed in the city. Another 34 percent of the trips are school trips. Of the balance 14 percent trips, Social and shopping trips account for 11 percent (5.5% each). Remaining are social, recreational and other trips. Given this the focus of BRTS system plan would have to address connectivity to major work and education areas.
Table 5-6: Trip Purpose in the study area Trip Purpose Total Trips %age of total trips Per Capita Trip rate Return home 3211352 49 0.541
Work 1722572 26.3 0.29 Education 1137061 17.4 0.192 Shopping 175033.7 2.7 0.03
Recreation 26870.95 0.4 0.005 Social 186810.2 2.9 0.031
Religious 56694.41 0.9 0.01 medical 18664.23 0.3 0.003 Other 13463.41 0.2 0.002 Total 6548522 100 1.104
Source: LB - IPTS Study (2000)

Bus Rapid Transit System, Ahmedabad GIDB, GoG
AMC & AUDA 5-7 CEPT University
5.3.3 Mode choice The dominant trend in modes of transportation used for trips to work has been the decline in share of all alternatives compared to the personalized motor vehicles; there has been a significant decline in share of public transport when compared to the two wheeler and IPTS alternative. Still a large proportion (37%) walk and another 17% use bicycles. Despite this we do not allocate any special resources to create facilities for pedestrians or bicyclists! The proportion of car users are as still as low as 2.5%.
Table 5-7: Modal Split Sr No. Mode No. of Trips Percentage
1 2-wheeler 1681867 25.29 2 Car 165207 2.48 3 Shared auto-rickshaw 381356 5.73 4 Auto rickshaw 169019 2.54 5 Bus 561254 8.44 6 Train 20043 0.3 7 Cycle 1169732 17.59 8 Walk 2501356 37.62
Total 6649834 100
Source: LB - IPTS Study (2000)
25 percent of the population drove their scooters, while 2.5 percent used cars. Use of car is still limited. Auto Rickshaw and shared auto accounts for about 8.5% of trips which are likely candidates for attracting towards bus. As per DMRC report about 55% of trips are made either through walk (18%) or use bicycles (38%). Transit rider ship as a percentage of total trips was a lowly 8.4%. No distinct trend in choice of mode was observed across the trip purposes.
Table 5-8: Trip Purpose v/s Mode in The Study Area
Purpose Walk Bicycle Motor-cycle Car
Auto Rickshaw Bus
Shared Auto Others Train All Trips
Return Home 49.30% 49.00% 48.60% 49.30% 47.60% 48.80% 48.20% 47.30% 54.60% 49.00%Work 26.20% 26.30% 26.00% 25.50% 28.30% 26.70% 27.40% 26.90% 23.80% 26.30%
Education 17.30% 16.90% 18.00% 16.90% 18.40% 17.20% 17.10% 19.10% 17.40% 17.40%Others 7.20% 7.80% 7.40% 8.30% 5.80% 7.30% 7.30% 6.80% 4.20% 7.30% Total 100.00%
Source: LB - IPTS Study (2000)
Vehicular Ownership and Mode Choice: So as to understand the choice of mode a cross tabulation was made for those trips performed using motorized mode. No vehicle and only bicycle owner category of population depend more on buses. A quarter of two wheeler owners also use public transport. Car users are limited and only about 13 percent of those prefer bus.

Bus Rapid Transit System, Ahmedabad GIDB, GoG
AMC & AUDA 5-8 CEPT University
Table 5-9: Mode of Travel and Vehicle Ownership
Household Vehicle Availability Category Travel Mode No Vehicle Bicycle Motor scooter + Car + Total
Motor scooter 3% 5% 62% 47% 44% Car 1% 2% 1% 24% 3% Auto Rickshaw 8% 9% 9% 14% 10% Public Transport 79% 76% 25% 13% 38% Other Modes 8% 9% 3% 3% 5% Total 100% 100% 100% 100% 100%
Source: LB - IPTS Study (2000)
Fig 5-3: Bus Trips and vehicle ownership
Bus Trips vs Vehicle Ownership
79% 76%
25%13%
0%10%20%30%40%50%60%70%80%90%
No Vehicle Bicycle Motorscooter + Car +
Vehicle Ownership
% o
f Tot
al T
rips
Income and Mode Choice: The choice of mode shifts from walk, bicycle and bus to more personalized vehicles as we move upwards on the income group ladder.

Bus Rapid Transit System, Ahmedabad GIDB, GoG
AMC & AUDA 5-9 CEPT University
Fig 5-4: Mode Choice and Household Income
0.0%
20.0%
40.0%
60.0%
80.0%
100.0%
% T
rips
in e
ach
Inco
me
Gro
up
EconomicallyWeaker Sections
Low Income Group M iddle IncomeGroup
High Income Group
Walk
Bicycle
T-W(Driver)
T-W(Passenger)
Car Driver
Car Passenger
Auto Rickshaw
Taxi
Public Bus
Staff Bus
School Bus
School Rickshaw
Truck
Share Auto Rick.
Other
Train
Derived from GIDB IPTS Study (2000) by LBA
Fig 5-5: Vehicle ownership and mode of travel
Zone wise generated trips using different modes have been presented below. It is evident that east, north-west and south west areas are more potential areas for buses.
0%
20%
40%
60%
80%
100%
% T
rips
in e
ach
Vehi
cle
Ow
ners
hip
Gro
up
No Vehicle Bicycle M otorscooter + Car + Total
Vehicle Ownership vs Mode of Travel
Other ModesPublic TransportAuto RickshawCarMotorscooter
Derived from GIDB IPTS Study (2000) by LBA

Bus Rapid Transit System, Ahmedabad GIDB, GoG
AMC & AUDA 5-10 CEPT University
a) Zone-wise Demand for Bus Total bus trips generated in study area are 910264.
b) Zone-wise Demand for Bicycles
Total bicycle trips generated in the study area are 1005100.

Bus Rapid Transit System, Ahmedabad GIDB, GoG
AMC & AUDA 5-11 CEPT University
c) Zone-wise Demand for 2-wheelers
Total Trips generated by two wheelers in the study area are 1216708.
d) Zone-wise Demand for shared auto
Total Trips generated by auto rickshaws/shared auto rickshaws in the study area are 420462.

Bus Rapid Transit System, Ahmedabad GIDB, GoG
AMC & AUDA 5-12 CEPT University
e) Zone-wise Demand for Cars
Total Trips generated by two wheelers in the study area are 87490.
Age and Mode Choice: Close correlation in the age and mode choice is observed. The survey indicates more percentage of walk trips being performed in the age groups below 15 years and above 50 years. In Contrast the age groups in between 15 to 50 years prefer two wheelers and other motorized form of transport.
0%
20%
40%
60%
80%
100%
120%
<4 5-12 13-17 18-22 23-35 36-45 46-58 59-75 >75 Total
Age of Population in Years
% O
f Tot
al T
rips
in th
e Gro
up
WalkBicycleT-W(Driver)T-W(Passenger)Car DriverCar PassengerAuto RickshawTaxiPublic BusStaff BusSchool BusSchool RickshawTruckShare Auto Rick.OtherTrainGrand Total
5.3.4 Trip length Average trip length including walk trips is 4.6 kms. Bus trips are longer with 12 kms as average trip length. 2-wheelers travel about 6.8 kms, cars 11 kms staff bus 22 kms. Few
Fig 5-6: Age and Mode Choice

Bus Rapid Transit System, Ahmedabad GIDB, GoG
AMC & AUDA 5-13 CEPT University
who travel by train commute for about 37 kms. Average walk trips are 0.9 km longer and average bicycle trips are 3.6 kms longer. Trip lengths by purpose vary significantly. Work trips on an average are 5.6 kms longer. Longest trips are by train commuters (34.6Km) fallowed by staff bus 22.8 km. Of the education trips, walk trip lengths are 0.8 km, bicycle 2.6 km, Auto-rickshaw 3.8 km, bus 10.2 km, school bus 7.4 kms with an average of 2.7 kms.
Fig 5-7: Trip Length Distribution and Age Group
Trip Length Distribution by Age
0.0%
10.0%
20.0%
30.0%
40.0%
50.0%
60.0%
1 4 7 10 13 16 19 22 25 28 31 34 37 40 43 46 49 52 55 58 61 64 67
Trip Length in KM
% o
f trip
s in
eac
h ca
tego
ry
<4
5-12
13-17
18-22
23-35
36-45
46-58
59-75
>75
Table 5-10 : Trip Length and Age Group Age Group (%) Distance
in KM <4 5-12(Yr) 13-17 18-22 23-35 36-45 46-58 59-75 >75 Total
<1 28.6 25.4 16.2 8.1 8.7 9.1 9 13.9 26.3 13 1-3 35.5 `59.3 60.3 36 36.8 36.5 33.1 38.7 41.7 43.1 3-5 13.4 8.3 11.2 13.5 14.3 16 14.4 12.8 16.1 12.9 5-7 8 3.5 5.2 10.1 10.5 9.6 10.4 10.1 1.6 8.3 7-9 6.5 1.7 2.9 10.2 8.9 8.6 9.6 7.9 9.8 7
9-12 3.8 0.9 1.7 7.9 7.5 7.3 8.7 6.7 0 5.7 12-15 0.5 0.3 1.1 4.8 4.2 4 4.8 2.5 2.4 3.2 15-25 1.7 0.4 0.8 6 5.5 5.3 6.3 5 0 4.1 >25 2.1 0.2 0.6 3.4 3.7 3.7 3.7 2.5 2.1 2.6
100
5.3.5 Women and Travel Trips
Average daily number of trips made by women are1555000 trips (2000) constituting about of
the total trips. Most of them walk (63%). About 12% depend on buses. Trip lengths made by
women are also shorter.
Bus Rapid Transit System, Ahmedabad GIDB, GoG
AMC & AUDA 5-14 CEPT University
Trip Length Distribution of Female Trips
0%10%
20%30%
40%50%
Bel
ow 1 2 4 6 8 10 12 14 16 18 20 22 24 26 28 30
Trip Length in KM
% o
f Tot
al T
rips
Mode Choice of Female Trips
Walk63%
Bus12%
School Rickshaw5%
Others3%Auto Rick.
2%
Bicycle5%
TW9%
Car1%
Derived from GIDB IPTS Study (2000) by LBA
Derived from GIDB IPTS Study (2000) by LBA

Bus Rapid Transit System, Ahmedabad GIDB, GoG
AMC & AUDA 5-15 CEPT University
Table 5-11: Percentage Trips Purpose and Mode of Travel
Table 5-12: Trip Length and Mode of Travel
Walk BicycleT-
W(Driver)W(Passeng
er) Car DriverCar
PassengerAuto
Rickshaw Taxi Public Bus Staff BusSchool
BusSchool
Rickshaw TruckShare Auto
Rick. Other Train Grand TotalHome 20.7% 7.7% 8.0% 1.0% 0.4% 0.2% 0.5% 0.0% 6.3% 0.2% 0.2% 1.5% 0.1% 1.2% 0.9% 0.1% 49.02%Work 7.2% 5.5% 6.9% 0.5% 0.4% 0.1% 0.2% 0.0% 3.3% 0.3% 0.0% 0.0% 0.1% 0.9% 0.9% 0.1% 26.29%Education 10.6% 1.9% 0.6% 0.3% 0.0% 0.0% 0.1% 0.0% 2.1% 0.0% 0.2% 1.5% 0.0% 0.1% 0.1% 0.0% 17.44%Shopping 1.6% 0.2% 0.3% 0.0% 0.0% 0.0% 0.1% 0.0% 0.4% 0.0% 0.0% 0.0% 0.0% 0.1% 0.0% 0.0% 2.70%Recreation 0.1% 0.0% 0.1% 0.0% 0.0% 0.0% 0.0% 0.0% 0.0% 0.0% 0.0% 0.0% 0.0% 0.0% 0.0% 0.0% 0.41%Social 0.8% 0.2% 0.7% 0.2% 0.1% 0.0% 0.1% 0.0% 0.6% 0.0% 0.0% 0.0% 0.0% 0.1% 0.0% 0.0% 2.76%Religion 0.5% 0.0% 0.1% 0.1% 0.0% 0.0% 0.0% 0.0% 0.1% 0.0% 0.0% 0.0% 0.0% 0.0% 0.0% 0.0% 0.90%Medical 0.0% 0.0% 0.0% 0.0% 0.0% 0.0% 0.0% 0.0% 0.1% 0.0% 0.0% 0.0% 0.0% 0.0% 0.0% 0.0% 0.27%Serve Passenger 0.0% 0.0% 0.0% 0.0% 0.0% 0.0% 0.0% 0.0% 0.0% 0.0% 0.0% 0.0% 0.0% 0.0% 0.0% 0.0% 0.03%Transfer Mode 0.0% 0.0% 0.0% 0.0% 0.0% 0.0% 0.0% 0.0% 0.0% 0.0% 0.0% 0.0% 0.0% 0.0% 0.0% 0.0% 0.14%Other 0.0% 0.0% 0.0% 0.0% 0.0% 0.0% 0.0% 0.0% 0.0% 0.0% 0.0% 0.0% 0.0% 0.0% 0.0% 0.0% 0.04%Grand Total 41.7% 15.5% 16.8% 2.1% 0.8% 0.4% 1.1% 0.0% 12.9% 0.5% 0.3% 2.9% 0.2% 2.4% 2.0% 0.3% 100.00%
MajorMode
Trip Purpose/ Mode
PurposeToCode Walk BicycleT-W
(Driver)T-W
(Passenger)Car
DriverCar
PassengerAuto
Rickshaw TaxiPublic
BusStaff Bus
School Bus
School Rickshaw Truck
Share Auto Rick. Other Train
Grand Total
Home 0.9 3.6 6.8 5.8 10.4 10.1 4.8 17.3 12.0 22.4 7.1 3.6 21.8 5.4 5.2 37.1 4.5Work 1.1 4.0 7.0 6.4 12.9 13.8 6.3 30.0 12.1 22.8 5.4 18.9 5.0 5.1 34.6 5.6Education 0.8 2.6 6.1 2.9 4.5 5.2 3.8 25.0 10.2 14.0 7.4 3.5 4.0 3.5 45.0 2.7Shopping 0.7 3.8 6.2 4.3 7.7 5.4 3.4 11.0 11.9 5.2 10.2 21.5 3.5Recreation 1.3 3.7 4.9 6.5 5.0 6.6 3.9 19.5 10.0 11.1 10.0 18.0 5.9Social 1.0 3.7 6.1 7.3 9.2 13.2 5.3 16.3 14.7 30.0 37.9 6.4 17.2 6.8Religion 1.1 2.7 5.3 4.3 4.0 5.9 8.5 22.6 6.6 23.7 30.0 4.5Medical 0.8 4.6 4.9 4.9 1.0 4.5 11.2 6.0 5.5 5.9Serve Passenger 1.0 5.0 10.7 3.6 7.5 5.2Transfer Mode 1.1 4.5 5.4 2.0 6.0 15.8 16.5 17.4 87.3 59.0 14.9Other 0.4 7.0 4.8 3.0 9.0 9.4 4.9Grand Total 0.9 3.6 6.8 5.6 11.2 10.6 5.1 19.8 12.0 22.4 7.2 3.6 21.8 5.3 5.6 36.8 4.6
Bus Rapid Transit System, Ahmedabad GIDB, GoG
AMC & AUDA 5-16 CEPT University
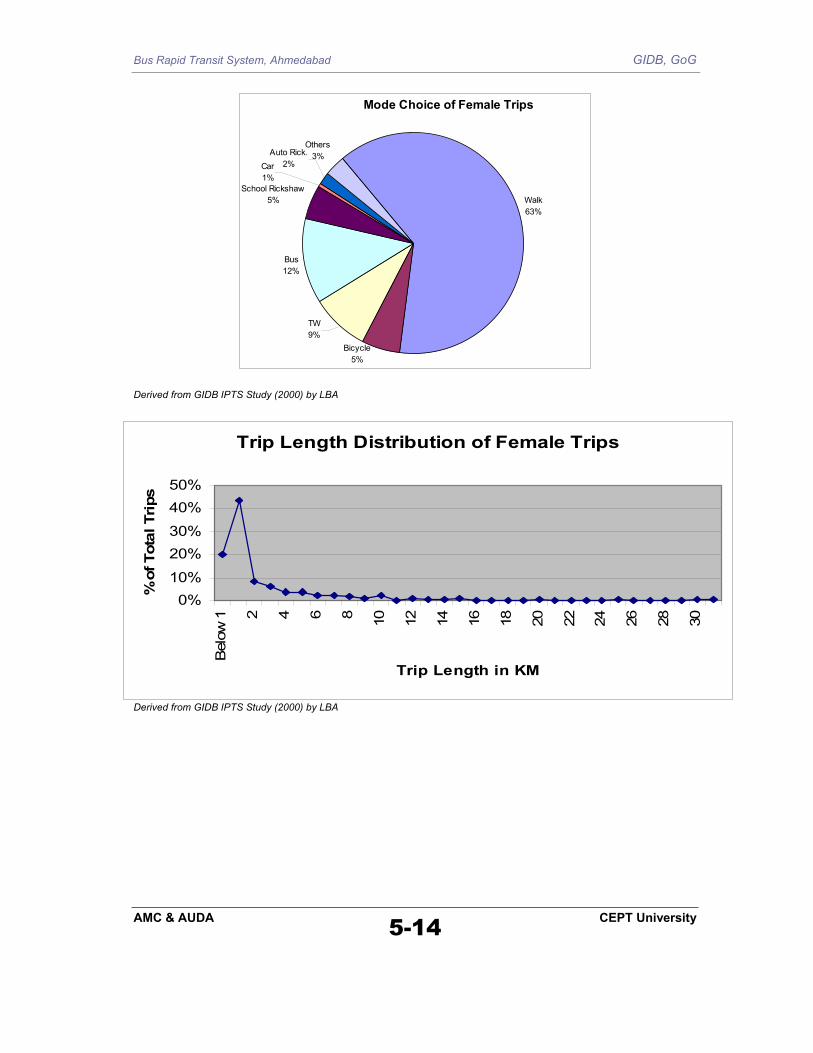
5.3.6 Monthly Expenditure on Travel
In Ahmedabad on an average a person spends about Rs.103 on travel every month which is
quite low.
Fig 5-8: Monthly expenditure on travel
Vehicle Ownership and Monthly Expenditure on Transport
0%
5%
10%
15%
20%
25%
30%
0
200-29
9
500-59
9
800-89
9
1100
-119
9
1400
-149
9
1700
-179
9
2000
-209
9
2300
-239
9
2600
-269
9
2900
-299
9
3200
-329
9
3500
-359
9
3800
-389
9
Expenditure on Transport Rs.
% o
f Tot
al in
Eac
h In
com
e G
roup
No. VehicleT-W+CycleCar+Grand Total
Derived from GIDB IPTS Study (2000) by LBA
5.4 Spatial Pattern of Passenger Movement
The outcome of interaction between socio-economic characteristics, land use and transport system results in a movement pattern. The movement patterns generated, based on origin-destination table for the years 2000 and 2003, have been depicted in the form of desire-lines.
From the maps below it is evident that still the movements across the river are very large. As expected, the walled city (Kalupur, Gita Mandir), Naroda, Odhav, Vatva industrial estates, Ashram Road, CG Road, 132 feet ring road and Highway are major trip attraction places. More detailed description is provided in subsequent chapter.

Bus Rapid Transit System, Ahmedabad GIDB, GoG
AMC & AUDA 5-17 CEPT University
Fig 5-9: Desire line Diagram - 2000 (Total Zone-Zone Movement in excess of 300 Trips)
Fig 5-10: Desire line Diagram - 2003

Bus Rapid Transit System, Ahmedabad GIDB, GoG
AMC & AUDA 5-18 CEPT University
5.5 Summary
Analysis indicates the following trends that are observed, to be taken into consideration while designing a Bus Rapid Transit Plan for the city of Ahmedabad.
• A large proportion of the city population falls under low and middle income category. Over 55 percent do not own any motorized vehicles and hence captive to public transport.
• A large proportion of the population either walks or use bicycle. Hence needs for improvements in related facilities are a necessity.
• Trip lengths are still shorter mainly due to land use and density distribution. Opportunities for enhancing further compactness of the urban structure need high priority while designing the system.
• Deterioration in public transport has resulted in increased patronage of two wheeler and shared auto mode. A good and quality bus service should still be able to recover some of the traffic lost to the other motorized modes of transport.
• At present, though the use of car as a mode does not form a significant number, the rise would be significant in a short period (as in the case of Banglore). This would lead to severe clogging on the roads.

Bus Rapid Transit System, Ahmedabad GIDB, GoG
6.1. Background
6.2. Challenges and Opportunities
6.3. Major Initiatives
6.4. Role of Bus Transport in Ahmedabad
C
hapt
er 6
SYS
TEM
NEE
DS &
INIT
IATI
VES

Bus Rapid Transit System, Ahmedabad GIDB, GoG
AMC & AUDA 6-1 CEPT University
6. SYSTEM NEEDS & INITIATIVES
6.1 Background
Ahmedabad public transit system is at a crossroads. After over 5 decades of operation, AMTS has lost its glory. Services have deteriorated and the image has taken a major beating. Financially the organization is in a severe crisis situation. The effects of this are system wide and have become visible in the fact that the city has received the dubious distinction of becoming a highly polluted city in the country. However in terms of congestion, traffic accidents and other parameters the city has still not reached a position of from where recovery is not possible. There could not be a more appropriate time to take a critical look at the significant challenges and opportunities facing public transit in the city.
6.2 Challenges and Opportunities
Today, Key challenges facing the city region that specifically impact public transit include:
Rapid Growth: The city continues to experience growth at a moderate rate. Indications towards urban sprawl are being observed. Employment decentralization beyond urban limits, large open lands within the city are areas of concern that will affect future transport needs. Location of malls and other such activities inside is likely to alter the travel pattern significantly. Old city revitalization (walled city and eastern part) is a critical complimentary objective. Transit oriented land use development strategies need consideration.
Socio-economic Changes: More women participate in the work force. Their travel needs to be focused specifically. With wealth also come the changes in life-style trends, which are personalized transport intensive. Parking strategy and other demand management strategies require focus. Social trips are on the rise. These result in much more complex and varied travel need requiring broad based, wider area coverage oriented transit service system plan.
Transit Patronage: Over the years transit patronage has declined and has reached its minimum in 5 decades of existence of AMTS. The plan hence is not a gap filling exercise, as the market has been lost to other modes of transport. In fact the effort has to be strategic in nature with a focus on stopping further erosion in transit passenger patronage, retrieve whatever has been lost and then bid for a larger share of travel demand on to public transit. This can only be possible with adequate, affordable, convenient, quality public transport service. Of course demand is growing significantly.
Cycling and Walking: Cycling and walking together constitute 54% of trips, to which very little attention is given. Cyclists are the major victims of road accidents. Promotion of these modes needs to be a complimentary activity to public transport development.

Bus Rapid Transit System, Ahmedabad GIDB, GoG
AMC & AUDA 6-2 CEPT University
System Improvement Focus: Given the strategic nature of the project envisaged, the objective is to enhance accessibility and mobility options of the people of the city as a whole in an integrated framework rather than a limited part intervention focused only on bus or rail.
Resource Mobilization: It is needless to overemphasis that public resources have shrunk over the years and there are too many other tough priorities. While on the one hand supply needs to be enhanced beyond critical minimum threshold, plans and programmes have to evolve mechanisms, which can enable recovery of most or all of the infrastructure development costs. Efficiency gains, wherever possible, through private participation need to be attempted.
6.3 Major Initiatives
In the light of these and with the objective to promote and enhance regional mobility and serve the public by providing quality transit services and solutions that improve the overall quality of life of the residents of Ahmedabad, the Government of Gujarat (GIDB, AMC and AUDA) is considering building of a metro transport facility, up gradation of regional rail facility and the present initiative of BRTS. This is over and above the ongoing effort on road improvement, traffic management, procuring CNG buses by AMC and AUDA at various levels.
The highlights of the rapid transit system under consideration in Ahmedabad are presented
below:
- A Metro Rail System - A Regional Rail System - A Bus Rapid Transit System - A Regular Bus System
Metro Rail System:
Through the initiative of the state, DMRC in collaboration with RITES have developed
proposals for a Metro system and a Regional Rail Development Proposal in Ahmedabad.
Metro has been proposed within the city, by connecting areas in core Ahmedabad with other areas such as Gandhinagar, Sarkhej, Iskcon and Thalthej under two phase planning. The details of the phasing of the corridors are given below –
Phase 1 has been planned from a) Vishala Vasna to Akshardham through Ashram Road covering a route length of 32 kms with 30 stations and from b) Kalupur to Thalthej covering a route length of 9.6 kms with 11 stations.
Phase 2 has been planned from a) Sarkhej to Indroda Circle via NH8C covering a route length of 32 kms with 16 stations and from b) Vishala to RTO through 132 feet ring road covering a route length of 13 kms with 11 stations.

Bus Rapid Transit System, Ahmedabad GIDB, GoG
AMC & AUDA 6-3 CEPT University
The estimated cost for developing the first phase of metro is 3180 crores while the full system would be developed with an investment of 7473.75 crores.
Map 6.1: MAP showing Metro Corridor Proposals for Phase 1 and Phase 2
NARMADA MAIN CANAL
NARMADA MAIN CANAL
0 2.5 5.0 7.5 10.0 20.0 Km
SCALE
MEHEMDABAD
DEHGAM
METRO CORRIDOR - PHASE 1METRO CORRIDOR - PHASE 2SUBURBAN RAIL PROPOSAL
PROPOSED METRO STATIONSPROPOSED SUBURBAN RAIL STATIONS
Table 6-1: Metro Proposal
Section Length (km)
Number of Passengers (lakhs)
Passenger km (lakhs)
Passenger km/km (lakh) Cost
Line1: Changodar-Vishala-ITO-Sabarmati-
Akshardham 45.1 13.27 126.85 2.81
3382.5
Line2: Kalupur- ITO- thaltej 9.65 6.28 52.81 5.47
723.75
Line3: Vishala-RTO 12.5 2.25 20.56 1.65 937.5 Line4: Sarkhej- Indroda Circle 32.4 8.18 87.61 2.7
2430
Total 99.65 29.98 287.83 12.63 7473.75
Source: DMRC & Rites

Bus Rapid Transit System, Ahmedabad GIDB, GoG
AMC & AUDA 6-4 CEPT University
Regional Rail System:
Currently under consideration the proposed regional rail system spread over a length of 153 kms connecting Core Ahmedabad with Naroda, Kalol, and Barejadi. The proposed corridor has 25 rail stations.
Table 6-2: Regional Rail Proposal
Section Length (km)
Number of Passengers (lakhs)
Passenger km (lakhs)
Passenger km/km (lakh) Cost
Line1: Barejadi-Kalupur-Kalol 43.5 2.47 34.3 0.79
957
Line2:Kalupur-Naroda 9.4 1.65 13.73 1.46 206.8 Total 52.9 4.12 48.03 2.25 1163.8
Source: DMRC & Rites
6.4 Role of Bus Transport in Ahmedabad
Need for resurrecting the role of public transport system is evident in the fact that air quality is deteriorating and congestion is increasing. A planned progressive improvement has been envisaged as below. The scenario developed aim at increasing the public transport share from the present 7% to 40% over a period of 10 years. Till the year (probably 2015) other rail based public transport system is realized, it is envisaged to have bus based public transport only in the following form:
Existing A.M.T.S System • AMTS Own Fleet • Private Fleet under AMTS
Proposed BRTS System • Exclusive BRTS Service • BRTS Mixed Service (Other Corridors)
Depending on the target service population and basic bus operations characteristics demand for bus service has been estimated and presented below.
Table 6-3: Public Transport Demand Parameters
Sl. No Population Forecast (lakhs)
Trip Rate Total Trips (lakh)
Target Public Transport Share %
No. of Passangers (Public Transport)
lakhs
Passenger Lead (kms)
Pass. Kms per Day
2005 49 1.05 51.45 7 3.6 8 28.8 2006 50 1.05 52.5 10 5.3 8 42.0 2007 51 1.08 55.08 20 11.0 8 88.1 2008 52 1.08 56.16 20 11.2 8 89.9 2009 53 1.08 57.24 25 14.3 8 114.5 2010 54 1.08 58.32 30 17.5 8.5 148.7 2011 55 1.1 60.5 30 18.2 8.5 154.3 2012 56 1.1 61.6 35 21.6 8.5 183.3 2013 58 1.15 66.7 35 23.3 8.5 198.4 2014 59 1.15 67.85 40 27.1 8.5 230.7

Bus Rapid Transit System, Ahmedabad GIDB, GoG
AMC & AUDA 6-5 CEPT University
2015 60 1.15 69 40 27.6 8.5 234.6
Table 6-4: Bus Operating Characteristics and Fleet Requirements
Year Occupancy Ratio Avg. carrying Capacity/Bus
Vehicle Utilization (kms)/ Day
Fleet. Utilization
Total Fleet Required
2005 55 61 211 72 562 2006 60 55 214 81 738 2007 60 54 238 93 1215 2008 65 55 243 93 1110 2009 65 55 248 91 1424 2010 65 55 244 91 1876 2011 70 63 244 91 1565 2012 70 63 241 90 1911 2013 70 63 243 91 2049 2014 70 63 245 91 2337 2015 70 63 248 91 2336
The system plan being developed and presented in the subsequent chapters take this discussion as basis