Harmonic Analysis Report - Power Quality Specialists | Harmonic
Aalborg Universitet
Bus Participation Factor Analysis for Harmonic Instability in Power Electronics BasedPower Systems
Ebrahimzadeh, Esmaeil; Blaabjerg, Frede; Wang, Xiongfei; Bak, Claus Leth
Published in:I E E E Transactions on Power Electronics
DOI (link to publication from Publisher):10.1109/TPEL.2018.2803846
Publication date:2018
Document VersionPublisher's PDF, also known as Version of record
Link to publication from Aalborg University
Citation for published version (APA):Ebrahimzadeh, E., Blaabjerg, F., Wang, X., & Bak, C. L. (2018). Bus Participation Factor Analysis for HarmonicInstability in Power Electronics Based Power Systems. I E E E Transactions on Power Electronics, 33(12),10341 - 10351. [8310606]. https://doi.org/10.1109/TPEL.2018.2803846
General rightsCopyright and moral rights for the publications made accessible in the public portal are retained by the authors and/or other copyright ownersand it is a condition of accessing publications that users recognise and abide by the legal requirements associated with these rights.
- Users may download and print one copy of any publication from the public portal for the purpose of private study or research. - You may not further distribute the material or use it for any profit-making activity or commercial gain - You may freely distribute the URL identifying the publication in the public portal -
Take down policyIf you believe that this document breaches copyright please contact us at [email protected] providing details, and we will remove access tothe work immediately and investigate your claim.
IEEE TRANSACTIONS ON POWER ELECTRONICS, VOL. 33, NO. 12, DECEMBER 2018 10341
Bus Participation Factor Analysis for HarmonicInstability in Power Electronics Based Power Systems
Esmaeil Ebrahimzadeh , Student Member, IEEE, Frede Blaabjerg , Fellow, IEEE,Xiongfei Wang , Senior Member, IEEE, and Claus Leth Bak , Senior Member, IEEE
Abstract—Compared with the conventional power systems,large-scale power electronics based power systems present a morecomplex situation, where harmonic instability may be induced bythe mutual interactions between the inner control loops of the con-verters. This paper presents an approach to locate which powerconverters and buses are more sensitive and have a significant con-tribution to the harmonic instability. In the approach, a power elec-tronics based system is introduced as a multi-input multi-output(MIMO) dynamic system by means of a dynamic admittance ma-trix. Bus participation factors (PFs) are calculated by the oscilla-tory mode sensitivity analysis versus the elements of the MIMOtransfer function matrix. The PF analysis detects which powerelectronic converters or buses have a higher participation in har-monic instability excitation than others or at which buses suchinstability problems have a higher impact. In order to confirm theeffectiveness of the presented approach, time-domain simulationresults are provided for a 400-MW wind farm in PSCAD softwareenvironment.
Index Terms—Harmonic instability, power electronics based sys-tems, participation factor (PF) analysis, sensitivity analysis.
I. INTRODUCTION
THE integration of the power electronic converters into theelectric power system has been increased over the last
decades because of the extensive usage in different industrialand commercial applications such as renewable energy sources,electric railway systems, variable-speed drivers, HVDC, andflexible alternating current transmission system (FACTS) [1],[2]. Besides the advantages, including full controllability andimproved efficiency, high penetration of power electronics basedpower systems is challenging the stable operation of the powerdelivery system [3]–[5]. Some stability studies in power elec-tronics based systems have focused on low-frequency oscilla-tions, driven by the outer controllers of power converters [6], [7]and phase-locked loops [8]–[10]. Apart from the low-frequencyoscillations, the mutual interactions between the fast inner
Manuscript received August 11, 2017; revised December 19, 2017; acceptedFebruary 4, 2018. Date of publication March 9, 2018; date of current ver-sion September 28, 2018. This work was supported by the European ResearchCouncil under the European Union’s Seventh Framework Program (FP/2007-2013)/ERC Grant Agreement no. [321149-Harmony]. Recommended for pub-lication by Associate Editor Jesus A Oliver. (Corresponding author: EsmaeilEbrahimzadeh.)
The authors are with the Department of Energy Technology, Aalborg Uni-versity, Aalborg DK-9220, Denmark (e-mail: [email protected]; [email protected];[email protected]; [email protected]).
Color versions of one or more of the figures in this paper are available onlineat http://ieeexplore.ieee.org.
Digital Object Identifier 10.1109/TPEL.2018.2803846
control loops of the grid-connected converters may lead to high-frequency oscillations, which can be called harmonic instability[9]. Most research works about harmonic instability discuss howto predict a system is either stable or unstable. However, it hasnot been paid much attention to identify which power convert-ers have more influence on the harmonic instability or whichbuses are affected more by the harmonic instability than oth-ers. A general approach for analyzing such stability is basedon the state-space model, where the stability can be assessedby eigenvalue analysis of the state-space matrix [12]–[21]. Instate-space modeling, the participation factor (PF) contributionof each state variable to the system stability can be calculatedbased on the eigenvectors of the state matrix [15]–[21]. Thestate-space analysis has been applied in some systems such asinverter-based microgrid [14], active-rectifier-based microgrid[15], current source inverters [12], parallel-connected inverters[13], [18], and wind farms [19], [21]. However, in a large-scalepower system with a high penetration of power electronic con-verters, there would be a lot of state variables, coming fromthe detailed models of power converter dynamics, loads, cables,transformers, etc., required. Therefore, the formulation of thestate matrices may become complicated in such large systems[21]–[23]. Apart from the state-space analysis, the impedance-based analysis approach is another powerful tool to predict theharmonic instability by calculating the ratio of the converter out-put impedance to the grid equivalent impedance at point of con-nection (PoC) of the converter [24]–[27]. The impedance-basedapproach has been applied in several applications, e.g., paral-lel LCL-filtered grid-connected converters [28], and voltage-controlled and current-controlled inverters with LC- and LCLfilters [11]. However, the impedance-based analysis is not able tolocate which bus and which converter in a large power electron-ics based power system has the most contribution to harmonicinstability [29], [30].
In contrast to the previous research works [15]–[21], wherePF analysis for the system stability is presented based on thestate-space modeling, this paper presents a new PF analysis forthe system stability based on a multi-input multi-output (MIMO)transfer function matrix. A large-scale power electronics basedsystem is modeled as a MIMO transfer function matrix by meansof the nodal admittance matrix of the system. Since the presentedapproach is based on the nodal admittance matrix of the powersystem, it is easy to apply for a large power electronics basedsystem. PFs and sensitivities of different buses and power elec-tronic converters to the harmonic instability are calculated by
0885-8993 © 2018 IEEE. Translations and content mining are permitted for academic research only. Personal use is also permitted, but republication/redistributionrequires IEEE permission. See http://www.ieee.org/publications standards/publications/rights/index.html for more information.
10342 IEEE TRANSACTIONS ON POWER ELECTRONICS, VOL. 33, NO. 12, DECEMBER 2018
means of mode analysis of the introduced MIMO system. SincePFs are the product of the controllability and the observabilityof harmonic instability at the system buses, a power converterand a bus with a larger PF are more sensitive and have more con-tribution to the harmonic instability. Therefore, the advantagesof the proposed PF analysis can be summarized as follows.
1) It is a systematic approach and easy to apply to large powerelectronics based power systems like large wind farms,where a large number of power converters, transformers,long cables, and filters are located.
2) By changing a component of the system, only one admit-tance of the system is affected. Therefore, the effects ofnew changes on system stability can be easily analyzed.
3) The detailed information of each component of the systemis not needed.
4) When a component model is black-box, its equivalent ad-mittance can be obtained by experiment (if the componenthas been built) or by numerical simulations (if the com-ponent has been designed but has not been built yet).
5) It is simple to identify directly which component of thesystem has more contribution to instability and whichcomponent is the main source of instability.
Other contributions of this paper are as follows.1) Most of the research works about stability of power elec-
tronic systems discuss small-scale systems, where indi-vidual or small groups of power electronic converters areconsidered [18], [28]. However, it has been paid less atten-tion to large-scale power electronic systems. On the otherhand, about large-scale power electronic system stability,it has not been paid much attention to the effects of thedynamics and the time-delay of the digital control systemand pulsewidth modulation (PWM) [19], [21]. However,a large volume of the literature about the individual grid-connected converters has shown that the time-delay of thedigital control system and PWM have a significant effecton the stability of the system [31]–[33]. Therefore, thispaper attempts to fill in this gap, i.e., PF analysis of alarge-scale power electronic system with considering theeffects of the time delay of the digital control system andPWM.
2) The effects of connection/disconnection of the power con-verters with different PFs are analyzed. Therefore, PFscan locate the main source of harmonic instability andthe most efficient location for damping and reducing theharmonic instability problems.
3) The grid disturbance amplification by the resonancemodes with very low damping is analyzed. The PF anal-ysis shows that which bus amplifies the grid harmonicbackground more.
4) The effect of the cable lengths on the system stability isanalyzed.
5) The electrical oscillations during faults and transients arepredicted by the PF analysis.
In Section II, a grid-connected converter is modeled as acurrent source with a parallel active admittance. In Section III,a large power electronics based power system is introducedas a MIMO system using the admittance matrix of the whole
system. The mode analysis is presented in Section IV, wherePFs of the system buses for the oscillatory modes are calculated.In addition, the damping and the frequency of oscillations, andthe most and least influencing bus for each mode are obtained.In Section V, the mode and PF analysis results are validated bynonlinear time-domain simulation for a 400-MW wind farm asa case study, where the effectiveness of the proposed method isdemonstrated. In Section VI, the conclusion is presented.
II. GRID-CONNECTED CONVERTER MODEL
Fig. 1(a) shows a block diagram of a three-phase grid-connected voltage source converter. As the system is assumedto be a three-phase balanced system, the converter can be mod-eled by its single-phase equivalent circuit, as shown in Fig. 1(b),where Gcont−k is the current controller, and Gdelay−k is the delayof the digital control and SPWM. As the output of the currentcontroller is normalized to the dc-link voltage, the gain of thesystem is equal to 1 in Fig. 1(b). Fig. 1(c) depicts the block dia-gram of the current closed-loop control, where the PoC voltage(VPoC−k ) and the current reference (Iref−k ) are the inputs andthe grid current (Ig−k ) is the output. From Fig. 1(c), the gridcurrent can be obtained as follows:
Ig−k = Gc−k Iref−k − Yc−kVPoC−k (1)
where Gc−k and Yc−k are
Gc−k =Tc−k
1 + Tc−k, Yc−k =
YLf−k
1 + Tc−k. (2)
Tc−k and YLf−k are
Tc−k = Gcont−kGdelay−kYLf−k , YLf−k =1
sLf−k. (3)
Based on (1), a current-controlled grid-connected convertercan be modeled as a Norton equivalent, i.e., a current sourcewith a parallel active admittance, as shown in Fig. 1(d). Thispaper focuses on the harmonic instability above the fundamen-tal frequency. Therefore, the outer power controllers and gridsynchronization loops are neglected because they are too slowto have the influence on the high-frequency oscillations.
In this paper, Gcont−k is considered with a proportional plusresonant current controller and Gdelay−k is modeled by Padeapproximation, i.e.,
Gcont−k = Kp−k +Ki−k s
s2 + ω2f
, Gdelay−k (s) = e−1.5Ts , k s
≈ 1 − 1.5Ts−k
2 s + (1.5Ts−k )2
10 s2
1 + 1.5Ts−k
2 s + (1.5Ts−k )2
10 s2(4)
where ωf and Ts−k are the fundamental frequency of the gridand the sampling period of the digital control, respectively. Asthe SPWM with the double update has been considered, the sam-pling period (Ts−k ) is equal to 0.5
fsw, where fsw is the switching
frequency [31]–[33].

EBRAHIMZADEH et al.: BUS PF ANALYSIS FOR HARMONIC INSTABILITY IN POWER ELECTRONICS BASED POWER SYSTEMS 10343
Fig. 1. Grid-connected converter along with the current control system. (a) Three-phase grid-connected voltage source converter. (b) Single-phase equivalentcircuit of the converter. (c) Block diagram of closed-loop control of grid current. (d) Norton equivalent model of the converter.
III. POWER ELECTRONICS BASED SYSTEM AS A MULTI-INPUT
MULTI-OUTPUT (MIMO) TRANSFER FUNCTION MATRIX
By applying the Norton equivalent theorem for every pas-sive element and active element (grid-connected converters) inthe s-domain, the current–voltage relationships can be writtenby using the nodal admittance matrix of the power system as(5) as shown at the bottom of this page, where it is assumedthat bus-1 is connected to the main electrical grid and bus-2 tobus n + 1 are connected to the power converters. Bus n + 2 tobus m are other buses to which any power converters or gridare not connected. Yc−k (k = 1, 2, . . . , n), Yii , Yij (s) (i, j =1, 2, . . . ,m, and i �= j) are the active admittance of the kthpower converter, the connected admittance to the ith bus, andthe admittance between ith bus and jth bus, respectively. Equa-tion (5) is actually a MIMO transfer function matrix, where
the outputs are the bus voltages and the inputs are the injectedcurrents, i.e.,
V(s) = G(s)−1I(s). (6)
The poles of the introduced MIMO transfer function are theoscillatory modes of the power system, which can be obtainedby solving the following equation:
det [G(s)] = 0
⇒ p1 = α1 + jβ1 , p2 = α2 + jβ2 , . . . , pq = αq + jβq (7)
where the oscillation frequency (fi) and the damping ratio (ζi)of the oscillations can also be obtained by
fi =βi
2πζi =
−αi√α2
i + β2i
. (8)
⎡
⎢⎢⎢⎢⎢⎢⎢⎢⎢⎢⎢⎢⎣
Ig
Ic−1Ic−2
...Ic−n
0...0
⎤
⎥⎥⎥⎥⎥⎥⎥⎥⎥⎥⎥⎥⎦
=
⎡
⎢⎢⎢⎢⎢⎢⎢⎢⎢⎢⎢⎢⎣
Y11 −Y12 −Y13 · · · −Y1(n+1) −Y1(n+2) · · · −Y1m
−Y21 Y22 + Yc−1 −Y23 · · · −Y2(n+1) −Y2(n+2) · · · −Y2m
−Y31 −Y32 Y33 + Yc−2 · · · −Y3(n+1) −Y3(n+2) · · · −Y3m
......
......
......
......
−Y(n+1)1 −Y(n+1)2 −Y(n+1)3 · · · Y(n+1)(n+1) + Yc−n Y(n+1)(n+2) · · · −Y(n+1)m−Y(n+2)1 −Y(n+2)2 −Y(n+2)3 · · · −Y(n+2)(n+1) Y(n+2)(n+2) · · · −Y(n+2)m
......
......
......
......
−Ym1 −Ym2 −Ym3 · · · −Ymn −Ym (n+2) · · · Ymm
⎤
⎥⎥⎥⎥⎥⎥⎥⎥⎥⎥⎥⎥⎦
⎡
⎢⎢⎢⎢⎢⎢⎢⎢⎢⎢⎢⎢⎣
V1V2V3...
Vn
V(n+1)...
Vm
⎤
⎥⎥⎥⎥⎥⎥⎥⎥⎥⎥⎥⎥⎦
(5)
10344 IEEE TRANSACTIONS ON POWER ELECTRONICS, VOL. 33, NO. 12, DECEMBER 2018
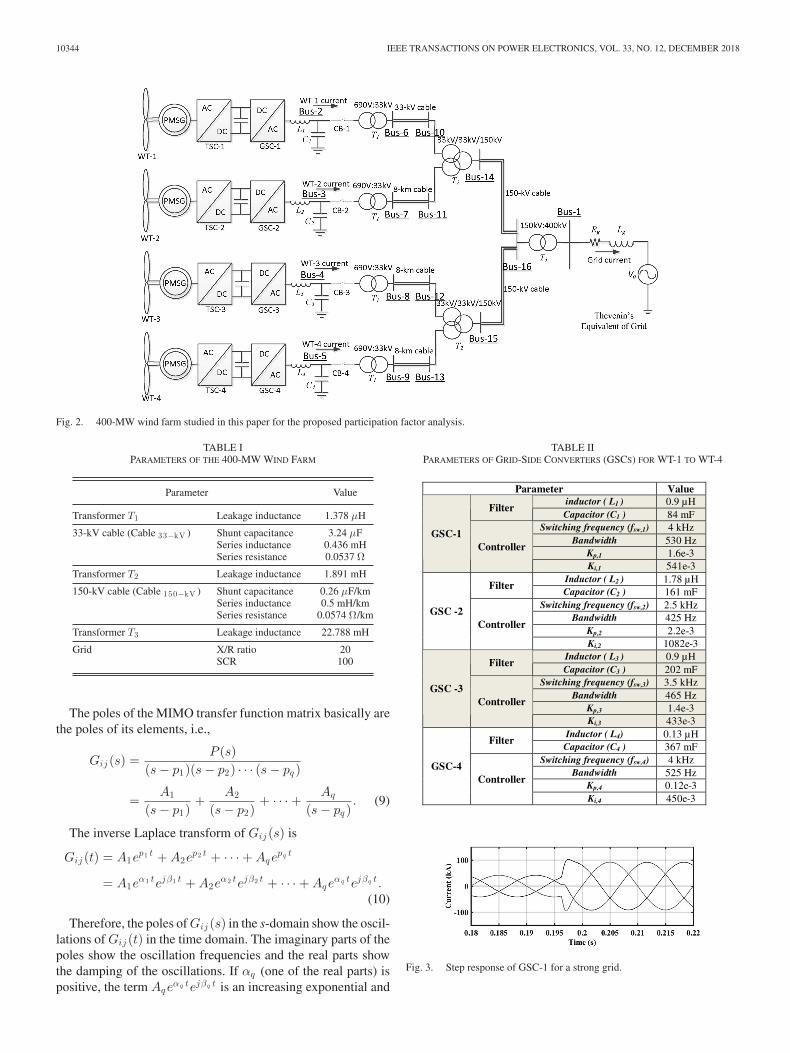
Fig. 2. 400-MW wind farm studied in this paper for the proposed participation factor analysis.
TABLE IPARAMETERS OF THE 400-MW WIND FARM
Parameter Value
Transformer T1 Leakage inductance 1.378 μH
33-kV cable (Cable 33−kV ) Shunt capacitance 3.24 μFSeries inductance 0.436 mHSeries resistance 0.0537 Ω
Transformer T2 Leakage inductance 1.891 mH
150-kV cable (Cable 150−kV ) Shunt capacitance 0.26 μF/kmSeries inductance 0.5 mH/kmSeries resistance 0.0574 Ω/km
Transformer T3 Leakage inductance 22.788 mH
Grid X/R ratio 20SCR 100
The poles of the MIMO transfer function matrix basically arethe poles of its elements, i.e.,
Gij (s) =P (s)
(s − p1)(s − p2) · · · (s − pq )
=A1
(s − p1)+
A2
(s − p2)+ · · · + Aq
(s − pq ). (9)
The inverse Laplace transform of Gij (s) is
Gij (t) = A1ep1 t + A2e
p2 t + · · · + Aqepq t
= A1eα1 tejβ1 t + A2e
α2 tejβ2 t + · · · + Aqeαq tejβq t .
(10)
Therefore, the poles of Gij (s) in the s-domain show the oscil-lations of Gij (t) in the time domain. The imaginary parts of thepoles show the oscillation frequencies and the real parts showthe damping of the oscillations. If αq (one of the real parts) ispositive, the term Aqe
αq tejβq t is an increasing exponential and
TABLE IIPARAMETERS OF GRID-SIDE CONVERTERS (GSCS) FOR WT-1 TO WT-4
Fig. 3. Step response of GSC-1 for a strong grid.

EBRAHIMZADEH et al.: BUS PF ANALYSIS FOR HARMONIC INSTABILITY IN POWER ELECTRONICS BASED POWER SYSTEMS 10345
TABLE IIIFREQUENCY, DAMPING, PARTICIPATION FACTOR, AND INFLUENCING BUSES FOR THE OSCILLATORY MODES OF THE WIND FARM (LCABLE = 10 KM)
Mode i Real part αi Frequency fi Damping ζi The largestparticipationfactor (PFi )
The smallestparticipationfactor (PFi )
The mostinfluencing
bus
The leastinfluencing
bus
p1 –33.5928 67.07399 0.079458 0.197011 0.001399 4 1p2 –104.447 70.33675 0.230002 0.550534 0.000291 2 1p3 –33.6531 73.03792 0.073136 0.670614 0.00217 5 1p4 –133.93 85.53932 0.241796 0.720086 0.000429 3 1p5 –379.337 428.1876 0.139617 0.393558 3.25E – 05 3 5p6 –629.545 492.4904 0.199362 0.667492 8.05E–05 4 5p7 –127.862 586.1375 0.034698 0.156834 0.00054 14 5p8 –489.454 784.0175 0.098872 0.7446 0.00029 2 3p9 20.58653 839.9291 –0.0039 0.737738 0.000128 5 4p10 –43.8898 1888.711 0.003698 0.116899 4.82E–08 13 1p11 –15957.6 2429.353 0.722635 1.02945 0 3 5p12 –19.6983 2463.564 0.001273 0.136212 1.10E – 05 7 5p13 –0.23499 2570.186 1.46E–05 0.262655 4.39E–10 8 14p14 0.006365 2578.026 3.93E–07 0.264195 4.03E–09 6 5p15 –8.90394 2810.927 0.000504 0.136762 7.02E–08 6 1p16 –35.659 3048.901 0.001861 0.126374 3.97E–06 9 5p17 –22171.4 3321.399 0.728172 1.015231 0 4 3p18 –23068.1 3350.696 0.738632 1.013194 0 5 3p19 –25313.3 3797.759 0.727659 1.009835 0 2 5p20 –56.3225 8853.221 0.001013 0.266982 0 13 14p21 –56.3185 8853.384 0.001012 0.27569 0 11 5p22 –56.2355 8856.541 0.001011 0.267144 3.69E–10 12 3p23 –56.2315 8856.707 0.00101 0.275829 7.45E–11 10 5
TABLE IVPARTICIPATION FACTORS OF BUSES 2–5 FOR THE UNSTABLE MODE
Bus number PF for the unstable mode (P9 = 20.587 ± 5277.43i)
Bus-2 (GSC-1) 0.1095e – 1Bus-3 (GSC-2) 0.346e – 3Bus-4 (GSC-3) 0.128e – 3Bus-5 (GSC-4) 0.737738
the system is unstable. If αq is negative, Aqeαq tejβq t is a decay-
ing exponential function with a final value of zero. Therefore,for a system to be stable, all real parts of the poles (p1 , p2 , . . . ,and pq ) must be in the left half of the s-plane.
IV. PROPOSED BUS PARTICIPATION FACTOR ANALYSIS
By substituting the modes (pq ) for s in the transfer functionmatrix of G (s),G (pq ) can be numerically obtained. Based onthe theory of the eigenvalue decomposition [34]–[37], the matrixG (pq ) can be decomposed into three matrixes as
G(pq ) = RΛL = R
⎡
⎢⎢⎢⎣
λ1 0 0 00 λ2 0 00 0 · · · 00 0 0 λm
⎤
⎥⎥⎥⎦
L (11)
where Λ is a diagonal matrix whose diagonal elements are theeigenvalues of G (pq ) (λ1 , λ2 , . . . , λm ). R is a matrix whosecolumns are the corresponding right eigenvectors, i.e.,
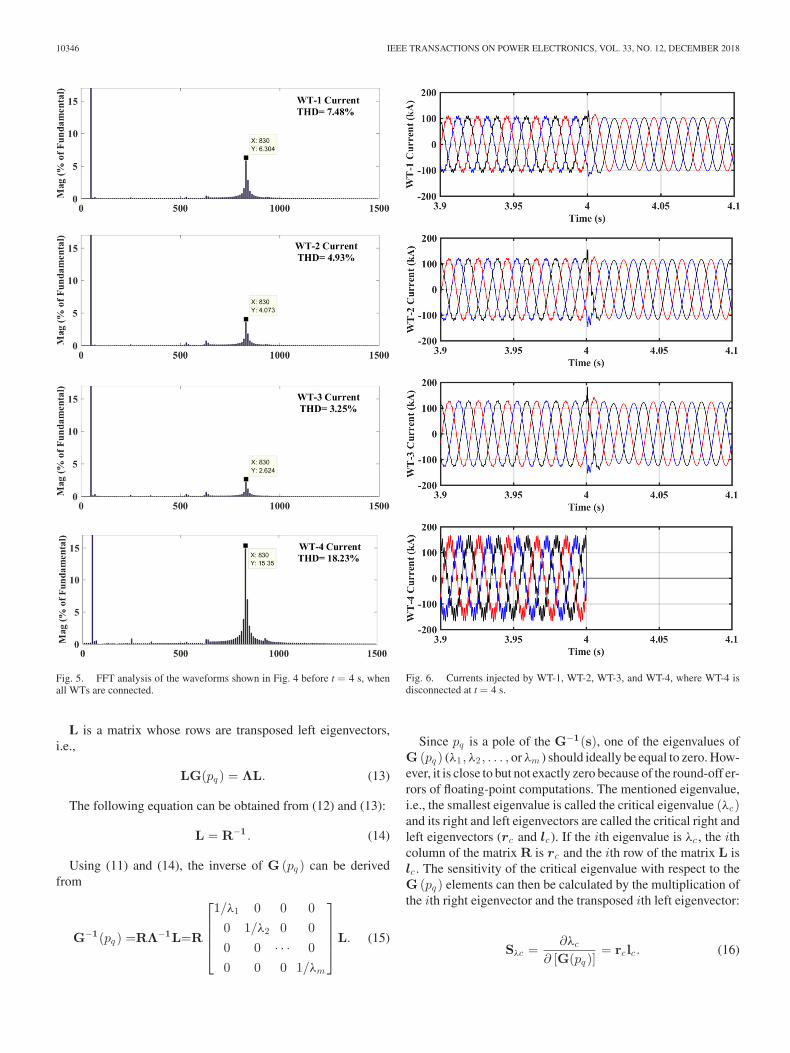
G(pq )R = RΛ. (12)Fig. 4. Currents injected by WT-1, WT-2, WT-3, and WT-4, where WT-1 isdisconnected at t = 4 s.
10346 IEEE TRANSACTIONS ON POWER ELECTRONICS, VOL. 33, NO. 12, DECEMBER 2018
Fig. 5. FFT analysis of the waveforms shown in Fig. 4 before t = 4 s, whenall WTs are connected.
L is a matrix whose rows are transposed left eigenvectors,i.e.,
LG(pq ) = ΛL. (13)
The following equation can be obtained from (12) and (13):
L = R−1 . (14)
Using (11) and (14), the inverse of G (pq ) can be derivedfrom
G−1(pq ) =RΛ−1L=R
⎡
⎢⎢⎢⎣
1/λ1 0 0 00 1/λ2 0 00 0 · · · 00 0 0 1/λm
⎤
⎥⎥⎥⎦
L. (15)
Fig. 6. Currents injected by WT-1, WT-2, WT-3, and WT-4, where WT-4 isdisconnected at t = 4 s.
Since pq is a pole of the G−1(s), one of the eigenvalues ofG (pq ) (λ1 , λ2 , . . . , or λm ) should ideally be equal to zero. How-ever, it is close to but not exactly zero because of the round-off er-rors of floating-point computations. The mentioned eigenvalue,i.e., the smallest eigenvalue is called the critical eigenvalue (λc)and its right and left eigenvectors are called the critical right andleft eigenvectors (rc and lc ). If the ith eigenvalue is λc , the ithcolumn of the matrix R is rc and the ith row of the matrix L islc . The sensitivity of the critical eigenvalue with respect to theG (pq ) elements can then be calculated by the multiplication ofthe ith right eigenvector and the transposed ith left eigenvector:
Sλc =∂λc
∂ [G(pq )]= rc lc . (16)

EBRAHIMZADEH et al.: BUS PF ANALYSIS FOR HARMONIC INSTABILITY IN POWER ELECTRONICS BASED POWER SYSTEMS 10347
TABLE VFREQUENCY, DAMPING, PARTICIPATION FACTOR, AND INFLUENCING BUSES FOR THE OSCILLATORY MODES OF THE WIND FARM (LCABLE = 5 KM)
Mode i Real part αi Frequency fi Damping ζi The largestparticipationfactor (PFi )
The smallestparticipationfactor (PFi )
The mostinfluencing
bus
The leastinfluencing
bus
p1 –37.322 67.67661 0.087434 0.215021 0.001483 4 1p2 –107.229 70.55648 0.235098 0.575217 0.000299 2 1p3 –30.7038 72.82643 0.06695 0.581145 0.001978 5 1p4 –134.65 85.9258 0.241991 0.720008 0.000444 3 1p5 –373.717 439.6441 0.134067 0.54612 1.89E – 05 3 5p6 –672.616 495.9811 0.210977 0.592752 4.10E – 05 4 5p7 –417.47 732.4515 0.090341 0.339319 0.001657 2 5p8 –99.631 818.1231 0.019378 0.165125 0.002907 5 4p9 –33.0973 862.8075 0.006105 0.167917 0.002285 16 4p10 –15957.6 2429.353 0.722635 1.029948 4.25E – 12 3 5p11 –8.17791 2438.652 0.000534 0.134898 9.84E – 08 9 1p12 –0.23348 2570.18 1.45E – 05 0.26203 1.66E – 09 8 14p13 –0.006739 2577.957 4.16E – 07 0.265142 1.70E – 08 7 5p14 –1.98489 2666.263 0.000118 0.147683 7.26E – 06 6 5p15 –22171.4 3321.399 0.728172 1.015238 0 4 3p16 –23068.1 3350.696 0.738632 1.0132 0 5 3p17 –25313.3 3797.759 0.727659 1.009821 0 2 5p18 –47.18 4257.028 0.001764 0.330987 2.36E – 11 15 1p19 –54.7767 5707.849 0.001527 0.310775 4.72E – 08 14 5p20 –56.3225 8853.222 0.001013 0.263699 0 13 14p21 –56.3185 8853.385 0.001012 0.267184 0 11 5p22 –56.1097 8861.298 0.001008 0.170296 1.05E – 08 12 1p23 –56.0949 8861.868 0.001007 0.17244 3.47E – 08 10 5
TABLE VIPARTICIPATION FACTORS OF BUSES 7, 11, 14, AND 16 FOR THE RESONANCE
MODE
Bus number PF for the resonance mode (P13 = −0.00674± 16198i)
Bus-7 0.265142Bus-11 0.242049Bus-14 8.31E – 05Bus-16 1.76E – 05
The kth diagonal element of the sensitivity matrix Sλc iscalled PF of the kth bus, which actually characterizes the com-bined excitability and observability of the mode at the kth bus.For an unstable or resonance mode, the bus with the largest PFis the main source of the instability and resonance and can becalled the most critical bus.
V. 400-MW WIND FARM AS A CASE STUDY
In this paper, a 400-MW wind farm shown in Fig. 2 withaggregated strings is used as a case study to validate the effec-tiveness of the proposed bus PF analysis. The main electricalgrid, transformers, and cables are modeled by Thevenin’s equiv-alent impedance, leakage impedances, and nominal π-model,respectively.
As the system has 16 buses, the dimension of the matrixG(pq ) is 16 × 16, which presents the relationships betweenbus-1 through bus-16. The parameters of the wind farm arepresented in Table I. The parameters of grid-side converters(GSCs) are shown in Table II, where they are designed to haveacceptable bandwidths. The phase margins are designed to be
Fig. 7. Voltages of buses 7, 11, 14, and 16, where 3% disturbance is added tothe grid voltage at 2578 Hz at t = 4 s.
10348 IEEE TRANSACTIONS ON POWER ELECTRONICS, VOL. 33, NO. 12, DECEMBER 2018
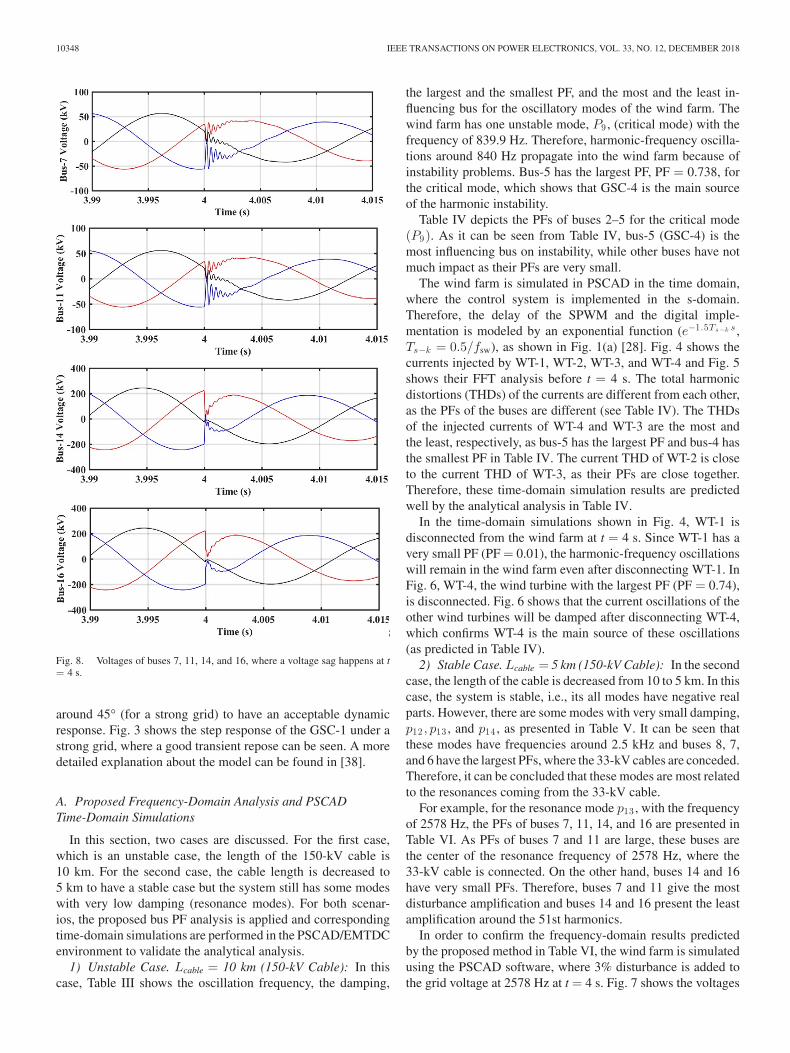
Fig. 8. Voltages of buses 7, 11, 14, and 16, where a voltage sag happens at t= 4 s.
around 45° (for a strong grid) to have an acceptable dynamicresponse. Fig. 3 shows the step response of the GSC-1 under astrong grid, where a good transient repose can be seen. A moredetailed explanation about the model can be found in [38].
A. Proposed Frequency-Domain Analysis and PSCADTime-Domain Simulations
In this section, two cases are discussed. For the first case,which is an unstable case, the length of the 150-kV cable is10 km. For the second case, the cable length is decreased to5 km to have a stable case but the system still has some modeswith very low damping (resonance modes). For both scenar-ios, the proposed bus PF analysis is applied and correspondingtime-domain simulations are performed in the PSCAD/EMTDCenvironment to validate the analytical analysis.
1) Unstable Case. Lcable = 10 km (150-kV Cable): In thiscase, Table III shows the oscillation frequency, the damping,
the largest and the smallest PF, and the most and the least in-fluencing bus for the oscillatory modes of the wind farm. Thewind farm has one unstable mode, P9 , (critical mode) with thefrequency of 839.9 Hz. Therefore, harmonic-frequency oscilla-tions around 840 Hz propagate into the wind farm because ofinstability problems. Bus-5 has the largest PF, PF = 0.738, forthe critical mode, which shows that GSC-4 is the main sourceof the harmonic instability.
Table IV depicts the PFs of buses 2–5 for the critical mode(P9). As it can be seen from Table IV, bus-5 (GSC-4) is themost influencing bus on instability, while other buses have notmuch impact as their PFs are very small.
The wind farm is simulated in PSCAD in the time domain,where the control system is implemented in the s-domain.Therefore, the delay of the SPWM and the digital imple-mentation is modeled by an exponential function (e−1.5Ts−k s ,Ts−k = 0.5/fsw), as shown in Fig. 1(a) [28]. Fig. 4 shows thecurrents injected by WT-1, WT-2, WT-3, and WT-4 and Fig. 5shows their FFT analysis before t = 4 s. The total harmonicdistortions (THDs) of the currents are different from each other,as the PFs of the buses are different (see Table IV). The THDsof the injected currents of WT-4 and WT-3 are the most andthe least, respectively, as bus-5 has the largest PF and bus-4 hasthe smallest PF in Table IV. The current THD of WT-2 is closeto the current THD of WT-3, as their PFs are close together.Therefore, these time-domain simulation results are predictedwell by the analytical analysis in Table IV.
In the time-domain simulations shown in Fig. 4, WT-1 isdisconnected from the wind farm at t = 4 s. Since WT-1 has avery small PF (PF = 0.01), the harmonic-frequency oscillationswill remain in the wind farm even after disconnecting WT-1. InFig. 6, WT-4, the wind turbine with the largest PF (PF = 0.74),is disconnected. Fig. 6 shows that the current oscillations of theother wind turbines will be damped after disconnecting WT-4,which confirms WT-4 is the main source of these oscillations(as predicted in Table IV).
2) Stable Case. Lcable = 5 km (150-kV Cable): In the secondcase, the length of the cable is decreased from 10 to 5 km. In thiscase, the system is stable, i.e., its all modes have negative realparts. However, there are some modes with very small damping,p12 , p13 , and p14 , as presented in Table V. It can be seen thatthese modes have frequencies around 2.5 kHz and buses 8, 7,and 6 have the largest PFs, where the 33-kV cables are conceded.Therefore, it can be concluded that these modes are most relatedto the resonances coming from the 33-kV cable.
For example, for the resonance mode p13 , with the frequencyof 2578 Hz, the PFs of buses 7, 11, 14, and 16 are presented inTable VI. As PFs of buses 7 and 11 are large, these buses arethe center of the resonance frequency of 2578 Hz, where the33-kV cable is connected. On the other hand, buses 14 and 16have very small PFs. Therefore, buses 7 and 11 give the mostdisturbance amplification and buses 14 and 16 present the leastamplification around the 51st harmonics.
In order to confirm the frequency-domain results predictedby the proposed method in Table VI, the wind farm is simulatedusing the PSCAD software, where 3% disturbance is added tothe grid voltage at 2578 Hz at t = 4 s. Fig. 7 shows the voltages

EBRAHIMZADEH et al.: BUS PF ANALYSIS FOR HARMONIC INSTABILITY IN POWER ELECTRONICS BASED POWER SYSTEMS 10349
Fig. 9. Zoomed transient waveforms of the voltages shown in Fig. 8 around t= 4 s.
of buses 7, 11, 14, and 16. The disturbance amplification of thebuses is different from each other, as the PFs of the buses aredifferent in Table VI. The electrical oscillations of bus-7 andbus-16 are the most and the least, respectively, as the frequency-domain results in Table VI predict that bus-7 has the largest PFand bus-16 has the smallest PF. The THD of bus-7 is close tothe THD of bus-11, as their PFs are almost the same as well.Therefore, these time-domain simulation results are predictedwell by the proposed frequency-domain analysis presented inTable VI.
3) Transient Oscillations: In this test, a fault occurs at t = 4 s,which leads to a voltage sag with the depth of 20%. Fig. 8 showsbus voltages 7, 11, 14, and 16, and Fig. 9 shows the zoomedtransient waveforms of these voltages around t = 4 s. As shownin Fig. 9, the frequencies of the transient oscillations are around2.5 kHz. In addition, the magnitudes of the oscillations of buses7 and 11 are much larger than buses 14 and 16. These results
are also predicted by the proposed frequency-domain analysisshown in Table VI, where the frequency of the resonance modep13 is 2578 Hz and the PFs of buses 7 and 11 are much largerthan buses 14 and 16.
VI. CONCLUSION
This paper attempts to identify the contribution of each powerconverter and each bus to harmonic instability in a power elec-tronics based system, and consequently to locate the main sourceof harmonic instability. A power electronics based system is in-troduced as a MIMO transfer function matrix and bus PFs areidentified by eigenvalue sensitivity analysis versus the elementsof the MIMO matrix. A 400-MW wind farm is studied as apower electronics based system for the proposed PF analysis.For unstable conditions, the presented frequency-domain anal-ysis shows that some power converters can have larger PFs thanthe other converters. Time-domain simulations in PSCAD soft-ware confirm that a power electronics based system can go froman unstable operation to a stable operation by disconnectingthe power converters with the larger PFs. For stable conditions,the frequency-domain results show that some modes can havevery low damping (resonance modes). The presented PF anal-ysis can identify the main bus, which excites these resonancemodes, where is the most efficient location for active or passivedamping activities. Simulation results confirm that a bus witha larger PF amplifies disturbances (around the frequency of theresonance mode) more than the other buses.
REFERENCES
[1] B. K. Bose, “Global energy scenario and impact of power electronics in21st century,” IEEE Trans. Ind. Electron., vol. 60, no. 7, pp. 2638–2651,Jul. 2013.
[2] J. M. Carrasco et al., “Power-electronic systems for the grid integration ofrenewable energy sources: A survey,” IEEE Trans. Ind. Electron., vol. 53,no. 4, pp. 1002–1016, Jun. 2006.
[3] F. Blaabjerg, R. Teodorescu, M. Liserre, and A. V. Timbus, “Overviewof control and grid synchronization for distributed power generation sys-tems,” IEEE Trans. Ind. Electron., vol. 53, no. 5, pp. 1398–1409, Oct. 2006.
[4] F. Jensen, Ł. H. Kocewiak, and Z. Emin, “Amplification of harmonic back-ground distortion in wind power plants with long high voltage connec-tions,” presented at the CIGRE Biennial Session, Paris, France, Aug. 2016,Paper C4-112.
[5] J. H. R. Enslin and P. J. M. Heskes, “Harmonic interaction between a largenumber of distributed power inverters and the distribution network,” IEEETrans. Power Electron., vol. 19, no. 6, pp. 1586–1593, Nov. 2004.
[6] T. Messo, J. Jokipii, J. Puukko, and T. Suntio, “Determining the valueof dc-link capacitance to ensure stable operation of a three-phase photo-voltaic inverter,” IEEE Trans. Power Electron., vol. 29, no. 2, pp. 665–673,Feb. 2014.
[7] D. Bazargan, S. Filizadeh, and A. M. Gole, “Stability analysis of converter-connected battery energy storage systems in the grid,” IEEE Trans. Sustain.Energy, vol. 5, no. 4, pp. 1204–1212, Oct. 2014.
[8] L. Harnefors, M. Bongiorno, and S. Lundberg, “Input-admittance calcu-lation and shaping for controlled voltage-source converters,” IEEE Trans.Ind. Electron., vol. 54, no. 6, pp. 3323–3334, Dec. 2007.
[9] M. Cespedes and J. Sun, “Impedance modeling and analysis of grid con-nected voltage-source converters,” IEEE Trans. Power Electron., vol. 29,no. 3, pp. 1254–1261, Mar. 2014.
[10] X. Wang, L. Harnefors, and F. Blaabjerg, “A unified impedancemodel of grid-connected voltage-source converters,” IEEE Trans.Power Electron., vol. 33, no. 2, pp. 1775–1787, Feb. 2014. Doi:10.1109/TPEL.2017.2684906.
[11] X. Wang, F. Blaabjerg, and W. Wu, “Modelling and analysis of harmonicstability in ac power-electronics-based power system,” IEEE Trans. PowerElectron., vol. 29, no. 12, pp. 6421–6432, Dec. 2014.
10350 IEEE TRANSACTIONS ON POWER ELECTRONICS, VOL. 33, NO. 12, DECEMBER 2018
[12] A. Singh, A. K. Kaviani, and B. Mirafzal, “On dynamic models andstability analysis of three-phase phasor PWM-based CSI for stand-aloneapplications,” IEEE Trans. Ind. Electron., vol. 62, no. 5, pp. 2698–2707,May 2015.
[13] E. A. A. Coelho, P. C. Cortizo, and P. F. D. Garcia, “Small-signal stabilityfor parallel-connected inverters in stand-alone ac supply systems,” IEEETrans. Ind. Appl., vol. 38, no. 2, pp. 533–542, Mar. 2002.
[14] N. Pogaku, M. Prodanovic, and T. C. Green, “Modeling, analysis andtesting of autonomous operation of an inverter-based microgrid,” IEEETrans. Power Electron., vol. 22, no. 2, pp. 613–625, Mar. 2007.
[15] N. Bottrell, M. Prodanovic, and T. C. Green, “Dynamic stability of amicrogrid with an active load,” IEEE Trans. Power Electron., vol. 28,no. 11, pp. 5107–5119, Nov. 2013.
[16] F. Gao, X. Zheng, S. Bozhko, C. I. Hill, and G. Asher, “Modal analysisof a PMSG-based DC electrical power system in the more electric aircraftusing eigenvalues sensitivity,” IEEE Trans. Transp. Electrif., vol. 1, no. 1,pp. 65–76, Jun. 2015.
[17] Z. Shuai, Y. Hu, Y. Peng, C. Tu, and Z. J. Shen, “Dynamic stability anal-ysis of synchronverter-dominated microgrid based on bifurcation theory,”IEEE Trans. Ind. Electron., vol. 64, no. 9, pp. 7467–7477, Sep. 2017.
[18] Y. Wang, X. Wang, F. Blaabjerg, and Z. Chen, “Harmonic instability as-sessment using state-space modeling and participation analysis in inverter-fed power systems,” IEEE Trans. Ind. Electron., vol. 64, no. 1, pp. 806–816, Jan. 2017.
[19] L. P. Kunjumuhammed, B. C. Pal, C. Oates, and K. J. Dyke, “Elec-trical oscillations in wind farm systems: analysis and insight based ondetailed modeling,” IEEE Trans. Sustain. Energy, vol. 7, no. 1, pp. 51–62,Jan. 2016.
[20] Y. Wang, X. Wang, F. Blaabjerg, and Z. Chen, “Small-signal stability anal-ysis of inverter-fed power systems using component connection method,”IEEE Trans. Smart Grid, early access, 2017.
[21] L. P. Kunjumuhammed, B. C. Pal, C. Oates, and K. J. Dyke, “The adequacyof the present practice in dynamic aggregated modeling of wind farmsystems,” IEEE Trans. Sustain. Energy, vol. 8, no. 1, pp. 23–32, Jan. 2017.
[22] J. Kwon, X. Wang, F. Blaabjerg, C. L. Bak, V. S. Sularea, and C. Busca,“Harmonic interaction analysis in a grid-connected converter using har-monic state-space (HSS) modeling,” IEEE Trans. Power Electron, vol. 32,no. 9, pp. 6823–6835, Sep. 2017.
[23] E. Ebrahimzadeh, F. Blaabjerg, X. Wang, and C. L. Bak, “Harmonicstability and resonance analysis in large PMSG-based wind power plants,”IEEE Trans. Sustain. Energy, vol. 9, no. 1, pp. 12–23, Jan. 2018.
[24] A. Rygg and M. Molinas, “Apparent impedance analysis: A small-signalmethod for stability analysis of power electronic based systems,” IEEETrans. Emerging Select. Topics Power Electron., vol. 5, no. 4, pp. 1474–1486, Dec. 2017. Doi: 10.1109/JESTPE.2017.2729596.
[25] J. Sun, “Impedance-based stability criterion for grid-connected inverters,”IEEE Trans. Power Electron., vol. 26, no. 11, pp. 3075–3078, Nov. 2011.
[26] L. Harnefors, R. Finger, X. Wang, H. Bai, and F. Blaabjerg, “VSCinput-admittance modeling and analysis above the nyquist frequency forpassivity-based stability assessment,” IEEE Trans. Ind. Electron., vol. 64,no. 8, pp. 6362–6370, Aug. 2017.
[27] A. Rygg, M. Molinas, C. Zhang, and X. Cai, “A modified sequence-domainimpedance definition and its equivalence to the dq-domain impedancedefinition for the stability analysis of ac power electronic systems,” IEEETrans. Emerging Sel. Topics Power Electron., vol. 4, no. 4, pp. 1383–1396,Dec. 2016.
[28] C. Yoon, H. Bai, R. Beres, X. Wang, C. Bak, and F. Blaabjerg, “Harmonicstability assessment for multi-paralleled, grid-connected inverters,” IEEETrans. Sustain. Energy, vol. 7, no. 4, pp. 1388–1397, Oct. 2016.
[29] E. Ebrahimzadeh, F. Blaabjerg, X. Wang, and C. L. Bak, “Modeling andidentification of harmonic instability problems in wind farms,” in Proc.IEEE Energy Convers. Congr. Expo., Milwaukee, WI, USA, Sep. 2016,pp. 1–6.
[30] E. Ebrahimzadeh, F. Blaabjerg, X. Wang, and C. L. Bak, “Reducing har-monic instability and resonance problems in PMSG based wind farms,”IEEE Trans. Emerging Sel. Topics Power Electron., vol. 6, no. 1, pp. 73–83, Mar. 2018.
[31] J. Wang, J. D. Yan, L. Jiang, and J. Zou, “Delay-dependent stability ofsingle-loop controlled grid-connected inverters with LCL filters,” IEEETrans. Power Electron., vol. 31, no. 1, pp. 743–757, Jan. 2016.
[32] X. Li, X. Wu, Y. Geng, X. Yuan, C. Xia, and X. Zhang, “Wide dampingregion for LCL-type grid-connected inverter with an improved capacitorcurrent-feedback method,” IEEE Trans. Power Electron., vol. 30, no. 9,pp. 5247–5259, Sep. 2015.
[33] C. Chen, J. Xiong, Z. Wan, J. Lei, and K. Zhang, “A Time delay compensa-tion method based on area equivalence for active damping of an LCL-typeconverter,” IEEE Trans. Power Electron., vol. 32, no. 1, pp. 762–772,Jan. 2017.
[34] S. Skogestad and I. Postlethwaite, Multivariable Feedback Control: Anal-ysis and Design. New York, NY, USA: Wiley, 2000.
[35] Y. Cui and X. Wang, “Modal frequency sensitivity for power systemharmonic resonance analysis,” IEEE Trans. Power Deliv., vol. 27, no. 2,pp. 1010–1017, Apr. 2012.
[36] E. Ebrahimzadeh, F. Blaabjerg, X. Wang, and C. L. Bak, “Dynamic res-onance sensitivity analysis in wind farms,” in Proc. IEEE 8th Int. Symp.Power Electron. Distrib. Gener. Syst., Florianopolis, Brazil, 2017, pp. 1–5.
[37] K. N. B. M. Hasan, K. Rauma, A. Luna, J. I. Candela, and P. Rodriguez,“Harmonic compensation analysis in offshore wind power plants usinghybrid filters,” IEEE Trans. Ind. Appl., vol. 50, no. 3, pp. 2050–2060,May/Jun. 2014.
[38] S. K. Chaudhary, “Control and protection of wind power plants with VSC-HVDC connection,” Ph.D. dissertation, Aalborg Univ., Aalborg, Denmark,2011.
Esmaeil Ebrahimzadeh (S’16) received the M.Sc.degree in electrical engineering from the Universityof Tehran, Tehran, Iran, in 2013. Since 2015, he hasbeen working toward the Ph.D. degree at the De-partment of Energy Technology, Aalborg University,Aalborg, Denmark.
He has been a Lecturer for undergraduate Labcourses with the University of Tehran. He was aVisiting R&D Engineer with Vestas Wind SystemsA/S, Aarhus, Denmark, in 2017. His research inter-ests include modeling, design, and control of power-
electronic converters in different applications like renewable energy systems,and his main current project is focusing on power quality and stability analysisin large wind power plants.
Mr. Ebrahimzadeh was a recipient of the best paper awards at IEEE PEDG2016 and IEEE PES GM 2017.
Frede Blaabjerg (S’86–M’88–SM’97–F’03) re-ceived the Ph.D. degree from Aalborg University,Aalborg, Denmark, in 1992.
He was with ABB-Scandia, Randers, Denmark,from 1987 to 1988. He became an Assistant Professorin 1992, an Associate Professor in 1996, and a FullProfessor of power electronics and drives in 1998.From 2017, he became a Villum Investigator. He hasauthored or coauthored more than 450 journal papersin the fields of power electronics and its applications.He is the Co-Author of two monographs and the Ed-
itor of six books in power electronics and its applications. His current researchinterests include power electronics and its applications such as in wind turbines,photovoltaic systems, reliability, harmonics, and adjustable speed drives.
Dr. Blaabjerg was a recipient of 22 IEEE Prize Paper Awards, the IEEEPELS Distinguished Service Award in 2009, the EPE-PEMC Council Awardin 2010, the IEEE William E. Newell Power Electronics Award 2014, and theVillum Kann Rasmussen Research Award 2014. He was the Editor-in-Chiefof the IEEE TRANSACTIONS ON POWER ELECTRONICS from 2006 to 2012. Hehas been a Distinguished Lecturer for the IEEE Power Electronics Society from2005 to 2007 and for the IEEE Industry Applications Society from 2010 to 2011as well as 2017 to 2018. He was nominated from 2014 to 2017 by ThomsonReuters to be among the most 250 cited researchers in Engineering in the world.In 2017, he became the Honoris Causa at the University Politehnica Timisoara,Timisoara, Romania.

EBRAHIMZADEH et al.: BUS PF ANALYSIS FOR HARMONIC INSTABILITY IN POWER ELECTRONICS BASED POWER SYSTEMS 10351
Xiongfei Wang (S’10–M’13–SM’17) received theB.S. degree in electrical engineering from YanshanUniversity, Qinhuangdao, China, in 2006, the M.S.degree in electrical engineering from the Harbin In-stitute of Technology, Harbin, China, in 2008, andthe Ph.D. degree in energy technology from AalborgUniversity, Aalborg, Denmark, in 2013.
Since 2009, he has been with Aalborg University,Aalborg, Denmark, where he is currently an Asso-ciate Professor with the Department of Energy Tech-nology. His research interests include modeling and
control of grid-connected converters, harmonics analysis and control, passiveand active filters, and stability of power electronic based power systems.
Dr. Wang serves as an Associate Editor for the IEEE TRANSACTIONS ON
POWER ELECTRONICS, the IEEE TRANSACTIONS ON INDUSTRY APPLICATIONS,and the IEEE JOURNAL OF EMERGING AND SELECTED TOPICS IN POWER ELEC-TRONICS. He was a recipient of the second prize paper award and the outstandingreviewer award of the IEEE TRANSACTIONS ON POWER ELECTRONICS in 2014and 2016, respectively, and the best paper awards at IEEE PEDG 2016 and IEEEPES GM 2017.
Claus Leth Bak (M’99–SM’07) was born in Arhus,Denmark, in April 13, 1965. He received the B.Sc.(with honors) and M.Sc. degrees in electrical powerengineering from the Department of Energy Tech-nology (ET), Aalborg University (AAU), Aalborg,Denmark, in 1992 and 1994, respectively, and thePh.D. degree in electrical power engineering with thethesis “EHV/HV underground cables in the transmis-sion system” from Aalborg University, in 2015.
After his studies, he worked as a ProfessionalEngineer with the Electric Power Transmission and
Substations with specializations within the area of power system protection withthe NV Net Transmission Company. In 1999, he was an Assistant Professor withET-AAU, where he holds a Full Professor position currently. He serves as theHead of the Energy Technology Ph.D. program (more than 100 Ph.D. degrees)and as the Head of the Section of Electric Power Systems and High Voltage inAAU and is a Member of the Ph.D. board with the Faculty of Engineering andScience. He has supervised/co-supervised +35 Ph.D. degrees and +50 M.Sc.theses. He is the Author/Co-Author of approximately 240 publications. Hismain research interests include corona phenomena on overhead lines, powersystem modeling and transient simulations, underground cable transmission,power system harmonics, power system protection, and HVDC voltage-sourceconverter offshore transmission networks.
Dr. Bak was a recipient of the DPSP 2014 best paper award and the PEDG2016 best paper award. He is a Member of Cigre JWG C4-B4.38, Cigre SC C4and SC B5 study committees’ member, and Danish Cigre National Committee.


![Aalborg Universitet Impedance-Based Harmonic Instability ......The standard EN50388-2012 [5] described and classified the overvoltage problems occurred in the AC or DC electrified](https://static.fdocuments.us/doc/165x107/612de74b1ecc515869427a55/aalborg-universitet-impedance-based-harmonic-instability-the-standard-en50388-2012.jpg)


![i .] APPROXIMATING HARMONIC FUNCTIONS 499€¦ · APPROXIMATING HARMONIC FUNCTIONS 499 THE APPROXIMATION OF HARMONIC FUNCTIONS BY HARMONIC POLYNOMIALS AND BY HARMONIC RATIONAL FUNCTIONS*](https://static.fdocuments.us/doc/165x107/5f0873ba7e708231d42214c2/i-approximating-harmonic-functions-499-approximating-harmonic-functions-499-the.jpg)