Bus Headways and Timetables
12
76 the chance of not finding a seat while bringing the average percentage of seats filled closer to 100. Examples of generic actions that can reduce stan- dee factor without reducing load factor are short- 1 ining, partial deadheading, and headway offsets. By shortlining, or running buses over only a seg- ment of the route, capacity can be shifted from a portion of a line on which the seats are seldom filled to another segment on which people frequently must stand. Headway offsets are a way to even the loads on successive trips, where one trip regularly tends to have standees and a succeeding trip is regularly light. Partial deadheading is a technique for saving buses by running a fraction of the buses without passengers (and consequently faster) in a light direction, in order to add a few trips in the heavy direction. Correctly done, this raises the overall load factor and reduces the standee factor. CONCLUSION The intent of this study was to gain a better under- standing of two indicators of scheduling performance before setting quantitative goals. Something has been learned about the current system. Considering the common perception that the system is over- crowded, the 24-hr averages of both load factor and standee factor are surprisingly low. The load and standee factors clearly show how overcrowding is a matter of time of day and line segment. In setting goals for scheduling, what is subject to scheduler influence must be borne in mind. Al- Transportation Research Record 1011 though the scheduler should endeavor to increase load factors, she typically has little direct con- trol over them--they are more directly a result of budget balancing. Within the overall load factors, however, schedulers should attempt to reduce stand- ing as much as possible. With this in mind, an informal goal of scheduling has been formulated on the basis of the elasticity results of this study. The goal is to hold rises in standee factor to less than 1. 6 percent for every 1 percent rise in load factor. A similar goal state- ment could be made for declining load factors, but a decline is unlikely to occur in the face of pres- sures for greater productivity. The transit industry knows relatively little about how well it could do. Quantifying how well it is doing now is just a first step toward determining what is possible. What is needed next is a concerted attempt to push the state of the art of service de- sign and operation. This could give a better indica- tion of just how high the load factors could be in combination with low standee factors. REFERENCE 1. N.H.M. Wilson and S.L. Gonzalez. Methods for Ser- vice Design. In Transportation Research Record 862, TRB, Nati-;:;al Research Council, Washington, o.c., 1982, pp. 1-9. Publication of this paper sponsored by Committee on Bus Transit Systems. Computer Application for Determining Bus Headways and Timetables AVISHAI CEDER ABSTRACT One component of an extensive program to develop applications for bus automatic data collection systems (ADCSs) is presented. Current procedures for determin- ing bus timetables are reviewed, and alternative methods for creating time- tables using passenger load data are proposed. The major objectives set forth are to evaluate timetables in terms of required resources, to improve the cor- respondence of bus departure times with passenger demand, to allow headway- smoothing techniques (similar to what is done manually): to integrate different headway-setting and timetable construction methods I and to permit direct bus frequency changes for possible exceptions (known to the scheduler), which do not rely on passenger demand data. The final product of the study consists of a set of computer programs that perform (a) conversion from the bus property mainframe files to an adequate input file, (b) analysis of four methods for setting bus headways, and (c) creation of alternative public timetables at all the route time points. These programs are tested on a heavily traveled bus line in Los Angeles, and the derived alternative frequencies and timetables are in- terpreted and discussed.
Transcript of Bus Headways and Timetables
76
the chance of not finding a seat while bringing the average percentage of seats filled closer to 100.
Examples of generic actions that can reduce standee factor without reducing load factor are short-1 ining, partial deadheading, and headway offsets.
By shortlining, or running buses over only a segment of the route, capacity can be shifted from a portion of a line on which the seats are seldom filled to another segment on which people frequently must stand.
Headway offsets are a way to even the loads on successive trips, where one trip regularly tends to have standees and a succeeding trip is regularly light.
Partial deadheading is a technique for saving buses by running a fraction of the buses without passengers (and consequently faster) in a light direction, in order to add a few trips in the heavy direction. Correctly done, this raises the overall load factor and reduces the standee factor.
CONCLUSION
The intent of this study was to gain a better understanding of two indicators of scheduling performance before setting quantitative goals. Something has been learned about the current system. Considering the common perception that the system is overcrowded, the 24-hr averages of both load factor and standee factor are surprisingly low. The load and standee factors clearly show how overcrowding is a matter of time of day and line segment.
In setting goals for scheduling, what is subject to scheduler influence must be borne in mind. Al-
Transportation Research Record 1011
though the scheduler should endeavor to increase load factors, she typically has little direct control over them--they are more directly a result of budget balancing. Within the overall load factors, however, schedulers should attempt to reduce standing as much as possible.
With this in mind, an informal goal of scheduling has been formulated on the basis of the elasticity results of this study. The goal is to hold rises in standee factor to less than 1. 6 percent for every 1 percent rise in load factor. A similar goal statement could be made for declining load factors, but a decline is unlikely to occur in the face of pressures for greater productivity.
The transit industry knows relatively little about how well it could do. Quantifying how well it is doing now is just a first step toward determining what is possible. What is needed next is a concerted attempt to push the state of the art of service design and operation. This could give a better indication of just how high the load factors could be in combination with low standee factors.
REFERENCE
1. N.H.M. Wilson and S.L. Gonzalez. Methods for Service Design. In Transportation Research Record 862, TRB, Nati-;:;al Research Council, Washington, o.c., 1982, pp. 1-9.
Publication of this paper sponsored by Committee on Bus Transit Systems.
Computer Application for Determining
Bus Headways and Timetables
A VISHAI CEDER
ABSTRACT
One component of an extensive program to develop applications for bus automatic data collection systems (ADCSs) is presented. Current procedures for determining bus timetables are reviewed, and alternative methods for creating timetables using passenger load data are proposed. The major objectives set forth are to evaluate timetables in terms of required resources, to improve the correspondence of bus departure times with passenger demand, to allow headwaysmoothing techniques (similar to what is done manually): to integrate different headway-setting and timetable construction methods I and to permit direct bus frequency changes for possible exceptions (known to the scheduler), which do not rely on passenger demand data. The final product of the study consists of a set of computer programs that perform (a) conversion from the bus property mainframe files to an adequate input file, (b) analysis of four methods for setting bus headways, and (c) creation of alternative public timetables at all the route time points. These programs are tested on a heavily traveled bus line in Los Angeles, and the derived alternative frequencies and timetables are interpreted and discussed.
Ceder
Passenger demand at the route level is generally ascertained at one or more selected stops along the route where the bus carries its heaviest loads (point check). A more comprehensive method is based on load profile and running time information gathered along the entire length of the bus route (ride check). Point checks are typically conducted several times a yeaq ride checks are often performed only once or twice during the year.
The methods used by bus properties worldwide are commonly based on the following service standards: (a) adequate space will be provided to meet passen
ger demand and (b) an upper bound is placed on the headway to assure a minimum frequency 0f service (policy headway). The first requirement is adequate for heavy ridership hours (peak periods) , and the second for light ridership hours. The first requirement is usually met by the peak load factor method-the required number of buses is obtained by dividing the maximum observed passenger flow by a load standard (desired occupancy, number of seats). The second requirement is met by establishing policy headways (maximum allowed headways) that usually are 30 or 60 min.
Several researchers have approached the bus headway determination problem through mathematical programming techniques (.!-_l). However, these mathematical programming models have not been generally adopted by transit schedulers because the models are not sensitive to a great variety of system-specific operational constraints. For example, they cannot simultaneously determine evenly spaced headways and unevenly spaced headways for situations involving scheduling exceptions.
PREPARATION OF TIMETABLES
In current practice schedule changes are made using a mix of manual and computer-generated reports. The use of computerized reports has been established in many large bus properties [e.g., Southern California Rapid Transit District (SCRTD) in Los Angeles, Toronto Transit Commission in Toronto, EGGED in Israel]. The procedure employed by SCRTD to develop timetables will be used as an example. On the basis of ride- and point-check data, the following steps are performed by the SCRTD scheduling department:
1. Running times are established for each route by time of day (using the most recent ride-check data).
2. Calculated bus speeds are examined for each time period and route segment in order to correct special cases of speeding up and slowing down of buses (e.g., drivers may speed up toward the end of the route in order to extend their layover time).
3. Headways are determined at the peak point. This is usually the time point at which maximum passenger flow is observed; a time point is generally a bus stop at a major intersection or facility that appears on the public timetable.
4. Initial departures (passage) times are set at the peak point.
5. Departure times a re set at all route time points including the departure and arrival terminals by using the established running times and the headways at the peak point.
6. Departure (passage) times are adjusted at the peak point to take into account two additional considerations: trips with short turns and the vehicle block construction procedure.
7. The final route timetable is completed. 8. After the updating of the schedule, the
changes (or the new timetable) are marked on the
77
timetable print instruction sheet that is transferred to marketing.
The scheduling departments at various bus properties including SCRTD are seeking improvements at three different levels:
• Elimination of manual steps, • Improved accuracy, and • Cost saving and productivity gains.
The first improvement is anticipated to take place in the relatively near future, due to the acceptance of a computer in the scheduling department. However, it is understood that, even with the computerized process, many decisions will be made on the basis of the scheduler's judgment (e.g., the development of timetables for periods with special activities such as sporting events). The second improvement is directly related to the data collection methods. With greater use of an automatic data collection system (ADCS) , it is anticipated that this improvement could be easily attained. The third improvement is related to new and more efficient scheduling methods i the data collected will provide a reliable basis for the scheduler's decision. For example, the ADCS might provide the required data, but, without appropriate statistical models, the data would be meaningless. The statistical models should accurately reflect the variations of both the passenger demand and the vehicle performance measures. [For a statistical analysis of bus running time data see Ceder (_!) .]
This study provides alternative methods for determining bus timetables using passenger load data. The major objectives set forth are (a) to evaluate timetables in terms of required resources; (b) to improve correspondence of bus departure times with passenger demand; (c) to allow headway-smoothing techniques (similar to what is done manually) i (d) to integrate different headway-setting and different timetable construction methods i and (e) to permit direct bus frequency changes for possible exceptions (known to the scheduler), which do not rely on passenger demand data.
METHODS FOR SETTING BUS HEADWAYS
Earlier work (_~), which is strongly related to the procedures described in the following sections, is presented and clarified in this section. This early work describes four alternative bus frequency determination methods to fulfill two major objectives:
• Setting of bus frequencies both to maintain adequate service quality and to minimize the number of buses in the schedule and
• Efficient allocation of resources to gather passenger load data.
The first objective is to evaluate alternative methods of determining bus frequencies in conjunction with saving resources. The second objective compares the costs and benefits of information obtained from point checks and ride checks. The ride check provides more complete information than the point check, but it is more expensive because either additional checkers are needed to provide the required data or an automatic passenger counter is used. There is also the question of whether the additional information gained justifies the expense. Certainly, for bus properties that have I\.OCS this question is also relevant because only part of the overall fleet will be equipped with ADCS. The ADCS may be rotated among several groups of routes, de-
78
pending on whether it is worthwhile to gather pointcheck as opposed to ride-check data.
The four frequency determination methods in Ceder (.,?.) can be summarized by the following four equations:
• Two point-check methods for time period j
Method I : (Frequency)j = (Load at the daily maximum
load point)j/(Desired occupancy)j
Method 2: (Prequency )j • (Load at the hourly maximum
load point)j/(Desired occupancy )j
• Two ride-check methods for time period j
Method 3: (Frequency)j = MAX ( { (Area under the load profile in
passenger-km);/ ((Desired occupancy )j
x (Route length)]} (!..(lad at the hou rly
(1 )
(2)
maximum load point );/Bus cnpncity) (3)
Method 4: (Frequency) j is the same as in Method 3 but is subject to a constraint that limits the length of the route over which the load may exceed the product of (Frequency)j x (Desired occupancy)j•
Note that hourly or other time periods that coincide with j may be used in Equations 2 and 3 and that passenger-miles may be used instead of passengerkilometers in Equation 3.
The first method is based on data gathered at one point during the day. This point is usually determined from old ride-check data or from information given by a mobile supervisor. It represents the stop with the heaviest daily load along the route. The second method is based on the maximum load observed in each time period (usually an hour) instead of the whole day . Certainly, it is less costly and more convenient to station an observer (when ,:he data are collected manually) at one point during the entire working day than to assign observers to different points every time period. When ride-check data are available (collected either manually or by ADCS), the program established in Ceder (il compares Methods 1 and 2, and, as a result, the scheduler can decide about the appropriate point-check procedure.
The third method is based on load profile information. The load profile is plotted with respect to the distance traveled f r om the departure point. Thus, the area under this curve serves as a productivity measure in passenger-kilometers (or passenger-miles). This area divided by the route length is the average load as opposed to the maximum load in each period j in Method 2. Method 3 also guarantees, in an average sense, that the passengers on board on the maximum load segment will not experience crowding above the given bus capacity (number of seats plus maximum allowable standees). This method is useful for situations in which the scheduler wishes to know the number of bus runs that can be saved by raising the desired occupancy standard without incurring overcrowding. However, Method 3 can result in unpleasant travel for an extended distance over which the average load is above the desired occupancy. To control this undesirable situation, it is possible to establish a level of service criterion by restricting the total route distance that has loads greater than the desired occupancy. This is in essence Method 4.
A Programming Language, Version 1 (PL/1) program has been written for all four methods. This program compares the results of Methods l and 2 and uses a load profile density measure in a preliminary examination of the point- and the ride-check methods. The investigation of the load profile density measure
Transportation Research Record 1011
suggests the use of a point-check procedure for relatively flat profiles and a ride-check procedure otherwise (il . The program calculates the bus frequency for each time period and for each method. Three criteria are selected for Method 4: 10, 20, or 30 percent of the route length is allowed t o have a n observed load exceeding the desired one (these criteria can obviously be varied).
ALTERNATIVE TIMETABLES
There is always a trade-off between increasing passenger comfort and reducing the cost of service. Bus schedulers certainly understand the need to accommodate the observed passenger demand as well as possible. However, at the same time, their effort is also directed to the minimization of vehicle and driver costs. Different bus properties use different scheduling strategies based on their own schedulers' experience. As a result, it is unlikely that two independent bus properties will use exactly the same scheduling procedures at the detailed level. In addition, even at the same bus property, the schedulers may use different scheduling procedures for different groups of routes. Consequently, there is a need, when developing computerized procedures, to supply the schedulers with alternative schedule options along with an interpretation and an explanation of each alternative. undoubtedly, it is desirable that one of the alternatives coincide with the scheduler's manual procedure. In this way, the scheduler will be in a posi t ion not only to expedite the manual tasks but also to compare his methods with others in terms of the trade-off between passenger comfort and operating cost.
Current timetable determination procedures provide the basis for establishing the spectrum of alternative timetables. Three categories of options ~an be idcntifi~d: {:::) ~election cf type cf head.wa~l , (b) selection of a method or combination of methods for the setting of frequencies, and (c) selection of special requests. These three groups of options are shown in Figure 1. A selected path in this figure provides a single timetable. Hence, there is a variety of timetable options.
In the first category, alternative types of headway are considered. An equal headway simply means constant time intervals between departures in each time period, or evenly spaced headway. A balanced headway refers to unevenly spaced headways in each time period so that the observed passenger loads on all buses are similar. A smoothed headway is simply an average headway between the equal and balanced headways. It is an option in cases in which the available data are not sufficient for concrete conclusions about balanced headways but in which the scheduler believes that equal headways will result in significantly uneven loads. Such uneven load situations occur around work and school dismissal times and for trips with sh.ort turns. The theoretical work and the detailed procedures for this category appear elsewhere (§_).
In the second category it is possible to select different frequency or headway determination methods. This category allows for the selection of one method as well as combinations of methods for different time periods . The methods considered, indicated in Figure 1, are the two point-check and the two ride-check methods described in the fist section. In addition, there might be procedures used by the scheduler that are not based on data but rather on observations made by the road supervisors and inspectors as well as other sources of information.
The third category allows for special scheduling requests. One characteristic of existing transit
Ceder 79
,-------------------------, I Type of I I Headway Equal Balanced I I I I I I • I I
Smoothed I
I I I I
r-1
~------------~-----------~ ------------------------------- 1 I I I I I I I
M s F
ethods for ettlng requencles
' Daily Max Load
(Method 1)
I
' Max Load
(point check ) Methods
I
~ Hourl y (or Period )
M·ax Load (Method 2)
I -
' ' Intuitive or Load Profile Experience-(ride check ) Methods based
Methods
I
i ! Wi thout With
Level-of- Le ve l-of -service servic e
Criterion Criterion (Method 3) (Method 4)
I l I L_ ---------------------------- --
I I I I I I I I I J
r------- ------- ---------- --, I Special ' ' I I Requeats I I Clock Derived I I
Headways Headways I
I l I I I I I I Numbe r of Number of I Departures Departures I are Derived b:y Are I I the Selected Specified I Procedure ~------------------------~ FIGURE 1 Alternative timetables.
timetables is the repetition of departure times, usually every hour. These easy-to-memorize departure times are based on "clock headways" of 1, 2, 3, 4, 5, 6, 7.5, 10, 12, 15, 20, 30, 40, 45, and 60 min. Note that schedules do not generally consider that headways of less than 6 min influence the timing of passenger arrivals at a bus stop. However, for a general timetable determination procedure, there might be peak periods in which the headways are less than 6 mi n but need to be marked explicitly on the timetable.
The second possible special request is to allow the scheduler to prespecify the total number of bus departures during a time period. This request is most useful in er ises in which the scheduler needs to supply a working timetable for operation on the basis of tightly limited resources (buses or drivers, or both). By using his intuition and controlling the total number of departures, the scheduler may achieve better results than by simply dropping departures without any systematic procedure. Als;o, there might be cases in which the scheduler would like to increase the level of service by allowing more departures. Such situations occur when there is a belief that passenger demand can be increased by providing improved (more frequent) service. Certainly, the latter special request can also be approached through varying the desired occupancy
values, and it is up to the scheduler to decide whether to control the passenger loads or the number of departures, which directly governs the required fleet size.
It is important to emphasize that not all the paths in Figure 1 regarding clock headways are meaningful. Selection of balanced or smoothed headways cannot be performed if there is a clock headway constraint. Also, as shown in Figure 1, the number of departures cannot be specified for clock headways due to the specific time restrictions on those headways.
COMPUTER PROGRAMS ANO TEST RUNS ON AN SCRTn ROUTE
In this section the product of the analysis, which demonstrates that all the study objectives set forth in the first section are fulfilled, is discussed. The product is a set of computer programs that perform
• Conversion from the bus property mainframe files to adequate input files,
• Analysis of four methods for setting bus frequencies, and
• Creation of a public timetable at all the route time points.
80
U•• Frequencies and Heedways to Conatruct Manually the (one-POint I Timetabh
------------------------• PROGRAM 1 I becute the •rour Net11o .. ,• Protr .. to Dari,,. rre~encl•• •nil .. ....,,y, laH-! on ADCS or 011! IUl!e Ctl•cl< Data
Seve the lle1ult1 of lll>thol! for "Crl,i1" Situation•
Ye~ No
• •
------------ -----------·------------ -----------PROGRAM 2 I I I
I I I I
DPtermi~ the Com~ination of Run to be Performed rl'gar~ ing: Ill Type of headway l•qual, halancej, IIIIIOOthe~) (2) Information about th• Headway Metho~•
to be uwol (3! Pre~pee!fie~ Num~r ~f Bu~,~~~ (4) Cloe~ Headwoy
lrxecute the Timetable Construct1onl Frogram I
I
! ~---------------~------· OPTIONAL
UH the Derived HHdway Timetable
--,_.,-~~-----
... .,.,y TlMtable
_______ ._. ___ J
Cllapare the Alternatl .. TIMtabl11 lleau .. l."9 th• """"*r of Bu• 11una an<! FlHt Sile
I I
,-uc TiMUblN Ccaf'lete wl. t>i
---~ all TSMpolntl I
InltlllUIU'>III lnpot Data
P1de Check Conver•ior. Prograrr
Input Dita
!>us Pro~rty IS.CRTDI r1l11
FIGURE 2 Flowchart of Program 1 (setting alternative frequency and headways) and Program 2 (constructing alternative timetahles).
Ceder
DP
H~ UY'o':"XI
s; 5U1'5ET C
F'OtmTkJr~
!:! 0 .. S.VOTA MO~ICA .. 5
~ :i:
MELR05£ A\
BEVERLY BLVD
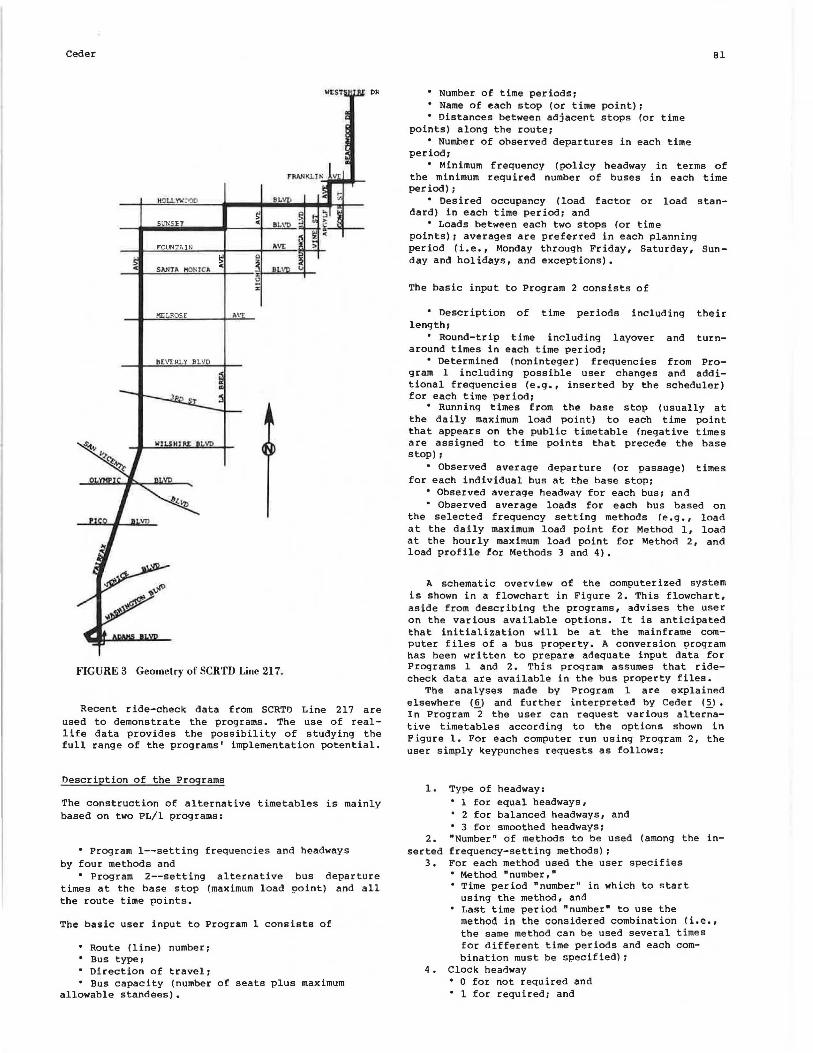
FIGURE 3 Geometry of SCRTD Line 217.
Recent ride-check data from SCRTO Line 217 are used to demonstrate the programs. The use of reallife data provides the possibility of studying the full range of the programs' implementation potential.
Oescription of the Programs
The construction of alternative timetables is mainly based on two PL/1 programs:
• Program 1--setting frequencies and headways by four methods and
• Program 2--setting alternative times at the base stop (maximum load the route time points.
bus departure point) and all
The basic user input to Program l consists of
• Route (line) number: • Bus type: • Direction of travel: • Bus capacity (number of seats plus maximum
allowable standees).
• Number of time periods: • Name of each stop (or time point); • Distances between adjacent stops (or time
points) along the route; • Number of observed departures in each time
period;
Bl
• Minimum frequency (policy headway in terms of the minimum required number of buses in each time period);
• Desired occupancy (load factor or load standard) in each time period; and
• Loads between each two stops (or time points) i averages are preferred in each planning period (i.e., Monday through Friday, Saturday, Sunday and holidays, and exceptions).
The basic input to Program 2 consists of
• Description of time periods including their length;
• Round-trip time including layover and turnaround times in each time period;
• Determined (noninteger) frequencies gram 1 including possible user changes tional frequencies (e.g., inserted by the for each time period;
from Proand addischeduler)
• Running times from the base stop (usually at the daily maximum load point) to each time point that appears on the public timetable (negative t i mes a re assigned to time points that precede the base stop):
• Observed average departure (or passage) times for each individual bus at the base stop:
• Observed average headway for each bus; and • Observed average loads for each bus based on
the selected frequency setting methods (e.g., load at the daily maximum load point for Method l, load at the hourly maximum load point for Method 2, and load profile for Methods 3 and 4).
A schematic overview of the computerized system is shown in a flowchart in Figure 2. This flowchart, aside from describing the programs, advises the user on the various available options. It is anticipated that initialization will be at the mainframe computer files of a bus property. A conversion program has been written to prepare adequate input data for Programs l and 2. This program assumes that ridecheck data are available in the bus property files.
The analyses made by Program l are explained elsewhere (6) and further interpreted by Ceder (5). In Program 2 the user can request various alter;ative timetables according to the options shown in Figure 1. For each computer run using Program 2, the user simply keypunches requests as follows:
1.
2. serted
3.
4.
Type of headway: • l for equal headways, • 2 for balanced headways, and • 3 for smoothed headways; "Number" of methods to be used (among the infrequency-setting methods); For each method used the user specifies • Method "number," • Time period "number" in which to start
using the method, and • Last time period "number" to use the
method in the considered combination (i.e., the same method can be used several times for different time periods and each combination must be specified) 1
Clock headway • O for not required and • 1 for required; and
82
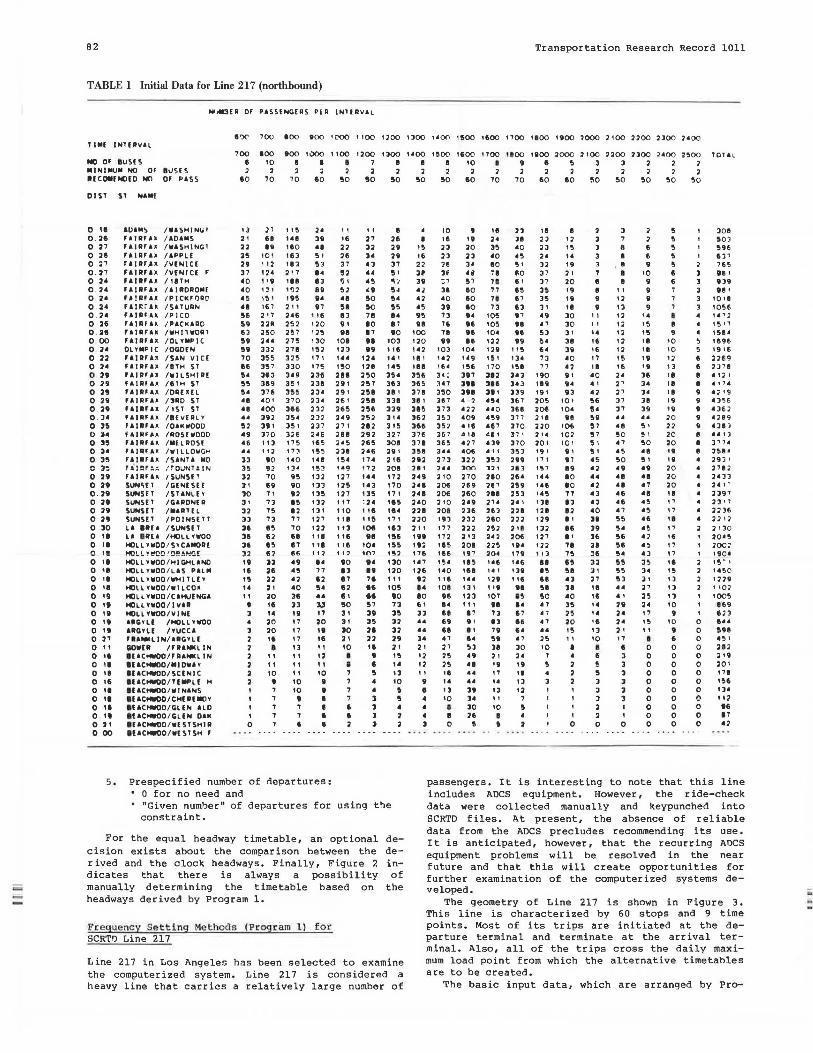
TABLE I Initial Data for Line 217 (northbound)
..,lll!IU or PISSI .. G[AS PEA l .. ll AVIL
l'X' 100 100 ,oo • COO '10() 1200 Tl•I INl!AVll
700 100 too 1000 1100 1200 1)00 Nil or IUSI s e 10 • • I 7 I 11111,u•u• ND or eusrs ' 2 2 2 2 2 2 UCOll[NOEO NO Of PASS 10 70 70 60 !10 !10 !IO
01ST Sl NAIii[
0 II &UIIIII~ /IU~HINt.l !J 27 115 ,. II II I o . 26 ,,,.,.,. /IDIIOS 21 61 10 39 16 21 :16 0 21 fA t Rra,. / WISHINGl n n 110 •• n J2 a 0 a "IAfU /APPL[ 25 101 tel 51 26 l• 29 0 21 ,.!Af ,U /V[ .. ICE 21 112 11) 53 31 A3 J1 o . 27 raruu /VI .. ! Cl ' 37 12& 211 •• !12 •• !11 0 2' FAIUU / 11TH AO 119 111 13 ~ I •5 ~, 0 . 2• "IAfU / Al ADAOIO£ AO 1,' ·~2 811 52 <9 !I> o . 2A r•!RfAl / PJCl<rlJAC' •s 151 195 I• •• !10 54 o . 2• , lJ S::i ll /SATURN •1 16 1 2 11 97 51 50 !,5 o . 2• ,., .... /PICO 56 2 17 246 116 13 71 I• 0 26 ,.,.,.,. /PICKARD 59 ne 252 120 91 10 11 0 . 21 ,.,.,.. /WH!l WOAl e3 250 251 125 .. 11 10 0 00 f AJAru /OLTIIIIPIC !Ill :14A 215 130 101 .. 103 0 2• OLTIIIIP IC /DGOIN " 33 2 211 152 123 •• 116 0 22 fAJAfU /SI .. VIC[ 70 355 325 111 144 12• 14 1 0 2A F.IJAflX /ITH ST H 357 JJO 175 150 ,,. 145 0 29 ,. ..... /WILSHJAI !I• JfiJ 349 236 211 250 354 0 29 fllAIU /tllM Sl !15 369 35 t 23ft 291 257 Je3 0 29 ,.,., .. /DAUH 5• 376 355 234 291 251 JI I 0 29 ,. ..... /JAD S l •• •o• 310 2J• 261 2!11 JJI o . 29 ,.,., .. / IST Sl 41 AOO 366 23 :1 265 2!16 339 o . H fAJAFAJ. /IIVIAL Y 4• 392 JS• 232 H9 25:1 314 0 35 "IAfll /OAKWOOD !12 391 ]51 237 271 212 315 0 JA ,. ..... /ROSEWOOD 49 370 326 2•6 211 292 327 0 35 "IAFU /lllll ROSI A6 11 3 175 165 2•5 :165 JOI 0 J• ,,,,u,.11: / Wll LDWGM .. "' 17:" 155 :Ill 2•6 291 0 3!1 ....... /SAN11 11110 JJ 90 uo 10 t5• ,,. 216 0 ,~ FA UH':..!. : rouN T!!f".: 35 9, CH ,!3 1-49 ,., 2 ~08 0 29 "IAFU /SU .. 5! l J2 70 9!, 132 127 , .. 172 0 29 SU..~! l /GI .. [ SH JI 19 90 13) 1:15 143 170 o . 29 SUNS! T /STll,iL(Y lO 7 1 12 135 127 135 17 I o . 29 SU..S[T /GUO .. IA 31 1J 15 132 111 : 2& 1115 0 29 SU..S[T /IOIAT[L J2 75 12 tJ• 110 1,11 ,,. 0 21 SU..SI 1 /POI .. SI l1 3] 73 17 127 111 115 17 I 0 JO LA IAU /SU..S! l J6 115 70 122 113 IOI 163 0 .. LI IA(I /HOLLTWOO Je 12 Ill 111 1111 H 1!16 0 II HOLL YWOD/STCIIIIIOAI 36 65 17 Ill 116 10A 155 C . 1! HO~!. '!'tfQ0 / 0!!.~Gl 32 @'.? ~~ I 12 ,q 1()1 15:1 0 II HllLLYWOO / HIGHLl..0 •• J] .. 1• 90 94 130 0 ,1 H0LLTW00 / L15 Pllllll 16 211 4!1 17 IJ 19 120 0 II HllLLYW00 / ,,,..1 lL[ T l!I 22 42 112 11 7a II' 0 •• HOLL YWOD/WI LCD• .. 21 40 ,. 12 16 ,os 0 19 HIILLTWDO/CAHU(..C.1 " 20 311 .. 11 16 90 0 19 HOLLYWOO/IVIA 9 16 33 J;I !10 57 n 0 " HOLLYIIOO/VI .. ( J .. 11 17 31 JII 35 0 19 Hi.Ylf /Hill LT WOO • ,o 17 20 JI J5 3:1 0 ,, HGTl[ /YUCCA 3 20 11 11 JO 21 32 0 27 fUMlL 1 .. /UGTLI 2 ,11 17 16 2, l2 29 0 II GOWER /fAIMlL I .. 2 I 13 11 10 111 21 0 111 IIACHWOO/fAll,fl(LIN 2 11 II 12 I I 15 0 II ll &CHIIOD/11111 DWI Y 2 11 11 II I I ,. 0 ,1 IUCHWOD/SCl .. lC 2 10 II ,o !I 13 0 16 lllCHIIOO / T(IIIIPL( H 2 I 10 • • 10 0 ti IUCHIIOO / WINANS 10 • 7 • 5 0 11 II &C.-00/CHU(IIIIOY • • 1 3 !I 0 II l[ICHIIOO/GLl .. ALO 7 6 6 J • 0 11 l(ACHWIIO/GL(N OAK 1 7 • I J 2 0 2' ll1c..,go 1w1s1s><1A 0 • • 2 J 2 0 00 l(ACHIIOO / W[STSH r
5 . Prespecified number of departures: • O for no need and
"Given number" of departures for using the constraint.
For the equal headway timetable, an optional decision exists about the comparison between the derived and the clock headways. Finally, Figure 2 indicates that there is always a possibility of manually determining the timetable based on the headways derived by Program 1.
Fr eq uency Set t i ng Methods (Program 1) for SCR'rD Li ne 217
Line 217 in Los Angeles has been selected to examine the computerized system. Line 217 is considered a heavy line that carries a relatively large number of
!JOO
••oo I 2
!10
• • 15 16 n JP 39 •J "2 45 95 H
100 120 ••2 111 111 356 365 371 J8, J8' 362 366 J16 371 )51 2112 1•• 249 ,.. 2&1 2•0 221 no 211 191 112 116 147 126 12 IA 10 61 JJ .. •• 1• 2 I 12 12 II II
• A
• A J
Transportation Research Record 1011
,.()() 1$00 ,,oo 11()() 1100 1900 1000 2 100 noo HOO :i• oo
1500 1600 1100 1100 1100 2000 '100 noo :llOO 2• 00 2500 TOl•L e 10 I 9 e 5 3 J 2 2 :I 2 2 2 ' 2 2 2 2 2 2 ' !10 10 10 70 60 10 50 50 !10 50 50
10 I 11 ,, II I 2 J ' 5 3 0 1 16 " ,. JI :I) , , ] 7 2 5 5 0 ) 23 20 JS •o n 15 J ft 6 5 ' 596 n n •o •5 2• .. 3 I 6 5 1 6) 1 16 J4 10 51 32 19 J · ' 9 5 ' 165 3f ., ~. ,o 37 2 1 7 I 10 • J 961 :1 5 7 11 II J7 20 I • 9 6 ] 139 31 10 71 15 35 19 I ,, 9 ] ... 40 10 71 11 J5 19 9 ,, I J 1011 31 10 73 63 3 1 11 9 13 9 ] 1056 73 14 105 ,, A9 JO ,, 12 ,. ,.,j 76 16 105 .. •7 JO 11 12 15 • , ~ ', 71 H 10• .. 53 31 ,. 12 15 9 • 1!tl• 19 H ,n 99 5• 31 16 12 •• 10 s 1696
10) 10• 129 115 6• Ji 16 ,2 •• 10 s 19 16 142 10 151 13• 73 Ao 17 15 19 12 6 2769 I 6• 1!16 170 151 71 •2 11 16 ,9 13 6 2)11 JI.: 397 312 J•J 190 ,, AO H J6 II I • 1 J I
JA1 JII JH JO) 119 94 . , 27 H II I . ',. 3'0 ,., JII )Jg 191 IJ A2 21 J4 II 9 4;> ,g ]17 • 2 4!1• )61 205 101 56 31 JI 19 9 "35 6 373 422 uo ]61 206 •o• !14 J1 J9 19 9 436] JSJ •09 •59 Jn ; 11 H 511 •4 .. :1 0 9 4JB9 352 • 16 A61 310 220 106 !17 •e 51 n 9 All) J67 • II .. ' 311 2•• 10:1 !17 50 51 20 8 441J
365 &21 •J9 370 201 101 51 41 50 20 I )17111
JU •06 • I 1 35] ,9' ,, 51 •5 .. ,9 I 3~B• 213 322 J5J 299 111 9 1 AS 50 !II II 29) 1 , .. Jon ", aJ 157 19 •2 49 •9 20 211:i 210 270 210 26• ... 10 •• 41 Al 20 2•JJ 206 269 21' 259 U6 10 42 .. •7 20 24, • 206 260 211 253 ,., 17 •J 06 •• II • 2391 210 20 2,. 2•, 131 " OJ "6 •5 17 23 • 1 201 2J6 21J 221 121 12 •6 •1 •5 17 2'36 193 '3:1 260 n2 129 I I JI 55 "6 •• • 221 :i 177 222 252 211 132 16 39 54 •5 17 213 0 112 213 2•2 206 127 11 J6 56 ., ,11 20•5 115 201 225 19A 122 71 JI !16 45 17 2oc: 1116 191 20• 119 I 13 15 J6 5• •J 17 , 190• tS• 115 U6 ••6 .. 6!I JJ 55 35 Ill ' I !t ~ I
uo 1111 ,., IJI 15 u JI 55 J• 15 2 14!)(\
116 ... 121 1111 61 0 21 !13 J 1 1 J ; 12:111 101 1 JI "' II 51 JI II 4. 21 IJ 2 , •OJ 96 123 101 15 !10 •o 16 ., 25 1) ,ocs
•• 1" H I• •1 J5 .. 29 2• ,o 169 H 17 1] 67 ., 25 1A H ,, 9 I 62) 69 •• ll H 41 20 16 2• ,s 10 0 ... H . ' 19 u .. 15 13 '1
,, II 0 !191 ., I• !19 ., 25 ,, 10 17 • II 0 •5 I ,1 5] JI JO ,o I • 6 0 0 0 ,12 25 09 2, 2• 7 • 6 J 0 0 0 ,19 25 •• ,, 19 5 2 5 3 0 0 0 201 16 .. 17 ,1 • 2 !I 3 0 0 0 171 14 .. u I] J 2 ] 3 0 0 0 156 I J J9 1] 12 J J 0 0 0 tJ• •o J• II 7 J 3 0 0 0 "' I JO 10 5 I 2 0 0 0 16 I 26 • • I 2 I 0 0 0 11 D 5 5 ' 0 0 0 0 0 0 02
passengers. It is interesting to note that this line includes AOCS equipment. However, the ride-check data were collected manually and keypunched into SCRTD files. At present, the absence of reliable data from the ADCS precludes recommending its use. It is anticipated, however, that the recurring AOCS equipment problems will be resolved in the near future and that this will create opportunities for further examination of the computerized systems developed.
The geometry of Line 217 is shown in Figure 3. This line is characterized by 60 stops and 9 time points. Most of its trips are initiated at the departure terminal and terminate at the arrival terminal. Also, all of the trips cross the daily maximum load point from which the alternative timetables are to be created.
The basic input data, which are arranged by Pro-
Ceder
gram 1 in a table form, are given in Table 1 for northbound Line 217. This ride-check information includes, for each hour, the observed number of buses in the third row, the minimum required frequency, and the desired occupancy in the fourth and fifth rows, respectively. The first and second columns in the tables are the distances (in kilometers) hetween each two adjacent stops and the stop name. The last column represents the total load across the whole day for each stop where each entry in Table 1 is a representative load for a given hour and stop. It is expected that these entries will usually be based on average values across several checks. A complete description of the input, including that for southbound Line 217, appears elsewhere (i).
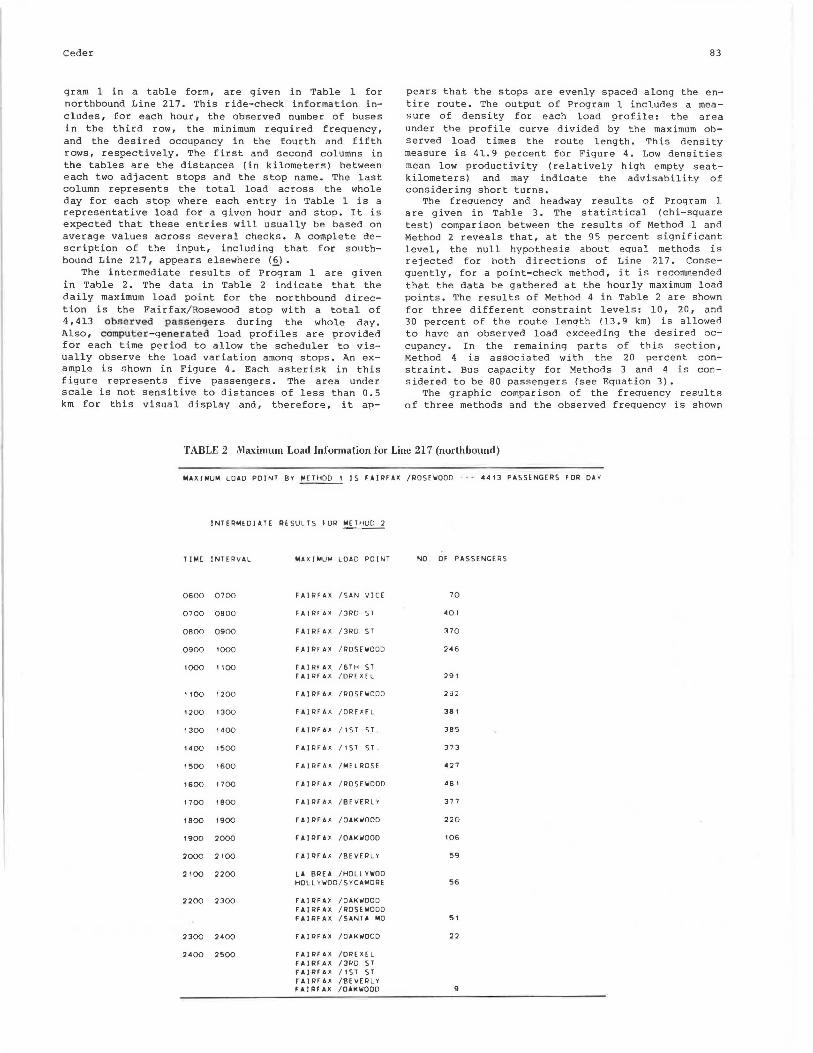
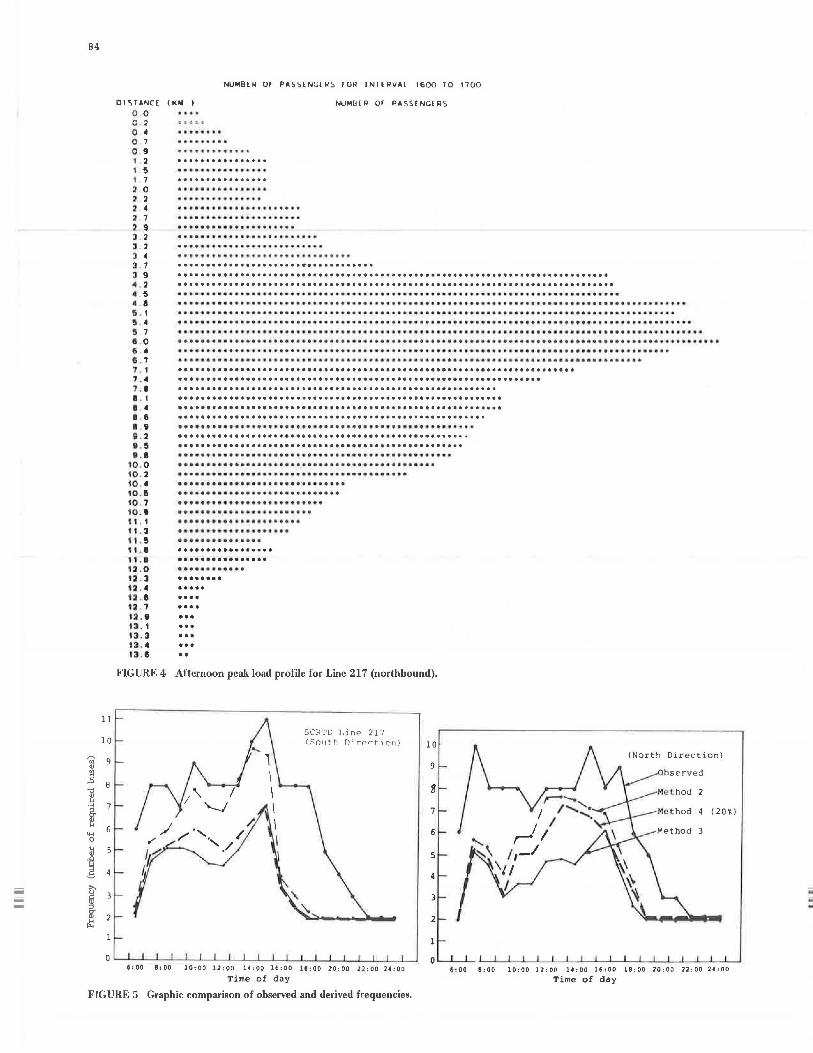
The intermediate results of Program 1 are given in Table 2. The data in Table 2 indicate that the daily maximum load point for the northbound d irection is the Fairfax/Rosewood stop with a total of 4,413 observed passengers during the whole day. Also, computer-generated load profiles are provide<l for each time period to allow the scheduler to visually observe the load variation among stops. An example is shown in Figure 4. Each asterisk in this figure represents five passengers. The area under scale is not sensitive to distances of less than 0.5 km for this visual display and, therefore, it ap-
83
pears that the stops are evenly spaced along the entire route. The output of Program 1 includes a measure of density for each load profile: the area under the profile curve divided by the maximum observed load times the route length. This density measure is 41.9 percent for Figure 4. Low densities mean low productivity (relatively high empty seatkilometers) and may indicate the advisability of considering short turns.
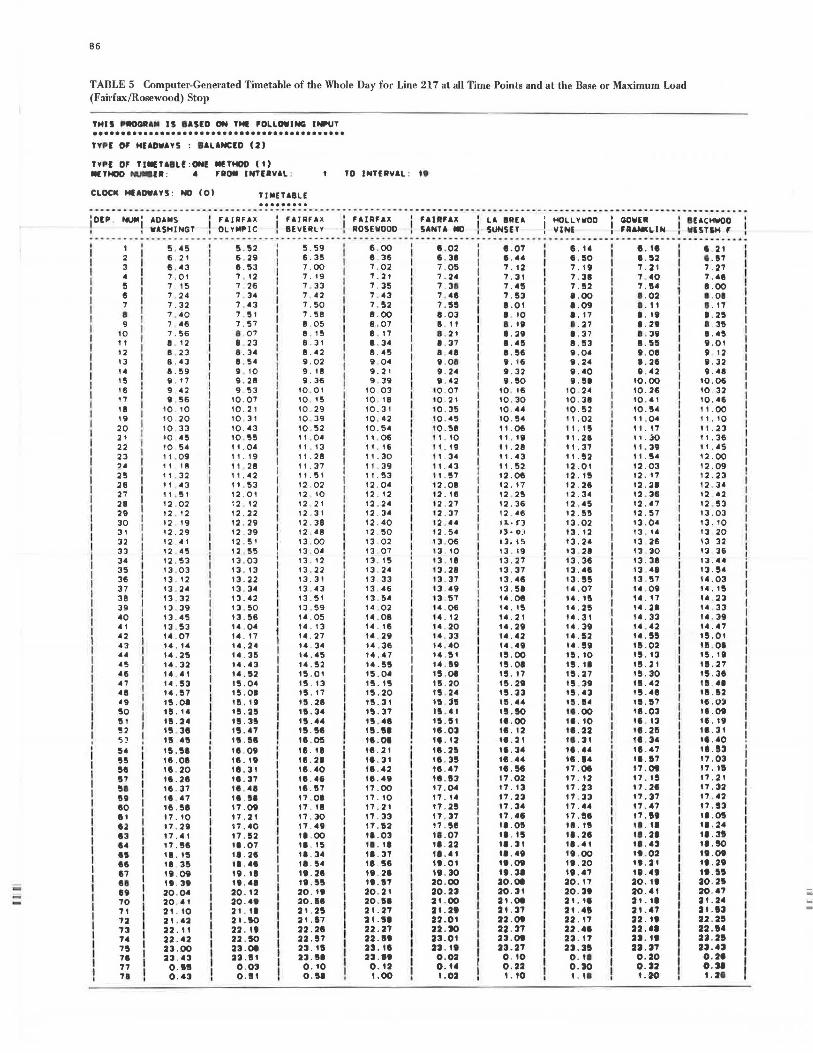
The frequency and headway results of Pr.ogram 1 are given in Table 3. The statistical (chi-square test) comparison between the results of Method 1 and Method 2 reveals that, at the 95 percent significant level, the null hypothesis about equal methods is rejected for both directions of Line 217. Consequently, for a point-check method, it is recommended that the data be gathered at the hourly maximum load points. The results of Method 4 in Table 2 are shown for three different constraint levels: 10, 20, and 30 percent of the route lenqth (13. 9 km) is allowed to have an observed load exceeding the desired occupancy. In the remaining parts of this section, Method 4 is associated with the 20 percent constraint. Bus capacity for Methods 3 and 4 is considered to be 80 passengers (see Equation 3).
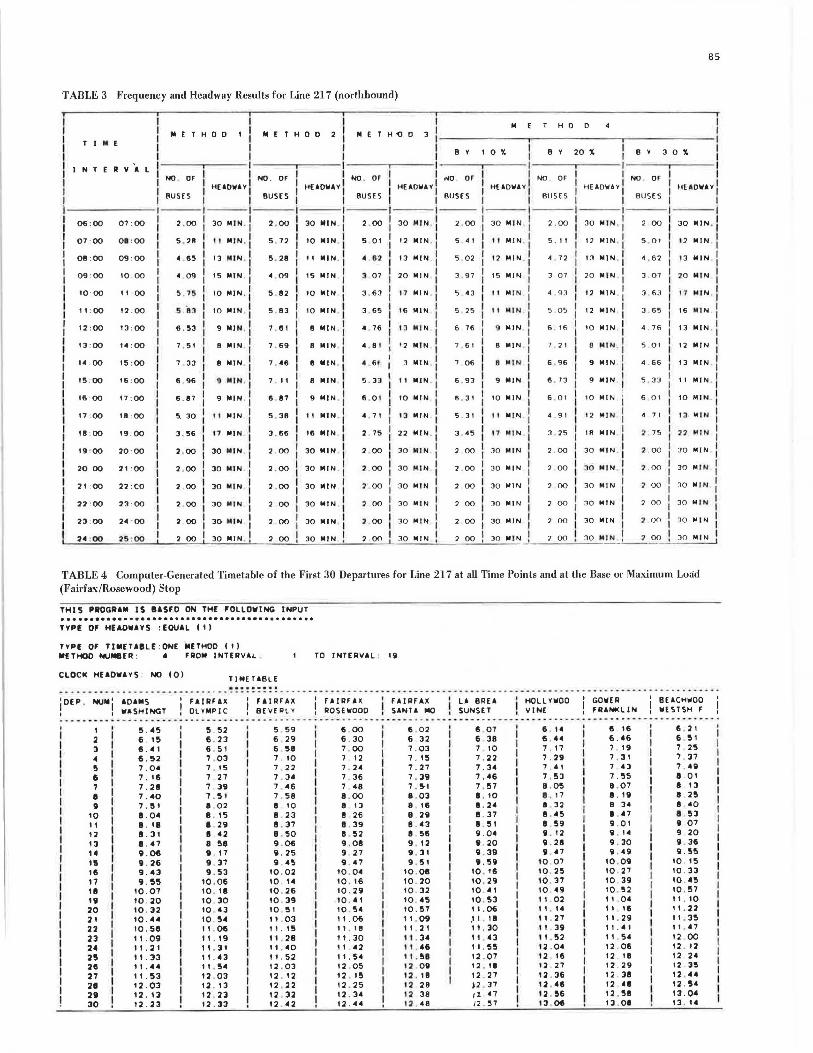
The graphic comparison of the frequency results of three methods and the observed frequency is shown
TABLE 2 Maximum Load Information for Line 217 (northbound)
MAXIMUM LOAD POINT BY METHOD 1 JS FAIRFAX /RDSEIIIDDD • •• 4413 PASSENGERS FDR DAY
INTERMEDIATE RESULTS FDR METHOD 2
TIME INTERVAL MAXIMUM LOAD POINT
0600 0700 FAIRFAX /S AN VIC£
0700 0800 FAIRFAX /JRD ST
OBOO 0900 FAIRFAX (3 RD ST
0900 1000 Fl!RFAX /ROSEWOOD
1000 1100 FAIRFAX (6TH ST FAtRFA)( /O REJtfl
1100 1200 FAIRFAX /ROSE\olDDD
1200 1300 FAIRFAX / DR DEL
1300 1400 FAIRFAX /1ST ST
1400 1500 FAIRFAX /1ST ST
1500 1600 FAIRFAX /MELROSE
1600 1700 FAIRFAX /ROSEWOOD
1700 1800 FAIRF,H /BEVERLY
1800 1900 FAIRFAX /OAKWOOD
1900 2000 FAIIHAX /OAKWOOD
2000 2100 FAIRFAX /BEVERLY
2100 2200 LA BREA /HOLLYll/00 HOLLYWOO / SYCAMORE
2200 2300 FAIRFAX /OAKWOOD FAIRFAX /ROSEWOOD FAIRFAX /SANTA MO
2300 2400 FAIRFAX /OAKll/000
2400 2500 FAIRFAX /DREXEL FAIRFAX /3~0 ST FAIRFAX / 1 ST ST FAIRFAX /BEVERLY FAIRFAX /OAKWOOD
NO OF PASSENGERS
70
401
370
246
291
381
385
373
427
4 8 1
377
220
106
59
56
5\
9
-
B4
11
10
00 OJ
9
1l 8 -0
\I! .... 7
~ I-<
6 .... 0
t;J 5
l >, u 3
I 2 it:
Dl~TANCE (KM )
0 0
NUMBER Of PASSCNGCR, FOR INlCRVAl 1600 TO 1700
NUMBER Of PASSENGERS
0 . 2 0 • 0 7 0 . 9 I 2 I. 5 I 7 2 0 2 2 2 • 2 7 2 9 J 2 3 2
..•..•.••... .. •.
..................... ". ·····················
•.......•••......•....•.•.......................................•...•..•....• .............................................................................. .••.....•.•.•.•...•.••.•.•.......•..•.•.••• , ............•...................... ·····························································~····························· ........................................•.•.•......••.•...•...•........•.......... ....... . .•.•......•......•..•..•........•..•.•.....•.••••.••••.....•.••.••.••••••.....•......••.... ...............•...........................•..........•.........•...........•.................
3 • 3 . 7 3 9 • . 2 • . 5 4 . 1 5 . I !I • !I 7 e o 6 •
••...•........•..•....•......................•..•.•..••.........•••.••••..•••.••......•...•.••..• 6 . 7 7 . 1 , .. 7 . 1 I . I I 4 1 . 6 1 . 9 II . 2 11 . !I II.I
10 . 0 10 . 2 10 . 4 10 . !i 10 . 7 10 . 1 II . 1 t I. 3 11. !I 11.I I I . I 12 . 0 12 . 3 12 . 4 12 . 1 12 . 7 u., 1:1 . 1 13 . 3 13 . 4 1:1 . 1
························································································ .••..•...•.•.... , ....... ····· ..•.......•...•....••.•.. ...•.......••.•.•....... ····································································~·· ································································· ......................................................... .....••..••.•..........•.................................. ....••..•.•..••..........................•............. •..••..•.•..........••.........••.•.....•..•....•.... ······$············································· ••..•..••......•.••.....•...••.•••.••.•.••......... ...•....•.•.............•.............•....... ....•.••••.....•..•.•. ~ ...... . ····························· .......................... .•.•.•...•.•.........•.• •..••••••...•.•......• •..••.•.•.•....••.•. •..•..•........ .•............... •....••..•...... ............ ........ .....
•• FIGURE 4 Afternoon peak load profile for Line 217 (northbound).
SCRTD Line 217 (Sn11th nirPrtion)
6:00 8:00 10:00 12:00 14:00 16:00 18:00 20:00 22:00 24:00
Time of day
10
9
8
3
2
l
(North Direction)
2
(20i)
6 : 00 8:00 10:00 12:00 14:00 16:00 18:00 20:00 22:00 24:00
Time of day
FIGURE 5 Graphic comparison of observed and derived frequencies.
85
TABLE 3 Frequency and Headway Results for Line 217 (northbound)
T I N E
I N E T H o o N E T H o o 2 ! N E T H ii o J l, _______ M_--.-___ H_ o __ D __ 4
_ T--_______ I II 1' II
BY 1 0 % I BY 20 % I BY JO% I 11 I I ! I 1- ----,.----1----.---- -----,.---- 1-----,.----1- --~--- ----.----I
I I I I I I I I NO . OF I NO . OF I NO . OF I NO . OF I NO . DF NO . OF I I !
I HEADWAY' HEADWAY! I HEADWAY' I HEADWAY HEADWAY' I HEADWAY BUSES I I BUSES I BUSES I BUSES I BUSES I BUSES I I
------:---1---1- -- 1---1---1--1--- --- ---1---l! - - -1 06:00 07:00 I 2 . 00 JO MIN . I 2 . 00 JO NIN . I 2 . 00 j JO NIN I 2 . 00 I 30 NIN 2 . 00 30 IIIN , I 2 00 30 MIN . I
07:00 011:00 I 5 . 2811 I I MIN . 1 5 72 10 MIN . : 5 01 I 12 IIIN . '1 5 41 I 1 I IIIN , I 5 . 11 12 IIIN : 5 . 01 12 IIIN '1
I I I I f I I 08:00 09 : 00 4 65 13 NIN . , 5 , 28 11 MIN . I 4 . 62 I 13 IIIN . , 5 . 02 l 12 MIN . , 4 , 72 13 IIIN . , 4 . 62 13 MIN I
09 :00 10 : 00 I 4 . 09 I 15 IIIN . , 4 09 15 IIIN I J 07 I 20 MIN I J . 97 I 15 IIIN 1' J 07 20 IIIN I J . 07 20 MIN I I I I I I I ul N .
1 I I 10:00 11:00 5 . 75 I 10 IIIN . , 5 82 10 MIN I 3 , 63 I 17 MIN . , 5 . 43 I !I~ 4 . 93 12 MIN I J 63 17 MIN ,
11 : 00 12 : 00 5 .8 3 I 10 NIN . : 5 . 83 10 lllN , I 3 , 65 I 16 MIN 1' 5 25 I 11 MIN I 5 05 12 MIN I 3 65 16 MIN I I I I I I I I I 12:00 13:00 6 , 53 I 9 MIN , 7 . 61 B IIIN . , 4 76 j 13 NIN 6 . 76 I 9 MIN . 6 . 16 10 "11N . , 4 . 76 13 IIIN . ,
I I I I I I I 13 00 14 :00 7 . 51 I 8 NIN . 7 . 69 8 MIN I 4 . 81 12 MIN . , 7 61 I 8 IIIN I 7 21 8 MIN . , 5 01 12 MIN
14:00 15:00 7 , JJ I a "11N 1 . 46 e MIN , 4 . 6 f J MIN I 1 06 I a ,,nN I 6 . 96 9 MIN . I 4 . 66 13 MIN . I
6 , 96: 9111N . 7 . 11 B"11N . 5 . 33 II IIINI 6 . 9319MIN: 6 , 73 9111N I 5 . 33 11"11N I
6 . 87 I 9 MIN . 6 , 87 9 IIIN 6 . 01 10 IIIN I 6 . 31 I 10 IIIN : 6 01 10 IIIN I 6 01 10 MIN . I I ', I I I 5. Jo 1
11 111N s . Ja 11 111N 4 11 13 111N s . 31 11 MIN 4 _91 12 "11 N 1
4 11 ,a " IN 1
INTERVAL
15 :00 16 : 00
16:00 17:00
17 : 00 18 : 00
J . 56 l 11 111N J . 66 16 111N . 2 1s 22 111N I 3 45 I 11 111N I 3 25 18 111N . 1
1
2 . 15 n MIN l 2 , 00 I JO IIIN . 2 . 00 JO MIN . 2 00 JO IIIN I 2 00 I JO "11N I 2 . 00 30 IIIN . 2 . 00 JO IIIN l
I I I I I 2 . 00 I JO IIIN . 2 . 00 JO MIN . 2 . 00 JO II IN I 2 00 I JO MIN 2 00 JO IIIN I , . oo JO II I N I
2 00 I JO IIIN 2 . 00 JO MIN '00 JO MIN I 2 00 I 30 IIIN I 2 00 JO IIIN 1' '00 30 MIN:
2 00 I JO 111 N 2 00 JO 111 N , 2 00 30 "IN I 7 00 I JO 111 N I 2 00 30 111 N 7 00 30 111 N ', I I I I ' I I I I 2 00 I JO MIN 2 00 JO IIIN 2 . 00 JO MIN I 2 00 I 30 MIN 2 00 JO IIIN I 2 00 JO MIN I
2 00 ! JO NIN 2 00 JO IIIN 2 00 JO IIIN , 2 00 , 30 MI N I 7 00 30 MIN! 2 00 30 MIN l
18 : 00 19 00
19 00 20 : 00
20 00 21 :00
21:00 22:CO
22 : 00 23 00
23:00 24 · 00
24 ' 00 25 :00
TABLE 4 Computer-Generated Timetable of the First 30 Departures for Line 217 at all Time Points and at the Base or Maximum Load (Fairfax/Rosewood) Stop
THIS PROGRAM IS IIASFO ON THE FOLLOVING INPUT •....••..••...•.••••....•••.....••.....••..•• TYPE o, HUOWAYS : EQUAL ( 11
TYP[ OF TIM[TAIIL[: ON[ METHOD (11 METHOD NUMBER : 4 FROM INTERVAL TO JNT[R\IAL : 1g
CLOCK HEADWAYS : NO (0) TIIIETABLE ......... .... . . ...... ... . . .. ..... __ __ .... .. .. . ... ... ........... ..... ..... .... . .. ......... .. .. . .. ............... .... ................... .. . .. . ............. .. ... .... ..
1orP . NUN' ADAMS ' FAIRFAX I FAIRFAX I FAIRFA~ I FAIRFU( I LA BREA I HOLLYWOO GO,.ER I 8EACHW00
W&SHINGT I OLYMPIC I B[IIERLY I ROSEOIODO I SANTA NO I SUNSET ! IIINE FRANKLIN I WESTSH r I I ' I • • I ... ............ --- - ..... . ... .. ..... . -- .......... .. .... --~ .. . ....... ··· -·- ---·· · " . . .... ..... ---- --·-··· · ·- .. -·· . .. . --. ....... --- . -......... - .. --
1 !1 . 45 !1 . 52 5 , 59 6 00 6 . 02 6 07 6 . ,. fl 1fi 6 2 I
2 (j 15 6 . 23 6 29 6 . 30 (j 32 6 38 fi . U 6 . 46 6 !11
3 6 . 41 6 51 6 . 58 7 . oo 7.03 7 . 10 7 . 17 7. 19 7 25
4 fl . 52 7 . 0J 7 10 7 12 7 . 15 7 . 22 7 . 29 7 , 3 1 7 37
!I 7 . 04 7 . 15 7 22 7 24 7 . 27 7 . 34 7 . 41 7 4J 7 . 4i
6 7. 16 7 27 7 34 7 36 7 . 39 7.46 7 , 53 7. !15 8 . 01
7 7.211 7 . 39 7 46 7 48 7 . 5-1 7 , !17 8 . 05 8 . 07 (I 13 (I 7 . 40 7 . !11 7. 58 8 . 00 11 . 03 • • 10 8 . 17 II . 111 II 25
9 7 . !11 11 . 02 II 10 II 'J 8 18 11 . 24 II J2 8 34 11 . 40
10 I . 04 8 . 15 8 . 23 (I 26 8 . 2i 11 . 37 (I , 45 11 . 47 • 53
11 8 . 18 1 . 29 8 . 37 (! , Jg 8 . 43 8 . !I 1 8 . 59 9 . 01 9 07
12 II . 31 (I 42 8 . !10 (I 52 8 58 i . 04 9 . 12 9 . 14 9 20
13 (I . 47 8 . !18 9 . 06 9 . 011 9 12 9 . 20 9 . 211 i . JO i . 38
u 9 . 06 9 , 17 9 . 25 9 27 9 . 31 9 . 39 9 . 47 9 . 49 !1.55
1!1 9 . 26 9 . 37 g 45 9 . 47 ll , !11 9.!l!I 10 07 10 . 0i 10 , 15
1fl 9 . 43 9 . 53 10 . 02 10 . 04 10 . 011 10 . 16 10 . 2!1 10 . 27 10 . 33
17 9 . !15 10 . 06 10 . U 10 , 16 10 . 20 10 , 29 10 . 37 10 . 39 10 . 45
111 10 . 07 10 . 111 10 . 26 10 . 29 10 . 32 10 . 41 10 . 49 10 . !12 10 . 57
19 10 . 20 10 30 10 . 39 10 . 41 10. 45 10 . 53 11 . 02 11 . 04 11 . 10
20 10.32 10 . 43 10 !II 10 . 54 10.57 11 .06 11 , 14 11 16 1 I , 22
21 10 . 44 10 . !14 11 . 0J 11 . 06 11 . 09 ,1 I. 111 I 1 , 27 11 . 29 1 I . 35
22 10 . 58 I 1. Ofl 11 . 15 11 . 18 1I . 21 11. JO 11 Jg 11 . 41 11 47
23 11 . 09 11. 19 I 1 . 28 11 . 30 1 I . 34 11 . 43 1, . !12 11 . 54 12 00
24 , 1.21 1I.31 11 , 40 11 . 42 11 . 46 11.!l!I 12 . 04 12 . 06 12 . 12
2!1 11 . 33 11 . 43 11 . 52 11 . 54 1 I . 511 12 . 07 12 . 16 12 . 18 12 24
28 11. 44 11 , 54 12 . 0J 12 05 12 09 12 . 11 12 27 12 . 29 12 . J!I
27 11 . 53 12 . 03 12 . 12 12 , 15 12 . 18 12 . 27 12 . 36 12 . 38 12 . 44
211 12 . 03 12 . 13 12 . 22 12 . 25 12 28 f2 . J7 12 . 46 12 . 41 12 . !14 29 12 . 13 12 . 23 12 . 32 12 . 34 12 38 ,1 47 12 . !16 12 . 58 1:i.o,
30 12 . 23 12 . l:J 12 . 42 12 . 44 12 48 12 . 5 7 13 06 13 . 01 13 . 14
86
TABLE 5 Computer-Generated Timetable of the Whole Day for Line 217 at all Time Points and at the Base or Maximum Load (Fairfax/Rosewood) Stop
THIS ,aooaa• IS IIASED DN TNI FDLLDIIING 1•UT .•....•....................•........•........ TY'E OF HEADWAYS : IALANCED (2)
TY'E DF TIIIETAIILf:DNE NETHOO Cl) IKTHOO .._...EA: • FRON INTERVAL :
CLOCK HIADIIAYS : NO (0) TJM£UBL£
jD!P . MUM! ADAMS 1 , WASHINGT
, 2 3
• !I I 7 I 9
10 11 12 13
•• 15 16 17 18 19 20 2 1 22 2J ,. 25 211 27 21 29 30 31 32 33 J• 35 36 37 38 39 40 .. , 42 43 .... 45 48 47 All 49 50 !11 52 '51 5• 55 !Ill 57 58 51 110 111 62 83 u 15 H 117 81 19 70 71 72 73 74 75 71 n 71
5 . 45 6 21 6 . •3 7.01 7 15 7 , 24 7. 32 7 . 40 7 •6 7.56 II . 12 II 23 8.•3 8.59 9 , 17 9 •2 9 . 56
10 . 10 10 . 20 10 . JJ 10 45 10 S4 11 . 09 11 111 11 . 32 11 43 11 . 51 1l 02 12 . 12 12 19 12.29 12 . • 1 12 45 12.53 13 OJ 13 . 12 13 . 24 13 . 32 1J J9 13 . •5 13 . !13 1• .07 , •. 14 14. 25 14 . J2 14 • , 14. 53 14. 57 15 . 01 1!1.,.. 111.2• 1!1 . 31 HI 45 1!1.51 111.08 111.20 16 . 21 11 . 37 11 47 16.!18 17. 10 17. 21 17. 41 17. 56 18. 15 18 3!1 1!1.09 ti . 311 20 . ~ 20 , 41 21. 10 21.U ::12. , , 22 . •2 23.00 23.43
0 . 1!1 0.43
I F&JIIF&X
1 OLVM,JC
5 . 52 6 29 6.5J 7 . 12 7 26 7 J4 7 43 7 51 7.57 8 07 I 23 II . 34 11 . 54 g 10 9. 211 9 53
10 . 07 10.21 10 . 31 10 . 43 10 . 55 11 . 04 11 . 19 1' • 28 1, . •2 11 , 53 12 . 01 12 12 12 . 22 12.29 12 . 39 12 . 51 12 !55 13 , 03 IJ . 13 13 . 22 13 34 13. 42 13.50 13 . !56 14 .04 14. 17 14. 2• 14 . 3!5 14 . •J 14 . 52 15.o• 15.01 1!5. 11 1!1. 2!1 15 . 3! 1!1 . 47 15.!II 11 . 0!I 11. II II. JI ti. 37 11 . 41 11 . 51 17 . 09 17. 21 17 .40 17 . !52 11 . 07 18. 21 11.41 ,11. ,a 11.48 20 . 12 20 . 41 21. 11 21 .!10 22. 11 22 . 50 23 . 09 23.111 0.03 0.!11
'i FAIIIFU 11£1/EIILV
!1 . 59 6.35 7 .00 7. 19 7 , 33 7 42 7.50 7.58 11.05 8 . 15 I . 31 8.•2 9.02 9. 18 9.36
10 . 01 10 15 10 . 29 10 . 39 10 !52 11 . 04 11 13 11. 28 11 . 37 1,. !11 12 02 12 10 12 21 12 31 12 . 38 12 48 13 . 00 13 04 13 . 12 13 . 22 13 . 31 13 _.3 13. !51 13 . 59 1,.os 1•. 13 14. 27
". 3• 14.4!5 14. 52 1!5 . 01 15 . 13 15. 17 l!I. 28 111. 34 15.•4 1!1.!111 111 . 05 111. 11 111.21 111.40 ,, .... 11.57 17 . 01 11. 11 17.30 17 . 41 11 . 00 11 . 15 11. 34 11. !54 111.211 111.5!5 20 . ti 20 . !II 21. 25 21 .57 22.21 22 . !17 23 . 15 23 . H o. 10 0.!11
TD INTUVAL: 11
I FAIRFAX ! IIOSEWOOO
11 . 00 1 . 36 7.02 7.21 7.35 7 . 43 7.!52 1.00 8 . 07 8 . 17 1.34 I. 45 9 o• 9.21 9 . 39
10 03 10 18 10. 31 10 , 42 10.54 11 . Ofj
11 16 11 . 30 11 39 11. !13 12.04 12. 12 12 . 24 12 . 34 12.40 12.!IO 13 . 02 13 . 07 13 . 15 1J . 2• 13 33 13 , 46 13 . 54 14 02 14 .08 14. 16 14. 29 14 . 36 14. 47 14 .!15 15 . 04 15. 15 1!1. 20 1!5. 31 1!1. 37 t!l . 48 111 . !II 11.01 18. 21 , •. 31 II. 42 18.41 17.00 17. 10 17. 21 17. 33 17.112 11 . 03 ,,. 11 11. 37 18 !16 111.21 11.!17 20 . 21 20.H 21. 27 '21 .!II 22. 27 22.91 23 . ti 2:11.91 o. 12 1.00
i ,u.,u I SANTA IIO
1 .02 1 . 31 7.05 7.24 7 . 38 7 . 48 7 . 55 1.03 I . It 1.21 8.37 1 . 41 9.01 9.24 •. 42
10 . 07 10 . 21 10.35 10.45 10.51 11. 10 I 1. II 11 . 34 11. 43 11. !57 12 .08 12 . 111 12 . 27 12 . 37 12 . 44 12.54 13 . 06 13. 10 13 . 11 13.21 13 . 37 13 . 49 13 . 57 14 . Ofj
14 . 12 U . 20 ,. , 33 14 . 40 14. !11 14 . !II 1!1 . 0I 1!1. 20 15 24 l!I . 3!1 l!l . 41 t!l.!11 11 .03 ,,.12 111.2!1 11 . 3!1 111.0 11 . 113 17 . ~ 17 . 14 17. 2!1 17 . 37 17. !II 11.07 11 . 22 11.41 11.01 11.30 20.00 20.23 21.00 21.21 22.01 22.,0 23.01 2:11. 11
0 . 02 o. ,. 1.02
I LA BAU , SUNSET
1 . 07 6.44 7 . 12 7 .3 1 7 . 4!1 7. !13 8.01 I 10 II. 11 1.29 1.4!5 l . !11 , . 11 11. 32 1 . !lo
10 . 16 10 . 30 10 . 44 10 . !14 11 ,Ofi 11 . 11 1 I . 211 11 . 43 11 . !12 12 . oe 12. 17 12 . 25 12.36 12 . •6 11-n tJ• OJ 1 l. 15 13 . 19 13.27 13 . 37 13 . 411 13. !51 14.0I U . 15 14.21 14 . 29 14 . • 2 14 . 4!1 1!1. 00 1!1.01 l!I. 17 1!1.211 1!1 . 33 1!1.U 1!1. !IO 11.00 11. 12 11.21 II . :a• 11 . U ,e.511 17 . 02 17 . 13 17 . 23 17.34 17.48 11 . 0!5 ti. 1!1 11 . 31 11 . 49 111.0II 11.31 20,0I 20 . 31 21 . 0I 21. 37 22.0I 22.37 23.0I 23.27 o. 10 0.22 1.10
HOLLYWOO VIN£
6 . ,.. l.!10 7. 11 7.31 7.52 1 . 00 1.09 I. 17 I. 27 8.37 l.!13 !1 . 04 11.24 9.40 !I .!II
10 24 10 . 311 10.!12 11 .02 ,,. 1!5 t 1. 211 I I. 37 I I . !12 12.01 12. 1!1 12.26 12.34 12 , 45 12 . 55 13.02 13 . 12 13.24 13 21 13 . 36 13.41 13. !l!I 14 .07 14. 1!5 ,. . 2!1 1• . 31 14.39 14 .!12 14 . !l!I 11, 10 l!I . 11 1!1. 27 l!I 311 1!1.0 1!1.114 11.00 11.10 11 . 22 11.:111 , .... 11.14 17 .OI 17 . 12 17 . 23 17 . 33 17.U 17 .!II 11. 1!1 ,,. 211 11 . 41 111 . 00 111.20 11.47 20. 17 20 . 31 21. ,. 21 .• , 22. 17 22.•• 23.17 2:11.39 o. ,. 0.30 '. 11
' GOWER ! FRANKLIN
I . 11 l.!12 7.21 7 40 7 .!14 1.02 I. 11 I. Ill 1.211 1 . 31 I. !l!I 1 .08 1.211 11 . 42
10.00 10. 26 10.41 10.!14 11 . 04 11. 17 1, .30 I 1. 3!1 1 I. !14 12.03 12. 17 12.21 12 . 36 12.•7 12 . 57 13.0.C 13 . U 13 26 13 30 13. 31 13 48 13 . !57 U .09 14. 17 14. 28 14. 33 14 . 42 14. !l!I 1!1.02 l!I. 13 l!I.21 t!l.30 II. 42 t!I. 41 1!1.117 11.03 Ill 13 11.2!1 11.3• 11.47 11.!17 17.0I 17. 1!1 17. 211 17. 37 17 .0 17.H 11. 11 ti. 21 11 . 4:11 11 . 02 11.21 , .... 20. 11 20 ... 21. 11 21.'7 22. ,. 22.•1 2:11. ,, 2:11. 37 0.20 0.32 1.20
I IUCHWOO 1 WIST5H ,
1.21 l.!17 7. 27 7.411 1.00 1.01 8. 17 1.2!1 8 . 3!5 1.4!1 !1.01 !I ,., 1 .3 2 !1.41
10.06 10 32 10.46 11.00 11. 10 11. 23 I I. 36 11. 45 12 . oo 12 . 09 12.23 12 . 34 12 •2 12 . !53 13.0l 13. 10 13 20 13 32 13 ]6
13 . 44 13.!I• 1, .03 14. 15 14 . 23 U . 33 14 . 39 14 . 47 1!1.0t t!l . 01 111. ,, 1!1.27 1!1 . 311 l!l . 411 t!l.!52 16.03 II.OIi 16. II ti . 31 11.•o 18.!13 17 .03 17. 111 17 .2 I 17 . 32 17 . 42 17. !13 11.0!I 11.24 II. 39 ti. !IO 11.09 11.21 11.!l!I 20.2!1 20 . '7 21 . 2• 21 .13 22.211 22.,. 2:11. 29 22.0 0.21 0.:111 1.H
iii iii,
Ceder
in Figure 5 for both directions of Line 217. It can be easily seen that the provided frequencies in both directions represent an excessive number of bus runs. The desired occupancy for each time period appears in Table 1 in the fourth row and was set forth by SCRTD schedulers. The use of these load factors and either Method 2 or Method 4 can result in significant resource savings. It is interesting to note that Method 4 results in much lower frequency than Method 2, particularly in the southbound direction. The absolute minimum frequency to accommodate the passenger load while neglecting the load factors is presented by Method 3, and in most hours is half the presently provided frequency.
Alternative Timetables [Program 2) for SCRTD Line 217
The PL/1 Program 2, which is based on the procedures described in Ceder (&_) , is used for the SCRTD Line 217 to construct alternative timetables.
Eighteen different combinations of runs have been selected for each direction of travel. Tables 4 and 5 are computer-generated timetables for the northbound direction. Table 4 [for equal headway) gives only the first 30 departures, and Table 5 presents the whole day's timetable. Nonetheless, it is possible to examine the differences between the equal and the balanced headway timetables.
Several observations can be made on the basis of results presented elsewhere (il. The results of Method 4 indicate significant resource saving in comparison with the results of Method 2, particularly in the southbound direction. This can also be seen in Figure 5. The combinations of methods used indicate that the use of Method 4 during peak periods only does not result in significant saving in comparison with Method 2 results. Consequently, Method 4 may be particularly useful during off-peak hours. For the southbound direction, the clock headway timetable using Method 2 results in the same number of departures and fleet size measure as Method 2 without clock headway. This may provide an opportunity to introduce the clock headway timetable at the main (daily maximum load) Fairfax/Beverly stop. It is worth mentioning that the clock headway pattern is not maintained along the entire route because of different running times between time points.
Certainly, the large number and variety of timetables may complicate the decision-making process for schedulers. However, it provides an opportunity
87
to examine rapidly different timetable and frequency scenarios. It is anticipated, however, that the skilled scheduler, while recognizing the full potential of the procedures, will select only a few alternatives to compare.
ACKNOWLEDGMENT
This study was supported by the Urban Mass Transportation Administration and is part of the UMTA/TSC Project Evaluation Series under the Service and Management Demonstration Program.
REFERENCES
1. P.G. Furth and N.H.M. Wilson. Setting Frequencies on Bus Routes: Theory and Practice. In Transportation Research Record 818, TRB, National Research Council, Washington, D.C., 1981, pp. 1-7.
2. H. N. Koutsopoulos, A. Odoni, and N. H. M. Wilson. Determination of Headways as a Function of Time Varying Characteristics on a Transit Network. Proc., 3rd International Workshop on Transit Vehicle and Crew Scheduling, University of Montreal, Transportation Research Centre, June 1983.
3. M. Lampkin and P.D. Saalmans. The Design of Routes, Service Frequencies and Schedules for a Municipal Bus Undertaking: A Case Study. Operation Research Quarterly, Vol. 18, No. 4, 1967, pp. 375-397.
4. A. Ceder. Practical Methodology for Determining Dynamic Changes in Bus Travel Times • .!.!!_ Transportation Research Record 798, TRB, National Research Council, Washington, o.c., 1981, pp. 18-22.
5. A. Ceder. Bus Frequency Determination Using Passenger Count Data. Transportation Research, Part A, forthcoming.
6. A. Ceder. Methods for Setting Bus Timetables. Multisystems, Inc., Cambridge, Mass.; Transportation Systems Center Project Evaluation Series, Service and Management Demonstration Program, UMTA, U.S. Department of Transportation, Feb. 1984.
Publication of this paper sponsored by Committee on Bus Transit Systems.