Burning Hydraulics – Experimental Investigations of the ...
6
degree flow deflection. But for the development of a simulation model of the micro-diesel effect from the experiments, there is insufficient information available. The operating conditions to obtain first micro-diesel events and a detailed position of the emitted light are not mentioned explicitly. Thus, the results are also inappropriate for model development. The present contribution takes up the mentioned weaknesses and will deliver detailed boundary conditions of the micro-diesel effect within models of real components. Therefore a typical valve and a pump geometry were chosen, where the occurrence of the micro-diesel effect was expected. During the micro-diesel experiments a further light-emitting phenomenon has been observed, which could not be assigned to the micro-diesel effect. This intensive blue light was induced by a gas ionisation within the analysed models. To reach this, among other conditions, a high voltage is necessary. This voltage is caused by an electrostatic charge in the model. Electrostatic charge is a current topic in the world of hydraulics, in particular in filter technology /4/. Improved hydraulic oils lead to high electrostatic potentials and following electrostatic discharges, which can destroy a filter. The present contribution shows recordings of different types of electrostatic discharges and will deliver operating conditions for such a discharge. These information can be used to develop models for an electrostatic discharge prediction in further works. 2 Basics of the micro-diesel effect, gas ionisation and electrostatic charge 2.1 The micro-diesel effect The micro-diesel effect is defined by the self-ignition of a gas and vapour containing bubble. Therefore it is crucial that a gas bubble has to contain oxygen and flammable components. The oxygen is typically provided by air evolution within the cavitation process, which can take place at various points in a hydraulic system. Common hydraulic fluids are consisting of various flammable hydrocarbons, which makes a micro-diesel effect possible. For the self-ignition of the bubble a high temperature is necessary. Depending on the chemical composition, hydraulic fluids typically have an ignition temperature between 300 and 400 °C /5/. This liquid-dependent ignition temperature can be reached by a rapid compression of the bubble. The therefore minimum necessary critical pressure increase Δ can be estimated considering an adiabatic compression: Δ = ∙ − = 1,4 () (1) The pressure and temperature are the conditions in the bubble at the beginning of compression. In case the pressure increase was too slow, the adiabatic assumption of equation (1) is not valid and the necessary temperature would not be reached. This is caused by a high heat transfer from the inner bubble into the liquid. Lipphardt has found a minimum rate of pressure increase of 110.000 bar/s to provoke an ignition of a bubble in mineral oil. This lower limit has be found for big bubbles with a volume of approximately 180 mm 3 . For smaller bubbles (< 100 mm 3 ) higher rates are necessary. The translational velocity of the bubble in the flow has also an impact on the heat transfer. High slip velocities are increasing the heat transfer. The typical combustion period of a bubble in mineral oil is less than 2.5 ms /1/. Furthermore, the mixing ratio within the bubble and the ignition delay time determine whether or not the bubble will ignite. 2.2 Gas ionisation and electrostatic charge Ionisation defines the process of forming an ion from an atom or molecule. Its negative or positive charge of these elementary particles will be achieved by losing or gaining electrons. The loss of an electron can be caused by a collision between elementary particles or through interaction with light. Further mechanism of ionisation are also possible. For the separation of an electron from an atom or a molecule a minimum energy is necessary. This ionisation potential depends on the type of atom (material) and the excited state. The separation of further Burning Hydraulics – Experimental Investigations of the Micro-Diesel Effect and Gas Discharge within Models of a Valve and a Pump Dominik Krahl* and Jürgen Weber* TU Dresden, Institut für Fluidtechnik (IFD), Helmholtzstraße. 7a, 01069 Dresden, Germany* E-Mail: [email protected] This paper deals with light-emitting phenomena in hydraulic components, which are closely linked to cavitation. Both the micro-diesel effect and the gas discharge have been optically investigated within plane models of a valve and a pump section, respectively. The gas discharge is caused by an electrostatic charge of the oil or of the component. One result of the investigations is an overview of the areas of occurrence and the minimum necessary operating conditions of the phenomena. The form of appearance of both phenomena is also shown. Furthermore, the impact of electrically insulating materials is presented. In addition some measurements of the temperatures in close proximity to the phenomena are presented. Keywords: Micro-Diesel Effect, Cavitation, Valves & Pumps, Electrostatic Discharge Target audience: Component Manufacturer, Oil Manufacturer, Scientists 1 Introduction Cavitation is an omnipresent process in the field of hydraulics. A local pressure drop causes evaporation and/or degassing of the liquid. The consideration of this phenomenon is important in the design and operation of many hydraulic components. Cavitation is often accompanied by mostly unwanted effects such as noise, vibrations, efficiency losses and erosion. The micro-diesel effect is another phenomenon, which can be caused by cavitation in hydraulic components. This process is defined by the self-ignition of a gas and vapour containing bubble. Thus, the micro-diesel effect is another load for hydraulic components, which can be caused by cavitation. A typical example of a micro- diesel based overload are scorched sealings. But not only components can be affected by this phenomenon, also the quality of oil will suffer under accelerated ageing. If the micro-diesel effect is ignored, all these described negative impacts can lead to additional costs for the operator of the hydraulic system. But this is the crucial challenge. So far, there is no easy way to predict the micro-diesel probability. You can´t find any tool within commercial CFD software to judge the probability of micro-diesel occurrence. Taking a look into literature, there are only few contributions concerning the micro-diesel effect. Lipphardt /1/ has conducted basic micro-diesel experiments in the 1970s. He was investigating the conditions which are necessary to trigger the self-ignition of a single bubble in mineral oil. The required minimum rate of pressure increase of 110.000 bar/s is one main result of his work. The experiments were conducted under much idealised conditions, which makes the translation of the results into components like valves and pumps difficult. Ideal spherical bubbles like Lipphardt investigated are hardly to be found due to high velocities and turbulent conditions. Schmitz /2/ has taken up the results from Lipphardt and was developing a simulation model. This is useful for a better understanding of the experimental results. It shows for example, that smaller bubbles need higher rates of pressure increase for self-ignition. But a translation of the model to predict the micro-diesel effect within real components is also difficult, because the modelled bubbles are ideal spherical. Thus, some equations which were used are not valid for strongly deformed bubbles. The experiments of Lohrentz /3/ were the only ones investigating the micro-diesel effect in components with inner flow. It is a very simple geometry of a 90 539 GROUP J- 1
Transcript of Burning Hydraulics – Experimental Investigations of the ...

The 11th International Fluid Power Conference, 11. IFK, March 19-21, 2018, Aachen, Germany
degree flow deflection. But for the development of a simulation model of the micro-diesel effect from the experiments, there is insufficient information available. The operating conditions to obtain first micro-diesel events and a detailed position of the emitted light are not mentioned explicitly. Thus, the results are also inappropriate for model development.
The present contribution takes up the mentioned weaknesses and will deliver detailed boundary conditions of the micro-diesel effect within models of real components. Therefore a typical valve and a pump geometry were chosen, where the occurrence of the micro-diesel effect was expected.
During the micro-diesel experiments a further light-emitting phenomenon has been observed, which could not be assigned to the micro-diesel effect. This intensive blue light was induced by a gas ionisation within the analysed models. To reach this, among other conditions, a high voltage is necessary. This voltage is caused by an electrostatic charge in the model. Electrostatic charge is a current topic in the world of hydraulics, in particular in filter technology /4/. Improved hydraulic oils lead to high electrostatic potentials and following electrostatic discharges, which can destroy a filter. The present contribution shows recordings of different types of electrostatic discharges and will deliver operating conditions for such a discharge. These information can be used to develop models for an electrostatic discharge prediction in further works.
2 Basics of the micro-diesel effect, gas ionisation and electrostatic charge
2.1 The micro-diesel effect
The micro-diesel effect is defined by the self-ignition of a gas and vapour containing bubble. Therefore it is crucial that a gas bubble has to contain oxygen and flammable components. The oxygen is typically provided by air evolution within the cavitation process, which can take place at various points in a hydraulic system. Common hydraulic fluids are consisting of various flammable hydrocarbons, which makes a micro-diesel effect possible.
For the self-ignition of the bubble a high temperature is necessary. Depending on the chemical composition, hydraulic fluids typically have an ignition temperature between 300 and 400 °C /5/. This liquid-dependent ignition temperature can be reached by a rapid compression of the bubble. The therefore minimum necessary critical pressure increase Δ can be estimated considering an adiabatic compression:
Δ = ∙
− = 1,4() (1)
The pressure and temperature are the conditions in the bubble at the beginning of compression. In case the pressure increase was too slow, the adiabatic assumption of equation (1) is not valid and the necessary temperature would not be reached. This is caused by a high heat transfer from the inner bubble into the liquid. Lipphardt has found a minimum rate of pressure increase of 110.000 bar/s to provoke an ignition of a bubble in mineral oil. This lower limit has be found for big bubbles with a volume of approximately 180 mm3. For smaller bubbles (< 100 mm3) higher rates are necessary. The translational velocity of the bubble in the flow has also an impact on the heat transfer. High slip velocities are increasing the heat transfer. The typical combustion period of a bubble in mineral oil is less than 2.5 ms /1/. Furthermore, the mixing ratio within the bubble and the ignition delay time determine whether or not the bubble will ignite.
2.2 Gas ionisation and electrostatic charge
Ionisation defines the process of forming an ion from an atom or molecule. Its negative or positive charge of these elementary particles will be achieved by losing or gaining electrons. The loss of an electron can be caused by a collision between elementary particles or through interaction with light. Further mechanism of ionisation are also possible. For the separation of an electron from an atom or a molecule a minimum energy is necessary. This ionisation potential depends on the type of atom (material) and the excited state. The separation of further
The 11th International Fluid Power Conference, 11. IFK, March 19-21, 2018, Aachen, Germany
Burning Hydraulics – Experimental Investigations of the Micro-Diesel Effect and Gas Discharge within Models of a Valve and a Pump
Dominik Krahl* and Jürgen Weber*
TU Dresden, Institut für Fluidtechnik (IFD), Helmholtzstraße. 7a, 01069 Dresden, Germany* E-Mail: [email protected]
This paper deals with light-emitting phenomena in hydraulic components, which are closely linked to cavitation. Both the micro-diesel effect and the gas discharge have been optically investigated within plane models of a valve and a pump section, respectively. The gas discharge is caused by an electrostatic charge of the oil or of the component. One result of the investigations is an overview of the areas of occurrence and the minimum necessary operating conditions of the phenomena. The form of appearance of both phenomena is also shown. Furthermore, the impact of electrically insulating materials is presented. In addition some measurements of the temperatures in close proximity to the phenomena are presented.
Keywords: Micro-Diesel Effect, Cavitation, Valves & Pumps, Electrostatic Discharge Target audience: Component Manufacturer, Oil Manufacturer, Scientists
1 Introduction
Cavitation is an omnipresent process in the field of hydraulics. A local pressure drop causes evaporation and/or degassing of the liquid. The consideration of this phenomenon is important in the design and operation of many hydraulic components. Cavitation is often accompanied by mostly unwanted effects such as noise, vibrations, efficiency losses and erosion.
The micro-diesel effect is another phenomenon, which can be caused by cavitation in hydraulic components. This process is defined by the self-ignition of a gas and vapour containing bubble. Thus, the micro-diesel effect is another load for hydraulic components, which can be caused by cavitation. A typical example of a micro-diesel based overload are scorched sealings. But not only components can be affected by this phenomenon, also the quality of oil will suffer under accelerated ageing. If the micro-diesel effect is ignored, all these described negative impacts can lead to additional costs for the operator of the hydraulic system. But this is the crucial challenge. So far, there is no easy way to predict the micro-diesel probability. You can´t find any tool within commercial CFD software to judge the probability of micro-diesel occurrence.
Taking a look into literature, there are only few contributions concerning the micro-diesel effect. Lipphardt /1/ has conducted basic micro-diesel experiments in the 1970s. He was investigating the conditions which are necessary to trigger the self-ignition of a single bubble in mineral oil. The required minimum rate of pressure increase of 110.000 bar/s is one main result of his work. The experiments were conducted under much idealised conditions, which makes the translation of the results into components like valves and pumps difficult. Ideal spherical bubbles like Lipphardt investigated are hardly to be found due to high velocities and turbulent conditions. Schmitz /2/ has taken up the results from Lipphardt and was developing a simulation model. This is useful for a better understanding of the experimental results. It shows for example, that smaller bubbles need higher rates of pressure increase for self-ignition. But a translation of the model to predict the micro-diesel effect within real components is also difficult, because the modelled bubbles are ideal spherical. Thus, some equations which were used are not valid for strongly deformed bubbles. The experiments of Lohrentz /3/ were the only ones investigating the micro-diesel effect in components with inner flow. It is a very simple geometry of a 90
539
GR
OU
P J
- 1

The 11th International Fluid Power Conference, 11. IFK, March 19-21, 2018, Aachen, Germany
3.1 Geometries of spool valve and axial piston pump model
An overview of the investigated models is given in Figure 1. Both are two-dimensional models with a model depth of 10 mm. An optimum optical access for visualization is assured through acrylic glass windows, which border the flow chamber in the third dimension.
The spool valve model represents a single control edge, which can be found in every spool valve. Between inlet and outlet a constant throttle gap of 1 mm height is positioned. The piston representing element of the valve model is chamfered in the control area. At high volume flows and low outlet pressures a cavitation area arises in the valve chamber downstream from the gap. This area is not only interesting for the visualization of cavitation, but also for the presented phenomena of chapter 2.
The second model is a section of an axial piston pump, where a high cavitation risk at reversing between delivery and suction stroke is typically. Thereby, the control groove of the valve plate is the dominant geometry, which throttles the flow. The high pressure difference between valve plate kidney and cylinder cavity causes a cavitating jet into the cylinder cavity. This one is very intensive in the considered pump at 9 ° overlap. For that reason, the investigated plane geometry was derived in this moment. Details of the origin geometry and some cavitation measurements can be found in the contribution of Wustmann /9/.
Figure 1: Overview of the investigated models
3.2 Test rig
Both models can be investigated with the same test rig, which is viewed in Figure 2. A change between the models is easily possible by a replacement of a few parts in the plane basic model. The volume flow is delivered by two screw-spindle pumps, which are characterized by a very low pulsation. Two speed variable motors enable the control of the volume flow. The maximum volume flow rate is 90 l/min. A variable throttle valve in the return line realizes a variation of the back pressure. High back pressures at same pressure difference can reduce or eliminate cavitation. A heat exchanger is used to keep the oil temperature constant. Various sensors are installed to measure the volume flow, inlet and outlet pressures as well as several temperatures at different positions. The temperature sensors and are only part of the valve model. These are positioned in areas, where a high micro-diesel impact is expected.
A visualization of the light appearances is possible through the windows of the basic model. To record the light phenomena with high light sensitivity, a monochromatic high speed camera is used. Although the camera allows a maximum frame rate of 650,000 fps, the presented recordings were taken with only 24 fps. This allows a higher exposure duration of 42 ms, which permits the visualisation of weak lights. The maximum spatialresolution of the camera is 1280x800. An impact of extraneous lights at the recordings can be precluded, because the optical setup is installed in a dark room. All presented measurements have been conducted with the mineral oil “HLP 46” of the manufacturer ELASKON.
The 11th International Fluid Power Conference, 11. IFK, March 19-21, 2018, Aachen, Germany
electrons from an atom is possible, but compared to the first separation, higher ionisation potentials are needed /6/.
The ionisation potential can be delivered in case of an ionisation by collision by the kinetic energy of the collision partner. This is typical for a field ionisation, whereby charged particles are accelerated by an electric field. Accelerated by the same field, electrons can reach a higher kinetic energy than positive ions due to their lower mass. Consequently, a collision with fast electrons is the dominant ionisation process in an electric fields. If the electric field energy was high enough, this type of ionisation would cause a chain reaction. The result of every field ionisation event is a further free electron, which can be accelerated and thus is able to ionise further atoms or molecules /6/.
To ensure the ionisation of a gas, a combination of a high electric field and a low gas pressure is necessary. At high pressures the distance between adjacent gas molecules is small. In the same electrical field a collision without enough kinetic energy has a higher probability than at low gas pressures. In this case the acceleration path of the electron is to short and the kinetic energy will be transferred to the atom/molecule by an elastic impact without ionisation.
Positive gas ions are not stable. They recombine with electrons and the previously required ionisation energy will be released by emitting photons. In gases different types of gas discharge are basically possible. They are mainly depending on gas pressure and electric field, but further conditions have an influence. At low pressures a glow discharge is most likely /7/. A glow discharge in air emits photons which are visible as blue light. Therefore for example in a geissler tube, an absolute pressure of 1 mbar and a voltage of some kV are necessary /6/. A combination of a lower voltage and smaller distance between the electrodes can also yield to a glow discharge. But according to Paschen´s law the minimum voltage for an air discharge is approximately 330 V. At higher pressures and corresponding higher voltages an arc discharge is more probable. This type of discharge appears as lightning.
The presented phenomena of gas discharge can also occur in hydraulic components. Two conditions can be typically found in every cavitation zone: free gas and a low pressure. The necessary high voltage can occur due to an electrostatic charge of the oil and the components. Modern hydraulic oils have a low electrical conductivity and therefore tend to charge electrostatically /8/. Critical are fluids with an electrical conductivity lower than 1000 pS/m. A charge of hydraulic components is also possible, if they consist of isolating materials or if there is no electrical grounding of conductive materials. In addition to the mentioned influencing material properties further factors determine about the level of electrostatic charge. The geometry and size of components as well as the flow velocity are influencing the charge. High flow velocities are typically critical, because the associated friction is the reason for electrostatic charge. In literature voltage measurements are documented, which verify the high electrostatic charge of oil passing a filter. Voltage peaks till 17 kV are the result of these measurements /4/. This voltage is high enough to trigger an air discharge and thus all necessary conditions for a gas discharge are possible within hydraulic systems.
3 Overview of the test rig as well as the investigated valve and pump models
The presented test rig and geometries originally were developed to investigate cavitation and cavitation erosion. The design was not optimized to provoke the phenomenon of micro-diesel or gas discharge. Both are peripheral phenomena, which could be repeatedly observed during cavitation measurements.
541
GR
OU
P J
- 1
The 11th International Fluid Power Conference, 11. IFK, March 19-21, 2018, Aachen, Germany
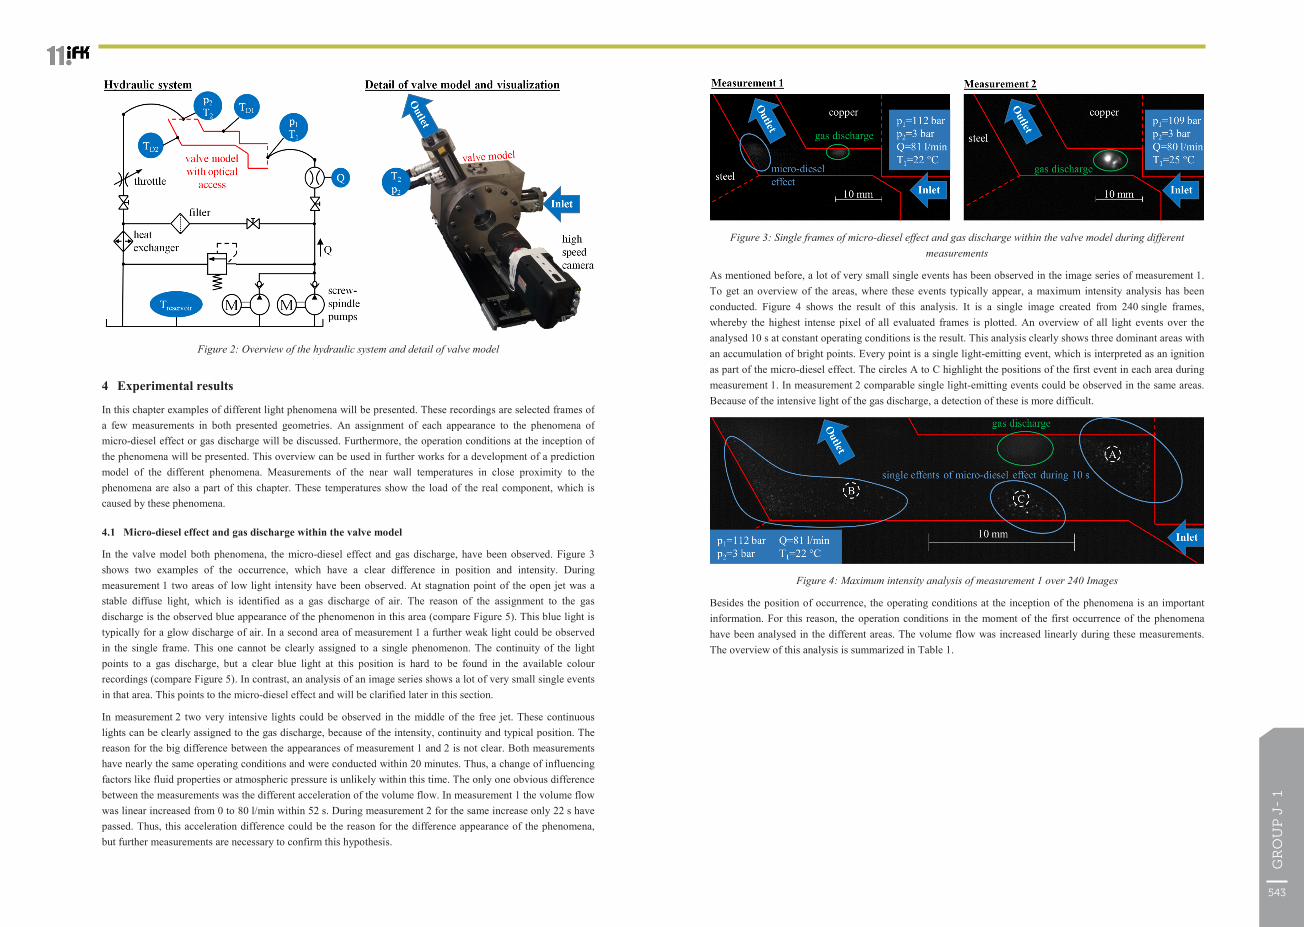
Figure 3: Single frames of micro-diesel effect and gas discharge within the valve model during different measurements
As mentioned before, a lot of very small single events has been observed in the image series of measurement 1. To get an overview of the areas, where these events typically appear, a maximum intensity analysis has been conducted. Figure 4 shows the result of this analysis. It is a single image created from 240 single frames, whereby the highest intense pixel of all evaluated frames is plotted. An overview of all light events over the analysed 10 s at constant operating conditions is the result. This analysis clearly shows three dominant areas with an accumulation of bright points. Every point is a single light-emitting event, which is interpreted as an ignition as part of the micro-diesel effect. The circles A to C highlight the positions of the first event in each area during measurement 1. In measurement 2 comparable single light-emitting events could be observed in the same areas. Because of the intensive light of the gas discharge, a detection of these is more difficult.
Figure 4: Maximum intensity analysis of measurement 1 over 240 Images
Besides the position of occurrence, the operating conditions at the inception of the phenomena is an important information. For this reason, the operation conditions in the moment of the first occurrence of the phenomena have been analysed in the different areas. The volume flow was increased linearly during these measurements. The overview of this analysis is summarized in Table 1.
The 11th International Fluid Power Conference, 11. IFK, March 19-21, 2018, Aachen, Germany
Figure 2: Overview of the hydraulic system and detail of valve model
4 Experimental results
In this chapter examples of different light phenomena will be presented. These recordings are selected frames of a few measurements in both presented geometries. An assignment of each appearance to the phenomena of micro-diesel effect or gas discharge will be discussed. Furthermore, the operation conditions at the inception of the phenomena will be presented. This overview can be used in further works for a development of a prediction model of the different phenomena. Measurements of the near wall temperatures in close proximity to the phenomena are also a part of this chapter. These temperatures show the load of the real component, which is caused by these phenomena.
4.1 Micro-diesel effect and gas discharge within the valve model
In the valve model both phenomena, the micro-diesel effect and gas discharge, have been observed. Figure 3 shows two examples of the occurrence, which have a clear difference in position and intensity. During measurement 1 two areas of low light intensity have been observed. At stagnation point of the open jet was a stable diffuse light, which is identified as a gas discharge of air. The reason of the assignment to the gas discharge is the observed blue appearance of the phenomenon in this area (compare Figure 5). This blue light is typically for a glow discharge of air. In a second area of measurement 1 a further weak light could be observed in the single frame. This one cannot be clearly assigned to a single phenomenon. The continuity of the light points to a gas discharge, but a clear blue light at this position is hard to be found in the available colour recordings (compare Figure 5). In contrast, an analysis of an image series shows a lot of very small single events in that area. This points to the micro-diesel effect and will be clarified later in this section.
In measurement 2 two very intensive lights could be observed in the middle of the free jet. These continuous lights can be clearly assigned to the gas discharge, because of the intensity, continuity and typical position. The reason for the big difference between the appearances of measurement 1 and 2 is not clear. Both measurements have nearly the same operating conditions and were conducted within 20 minutes. Thus, a change of influencing factors like fluid properties or atmospheric pressure is unlikely within this time. The only one obvious difference between the measurements was the different acceleration of the volume flow. In measurement 1 the volume flow was linear increased from 0 to 80 l/min within 52 s. During measurement 2 for the same increase only 22 s have passed. Thus, this acceleration difference could be the reason for the difference appearance of the phenomena, but further measurements are necessary to confirm this hypothesis.
543
GR
OU
P J
- 1

The 11th International Fluid Power Conference, 11. IFK, March 19-21, 2018, Aachen, Germany
It should be mentioned that there is also highly likely an impact of acrylic components on measurements 1 and 2. During all measurements acrylic glass windows were used to get the necessary optical access. So it cannot be ruled out that the presented discharge phenomena are only induced by the design of the model.
The temperature profiles of measurement 3 are presented in Figure 6. An increase of the volume flow Q is resulting in an increase of all temperatures, which are measured downstream of the gap (TD1, TD2, T2). That was to be expected, because the throttle geometry converts hydraulic energy into thermal energy. The temperatures TD1 and TD2 are round 15 K higher than T2, but this cannot be clearly referred to be a result of the presented phenomena. Due to a heat transfer between the mineral oil and the walls of the model, a lower temperature T2 at the further downstream positioned sensor is also typical.
Furthermore, the maximum measured temperatures of TD1 and TD2 are too low to pose a risk for usual materials. The maximum measured temperature of 45 °C has a big difference to the ignition temperature of mineral oil, which is above 300 °C. But this measurement did not preclude the presence of the micro-diesel effect in the measurement areas. The response time of a thermocouple is several orders of magnitude higher than the duration of the burning process of the micro-diesel effect. Thus, the sensor cannot sense this fast process. Furthermore, the diameter of the thermocouple is too big to sense the very small single event of an igniting bubble.
Figure 6: Temperature profiles during flow measurement
During further temperature measurements, the backpressure p2 was increased at constant motor speed of both pumps. This pressure increase from 3 to 19 bar has provoked a reduction of volume flow of only about 4.5 %, as visible in Figure 7. This is caused by a simultaneous increase of the system pressure p1. While the temperatures T1 and T2 are approximately unaffected, there is a striking decrease of the temperature TD2 in the area of the micro-diesel. This behaviour cannot be explained by a reduction of viscous losses. The hydraulic energy, which is converted in thermal energy, is only reduced slightly from 14 to 12 kW.
The cavitation behaviour during this measurement can deliver an explanation for this significant temperature decrease. At the start of this measurement there is massive cavitation downstream of the gap. An increase of the backpressure at same volume flow reduces the cavitation intensity stepwise, till cavitation is completely eliminated. This cavitation free operating condition was reached after 9 s. This was optical reviewed, but can also be identified by the noiseless signal of backpressure p2 in the period of maximum backpressure. Without cavitation, no compression of gas bubbles and accordingly no increase of the bubble temperature is possible. An explanation of the presented temperature decrease could be the loss of these bubble compressions. Since in the micro-diesel area many compression processes could be expected, these can lead to significant temperature changes in the whole area.
The 11th International Fluid Power Conference, 11. IFK, March 19-21, 2018, Aachen, Germany
Effect / Measurement
Inlet pressure p1 [bar]
Outlet pressure p2 [bar]
Volume flow Q [l/min]
Temperature T1 [°C]
Temperature T2 [°C]
Micro diesel @ A Measurement 1
9,1 1,3 20,6 21,9 22,0
Micro diesel @ B Measurement 1
12,4 1,4 25,1 21,9 22,0
Micro diesel @ C Measurement 1
17,8 1,5 30,3 21,8 22,0
Gas discharge
Measurement 1
28,6 1,6 38,8 21,8 21,9
Gas discharge
Measurement 2
17,7 1,4 31,3 25,1 28,4
Table 1: Operating conditions at the first events of the different phenomena
A comparison of the determined operating conditions shows, that the micro-diesel effect starts at lower pressures than the gas discharge. This is the case at all three determined points of micro-diesel phenomena. Furthermore, there is a big difference between the necessary minimum pressure of gas discharge inception between measurement 1 and 2. Once again, the difference in the acceleration of the volume flow above mentioned could be the reason for this.
4.2 Temperature measurements in the valve model
Two temperature sensor have been installed in close proximity to the phenomena of measurement 1 to determine the temperature load of the component. Both sensors are a type T sheath thermocouple with a diameter of 1 mm. These sensors have been mounted flush to the wall. The mounting positions of the sensors TD1 and TD2 is shown in Figure 5. Contrary to the first measurements, the upper component of the valve model consists instead of copper, of acrylic glass. Because of its low thermodynamic conductivity, this component was chosen for the integration of the thermocouple. As visible in Figure 5, this change of material has an impact on the spatial extent of the gas discharge in the area of the free jet. The light emitting area is greater and surrounds the whole free jet up to the gap. This reproducible appearance is caused by a stronger electrostatic charge in the valve model, which is provoked by the acrylic glass component. The blue colour of the free jet (right part of Figure 5) is a clear indication of a glow discharge of air. There is no significant difference in the operating conditions compared to the presented frames of Figure 3. At same operating conditions, metallic components like copper or steel will not reach the same local high electric charge. Metals have the ability to distribute charges over the whole surface. This prevents a high static charge and reduces discharge phenomena.
Figure 5: Intensive gas discharge provoked by a further acrylic glass component
545
GR
OU
P J
- 1
The 11th International Fluid Power Conference, 11. IFK, March 19-21, 2018, Aachen, Germany
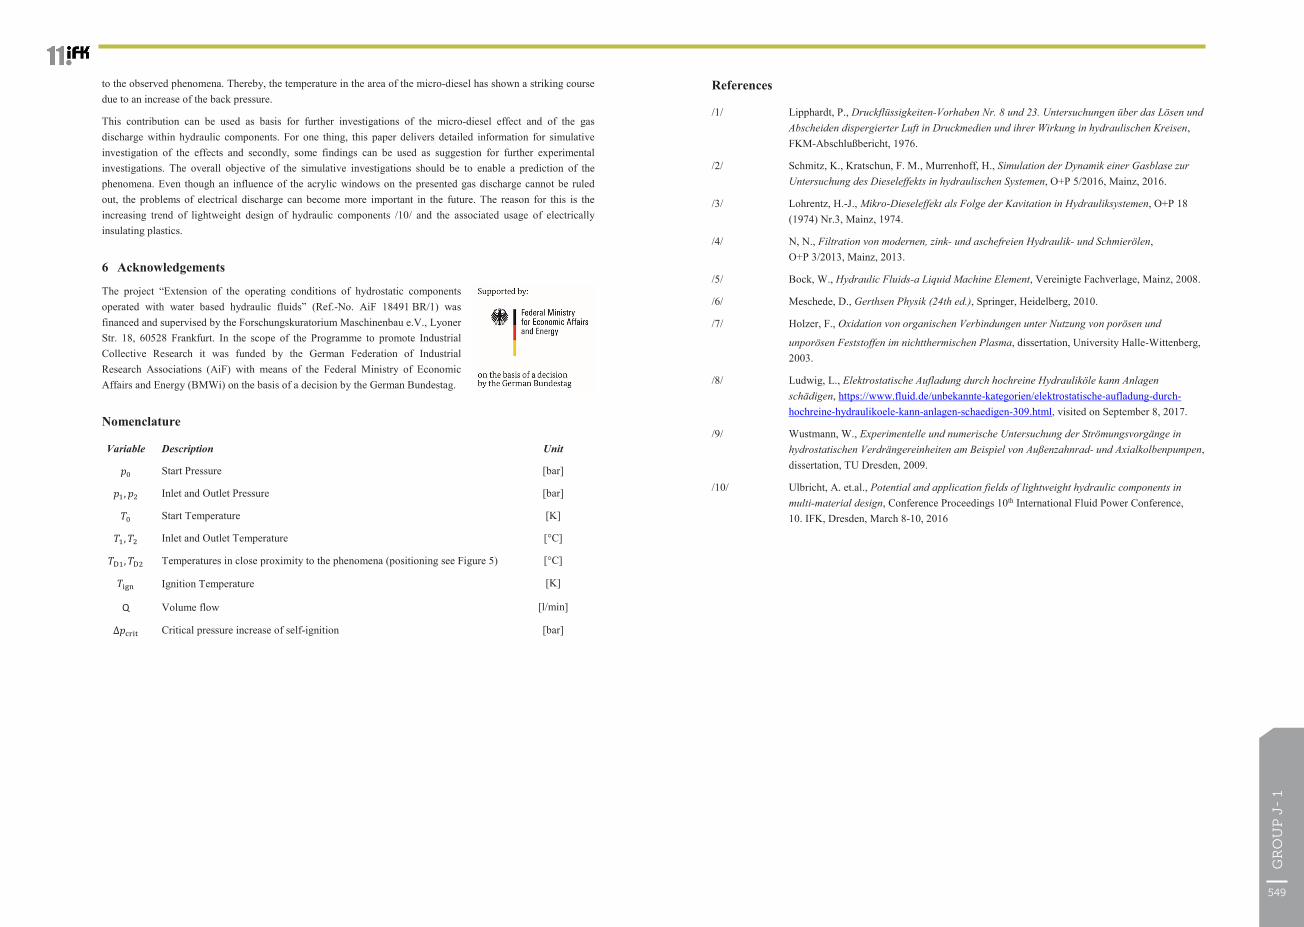
Figure 9: Single frame of gas discharge within the pump model
Because of the consistency of the lights, the high intensity and the relatively large size, the detected light-emitting phenomena are assigned to the glow discharge. This type of gas discharge is possible in areas of very low pressures, as introduced in chapter 2.2. Thus, the glow discharge delivers a field information about low pressure locations at the corresponding operating conditions. During the measurements no lights were detected, which points to the micro-diesel effect within the pump model.
Analogous to the procedure of the valve model, the operating conditions at first occurrence of the gas discharge have been analysed in the different areas of the pump model. As mentioned before, the volume flow was increased linearly during this measurement. The overview of this analysis is given in Table 2.
Effect / Measurement
Inlet pressure p1 [bar]
Outlet pressure p2 [bar]
Volume flow Q [l/min]
Temperature T1 [°C]
Temperature T2 [°C]
Gas discharge @ 1 83,2 1,3 29,5 26,4 27,7
Gas discharge @ 2 139,5 1,7 42,0 26,5 29,3
Gas discharge @ 3 154,8 1,7 47,0 27,2 32,0
Table 2: Operating conditions at the first events of gas discharge within the pump model
In comparison to the valve model, higher inlet pressures are necessary to provoke a gas discharge within the pump model. So far there are no further investigations to find the reason for this behavior. It is very probable, that the big deviation of the geometry has the greatest influence on it. Furthermore, the deviations in temperature, the history of the fluid (cavitation nuclei) and the lower acceleration of the volume flow can have an influence.
5 Summary and Conclusion
The present contribution deals with light-emitting phenomena in hydraulic components, which are closely linked to cavitation. The first one is the micro-diesel effect, which can be induced by a rapid compression of cavitation bubbles. The second investigated phenomenon was the gas discharge of air. Therefore, an electrostatic charge of the oil or of the component is necessary. Both light-emitting phenomena have been optically investigated within two plane models of hydraulic components. The first one was a model of a spool valve and the second one a model of the valve plate area of an axial piston pump.
An overview of the areas of occurrence and the minimum necessary operating conditions of the different phenomena is one result of this contribution. Some frames of the different phenomena are presented to show the form of appearance. Furthermore, the impact of electrically insulating materials on the appearance of gas discharge is shown. Another part of this contribution is the measurement of the temperatures in close proximity
The 11th International Fluid Power Conference, 11. IFK, March 19-21, 2018, Aachen, Germany
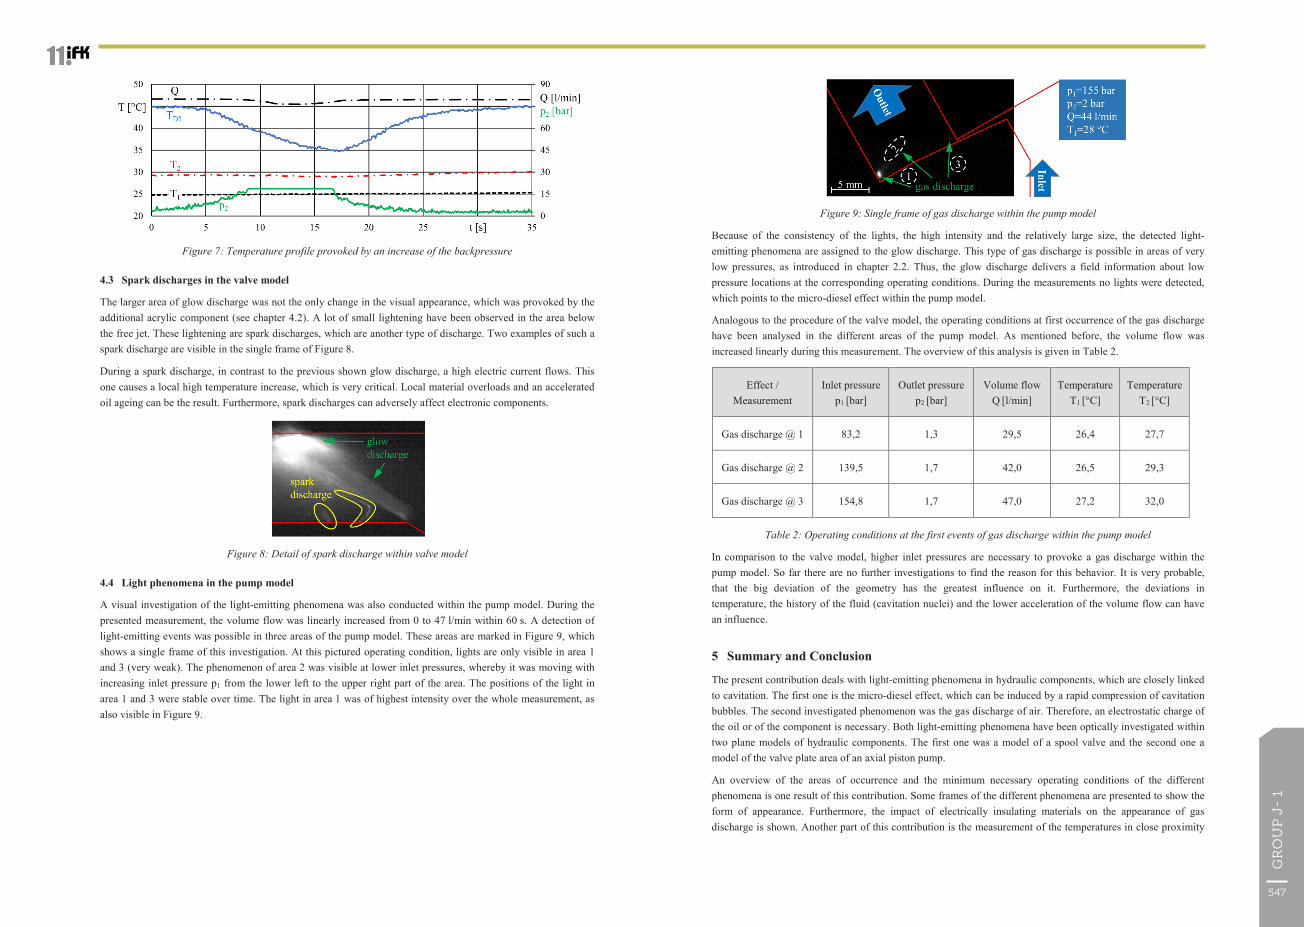
Figure 7: Temperature profile provoked by an increase of the backpressure
4.3 Spark discharges in the valve model
The larger area of glow discharge was not the only change in the visual appearance, which was provoked by the additional acrylic component (see chapter 4.2). A lot of small lightening have been observed in the area below the free jet. These lightening are spark discharges, which are another type of discharge. Two examples of such a spark discharge are visible in the single frame of Figure 8.
During a spark discharge, in contrast to the previous shown glow discharge, a high electric current flows. This one causes a local high temperature increase, which is very critical. Local material overloads and an accelerated oil ageing can be the result. Furthermore, spark discharges can adversely affect electronic components.
Figure 8: Detail of spark discharge within valve model
4.4 Light phenomena in the pump model
A visual investigation of the light-emitting phenomena was also conducted within the pump model. During the presented measurement, the volume flow was linearly increased from 0 to 47 l/min within 60 s. A detection of light-emitting events was possible in three areas of the pump model. These areas are marked in Figure 9, which shows a single frame of this investigation. At this pictured operating condition, lights are only visible in area 1 and 3 (very weak). The phenomenon of area 2 was visible at lower inlet pressures, whereby it was moving with increasing inlet pressure p1 from the lower left to the upper right part of the area. The positions of the light in area 1 and 3 were stable over time. The light in area 1 was of highest intensity over the whole measurement, as also visible in Figure 9.
547
GR
OU
P J
- 1
The 11th International Fluid Power Conference, 11. IFK, March 19-21, 2018, Aachen, Germany
References
/1/ Lipphardt, P., Druckflüssigkeiten-Vorhaben Nr. 8 und 23. Untersuchungen über das Lösen und Abscheiden dispergierter Luft in Druckmedien und ihrer Wirkung in hydraulischen Kreisen, FKM-Abschlußbericht, 1976.
/2/ Schmitz, K., Kratschun, F. M., Murrenhoff, H., Simulation der Dynamik einer Gasblase zur Untersuchung des Dieseleffekts in hydraulischen Systemen, O+P 5/2016, Mainz, 2016.
/3/ Lohrentz, H.-J., Mikro-Dieseleffekt als Folge der Kavitation in Hydrauliksystemen, O+P 18 (1974) Nr.3, Mainz, 1974.
/4/ N, N., Filtration von modernen, zink- und aschefreien Hydraulik- und Schmierölen, O+P 3/2013, Mainz, 2013.
/5/ Bock, W., Hydraulic Fluids-a Liquid Machine Element, Vereinigte Fachverlage, Mainz, 2008.
/6/ Meschede, D., Gerthsen Physik (24th ed.), Springer, Heidelberg, 2010.
/7/ Holzer, F., Oxidation von organischen Verbindungen unter Nutzung von porösen und
unporösen Feststoffen im nichtthermischen Plasma, dissertation, University Halle-Wittenberg, 2003.
/8/ Ludwig, L., Elektrostatische Aufladung durch hochreine Hydrauliköle kann Anlagen schädigen, https://www.fluid.de/unbekannte-kategorien/elektrostatische-aufladung-durch-hochreine-hydraulikoele-kann-anlagen-schaedigen-309.html, visited on September 8, 2017.
/9/ Wustmann, W., Experimentelle und numerische Untersuchung der Strömungsvorgänge in hydrostatischen Verdrängereinheiten am Beispiel von Außenzahnrad- und Axialkolbenpumpen, dissertation, TU Dresden, 2009.
/10/ Ulbricht, A. et.al., Potential and application fields of lightweight hydraulic components in multi-material design, Conference Proceedings 10th International Fluid Power Conference, 10. IFK, Dresden, March 8-10, 2016
The 11th International Fluid Power Conference, 11. IFK, March 19-21, 2018, Aachen, Germany
to the observed phenomena. Thereby, the temperature in the area of the micro-diesel has shown a striking course due to an increase of the back pressure.
This contribution can be used as basis for further investigations of the micro-diesel effect and of the gas discharge within hydraulic components. For one thing, this paper delivers detailed information for simulative investigation of the effects and secondly, some findings can be used as suggestion for further experimental investigations. The overall objective of the simulative investigations should be to enable a prediction of the phenomena. Even though an influence of the acrylic windows on the presented gas discharge cannot be ruled out, the problems of electrical discharge can become more important in the future. The reason for this is the increasing trend of lightweight design of hydraulic components /10/ and the associated usage of electrically insulating plastics.
6 Acknowledgements
The project “Extension of the operating conditions of hydrostatic components operated with water based hydraulic fluids” (Ref.-No. AiF 18491 BR/1) was financed and supervised by the Forschungskuratorium Maschinenbau e.V., Lyoner Str. 18, 60528 Frankfurt. In the scope of the Programme to promote Industrial Collective Research it was funded by the German Federation of Industrial Research Associations (AiF) with means of the Federal Ministry of Economic Affairs and Energy (BMWi) on the basis of a decision by the German Bundestag.
Nomenclature
Variable Description Unit
Start Pressure [bar]
, Inlet and Outlet Pressure [bar]
Start Temperature [K]
, Inlet and Outlet Temperature [°C]
, Temperatures in close proximity to the phenomena (positioning see Figure 5) [°C]
Ignition Temperature [K]
Q Volume flow [l/min]
∆ Critical pressure increase of self-ignition [bar]
549
GR
OU
P J
- 1