
Burlington Vital Signs 2013
28
As a prosperous community, issues are hard to see.
-
Upload
laura-pizzacalla -
Category
Documents
-
view
216 -
download
3
description
Â
Transcript of Burlington Vital Signs 2013
As a prosperous community, issues are hard to see.

Burlingtonians have much to take pride in. Nestled on the shore of Lake Ontario and surrounded by magnificent conservation lands and green spaces, Burlington is not only one of the most beautiful places to live, it is also a safe and welcoming community of relative affluence. But even as a prosperous community, critical issues and people in need are hard to see.

3
Burlington Community Foundation’s Vital signs® 2013Mental health issues, especially among our youth; obesity, poverty and healthy levels of physical
activity, are serious and growing issues that deeply affect our community. But because Burlington is
a prosperous community, the issues are not always easy to see. Vital Signs® is a community check-
up conducted by community foundations across Canada, coordinated nationally by Community
Foundations of Canada.
Vital Signs continues to build on partnerships with a broad range of community members and
organizations who have contributed to the development of this report. Burlington’s 2nd edition of
Vital Signs is an initiative of the Burlington Community Foundation.
Table of Contents
Message from the CEO ...................................4
Research ..............................................................5
Burlington: One of the Best Places
to Live in Canada ..............................................6
Work & Careers ................................................7
Environment ......................................................8
Housing ...............................................................9
Safety ................................................................10
Health & Wellness .........................................11
Seniors in Burlington .....................................12
Community Spirit...........................................14
Arts & Culture .................................................15
Income & Poverty in Burlington ................16
Portrait of Youth: Our Future ......................17
Mental Health – A Vital Issue
for Youth in Our Community ..................... 20
Message from the Chair ...............................24
Glossary ........................................................... 25
Bibliography .................................................... 26
Cover Illustration by Grant HiehmResearch by SAGE Research Corporation
Design by PLAY Advertising

4
Imagine what we could do together.
Welcome to the 2nd edition of Burlington’s Vital Signs – the Burlington
Community Foundation’s annual check-up that evaluates Burlington as a
place to live, work, and play by identifying trends that are critical to our
quality of life.
This report advocates that connections are critical to community vitality. We
are intrinsically connected to one another, and what we experience together
– both positive and negative – are also interwoven.
By exploring 11 key areas of community life, this report celebrates all that
we have to be proud of and shines a spotlight on the areas of greatest
need in our community. It also shows that our experiences do not exist in
isolation; they interweave and overlap and one issue often affects another.
One issue of tremendous importance for our community – and we know
does not stand in isolation – is mental health problems or illness. Mental
illness is indiscriminate. Regardless of affluence, when you take into account
family members, friends and neighbours, almost everyone is affected by
mental illness in some way.
My own personal memories of growing up with a father who suffered from
severe depression and anxiety are tinged with great sadness. Growing up I
had long stints of feeling a sense of isolation from many of the normal life
experiences that my friends seemed to be having. I only wish that my dad,
and my family, had the opportunity to receive the treatment and support
that we needed, and must make available to everyone affected by mental
illness. There is no place for blame or shame.
Vital Signs helps guide Burlington Community Foundation’s granting
program and helps us inform our donors and fundholders about issues
facing our community. Many organizations and individuals gave of their
time and expertise to make this report truly the work of many. Special
thanks to Paletta International, our Vital Signs Proud Supporter, and thanks
also to Sage Research Corporation and PLAY Advertising for their inspiring
dedication to this initiative.
I invite you to take a moment and read our 2013 Vital Signs Report. When
we understand the connections between our community issues, we can work
together to strengthen them. Imagine what we could do together, now and
for the future!
Colleen Mulholland
President and CEO
Burlington Community Foundation
message From the Ceo

5
researChThe statistics contained in this report were compiled by Sage Research
Corporation through a comprehensive review of a wide variety of research
studies. Information is included from local, regional, provincial and
national studies, and additional information was provided by our own local
community agencies and organizations. The sources reviewed and used can
be found in the Bibliography.
The report includes recently released data from Statistics Canada’s 2011
Census, and 2011 National Household Survey. However, not all of the data
for Burlington from these studies has been released yet, so in some cases
2006 Census data has been used.

6
ONTARIO BURLINGTON PETERBOROUGH KINGSTON MISSISSAUGA TORONTO
79% 86% 82% 80% 80%
53%
In 2013, MoneySense magazine ranked Burlington the top mid-sized city in which
to live in Canada.
Indeed, people in Burlington take great pride in their community, the “jewel on the
lake”. The unemployment rate in Burlington continues to be lower than Ontario
as a whole, with over three-quarters of all jobs in Burlington being full-time, the
highest share of full-time employment among the Halton municipalities.
Burlington: one oF the Best plaCes to liVe in Canada
“Mild weather, low unemployment, high incomes, low crime and a thriving arts community are just some of the
factors making this the best mid-sized city in Canada,”
– MoneySense magazine, March 20, 2013
Median household income levels are 24% higher in Burlington
than the provincial average but according to Statistics Canada,
almost 1 in 10 youth under 18 lived in a low-income household.
The face of our community
The majority commute to work by car, truck or van,
more so than elsewhere in Ontario:
Young people in Burlington are preforming well in school
compared to the Ontario average but there are some
opportunities for improving the lives and outcomes for our youth,
starting as early as kindergarten. Some issues we need to tackle
as a community are obesity, bullying and mental health.
Overall, the age profile of Burlington is getting older and more so
than the Ontario average – in 2011, there were 29,720 seniors
65 years of age or older living in Burlington, comprising 16.9% of
the population vs. 14.6% in Ontario.
In the last federal election, more turned out to vote in Burlington
(66.5%) than the Ontario average (61.5%)
In 2012, 36% of all items circulated by Burlington public libraries
were in the child or youth category. Attendance at children and
youth programs at Burlington libraries was 35,195.
% that get to work by car, truck or van

7
9%32%
35%
24%
Burlington
16%30%
30%24%
Ontario
17%
28%
32%23%
CanadaBurlington has an educated labour pool
Burlington residents are better educated than the population of Ontario and
Canada. 67% of Burlington adults 25 years of age and over have completed
some form of post-secondary education, compared with 60% of the
population of Ontario.
Among Burlingtonians 25–64 years of age, 95% have completed high
school – this is a big positive change in a 10 year period: in 2001, 79% had
completed high school.
Burlington is working!
In 2011, there were 143,510 people 15 years of age or older in Burlington.
Within this age range, 93,030 people were employed and 5,755 were
unemployed for a total labour force of 98,785.
Burlington has stronger employment statistics than Ontario as a whole. The
employment rate among people 15–64 years of age was 65%, compared to
60% for Ontario. Burlington’s unemployment rate was 6%, compared to 8%
for Ontario.
For the past 10 years, the rate of unemployment in Burlington has been
consistently lower than elsewhere in Ontario and in other communities
across Canada.
Work & Careers
Employment Rate
Unemployment Rate
65% 6%60% 8%
Burlington
No Certificate/Diploma
High School Diploma
College/Trade
University Degree
Ontario

8
Profile of current jobs & businesses in Burlington
Here are some quick facts about jobs and businesses in Burlington, according
to the Halton Region 2012 Employment Survey, released in June 2013:
• The City of Burlington has 4,638 businesses providing 74,216 full and
part-time jobs.
• While Burlington accounts for 35% of the 15–64 year olds living in
Halton Region, jobs in Burlington accounted for nearly 40% of Halton’s
total employment.
• Approximately 80% of jobs were in the service-based sector – the
leading ones being the retail trade, professional, scientific and technical
services, and health care and social assistance.
Income LeveLs In BurLIngtonBurlington has higher median household income
levels than the rest of Ontario, although it is not high in comparison to other parts of Halton Region.
enVironmentA city where people enjoy the outdoors
Burlington has 1,472 acres of city-owned parkland, and the city each year
takes care of 60,000 trees, plants 600 new trees, and maintains 796 acres of
grass. Most residents are within a 10-minute or less walk from green space.
And these close connections to green spaces are valued by residents: 92%
say being within walking distance of parks, trails and open green spaces
would be very or somewhat important to them when making a decision
about where to live.
Responsible waste management
Burlington, together with neighbouring communities, is a recognized leader
in responsible waste management. In 2012 Halton Region received several
awards for its waste management programs:
• Gold Ontario Waste Minimization Award from the Recycling Council of
Ontario: this award recognized Halton for achieving a 60% residential
waste diversion rate – for comparison, the Ontario average is 47%.
• Gold Digital Promotion & Education Award from the Municipal Waste
Association for the social media program, HaltonRecyles.
• Silver Landfill Management Award, from the Solid Waste Association of
North America.

9
19%GREAT
65%GOOD
16%POOR
Air quality good – but could be better
Burlington has good air quality, compared to downtown Hamilton. Hamilton has
more poor to moderate air quality days (22%) than does Burlington (16%).
However, Burlington’s location in southern Ontario – in Canada’s
manufacturing heartland and downwind from the industrial centre of the
U.S. – increases the number of poor to moderate air quality days relative
to more northern parts of Ontario and cities in other parts of Canada. For
example, in each of Sudbury and Ottawa only 8% of the days in 2012 had
poor to moderate air quality compared to 16% in Burlington.
housingBurlington Housing Prices Up 7%
The average price of a home in Burlington in the first half of 2013 was
$486,669 – up 7% from 2012.
Similar increases were seen in the neighbouring cities of Hamilton (+6%) and
Oakville (+7%), with Burlington housing costs continuing to be intermediate
between these two cities.
Burlington Air Quality Days in 2012
HaLton Has a Large and growIng sHortage of affordaBLe,
rent–geared–to–Income HousIng.

10
0.5% 0.4%
4.6%
3.2%
Rental housing can be tough to find
People looking to rent – particularly those with more modest incomes – can find
it difficult to find affordable rental housing in Burlington. In fall 2012, Burlington’s
rental vacancy rate was 1.3%. For reference, a vacancy rate of 3% is considered
necessary for adequate competition and supply. By comparison, Hamilton’s vacancy
rate was 4.2%, and in Ontario as a whole it was 2.5%.
In 2011, Halton had a higher percentage of households (4.6%) on waiting lists
for affordable, rent-geared-to-income housing than was the case for Ontario
as whole (3.2%). Further, the demand for this housing greatly exceeds the
supply, as only 0.5% of Halton households were living in affordable, rent-
geared-to-income housing in 2011.
In Halton, between 2010 and 2011 there was a 47% increase in households
waiting for rent-geared-to-income housing. Families with children are the
hardest hit.
We’re one of the safest in Canada
MoneySense magazine ranked Burlington as one of the safest cities among the
200 Canadian cities it analyzed in its feature, Canada’s Best Places to Live 2013.
saFety
Affordable, Rent-Geared-to-Income Housing
Halton
Ontario
MoneySense Magazine: Crime Severity Index for 200 Canadian Cities (Lower is Better)
CRIm
E SE
vERI
TY I
NDE
x 150
120
90
60
30
Burlington
Hamilton
Stratford
Windsor
Woodstock
11
2008 2009 2010 2011 2012
807570656055504540
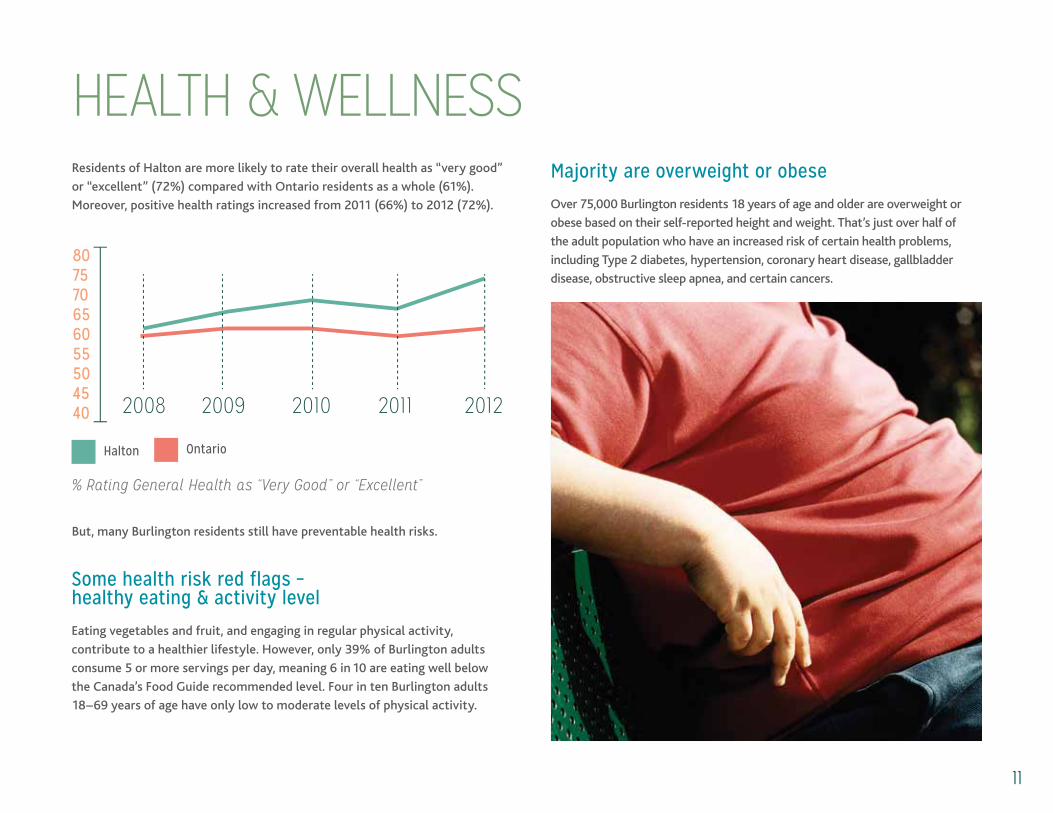
majority are overweight or obese
Over 75,000 Burlington residents 18 years of age and older are overweight or
obese based on their self-reported height and weight. That’s just over half of
the adult population who have an increased risk of certain health problems,
including Type 2 diabetes, hypertension, coronary heart disease, gallbladder
disease, obstructive sleep apnea, and certain cancers.
Some health risk red flags – healthy eating & activity level
Eating vegetables and fruit, and engaging in regular physical activity,
contribute to a healthier lifestyle. However, only 39% of Burlington adults
consume 5 or more servings per day, meaning 6 in 10 are eating well below
the Canada’s Food Guide recommended level. Four in ten Burlington adults
18–69 years of age have only low to moderate levels of physical activity.
Residents of Halton are more likely to rate their overall health as “very good”
or “excellent” (72%) compared with Ontario residents as a whole (61%).
Moreover, positive health ratings increased from 2011 (66%) to 2012 (72%).
health & Wellness
% Rating General Health as “Very Good” or “Excellent”
Halton Ontario
But, many Burlington residents still have preventable health risks.
12
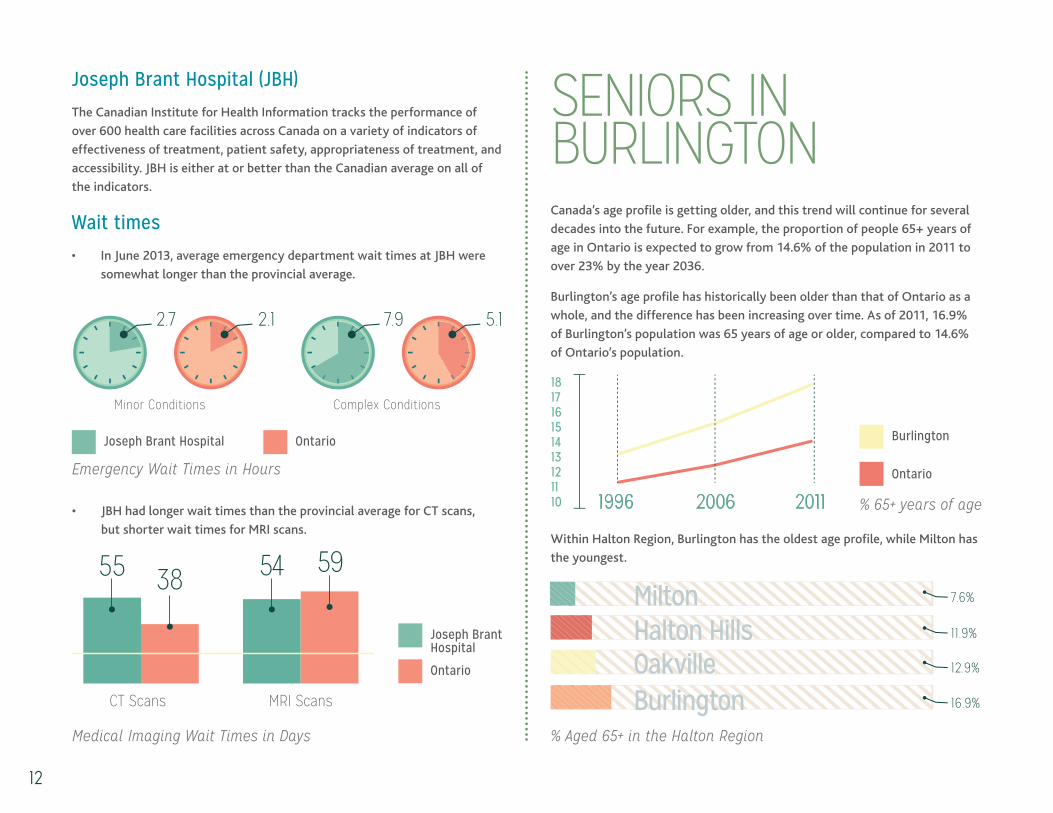
Wait times
• In June 2013, average emergency department wait times at JBH were
somewhat longer than the provincial average.
Joseph Brant Hospital (JBH)
The Canadian Institute for Health Information tracks the performance of
over 600 health care facilities across Canada on a variety of indicators of
effectiveness of treatment, patient safety, appropriateness of treatment, and
accessibility. JBH is either at or better than the Canadian average on all of
the indicators.
seniors in BurlingtonCanada’s age profile is getting older, and this trend will continue for several
decades into the future. For example, the proportion of people 65+ years of
age in Ontario is expected to grow from 14.6% of the population in 2011 to
over 23% by the year 2036.
Burlington’s age profile has historically been older than that of Ontario as a
whole, and the difference has been increasing over time. As of 2011, 16.9%
of Burlington’s population was 65 years of age or older, compared to 14.6%
of Ontario’s population.
2.7 2.1 7.9 5.1
Joseph Brant Hospital Ontario
% Aged 65+ in the Halton Region
55 38 54 59
Joseph Brant Hospital
Ontario
Medical Imaging Wait Times in Days
Emergency Wait Times in Hours
miltonHalton HillsOakvilleBurlington
• JBH had longer wait times than the provincial average for CT scans,
but shorter wait times for MRI scans.
181716151413121110 1996 2006 2011 % 65+ years of age
Burlington
Ontario
Within Halton Region, Burlington has the oldest age profile, while Milton has
the youngest.

13
Women comprise 57% of Burlington seniors overall, with this proportion being higher at the older age ranges: among Burlington residents 85+ years of
age, 2 out of 3 are women.
Housing Costs
In 2006, about 1,800 senior households in Burlington spent 30% or more of their
total household income before tax on mortgages, electricity, heat and municipal
services. Of these, almost 500 spent 50% or more of their income on housing,
which leaves very little money for food, medications, or other necessities.
In the Age-Friendly Communities Forum: A Seniors’ Perspective – an initiative
of the Elder Services Advisory Council In Halton Region – the Burlington
participants identified a need for affordable housing as one of the top 3
issues for seniors in Burlington, and noted that “some people are moving out
of the community as they cannot afford to live here.”
spendIng more tHan 30% of your Income on HousIng
costs can make LIfe dIffIcuLt.
% of Female Seniors with Low Income
Based on Statistics Canada measures of low-income from the 2006 census,
5.6% of Burlington seniors have low income after tax. However, the
prevalance of low income is particularly acute among female seniors in
Burlington: this prevalence is higher than the Ontario average, and higher
than other Halton region communities.

14
5%
3%
45% 50%
12% 65% 20%
-Size
Burlingtonians are in love with their city
In 2012, the City of Burlington conducted a survey of Burlington residents that
included comparisons to residents of another similar medium-size Ontario city.
Burlingtonians are generally happy with life in Burlington: 95% rated the
quality of life in Burlington as “excellent” or “good”. And this is a much
higher level of satisfaction than observed in the comparison city, particularly
at the “excellent” end of the scale.
Community spirit
Burlington residents tend to see the quality of life in the city as improving:
27% said the quality of life in Burlington has improved over the past two
years, compared to only 11% who said it has declined.
Survey respondents were asked which factors had the greatest impact on
quality of life in their city. What set Burlington residents apart particularly
was the importance of a low crime rate, and a strong sense of community.
Excellent Good Fair
Burlington
Poor
medium-Size City
Quality of Life
Greatest Impact on Quality of Life
20%
11%5%6%
voLunteerIng rates are HIgHIn Halton Region, almost 6 in 10 (59%) people age 15 and over volunteer their time through an agency, a group or an organization. This exceeds the Ontario
(48%) and national (47%) averages.

15
arts & CultureCultural experiences important to life in Burlington
In a survey of Burlington residents, 76% said culture is “essential” or “highly
important” in their daily lives. There are many types of cultural experiences.
For Burlington residents, the top 6 are festivals (86%), museum & local
history (81%), art galleries (78%), going to the theatre (75%), public art
(69%) and family heritage & traditions (69%).
Benefits to Burlington from community cultural organizations include:
• 624,000+ visits to local festivals, events, productions and exhibitions
• 89,000+ hours of cultural programming offered to all ages
Burlington residents spend 37% of their cultural time in Burlington, and the
remaining time in other cities such as Toronto and Hamilton.
Burlington’s Public Libraries
Public libraries are an important community asset, and this is underlined by
the fact that library use in Canada has increased 45% over the past decade.
Burlington has 6 public libraries.
The Ontario Ministry of Tourism, Culture and Sport provides comparisons
of library usage across all Ontario cities in Burlington’s size range. Some key
facts about Burlington residents:
• We visit libraries more often
• We are more likely to use online library services
• We are about average in active library card holders

16
$10.25$18.69 $19.45$17.05
inCome & poVerty in BurlingtonBurlington is a prosperous and affluent community where its individual,
household and family median income is higher than Ontario. However, some
families are struggling to make ends meet.
Lone-parent families struggle
In general, lone-parent families are much more at risk of being low income.
Statistics Canada data (2008) shows that while 6.7% of all non-elderly
families are low income in Canada, 18% of lone-parent families are
low income.
Burlington has a lower proportion of lone-parent families (14.3% of families)
than does Ontario as a whole (16.3%). However, the proportion of lone-
parent families has grown faster over the 10 years in Burlington (up +19.2%)
than in Ontario as a whole (+9.9%).
What is a living wage in this area?
Ontario has a legally mandated minimum wage of $10.25 an hour. However,
a person working full-time at the minimum wage rate will be living in
poverty, as they will earn less than Statistics Canada’s Low Income Cut-off.
The concept of a “living wage” is motivated by the following question: What
does a family working full-time (37.5 hours a week, year-round) need to earn
in order to pay for the necessities of life, to enjoy a decent quality of life, and
to be able to participate fully in the economic, political, social and cultural
life of the community?
The answer to this question depends on family composition and on where
you live. Community Development Halton has tackled this question for the
Halton Region, including Burlington.
famILy of 4RequiRed annual
household employment income:
$66,498
Lone-parentRequiRed annual
household employment income:
$36,439
sIngLe IndIvIduaLRequiRed annual
household employment income:
$37,930
Living Wage in Halton (assuming full-time, year-round employment)
What is included in a living wage, and what is excluded? “A living wage isn’t
extravagant. It doesn’t allow families to save for retirement, to save for
their children’s education or to service their debt. But it does reflect the cost
of affording the basics of life – something the minimum wage doesn’t do,”
states the Canadian Centre for Policy Alternatives.
Community Development Halton considered three types of Halton
households: a family of 4 (two parents, two children – a boy age 10, and a
girl age 14), a single-parent family (mother age 30 and a boy age 3), and a
single person (male age 32). In each household, each adult is working full-
time, year-round. The calculation of living wage reflects the typical costs in
Halton, as well as taxes and benefits.
17
portrait oF youth: our Future The number of youth in Burlington has increased since 2006, but at a slower
rate than older age groups. As a result, the overall age profile of Burlington is
getting older.
Youth more likely to be affected by low income
Burlington is an affluent community, but not everyone is well off. In the
2006 census, 7% of all residents lived in low income households. However,
this was greater for youth under 18, where 9% – almost one in 10 youth –
lived in a low income household.
Kids — readiness to learn in Burlington
Our Kids Network in Halton has provided an extensive analysis of
developmental readiness data collected on Halton and Ontario children in
senior kindergarten: “Developmental readiness refers to the child’s ability to
meet the task demands of school and benefit from the educational activities
provided. The current concept of developmental readiness encompasses
much more than academic skills; children’s physical, social, emotional, oral
communication and cognitive skills contribute towards success in school.”
The Early Development Instrument (EDI) measures developmental readiness
in kindergarteners on these various dimensions, and can be used to identify
children who are developmentally vulnerable.
AGE % GROWTH IN BURLINGTON SINCE 2006
0 – 24 +3.5%25 – 64 +5.9%65+ +17.2%
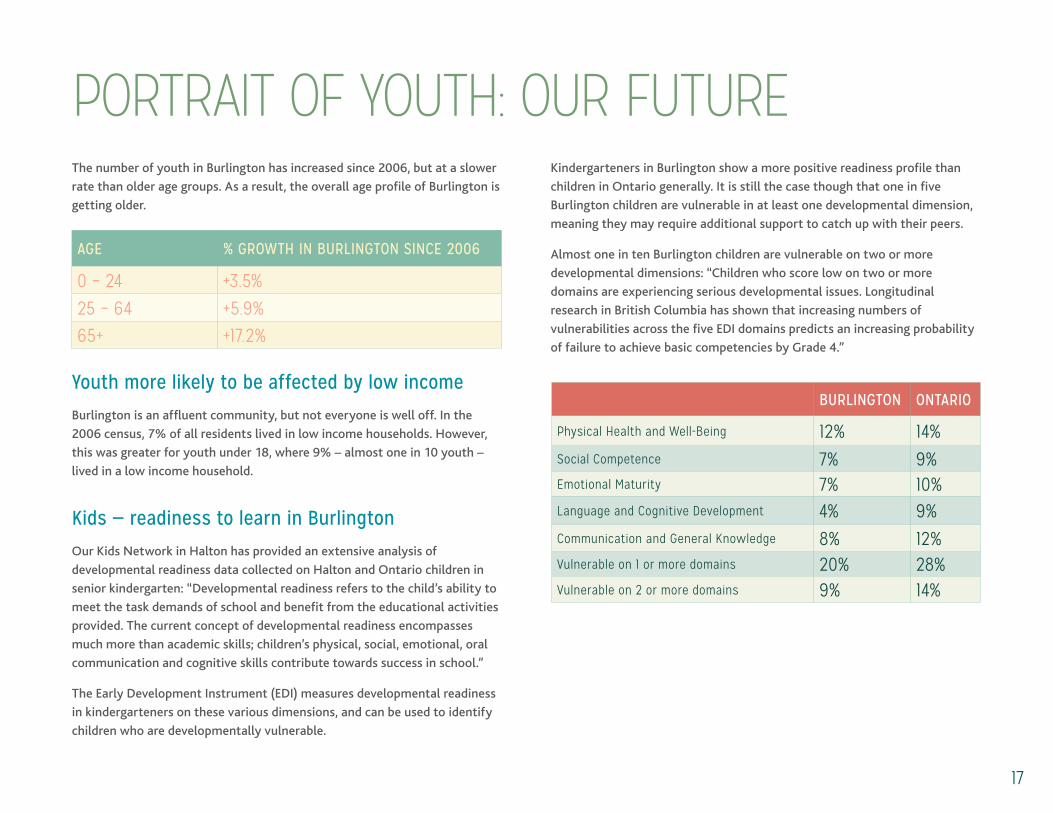
Kindergarteners in Burlington show a more positive readiness profile than
children in Ontario generally. It is still the case though that one in five
Burlington children are vulnerable in at least one developmental dimension,
meaning they may require additional support to catch up with their peers.
Almost one in ten Burlington children are vulnerable on two or more
developmental dimensions: “Children who score low on two or more
domains are experiencing serious developmental issues. Longitudinal
research in British Columbia has shown that increasing numbers of
vulnerabilities across the five EDI domains predicts an increasing probability
of failure to achieve basic competencies by Grade 4.”
BURLINGTON ONTARIO
physical health and Well-Being 12% 14%social competence 7% 9%emotional maturity 7% 10%language and cognitive development 4% 9%communication and General Knowledge 8% 12%Vulnerable on 1 or more domains 20% 28%Vulnerable on 2 or more domains 9% 14%

18
59%73%
39%71%
School age youth
Our Kids Network conducts the ongoing Halton Youth Survey to track over
time the well-being of youth in Grades 7 and 10 in Burlington as well as other
Halton communities. The latest survey in 2012–2013 identifies challenges and
opportunities for improving the lives and outcomes for our youth.
Bullying: While there has been some improvement over time in reports of
being bullied in school, it remains a serious issue. 30% of Burlington Grade
7s reported being bullied at school in the current school year, and bullying
is still prevalent among Grade 10s (26%). The level of reported bullying in
Grade 7 is similar to the Ontario provincial average at 30%.
The Conference Board of Canada City Magnets report on Canada’s 50 largest cities ranked Burlington #1 on the number
of elementary and secondary school teachers per 1,000 school–age children.
Healthy level of physical activity
According to the Canadian Society for Exercise Physiology, youth 12–17 years
of age require at least 60-minutes of moderate to vigorous intensity activity
per day.
In the Halton Youth Survey, two–thirds of Burlington Grade 7s claimed to
meet the 60-minute-per-day guideline, but only just over half of Grade 10s
claimed to meet the guideline.
Girls in the Halton region were much less likely than boys to report meeting
the physical activity guideline, with only four in ten Grade 10 girls meeting
the guideline.
Healthy body weight
According to Statistics Canada, in 2010 18% of 12–17 year old Canadians
were either overweight or obese based on their self-reported height and
weight, with the level being higher among boys (21%) than girls (14%).
The Halton Youth Survey found similar results for Burlington and for Halton
as a whole, with about one in five Grade 7 and 10 students being overweight
or obese (based on self-reported height and weight).
In both grades, boys were much more likely to be overweight or obese than
were girls.
Girls Boys
% of Halton Students Who Self-report They Meet The Physical Activity Guideline
Perceived Safety of Schools Among Halton Residents
very Safe Fairly Safe Unsafe

19
5%
21%14%
26%
14%26%
11%28%
In the qualitative research project, Halton Youth Voice Road Show (2011),
Grade 10 students suggested the following reasons why obesity is a problem
for youth:
• Fast food, processed food, and unhealthy cafeteria food
• Youth just choose not to eat healthy foods
• Youth could not afford to buy healthy foods
• After-school activities, such as soccer or dance class are expensive,
making it difficult for many youth to participate
• Youth are less active because they’re busy, don’t feel like it, or decide to
stop being active
• Parents don’t watch what their children eat and give lunch money
instead of making lunches
Smoking, substance use & binge drinking
All have shown some declines since 2009–10 according to the Halton Youth
Survey. Nonetheless, there continue to be reasons for concern:
• Among Burlington Grade 7s, the most common form of substance
abuse is illegal use of pain relief pills, with 7% reporting such usage in
the past 12 months – almost as high as the Grade 10 level of 9%.
• Among Burlington Grade 10s, one in five used cannabis in the past year,
and one in three had an episode of heavy drinking in the past year.
Crime
The Halton Youth Survey, conducted by the Halton Our Kids Network,
developed an indicator of involvement in criminal activity based on four self-
report questions asking about vandalism, carrying a weapon, selling drugs,
and group or gang involvement, and these define what is meant here by
“criminal activity”. Note that because this is based on self-report, it includes
not only youth accused of crime but also youth who “got away with it”.
Girls Boys% of Halton Students Who Have Been Involved in Some Type of Criminal Activity
Girls Boys
% of Halton Students Classified As Overweight or Obese

20
15.4%27.5%
14.2%
15.2%
20.0%28.4%
25.7%
9-12 YRS
13-19 YRS
20-29 YRS
30-39 YRS
40-49 YRS
50-59 YRS
60-69 YRS
One in five people in Ontario experiences a mental health problem or
illness. Because mental illness can affect people in all walks of life, this is as
important an issue in comparatively affluent communities like Burlington as
it is in other less affluent communities. When you take into account family
members and friends, almost everyone is affected in some way.
The childhood, teen and young adult years are a critical period for the onset of
mental health problems. The number experiencing mental illness peaks at over
one in four young people during the teen years and among people in their 20s.
mental health – a Vital issueMental illness affects people at all life-stages. However, one of the most
significant characteristics of the onset of mental health problems is that,
unlike many other illnesses, they are more likely to first emerge and affect
people early in their lives.
According to a Mental Health Commission of Canada report, the potential
negative effects of mental illness on the lives and prospects of young
people are considerable:
“Mental disorders are the most common medical conditions causing
disability in young people. Most mental disorders begin before age twenty-
five and tend to be chronic, with substantial negative short and long-term
outcomes. They are associated with poor academic and occupational success,
economic burden, personal, interpersonal and family difficulties, increased
risk for many physical illnesses and shorter life expectancy.”
Early detection and treatment of mental health problems is vital for the
young people in our community and for the future health of our city.Estimated Annual % of People Experiencing a Mental Illness by Age in Canada
“Recent research in areas like diagnostic imaging and immunology point increasingly to the biological nature of mental health disorders. In other words, mental health disorders are truly health disorders similar to diabetes,
arthritis, heart disease, etc.”
– Dr. Alan Brown, Chief of Psychiatry, Joseph Brant Hospital

21
Access to youth mental health services is not what it needs to be
• Only one-third of those who need mental health services in Canada
actually receive them.
• 71% of family physicians ranked access to psychiatrists in Ontario as
fair to poor.
• While mental illnesses constitute more than 15% of the burden of disease
in Canada, these illnesses receive only 5.5% of health care dollars.
ROCK reports that due to mental health funding gaps, as of March 2013, youth
and families were waiting for just over 1,000 various services they offer. Wait
times for these services range from months up to 2 years.
Suicide – a critical issue
Suicide is the second leading cause of death among young people in Canada.
One of the most important causes of youth suicide is mental illness – most
often depression, bipolar disorder, schizophrenia, and substance abuse.
The effects of youth suicide go beyond the deceased, impacting those who
survive their death – their parents, friends, peers, and communities.
A survey conducted by the Centre for Addiction and Mental Health found
that in response to the question, “In the last 12 months, did you ever
seriously consider attempting suicide?”, 7% of Ontario Grade 7s and 12% of
Grade 12s answered “yes.”
The Halton Youth Survey asked a somewhat different version of the
question, focusing on teens who “sometimes, often or always” had thoughts
of suicide in the past 12 months. While the question is somewhat different
the results are similar: one in twenty (5%) Grade 7s in Burlington had
thoughts about suicide in the past 12 months, increasing to over one in ten
(13%) by Grade 10.
Every $1 spent on mental health issues and addictions saves $7 in health costs and $30 in lost
productivity and social costs.

22
6%
15%
4%3%
Depression
Depression is a mood disorder characterized by intense negative emotions
and feelings, that negatively impact on people’s lives leading to social,
educational, personal and family difficulties.
The Halton Youth Survey created an indicator of being at risk for depression,
based on a person saying they “always” or “often” had experienced the
following four emotional states in the past week: feeling sad, lonely,
depressed, or like crying.
The percentage of Burlington students at risk for depression increases
from Grade 7 to Grade 10, and by Grade 10, one in 10 teens are at risk for
depression.
This increase in risk for depression from Grade 7 to Grade 10 is occurring
primarily among girls. By Grade 10, one in seven girls is at risk for depression.
In the qualitative research project, Halton Youth Voice Road Show (2011),
participants suggested the following causes for depression in youth:
• Being bullied, which was seen to lead not only to depression but
also suicide
• Different social groups within a school bullying one another
• The fact that sometimes youth were just mean to each other
• Technology, since youth don’t actually need to connect to each other
on a personal level any more
• Images and expectations portrayed in the media
• The pursuit of material possessions, with participants saying that it would
be better if youth just spent time hanging out instead of shopping
• Stress
• Not having friends
• Being pressured to do drugs
Eating disorders – third most common chronic illness among adolescents
Eating disorders, such as anorexia nervosa
and bulimia nervosa are the third most
common chronic illness among adolescents.
Eating disorders affect adolescents from all
ethnicities, social classes and geographic
locations. Up to 15 percent of people with
serious eating disorders die.
Danielle’s Place, located in Burlington, offers
support programs and services to people
affected by an eating disorder. They have
seen a dramatic increase in the percentage of clients under the age of 25,
from 41% in 2012 to 56% in 2013. The number of clients under the age of 16
has doubled from 8% in 2012 to 16% in 2013.
While eating disorders are found among both girls and boys, they are more
common among girls. A study found that unhealthy eating attitudes and
behaviours were present in over 27% of Ontario girls aged 12–18 years, and
these girls are at increased risk for the development of clinical eating disorders.
Girls
Boys
% of Halton Students at Risk of Depression
23
Youth mental health trends at Joseph Brant Hospital (JBH)
Trips to the hospital emergency department because of a mental health
issue represent the tip of the iceberg for youth mental health and substance
abuse issues in Burlington. Emergency department visits can occur when
mental health or substance abuse issues are undiagnosed, or are untreated,
or treatment is not working. Youth visits to the JBH emergency department
because of mental health or substance abuse problems show:
• Emergency department visits for mental health or substance abuse
issues spikes upwards for youth 18–24 years of age.
• The annual number of youth under 25 years of age going to JBH
emergency because of mental health or substance abuse issues has
increased 30% over the last 3 years.
• The rate of increase has been even higher among the subset of youth
under 18 years of age – showing an increase in emergency visits of 43%
over the past 3 years.
JBH operates the Child and Adolescent Psychiatry Consultation Clinic, which
provides support to children/youth under the age of 18 years. The case load
for the Clinic increased by 16% from 2010–11 to 2011–12, and the average
wait time for assessment increased by 31%, to 47 days.
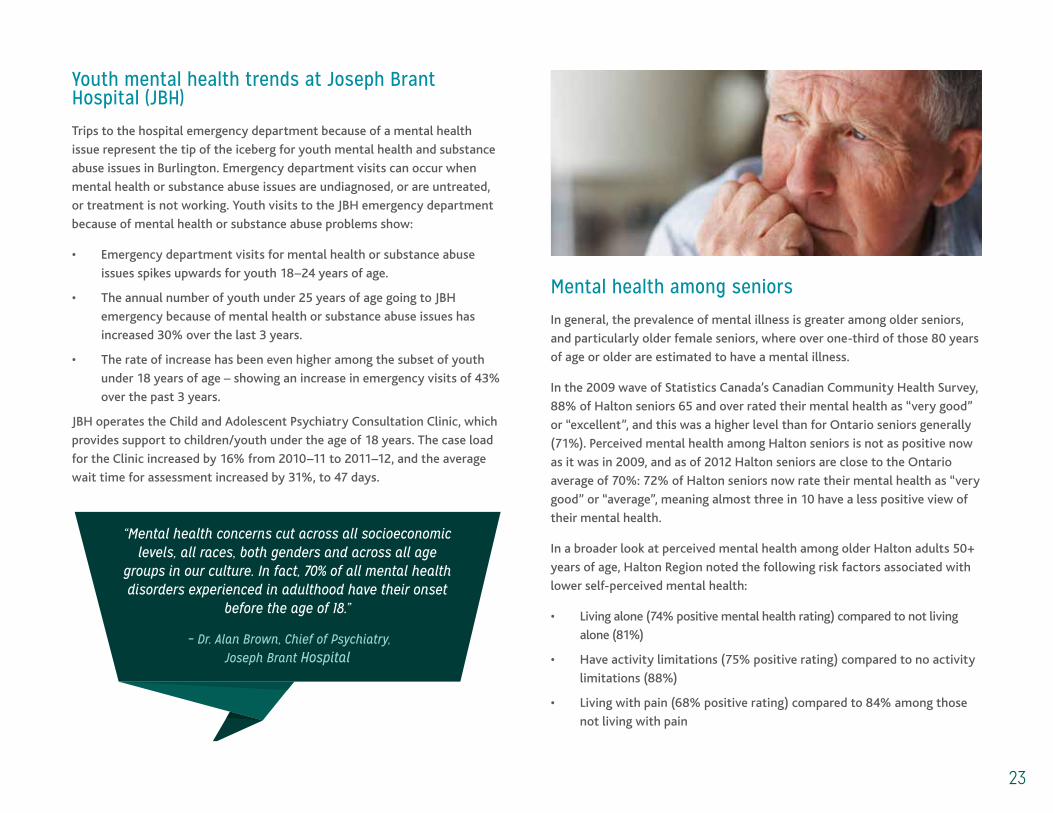
mental health among seniors
In general, the prevalence of mental illness is greater among older seniors,
and particularly older female seniors, where over one-third of those 80 years
of age or older are estimated to have a mental illness.
In the 2009 wave of Statistics Canada’s Canadian Community Health Survey,
88% of Halton seniors 65 and over rated their mental health as “very good”
or “excellent”, and this was a higher level than for Ontario seniors generally
(71%). Perceived mental health among Halton seniors is not as positive now
as it was in 2009, and as of 2012 Halton seniors are close to the Ontario
average of 70%: 72% of Halton seniors now rate their mental health as “very
good” or “average”, meaning almost three in 10 have a less positive view of
their mental health.
In a broader look at perceived mental health among older Halton adults 50+
years of age, Halton Region noted the following risk factors associated with
lower self-perceived mental health:
• Living alone (74% positive mental health rating) compared to not living
alone (81%)
• Have activity limitations (75% positive rating) compared to no activity
limitations (88%)
• Living with pain (68% positive rating) compared to 84% among those
not living with pain
“Mental health concerns cut across all socioeconomic levels, all races, both genders and across all age
groups in our culture. In fact, 70% of all mental health disorders experienced in adulthood have their onset
before the age of 18.”
– Dr. Alan Brown, Chief of Psychiatry, Joseph Brant Hospital

24
On behalf of the Burlington Community Foundation staff and Board of
Directors, we hope that our 2nd edition of Burlington’s Vital Signs provides
you with an even deeper and more thoughtful understanding of the
connections between the issues and opportunities facing our community.
When we developed our first edition of Burlington’s Vital Signs in 2012, we
hoped that it would help to inform productive conversations and encourage
action on the key issues influencing our great city. Now, with the launch of
our 2013 Vital Signs Report, we are pleased that conversations have begun
and we will proactively work together with our partners and community
leaders to inspire greater action in the year ahead.
message From the Chair
Tim Dobbie
Chair, Board of Directors
Burlington Community Foundation

25
glossaryaIr QuaLIty IndeX: The Air Quality Index is an indicator of air quality,
based on air pollutants that have adverse effects on human health and the
environment. The pollutants are ozone, fine particulate matter, nitrogen
dioxide, carbon monoxide, sulphur dioxide and total reduced sulphur
compounds.
crIme severIty IndeX: This is an index created by MoneySense that takes
into account the following crime indicators: violent crime rates, total crime
rates per 100,000 people, the five-year change in the crime rate and crime
severity rates for 2010. A lower value is better.
empLoyment rate: This is the percentage of working-age people who have
jobs. It is the ratio of the total employed population over the total number of
working-age people.
Low Income measures: References to low income in this report are based on
Statistics Canada’s Low Income Measures (LIM). The LIM is a fixed percentage
(50%) of median adjusted economic family income, where “adjusted”
indicates that family size and composition are taken into account.
medIan: This is the number which divides data into two equal groups, half
having a value above that number, and half having a value below
that number.
rent-geared-to-Income HousIng: Rent-geared-to-income (RGI) housing
is rental housing in which the rent paid is determined by the household’s
income, normally about 30% of the gross monthly household income.
Adjustments to RGI are made depending on what utilities are included or not
included in the rent. If the household’s income consists of social assistance,
rent is charged at a set amount, according to the kind of benefits received
and the number of people covered by social benefits. This amount is based
on the rent scale set by the Ontario government instead of a
30% calculation.
senIors: For most purposes in this report, seniors are defined as people
65 years of age or older.
unempLoyment rate: The percentage of the total labour force that is
unemployed but actively seeking employment and willing to work.
youtH: The age range referred to by “youth” varies with the topic. In this
report, the focus was primarily on people 5 to 24 years of age.
26
BiBliographyAir Quality Ontario website, www.airqualityontario.com
Burlington Economic Development Corporation, Securing Our Prosperity: Employment Lands Operational Plan, September 14, 2012
Canada Mortgage and Housing Corporation:
• Rental Market Report Hamilton and Brantford CMAs Fall 2012
• Rental Market Report Ontario Highlights Fall 2012
• Seniors Housing Report – Ontario, 2012
Canadian Centre for Policy Alternatives, A Living Wage for Toronto, Ottawa, Ontario, 2008
Canadian Society for Exercise Physiology, Canadian Physical Activity Guidelines and Canadian Sedentary Behaviour Guidelines, 2011
Canadian Urban Libraries Council:
• An Analysis of Public Library Trends, Lumos Research, Inc. 2011
• 2011 Canadian Public Library Statistics
Centre for Addiction and Mental Health (www.camh.ca):
• The mental health and well-being of Ontario students, 1991–2011: Detailed OSDUHS findings, Paglia–Boak, A., Adiaf, E.M., Hamilton, H.A., Beitchman, J.H., Wolfe, D., & Mann, R.E., 2012, CAMH Research Document Series No. 34
• Drug and Alcohol Treatment Information System (DATIS), custom tables provided Aug. 1, 2013
City of Burlington (www.burlington.ca/):
• 2013 Community Report, www.burlington.ca/communityreport
• City of Burlington Cultural Action Plan: Directions Forward Report, Prepared by Cobalt Connects, 2013
• Focus Ontario Fall 2012, Environics Research Group
Community Development Halton (www.cdhalton.ca/)
• Calculating a Living Wage for Halton: A discussion paper, March 2013
• Community Lens: Volunteering in Halton, Bulletin #80, September 2012
• Community Lens, Bulletin #82: Low Income Families in 2009, November 2012
Disordered eating attitudes and behaviours in teenaged girls: a school-based study, Jones, J.M., Bennett, S., Olmsted, M.P., Lawson, M.L., Rodin, G., Canadian Medical Association Journal, September 4, 2001 vol. 165 no. 5 547–552
Disordered Eating behaviours, Jones, J.M., Olmsted, M.P., Rodin, G., Canadian Medical Association Journal, May 28, 2002 vol. 166 no. 11
Eating Disorders Program website, The Hospital for Sick Children, Toronto
Elections Canada, Official Voting Results: Forty-first General Election 2011
Halton Our Kids Network (www.ourkidsnetwork.ca/)
• Early Development Instrument Halton Community Profile: 2003, 2006, 2009 and 2012 Results
• Halton Youth Survey: Community Profile 2012–13
• Report Card 2011: A Vision for Children in Halton
Halton Region (www.halton.ca):
• 2012 Employment Survey, released June 2013
• Age-Friendly Communities Forum: A Seniors’ Perspective, 2010, Elder Services Advisory Committee
• Halton Region – 2012 State of Housing Report
• Halton Region Presented with Gold Waste Minimization Award from the Recycling Council of Ontario, Halton Region website
• Halton Youth Voice Roadshow: Findings from seven information sessions held with Halton youth, March 2011
• Select Indicators of Health & Wellbeing in Older Adults: Halton 2007–2011
27
• The Quality of Life for Seniors in Halton – Update #2: Income and Housing, October 2009
• Wasteless News, Fall 2012
Halton Region Health Department (https://www.halton.ca/living_in_halton/public_health/):
• Body Mass Index (BMI), November 2012
• Consumption of Fruits & Vegetables, November 2012
• Physical Activity – International Physical Activity Questionnaire (IPAQ), Halton November 2012
• Urban Development – Walking Distances, 2013
Halton Regional Police Service (www.haltonpolice.ca/):
• Burlington Crime Statistics (2009–2011)
• Halton Regional Police Service 2012 Community Survey – Summary of Results
Health Canada, Canada’s Food Guide, http://www.hc – sc.gc.ca/fn – an/food- guide-aliment/index-eng.php
Human Resources & Skills Development Canada, Canadians in Context – Aging Population, http://www4.hrsdc.gc.ca/[email protected]?iid=33
Joseph Brant Hospital (www.jbmh.com/):
• Momentum, Spring 2013
• Statistics provided to Burlington Community Foundation on mental health visits to the Emergency Department, and statistics on referrals to the Child and Adolescent Psychiatry Consultation Clinic, July 2013
• Strategic Plan 2011 and Beyond
MoneySense, Canada’s Best Places to Live 2013¸ http://www.moneysense.ca/2013/03/20/canadas-best-places-to-live-2013/
Ontario Ministry of Health and Long-term Care, Ontario Wait Times, http://waittimes.hco-on.ca/en/
Ontario Ministry of Tourism, Culture and Sport, Public Libraries section of their website, http://www.mtc.gov.on.ca/en/libraries/statistics_2010.shtml
Ontario Non-Profit Housing Association, Waiting Lists Survey 2012, August 2012
Mental Health Commission of Canada (www.mentalhealthcommission.ca/):
• Changing directions, changing lives: The mental health strategy for Canada, 2012
• Evergreen: A child and youth mental health framework for Canada, Kutcher, S. and McLuckie, A. for the Child and Youth Advisory Committee, 2010
• Making the Case for Investing in Mental Health, 2012
REALTORS Association of Hamilton Burlington, Market Reports section of their website, http://www.rahb.ca/category/press-release/market-reports/
Reach Out Centre for Kids (ROCK), Invest in Mental Health, March 2013
Statistics Canada:
• Canadian Community Health Survey, CANSIM Tables 105–0501, 105–0502
• Canadian Vital Statistics Death Database. Suicide rates: An overview, by Tanya Navaneelan Statistics Canada Catalogue no. 82-624-X
• Census: 2011, 2006, 2001
• Census: Community Profiles
• National Household Survey Focus on Geography Series 2011
• National Household Survey, NHS Profiles
• Police-reported crime statistics in Canada, 2011, Shannon Brennan, Juristat article, Statistics Canada catalogue no. 85-002-X, released July 24, 2012
• Statistics Canada catalogue no. 97-563-XCB2006037
Teen Mental Health website, http://teenmentalhealth.org/for-families-and-teens/suicide/
The Oakville, Milton and District Real Estate Board, Market Watch section of their website, http://omdreb.on.ca/market_watch/
The Offord Centre for Child Studies, School Readiness to Learn Ontario SK Cycle 2 Results, McMaster University
3380 South Service Road, Unit 107 Burlington, ON L7N 3J5 905 639 0744
[email protected] burlingtonfoundation.org
Follow @BurlingtonFDN on Twitter Keep connected on Facebook
A special thanks to our Vital Signs Proud Supporter
Burlington Community Foundation: Strengthening Burlington with Gifts that Give Forever
Established in 1999 as a centre for philanthropy, Burlington Community
Foundation is a local knowledge broker and one of the most reliable partners
in the non-profit sector. We collaborate with donors to build endowments,
give grants and connect leadership. Responsive to our donors, our grantmaking
experts help people give, build legacies, address vital community needs and
support areas of personal interest.
The Foundation helps people, agencies and corporations improve our city’s
vitality – today and tomorrow. Our grantmaking supports donor wishes and
addresses the highest priority needs in our community. Each grant truly makes
a difference to a person--a neighbour, a child, a senior.
Together, we are strengthening Burlington with gifts that give forever. Visit
burlingtonfoundation.org, follow @BurlingtonFDN or connect on Facebook to
discover the many ways you can get involved.