
BUREAU OF FISHERIES AND AQUATIC …Final)(4).pdf · Canned Fish (sardines, mackerel ,salmon,etc 3...
36
Department of Agriculture BUREAU OF FISHERIES AND AQUATIC RESOURCES PCA Compound, Elliptical Road, Diliman, Q. C. Tel Nos. 929-9597 Fax Nos. 929-8074 Website: www.bfar.da.gov.ph E-mail: [email protected] Department of Agriculture BUREAU OF FISHERIES AND AQUATIC RESOURCES
Transcript of BUREAU OF FISHERIES AND AQUATIC …Final)(4).pdf · Canned Fish (sardines, mackerel ,salmon,etc 3...

Department of Agriculture
BUREAU OF FISHERIES AND AQUATIC RESOURCES
PCA Compound, Elliptical Road, Diliman, Q. C.
Tel Nos. 929-9597
Fax Nos. 929-8074
Website: www.bfar.da.gov.ph
E-mail: [email protected]
Department of Agriculture BUREAU OF FISHERIES AND AQUATIC RESOURCES

70
Department of Agriculture
BUREAU OF FISHERIES AND AQUATIC RESOURCES
PCA Compound, Elliptical Road, Diliman, Q. C.
Tel Nos. 929-9597
Fax Nos. 929-8074
Website: www.bfar.da.gov.ph
E-mail: [email protected]
3
FOREWORD The Bureau of Fisheries and Aquatic Resources (BFAR) is pleased to provide you the 2011 Fisheries Profile, a handy publication of relevant fisheries information including the volume and value of production by region, commodity, culture environment; import and export data; the overall performance of the sector for that year, among others. Through this publication, we hope to contribute and provide solutions to your data needs and requirements. This publication was made possible through our collaboration with the Bureau of Agricultural Statistics (BAS), the National Statistics Office (NSO), the National Statistical Coordination Board (NSCB), Food and Nutrition Research Institute (FNRI) and the Food and Agriculture Organization (FAO).

4 69
E N D N O T E S Sources of Data: 1/ NAMRIA (Wikepedia and CIA World Factbook 2009) 2/ 1992 Fishery Statistics, Bureau of Agricultural Statistics (BAS)
This refers to fishpond area acquired by the operator
whether utilized or not during the reference period.
This includes nursery and transition ponds and undeveloped areas. 3/ National Statistical Coordination Board (NSCB)
(www.nscb.gov.ph) 4/ Preliminary data, 2002 Census of Fisheries 5/ National Statistics Office (NSO) (www.census.gov.ph) 6/ 7/ Directory of Philippine Wetlands, Volume II, AWBPFI 8/ BFAR Regional Yearbook, 2000 9/ BFAR Regulatory and Quarantine Division 10/ Food and Nutrition Research Institute Website, (http://www.fnri.dost.gov.ph.) 11/ FAO Website (http://www.fao.org.) 12/ Agricultural Marketing Statistical Analysis Division (AMSAD, BAS)
Bureau of Agricultural Statistics (BAS) (www.bas.gov.ph)

68
E. PRICES OF SELECTED FISH SPECIES, PHILIPPINES, 2010- 2011 12/
(pesos per kilogram)
Wholesale Retail Wholesale Retail
1. Indian mackerel (Alumahan) 84.83 104.70 89.13 111.942. Milkfish (Bangus) 90.69 112.56 92.32 112.863. Threadfin bream (Bisugo) 98.44 139.37 108.51 148.284. Blue crab (Alimasag) 120.48 171.86 127.41 183.445. Caesio (Dalagang Bukid, lapad) 104.88 136.22 113.81 146.575. Anchovies (Dilis) 44.45 74.21 47.83 79.656. Roundscad (Galunggong) 64.25 87.45 77.58 100.477. Slipmouth (Sapsap) 66.13 112.51 73.02 115.649. Endeavor prawn (Shrimp, Suaje) 242.30 266.28 250.12 282.0110. Tilapia 67.89 87.57 73.51 90.811. Frigate tuna (Tulingan) 77.97 92.90 88.33 103.0812. Shrimp, Tiger prawn (sugpo) 377.01 425.66 391.18 442.48
Species2010 2011
5
FOREWORD
8
FISHERY RESOURCES A. Marine Resources 15
B. Inland Resources 15
► FISHERIES CONTRIBUTION TO THE ECONOMY, 2011
A. Fisheries Contribution to Total GDP 16 B. Fisheries Contribution to GVA Agricultural Sector 16 C. Employment 19 D. Balance of Trade 17 E. Total Fish Production, by Sector, 2011 18 F. Fish Production, by Sector and Region, 2011 20 F‐a. Value of Fish Production, by Sector and Region, 2011 21 G. Fish Production, by Sector, 2002 ‐2011 22 H. Five Year Fish Production, Trend 2007 ‐2011 24
► AQUACULTURE PRODUCTION, 2011
A. Summary of Aquaculture Production by Culture Environment and Region, 2011 26
B. Aquaculture Production by Culture Environment, Region and Species, 2011 27
C. Aquaculture Production of Major Commodities 36
by Culture Environment and by Region, 2011 D. Major Species Produced in Aquaculture Fisheries, 2011 39
E. Area and Location of Major Lakes in the Philippines 40
HIGHLIGHTS
►
C O N T E N T S C O N T E N T S

6
► MUNICIPAL FISHERIES PRODUCTION, 2011
A. Municipal Fisheries Production, by Region, 2011 42
B. Marine Municipal Fish Catch, by Major
Fish Species, 2011 43
C. Number of Municipal Fishing Bancas,
By Region, 2000 44
► COMMERCIAL FISHERIES PRODUCTION, 2011
A. Commercial Fisheries Production, by Region
and by Type of Landing Centers, 2011 46
B. Commercial Fisheries Production,
by Major Fish Species, 2011 47
C. Number of Commercial Fishing Operators,
and Vessels, by Region, as of 2007 48
► EXTERNAL TRADE
A. Exports
1. Exports of Fish and Fishery Products
by Kind, Quantity and Value, 2011 50
2. Major Fishery Exports in Terms of Value, 2011 51
3. Major Destination of Top Three Fishery
Exports by Kind, Quantity and Value, 2011 52
4. Fishery Exports, by Major Country of
Destination in Terms of Value, 2011 55
B. Imports
1. Imports of Fish and Fishery Products
by Kind, Quantity and Value, 2011 57
2. Major Fishery Imports in Terms of Value, 2011 58
3. Fishery Imports, by Major Country of Origin
in Terms of Value, 2011 60
67
D. WORLD AQUACULTURE PRODUCTION OF AQUATIC PLANTS BY PRINCIPAL PRODUCERS IN 2010 11/
Value(US$' 000)
1. China 11,092,270 58.36 2,533,196 44.83 2. Indonesia 3,915,017 20.60 1,268,367 22.44 3. Philippines 1,801,272 9.48 256,715 4.54 4. Korea Rep. 901,672 4.74 327,823 5.80 5. Korea D P Rp. 444,300 2.34 66,645 1.18 6. Japan 432,796 2.28 1,138,184 20.14 7. Malaysia 207,892 1.09 17,444 0.31 8. Zanzibar 125,157 0.66 1,781 0.03 9. Vietnam 35,000 0.18 17,500 0.31 10. Chile 12,179 0.06 15,841 0.28 11. Other Countries 39,498 0.21 7,671 0.14
World Total 19,007,053 100 5,651,167 100
Major Countries Volume (MT) % Share % Share
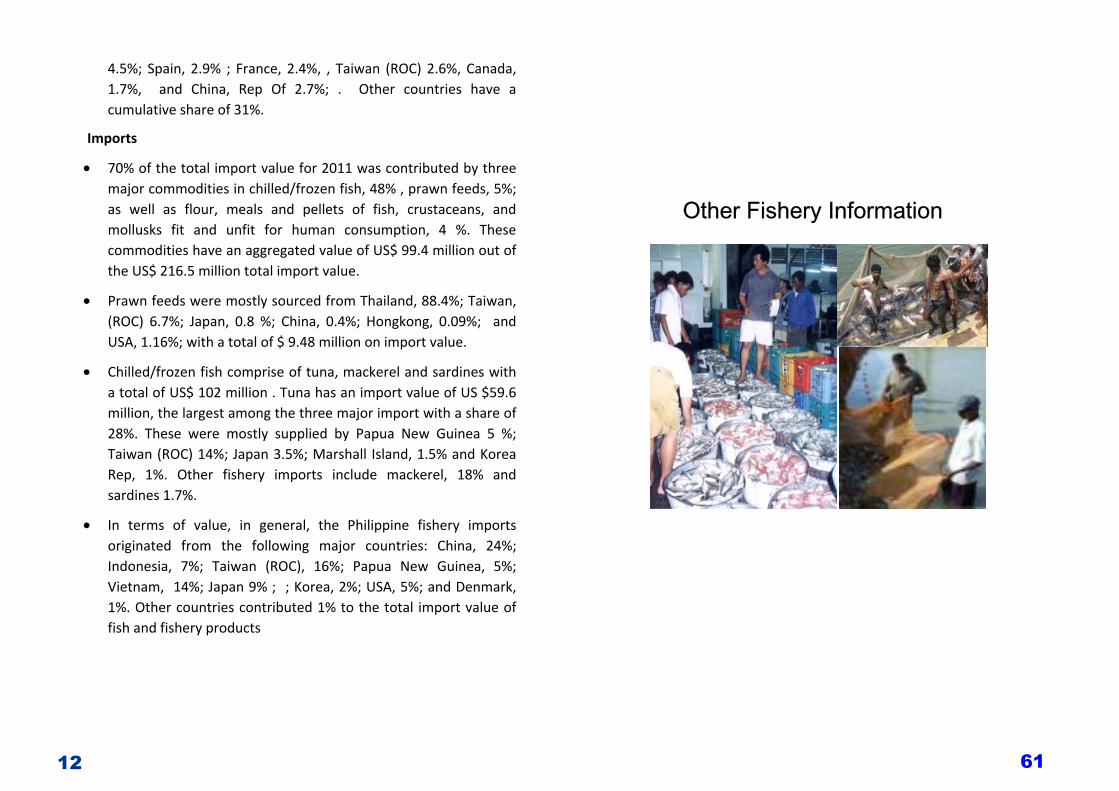
Other Fisheries Information
66
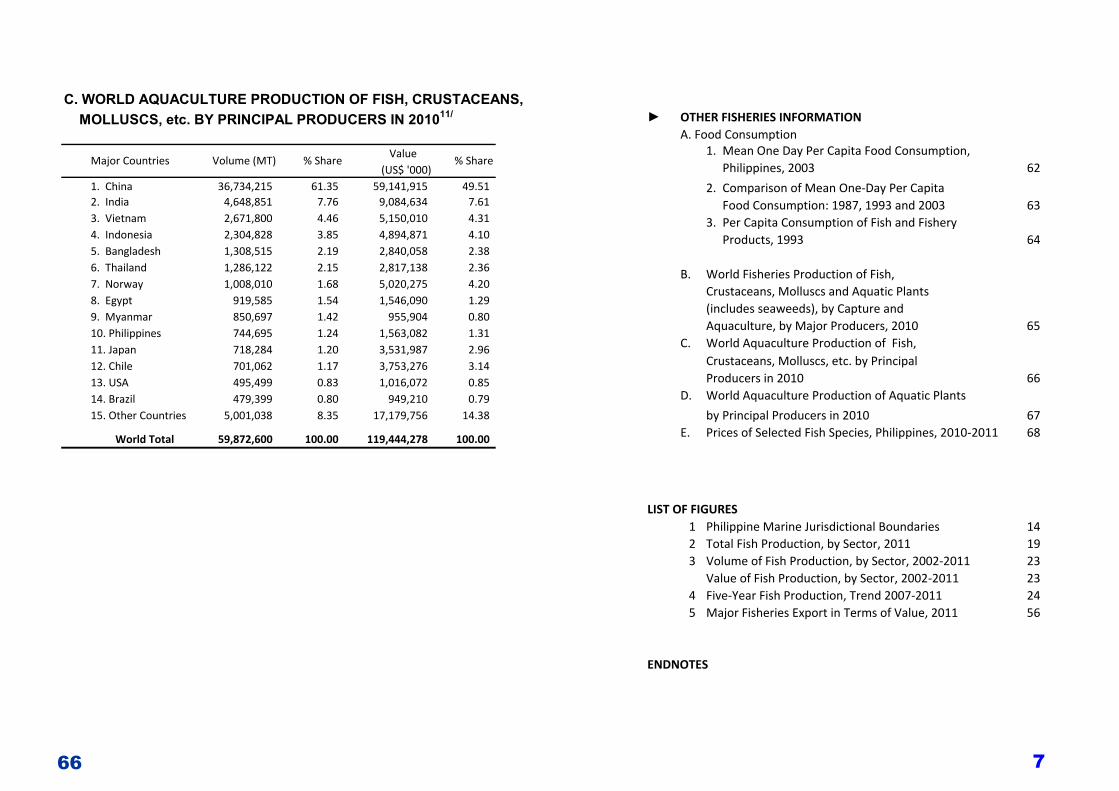
C. WORLD AQUACULTURE PRODUCTION OF FISH, CRUSTACEANS, MOLLUSCS, etc. BY PRINCIPAL PRODUCERS IN 201011/
Value(US$ '000)
1. China 36,734,215 61.35 59,141,915 49.51 2. India 4,648,851 7.76 9,084,634 7.61 3. Vietnam 2,671,800 4.46 5,150,010 4.31 4. Indonesia 2,304,828 3.85 4,894,871 4.10 5. Bangladesh 1,308,515 2.19 2,840,058 2.38 6. Thailand 1,286,122 2.15 2,817,138 2.36 7. Norway 1,008,010 1.68 5,020,275 4.20 8. Egypt 919,585 1.54 1,546,090 1.29 9. Myanmar 850,697 1.42 955,904 0.80 10. Philippines 744,695 1.24 1,563,082 1.31 11. Japan 718,284 1.20 3,531,987 2.96 12. Chile 701,062 1.17 3,753,276 3.14 13. USA 495,499 0.83 1,016,072 0.85 14. Brazil 479,399 0.80 949,210 0.79 15. Other Countries 5,001,038 8.35 17,179,756 14.38
World Total 59,872,600 100.00 119,444,278 100.00
Major Countries Volume (MT) % Share % Share
7
► OTHER FISHERIES INFORMATION A. Food Consumption 1. Mean One Day Per Capita Food Consumption, Philippines, 2003 62
2. Comparison of Mean One‐Day Per Capita Food Consumption: 1987, 1993 and 2003 63
3. Per Capita Consumption of Fish and Fishery
B. World Fisheries Production of Fish, Crustaceans, Molluscs and Aquatic Plants (includes seaweeds), by Capture and Aquaculture, by Major Producers, 2010 65
C. World Aquaculture Production of Fish, Crustaceans, Molluscs, etc. by Principal Producers in 2010 66
D. World Aquaculture Production of Aquatic Plants
by Principal Producers in 2010 67 E. Prices of Selected Fish Species, Philippines, 2010‐2011 68
LIST OF FIGURES 1 Philippine Marine Jurisdictional Boundaries 14
2 Total Fish Production, by Sector, 2011 19 3 Volume of Fish Production, by Sector, 2002‐2011 23 Value of Fish Production, by Sector, 2002‐2011 23 4 Five‐Year Fish Production, Trend 2007‐2011 24 5 Major Fisheries Export in Terms of Value, 2011 56
ENDNOTES
Products, 1993 64

8
H I G H L I G H T S H I G H L I G H T S
World Scenario: Philippine Fisheries
• In 2010, the Philippines ranked 5th among the top fish producing countries in the world with its total production of 5.16 million metric tons of fish, crustaceans, mollusks, and aquatic plants (including seaweeds). The production constitutes 3.06% of the total world production of 168.4 million metric tons (FAO website).
• The Philippines’ 0.745 million metric tons aquaculture production of fish, crustaceans and mollusks in 2010 ranked 10th in the world and a 1.24% share to the total global aquaculture production of 59.87 million metric tons. In terms of value, the country’s aquaculture production of fish, crustaceans and mollusks has amounted to over 1.56 billion dollars (FAO website).
• Similarly, the Philippines is the world’s 3rd largest producer of aquatic plants (including seaweeds) having produced a total of 1.80 million metric tons or nearly 9.48% of the total world production of 19.01 million metric tons (FAO website).
Contribution to National Economy, 2011 • The fishing industry’s contribution to the country’s Gross
Domestic Products (GDP) were 1.9 % and 2.2% at current and constant 2000 prices, respectively. This translates to some P183.1 billion for current prices and P130.77 billion for constant prices of the country’s GDP of P9,735.52 billion (current prices) and P5,924.4 billion (constant prices).
• The industry also accounted for 14.7% (P183.1 billion) and 19.2% (P130.77 billion) of the Gross Value Added (GVA) in Agriculture,
65
B. W
OR
LD F
ISH
ERIE
S PR
OD
UC
TIO
N O
F FI
SH, C
RU
STAC
EAN
S, M
OLL
USC
S AN
D A
QU
ATIC
PLA
NTS
(incl
udes
sea
wee
ds),
BY
CAP
TUR
E AN
D A
QU
ACU
LTU
RE,
BY
MAJ
OR
PR
OD
UC
ERS,
201
0 ('0
00 M
T)
MT
% s
hare
Capt
ure
Aqu
acul
ture
Tota
lCa
ptur
eA
quac
ultu
reTo
tal
1. C
hina
63,4
92,0
72
37
.71
15,4
18,9
67
36,7
34,2
15
52
,153
,182
24
6,62
0
11,0
92,2
70
11
,338
,890
2. I
ndon
esia
11,6
02,8
08
6.
895,
380,
266
2,
304,
828
7,
685,
094
2,69
7
3,91
5,01
7
3,91
7,71
4
3. I
ndia
9,34
8,06
3
5.55
4,69
4,96
8
4,64
8,85
1
9,34
3,81
9
2
4,
242
4,24
4
4. J
apan
5,29
1,86
5
3.14
4,04
4,18
5
718,
284
4,76
2,46
9
96
,600
432,
796
529,
396
5. P
hilip
pine
s5,
158,
160
3.
062,
611,
720
74
4,69
5
3,
356,
415
473
1,80
1,27
2
1,80
1,74
5
6. V
iet N
am5,
127,
600
3.
052,
420,
800
2,
671,
800
5,
092,
600
‐
35
,000
35
,000
7. U
SA4,
874,
066
2.
894,
369,
540
49
5,49
9
4,
865,
039
9,02
7
‐
9,02
7
8. P
eru
4,35
4,48
0
2.59
4,26
1,09
1
89,0
21
4,35
0,11
2
4,
368
‐
4,
368
9. R
ussi
an F
ed4,
196,
539
2.
494,
069,
624
12
0,38
4
4,
190,
008
5,91
7
614
6,
531
10. M
yanm
ar3,
914,
169
2.
323,
063,
210
85
0,69
7
3,
913,
907
‐
26
2
262
11. C
hile
3,76
1,55
7
2.23
2,67
9,73
6
701,
062
3,38
0,79
8
36
8,58
0
12,1
79
380,
759
12. N
orw
ay3,
683,
302
2.
192,
675,
292
1,
008,
010
3,
683,
302
‐
‐
‐
13. K
orea
Rep
.3,
123,
204
1.
851,
732,
928
47
5,56
1
2,
208,
489
13,0
43
90
1,67
2
91
4,71
5
14. T
haila
nd3,
113,
321
1.
851,
827,
199
1,
286,
122
3,
113,
321
‐
‐
‐
15. O
ther
Cou
ntrie
s37
,327
,923
22.1
729
,354
,300
7,
023,
571
36
,377
,871
13
8,32
3
811,
729
950,
052
Wor
ld T
otal
168,
369,
129
10
0.00
88,6
03,8
26
59
,872
,600
148,
476,
426
885,
650
19
,007
,053
19,8
92,7
03
Maj
or C
ount
ries
TOTA
LFi
sh, C
rust
acea
ns &
Mol
lusc
s
Aqu
atic
Pla
nts
(incl
udes
sea
wee
ds)
Other Fisheries Information
64
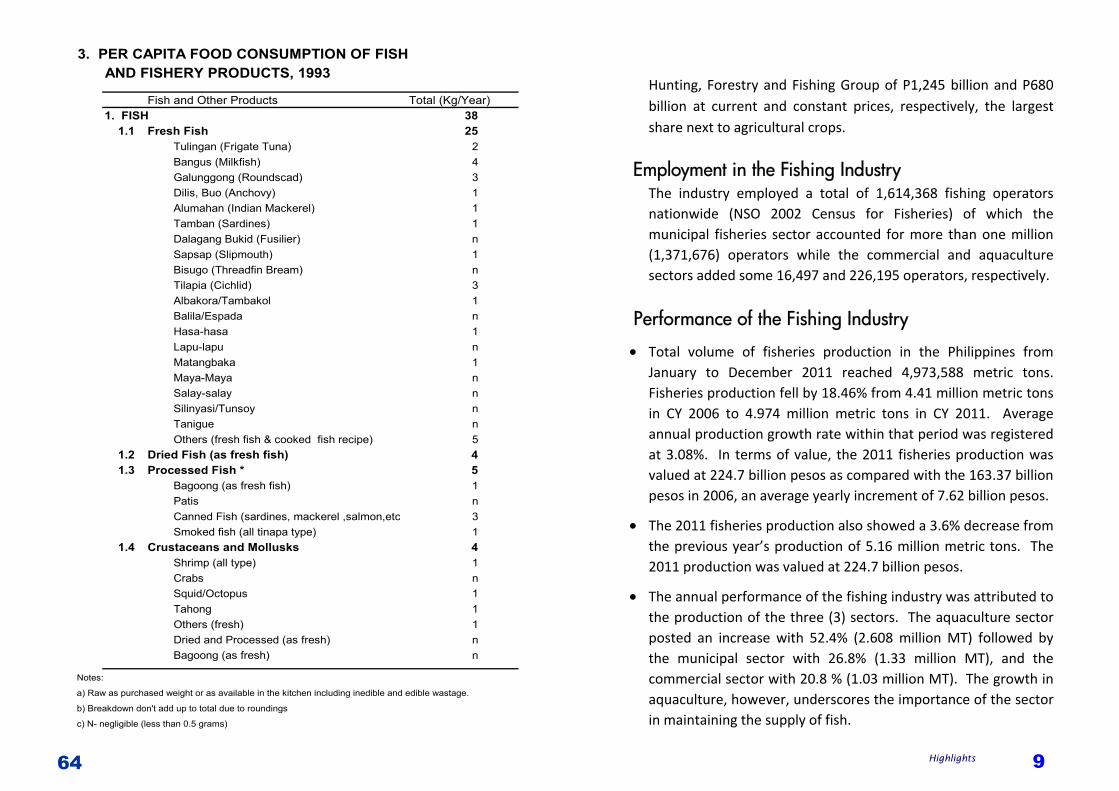
3. PER CAPITA FOOD CONSUMPTION OF FISHAND FISHERY PRODUCTS, 1993
Fish and Other Products Total (Kg/Year)1. FISH 38 1.1 Fresh Fish 25
Tulingan (Frigate Tuna) 2Bangus (Milkfish) 4Galunggong (Roundscad) 3Dilis, Buo (Anchovy) 1Alumahan (Indian Mackerel) 1Tamban (Sardines) 1Dalagang Bukid (Fusilier) nSapsap (Slipmouth) 1Bisugo (Threadfin Bream) nTilapia (Cichlid) 3Albakora/Tambakol 1Balila/Espada nHasa-hasa 1Lapu-lapu nMatangbaka 1Maya-Maya nSalay-salay nSilinyasi/Tunsoy nTanigue nOthers (fresh fish & cooked fish recipe) 5
1.2 Dried Fish (as fresh fish) 4 1.3 Processed Fish * 5
Bagoong (as fresh fish) 1Patis nCanned Fish (sardines, mackerel ,salmon,etc 3Smoked fish (all tinapa type) 1
1.4 Crustaceans and Mollusks 4Shrimp (all type) 1Crabs nSquid/Octopus 1Tahong 1Others (fresh) 1Dried and Processed (as fresh) nBagoong (as fresh) n
Notes:
a) Raw as purchased weight or as available in the kitchen including inedible and edible wastage.
b) Breakdown don't add up to total due to roundings
c) N- negligible (less than 0.5 grams)
9
Hunting, Forestry and Fishing Group of P1,245 billion and P680 billion at current and constant prices, respectively, the largest share next to agricultural crops.
Employment in the Fishing Industry The industry employed a total of 1,614,368 fishing operators nationwide (NSO 2002 Census for Fisheries) of which the municipal fisheries sector accounted for more than one million (1,371,676) operators while the commercial and aquaculture sectors added some 16,497 and 226,195 operators, respectively.
Performance of the Fishing Industry
• Total volume of fisheries production in the Philippines from January to December 2011 reached 4,973,588 metric tons. Fisheries production fell by 18.46% from 4.41 million metric tons in CY 2006 to 4.974 million metric tons in CY 2011. Average annual production growth rate within that period was registered at 3.08%. In terms of value, the 2011 fisheries production was valued at 224.7 billion pesos as compared with the 163.37 billion pesos in 2006, an average yearly increment of 7.62 billion pesos.
• The 2011 fisheries production also showed a 3.6% decrease from the previous year’s production of 5.16 million metric tons. The 2011 production was valued at 224.7 billion pesos.
• The annual performance of the fishing industry was attributed to the production of the three (3) sectors. The aquaculture sector posted an increase with 52.4% (2.608 million MT) followed by the municipal sector with 26.8% (1.33 million MT), and the commercial sector with 20.8 % (1.03 million MT). The growth in aquaculture, however, underscores the importance of the sector in maintaining the supply of fish.
Highlights
10
• At the regional level, the Autonomous Region for Muslim Mindanao (ARMM) registered the highest production among all regions with its 18.3% or 909,370 metric tons share to the total fisheries production, where seaweed was the major commodity produced followed by Region IV‐B (MIMAROPA) with a 14.7% share or 728,972 metric tons. Region IX recorded an output of 619,557 metric tons or 12.5% to the total fisheries production.
• In terms of value, the industry has contributed P224.7 billion in 2011 as compared to P221.05 billion in 2010. The top three (3) regions were Region VI with P27.61 billion, followed by Region III with P25.39 billion and Region IX with P21 billion.
• The Aquaculture fisheries sub‐sector contributed the highest value of about P86 billion or 38.3 %. Next is municipal fisheries sub‐sector with a total production of P 80.1 billion. Total fish caught by marine fishermen was valued at P72.03 billion while inland fisheries production was valued at P8.05 billion. The commercial sub‐sector contributed P58.62 billion or 26% to the total fishery output.
Fisheries Export and Import Performance Exports
• Foreign trade performance of the fishery industry in 2011 registered a net surplus of 654 million dollars – total export value of 871 million US dollars and import value of 217 million US dollars.
• Export volume declined by 3.14% from 220,992 MT in 2010 to 214,055 MT in 2011. The three major export commodities (tuna, seaweeds, shrimp/prawn,) combined for 61% (130,802 MT) of the total export volume (214,055 MT) and 65% (US$566.7 million) of the total export value (US$ 871million) in 2011.
63 Other Fisheries Information
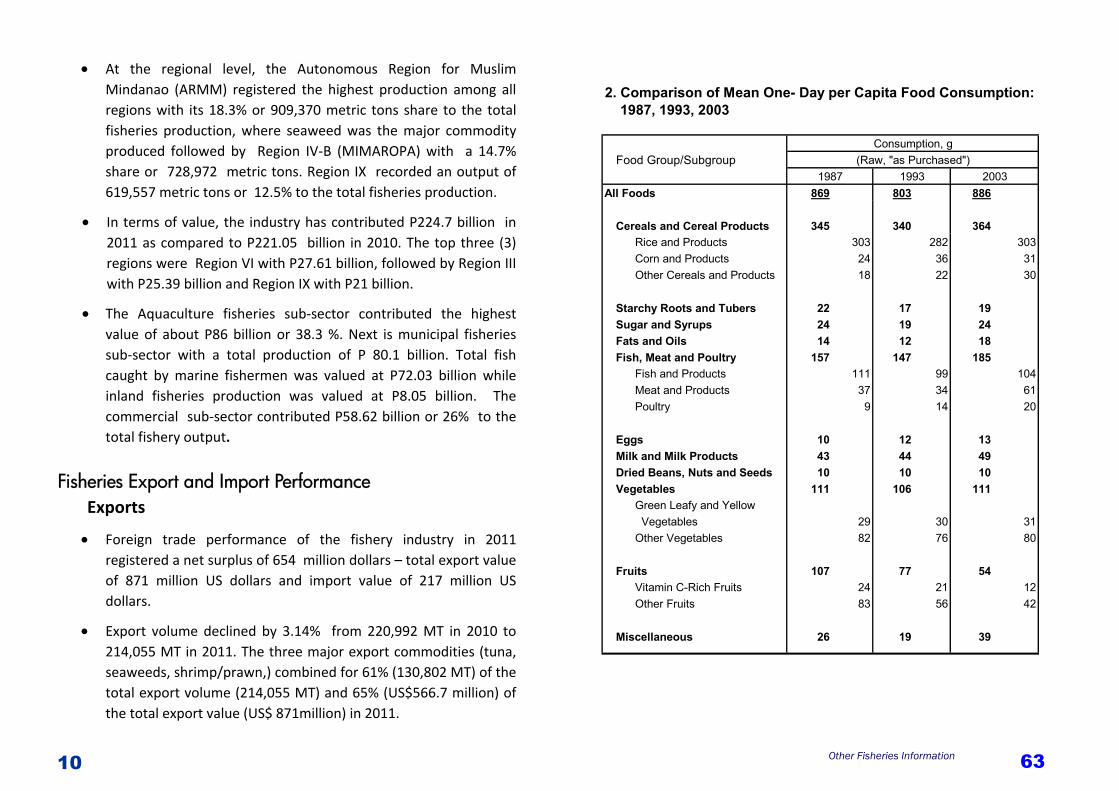
2. Comparison of Mean One- Day per Capita Food Consumption: 1987, 1993, 2003
Food Group/Subgroup
All Foods 869 803 886
Cereals and Cereal Products 345 340 364 Rice and Products 303 282 303 Corn and Products 24 36 31 Other Cereals and Products 18 22 30
Starchy Roots and Tubers 22 17 19Sugar and Syrups 24 19 24Fats and Oils 14 12 18Fish, Meat and Poultry 157 147 185 Fish and Products 111 99 104 Meat and Products 37 34 61 Poultry 9 14 20
Eggs 10 12 13Milk and Milk Products 43 44 49Dried Beans, Nuts and Seeds 10 10 10Vegetables 111 106 111 Green Leafy and Yellow Vegetables 29 30 31 Other Vegetables 82 76 80
Fruits 107 77 54 Vitamin C-Rich Fruits 24 21 12 Other Fruits 83 56 42
Miscellaneous 26 19 39
2003
Consumption, g (Raw, "as Purchased")
1987 1993
62
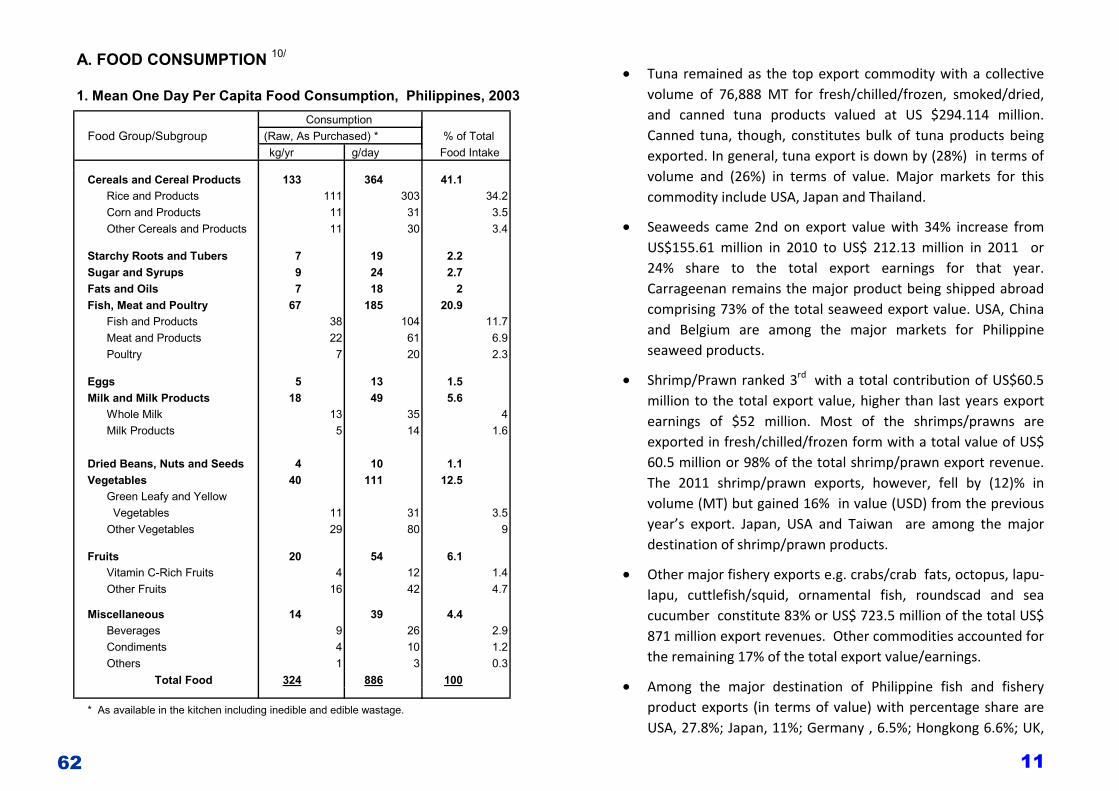
A. FOOD CONSUMPTION 10/
1. Mean One Day Per Capita Food Consumption, Philippines, 2003 Consumption
Food Group/Subgroup (Raw, As Purchased) *kg/yr g/day
Cereals and Cereal Products 133 364 41.1 Rice and Products 111 303 34.2 Corn and Products 11 31 3.5 Other Cereals and Products 11 30 3.4
Starchy Roots and Tubers 7 19 2.2Sugar and Syrups 9 24 2.7Fats and Oils 7 18 2Fish, Meat and Poultry 67 185 20.9 Fish and Products 38 104 11.7 Meat and Products 22 61 6.9 Poultry 7 20 2.3
Eggs 5 13 1.5Milk and Milk Products 18 49 5.6 Whole Milk 13 35 4 Milk Products 5 14 1.6
Dried Beans, Nuts and Seeds 4 10 1.1Vegetables 40 111 12.5 Green Leafy and Yellow Vegetables 11 31 3.5 Other Vegetables 29 80 9
Fruits 20 54 6.1 Vitamin C-Rich Fruits 4 12 1.4 Other Fruits 16 42 4.7
Miscellaneous 14 39 4.4 Beverages 9 26 2.9 Condiments 4 10 1.2 Others 1 3 0.3
Total Food 324 886 100
* As available in the kitchen including inedible and edible wastage.
% of Total Food Intake
11
• Tuna remained as the top export commodity with a collective volume of 76,888 MT for fresh/chilled/frozen, smoked/dried, and canned tuna products valued at US $294.114 million. Canned tuna, though, constitutes bulk of tuna products being exported. In general, tuna export is down by (28%) in terms of volume and (26%) in terms of value. Major markets for this commodity include USA, Japan and Thailand.
• Seaweeds came 2nd on export value with 34% increase from US$155.61 million in 2010 to US$ 212.13 million in 2011 or 24% share to the total export earnings for that year. Carrageenan remains the major product being shipped abroad comprising 73% of the total seaweed export value. USA, China and Belgium are among the major markets for Philippine seaweed products.
• Shrimp/Prawn ranked 3rd with a total contribution of US$60.5 million to the total export value, higher than last years export earnings of $52 million. Most of the shrimps/prawns are exported in fresh/chilled/frozen form with a total value of US$ 60.5 million or 98% of the total shrimp/prawn export revenue. The 2011 shrimp/prawn exports, however, fell by (12)% in volume (MT) but gained 16% in value (USD) from the previous year’s export. Japan, USA and Taiwan are among the major destination of shrimp/prawn products.
• Other major fishery exports e.g. crabs/crab fats, octopus, lapu‐lapu, cuttlefish/squid, ornamental fish, roundscad and sea cucumber constitute 83% or US$ 723.5 million of the total US$ 871 million export revenues. Other commodities accounted for the remaining 17% of the total export value/earnings.
• Among the major destination of Philippine fish and fishery product exports (in terms of value) with percentage share are USA, 27.8%; Japan, 11%; Germany , 6.5%; Hongkong 6.6%; UK,
12
4.5%; Spain, 2.9% ; France, 2.4%, , Taiwan (ROC) 2.6%, Canada, 1.7%, and China, Rep Of 2.7%; . Other countries have a cumulative share of 31%.
Imports
• 70% of the total import value for 2011 was contributed by three major commodities in chilled/frozen fish, 48% , prawn feeds, 5%; as well as flour, meals and pellets of fish, crustaceans, and mollusks fit and unfit for human consumption, 4 %. These commodities have an aggregated value of US$ 99.4 million out of the US$ 216.5 million total import value.
• Prawn feeds were mostly sourced from Thailand, 88.4%; Taiwan, (ROC) 6.7%; Japan, 0.8 %; China, 0.4%; Hongkong, 0.09%; and USA, 1.16%; with a total of $ 9.48 million on import value.
• Chilled/frozen fish comprise of tuna, mackerel and sardines with a total of US$ 102 million . Tuna has an import value of US $59.6 million, the largest among the three major import with a share of 28%. These were mostly supplied by Papua New Guinea 5 %; Taiwan (ROC) 14%; Japan 3.5%; Marshall Island, 1.5% and Korea Rep, 1%. Other fishery imports include mackerel, 18% and sardines 1.7%.
• In terms of value, in general, the Philippine fishery imports originated from the following major countries: China, 24%; Indonesia, 7%; Taiwan (ROC), 16%; Papua New Guinea, 5%; Vietnam, 14%; Japan 9% ; ; Korea, 2%; USA, 5%; and Denmark, 1%. Other countries contributed 1% to the total import value of fish and fishery products
61
Other Fishery Information
60
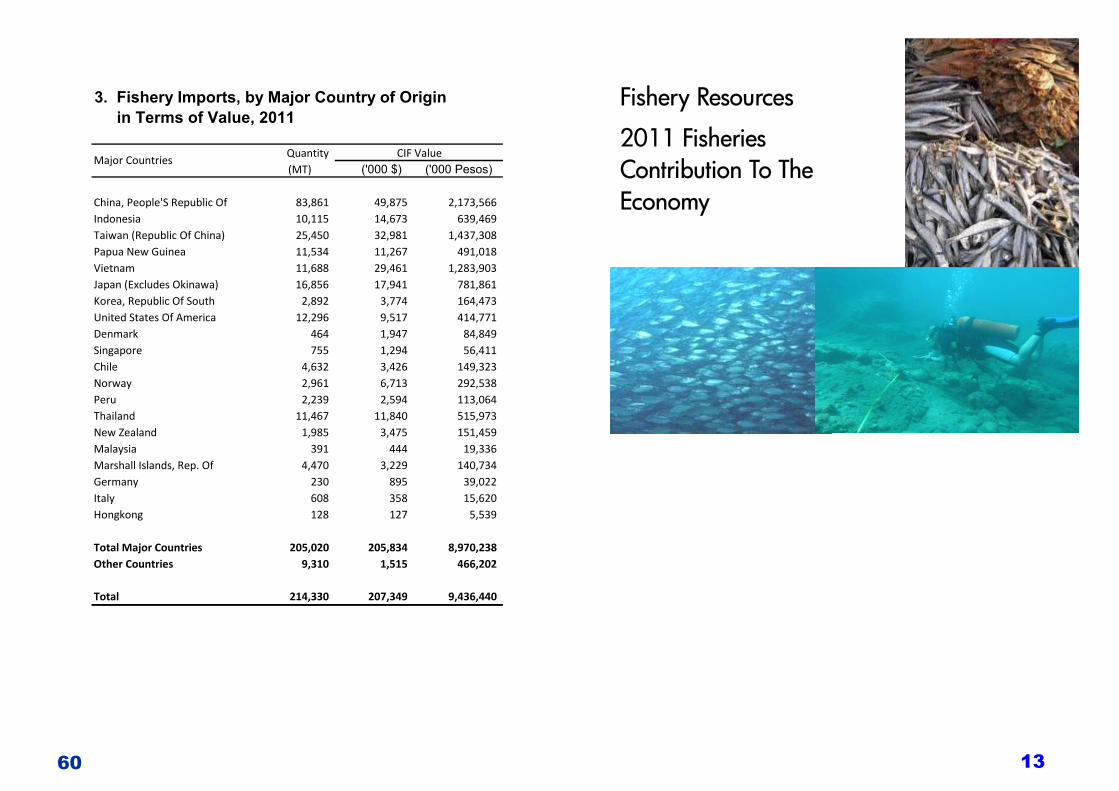
3. Fishery Imports, by Major Country of Origin in Terms of Value, 2011
Quantity(MT) ('000 $) ('000 Pesos)
China, People'S Republic Of 83,861 49,875 2,173,566 Indonesia 10,115 14,673 639,469 Taiwan (Republic Of China) 25,450 32,981 1,437,308 Papua New Guinea 11,534 11,267 491,018 Vietnam 11,688 29,461 1,283,903 Japan (Excludes Okinawa) 16,856 17,941 781,861 Korea, Republic Of South 2,892 3,774 164,473 United States Of America 12,296 9,517 414,771 Denmark 464 1,947 84,849 Singapore 755 1,294 56,411 Chile 4,632 3,426 149,323 Norway 2,961 6,713 292,538 Peru 2,239 2,594 113,064 Thailand 11,467 11,840 515,973 New Zealand 1,985 3,475 151,459 Malaysia 391 444 19,336 Marshall Islands, Rep. Of 4,470 3,229 140,734 Germany 230 895 39,022 Italy 608 358 15,620 Hongkong 128 127 5,539
Total Major Countries 205,020 205,834 8,970,238 Other Countries 9,310 1,515 466,202
Total 214,330 207,349 9,436,440
Major CountriesCIF Value
13
Fishery Resources
2011 Fisheries Contribution To The Economy
14
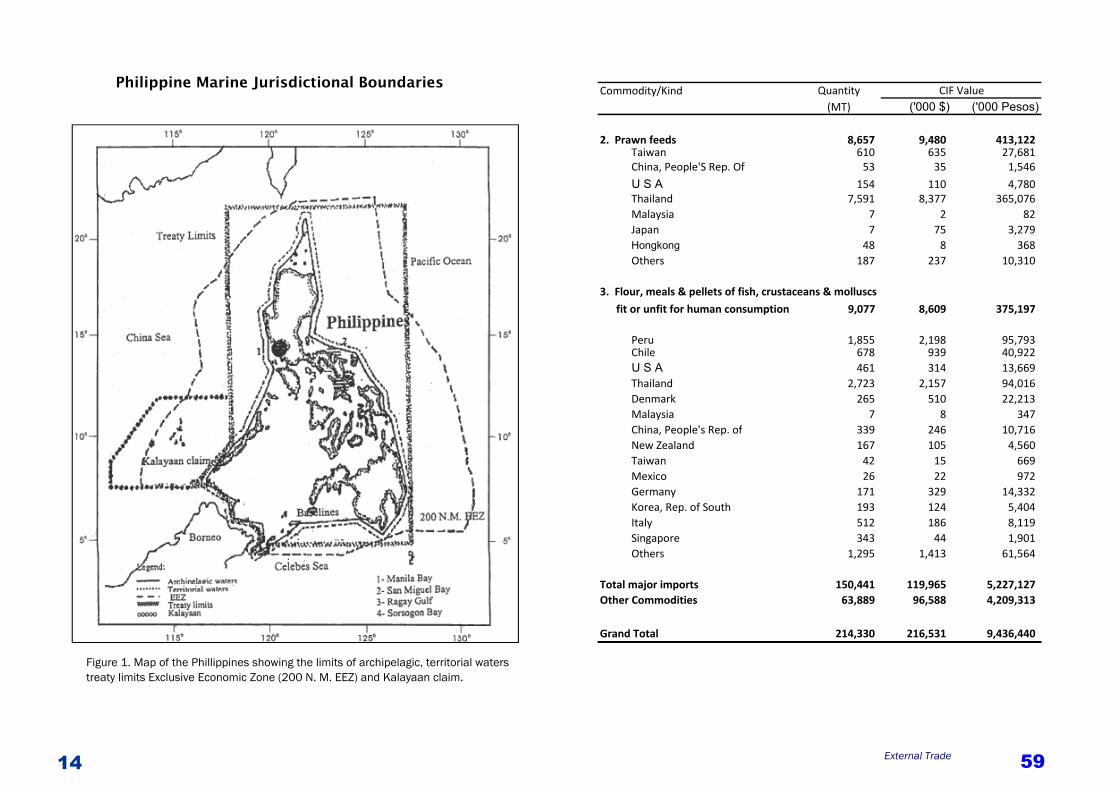
Philippine Marine Jurisdictional Boundaries
Figure 1. Map of the Phillippines showing the limits of archipelagic, territorial waters treaty limits Exclusive Economic Zone (200 N. M. EEZ) and Kalayaan claim.
59 External Trade
Commodity/Kind Quantity(MT) ('000 $) ('000 Pesos)
2. Prawn feeds 8,657 9,480 413,122 Taiwan 610 635 27,681 China, People'S Rep. Of 53 35 1,546
U S A 154 110 4,780 Thailand 7,591 8,377 365,076 Malaysia 7 2 82 Japan 7 75 3,279 Hongkong 48 8 368 Others 187 237 10,310
3. Flour, meals & pellets of fish, crustaceans & molluscs
fit or unfit for human consumption 9,077 8,609 375,197
Peru 1,855 2,198 95,793 Chile 678 939 40,922 U S A 461 314 13,669 Thailand 2,723 2,157 94,016 Denmark 265 510 22,213 Malaysia 7 8 347 China, People's Rep. of 339 246 10,716 New Zealand 167 105 4,560 Taiwan 42 15 669 Mexico 26 22 972 Germany 171 329 14,332 Korea, Rep. of South 193 124 5,404 Italy 512 186 8,119 Singapore 343 44 1,901 Others 1,295 1,413 61,564
Total major imports 150,441 119,965 5,227,127 Other Commodities 63,889 96,588 4,209,313
Grand Total 214,330 216,531 9,436,440
CIF Value
58
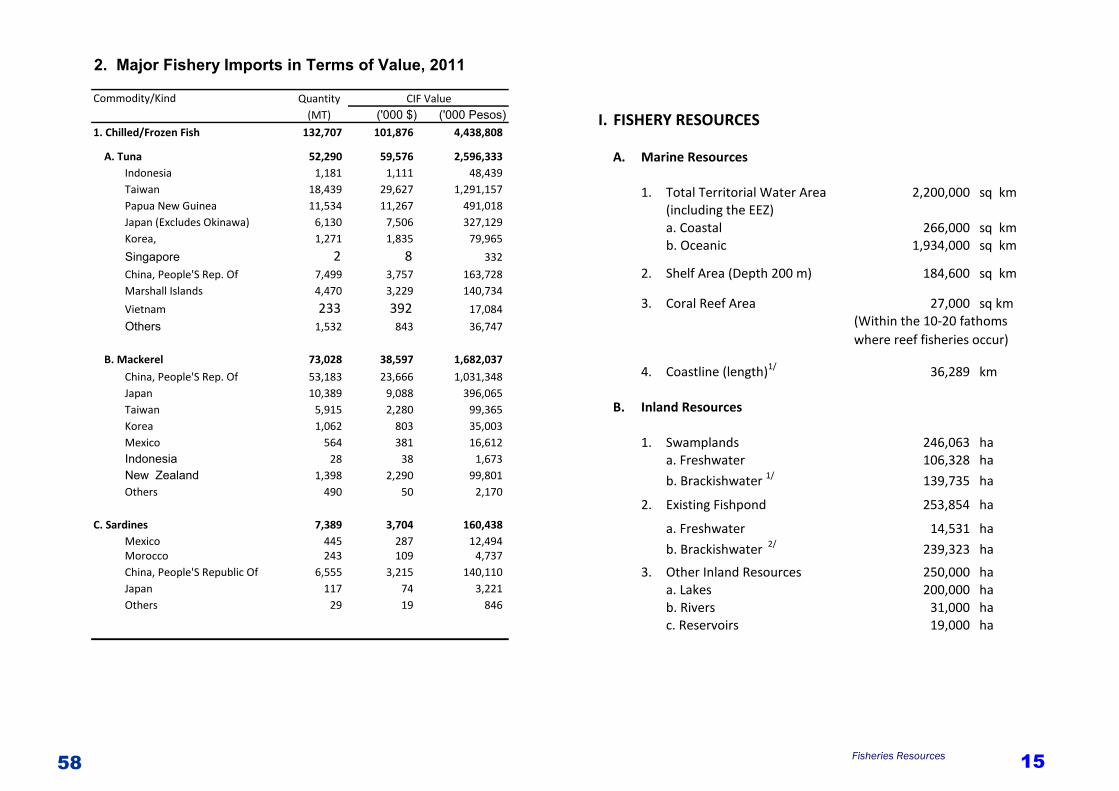
2. Major Fishery Imports in Terms of Value, 2011
Commodity/Kind Quantity(MT) ('000 $) ('000 Pesos)
1. Chilled/Frozen Fish 132,707 101,876 4,438,808
A. Tuna 52,290 59,576 2,596,333 Indonesia 1,181 1,111 48,439 Taiwan 18,439 29,627 1,291,157 Papua New Guinea 11,534 11,267 491,018 Japan (Excludes Okinawa) 6,130 7,506 327,129 Korea, 1,271 1,835 79,965
Singapore 2 8 332
China, People'S Rep. Of 7,499 3,757 163,728 Marshall Islands 4,470 3,229 140,734
Vietnam 233 392 17,084
Others 1,532 843 36,747
B. Mackerel 73,028 38,597 1,682,037
China, People'S Rep. Of 53,183 23,666 1,031,348 Japan 10,389 9,088 396,065 Taiwan 5,915 2,280 99,365 Korea 1,062 803 35,003 Mexico 564 381 16,612 Indonesia 28 38 1,673 New Zealand 1,398 2,290 99,801 Others 490 50 2,170
C. Sardines 7,389 3,704 160,438 Mexico 445 287 12,494 Morocco 243 109 4,737 China, People'S Republic Of 6,555 3,215 140,110 Japan 117 74 3,221 Others 29 19 846
CIF Value
15 Fisheries Resources
I. FISHERY RESOURCES
A. Marine Resources
1. Total Territorial Water Area 2,200,000 sq km(including the EEZ)a. Coastal 266,000 sq kmb. Oceanic 1,934,000 sq km
2. Shelf Area (Depth 200 m) 184,600 sq km 3. Coral Reef Area 27,000 sq km
(Within the 10‐20 fathomswhere reef fisheries occur)
4. Coastline (length)1/ 36,289 km
B. Inland Resources
1. Swamplands 246,063 haa. Freshwater 106,328 ha
b. Brackishwater 1/ 139,735 ha
2. Existing Fishpond 253,854 ha
a. Freshwater 14,531 ha
b. Brackishwater 2/ 239,323 ha
3. Other Inland Resources 250,000 haa. Lakes 200,000 hab. Rivers 31,000 hac. Reservoirs 19,000 ha

16
II. FISHERIES CONTRIBUTION TO THE ECONOMY, 2011
A. Fisheries Contribution to Total GDP 3/
1. At Current Prices 1.9%2. At Constant Prices 2.2%
B. Fisheries Contribution to GVA in Agriculture,
Hunting, Forestry and Fishing by Industry Group 3/
Industry At Current % to Agri‐ At Constant % to Agri‐Group Prices cultural Prices cultural
(P M) Sector (P M) Sector
1. Agricultural crops (Palay, corn, coconut ,etc) 716,344 57.5 333,059 48.9
2. Livestock 151,635 12.2 92,255 13.63. Poultry 106,906 8.6 71,262 10.54. Agricultural
activities 83,319 6.7 48,860 7.26. Forestry 3,906 0.3 4,236 0.65. Fishing 183,086 14.7 130,772 19.2
Total 1,245,196 100 680,445 100.0
Note: GDP at current and constant 2000 prices
57 External Trade
B. IMPORTS 5/
1. Import of Fish and Fishery ProductsBy Kind, Quantity and Value, 2011
Commodity/Kind Quantity (MT) ('000 $) ('000 Pesos)
Fish Crustaceans, Mollusks,
etc. and Preparation 185,936 171,225 7,461,983
a. Fish fresh (live or dead)chilled or frozen 160,738 145,548 6,342,996
b. Fish, dried, salted or inbrine, smoked fish 118 265 11,541
c. Crustaceans, mollusks and aquatic invertebrates 21,017 22,046 960,755
d. Fish and other aquaticinvertebrate, prepared/preserved 4,063 3,366 146,691
Shells and By‐Products 651 159 6,945
Miscellaneous and Other
Fishery Products 27,743 45,147 1,967,512
Grand Total 214,330 216,531 9,436,440
Note: Figures may not add up due to rounding off
CIF Value
56
6.36
0.08
0.29
0.35
0.94
0.99
1.59
2.51
2.61
9.14
12.67
‐ 5.00 10.00 15.00
Other commodities
Roundscad
Ornamental Fish, Live
Sea Cucumber, Dried
Grouper
Squid and Cuttlefish
Octopus
Crab/crab fat & crab meat
Shrimps/Prawn
Seaweeds
Tuna
(in billion pesos)
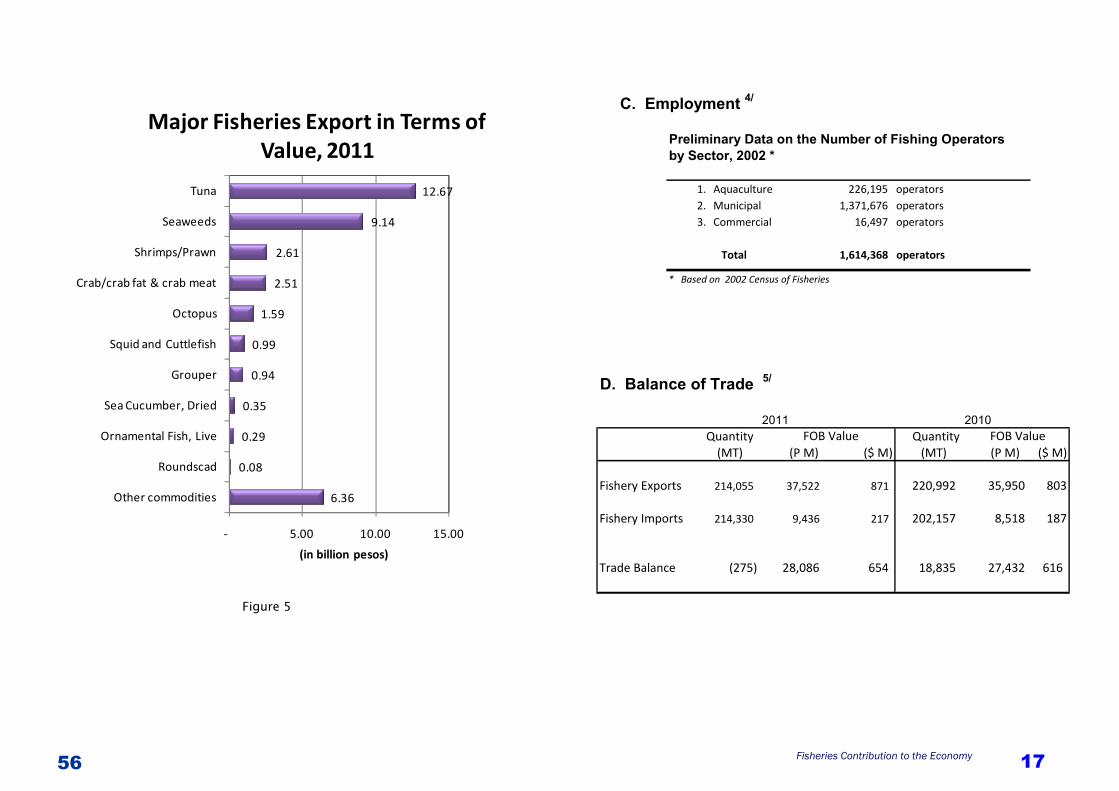
Major Fisheries Export in Terms of Value, 2011
Figure 5
17 Fisheries Contribution to the Economy
C. Employment 4/
Preliminary Data on the Number of Fishing Operators by Sector, 2002 *
1. Aquaculture 226,195 operators2. Municipal 1,371,676 operators3. Commercial 16,497 operators
Total 1,614,368 operators
* Based on 2002 Census of Fisheries
D. Balance of Trade 5/
2011 2010Quantity Quantity
(MT) (P M) ($ M) (MT) (P M) ($ M)
Fishery Exports 214,055 37,522 871 220,992 35,950 803
Fishery Imports 214,330 9,436 217 202,157 8,518 187
Trade Balance (275) 28,086 654 18,835 27,432 616
FOB Value FOB Value

18
E. Total Fish Production, by Sector, 2011
Sector Quantity % Value % (MT) Current Prices
('000 P)
1. Aquaculture 2,608,119.84 52.4 85,996,428.04 38.3
2. Municipal Fisheries 1,332,647.79 26.8 80,075,629.84 35.6
3. Commercial Fisheries 1,032,820.12 20.8 58,623,021.01 26.1
Total 4,973,587.75 100.0 224,695,078.89 100.0
55 External Trade
4. Fishery Exports, by Major Country of Destination in Terms of Value, 2011
Quantity(MT) ('000 $) ('000 Pesos)
United States Of America 55,161 242,248 10,436,040 Japan (Excludes Okinawa) 12,457 96,015 4,136,347 Germany 13,828 56,417 2,430,441 Hongkong 13,886 57,368 2,471,408 Uk Great Britain And N. Ireland 10,566 39,219 1,689,556 Spain 7,649 25,423 1,095,217 France 6,834 20,679 890,871 Taiwan (Republic Of China) 7,997 22,996 990,655 Canada 4,055 15,224 655,834 China, People'S Republic Of 12,200 23,839 1,026,983 Belgium 3,457 22,148 954,140 Indonesia 1,296 8,011 345,106 Italy 5,575 18,426 793,785 Singapore 2,502 10,140 436,842 Thailand 4,289 19,678 847,746 Korea, Republic Of South 3,419 14,944 643,782 Denmark 1,762 14,222 612,679 United Arab Emirates 2,035 7,200 310,180 Russian Federations 662 5,921 255,085 Vietnam 2,981 7,806 336,285
Total Major Countries 172,611 599,428 31,358,981 Other Countries 41,444 271,565 6,163,387
Grand Total 214,055 870,993 37,522,368
Country/DestinationFOB Value

54
Commodity/Kind Quantity(MT) ('000 $) ('000 Pesos)
3. Shrimps/Prawns 6,715 60,497 2,606,222
Frozen 6,486 57,684 2,485,014
Japan 3,878 39,463 1,700,069 U S A 1,101 7,902 340,433 Korea 242 1,825 78,612 Hongkong 169 887 38,231 Guam 145 1,274 54,872 Trust Territory of the Pacific Is. 94 709 30,561 Canada 120 1,070 46,109 Taiwan 438 1,645 70,886 France 210 2,107 90,767 Others 88 800 34,473
Fresh or chilled 98 1,364 58,751 Korea 2 30 1,273 Guam 1 7 280
United Arab Emirates 94 1,315 56,669 Others 1 12 528
Other Than Fresh/Chilled or Frozen 129 1,437 61,891 Japan 112 1,400 60,294 Taiwan 13 17 742 United States Of America 2 9 390
Prepared and Preserved 2 13 566 Thailand 2 12 524
Singapore 0 1 40
Total (3) major commodities 129,855 566,736 24,414,987 Total other commodities 84,200 304,257 13,107,381
Grand Total 214,055 870,993 37,522,368
FOB Value
19 Fisheries Contribution to the Economy
Total Fish Production, By Sector, 2011
Figure 2
Aquaculture2,608,120
52%
Municipal Fisheries1,332,648
27%
Commercial Fisheries1,032,820
21%
Aquaculture85.996 38%
Municipal Fisheries
80.076 36%
Commercial Fisheries
58.623 26%
Quantity =4,973,588 Metric Tons
Value = 224.695 Billion Pesos

20
F. Fish Production, by Sector and Region, 2011 in (MT)
% share to total
NCR 70,684.64 6,620.98 2,709.02 80,014.64 1.6 CAR ‐ 983.42 2,676.18 3,659.60 0.1 I 3,556.45 39,146.31 107,562.16 150,264.92 3.0 II 16,049.93 34,752.46 14,073.16 64,875.55 1.3 III 4,548.99 42,047.05 212,370.87 258,966.91 5.2 IV‐A 73,103.10 124,549.17 205,242.71 402,894.98 8.1 IV‐B 44,079.53 196,042.31 488,850.61 728,972.45 14.7 V 68,972.70 143,711.93 76,322.77 289,007.40 5.8 VI 103,808.69 167,227.67 179,849.81 450,886.17 9.1 VII 39,836.61 53,010.45 147,226.27 240,073.33 4.8 VIII 61,228.67 98,212.04 50,337.03 209,777.74 4.2 IX 214,436.45 129,037.87 276,082.66 619,556.98 12.5 X 39,853.61 43,128.28 73,403.82 156,385.71 3.1 XI 13,858.49 24,260.63 26,130.47 64,249.59 1.3 XII 174,840.33 47,668.61 26,020.44 248,529.38 5.0 CARAGA 6,064.74 66,600.69 23,487.05 96,152.48 1.9 ARMM 97,897.19 115,647.92 695,774.81 909,319.92 18.3
Total 1,032,820.12 1,332,647.79 2,608,119.84 4,973,587.75 100.00
Note: For Aquaculture, Figures may not add up to the totals due to rounding off.
Region Commercial Aquaculture TotalMunicipal
53 External Trade
Commodity/Kind Quantity
(MT) ('000 $) ('000 Pesos)
2. Seaweeds 46,252 212,125 9,138,326
Seaweeds and Other Algae
Eucheuma Chips 3,089 5,674 244,449 China, People'S Republic Of 965 1,300 56,008 France 706 1,226 52,833 Taiwan (Republic Of China) 14 25 1,098 Korea, Republic Of South 496 363 15,642 Spain 393 1,465 63,124 Others 515 1,294 55,743
Other Eucheuma 14,108 7,511 323,592 China, People'S Republic Of 5,161 2,144 92,366 Others 8,948 5,367 240,243
Seaweeds, Fresh, Chilled/Frozen or Dried 9,085 42,964 1,860,619 United States Of America 1,669 6,607 284,627 Japan 57 406 17,491 Spain 1,040 6,524 281,048 China, People'S Republic Of 1,992 2,344 100,989 Others 4,326 27,083 1,176,465
Carrageenan 19,877 155,699 6,707,504 United States Of America 4,234 31,748 1,367,690 Uk Great Britain And N. Ireland 1,016 7,167 308,762 Belgium 2,147 16,019 690,092 Germany 1,274 10,796 465,089 France 1,087 7,618 328,166 Canada 183 1,424 61,336 Mexico 740 5,135 221,216
Australia 683 5,023 216,391 Denmark 1,404 12,794 551,183
China, People'S Republic Of 474 2,811 121,096 Others 6,635 55,164 2,376,483
Kelp Powder 85 43 1,858 Japan 85 43 1,858
FOB Value

52
3. Major Destination of Top Three Fishery Exports by Kind, Quantity and Value, 2011
Commodity/Kind Quantity(MT) ('000 $) ('000 Pesos)
1. Tuna 76,888 294,114 12,670,439
Fresh/chilled/frozen 18,800 83,080 3,579,070 Japan 2,224 18,952 816,448 U S A 2,400 23,922 1,030,551 Indonesia 110 303 13,039 Thailand 2,495 4,883 210,351 China, People'S Republic Of 446 1,387 59,735 France 685 1,745 75,165
Taiwan 41 541 23,291 Uk Great Britain And N. Ireland 124 416 17,939 Germany 82 710 30,601 Vietnam 1,097 3,263 140,550 Others 9,095 26,959 1,161,402
Prepared/Preserved 58,071 210,866 9,084,115 U S A 19,742 73,946 3,185,593 Canada 981 3,856 166,106
Japan 1,248 6,867 295,809 South Africa 164 629 27,080 Germany 11,977 42,149 1,815,777 Taiwan 112 291 12,541 United Kingdom 8,992 30,220 1,301,867 Netherlands 2,351 7,777 335,036 Kuwait 917 3,167 136,418 Others 11,587 41,966 1,807,889
Dried/Smoked 17 162 7,254 Australia 12 111 4,773 New Zealand 5 51 2,197
FOB Value
21 Fisheries Contribution to the Economy
F.a. Value of Fish Production, by Sector and Region, 2011 (in '000 P)
% shareto total
NCR 4,843,743.11 609,039.40 142,802.94 5,595,585.45 2.5 CAR ‐ 93,614.54 243,444.87 337,059.41 0.2 I 256,041.81 3,300,972.11 9,273,320.00 12,830,333.92 5.7 II 1,094,538.13 2,575,681.35 982,469.72 4,652,689.20 2.1 III 290,772.46 3,068,022.72 24,031,605.94 27,390,401.12 12.2 IV‐A 5,498,447.78 4,695,318.33 10,095,672.32 20,289,438.43 9.0 IV‐B 1,900,070.02 9,451,955.65 4,717,902.57 16,069,928.24 7.2 V 3,191,283.71 8,719,099.79 2,319,483.01 14,229,866.51 6.3 VI 7,167,746.97 11,728,547.81 8,709,769.50 27,606,064.28 12.3 VII 2,385,352.76 3,770,435.28 1,529,868.53 7,685,656.57 3.4 VIII 3,995,970.33 7,142,452.61 2,395,842.63 13,534,265.57 6.0 IX 8,948,174.27 7,000,624.98 5,053,855.31 21,002,654.56 9.3 X 2,360,018.34 3,067,380.72 6,528,697.23 11,956,096.29 5.3 XI 1,115,298.27 1,808,780.86 2,036,993.40 4,961,072.53 2.2 XII 11,747,485.10 2,672,763.00 1,977,765.73 16,398,013.83 7.3 CARAGA 405,405.66 4,570,093.01 601,281.65 5,576,780.32 2.5 ARMM 3,422,672.29 5,800,847.68 5,355,652.69 14,579,172.66 6.5
Total 58,623,021.01 80,075,629.84 85,996,428.04 224,695,078.89 100.00
TotalRegion Commercial Municipal Aquaculture

22
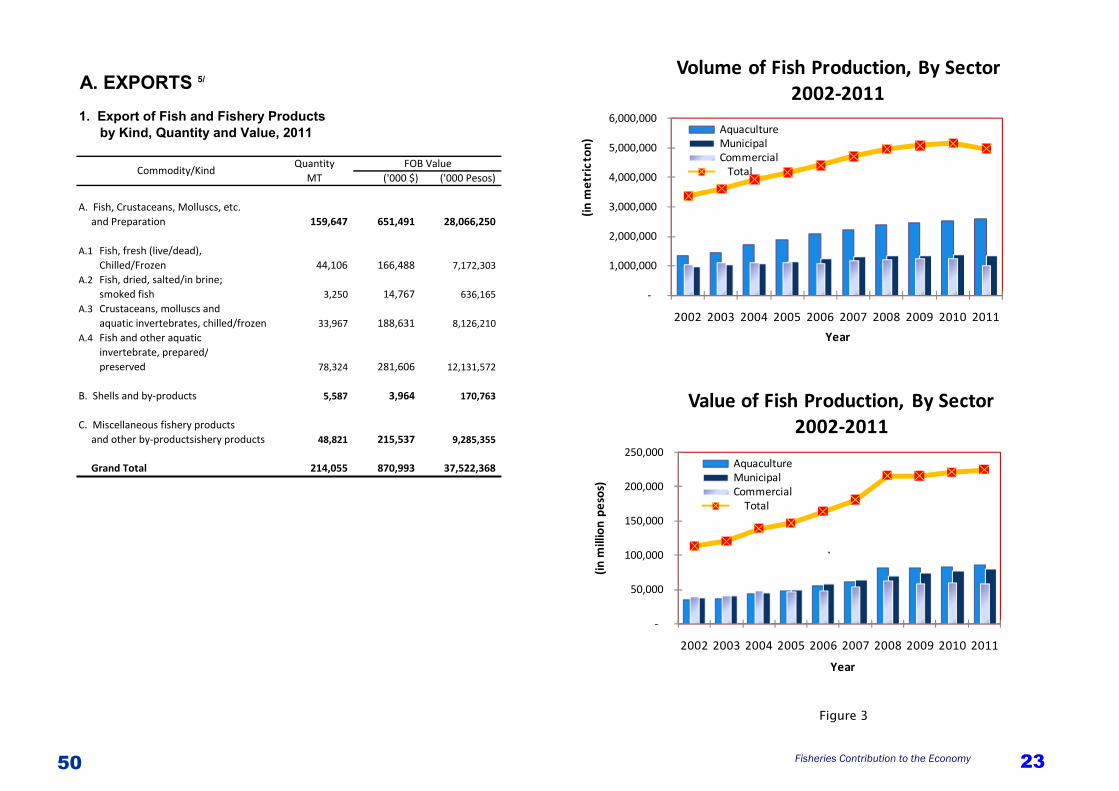
1. Volume of Fish Production (in MT)
Year Aquaculture Municipal Commercial Total
2011 2,608,119.84 1,332,647.79 1,032,820.12 4,973,587.8 2010 2,545,967.13 1,371,389.78 1,242,101.76 5,159,458.7 2009 2,477,392.03 1,348,643.97 1,253,940.98 5,079,977.0 2008 2,407,697.92 1,332,986.38 1,226,204.88 4,966,889.2 2007 2,214,826.18 1,304,356.47 1,192,069.78 4,711,252.4 2006 2,092,275.8 1,235,528.8 1,080,667.7 4,408,472.3 2005 1,895,847.3 1,132,046.3 1,133,976.2 4,161,869.8 2004 1,717,026.7 1,080,764.3 1,128,382.4 3,926,173.4 2003 1,454,503.4 1,055,143.0 1,109,636.0 3,619,282.4 2002 1,338,393.0 988,938.0 1,042,193.0 3,369,524.0
2,829,520.0
2. Value of Fish Production (in '000 P)
Year Aquaculture Municipal Commercial Total
2011 85,996,428.0 80,075,629.84 58,623,021.01 224,695,078.9 2010 82,857,454.5 77,736,463.7 60,456,931.3 221,050,849.5
2009 81,493,357.5 75,383,741.5 58,704,969.4 215,582,068.3 2008 81,669,480.6 70,973,918.9 63,170,103.2 215,813,502.7
2007 61,597,274.2 64,210,385.6 54,737,468.3 180,545,128.2 2006 55,671,892.8 59,146,569.7 48,555,921.0 163,374,383.5 2005 49,169,787.9 49,950,423.5 47,272,737.5 146,392,948.9 2004 44,822,257.0 45,674,851.6 48,349,268.7 138,846,377.3 2003 37,199,123.0 40,664,303.0 42,002,900.0 119,866,326.0 2002 35,418,183.0 38,158,871.0 39,681,164.0 113,258,218.0 2001 36,634,345.0 34,221,731.0 36,088,640.0 106,944,716.0
G. Fish Production, by Sector 2002-2011
51 External Trade
2. Major Fishery Exports in Terms of Value, 2011 Commodity/Kind Quantity FOB Value
MT ('000 $) ('000 Pesos)
1. Tuna 76,888 294,114 12,670,439 Fresh/chilled/frozen (excludes fillet) 18,800 83,080 3,579,070 Smoked 17 168 7,254
Prepared/preserved 58,071 210,866 9,084,115
2. Seaweeds 46,252 212,125 9,138,326
Seaweeds and other Algae, nes. 23,286 50,751 2,186,373
Seaweeds for human consumption 3,089 5,674 244,449 Carrageenan 19,877 155,699 6,707,504
3. Shrimps/Prawns 6,715 60,497 2,606,222 Fresh/ chilled or frozen, nes 6,584 59,047 2,543,765 Dried 129 1,437 61,891 Prepared and preserved 2 13 566
4. Crabs/crabs fat & crab meat 6,164 58,228 2,508,479 Live, Frozen/Fresh or Chilled 4,240 27,350 1,178,244 Crab fat (Prepared/presrd) 181 1,774 76,410 Crab meat (Prepared/presrd 1,743 29,105 1,253,825
5. Octopus 9,577 36,902 1,589,756
Live, Fresh or chilled 68 221 9,519
Dried, salted or in brine 25 180 7,753
Frozen 9,484 36,501 1,572,484 6. Grouper 6,023 21,751 937,052
Live (other than fry) ‐ ‐ ‐
For breeding, live ‐ ‐ ‐ Breeder 6,019 21,745 936,772
Other than for breeding 4 6 280 7. Squid and Cuttlefish 5,704 23,016 991,542
Live 1 1 63 Fresh/chilled/frozen/dried 5,489 22,363 963,408 Prepared/preserved 214 652 28,071
8. Ornamental Fish, Live 5,503 6,650 286,476
9. Roundscad 753 1,954 84,174 Frozen 635 1,597 68,780 Smoked 114 340 14,649
Dried 4 17 745
10. Sea Cucumber, Dried 730 8,228 354,471
Total major commodities 164,309 723,467 31,166,937
Total of other commodities 49,746 147,526 6,355,431
Grand Total 214,055 870,993 37,522,368 a/ - volume less than 1 metric ton
50
A. EXPORTS 5/
1. Export of Fish and Fishery Products by Kind, Quantity and Value, 2011
QuantityMT ('000 $) ('000 Pesos)
A. Fish, Crustaceans, Molluscs, etc. and Preparation 159,647 651,491 28,066,250
A.1 Fish, fresh (live/dead),Chilled/Frozen 44,106 166,488 7,172,303
A.2 Fish, dried, salted/in brine;smoked fish 3,250 14,767 636,165
A.3 Crustaceans, molluscs andaquatic invertebrates, chilled/frozen 33,967 188,631 8,126,210
A.4 Fish and other aquatic invertebrate, prepared/preserved 78,324 281,606 12,131,572
B. Shells and by‐products 5,587 3,964 170,763
C. Miscellaneous fishery products and other by‐productsishery products 48,821 215,537 9,285,355
Grand Total 214,055 870,993 37,522,368
Commodity/KindFOB Value
23 Fisheries Contribution to the Economy
Figure 3
‐
1,000,000
2,000,000
3,000,000
4,000,000
5,000,000
6,000,000
2002 2003 2004 2005 2006 2007 2008 2009 2010 2011
(in m
etri
c ton
)
Year
Volume of Fish Production, By Sector 2002‐2011
AquacultureMunicipalCommercial
Total
‐
50,000
100,000
150,000
200,000
250,000
2002 2003 2004 2005 2006 2007 2008 2009 2010 2011
(in m
illio
n pe
sos)
Year
Value of Fish Production, By Sector 2002‐2011
AquacultureMunicipalCommercial
Total
`

24
Figure 4
4,400
4,600
4,800
5,000
5,200
2007 2008 2009 2010 2011
Quantity (in '000 MT)
Year
Five Year Fish Production, Trend 2007‐2011
H. Five Year Fish Production, Trend 2007-2011
Quantity % Increase/ Value % Increase/ (MT) (Decrease) ('000 P) (Decrease)
2011 4,973,588 (3.6) 224,695,079 1.6 2010 5,159,459 1.6 221,050,850 2.5 2009 5,079,977 2.3 215,582,068 (0.1) 2008 4,966,889 5.4 215,813,503 19.5 2007 4,711,252 6.9 180,545,128 10.5
, 6 ,8 0 6,39 ,9 9
Year
49
External Trade

48
NUMBER OF COMMERCIAL FISHING OPERATORS
AND VESSELS, BY REGION, AS OF 2007 9/
Region No. of Operators No. of Vessels
NCR 138 758CAR 4 6I 36 74II 68 111III 50 137IV‐A 153 226IV‐B 259 455V 248 387VI 238 667VII 278 565VIII 240 350IX 100 454X 93 136XI 89 269XII 323 1717CARAGA 31 41ARMM 10 18
TOTAL 2,358 6,371
25
Aquaculture Production, 2011
This includes production from the following:
• Brackishwater fishpond • Freshwater fishpond • Fish pen and fish cage in fresh and marine
waters • Mariculture of oyster, mussel and seaweeds
26
A. S
UM
MA
RY
OF
AQU
ACU
LTU
RE
PRO
DU
CTI
ON
BY
CU
LTU
RE
ENVI
RO
NM
ENT
AND
REG
ION
, 201
1
(In
Met
ric T
ons)
Oys
ter
Rice
Fish‐
Fish‐
Mus
sel a
ndS
F R
Fish
pond
pond
Seaw
eed
NCR
2,70
980
1.9
....
802
..47
4.9
1176
.21
1,65
1..
..0
256.
0
..
..CA
R 2,
676
....
..0
1765
.17
911.
01..
2,67
6..
..0
‐
..
..
I10
7,56
219
865.
3123
0.06
787.
0520
,882
9237
.64
24.7
60.
089,
262
6083
8.56
1130
5.7
72,1
445,
254.
9
15.4
22.
72
II14
,073
3167
.48
108.
59..
3,27
679
85.3
426
6.58
..8,
252
0.28
..0
2,41
6.5
12
8.35
..
III21
2,37
188
625.
280.
25..
88,6
2611
3530
.44
0.93
..11
3,53
133
66.3
7..
3,36
66,
736.
3
64.7
246
.6
IV‐A
205,
243
1507
2.01
....
15,0
7213
44.3
387
244.
3147
317.
913
5,90
70.
67..
154
,263
.5
....
IV‐B
488,
851
4588
.91
....
4,58
962
8.09
....
628
442.
81..
443
483,
190.
8
..
..
V76
,323
8007
.46
....
8,00
716
55.0
575
79.9
8..
9,23
522
.78
199.
3122
258
,858
.2
....
VI17
9,85
085
676.
167.
1829
.22
85,7
1315
11.3
9..
0.3
1,51
220
5.78
921.
931,
128
91,4
89.2
5.
043.
6
VII
147,
226
7969
.86
9.22
..7,
979
163.
526
..17
043
8.87
35.7
147
513
8,59
1.7
11.3
5..
VIII
50,3
3785
77.4
248
.18
12.2
38,
638
297.
0844
.711
.36
353
4807
.542
.46
4,85
036
,496
.1
....
IX27
6,08
320
898.
150.
57..
20,8
9916
0.15
..4.
7216
511
5.78
..11
625
4,90
3.3
....
X73
,404
2748
1.11
....
27,4
8195
0.99
16.3
..96
723
33.3
4..
2,33
342
,620
.6
1.52
..
XI26
,130
4227
.81
56.4
80.
934,
285
2117
.81
1.55
16.4
92,
136
8306
.390
43.8
417
,350
2,35
9.3
..
..
XII
26,0
2086
57.1
....
8,65
793
5.53
1537
.77
1196
8.1
14,4
4124
54.3
4..
2,45
444
9.0
18.6
5..
CARA
GA
23,4
8721
42.2
343.
712.
322,
488
144.
9489
.39
..23
434
1.01
21.8
936
320
,401
.6
....
ARM
M69
5,77
537
03.8
6..
..3,
704
217.
6125
3.39
5042
.49
5,51
310
5.11
1.81
107
686,
450.
5
..
..
TOTA
L2,
608,
120
309,
462.
0280
4.23
832
311,
098
142,
645
98,4
5265
,538
306,
634
83,7
79.5
21,5
7310
5,35
21,
884,
737
245.
152
.9
Not
e: F
igur
es m
ay n
ot a
dd u
p to
the
tota
ls d
ue to
roun
ding
off
.
Fish
cag
eTo
tal
Aqu
acul
ture
Fish
cag
eFi
sh
pen
Regi
onBr
acki
shw
ater
Fres
hwat
erM
arin
e W
ater
s
Tota
lFi
sh p
enTo
tal
Fish
cag
eFi
sh p
enTo
tal
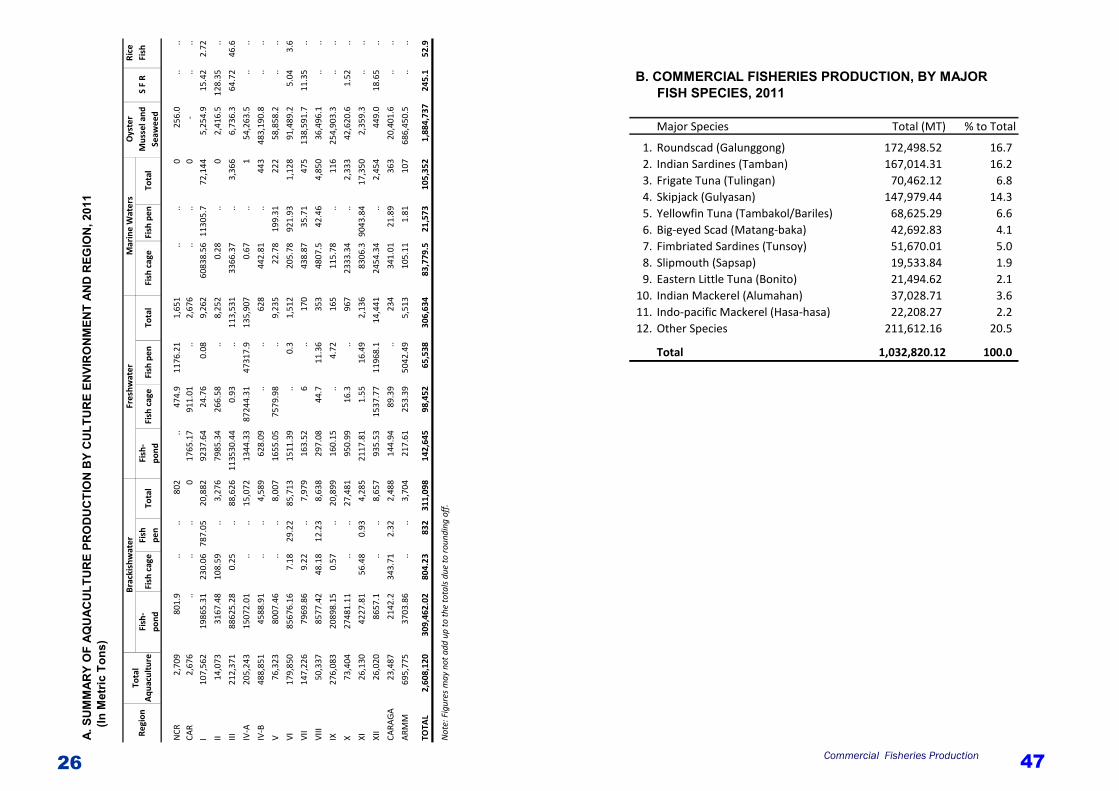
47 Commercial Fisheries Production
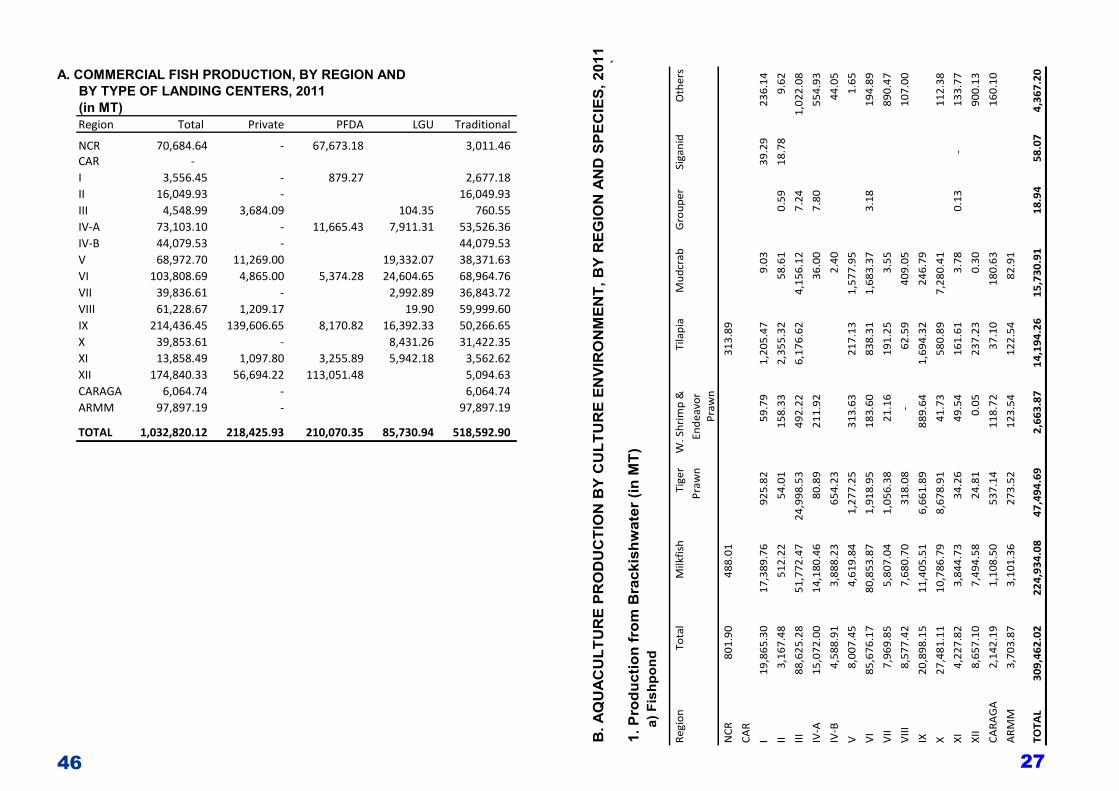
B. COMMERCIAL FISHERIES PRODUCTION, BY MAJOR FISH SPECIES, 2011
Major Species Total (MT) % to Total
1. Roundscad (Galunggong) 172,498.52 16.7 2. Indian Sardines (Tamban) 167,014.31 16.2 3. Frigate Tuna (Tulingan) 70,462.12 6.8 4. Skipjack (Gulyasan) 147,979.44 14.3 5. Yellowfin Tuna (Tambakol/Bariles) 68,625.29 6.6 6. Big‐eyed Scad (Matang‐baka) 42,692.83 4.1 7. Fimbriated Sardines (Tunsoy) 51,670.01 5.0 8. Slipmouth (Sapsap) 19,533.84 1.9 9. Eastern Little Tuna (Bonito) 21,494.62 2.1
10. Indian Mackerel (Alumahan) 37,028.71 3.6 11. Indo‐pacific Mackerel (Hasa‐hasa) 22,208.27 2.2 12. Other Species 211,612.16 20.5
Total 1,032,820.12 100.0
46
A. COMMERCIAL FISH PRODUCTION, BY REGION AND BY TYPE OF LANDING CENTERS, 2011 (in MT)Region Total Private PFDA LGU Traditional
NCR 70,684.64 ‐ 67,673.18 3,011.46 CAR ‐ I 3,556.45 ‐ 879.27 2,677.18 II 16,049.93 ‐ 16,049.93 III 4,548.99 3,684.09 104.35 760.55 IV‐A 73,103.10 ‐ 11,665.43 7,911.31 53,526.36 IV‐B 44,079.53 ‐ 44,079.53 V 68,972.70 11,269.00 19,332.07 38,371.63 VI 103,808.69 4,865.00 5,374.28 24,604.65 68,964.76 VII 39,836.61 ‐ 2,992.89 36,843.72 VIII 61,228.67 1,209.17 19.90 59,999.60 IX 214,436.45 139,606.65 8,170.82 16,392.33 50,266.65 X 39,853.61 ‐ 8,431.26 31,422.35 XI 13,858.49 1,097.80 3,255.89 5,942.18 3,562.62 XII 174,840.33 56,694.22 113,051.48 5,094.63 CARAGA 6,064.74 ‐ 6,064.74 ARMM 97,897.19 ‐ 97,897.19
TOTAL 1,032,820.12 218,425.93 210,070.35 85,730.94 518,592.90
27
B. A
QU
AC
ULT
UR
E P
RO
DU
CTI
ON
BY
CU
LTU
RE
EN
VIR
ON
ME
NT,
BY
RE
GIO
N A
ND
SP
EC
IES
, 201
1 `1.
Pro
duct
ion
from
Bra
ckis
hwat
er (i
n M
T)
a) F
ishp
ond
Regi
onTo
tal
Milk
fish
Tige
rW
. Shr
imp
&Ti
lapi
aM
udcr
abG
roup
er
Siga
nid
Oth
ers
Praw
nEn
deav
or
Praw
n
NCR
801.
9048
8.01
31
3.89
CAR
I19
,865
.30
17,3
89.7
6
92
5.82
59.7
9
1,20
5.47
9.
03
39.2
9
23
6.14
II3,
167.
4851
2.22
54
.01
15
8.33
2,35
5.32
58
.61
0.59
18.7
8
9.
62
III88
,625
.28
51,7
72.4
7
24
,998
.53
492.
22
6,
176.
62
4,15
6.12
7.24
1,02
2.08
IV‐A
15,0
72.0
014
,180
.46
80.8
9
211.
92
36
.00
7.80
554.
93
IV‐B
4,58
8.91
3,88
8.23
654.
23
2.
40
44.0
5
V8,
007.
454,
619.
84
1,
277.
25
313.
63
21
7.13
1,57
7.95
1.65
VI
85,6
76.1
780
,853
.87
1,91
8.95
18
3.60
838.
31
1,
683.
37
3.
18
19
4.89
VII
7,96
9.85
5,80
7.04
1,05
6.38
21
.16
19
1.25
3.55
89
0.47
VIII
8,57
7.42
7,68
0.70
318.
08
‐
62
.59
40
9.05
107.
00
IX20
,898
.15
11,4
05.5
1
6,
661.
89
889.
64
1,
694.
32
246.
79
X27
,481
.11
10,7
86.7
9
8,
678.
91
41.7
3
580.
89
7,
280.
41
11
2.38
XI4,
227.
823,
844.
73
34
.26
49
.54
16
1.61
3.78
0.
13
‐
133.
77
XII
8,65
7.10
7,49
4.58
24.8
1
0.05
237.
23
0.
30
900.
13
CARA
GA
2,14
2.19
1,10
8.50
537.
14
11
8.72
37.1
0
180.
63
16
0.10
ARM
M3,
703.
873,
101.
36
27
3.52
123.
54
12
2.54
82.9
1
TOTA
L30
9,46
2.02
224,
934.
0847
,494
.69
2,66
3.87
14,1
94.2
615
,730
.91
18.9
458
.07
4,36
7.20

28
b) Fish cage
Region Total Milkfish Tilapia Grouper Siganid Others
NCR
CAR
I 230.06 179.31 19.4 0.86 30 0.49
II 108.58 26.38 69.98 1.64 9.15 1.43
III 0.25 0.25
IV‐A
IV‐B
V
VI 7.17 6.44 0.73
VII 9.22 8.97 0.25
VIII 48.18 38.06 10.12
IX 0.56 0.21 0.35
X
XI 56.48 56.48
XII
CARAGA 343.71 343.71
ARMM
TOTAL 804.23 652.91 89.37 9.41 39.15 13.38
a/ ‐ Volume less than .01 metric ton
45
Commercial Fisheries Production, 2011
Fishing with the use of fishing vessels more than 3 gross tons.

44
C. NUMBER OF MUNICIPAL FISHING BANCAS,
BY REGION, 2000 8/
Region Total Motorized Non‐Motorized
CAR 660 49 611
I 17,678 11,641 6,037
II 3,304 1,502 1,802
III 27,038 18,375 8,663
IV 69,927 26,569 43,358
V 54,715 19,453 35,262
VI 41,808 16,234 25,574
VII 56,142 19,100 37,042
VIII 58,068 16,255 41,813
IX 45,650 13,280 32,370
X 9,041 2,472 6,569
XI 24,099 11,382 12,717
XII 10,759 2,671 8,088
XIII 31,283 11,202 20,081
ARMM 19,635 7,442 12,193
Total 469,807 177,627 292,180
Percent
% 100 38 62
29 Aquaculture Production
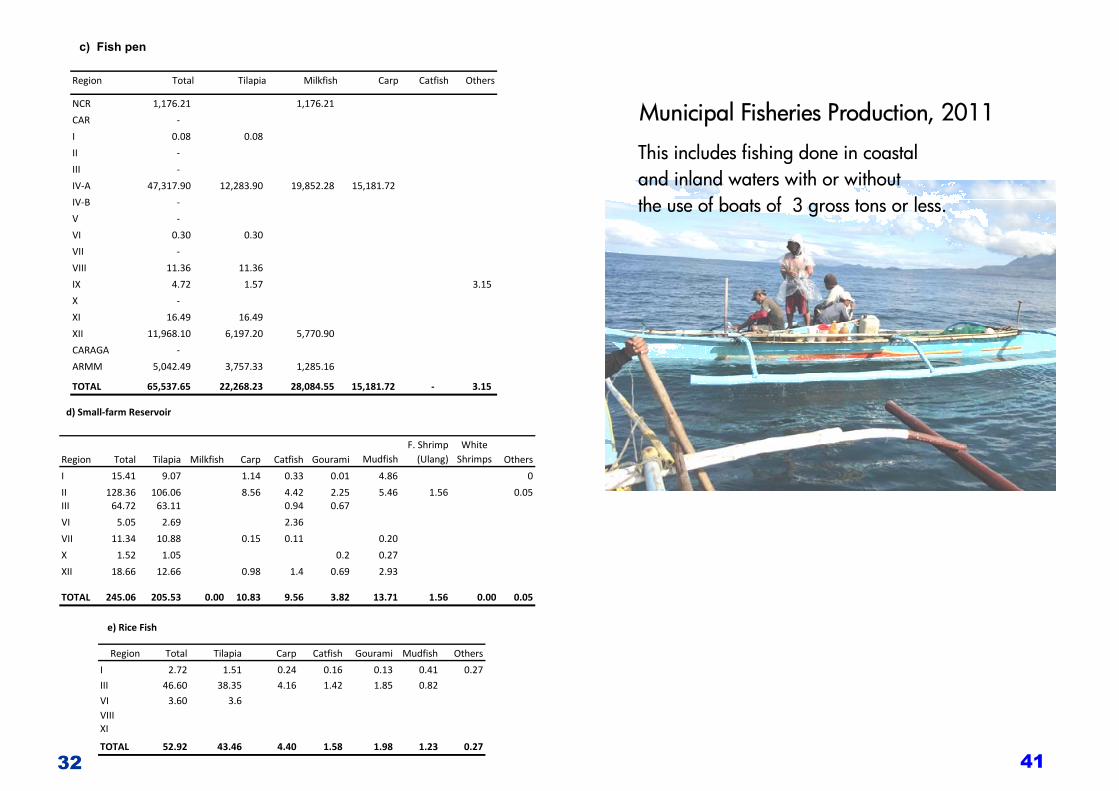
c) Fish pen
Region Total Milkfish Siganid Grouper Tilapia Others
NCR
CAR
I 787.04 739.45 1.3 0.3 44.73 1.26
II
III
IV‐A
IV‐B
V
VI 29.22 29.02 0.2
VII
VIII 12.23 12.23
IX
X
XI 0.93 0.79 0.09 0.01 0.04
XII
CARAGA 2.32 1.85 0.05 0.42
ARMM
TOTAL 831.74 783.35 1.43 0.32 45.15 1.49

30
2. Production from Freshwater (in MT)
a) Fishpond
Region Total Tilapia Milkfish Carp Catfish Mudfish GouramiFresh‐water Others
Shrimp (Ulang)
NCR
CAR 1,765.16 1,761.75 0.19 3.22
I 9,237.63 9,142.46 2.11 29.9 5.09 56.78 1.29
II 7,985.33 7,880.95 11.05 43.78 33.34 1.34 0.57 14.3
III 113,530.44 111,574.14 198.6 1011.37 567.85 160.35 0.14 17.99
IV‐A 1,344.33 1,180.12 31.66 129.5 0.23 0.19 2.63
IV‐B 628.09 627.01 1.08
V 1,655.05 1,552.97 102.08
VI 1,511.39 494.02 1006.6 0.12 10.65
VII 163.51 157.47 0.04 5.74 0.26
VIII 297.09 290.71 0.3 5.2 0.88
IX 160.15 104.37 5.94 49.84
X 950.99 801.57 92.36 1.62 55.36 0.06 0.02
XI 2,117.81 1,599.58 14.93 435.39 61.55 2.12 4.242
XII 935.54 624.70 1.31 232.25 48.24 1.72 27.323
CARAGA 144.95 133.97 5.37 0.19 1.99 3.43
ARMM 217.61 84.43 133.18
TOTAL 142,645.08 138,010.22 2.41 385.41 3,117.93 875.56 166.88 2.86 83.81
43 Municipal Fisheries Production
B. MARINE MUNICIPAL FISH CATCH, BY MAJOR FISH SPECIES, 2011
Major Species Total (MT) % to Total
Frigate Tuna (Tulingan) 62,167.10 5.5 Big‐eyed Scad (Matang‐baka) 76,516.78 6.7 Roundscad (Galunggong) 67,072.43 5.9 Indian Sardines (Tamban) 65,893.11 5.8 Indian Mackerel (Alumahan) 47,282.50 4.2 Anchovies (Dilis) 48,826.95 4.3 Yellowfin tuna (Tambakol) 54,389.17 4.8 Squid (Pusit) 43,508.27 3.8 Fimbriated Sardines (Tunsoy) 47,124.11 4.1 Slipmouth (Sapsap) 41,608.70 3.7 Others 584,560.34 51.3
Total 1,138,949.46 100.0

42
A. MUNICIPAL FISHERIES PRODUCTION, BY REGION, 2011 (in MT)
Region Marine Inland Total
NCR 6,620.98 . 6,620.98 CAR . 983.42 983.42 I 36,246.43 2,899.88 39,146.31 II 22,157.14 12,595.32 34,752.46 III 29,672.78 12,374.27 42,047.05 IV‐A 36,595.38 87,953.79 124,549.17 IV‐B 195,128.77 913.54 196,042.31 V 137,716.63 5,995.30 143,711.93 VI 158,937.88 8,289.79 167,227.67 VII 52,816.90 193.55 53,010.45 VIII 96,869.40 1,342.64 98,212.04 IX 128,110.96 926.91 129,037.87 X 39,013.49 4,114.79 43,128.28 XI 24,067.39 193.24 24,260.63 XII 21,468.38 26,200.23 47,668.61 CARAGA 62,337.76 4,262.93 66,600.69 ARMM 91,189.19 24,458.73 115,647.92
TOTAL 1,138,949.46 193,698.33 1,332,647.79
31 Aquaculture Production
b) Fish cage
Region Total Tilapia Milkfish Carp Catfish Others
NCR 474.89 390.05 84.84
CAR 911.01 911.01
I 24.76 24.76
II 266.58 266.58
III 0.93 0.93
IV‐A 87,244.31 71,478.02 14,104.82 1661.47
IV‐B 0.00
V 7,579.98 7,567.99 11.99
VI 0.00
VII 6.00 6.00
VIII 44.70 44.70
IX 0.00
X 16.30 16.30
XI 1.55 1.54 0.01
XII 1,537.78 1,537.24 0.20 0.33
CARAGA 89.39 89.14 0.25
ARMM 253.39 192.92 60.47
TOTAL 98,451.58 82,527.20 14,165.29 1,758.51 0.00 0.59
32
c) Fish pen
Region Total Tilapia Milkfish Carp Catfish Others
NCR 1,176.21 1,176.21
CAR ‐
I 0.08 0.08
II ‐
III ‐
IV‐A 47,317.90 12,283.90 19,852.28 15,181.72
IV‐B ‐
V ‐
VI 0.30 0.30
VII ‐
VIII 11.36 11.36
IX 4.72 1.57 3.15
X ‐
XI 16.49 16.49
XII 11,968.10 6,197.20 5,770.90
CARAGA ‐
ARMM 5,042.49 3,757.33 1,285.16
TOTAL 65,537.65 22,268.23 28,084.55 15,181.72 ‐ 3.15
d) Small‐farm Reservoir
Region Total Tilapia Milkfish Carp Catfish Gourami MudfishF. Shrimp
(Ulang)White
Shrimps Others
I 15.41 9.07 1.14 0.33 0.01 4.86 0
II 128.36 106.06 8.56 4.42 2.25 5.46 1.56 0.05III 64.72 63.11 0.94 0.67
VI 5.05 2.69 2.36
VII 11.34 10.88 0.15 0.11 0.20
X 1.52 1.05 0.2 0.27
XII 18.66 12.66 0.98 1.4 0.69 2.93
TOTAL 245.06 205.53 0.00 10.83 9.56 3.82 13.71 1.56 0.00 0.05
e) Rice Fish
Region Total Tilapia Carp Catfish Gourami Mudfish Others
I 2.72 1.51 0.24 0.16 0.13 0.41 0.27
III 46.60 38.35 4.16 1.42 1.85 0.82
VI 3.60 3.6VIIIXI
TOTAL 52.92 43.46 4.40 1.58 1.98 1.23 0.27
41
Municipal Fisheries Production, 2011
This includes fishing done in coastal and inland waters with or without the use of boats of 3 gross tons or less.

40
E. AREA AND LOCATION OF MAJOR LAKES IN THE PHILIPPINES 7/
Rank Name of Lakes Area (HA) Location
1 Laguna de Bay 90,000 Laguna & Rizal
2 Lanao 34,700 Marawi City, Lanao del Sur
3 Taal 23,400 Batangas
4 Mainit 14,000 Agusan del Norte & Surigao del Norte
5 Naujan 11,000 Mindoro Oriental
6 Buluan 6,500 Sultan Kudarat & Maguindanao
7 Bato 3,800 Iriga City, Camarines Sur
8 Buhi 1,800 Iriga City, Camarines Sur
9 Dapao 1,000 Ganassi, Lanao del Sur
10 Sebu 964 South Cotabato
11 Wood 792 Pagadian City, Zamboanga del Sur
12 Manguao 643 Taytay, Palawan
13 Baao 600 Baao, Camarines Sur
14 Paoay 420 Ilocos Norte
15 Maughan 314 Gen. Santos City, South Cotabato
16 Danao 260 Camotes Island, Cebu
17 Pagusi 253 Santiago, Agusan del Norte
18 Pinamaloy 252 Maramag, Bukidnon
19 Balut 206 Parang, Maguindanao
20 Imelda/Danao 197 Ormoc City, Leyte
21 Bito 150 Tacloban City, Leyte
22 Nunungan 148 Ganassi, Lanao del Norte
23 Sampaloc 102 San Pablo City, Laguna
*Only those with an area greater than 100 hectares are listed.
Source: Directory of Philippine Wetlands, Volume IIPublished by Asian Wetland Bureau Philippines Foundation Inc. (DENR Library)
33 Aquaculture Production
3. P
rodu
ctio
n fr
om M
arin
e W
ater
s (in
MT)
a)
Fish
cag
e
Regi
onTo
tal
Milk
fish
Gro
uper
Si
gani
dSn
appe
rCa
valla
Mud
Spin
yTi
ger
Tila
pia
Oth
ers
crab
lobs
ter
Praw
n
NCR
CAR
I60
,838
.56
60,8
29.1
9
9.
37
II0.
280.
28
III3,
366.
373,
356.
13
10
.24
IV‐A
0.67
0.67
IV‐B
442.
811.
25
440.
07
0.17
0.
26
1.06
V22
.78
0.73
11
.50
0.
11
10.4
2
0.
02
VI20
5.78
145.
14
50
.80
7.
94
0.63
1.27
VII
438.
8642
8.71
2.77
3.15
0.
16
1.32
2.75
VIII
4,80
7.50
4,43
5.51
371.
99
IX11
5.78
0.32
11
1.04
4.
42
X2,
333.
342,
330.
90
2.
44
XI8,
306.
308,
288.
51
0.
85
15
.15
0.70
1.09
XII
2,45
4.33
2,27
4.65
0.54
0.
56
17
8.58
CARA
GA
341.
0231
5.92
7.81
8.53
8.
76
ARM
M10
5.11
15.4
0
24
.59
10
.83
54.2
9
TOTA
L83
,779
.49
82,4
22.3
61,
022.
0934
.79
8.36
23.4
90.
0063
.07
0.00
2.02
203.
30

34
b) Fish pen
Region Total Milkfish Grouper Siganid Snapper Cavalla Spiny Tiger Tilapia Others
Lobster Prawn
NCR
CAR
I 11,305.72 11,305.72
II 0.00
III 0.00
IV‐A 0.00
IV‐B 0.00
V 199.31 197.91 1.41
VI 921.93 921.93
VII 35.72 35.24 0.14 0.23 0.04 0.07
VIII 42.46 31.76 10.7
IX 0.00
X 0.00
XI 9,043.83 9,043.29 0.06 0.44 0.06
XII 0.00
CARAGA 21.89 11.9 5.59 4.40ARMM 1.81 1.38 0.43
TOTAL 21,572.67 21,535.84 13.50 16.95 0.04 1.43 4.84 0.00 0.00 0.07
39 Aquaculture Production
D. MAJOR SPECIES PRODUCED IN AQUACULTURE FISHERIES, 2011
Species Quantity (MT) Percent (%)
Seaweeds 1,840,832.86 70.58Milkfish 372,580.80 14.29Tilapia 257,385.44 9.87Shrimps/Prawns 50,158.55 1.92Others 87,162.19 3.34
Total 2,608,119.84 100.00
38
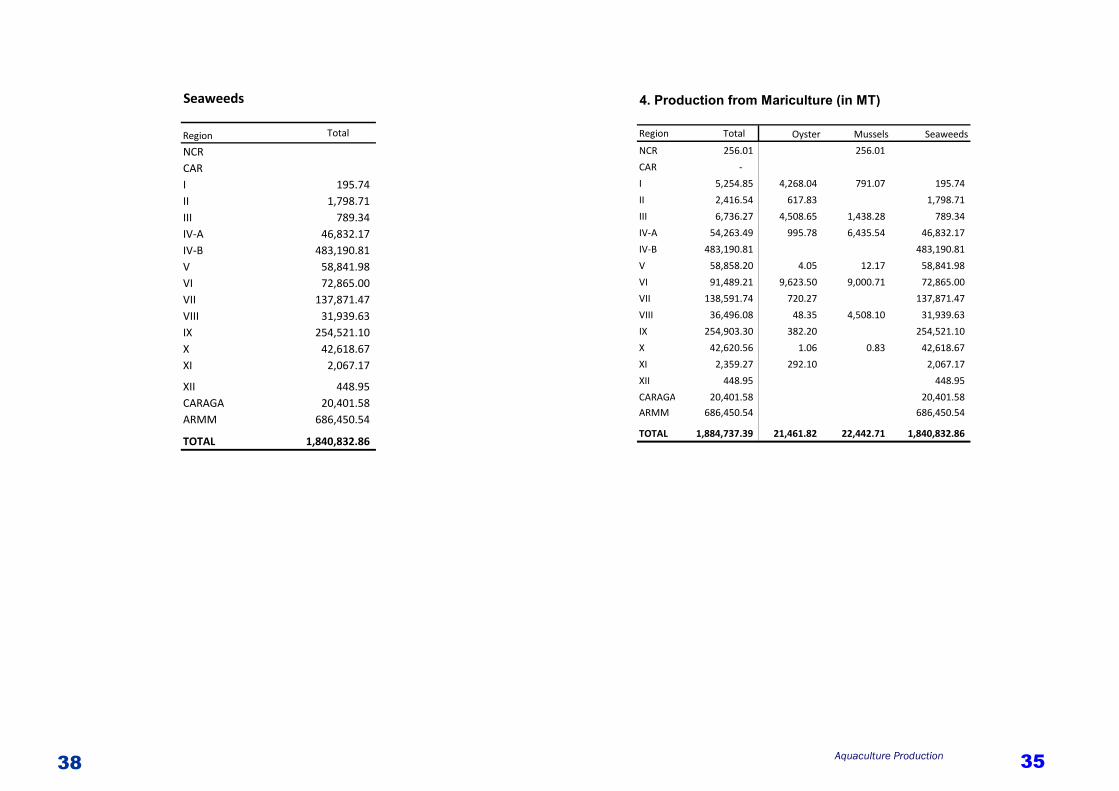
Seaweeds
Region Total
NCRCAR I 195.74 II 1,798.71 III 789.34 IV‐A 46,832.17 IV‐B 483,190.81 V 58,841.98 VI 72,865.00 VII 137,871.47 VIII 31,939.63 IX 254,521.10 X 42,618.67 XI 2,067.17
XII 448.95 CARAGA 20,401.58 ARMM 686,450.54
TOTAL 1,840,832.86
35 Aquaculture Production
4. Production from Mariculture (in MT)
Region Total Oyster Mussels Seaweeds
NCR 256.01 256.01
CAR ‐
I 5,254.85 4,268.04 791.07 195.74
II 2,416.54 617.83 1,798.71
III 6,736.27 4,508.65 1,438.28 789.34
IV‐A 54,263.49 995.78 6,435.54 46,832.17
IV‐B 483,190.81 483,190.81
V 58,858.20 4.05 12.17 58,841.98
VI 91,489.21 9,623.50 9,000.71 72,865.00
VII 138,591.74 720.27 137,871.47
VIII 36,496.08 48.35 4,508.10 31,939.63
IX 254,903.30 382.20 254,521.10
X 42,620.56 1.06 0.83 42,618.67
XI 2,359.27 292.10 2,067.17
XII 448.95 448.95
CARAGA 20,401.58 20,401.58
ARMM 686,450.54 686,450.54
TOTAL 1,884,737.39 21,461.82 22,442.71 1,840,832.86
36
C. A
QU
AC
ULT
UR
E PR
OD
UC
TIO
N O
F M
AJO
R C
OM
MO
DIT
IES
BY
CU
LTU
RE
ENVI
RO
NM
ENT
AN
D B
Y R
EGIO
N, 2
011
(
In M
etric
Ton
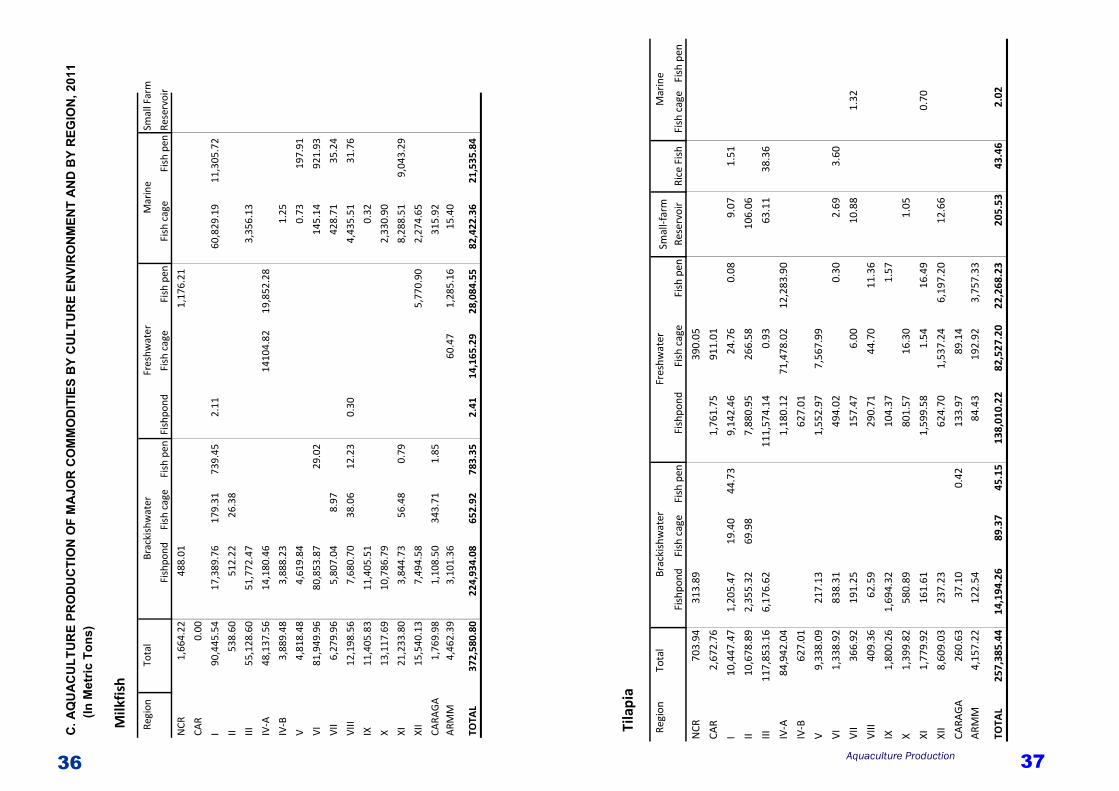
s)
Milk
fish
Regi
onTo
tal
Smal
l Far
m
Fish
pond
Fish
cag
eFi
sh p
enFi
shpo
ndFi
sh c
age
Fish
pen
Fish
cag
eFi
sh p
enRe
serv
oir
NCR
1,66
4.22
488.
01
1,
176.
21
CAR
0.00
I90
,445
.54
17,3
89.7
6
17
9.31
739.
45
2.
11
60,8
29.1
9
11
,305
.72
II53
8.60
512.
22
26
.38
III55
,128
.60
51,7
72.4
7
3,
356.
13
IV‐A
48,1
37.5
614
,180
.46
1410
4.82
19,8
52.2
8
IV‐B
3,88
9.48
3,88
8.23
1.25
V4,
818.
484,
619.
84
0.
73
197.
91
VI81
,949
.96
80,8
53.8
7
29
.02
145.
14
92
1.93
VII
6,27
9.96
5,80
7.04
8.97
428.
71
35
.24
VIII
12,1
98.5
67,
680.
70
38
.06
12
.23
0.30
4,
435.
51
31.7
6
IX11
,405
.83
11,4
05.5
1
0.
32
X13
,117
.69
10,7
86.7
9
2,
330.
90
XI21
,233
.80
3,84
4.73
56.4
8
0.79
8,
288.
51
9,04
3.29
XII
15,5
40.1
37,
494.
58
5,
770.
90
2,27
4.65
CARA
GA
1,76
9.98
1,10
8.50
343.
71
1.
85
315.
92
A
RMM
4,46
2.39
3,10
1.36
60.4
7
1,
285.
16
15
.40
TOTA
L37
2,58
0.80
224,
934.
08
652.
92
78
3.35
2.
41
14,1
65.2
9
28
,084
.55
82,4
22.3
6
21
,535
.84
Brac
kish
wat
erFr
eshw
ater
Mar
ine
37 Aquaculture Production
Tila
pia
Regi
onTo
tal
Fish
pond
Fish
cag
eFi
sh p
enFi
shpo
ndFi
sh c
age
Fish
pen
Fish
cag
eFi
sh p
en
NCR
703.
9431
3.89
39
0.05
CAR
2,67
2.76
1,76
1.75
91
1.01
I10
,447
.47
1,20
5.47
19.4
0
44.7
3
9,
142.
46
24.7
6
0.
08
9.07
1.
51
II10
,678
.89
2,35
5.32
69.9
8
7,88
0.95
26
6.58
106.
06
III11
7,85
3.16
6,17
6.62
111,
574.
14
0.
93
63.1
1
38
.36
IV‐A
84,9
42.0
41,
180.
12
71,4
78.0
2
12
,283
.90
IV‐B
627.
0162
7.01
V9,
338.
0921
7.13
1,
552.
97
7,56
7.99
VI1,
338.
9283
8.31
49
4.02
0.30
2.
69
3.60
VII
366.
9219
1.25
15
7.47
6.00
10
.88
1.32
VIII
409.
3662
.59
290.
71
44
.70
11.3
6
IX1,
800.
261,
694.
32
10
4.37
1.57
X1,
399.
8258
0.89
80
1.57
16.3
0
1.
05
XI1,
779.
9216
1.61
1,
599.
58
1.54
16
.49
0.70
XII
8,60
9.03
237.
23
624.
70
1,
537.
24
6,19
7.20
12.6
6
CARA
GA
260.
6337
.10
0.42
13
3.97
89.1
4
ARM
M4,
157.
2212
2.54
84
.43
19
2.92
3,75
7.33
TOTA
L25
7,38
5.44
14,1
94.2
689
.37
45.1
513
8,01
0.22
82,5
27.2
022
,268
.23
205.
5343
.46
2.02
Mar
ine
Brac
kish
wat
erSm
all‐f
arm
Re
serv
oir
Fres
hwat
er
Rice
Fis
h


