Bureau of Economic Geology Jackson School of Geosciences The University of Texas at Austin
34
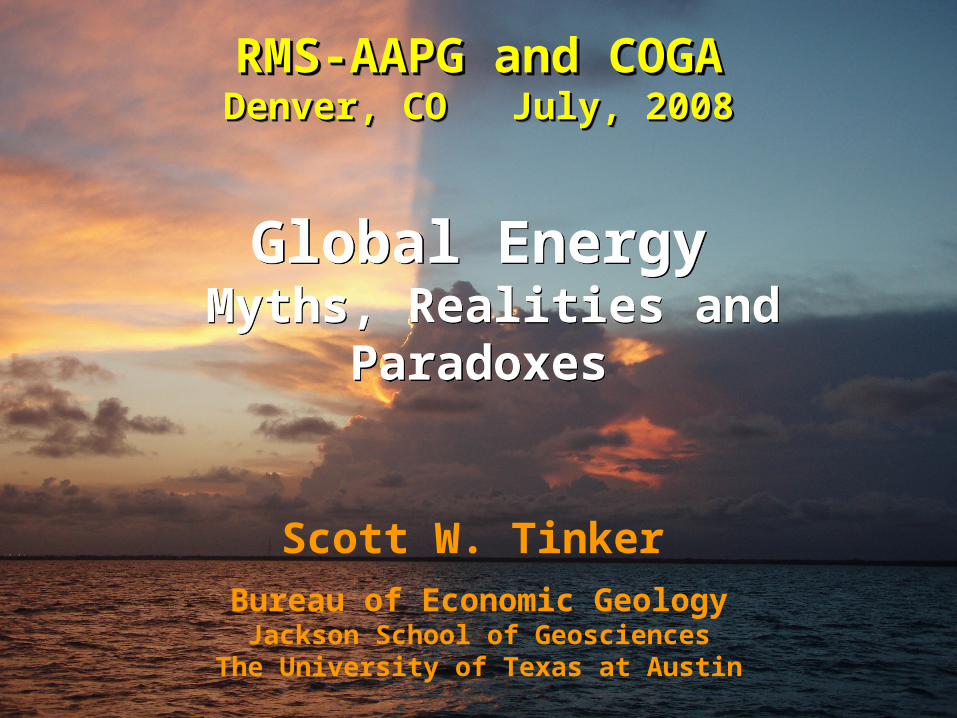
Tinker, 2008 QAd3931x Bureau of Economic Geology Jackson School of Geosciences The University of Texas at Austin Scott W. Tinker Global Energy Myths, Realities and Paradoxes RMS-AAPG and COGA RMS-AAPG and COGA Denver, CO Denver, CO July, 2008 July, 2008
-
Upload
julian-kline -
Category
Documents
-
view
18 -
download
0
description
RMS-AAPG and COGA Denver, COJuly, 2008. Global Energy Myths, Realities and Paradoxes. Scott W. Tinker. Bureau of Economic Geology Jackson School of Geosciences The University of Texas at Austin. The Global Energy Road. Fossil fuels are the bridge to an alternate energy future. - PowerPoint PPT Presentation
Transcript of Bureau of Economic Geology Jackson School of Geosciences The University of Texas at Austin
Tinker, 2008
QAd3931x
Bureau of Economic GeologyJackson School of Geosciences
The University of Texas at Austin
Scott W. Tinker
Global Energy Myths, Realities and Paradoxes
Global Energy Myths, Realities and Paradoxes
RMS-AAPG and COGARMS-AAPG and COGADenver, CODenver, CO July, 2008July, 2008
RMS-AAPG and COGARMS-AAPG and COGADenver, CODenver, CO July, 2008July, 2008
Tinker, 2008
QAd3931x
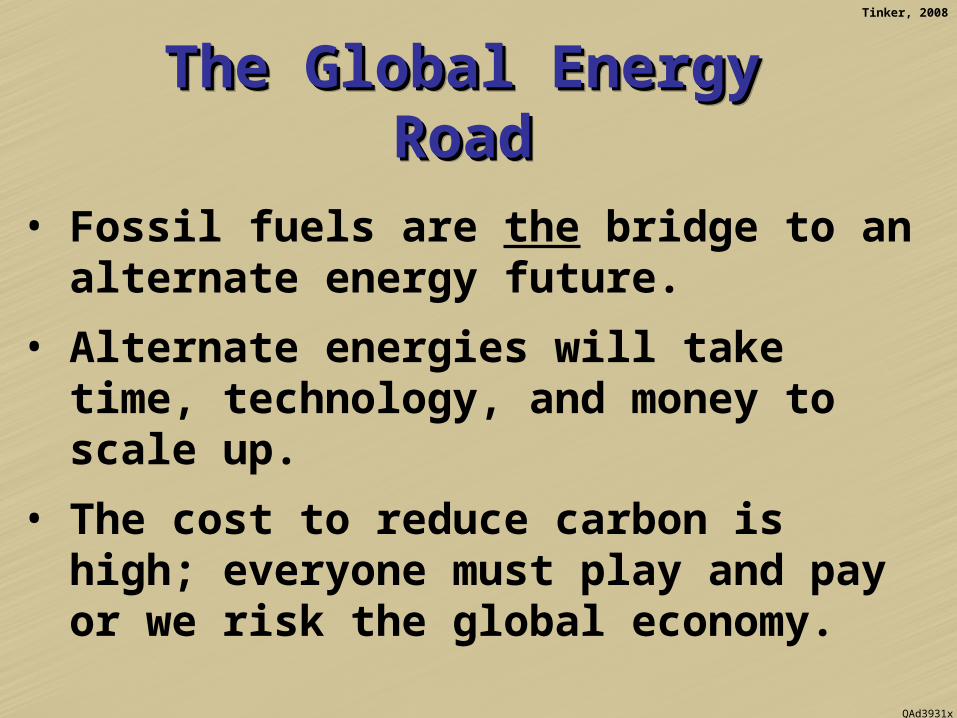
• Fossil fuels are the bridge to an alternate energy future.
• Alternate energies will take time, technology, and money to scale up.
• The cost to reduce carbon is high; everyone must play and pay or we risk the global economy.
The Global Energy RoadThe Global Energy RoadThe Global Energy RoadThe Global Energy Road

Tinker, 2008
QAd3931x
Webster’s Online: Webster’s Online: MythMythWebster’s Online: Webster’s Online: MythMyth
Main Entry: myth Pronunciation: \ˈmith\ Function: noun Etymology: Greek mythos Date: 1830
1 a: a usually traditional story of ostensibly historical events that serves to unfold part of the world view of a people or explain a practice, belief, or natural phenomenon b: parable, allegory
2 a: a popular belief or tradition that has grown up around something or someone; especially : one embodying the ideals and institutions of a society or segment of society <seduced by the American myth of individualism — Orde Coombs>
2 b: an unfounded or false notion

Tinker, 2008
QAd3931x
Webster’s Online: Webster’s Online: ParadoxParadoxWebster’s Online: Webster’s Online: ParadoxParadox
Main Entry: par·a·dox Pronunciation: \ˈper-ə-ˌdäks, ˈpa-rə-\ Function: noun Etymology: Latin paradoxum, from Greek paradoxon, from neuter of paradoxos contrary to expectation, from para- + dokein to think, seem — more at decent Date: 1540
1: a tenet contrary to received opinion
2 a: a statement that is seemingly contradictory or opposed to common sense and yet is perhaps true
2 b: a self-contradictory statement that at first seems true
2 c: an argument that apparently derives self-contradictory conclusions by valid deduction from acceptable premises

Tinker, 2008
QAd3931x
6. “Big Oil” controls the price of oil and gasoline and makes “obscene” profits.
7. Cutting oil imports will stabilize gasoline prices.
8. Global production of oil and natural gas are “peaking” and we are running out of fossil energy soon.
9. All coal is dirty.
10. The cost of energy increasing.
Ten Energy Myths Ten Energy Myths Ten Energy Myths Ten Energy Myths

Tinker, 2008
QAd3931x
Ten Energy Myths Ten Energy Myths Ten Energy Myths Ten Energy Myths
1. The US can be energy independent in the next 25 years.
2. “Renewable energy” can reduce dependence on fossil fuels significantly in the next 25 years.
3. The economy will adapt easily to a rapid, federally imposed energy transition.
4. Energy efficiency and savings (alone) will solve the problem.
5. There is plenty of low cost (conventional) oil ready to be found.

Tinker, 2008
QAd3931x
Crisis/Policy Paradox
Sound energy policy is necessary to prevent an energy crisis, yet crisis is
seemingly necessary to cause policy to be considered.
Energy ParadoxesEnergy ParadoxesEnergy ParadoxesEnergy Paradoxes

Tinker, 2008
QAd3931x
Economy/Carbon Paradox
Emissions from the combustion of fossil fuels enhance global warming which
harms the economy, yet a healthy economy relies on fossil energy today.
or
The road to an alternate (clean) energy future must be paved with fossil energy.
Energy ParadoxesEnergy ParadoxesEnergy ParadoxesEnergy Paradoxes

Tinker, 2008
QAd3931x
Government/Markets Paradox
Government policies are needed to enhance free market behavior.
Energy ParadoxesEnergy ParadoxesEnergy ParadoxesEnergy Paradoxes

Tinker, 2008
QAd3931x
Nationalization/Globalization Paradox
The US should be energy independent in order to remain a global leader in an
interdependent world.
Energy ParadoxesEnergy ParadoxesEnergy ParadoxesEnergy Paradoxes

Tinker, 2008
QAd3931x
Global production of oil and natural gas are
“peaking” and we are running out of fossil
energy soon.
Myth 8Myth 8Myth 8Myth 8

Tinker, 2008
QAd3931x
Global EnergyGlobal EnergyGlobal EnergyGlobal Energy
We depend upon fossil fuels today.
Energy Use (Quadrillion Btu)
0 20 40 60 80 100 120 140 160
Africa
Canada & Mexico
Middle East
Central & South America
Eurasia
Europe
United States
Asia & Oceania
Quadrillion Btu
Data: EIA, October 2007
Oil
Gas
Coal
Nuclear
All Other

Tinker, 2008
QAd3931x
Conventional Oil
Natural Gas
Data from EIA 2007
US Energy MixUS Energy MixUS Energy MixUS Energy Mix
Biom
assCoal
Hydro
Uranium
Transportation
Heat
Electricity
We depend upon fossil fuels today.
US Transportation Energy Demand (2006 Btu)
16407
618
264
4892
2647
1333
611
147
592
688Light-Duty Vehicles
Commercial Light Trucks 1
Buses
Freight Trucks
Air 3
Water
Rail
Lubricants
Pipeline Fuel Natural Gas
Military Use

Tinker, 2008
QAd3931x
0
5,000,000
10,000,000
15,000,000
20,000,000
25,000,000
30,000,000
35,000,000
1950 1955 1960 1965 1970 1975 1980 1985 1990 1995 2000 2005
Glo
bal
An
nu
al P
rod
uct
ion
(m
bo
)
World Oil Production (Thousand Barrels)
0.00
200.00
400.00
600.00
800.00
1,000.00
1,200.00
1,400.00
Glo
bal
Res
erv
es (
bb
o)
World Oil Reserves (Billion Barrels)
15
2025
30
35
40
R/P
Global Reserves and ProductionGlobal Reserves and ProductionGlobal Reserves and ProductionGlobal Reserves and Production
Source: 1980-2007 Energy Information Administration As of January 2008 (www.eia.doe.gov/pub/international/iealf/crudeoilreserves.xls ), 1950-1980 OPEC (http://www.opec.org/library/)
$0.00$10.00$20.00$30.00$40.00$50.00$60.00$70.00$80.00$90.00
$100.00
Oil
Pri
ce (
$20
07)
Oil Price Average in $/bbl Inflation Adjusted 2007

Tinker, 2008
QAd3931x
M
ExxonMobil, 2005. http://www.exxonmobil.com/Corporate/Citizenship/Corp_citizenship_energy_outlook.asp
The Conventional Oil “Wedge”
~35 MMBD new demand
If China and India grow from 1 B/P/Y today to 5 B/P/Y by 2030, it will create 48 MMBD
of new demand
Unconventionals
Plus EOR

Tinker, 2008
QAd3931x
Option Time to Initiate Impact (+10 Yrs)
(Yrs) (MM bpd)
– Enhanced Oil Recovery 5 3– Heavy Oils / Oil Sands 3 8– Shale Oil 10 2– Coal Liquids 4 5– Gas-To-Liquids 3 2– Biofuels 2 1
21after Hirsch et.al, 2005
Options to Conventional Oil Options to Conventional Oil Options to Conventional Oil Options to Conventional Oil
Tinker, 2008
QAd3931x
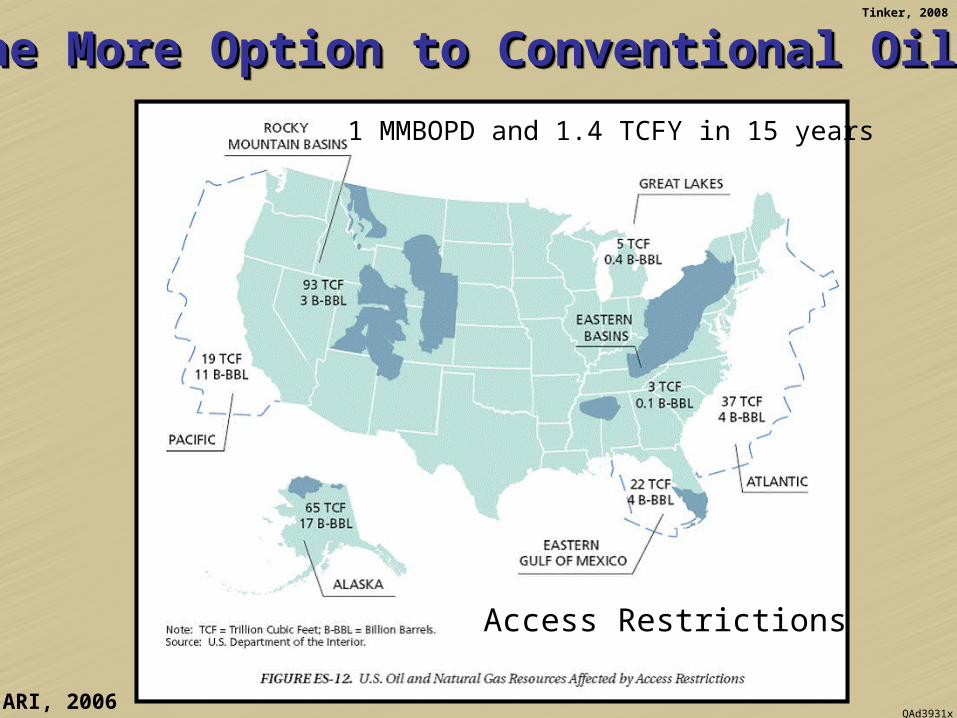
One More Option to Conventional Oil… One More Option to Conventional Oil… One More Option to Conventional Oil… One More Option to Conventional Oil…
1 MMBOPD and 1.4 TCFY in 15 years
ARI, 2006
Access Restrictions

Tinker, 2008
QAd3931x
Global Natural Gas Supply and DemandGlobal Natural Gas Supply and DemandGlobal Natural Gas Supply and DemandGlobal Natural Gas Supply and Demand
50
60
70
80
90
100
110
1980
1981
1982
1983
1984
1985
1986
1987
1988
1989
1990
1991
1992
1993
1994
1995
1996
1997
1998
1999
2000
2001
2002
2003
2004
2005
Year
Nat
ura
l G
as (
Tcf
)
*Supply = world natural gas production & Demand =world natural gas consumption.
Data: EIA, October 2007
SupplyDemand
60
70
R/P (yrs)
Tinker, 2008
QAd3931x
0
5,000
10,000
15,000
20,000
25,000
1949 1954 1959 1964 1969 1974 1979 1984 1989 1994 1999 2004
Year
U.S
. N
atu
ral
Gas
Pro
du
ctio
n (
Bcf
)
Total Natural Gas
Conventional Gas
Difference
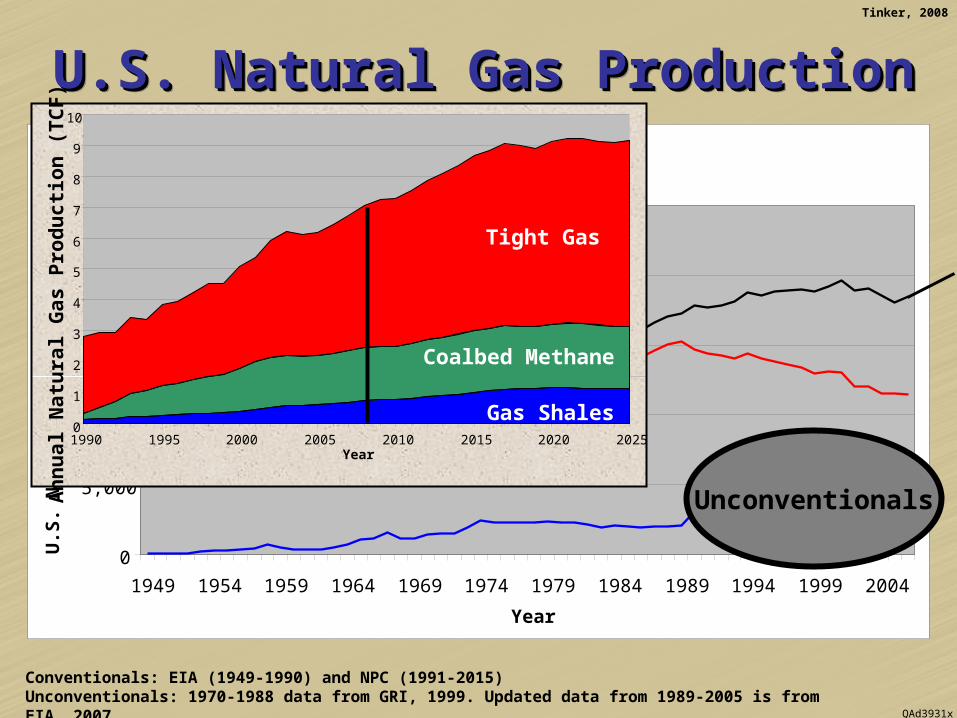
U.S. Natural Gas ProductionU.S. Natural Gas ProductionU.S. Natural Gas ProductionU.S. Natural Gas Production
Conventionals: EIA (1949-1990) and NPC (1991-2015)Unconventionals: 1970-1988 data from GRI, 1999. Updated data from 1989-2005 is from EIA, 2007
0
1
2
3
4
5
6
7
8
9
10
1990 1995 2000 2005 2010 2015 2020 2025Year
An
nu
al
Na
tura
l G
as
Pro
du
cti
on
(T
CF
)
Gas Shales
Coalbed Methane
Tight Gas
Unconventionals

Tinker, 2008
QAd3931x
US Dry Natural Gas ReservesUS Dry Natural Gas ReservesUS Dry Natural Gas ReservesUS Dry Natural Gas Reserves
Source: Energy Information Administration (EIA)
0
50,000
100,000
150,000
200,000
250,000
300,000
350,000
1950 1955 1960 1965 1970 1975 1980 1985 1990 1995 2000 2005
Res
erve
s (B
cf)
Unconventionals
Technology and Ideas

Tinker, 2008
QAd3931x
•Easy to produce (but hard to find!) conventional oil will plateau and then decline; i.e. the conventional oil “plateau”
•Global natural gas production is a few decades away from a plateau
•Easy to find (but hard to produce!) unconventional oil and natural gas are playing a growing role (function of environmental policy, economics and technology)
•Fossil fuel resources combined (oil, natural gas and coal) could provide over two hundred years at current consumption rates
Myth 8 RealitiesMyth 8 RealitiesMyth 8 RealitiesMyth 8 Realities

Tinker, 2008
QAd3931x
Myth 2Myth 2Myth 2Myth 2
“Renewable energy” can reduce dependence on
fossil fuels significantly in the next 25 years.

Tinker, 2008
QAd3931x
QAc9841c
Global Energy ConsumptionGlobal Energy ConsumptionGlobal Energy ConsumptionGlobal Energy Consumption
U.S. Data: Annual Energy Review 1999 (EIA, 2000)World Data: International Energy Annual 1999 (EIA, 2000)
100
80
60
40
20
0
Per
cen
tag
e o
f to
tal
mar
ket
Year
1850 1900 1950 2000
H/C>4 (Natural Gas, Nuclear, All others)
H/C<1 (Wood, Coal)
H/C~2 (Oil)

Tinker, 2008
QAd3931x
1.25% annual demand growth
Historical Data: EIA October 2007: Forecasts: Tinker, 2008
0.0020.0040.0060.0080.00
100.00120.00140.00160.00180.00200.00
1980 1985 1990 1995 2000 2005 2010 2015 2020 2025 2030Glo
bal
En
erg
y C
on
sum
pti
on
(q
uad
s)Petroleum
Natural Gas
Coal
Hydroelectric Nuclear
Biomass, Geothermal, Solar & Wind
0%5%
10%15%20%25%30%35%40%45%50%
% T
ota
l C
on
su
mp
tio
n
1980 1985 1990 1995 2000 2005 2010 2015 2020 2025 2030
Future Global TrendsFuture Global TrendsFuture Global TrendsFuture Global Trends
0
100
200
300
400
500
600
700
1980 1985 1990 1995 2000 2005 2010 2015 2020 2025 2030
Glo
bal
En
erg
y C
on
su
mp
tio
n (
Qu
ad
s)
Unconventional Gas
Unconventionals/Res Growth
1.25% Global Annual Demand Growth
4 8 16 322X
every7 yrs
91% 87% 80%
Sound energy policy is necessary to prevent an energy crisis, yet crisis is seemingly necessary to cause (poor)
policy to be considered.
andThe road to an alternate (clean) energy
future must be paved with fossil energy.

Tinker, 2008
QAd3931x
•Energy is not “renewable”
•One of the great challenges of alternate energy is scale
•Energy transitions take time and are expensive
•Oil is beginning to plateau
•Disruptive breakthroughs in electricity storage and transmission are needed to facilitate alternate energy
Myth 2 RealitiesMyth 2 RealitiesMyth 2 RealitiesMyth 2 Realities

Tinker, 2008
QAd3931x
Myth 1Myth 1Myth 1Myth 1
The US can be energy independent in the
next 25 years.

Tinker, 2008
QAd3931x
US Economy and Oil PriceUS Economy and Oil PriceUS Economy and Oil PriceUS Economy and Oil Price
Nixon Clinton Bush 2 Bush 1 ReaganCarterFord
-4.00
-2.00
0.00
2.00
4.00
6.00
8.00
10.00
1970 1975 1980 1985 1990 1995 2000 2005
Year
GD
P G
row
th (
% p
oint
s at
ann
ual r
ates
)
0
10
20
30
40
50
60
Oil
Do
mes
tic
Wel
lhea
d P
rice
($)
GDP Growth (Percentage points at annual rates)
Crude Oil Domestic Wellhead Price ($2000)
Data: EIA February 2007 and US department of Commerce

Tinker, 2008
QAd3931x
1800 1855 1910 1965 2020
An
nua
l Use
(Q
uad
s)
1
0.1
10
100
Electricity’s RoleElectricity’s RoleElectricity’s RoleElectricity’s Role
Total Energy
After Huber and Mills, 2005. Data: EIA, Annual Review, 2003. US Census Bureau, Historical Statistics of the US Colonial Ties to 1970
Energy used to produce electricity
45Q
Electricity will play an ever greater role in the energy
end use mix.

Tinker, 2008
QAd3931x
Conventional Oil
Natural Gas
Data from EIA 2007
ElectricityElectricityElectricityElectricity
Biom
assCoal
Hydro
Uranium
Transportation
Heat
Imports

Tinker, 2008
QAd3931x
Electricity OptionsElectricity OptionsElectricity OptionsElectricity Options• Natural Gas
– Abundant, reliable, price volatility, and cleaner
– Challenges: Global deliverability (LNG) and Access
• Coal– Abundant, reliable, cheap and dirty
– Challenge: Sequestration (IGCC w/CCS), financing, public perception
• Nuclear– Abundant, reliable, moderate price and cleaner
– Challenges: Waste disposal, security, public perception
• Renewables– Cleaner, less reliable and more expensive
– Challenge: Capacity impacts cost and reliability
• Efficiency– Fuel, lighting, electronics, insulation
– Challenge: Rebound effect

Tinker, 2008
QAd3931x
Global Carbon EmissionsGlobal Carbon EmissionsGlobal Carbon EmissionsGlobal Carbon Emissions
4,000
6,000
8,000
10,000
12,000
1980
1983
1986
1989
1992
1995
1998
2001
2004
An
nu
al
An
thro
po
ge
nic
CO
2 (
mm
T)
NA AfricaEuropeEurasia
ME
Cent & SAAsia & Oceania
2,000
EIA, 2007

Tinker, 2008
QAd3931x
Year
0.00
0.50
1.00
1.50
2.00
2.50
1981
1983
1985
1987
1989
1991
1993
1995
1997
1999
2001
2003
2005
GD
P (
$B20
00)/
CO
2 (M
MT
)
GDP/Carbon EmissionsGDP/Carbon EmissionsGDP/Carbon EmissionsGDP/Carbon Emissions
NA Africa
Europe
Eurasia
ME Cent & SA
Asia & Oceania
Emissions from the combustion of fossil fuels enhance global warming which
harms the economy, yet a healthy economy relies on fossil energy today.
and
Government policies are needed to enhance free market behavior.

Tinker, 2008
QAd3931x
•The world is “flattening;” resource interdependence is becoming the norm
•Independence requires realistic, scalable alternatives, which take time and are very expensive ($ trillions)
•Concerns about climate and security have placed the public sights squarely on fossil energy, especially coal and oil
•Energy and economies are inextricably linked and mandated transitions don’t really work
Myth 1 RealitiesMyth 1 RealitiesMyth 1 RealitiesMyth 1 Realities

Tinker, 2008
QAd3931x
Summary ThoughtsSummary ThoughtsSummary ThoughtsSummary Thoughts
•The Three E Waltz (Energy, Economy, Environment) is a sensitive dance
•Oil and natural gas provide nearly 2/3 of the world’s energy
•We need to be realistic about a carbon constrained world
– It is coming, it will take time, it won’t be cheap
– Everyone needs to play and pay
– Research funding and talent are vital
– Government, private, academic partnerships