Bureau of Customs - The Canadian Chamber of Commerce...
26
Bureau of Customs PORT OF CEBU “Customs Service at its Best”
-
Upload
truongdiep -
Category
Documents
-
view
225 -
download
5
Transcript of Bureau of Customs - The Canadian Chamber of Commerce...
Bureau of Customs
PORT OF CEBU
“Customs Service at its Best”
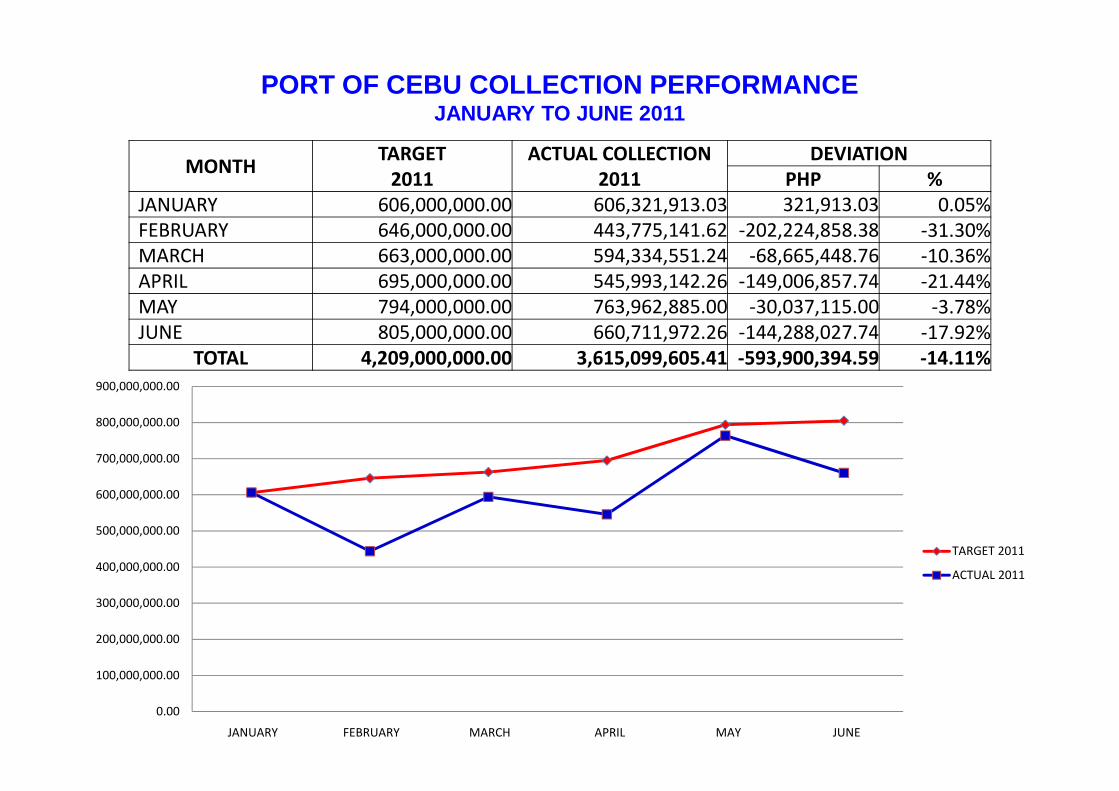
PORT OF CEBU COLLECTION PERFORMANCEJANUARY TO JUNE 2011
MONTHTARGET ACTUAL COLLECTION DEVIATION
2011 2011 PHP %
JANUARY 606,000,000.00 606,321,913.03 321,913.03 0.05%
FEBRUARY 646,000,000.00 443,775,141.62 -202,224,858.38 -31.30%
MARCH 663,000,000.00 594,334,551.24 -68,665,448.76 -10.36%
APRIL 695,000,000.00 545,993,142.26 -149,006,857.74 -21.44%
MAY 794,000,000.00 763,962,885.00 -30,037,115.00 -3.78%
JUNE 805,000,000.00 660,711,972.26 -144,288,027.74 -17.92%
TOTAL 4,209,000,000.00 3,615,099,605.41 -593,900,394.59 -14.11%
900,000,000.00
0.00
100,000,000.00
200,000,000.00
300,000,000.00
400,000,000.00
500,000,000.00
600,000,000.00
700,000,000.00
800,000,000.00
JANUARY FEBRUARY MARCH APRIL MAY JUNE
TARGET 2011
ACTUAL 2011
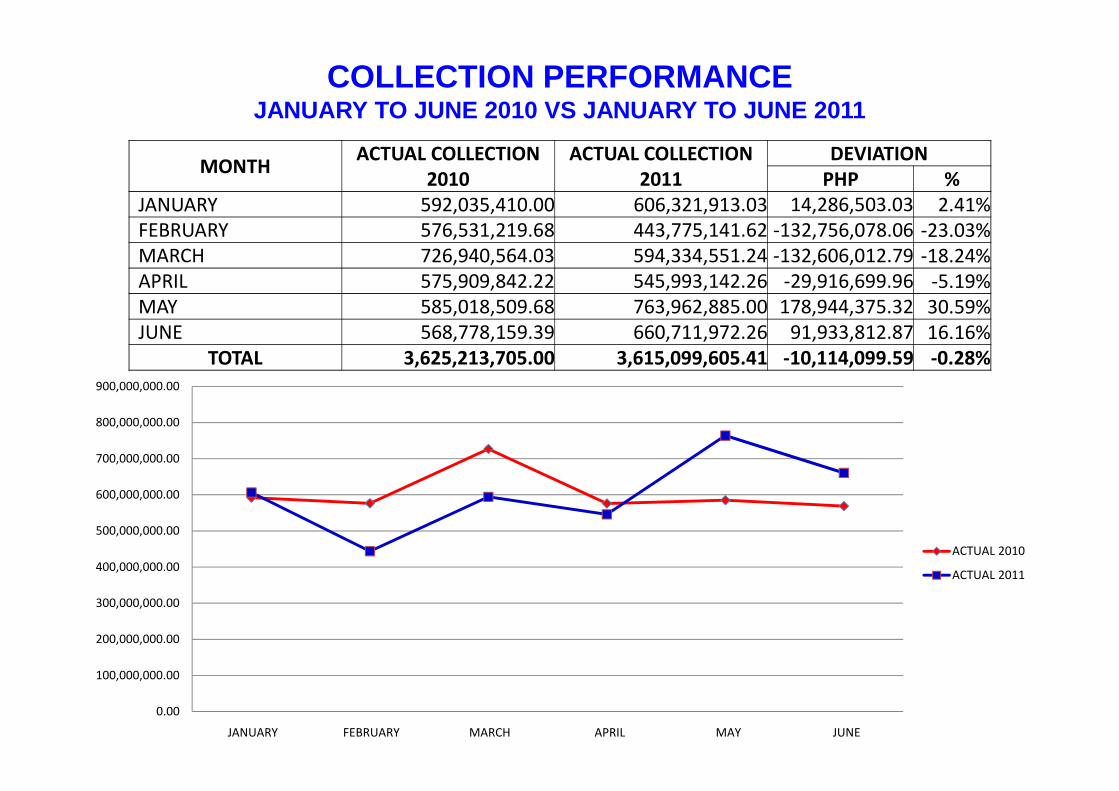
COLLECTION PERFORMANCEJANUARY TO JUNE 2010 VS JANUARY TO JUNE 2011
MONTHACTUAL COLLECTION ACTUAL COLLECTION DEVIATION
2010 2011 PHP %
JANUARY 592,035,410.00 606,321,913.03 14,286,503.03 2.41%
FEBRUARY 576,531,219.68 443,775,141.62 -132,756,078.06 -23.03%
MARCH 726,940,564.03 594,334,551.24 -132,606,012.79 -18.24%
APRIL 575,909,842.22 545,993,142.26 -29,916,699.96 -5.19%
MAY 585,018,509.68 763,962,885.00 178,944,375.32 30.59%
JUNE 568,778,159.39 660,711,972.26 91,933,812.87 16.16%
TOTAL 3,625,213,705.00 3,615,099,605.41 -10,114,099.59 -0.28%
900,000,000.00
0.00
100,000,000.00
200,000,000.00
300,000,000.00
400,000,000.00
500,000,000.00
600,000,000.00
700,000,000.00
800,000,000.00
JANUARY FEBRUARY MARCH APRIL MAY JUNE
ACTUAL 2010
ACTUAL 2011
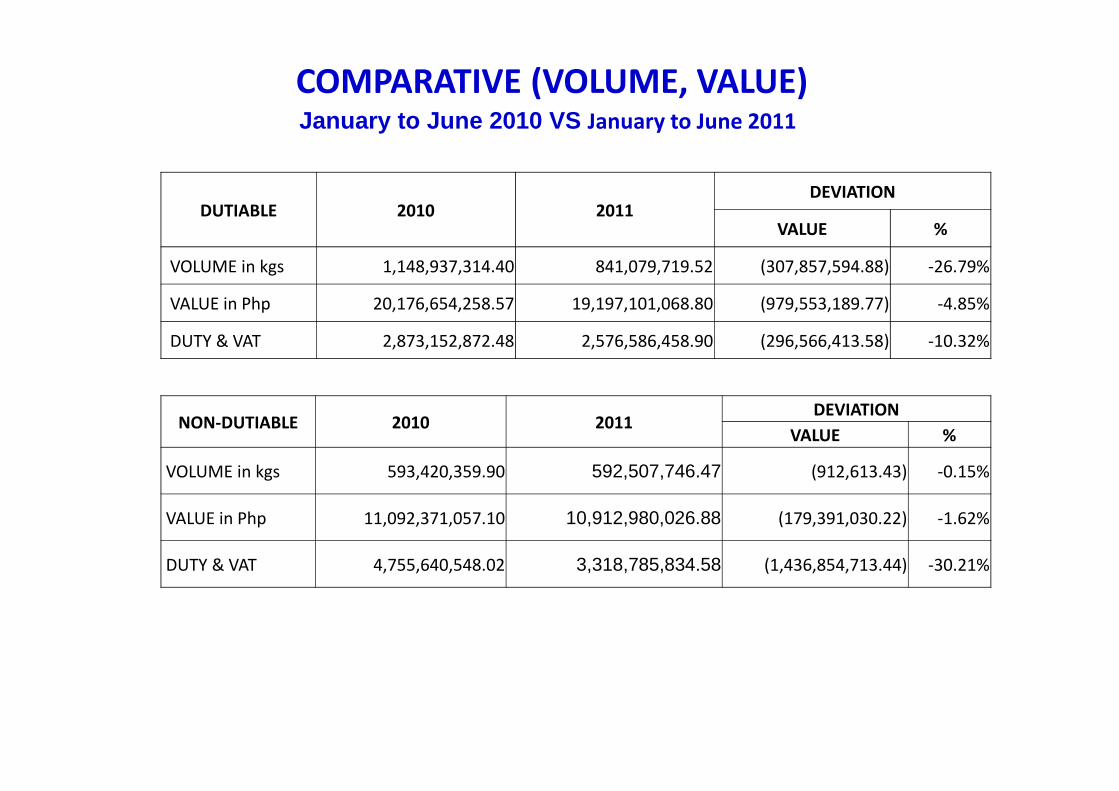
COMPARATIVE (VOLUME, VALUE)January to June 2010 VS January to June 2011
DUTIABLE 2010 2011DEVIATION
VALUE %
VOLUME in kgs 1,148,937,314.40 841,079,719.52 (307,857,594.88) -26.79%
VALUE in Php 20,176,654,258.57 19,197,101,068.80 (979,553,189.77) -4.85%
DUTY & VAT 2,873,152,872.48 2,576,586,458.90 (296,566,413.58) -10.32%
NON-DUTIABLE 2010 2011DEVIATION
VALUE %
VOLUME in kgs 593,420,359.90 592,507,746.47 (912,613.43) -0.15%
VALUE in Php 11,092,371,057.10 10,912,980,026.88 (179,391,030.22) -1.62%
DUTY & VAT 4,755,640,548.02 3,318,785,834.58 (1,436,854,713.44) -30.21%
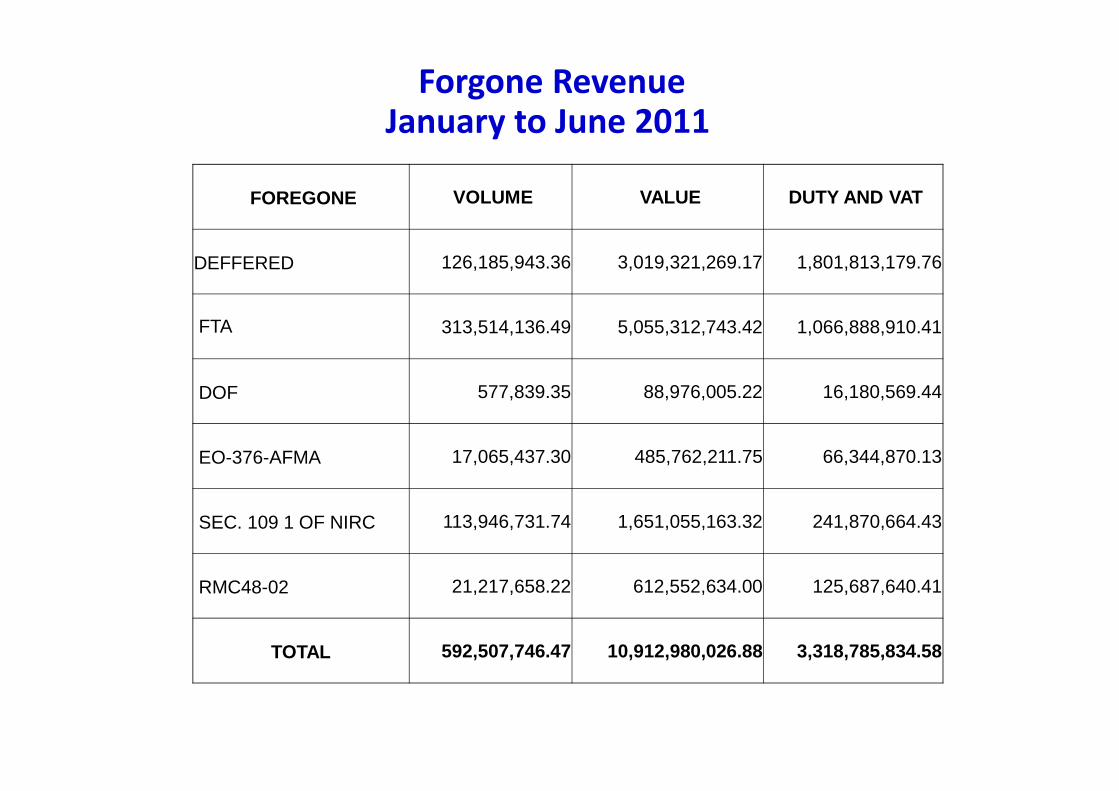
Forgone Revenue
FOREGONE VOLUME VALUE DUTY AND VAT
DEFFERED 126,185,943.36 3,019,321,269.17 1,801,813,179.76
FTA 313,514,136.49 5,055,312,743.42 1,066,888,910.41
DOF 577,839.35 88,976,005.22 16,180,569.44
January to June 2011
DOF 577,839.35 88,976,005.22 16,180,569.44
EO-376-AFMA 17,065,437.30 485,762,211.75 66,344,870.13
SEC. 109 1 OF NIRC 113,946,731.74 1,651,055,163.32 241,870,664.43
RMC48-02 21,217,658.22 612,552,634.00 125,687,640.41
TOTAL 592,507,746.47 10,912,980,026.88 3,318,785,834.58
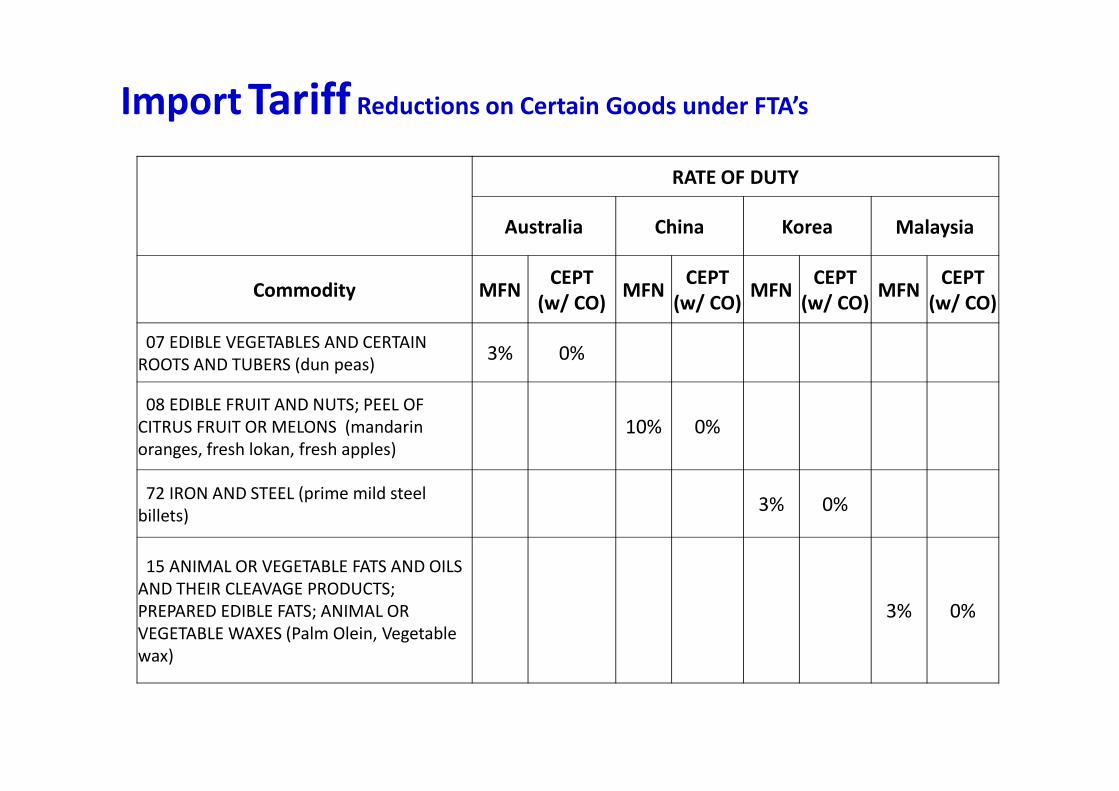
Import Tariff Reductions on Certain Goods under FTA’s
RATE OF DUTY
Australia China Korea Malaysia
Commodity MFNCEPT
(w/ CO)MFN
CEPT
(w/ CO)MFN
CEPT
(w/ CO)MFN
CEPT
(w/ CO)
07 EDIBLE VEGETABLES AND CERTAIN
ROOTS AND TUBERS (dun peas)3% 0%
08 EDIBLE FRUIT AND NUTS; PEEL OF 08 EDIBLE FRUIT AND NUTS; PEEL OF
CITRUS FRUIT OR MELONS (mandarin
oranges, fresh lokan, fresh apples)
10% 0%
72 IRON AND STEEL (prime mild steel
billets)3% 0%
15 ANIMAL OR VEGETABLE FATS AND OILS
AND THEIR CLEAVAGE PRODUCTS;
PREPARED EDIBLE FATS; ANIMAL OR
VEGETABLE WAXES (Palm Olein, Vegetable
wax)
3% 0%
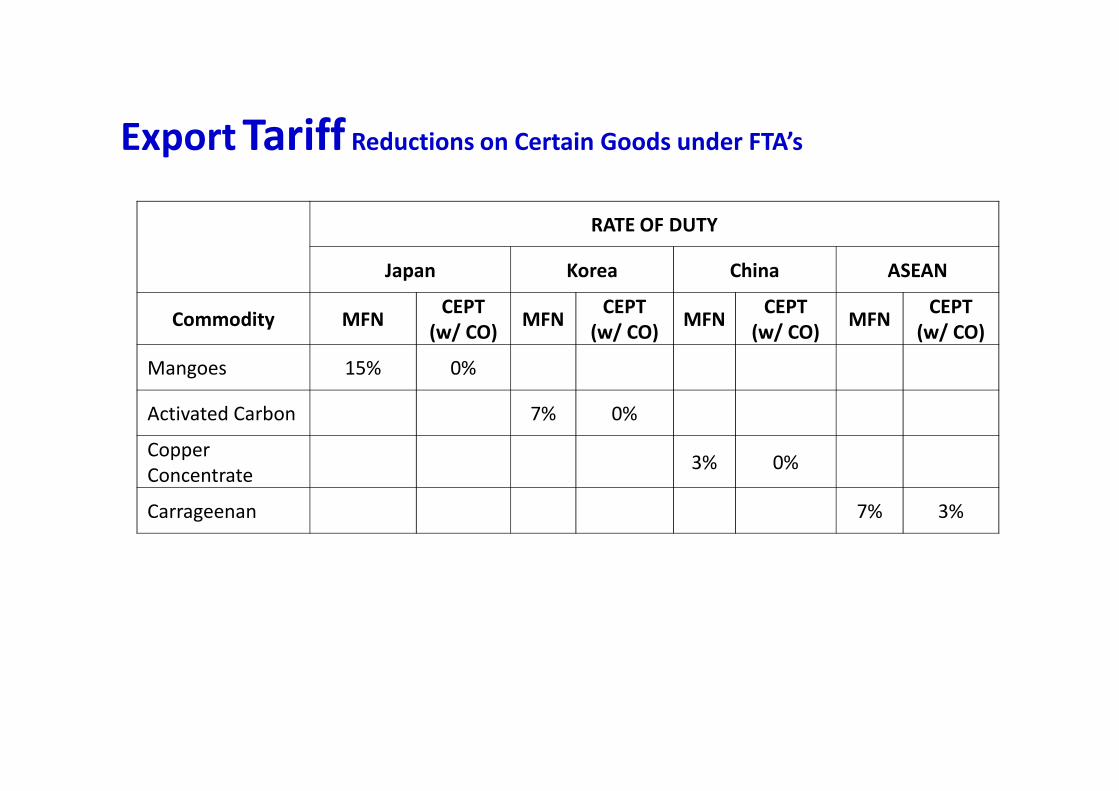
Export Tariff Reductions on Certain Goods under FTA’s
RATE OF DUTY
Japan Korea China ASEAN
Commodity MFNCEPT
(w/ CO)MFN
CEPT
(w/ CO)MFN
CEPT
(w/ CO)MFN
CEPT
(w/ CO)
Mangoes 15% 0%
Activated Carbon 7% 0%
Copper
Concentrate3% 0%
Carrageenan 7% 3%
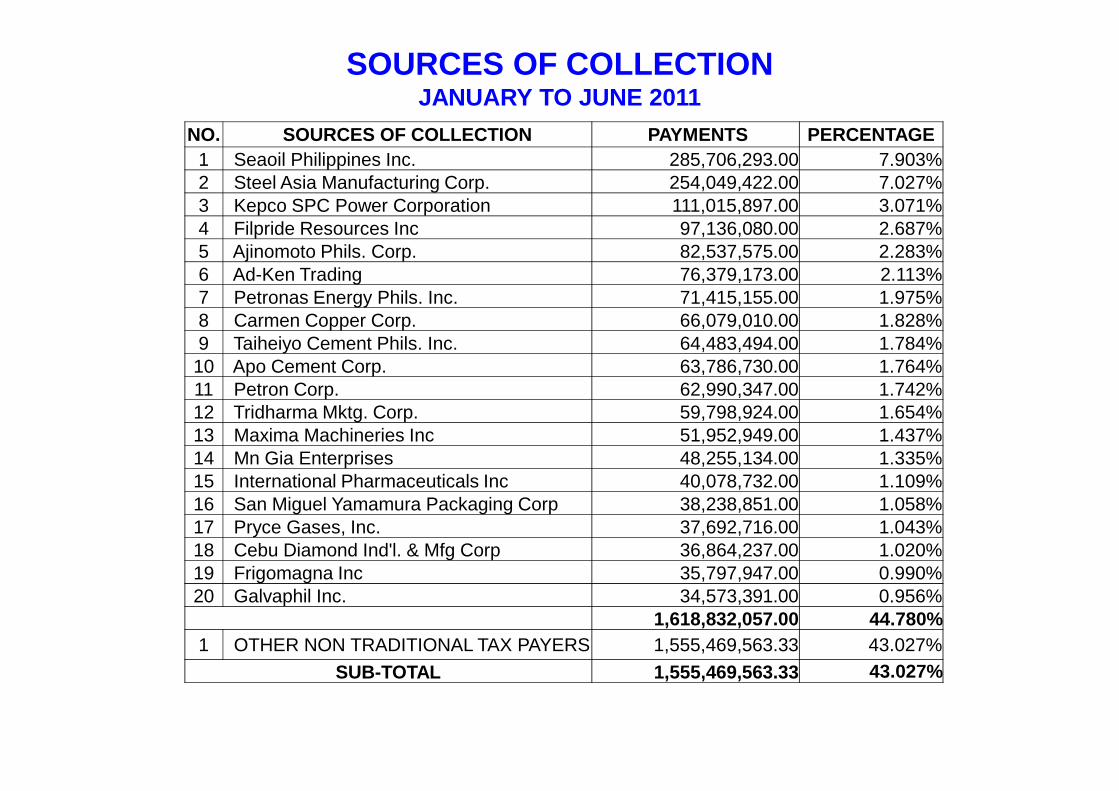
SOURCES OF COLLECTIONJANUARY TO JUNE 2011
NO. SOURCES OF COLLECTION PAYMENTS PERCENTAGE1 Seaoil Philippines Inc. 285,706,293.00 7.903%2 Steel Asia Manufacturing Corp. 254,049,422.00 7.027%3 Kepco SPC Power Corporation 111,015,897.00 3.071%4 Filpride Resources Inc 97,136,080.00 2.687%5 Ajinomoto Phils. Corp. 82,537,575.00 2.283%6 Ad-Ken Trading 76,379,173.00 2.113%7 Petronas Energy Phils. Inc. 71,415,155.00 1.975%8 Carmen Copper Corp. 66,079,010.00 1.828%9 Taiheiyo Cement Phils. Inc. 64,483,494.00 1.784%10 Apo Cement Corp. 63,786,730.00 1.764%11 Petron Corp. 62,990,347.00 1.742%11 Petron Corp. 62,990,347.00 1.742%12 Tridharma Mktg. Corp. 59,798,924.00 1.654%13 Maxima Machineries Inc 51,952,949.00 1.437%14 Mn Gia Enterprises 48,255,134.00 1.335%15 International Pharmaceuticals Inc 40,078,732.00 1.109%16 San Miguel Yamamura Packaging Corp 38,238,851.00 1.058%17 Pryce Gases, Inc. 37,692,716.00 1.043%18 Cebu Diamond Ind'l. & Mfg Corp 36,864,237.00 1.020%19 Frigomagna Inc 35,797,947.00 0.990%20 Galvaphil Inc. 34,573,391.00 0.956%
1,618,832,057.00 44.780%1 OTHER NON TRADITIONAL TAX PAYERS 1,555,469,563.33 43.027%
SUB-TOTAL 1,555,469,563.33 43.027%
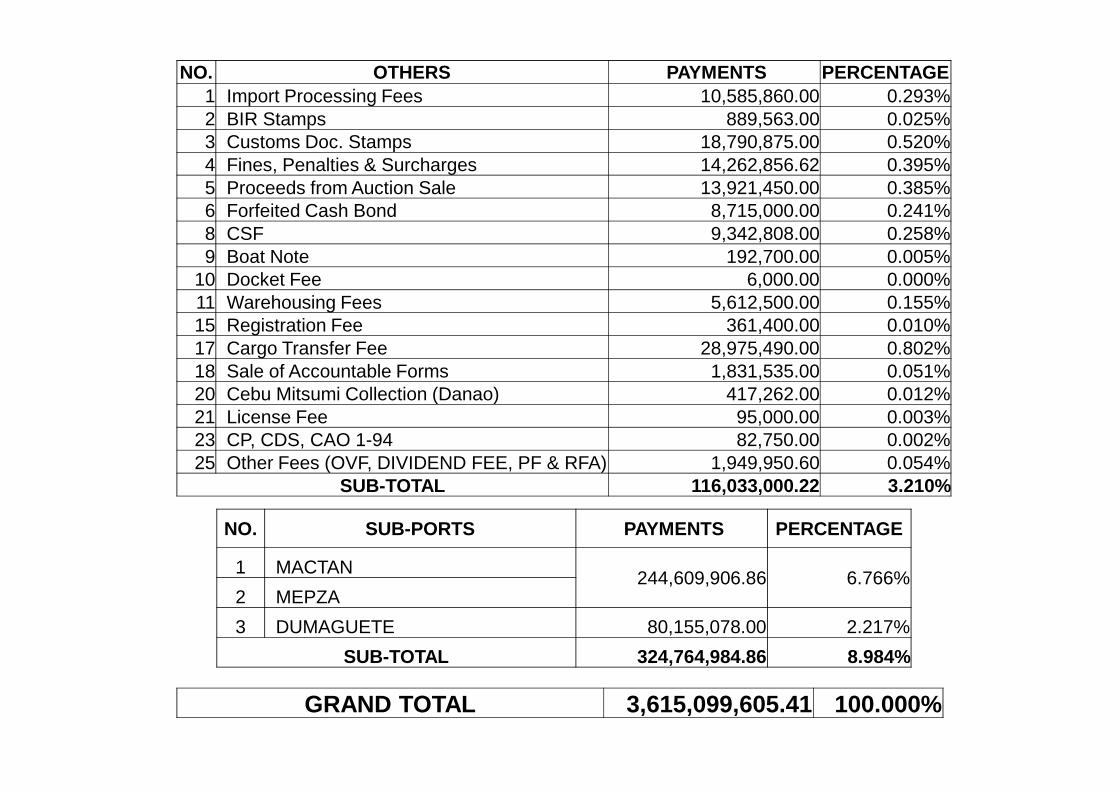
NO. OTHERS PAYMENTS PERCENTAGE1 Import Processing Fees 10,585,860.00 0.293%2 BIR Stamps 889,563.00 0.025%3 Customs Doc. Stamps 18,790,875.00 0.520%4 Fines, Penalties & Surcharges 14,262,856.62 0.395%5 Proceeds from Auction Sale 13,921,450.00 0.385%6 Forfeited Cash Bond 8,715,000.00 0.241%8 CSF 9,342,808.00 0.258%9 Boat Note 192,700.00 0.005%
10 Docket Fee 6,000.00 0.000%11 Warehousing Fees 5,612,500.00 0.155%15 Registration Fee 361,400.00 0.010%17 Cargo Transfer Fee 28,975,490.00 0.802%18 Sale of Accountable Forms 1,831,535.00 0.051%20 Cebu Mitsumi Collection (Danao) 417,262.00 0.012%20 Cebu Mitsumi Collection (Danao) 417,262.00 0.012%21 License Fee 95,000.00 0.003%23 CP, CDS, CAO 1-94 82,750.00 0.002%25 Other Fees (OVF, DIVIDEND FEE, PF & RFA) 1,949,950.60 0.054%
SUB-TOTAL 116,033,000.22 3.210%
NO. SUB-PORTS PAYMENTS PERCENTAGE
1 MACTAN244,609,906.86 6.766%
2 MEPZA
3 DUMAGUETE 80,155,078.00 2.217%
SUB-TOTAL 324,764,984.86 8.984%
GRAND TOTAL 3,615,099,605.41 100.000%
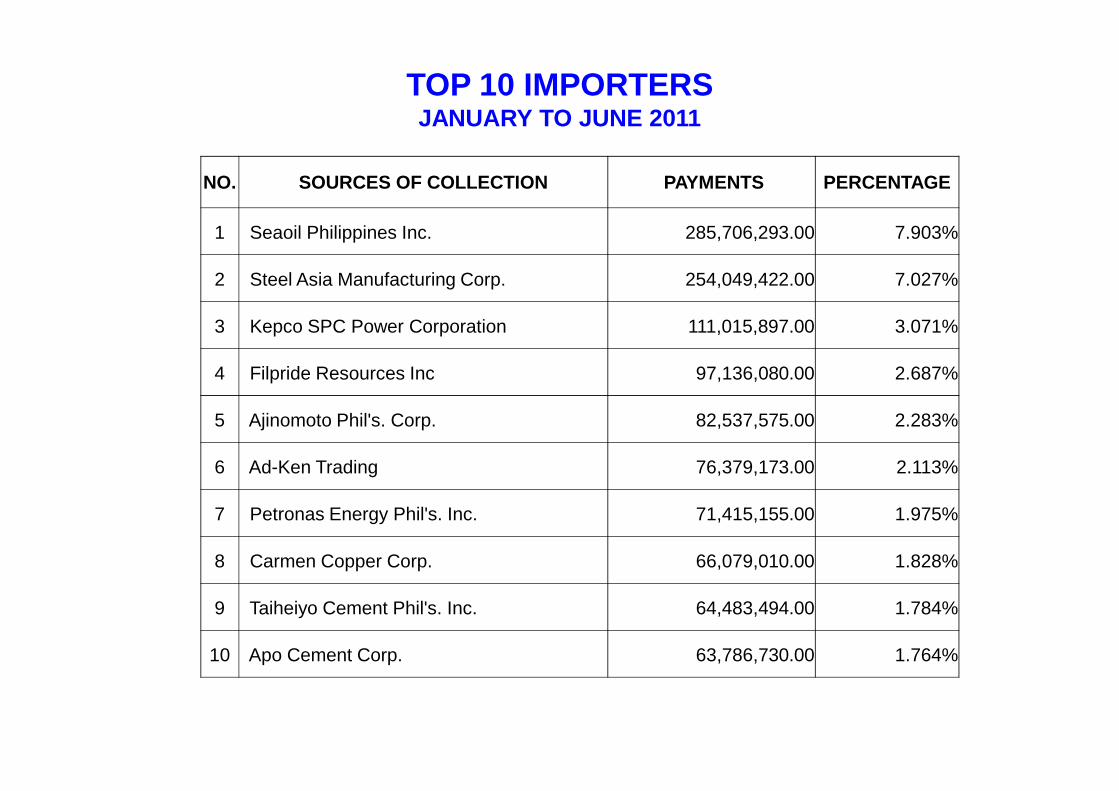
TOP 10 IMPORTERSJANUARY TO JUNE 2011
NO. SOURCES OF COLLECTION PAYMENTS PERCENTAGE
1 Seaoil Philippines Inc. 285,706,293.00 7.903%
2 Steel Asia Manufacturing Corp. 254,049,422.00 7.027%
3 Kepco SPC Power Corporation 111,015,897.00 3.071%
4 Filpride Resources Inc 97,136,080.00 2.687%
5 Ajinomoto Phil's. Corp. 82,537,575.00 2.283%
6 Ad-Ken Trading 76,379,173.00 2.113%
7 Petronas Energy Phil's. Inc. 71,415,155.00 1.975%
8 Carmen Copper Corp. 66,079,010.00 1.828%
9 Taiheiyo Cement Phil's. Inc. 64,483,494.00 1.784%
10 Apo Cement Corp. 63,786,730.00 1.764%
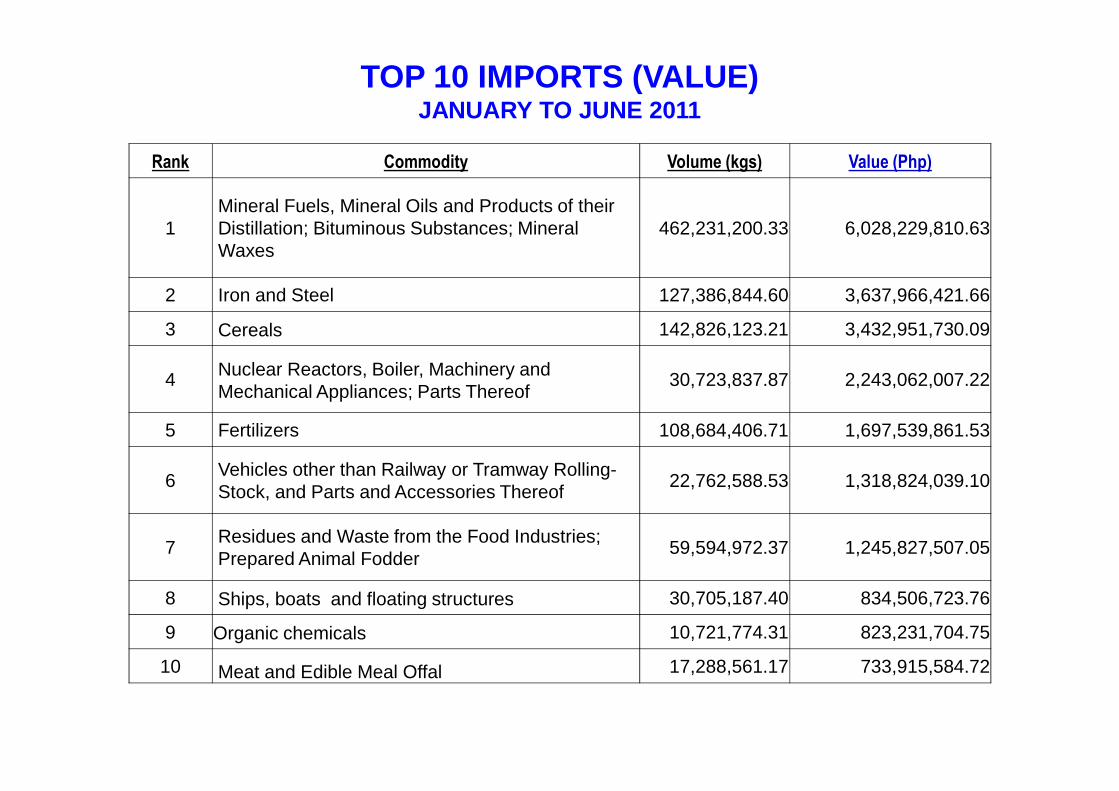
TOP 10 IMPORTS (VALUE)JANUARY TO JUNE 2011
Rank Commodity Volume (kgs) Value (Php)
1Mineral Fuels, Mineral Oils and Products of their Distillation; Bituminous Substances; Mineral Waxes
462,231,200.33 6,028,229,810.63
2 Iron and Steel 127,386,844.60 3,637,966,421.66
3 Cereals 142,826,123.21 3,432,951,730.09
4 Nuclear Reactors, Boiler, Machinery and Mechanical Appliances; Parts Thereof
30,723,837.87 2,243,062,007.22 Mechanical Appliances; Parts Thereof
5 Fertilizers 108,684,406.71 1,697,539,861.53
6Vehicles other than Railway or Tramway Rolling-Stock, and Parts and Accessories Thereof
22,762,588.53 1,318,824,039.10
7Residues and Waste from the Food Industries; Prepared Animal Fodder
59,594,972.37 1,245,827,507.05
8 Ships, boats and floating structures 30,705,187.40 834,506,723.76
9 Organic chemicals 10,721,774.31 823,231,704.75
10 Meat and Edible Meal Offal 17,288,561.17 733,915,584.72
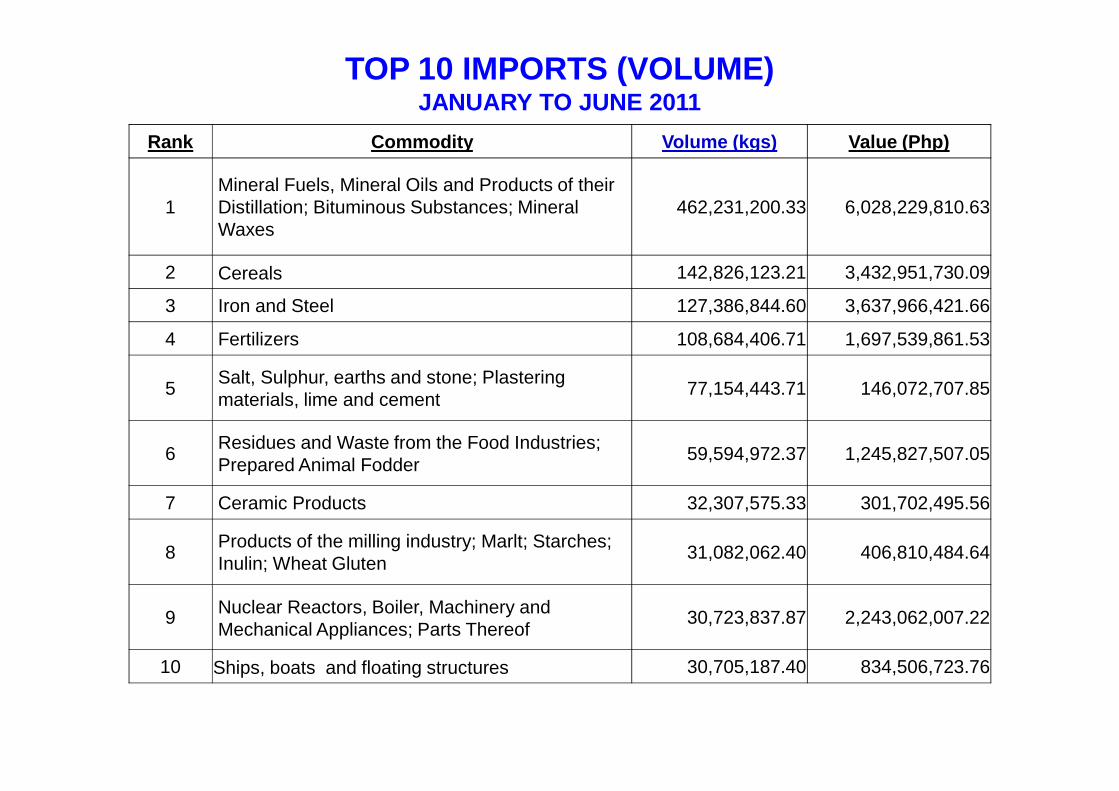
TOP 10 IMPORTS (VOLUME)JANUARY TO JUNE 2011
Rank Commodity Volume (kgs) Value (Php)
1Mineral Fuels, Mineral Oils and Products of their Distillation; Bituminous Substances; Mineral Waxes
462,231,200.33 6,028,229,810.63
2 Cereals 142,826,123.21 3,432,951,730.09
3 Iron and Steel 127,386,844.60 3,637,966,421.66
4 Fertilizers 108,684,406.71 1,697,539,861.53
5Salt, Sulphur, earths and stone; Plastering materials, lime and cement
77,154,443.71 146,072,707.85 5materials, lime and cement
77,154,443.71 146,072,707.85
6Residues and Waste from the Food Industries; Prepared Animal Fodder
59,594,972.37 1,245,827,507.05
7 Ceramic Products 32,307,575.33 301,702,495.56
8Products of the milling industry; Marlt; Starches; Inulin; Wheat Gluten
31,082,062.40 406,810,484.64
9 Nuclear Reactors, Boiler, Machinery and Mechanical Appliances; Parts Thereof
30,723,837.87 2,243,062,007.22
10 Ships, boats and floating structures 30,705,187.40 834,506,723.76
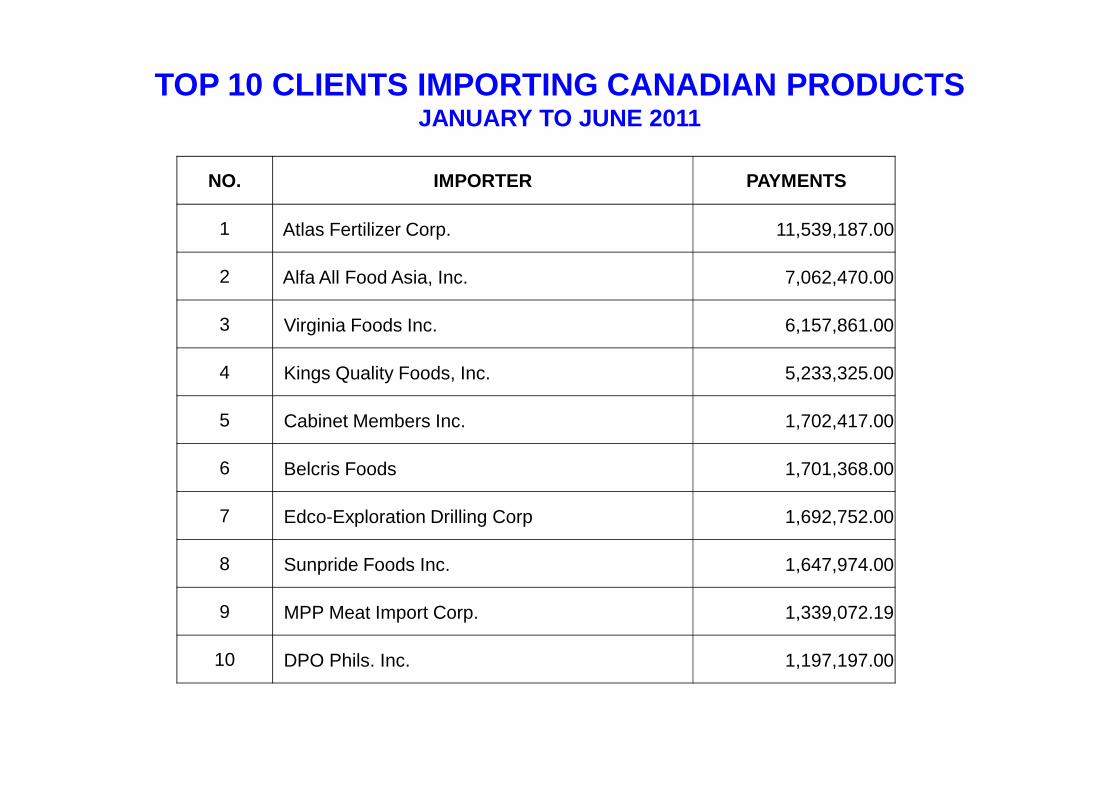
TOP 10 CLIENTS IMPORTING CANADIAN PRODUCTSJANUARY TO JUNE 2011
NO. IMPORTER PAYMENTS
1 Atlas Fertilizer Corp. 11,539,187.00
2 Alfa All Food Asia, Inc. 7,062,470.00
3 Virginia Foods Inc. 6,157,861.00
4 Kings Quality Foods, Inc. 5,233,325.00
5 Cabinet Members Inc. 1,702,417.00
6 Belcris Foods 1,701,368.00
7 Edco-Exploration Drilling Corp 1,692,752.00
8 Sunpride Foods Inc. 1,647,974.00
9 MPP Meat Import Corp. 1,339,072.19
10 DPO Phils. Inc. 1,197,197.00
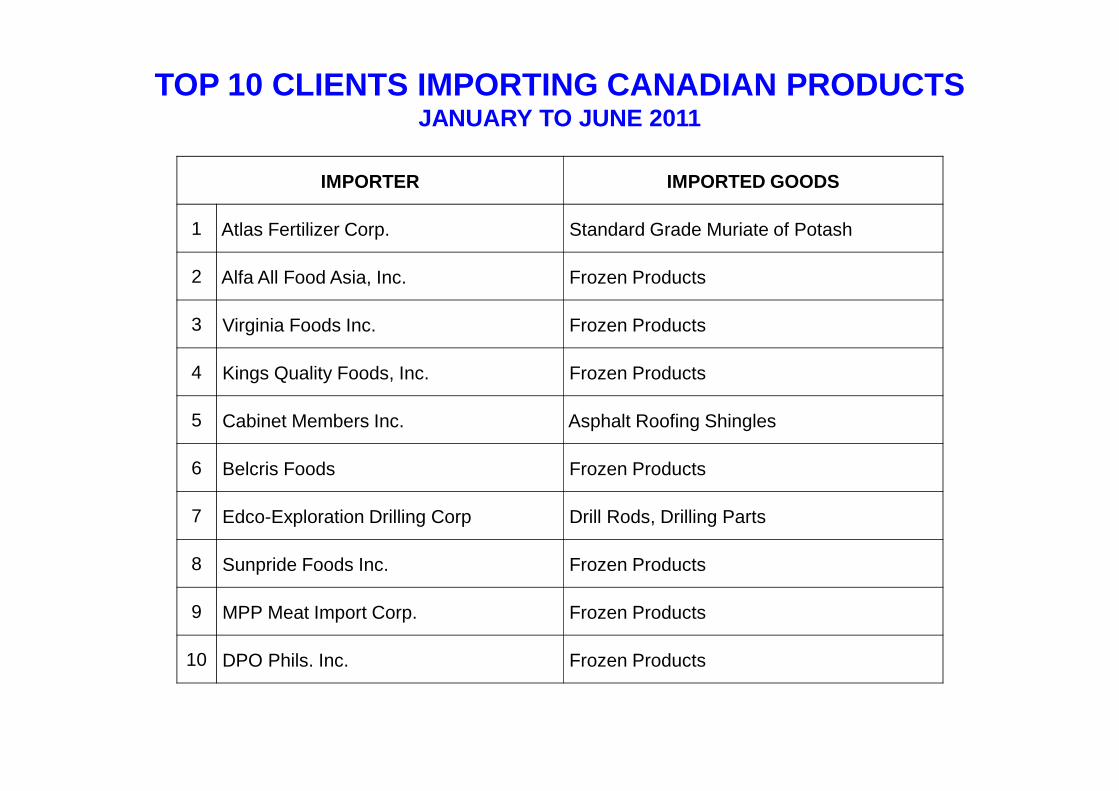
TOP 10 CLIENTS IMPORTING CANADIAN PRODUCTSJANUARY TO JUNE 2011
IMPORTER IMPORTED GOODS
1 Atlas Fertilizer Corp. Standard Grade Muriate of Potash
2 Alfa All Food Asia, Inc. Frozen Products
3 Virginia Foods Inc. Frozen Products
4 Kings Quality Foods, Inc. Frozen Products
5 Cabinet Members Inc. Asphalt Roofing Shingles
6 Belcris Foods Frozen Products
7 Edco-Exploration Drilling Corp Drill Rods, Drilling Parts
8 Sunpride Foods Inc. Frozen Products
9 MPP Meat Import Corp. Frozen Products
10 DPO Phils. Inc. Frozen Products
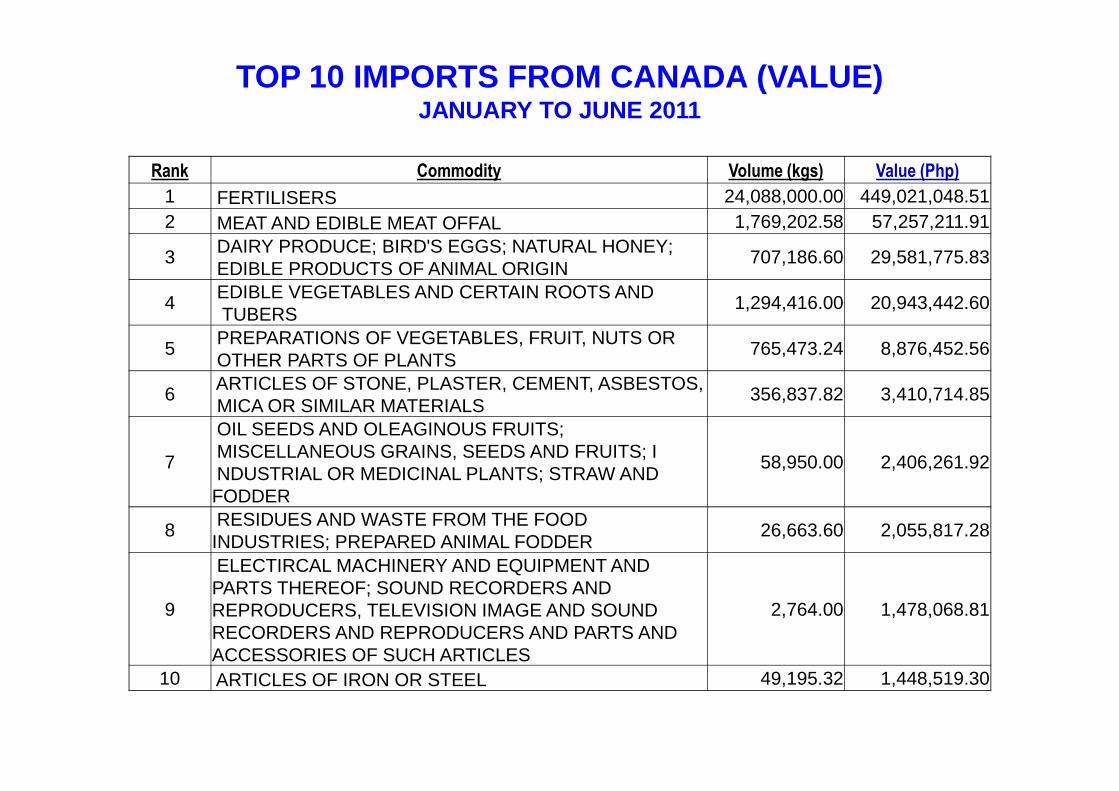
TOP 10 IMPORTS FROM CANADA (VALUE)JANUARY TO JUNE 2011
Rank Commodity Volume (kgs) Value (Php)
1 FERTILISERS 24,088,000.00 449,021,048.51 2 MEAT AND EDIBLE MEAT OFFAL 1,769,202.58 57,257,211.91
3 DAIRY PRODUCE; BIRD'S EGGS; NATURAL HONEY; EDIBLE PRODUCTS OF ANIMAL ORIGIN
707,186.60 29,581,775.83
4 EDIBLE VEGETABLES AND CERTAIN ROOTS AND TUBERS
1,294,416.00 20,943,442.60
5 PREPARATIONS OF VEGETABLES, FRUIT, NUTS OR OTHER PARTS OF PLANTS
765,473.24 8,876,452.56
6 ARTICLES OF STONE, PLASTER, CEMENT, ASBESTOS, MICA OR SIMILAR MATERIALS
356,837.82 3,410,714.85 6MICA OR SIMILAR MATERIALS
356,837.82 3,410,714.85
7
OIL SEEDS AND OLEAGINOUS FRUITS; MISCELLANEOUS GRAINS, SEEDS AND FRUITS; INDUSTRIAL OR MEDICINAL PLANTS; STRAW AND FODDER
58,950.00 2,406,261.92
8 RESIDUES AND WASTE FROM THE FOOD INDUSTRIES; PREPARED ANIMAL FODDER
26,663.60 2,055,817.28
9
ELECTIRCAL MACHINERY AND EQUIPMENT AND PARTS THEREOF; SOUND RECORDERS AND REPRODUCERS, TELEVISION IMAGE AND SOUND RECORDERS AND REPRODUCERS AND PARTS AND ACCESSORIES OF SUCH ARTICLES
2,764.00 1,478,068.81
10 ARTICLES OF IRON OR STEEL 49,195.32 1,448,519.30
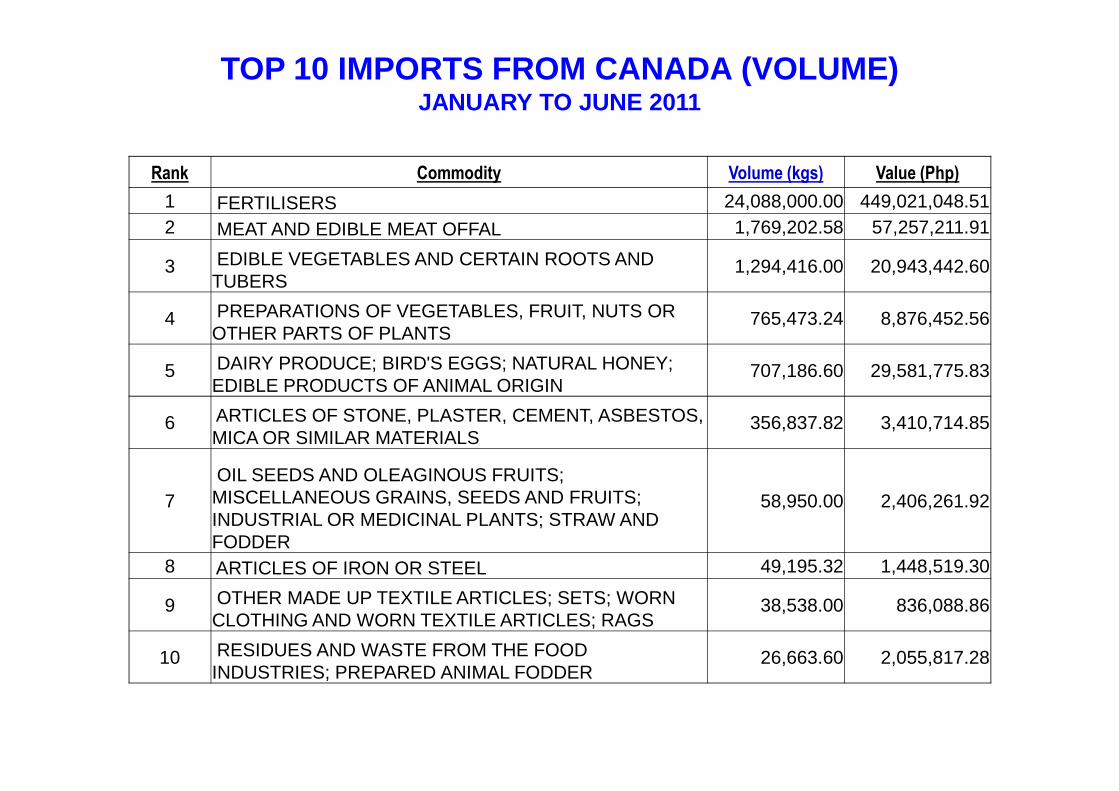
TOP 10 IMPORTS FROM CANADA (VOLUME)JANUARY TO JUNE 2011
Rank Commodity Volume (kgs) Value (Php)
1 FERTILISERS 24,088,000.00 449,021,048.51 2 MEAT AND EDIBLE MEAT OFFAL 1,769,202.58 57,257,211.91
3 EDIBLE VEGETABLES AND CERTAIN ROOTS AND TUBERS
1,294,416.00 20,943,442.60
4 PREPARATIONS OF VEGETABLES, FRUIT, NUTS OR OTHER PARTS OF PLANTS
765,473.24 8,876,452.56
5 DAIRY PRODUCE; BIRD'S EGGS; NATURAL HONEY; EDIBLE PRODUCTS OF ANIMAL ORIGIN
707,186.60 29,581,775.83 EDIBLE PRODUCTS OF ANIMAL ORIGIN
6 ARTICLES OF STONE, PLASTER, CEMENT, ASBESTOS, MICA OR SIMILAR MATERIALS
356,837.82 3,410,714.85
7OIL SEEDS AND OLEAGINOUS FRUITS; MISCELLANEOUS GRAINS, SEEDS AND FRUITS; INDUSTRIAL OR MEDICINAL PLANTS; STRAW AND FODDER
58,950.00 2,406,261.92
8 ARTICLES OF IRON OR STEEL 49,195.32 1,448,519.30
9 OTHER MADE UP TEXTILE ARTICLES; SETS; WORN CLOTHING AND WORN TEXTILE ARTICLES; RAGS
38,538.00 836,088.86
10 RESIDUES AND WASTE FROM THE FOOD INDUSTRIES; PREPARED ANIMAL FODDER
26,663.60 2,055,817.28

ICARE
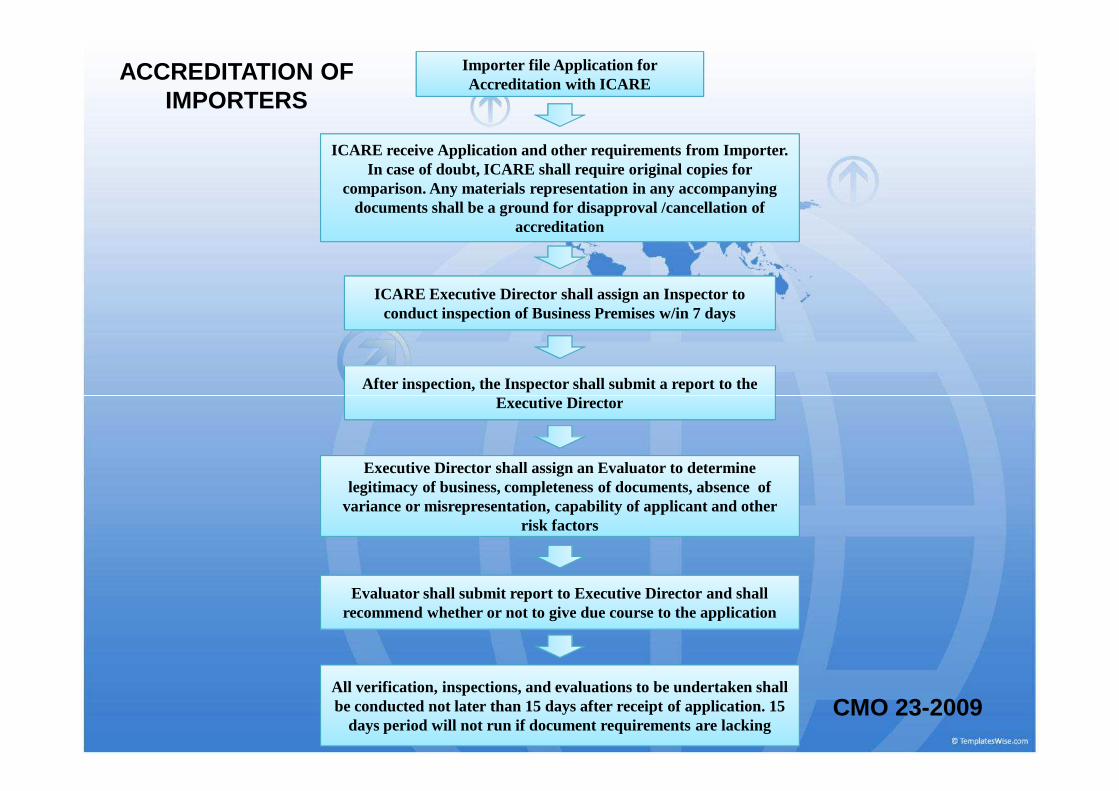
Importer file Application for Accreditation with ICARE
ICARE receive Application and other requirements from Importer. In case of doubt, ICARE shall require original copies for
comparison. Any materials representation in any accompanying documents shall be a ground for disapproval /cancellation of
accreditation
ICARE Executive Director shall assign an Inspector to conduct inspection of Business Premises w/in 7 days
After inspection, the Inspector shall submit a report to the Executive Director
ACCREDITATION OF IMPORTERS
Executive Director
Executive Director shall assign an Evaluator to determine legitimacy of business, completeness of documents, absence of
variance or misrepresentation, capability of applicant and other risk factors
Evaluator shall submit report to Executive Director and shall recommend whether or not to give due course to the application
All verification, inspections, and evaluations to be undertaken shall be conducted not later than 15 days after receipt of application. 15
days period will not run if document requirements are lackingCMO 23-2009
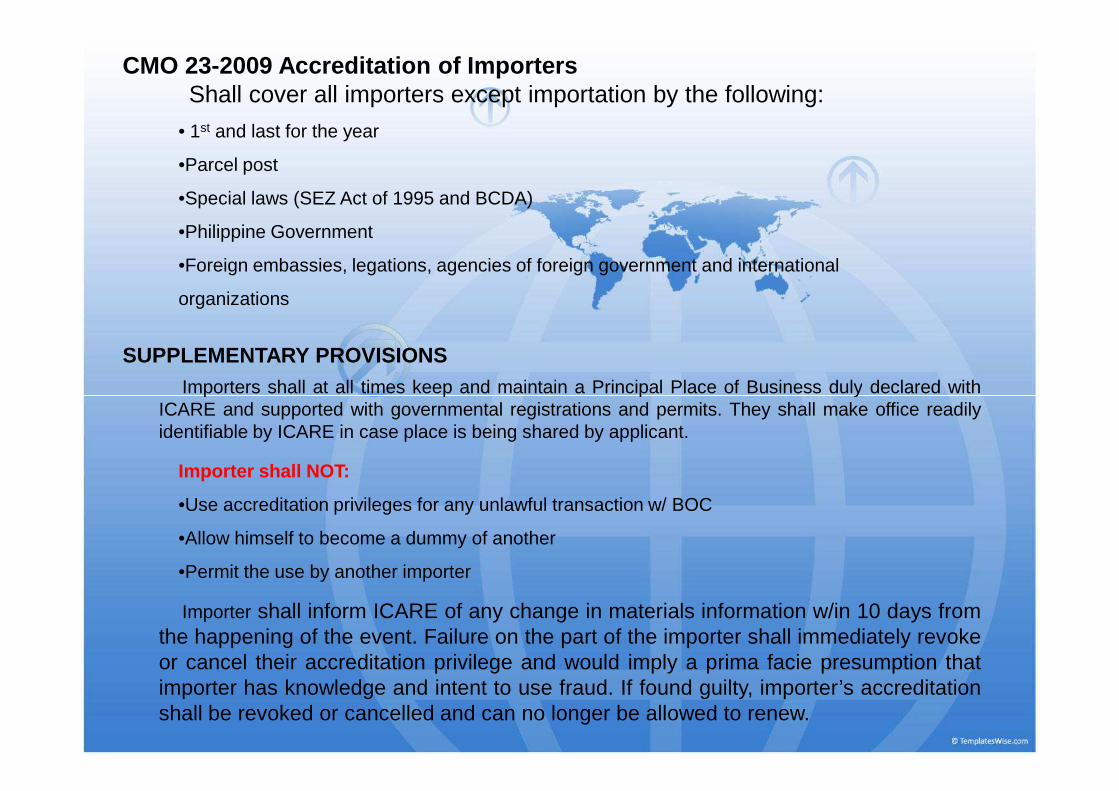
CMO 23-2009 Accreditation of ImportersShall cover all importers except importation by the following:
• 1st and last for the year
•Parcel post
•Special laws (SEZ Act of 1995 and BCDA)
•Philippine Government
•Foreign embassies, legations, agencies of foreign government and international
organizations
SUPPLEMENTARY PROVISIONSImporters shall at all times keep and maintain a Principal Place of Business duly declared with
Importer shall NOT:
•Use accreditation privileges for any unlawful transaction w/ BOC
•Allow himself to become a dummy of another
•Permit the use by another importer
Importers shall at all times keep and maintain a Principal Place of Business duly declared withICARE and supported with governmental registrations and permits. They shall make office readilyidentifiable by ICARE in case place is being shared by applicant.
Importer shall inform ICARE of any change in materials information w/in 10 days fromthe happening of the event. Failure on the part of the importer shall immediately revokeor cancel their accreditation privilege and would imply a prima facie presumption thatimporter has knowledge and intent to use fraud. If found guilty, importer’s accreditationshall be revoked or cancelled and can no longer be allowed to renew.
EXPORT EXPORT EXPORT EXPORT
UPDATES UPDATES
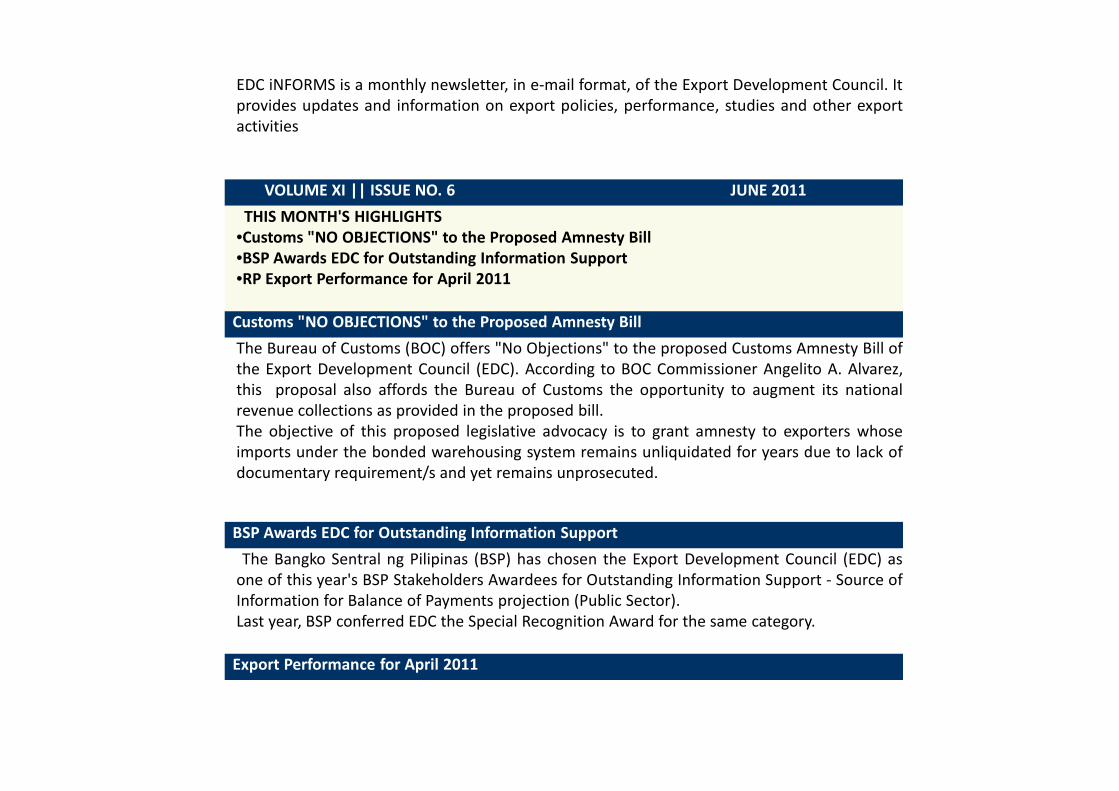
EDC iNFORMS is a monthly newsletter, in e-mail format, of the Export Development Council. It
provides updates and information on export policies, performance, studies and other export
activities
VOLUME XI || ISSUE NO. 6 JUNE 2011
THIS MONTH'S HIGHLIGHTS
•Customs "NO OBJECTIONS" to the Proposed Amnesty Bill
•BSP Awards EDC for Outstanding Information Support
•RP Export Performance for April 2011
Customs "NO OBJECTIONS" to the Proposed Amnesty Bill
The Bureau of Customs (BOC) offers "No Objections" to the proposed Customs Amnesty Bill of
the Export Development Council (EDC). According to BOC Commissioner Angelito A. Alvarez,
this proposal also affords the Bureau of Customs the opportunity to augment its nationalthis proposal also affords the Bureau of Customs the opportunity to augment its national
revenue collections as provided in the proposed bill.
The objective of this proposed legislative advocacy is to grant amnesty to exporters whose
imports under the bonded warehousing system remains unliquidated for years due to lack of
documentary requirement/s and yet remains unprosecuted.
BSP Awards EDC for Outstanding Information Support
The Bangko Sentral ng Pilipinas (BSP) has chosen the Export Development Council (EDC) as
one of this year's BSP Stakeholders Awardees for Outstanding Information Support - Source of
Information for Balance of Payments projection (Public Sector).
Last year, BSP conferred EDC the Special Recognition Award for the same category.
Export Performance for April 2011
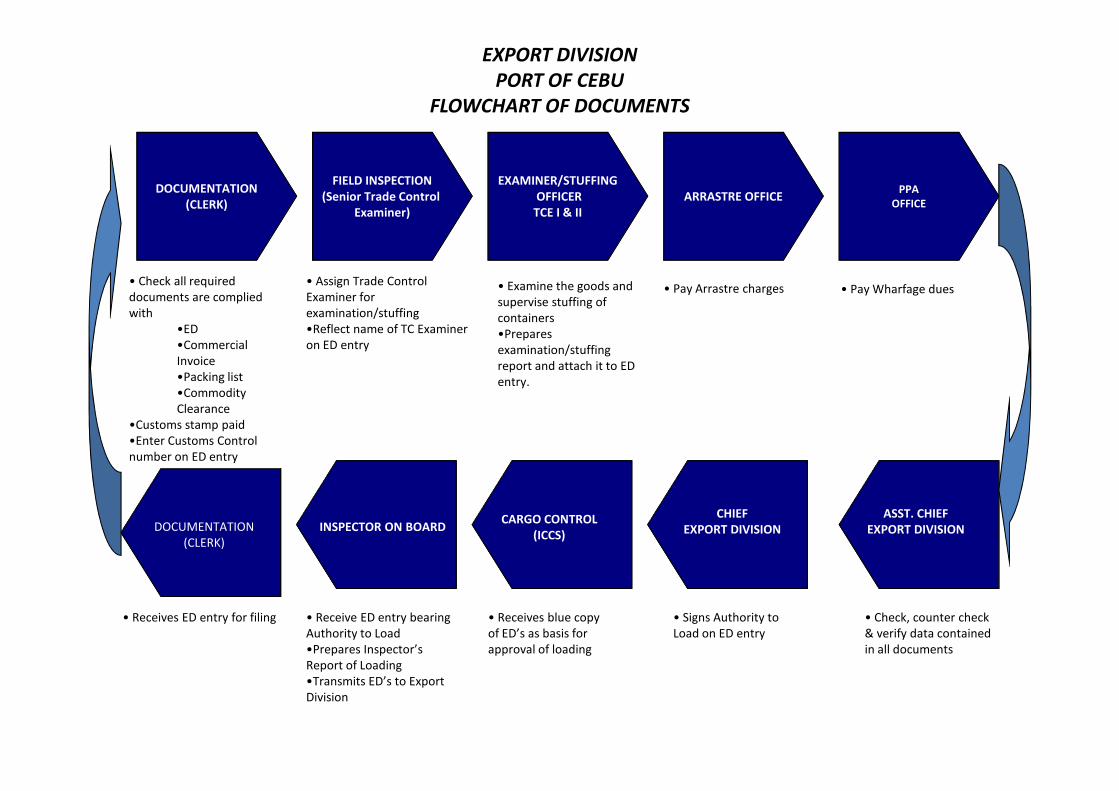
DOCUMENTATION
(CLERK)
FIELD INSPECTION
(Senior Trade Control
Examiner)
PPA
OFFICEARRASTRE OFFICE
EXAMINER/STUFFING
OFFICER
TCE I & II
• Check all required
documents are complied
with
•ED
•Commercial
Invoice
•Packing list
•Commodity
• Assign Trade Control
Examiner for
examination/stuffing
•Reflect name of TC Examiner
on ED entry
• Examine the goods and
supervise stuffing of
containers
•Prepares
examination/stuffing
report and attach it to ED
entry.
• Pay Arrastre charges • Pay Wharfage dues
EXPORT DIVISION
PORT OF CEBU
FLOWCHART OF DOCUMENTS
•Commodity
Clearance
•Customs stamp paid
•Enter Customs Control
number on ED entry
DOCUMENTATION
(CLERK)
INSPECTOR ON BOARDCARGO CONTROL
(ICCS)
CHIEF
EXPORT DIVISION
ASST. CHIEF
EXPORT DIVISION
• Receives ED entry for filing • Receive ED entry bearing
Authority to Load
•Prepares Inspector’s
Report of Loading
•Transmits ED’s to Export
Division
• Receives blue copy
of ED’s as basis for
approval of loading
• Signs Authority to
Load on ED entry
• Check, counter check
& verify data contained
in all documents
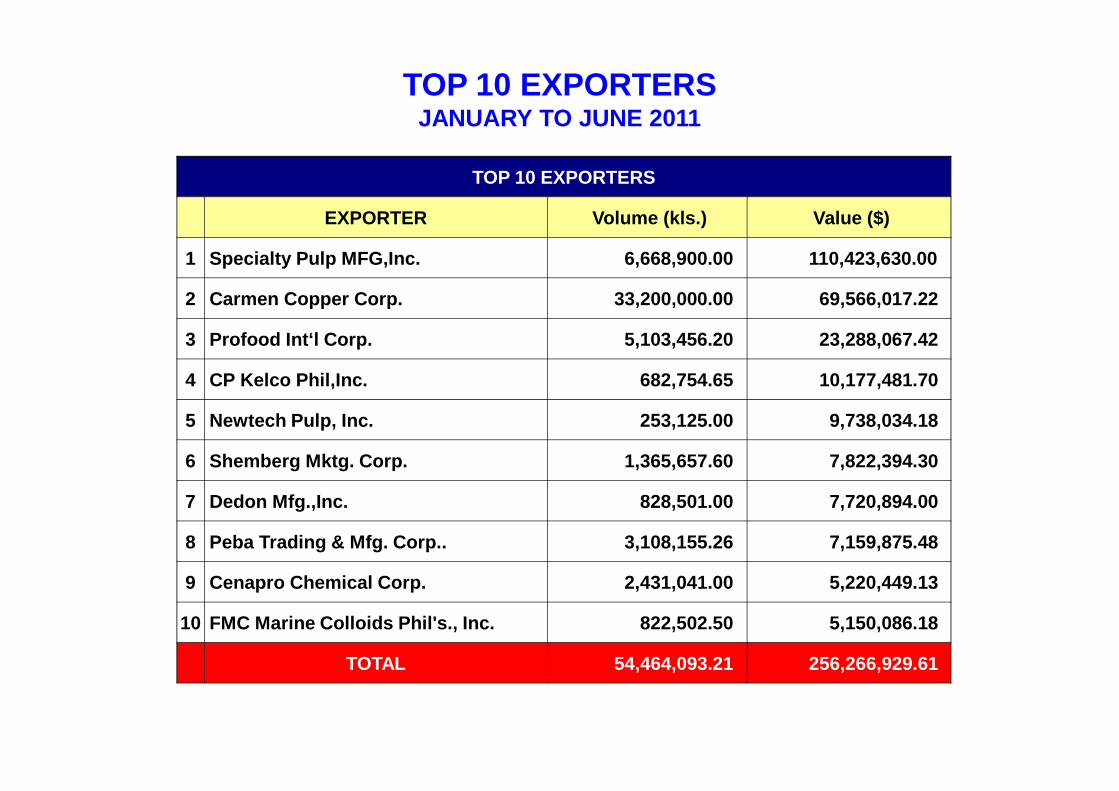
TOP 10 EXPORTERSJANUARY TO JUNE 2011
TOP 10 EXPORTERS
EXPORTER Volume (kls.) Value ($)
1 Specialty Pulp MFG,Inc. 6,668,900.00 110,423,630.00
2 Carmen Copper Corp. 33,200,000.00 69,566,017.22
3 Profood Int‘l Corp. 5,103,456.20 23,288,067.42
4 CP Kelco Phil,Inc. 682,754.65 10,177,481.70
5 Newtech Pulp, Inc. 253,125.00 9,738,034.18
6 Shemberg Mktg. Corp. 1,365,657.60 7,822,394.30
7 Dedon Mfg.,Inc. 828,501.00 7,720,894.00
8 Peba Trading & Mfg. Corp.. 3,108,155.26 7,159,875.48
9 Cenapro Chemical Corp. 2,431,041.00 5,220,449.13
10 FMC Marine Colloids Phil's., Inc. 822,502.50 5,150 ,086.18
TOTAL 54,464,093.21 256,266,929.61
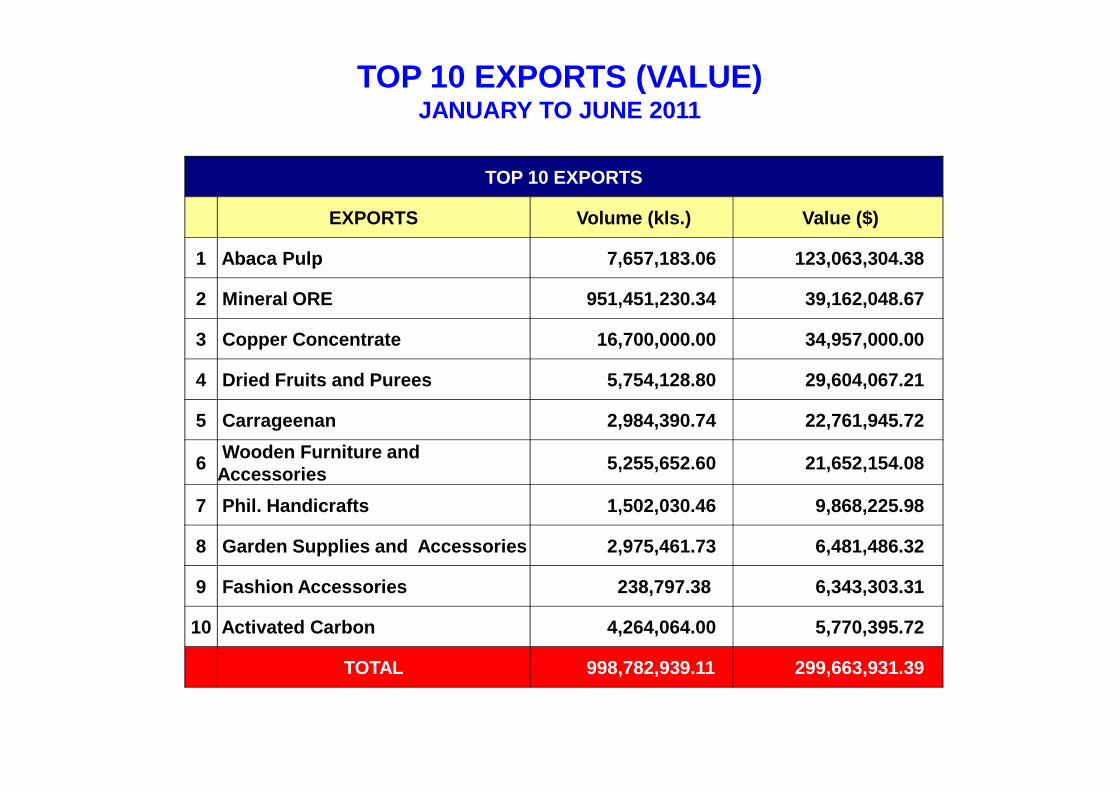
TOP 10 EXPORTS (VALUE)JANUARY TO JUNE 2011
TOP 10 EXPORTS
EXPORTS Volume (kls.) Value ($)
1 Abaca Pulp 7,657,183.06 123,063,304.38
2 Mineral ORE 951,451,230.34 39,162,048.67
3 Copper Concentrate 16,700,000.00 34,957,000.00
4 Dried Fruits and Purees 5,754,128.80 29,604,067.21
5 Carrageenan 2,984,390.74 22,761,945.72
6Wooden Furniture and Accessories
5,255,652.60 21,652,154.08
7 Phil. Handicrafts 1,502,030.46 9,868,225.98
8 Garden Supplies and Accessories 2,975,461.73 6,481 ,486.32
9 Fashion Accessories 238,797.38 6,343,303.31
10 Activated Carbon 4,264,064.00 5,770,395.72
TOTAL 998,782,939.11 299,663,931.39
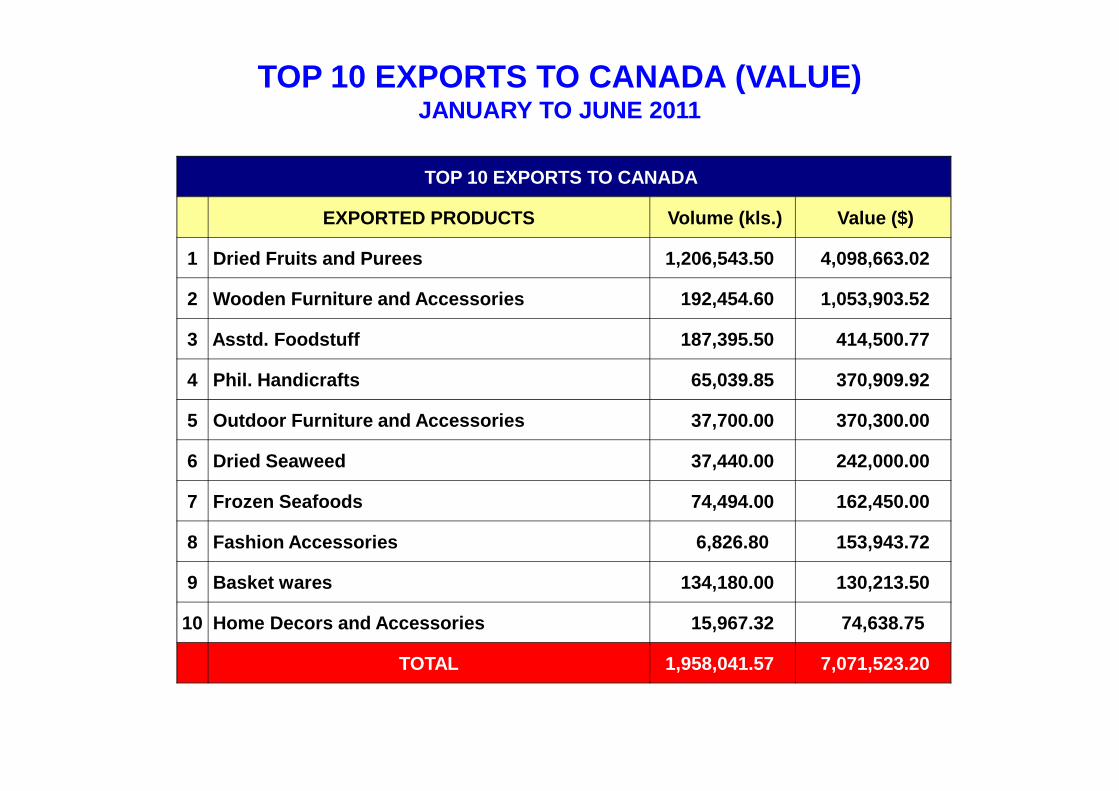
TOP 10 EXPORTS TO CANADA (VALUE)JANUARY TO JUNE 2011
TOP 10 EXPORTS TO CANADA
EXPORTED PRODUCTS Volume (kls.) Value ($)
1 Dried Fruits and Purees 1,206,543.50 4,098,663.02
2 Wooden Furniture and Accessories 192,454.60 1,053, 903.52
3 Asstd. Foodstuff 187,395.50 414,500.77
4 Phil. Handicrafts 65,039.85 370,909.92
5 Outdoor Furniture and Accessories 37,700.00 370,30 0.00
6 Dried Seaweed 37,440.00 242,000.00
7 Frozen Seafoods 74,494.00 162,450.00
8 Fashion Accessories 6,826.80 153,943.72
9 Basket wares 134,180.00 130,213.50
10 Home Decors and Accessories 15,967.32 74,638.75
TOTAL 1,958,041.57 7,071,523.20

DAGHANG SALAMAT