Burden Sharing and Exchange Rate Misalignments Within the ...
26
Burden Sharing and Exchange Rate Misalignments Within the Group of Twenty AGNÈS BÉNASSY-QUÉRÉ, PASCALE DURAN-VIGNERON, AMINA LAHRÈCHE-RÉVIL, and VALÉRIE MIGNON 69 Major changes in external imbalances have occurred in the world since the late 1990s. The most acknowledged one has been the growing size of the US current account deficit. This movement has been compensated for with rising surpluses in East Asia, in Russia, and in the Middle East, and with the vanishing of the aggregate deficit of Latin America. In 2003, individual imbalances grew to −4.9 percent of GDP in the United States, −6 percent in Australia, +10 percent in Taiwan, +11 percent in Hong Kong, +8.9 percent in Russia, and +12.9 percent in Saudi Arabia. Hence, the mirror of US imbalances has increasingly been located in emerging-market countries. Another feature of the past decade has been the rise of foreign direct investment to developing Asia, and the subsequent buildup of foreign exchange reserves in this region. Indeed, Chinese official reserves have become the second largest in the world (after Japan), with 12.5 percent of world reserves at the end of December 2003, compared with only 6.4 percent of world reserves at the end of December 1996. 1 Consistently, emerging-market countries have been increasingly included in the debate on exchange rate misalignments. This concern was manifest in 4 Agnès Bénassy-Quéré is a professor at the University of Paris X and deputy director of the Centre d’Etudes Prospectives et d’Informations Internationales. Pascale Duran-Vigneron is a PhD student at Thema-CNRS, University of Paris X. Amina Lahrèche-Révil is an economist at the Centre d’Etudes Prospectives et d’Informations Internationales. Valérie Mignon is a professor at University of Paris X and is affiliated with Thema-CNRS. The authors are grateful to Emmanuel Dubois for invaluable computer assistance and to Takatoshi Ito and John Williamson for helpful remarks. 1. These data are from the International Monetary Fund and national sources. We are grate- ful to Bronka Rzepkowski for providing us with these data.
Transcript of Burden Sharing and Exchange Rate Misalignments Within the ...

Burden Sharing and Exchange RateMisalignments Within the Group of TwentyAGNÈS BÉNASSY-QUÉRÉ, PASCALE DURAN-VIGNERON, AMINA LAHRÈCHE-RÉVIL, and VALÉRIE MIGNON
69
Major changes in external imbalances have occurred in the world since thelate 1990s. The most acknowledged one has been the growing size of theUS current account deficit. This movement has been compensated for withrising surpluses in East Asia, in Russia, and in the Middle East, and withthe vanishing of the aggregate deficit of Latin America. In 2003, individualimbalances grew to −4.9 percent of GDP in the United States, −6 percent inAustralia, +10 percent in Taiwan, +11 percent in Hong Kong, +8.9 percentin Russia, and +12.9 percent in Saudi Arabia. Hence, the mirror of USimbalances has increasingly been located in emerging-market countries.
Another feature of the past decade has been the rise of foreign directinvestment to developing Asia, and the subsequent buildup of foreignexchange reserves in this region. Indeed, Chinese official reserves havebecome the second largest in the world (after Japan), with 12.5 percent ofworld reserves at the end of December 2003, compared with only 6.4 percentof world reserves at the end of December 1996.1
Consistently, emerging-market countries have been increasingly includedin the debate on exchange rate misalignments. This concern was manifest in
4
Agnès Bénassy-Quéré is a professor at the University of Paris X and deputy director of the Centred’Etudes Prospectives et d’Informations Internationales. Pascale Duran-Vigneron is a PhD student atThema-CNRS, University of Paris X. Amina Lahrèche-Révil is an economist at the Centre d’EtudesProspectives et d’Informations Internationales. Valérie Mignon is a professor at University of Paris Xand is affiliated with Thema-CNRS. The authors are grateful to Emmanuel Dubois for invaluablecomputer assistance and to Takatoshi Ito and John Williamson for helpful remarks.
1. These data are from the International Monetary Fund and national sources. We are grate-ful to Bronka Rzepkowski for providing us with these data.

the Boca Raton (Florida) statement of the Group of Seven (G-7) finance min-isters on February 6–7, 2004: “In this context, we emphasize that more flexi-bility in exchange rates is desirable for major countries or economic areasthat lack such flexibility to promote smooth and widespread adjustments inthe international financial system, based on market mechanisms.”2
This statement was not followed by action in Asian countries—especiallyChina—that have continued de facto or de jure to run fixed pegs on the USdollar despite current account surpluses and capital inflows. However, theG-7 was perhaps not the best group to issue such a statement, becausenone of the Asian countries belongs to it. As Fred Bergsten (2004) has argued,the right group would instead be the Group of Twenty (G-20), which wascreated in 1999 to “promote cooperation to achieve stable and sustainablegrowth that benefits all.” Inasmuch as persistent exchange rate misalign-ments could be the source of a misallocation of resources, this should bean issue discussed in G-20 meetings. Hence, Bergsten argues that “the G-20should gradually but steadily succeed the G-7 as the informal steering com-mittee for the world economy in addressing topics such as these, for reasonsof both effectiveness and political legitimacy.”3
Following this view, one is left with the difficult problem of providingexchange rate benchmarks for the G-20 countries. In this chapter, we pre-sent equilibrium effective exchange rates for a set of industrial as well asdeveloping countries, based on a methodology close to that used byEnrique Alberola and colleagues (2002) and Alberola (2003), where the realexchange rate is jointly determined by external balance as well as internalbalance. We then calculate equilibrium bilateral exchange rates against theUS dollar. Finally, we investigate the size of bilateral misalignmentsdepending on the number of flexible currencies within the G-20.
Real Effective Exchange Rates for the G-20
Research on real equilibrium exchange rates has followed two main avenues.The first was launched by John Williamson (1983): The fundamental equi-librium exchange rate (FEER) is defined as the real exchange rate that allowsboth internal and external equilibrium. Internal equilibrium can be definedusing the concept of the nonaccelerating inflation rate of unemployment.External equilibrium is more difficult to operationalize, because it corre-sponds to a “sustainable” current account surplus or deficit. In practice, itis necessary to define a current account target for each country. This methodhas been widely applied (see, in particular, Wren-Lewis and Driver 1998).Its main advantage is that the methodology is transparent and openly nor-mative. Its main drawback is that it relies on price elasticities of trade that
70 DOLLAR ADJUSTMENT: HOW FAR? AGAINST WHAT?
2. This quotation can be found at http://www.g7.utoronto.ca/finance/fm040207.htm.
3. Bergsten (2004, 5). See also O’Neill and Hormats (2004).

are difficult to estimate, and on current account targets that can be seen asad hoc assumptions. In addition, as Ronald MacDonald (1997, 7) puts it,“The FEER approach per se does not embody a theory of exchange ratedetermination. Nonetheless, there is the implicit assumption that the actualreal effective exchange rate, q, will converge over time to the FEER.”
The second research avenue relies on observed long-run relationshipsbetween the real exchange rate and its determinants. This approach hasbeen proposed by MacDonald (1997) and Peter Clark and MacDonald (1998).The behavioral equilibrium exchange rate (BEER) contains no assessment onthe sustainability of the exchange rate path. It is an equilibrium rate onlyin the sense that the observed real exchange rate tends to come back tothe BEER after a shock, in the sense of the cointegration literature. Themisalignment is the difference between the actual exchange rate and theexchange rate provided by the permanent part of the model, which canincorporate a wide array of theories of exchange rate determination.
A number of researchers have developed approaches of the equilibriumexchange rate that fall between the FEER and the BEER. This is the case, forinstance, of the natural real exchange rate approach (NATREX) introducedby Jerome Stein (1994). As in the FEER approach, the NATREX is theexchange rate that permits the attainment of both internal and external equi-librium. However, the current account is modeled as the result of savingand investment behavior, as in a BEER approach. Because consumption isa positive function of the net foreign asset position (through a wealtheffect), it is possible to derive the equilibrium exchange rate by holding theratio of net foreign assets to GDP constant in the long run. The NATREXalso depends on productivity, which drives investment in the short run butgrowth and savings in the long run.
Carsten Detken and colleagues (2002), among others, have applied theNATREX methodology to the euro equilibrium exchange rate. The modeldeveloped by Hamid Faruqee, Peter Isard, and Paul Masson (1999) alsofalls between the two approaches, in that the current account target is deter-mined by econometric estimation of saving and investment behavior ratherthan a sustainability calculation.
Finally, a Balassa-Samuelson effect can be introduced either in the FEERor in the BEER, by assuming the existence of two sectors in the economy.The external equilibrium requirement then only applies to the tradable sec-tor, whereas internal equilibrium must include a long-run productivitydrift on top of short- to medium-run demand effects.4
Here we follow a methodology close to that used by Alberola and col-leagues (2002) and Alberola (2003), where the real exchange rate is jointlydetermined by external balance as well as internal balance. The realexchange rate is defined as the relative price of foreign currencies; hence,
BURDEN SHARING AND EXCHANGE RATE MISALIGNMENTS 71
4. See, e.g., Edwards (1989). Egert (2003) provides a recent review of equilibrium exchangerate estimations for transition countries, which generally include a Balassa-Samuelson effect.
it rises when the domestic currency depreciates in real terms. The priceindex at home and abroad is the geometric average of the price indicesof the tradable sector and of the nontradable sector. Assuming the shareof each sector is the same across countries, the real exchange rate can bewritten as the geometric average of the foreign-to-domestic relative pricein the tradable sector and of the “internal” real exchange rate, that is, the ratio of domestic nontradable-to-tradable relative price to foreignnontradable-to-tradable relative price.
The equilibrium relative price in the tradable sector is defined as the onethat allows the current account to reach a level that is consistent withdesired capital outflows or inflows, the latter being proportional to the dis-crepancy between the desired and observed levels of the net foreign asset(NFA) position.
The equilibrium internal real exchange rate stems from a Balassa-Samuelson effect; that is, the relative price of domestic nontradable goodsrises when productivity in the tradable sector rises relative to world produc-tivity. This very simple model leads to the following testable relationship:
where qt denotes the real effective exchange rate, nfat is the net foreign assetposition, and relpt stands for relative productivity in the tradable sectorcompared to the nontradable sector, as a ratio of foreign relative produc-tivity. We expect qt to fall (the real exchange rate to appreciate) when theNFA position rises, because a lower trade account is needed to reach agiven current account due to higher interest receipts, and because desiredcapital outflows are likely to diminish when the NFA position rises. Thereal exchange rate is also expected to appreciate when relpt rises, becausethis leads to a price increase in the nontradable sector, which experienceswage increases without productivity gains.
We consider 15 currencies corresponding to Argentina, Australia, Brazil,Canada, China, the eurozone, India, Indonesia, Japan, Mexico, South Africa,South Korea, Turkey, the United Kingdom, and the United States.5 Dataare annual and cover the period 1980 to 2001. The (log of the) real effectiveexchange rate for each country is calculated as a weighted average of realbilateral exchange rates, with consumer price indices.6 The weights rely onthe average geographic distribution of imports and exports of goods and ser-vices during the period 1999–2001. We do not want to use the “rest of the
q f nfa relpt t t= ( ), ( )4.1
72 DOLLAR ADJUSTMENT: HOW FAR? AGAINST WHAT?
5. Hence, our sample covers all G-20 countries except Russia and Saudi Arabia; France,Germany, and Italy are grouped into the euro area.
6. Nominal exchange rates are taken from the IMF, International Financial Statistics database,except the Chinese rate, which is taken from World Bank (1994) in order to include the non-official exchange rate before 1994. The consumer price indices are from the World Bank, WorldDevelopment Indicators. For Argentina and Brazil, bilateral real exchange rates are taken fromthe CHELEM database of the Centre d’Etudes Prospectives et d’Informations Internationales.

world” as a residual that would implicitly participate in the correction ofG-20 imbalances, despite its own balance of payments pattern. Introducingthe rest of the world as a residual would be especially misleading given theworld imbalance,7 and it is beyond the scope of G-20 meetings.8 Hence,trade weights here are normalized to sum to 1.
The NFA position is obtained from the Lane and Milesi-Ferretti database.9The stock data are updated using current accounts for 2000 and 2001. Weuse the ratio of the NFA position to GDP. Finally, relative productivity isproxied by the ratio of the consumer price index (CPI) to the producer priceindex (PPI), denoted rpit in logarithms.10 This widely used approximationstems from the idea that nontradable goods are included in the CPI but not(or not much) in the PPI. Therefore, the Balassa-Samuelson effect, whichpasses productivity growth differentials to the relative price of nontradableto tradable goods, should be caught through this variable.
The euro nominal exchange rate before 1999 is calculated as a weightedaverage of the 12 eurozone members. The weights used are the share of eachcountry in GDP at current exchange rates for each year of the sample. Thesame calculation is performed for price levels. The NFA position is takenfrom the European Commission (net international investment position)from 1998. Before 1998, the variable is obtained by subtracting the currentaccount of the eurozone aggregate.
Panel unit root and cointegration tests were performed using the variousmethodologies proposed in the literature (see, e.g., Pedroni 1996; Kao andChiang 2000). The series are found to be integrated of order 1 and cointe-grated in the panel (see appendix 4A). Table 4.1 reports the cointegration vec-tor obtained either with ordinary least squares (OLS) or the fully modifiedOLS method (FM-OLS) introduced by Peter Phillips and Bruce Hansen(1990). The two variables are significant and correctly signed; a rise in theNFA position or in the CPI/PPI ratio leads to a real exchange rate apprecia-tion. Moreover, the value of the parameter associated with rpi is close to −1,as expected.
Using a unique panel equation for calculating equilibrium exchange ratesrelies on the very strong assumption that the same behavior applies to allcountries. However, country-by-country estimates would be of poor econo-metric significance because there are only 22 observations per country.More important, the estimation period may not be representative of long-term behavior in some countries. For instance, the “desired” NFA positionmay in fact have moved in emerging-market countries, following capital lib-eralization or structural reforms. This could well have led to a positive rela-
BURDEN SHARING AND EXCHANGE RATE MISALIGNMENTS 73
7. Summing world current accounts tends to produce a world deficit.
8. This is true in the same way as China’s misalignment is out of the scope of G-7 meetings.
9. This database can be found at www.tcd.ie/iiis/plane/data.html.
10. PPIs are taken from the International Monetary Fund, International Financial Statistics. ForArgentina, Brazil, and Turkey, wholesale prices from national sources are used.

tionship between nfa and q (a fall in the NFA position being concomitantwith exchange rate appreciation). In a similar way, price liberalization mayhave polluted the relationship between rpi and q. Such specific behaviors insome countries in the past may have little to say about the future.
In addition, for world consistency, it is not possible to say that a rise inthe NFA position leads with opposite exchange rate reactions in two dif-ferent countries, just because the NFA of one country should be reflectedin the NFAs of its partners. For all these reasons, we believe that workingon a single, panel equation is more appropriate for deriving a set of con-sistent equilibrium exchange rates.11
In figure 4.1, the real equilibrium exchange rate calculated with the FM-OLS panel estimation is compared with the observed rate in each of the15 countries. By construction, the average of both series over the whole1980–2001 period is the same. This is due to the fact that the residuals of theestimation have a zero average. Hence, it is implicitly assumed that the realeffective exchange rate was at its equilibrium level, on average, over thisperiod. The misalignments observed at any point in time are conditional onthis assumption.
For the whole period 1980–2001, the equilibrium real exchange rateappears relatively stable in Canada, Mexico, the United States, and SouthAfrica. The result obtained for the United States may appear puzzling. Itstems from the offsetting effects of a fall in the NFA position (which depre-ciates the equilibrium exchange rate) and of a rise in the CPI/PPI ratio(which induces an appreciation), especially in the second half of the period.Consistent with common wisdom, the US dollar appears overvalued from1983 to 1986. It is undervalued from 1988 to 1995, and overvalued again
74 DOLLAR ADJUSTMENT: HOW FAR? AGAINST WHAT?
11. Further discussion of “in-sample” versus “out-of-sample” estimations of equilibriumexchange rates can be found in Egert, Lahrèche-Révil, and Lommatzsch (2004).
Table 4.1 Cointegration vector obtained witheither ordinary least squares (OLS)or fully modified OLS (FM-OLS)estimation in a panel context withfixed effects
Variable OLS FM-OLS
q 1.0 1.0
nfa −0.4323 (−3.80) −0.6398 (−6.28)
rpi −0.8755 (−9.08) −0.9349 (−10.61)
q = real effective exchange ratenfa = net foreign assetrpi = relative productivity index
Note: t-statistics are given in parentheses.
Source: Authors’ calculations.

BURDEN SHARING AND EXCHANGE RATE MISALIGNMENTS 75
Argentina
–0.6
–0.4
–0.2
0
0.2
0.4
0.6
0.8
1980 1983 1986 1989 1992 1995 1998 2001
ObservedREER
EquilibriumREER
rate
1980 1983 1986 1989 1992 1995 1998 2001
ObservedREER
EquilibriumREER
rate
Australia
–0.15
–0.10
–0.05
0
0.05
0.10
0.15
0.20
0.25
0.30
ObservedREER
EquilibriumREER
rate
1980 1983 1986 1989 1992 1995 1998 2001
Brazil
–0.3
–0.2
–0.1
0
0.1
0.2
0.3
0.4
ObservedREER
EquilibriumREER
rate
1980 1983 1986 1989 1992 1995 1998 2001–0.10
–0.05
0
0.05
0.10
0.15
0.20
0.25
0.30
0.35
Canada
ObservedREER
EquilibriumREER
rate
1980 1983 1986 1989 1992 1995 1998 2001
China
–0.8
–0.6
–0.4
–0.2
0
0.2
0.4
ObservedREER
EquilibriumREER
rate
1980 1983 1986 1989 1992 1995 1998 2001
Eurozone
–0.05
0
0.05
0.10
0.15
0.20
0.25
0.30
0.35
Figure 4.1 Real effective exchange rates calculated using FM-OLS,1980–2001
(figure continues next page)

76 DOLLAR ADJUSTMENT: HOW FAR? AGAINST WHAT?
1980 1983 1986 1989 1992 1995 1998 2001
ObservedREER
EquilibriumREER
rate
India
–0.5
–0.4
–0.3
–0.2
–0.1
0
0.1
0.2
0.3
0.4
ObservedREER
EquilibriumREER
rate
1980 1983 1986 1989 1992 1995 1998 2001
Japan
–0.4
–0.3
–0.2
–0.1
0
0.1
0.2
0.3
0.4
0.5
ObservedREER
EquilibriumREER
rate
1980 1983 1986 1989 1992 1995 1998 2001
Mexico
–0.6
–0.5
–0.4
–0.3
–0.2
–0.1
0
0.1
0.2
0.3
0.4
1980 1983 1986 1989 1992 1995 1998 2001
ObservedREER
EquilibriumREER
rate
South Africa
–0.4
–0.3
–0.2
–0.1
0
0.1
0.2
0.3
0.4
ObservedREEREquilibrium
REER
rate
1980 1983 1986 1989 1992 1995 1998 2001
South Korea
–0.10
–0.05
0
0.05
0.10
0.15
0.20
0.25
0.30
0.35
0.40
Indonesia
1980 1983 1986 1989 1992 1995 1998 2001
ObservedREER
EquilibriumREER
rate
–1.0
–0.8
–0.6
–0.4
–0.2
0
0.2
0.4
0.6
0.8
1.0
Figure 4.1 Real effective exchange rates calculated using FM-OLS,1980–2001 (continued )

BURDEN SHARING AND EXCHANGE RATE MISALIGNMENTS 77
United States
1980 1983 1986 1989 1992 1995 1998 2001
ObservedREER
EquilibriumREER
rate
–0.25
–0.20
–0.15
–0.10
–0.05
0
0.05
0.10
FM-OLS = fully modified ordinary least squaresREER = real effective exchange rate
Note: Rise = depreciation.
ObservedREER
EquilibriumREER
rate
1980 1983 1986 1989 1992 1995 1998 2001
United Kingdom
–0.20
–0.15
–0.10
–0.05
0
0.05
0.10
0.15
ObservedREER
EquilibriumREER
rate
1980 1983 1986 1989 1992 1995 1998 2001
Turkey
–0.25
–0.20
–0.15
–0.10
–0.05
0
0.05
0.10
0.15
0.20
0.25
Figure 4.1 (continued )
from 1997 to 2001. The Mexican peso also appears to be overvalued at theend of the period, whereas the Canadian dollar is undervalued due to asharp depreciation from 1996 to 2001.
Conversely, the real equilibrium exchange rate tends to appreciate dur-ing the period in Argentina, China, Japan, South Korea, Turkey, and theeurozone. This movement stems from rising NFAs in the eurozone, from arising CPI/PPI ratio in Argentina and Turkey, and from both effects inChina, Japan, and South Korea.
Finally, the depreciation of the equilibrium exchange rate during theperiod is sizable in Australia, India, Indonesia, and the United Kingdom.In all cases, the CPI/PPI ratio declines over the period. In all cases but the
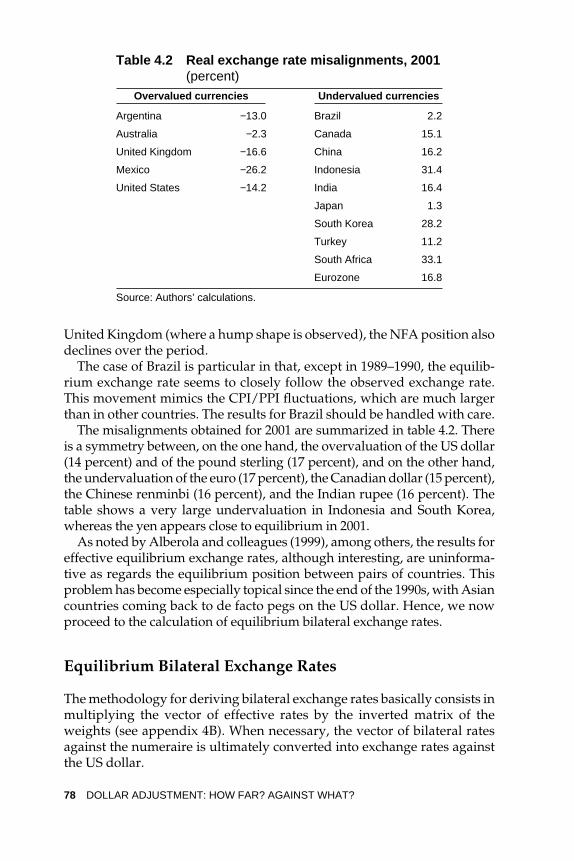
United Kingdom (where a hump shape is observed), the NFA position alsodeclines over the period.
The case of Brazil is particular in that, except in 1989–1990, the equilib-rium exchange rate seems to closely follow the observed exchange rate.This movement mimics the CPI/PPI fluctuations, which are much largerthan in other countries. The results for Brazil should be handled with care.
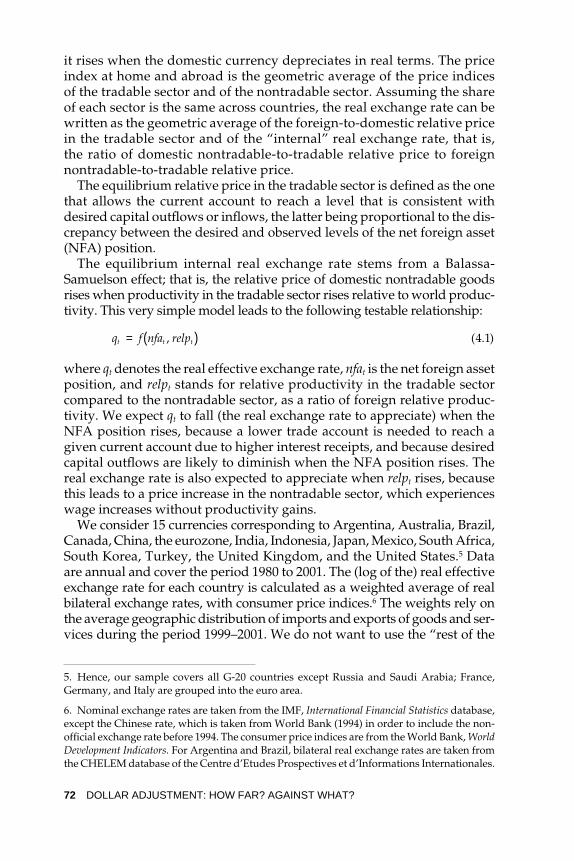
The misalignments obtained for 2001 are summarized in table 4.2. Thereis a symmetry between, on the one hand, the overvaluation of the US dollar(14 percent) and of the pound sterling (17 percent), and on the other hand,the undervaluation of the euro (17 percent), the Canadian dollar (15 percent),the Chinese renminbi (16 percent), and the Indian rupee (16 percent). Thetable shows a very large undervaluation in Indonesia and South Korea,whereas the yen appears close to equilibrium in 2001.
As noted by Alberola and colleagues (1999), among others, the results foreffective equilibrium exchange rates, although interesting, are uninforma-tive as regards the equilibrium position between pairs of countries. Thisproblem has become especially topical since the end of the 1990s, with Asiancountries coming back to de facto pegs on the US dollar. Hence, we nowproceed to the calculation of equilibrium bilateral exchange rates.
Equilibrium Bilateral Exchange Rates
The methodology for deriving bilateral exchange rates basically consists inmultiplying the vector of effective rates by the inverted matrix of theweights (see appendix 4B). When necessary, the vector of bilateral ratesagainst the numeraire is ultimately converted into exchange rates againstthe US dollar.
78 DOLLAR ADJUSTMENT: HOW FAR? AGAINST WHAT?
Table 4.2 Real exchange rate misalignments, 2001(percent)
Overvalued currencies Undervalued currencies
Argentina −13.0 Brazil 2.2
Australia −2.3 Canada 15.1
United Kingdom −16.6 China 16.2
Mexico −26.2 Indonesia 31.4
United States −14.2 India 16.4
Japan 1.3
South Korea 28.2
Turkey 11.2
South Africa 33.1
Eurozone 16.8
Source: Authors’ calculations.

Because we work in a closed, G-20 framework, there is no “rest of theworld.” Hence, each of the 15 effective exchange rates is a weighted aver-age of 14 bilateral rates. This means that, when moving to bilateral rates,one of the 15 currencies must be selected as the numeraire. In the deriva-tion of bilateral rates, the misalignment in effective terms for this currencywill not be accounted for. Hence, the choice of the numeraire is of highimportance. In the following, we successively use different numeraires andcompare the results.
The Dollar as the Numeraire
Here we calculate equilibrium bilateral exchange rates against the dollarwhen taking the dollar as the numeraire. It should be kept in mind that thisamounts to neglecting the misalignment of the effective rate of the dollar inthe calculation. The results are displayed in figure 4.2. Contrasting to effec-tive rates, there is no equality between average equilibrium and averageobserved bilateral rates. For instance, one currency can be systematicallyundervalued against the US dollar (provided it is systematically overvaluedagainst another currency). However, in practice, the shape of equilibriumbilateral rates against the US dollar is generally close to that of the effectiverate. The United Kingdom is an exception, with a stable equilibrium rateagainst the US dollar despite the depreciating trend in effective terms.
Table 4.3 reports the bilateral misalignments in 2001. All currencies butthe Mexican peso appear undervalued against the US dollar, which meansthat the US dollar is overvalued against all currencies but the peso. We thencalculate the bilateral real exchange rate variations between 2001 and 2003to obtain an estimate of misalignments in 2003, provided the equilibriumexchange rate stayed at its 2001 level. Given its strong appreciation between2001 and 2003, the euro appears undervalued by only 7.6 percent in 2003compared with 30.5 percent in 2001. Canada, Indonesia, and South Koreaalso reduce their amount of undervaluation. The British pound switchesfrom undervaluation in 2001 to overvaluation in 2003, whereas the under-valuation of the yen remains stable at about 22 percent. The large under-valuation of the Chinese currency (44.0 percent) was slightly larger still in2003 (47.3 percent), given the peg on the dollar and low inflation differen-tial between China and the United States over this period. Finally, the caseof Argentina is puzzling, with a huge undervaluation due to the fall of thecurrency after the crisis. The hypothesis of a constant equilibrium exchangerate between 2001 and 2003 is likely to be violated in this country, invali-dating the 2003 estimated misalignment.
Alternative Numeraires
As was argued above, the effective misalignment of the numeraire cur-rency is not taken into account in the derivation of bilateral misalignments.
BURDEN SHARING AND EXCHANGE RATE MISALIGNMENTS 79

80 DOLLAR ADJUSTMENT: HOW FAR? AGAINST WHAT?
Argentina
–0.8
–0.6
–0.4
–0.2
0
0.2
0.4
0.6
0.8
1980 1983 1986 1989 1992 1995 1998 2001
ObservedRER
EquilibriumRER
rate
1980 1983 1986 1989 1992 1995 1998 2001
ObservedRER
EquilibriumRER
rate
Australia
–0.1
0
0.1
0.2
0.3
0.4
0.5
ObservedRER
EquilibriumRER
rate
1980 1983 1986 1989 1992 1995 1998 2001
Brazil
–0.3
–0.2
–0.1
0
0.1
0.2
0.3
0.4
0.5
0.6
ObservedRER
EquilibriumRER
rate
1980 1983 1986 1989 1992 1995 1998 2001
Canada
–0.10
–0.05
0
0.05
0.10
0.15
0.20
0.25
0.30
0.35
0.40
ObservedRER
EquilibriumRER
rate
1980 1983 1986 1989 1992 1995 1998 2001
China
–1.2
–1.0
–0.8
–0.6
–0.4
–0.2
0
0.2
0.4
1980 1983 1986 1989 1992 1995 1998 2001
ObservedRER
EquilibriumRER
rate
Eurozone
–0.1
0
0.1
0.2
0.3
0.4
0.5
0.6
Figure 4.2 Equilibrium bilateral exchange rates against the dollar,1980–2001
BURDEN SHARING AND EXCHANGE RATE MISALIGNMENTS 81
Figure 4.2 (continued )
1980 1983 1986 1989 1992 1995 1998 2001
ObservedRER
EquilibriumRER
rate
India
–0.5
–0.4
–0.3
–0.2
–0.1
0
0.1
0.2
0.3
0.4
0.5
ObservedRER
EquilibriumRER
rate
1980 1983 1986 1989 1992 1995 1998 2001
Japan
–0.4
–0.3
–0.2
–0.1
0
0.1
0.2
0.3
0.4
0.5
ObservedRER
EquilibriumRER
rate
1980 1983 1986 1989 1992 1995 1998 2001
South Korea
–0.2
–0.1
0
0.1
0.2
0.3
0.4
0.5
ObservedRER
EquilibriumRER
rate
1980 1983 1986 1989 1992 1995 1998 2001
Mexico
–0.6
–0.5
–0.4
–0.3
–0.2
–0.1
0
0.1
0.2
0.3
0.4
Indonesia
1980 1983 1986 1989 1992 1995 1998 2001
ObservedRER
EquilibriumRER
rate
–1.0
–0.8
–0.6
–0.4
–0.2
0
0.2
0.4
0.6
0.8
1.0
South Africa
1980 1983 1986 1989 1992 1995 1998 2001
ObservedRER
EquilibriumRER
rate
–0.4
–0.3
–0.2
–0.1
0
0.1
0.2
0.3
0.4
0.5
0.6
0.7
(figure continues next page)

This means that using the US dollar as the numeraire may lead to mis-leading results, because the dollar appears overvalued in effective terms in2001 (table 4.2).
To quantify this problem, we calculated two additional sets of equilib-rium bilateral rates. The first one uses the euro as the numeraire. The sec-ond one uses the Turkish lira. Turkey is the country with the smallest sharein the trade of its other G-20 partners (and it also appeared close to equi-librium in 2003; see table 4.3). Hence, not accounting for Turkish misalign-ments is unlikely to have a major distortionary impact on other bilateralrates. For the sake of comparability, all bilateral rates are ultimately con-verted into bilateral rates against the US dollar using the correspondingequilibrium dollar-euro or dollar-lira exchange rate. In fact, the misalign-ments obtained with the euro and with the Turkish lira as the numeraireare very close to each other. Hence, table 4.4 reports only the misalign-ments with the euro as the numeraire in 2001 and 2003 (along with theresults already presented in table 4.3).
When the euro is used as the numeraire, the dollar-euro rate appears atequilibrium in 2003, whereas a slight undervaluation of the euro remains in2003 when the dollar is used as the numeraire. This difference can be relatedto the fact that the amount of euro undervaluation in effective terms in 2001is lower than the amount of dollar overvaluation (table 4.2); hence, neglectingeuro undervaluation in effective terms leads to lower euro undervaluationagainst the dollar than when the dollar’s effective overvaluation is neglected.
Another reason for this difference is the fact that the (normalized) shareof the United States in eurozone trade (28.9 percent) is higher than the share
82 DOLLAR ADJUSTMENT: HOW FAR? AGAINST WHAT?
Figure 4.2 Equilibrium bilateral exchange rates against the dollar,1980–2001 (continued )
RER = real exchange rate
Note: Rise = depreciation.
ObservedRER
EquilibriumRER
rate
1980 1983 1986 1989 1992 1995 1998 2001
United Kingdom
–0.2
–0.1
0
0.1
0.2
0.3
0.4
0.5
ObservedRER
EquilibriumRER
rate
1980 1983 1986 1989 1992 1995 1998 2001
Turkey
–0.3
–0.2
–0.1
0
0.1
0.2
0.3
0.4

BURDEN SHARING AND EXCHANGE RATE MISALIGNMENTS 83
Table 4.3 Bilateral misalignments against the US dollar, 2001 and 2003 (percent; numeraire = US dollar)
Real exchange variation Misalignment in 2003
Country or Misalignment in between based on 2001 region 2001 2001 and 2003 equilibrium rate
Argentina 17.8 74.7 92.5Australia 21.0 −24.5 −3.5Brazil 19.2 8.3 27.4Canada 19.0 −11.2 7.8China 44.0 3.3 47.3Eurozone 30.5 −22.9 7.6India 37.6 −5.5 32.0Indonesia 54.6 −31.7 22.9Japan 21.8 0.3 22.1Mexico −22.0 8.9 −13.1South Africa 54.9 −22.9 32.0South Korea 48.0 −10.4 37.5Turkey 36.3 −35.6 0.7United Kingdom 8.8 −13.3 −4.4
Note: A positive sign denotes an undervaluation.
Source: Authors’ calculations.
of the eurozone in US trade (19.3 percent). Hence, a smaller adjustment inthe dollar-euro exchange rate is needed to reach the equilibrium effectiverate of the euro than the equilibrium effective rate of the dollar. For othercountries, the difference between the two calculations is quite small.
The Number of Adjustees
As was stressed at the start of the chapter, one central argument in thedebate on exchange rate misalignments is the fact that the lack of adjust-ment in some countries may magnify the burden of the adjustment forother countries. Indeed, the equilibrium bilateral exchange rate calculationsproposed in the previous section implicitly assume that all exchange ratesadjust simultaneously. In this section, we try to quantify the impact ofsome countries’ refraining from letting their real exchange rate adjust.
To this end, several sets of equilibrium bilateral exchange rates are calcu-lated depending on the number of currencies that are flexible. Equilibriumbilateral rates are calculated in the same way as in the previous section.However, the country that does not allow for exchange rate adjustment isremoved from the calculations: Its effective real exchange rate does notparticipate in the correction of imbalances; remaining bilateral exchangerates adjust to move remaining effective exchange rates to their equilibriumvalues. Five scenarios are compared:
� S0 is the benchmark scenario where all currencies adjust.
� S1: All currencies but the renminbi adjust.

� S2: The currencies of emerging-market Asian countries (China, India,Indonesia, and South Korea) do not adjust.
� S3: Asian currencies (China, India, Indonesia, South Korea, and Japan)do not adjust.
� S4: Only G-7 currencies (US dollar, Canadian dollar, euro, yen, andpound sterling) adjust.
As in the previous section, we proceed by inverting the system of equi-librium effective rates. We assume that nonadjusters have fixed exchangerates against the US dollar. As is detailed in appendix 4B, when the US dol-lar is used as the numeraire, this amounts to removing both the rows andthe columns corresponding to nonadjusters, which means that their effec-tive misalignment is no longer taken into account in the calculation, andthat their bilateral rates against the numeraire (the US dollar) are fixed.
When the euro is used as the numeraire, the bilateral rates to be held con-stant are not bilateral rates against the numeraire (ei) but bilateral ratesagainst the US dollar (ei − eD). For instance, the renminbi-euro rate (eY) movesexactly like the dollar-euro rate (eD). Once again, the rows and columns cor-responding to nonadjusters must be removed. But now, the correspondingweights must be transferred to the US dollar column (see appendix 4B).
84 DOLLAR ADJUSTMENT: HOW FAR? AGAINST WHAT?
Table 4.4 Bilateral misalignments against the US dollar, 2001 and 2003 (percent)
Realexchange Misalignment in 2003variation based on 2001
Misalignment in 2001 between equilibrium rateCountry or Dollar as Euro as 2001 and Dollar as Euro asregion numeraire numeraire 2003 numeraire numeraire
Argentina 17.8 12.8 74.7 92.5 87.5Australia 21.0 17.3 −24.5 −3.5 −7.2Brazil 19.2 15.1 8.3 27.4 23.4Canada 19.0 18.1 −11.2 7.8 6.9China 44.0 40.8 3.3 47.3 44.1Eurozone 30.5 22.0 −22.9 7.6 −0.9India 37.6 33.2 −5.5 32.0 27.6Indonesia 54.6 51.1 −31.7 22.9 19.4Japan 21.8 18.8 0.3 22.1 19.1Mexico −22.0 −22.7 8.9 −13.1 −13.9South Africa 54.9 49.6 −22.9 32.0 26.7South Korea 48.0 44.9 −10.4 37.5 34.5Turkey 36.3 29.6 −35.6 0.7 −6.0United Kingdom 8.8 2.6 −13.3 −4.4 −10.7
Note: A positive sign denotes an undervaluation.
Source: Authors’ calculations.

The impact of the lack of adjusters on remaining misalignments isambiguous. Suppose, for instance, that the renminbi is fixed against theUS dollar. When depreciating toward equilibrium, the dollar must depre-ciate more against the euro because it does not depreciate against the ren-minbi. To put the same point a different way, the euro has to appreciatemore against the dollar if the renminbi does not adjust. However, if theproblem were that the dollar was undervalued, the euro would need todepreciate less against the US dollar when the renminbi appreciates withthe dollar. In general, then, the impact of the lack of adjusters is an empir-ical question.
The results for the G-7 currencies with the two alternative numerairesare displayed in table 4.5. Consistent with the above reasoning, the over-valuation of the dollar against the euro is larger when some adjusters arelacking if the euro is taken as the numeraire, but smaller if the dollar istaken as the numeraire. The latter result comes from the fact that the eurois undervalued in effective terms: If the renminbi does not appreciate, then
BURDEN SHARING AND EXCHANGE RATE MISALIGNMENTS 85
Table 4.5 Bilateral misalignments against the US dollar in the various scenarios (percent)
Realexchange
ratevariation
Misalignment in 2001 between Misalignment in 2003Country or Numeraire Numeraire 2001 and Numeraire Numeraireregion Scenario � euro � dollar 2003 � euro � dollar
Canada S0 18.1 19.0 −11.2 7.0 7.8S1 18.2 17.5 −11.2 7.0 6.3S2 18.2 17.6 −11.2 7.0 6.4S3 18.2 17.1 −11.2 7.0 5.9S4 18.2 17.9 −11.2 7.0 6.7
Eurozone S0 22.0 30.5 −22.9 −0.9 7.6S1 32.4 24.9 −22.9 9.6 2.1S2 32.2 25.7 −22.9 9.3 2.8S3 38.4 24.0 −22.9 15.5 1.2S4 31.3 27.2 −22.9 8.5 4.3
United Kingdom S0 2.6 8.9 −13.3 −10.7 −4.4S1 9.2 3.7 −13.3 −4.1 −9.6S2 9.0 4.4 −13.3 −4.2 −8.8S3 12.9 2.8 −13.3 −0.4 −10.5S4 8.7 5.8 −13.3 −4.6 −7.5
Japan S0 18.8 21.8 0.3 19.1 22.1S1 16.1 14.0 0.3 16.4 14.3S2 16.4 14.9 0.3 16.6 15.2S3 16.5 15.6 0.3 16.7 15.8
Note: A positive sign denotes an undervaluation.
Source: Authors’ calculations.

the needed appreciation of the euro against the US dollar (which is takenas the numeraire) is smaller because there is no depreciation against therenminbi.
Hence, the magnification or dampening effect of fewer adjusters dependson the numeraire chosen, that is, on whether the analysis focuses on anovervalued currency (the US dollar) or on an undervalued one (the euro).However, the sensitivity of the dollar-euro misalignment to the lack ofadjusters is weaker in the dampening case than in the magnification one, sothat it is likely that fewer adjusters will magnify the needed dollar-euroadjustment. This feature can be related to the fact that, as mentioned above,bilateral trade between the eurozone and the United States is more impor-tant for the eurozone than it is for the US economy. Hence, what happensin the rest of the world impacts more on the dollar-euro misalignmentswhen focusing on the US imbalance (with the euro as the numeraire) thanon the eurozone imbalance (with the US dollar as the numeraire).
It has been argued above that the dollar-euro exchange rate was closeto equilibrium in 2003. This corresponds to the baseline scenario (S0). Thelack of adjustment from China and other Asian countries leads to a resid-ual undervaluation of the euro that can be as large as 16 percent in thecalculation with the euro as the numeraire if the yen does not adjust. Inter-estingly, the bulk of this effect comes from China, because that is whereundervaluation was largest in 2003 (see table 4.3). Indeed, scenarios S1 to S4appear relatively close to each other in the second half of the period becausethey are dominated by the lack of adjustment in China. It is less the case inthe 1990s where scenarios S1, S2, and S3 clearly fall between S0 and S4 (seefigure 4.3).
Turning to other G-7 currencies, it is worth noting that with the euro asnumeraire the lack of adjusters largely eliminates the overvaluation of thepound sterling against the US dollar found in the baseline scenario in 2003.In the case of Japan, the lack of appreciation in other Asian countriesreduces the needed appreciation of the yen against the US dollar. This isbecause the effective exchange rate of the yen is close to equilibrium: IfAsian currencies appreciate, then the yen needs to appreciate against theUS dollar to keep the effective rate stable, but this is no longer necessary ifAsian currencies do not appreciate. Finally, the impact of a reduced num-ber of adjusters is negligible for Canada due to the overwhelming share ofthe US dollar in the effective exchange rates (81.7 percent in our normalizeddatabase), which leaves little room for an impact of other bilateral rates.
It has been found above that the lack of adjusters has an ambiguousimpact on the equilibrium dollar-euro rate depending on the numeraire(euro vs. dollar), but that the magnifying effect is likely to dominate. Thispoint can be checked by using a third currency as the numeraire. One can-didate is the Turkish lira because Turkey’s share in US and eurozonetrade is small. Another candidate is the yen, which is the currency clos-est to its equilibrium level (in effective terms) in 2001. The results (table 4.6)
86 DOLLAR ADJUSTMENT: HOW FAR? AGAINST WHAT?

BURDEN SHARING AND EXCHANGE RATE MISALIGNMENTS 87
Canada
–0.15
–0.10
–0.05
0
0.05
0.10
0.15
0.20
1980 1982 1984 1986 1988 1990 1992 1994 1996 1998 2000
Scenario 0Scenario 1Scenario 2Scenario 3Scenario 4
rate
rateUnited Kingdom
–0.4
–0.3
–0.2
–0.1
0
0.1
0.2
0.3
0.4
1980 1982 1984 1986 1988 1990 1992 1994 1996 1998 2000
Figure 4.3 Adjustment scenarios for selected Group of Seven currencies (numeraire = euro,1980–2001)
(figure continues next page)

88 DOLLAR ADJUSTMENT: HOW FAR? AGAINST WHAT?
Figure 4.3 Adjustment scenarios for selected Group of Seven currencies (numeraire = euro,1980–2001) (continued )
Japanrate
rate
1980 1982 1984 1986 1988 1990 1992 1994 1996 1998 2000
1980 1982 1984 1986 1988 1990 1992 1994 1996 1998 2000
Eurozone
–0.4
–0.3
–0.2
–0.1
0
0.1
0.2
0.3
0.4
–0.6
–0.5
–0.4
–0.3
–0.2
–0.1
0
0.1
0.2
0.3
0.4
0.5
Notes: Key is same for all four figures.Rise = depreciation.Scenarios in Canada and Japan appear close to each other.Bilateral misalignments against the US dollar are based on panel estimations of equi- librium exchange rates.
Source: Authors’ calculations.

confirm that having fewer adjusters tends to raise the bilateral dollar-euromisalignment. As expected, the difference across the scenarios is smallerwhen the yen or the Turkish lira is the numeraire. The difference across thescenarios is especially small when the yen is used as the numeraire. Hence,one should not exaggerate the “burden-sharing” argument according towhich a lack of adjusters magnifies the dollar-euro misalignment.
Conclusions
In this chapter, we have tried to produce a quantitative analysis of exchangerate misalignments in a closed G-20 framework. The first step consists inestimating real effective equilibrium rates based on the same modelthrough a panel cointegration approach on 15 of the G-20 currencies. Thisfirst step is useful in that it provides a quantification of misalignments foreach country. However, the policy discussion needs to translate effectivemisalignments into bilateral misalignments. This is the second step, whichconsists in deriving the full set of bilateral misalignments on the basis ofeffective misalignments.
This second step is difficult, because only n − 1 independent bilateral ratescan be derived from a set of n effective rates. One solution is to add an nth
BURDEN SHARING AND EXCHANGE RATE MISALIGNMENTS 89
Table 4.6 Bilateral misalignments against the US dollar in 2001 depending on the numeraire
Country or Numeraireregion Scenario Euro Dollar Turkish lira Yen
Canada S0 18.1 19.0 18.2 18.2S1 18.2 17.5 18.2 18.1S2 18.2 17.6 18.2 18.1S3 18.2 17.1 18.2 n.a.S4 18.2 17.9 18.2 18.2
Eurozone S0 22.0 30.5 23.8 27.5S1 32.4 24.9 30.7 27.2S2 32.2 25.7 30.6 27.4S3 38.4 24.0 34.7 n.a.S4 31.3 27.2 30.2 28.1
United Kingdom S0 2.6 8.9 2.9 6.0S1 9.2 3.7 8.8 5.9S2 9.0 4.4 8.8 6.1S3 12.9 2.8 12.2 n.a.S4 8.7 5.8 8.5 6.7
Japan S0 18.8 21.8 18.9 n.a.S1 16.1 14.0 16.0 n.a.S2 16.4 14.9 16.3 n.a.S4 16.5 15.6 16.4 n.a.
n.a. = not available
Source: Authors’ calculations.

currency representing the rest of the world. However, this solution meansthat G-20 countries transfer to third countries the burden of overall adjust-ment. Keeping the analysis within G-20 boundaries implies choosing one ofthe G-20 currencies as the numeraire, which means that the effective mis-alignment of this currency will be dropped in the calculation of bilateral rates.
By using various alternative numeraires, we can show the diagnosis ofbilateral misalignments to be robust for most currencies. However, suchdiagnosis assumes a simultaneous adjustment of all G-20 currencies. Onemain point of debate in the early 2000s has been the lack of adjustment ofsome G-20 currencies. The last step of this chapter is to quantify the impactof such a lack of adjustment on bilateral misalignments for other currencies.
On the whole, the analysis suggests that the dollar-euro exchange ratewas close to equilibrium in 2003, conditional on the acceptance, by Chinaand other Asian countries, of a rather large undervaluation of their own cur-rencies against the US dollar. We also show that the lack of adjustment inAsia tended to magnify the dollar’s overvaluation in 2001, and to a lesserextent in 2003. However, this effect is less general than might be believed,because the lack of appreciation of Asian currencies also helps the euro toreach its equilibrium level in effective terms. And in the case of Japan, thelack of adjusters reduces the amount of the yen-dollar misalignmentbecause the yen is found to be close to equilibrium in effective terms in 2001.
References
Alberola, E. 2003. Misalignment, Liabilities, Dollarization, and Exchange Rate Adjustment in LatinAmerica. Banco de España documento de trabajo 0309. Madrid: Banco de España.
Alberola E., S. G. Cervero, H. Lopez, and A. Ubide. 2002. Quo vadis euro? European Journal ofFinance 8, no. 4 (December): 352–70.
Bergsten, C. F. 2004. The G-20 and the World Economy. Speech to the Deputies of the G-20,Leipzig, Germany, March 4. www.iie.com/publications/papers/bergsten0304-2.htm.
Clark, Peter, and Ronald MacDonald. 1998. Exchange Rates and Economic Fundamentals: A Methodological Comparison of BEERs and FEERs. IMF Working Paper 98/671. Washington:International Monetary Fund.
Detken, C. A., A. Dieppe, J. Henry, C. Marin, and F. Smets. 2002. Model Uncertainty and theEquilibrium Value of the Real Effective Euro Exchange Rate. ECB Working Paper 160.Frankfurt: European Central Bank.
Edwards, Sebastian. 1989. Real Exchange Rates, Devaluation and Adjustment. Cambridge, MA:MIT Press.
Egert, Balasz. 2003. Assessing Equilibrium Exchange Rates in Acceding Countries: Can We HaveDEER with BEER Without FEER? A Critical Survey of the Literature. Focus on Transition2/2003. Vienna: Oesterreichische Nationalbank.
Egert, Balasz, A. Lahrèche-Révil, and K. Lommatzsch. 2004. The Stock-Flow Approach to theReal Exchange Rate of the EU Acceding Countries: In-Sample Versus Out-of-SampleEstimates. Centre d’Etudes Prospectives et d’Informations Internationales, Paris. Workingpaper (forthcoming).
Faruqee, H., P. Isard, and P. R. Masson. 1999. A Macroeconomic Balance Framework forEstimating Equilibrium Exchange Rates. In Equilibrium Exchange Rates, ed. R. MacDonaldand J. Stein. Boston: Kluwer Academic Publishers.
90 DOLLAR ADJUSTMENT: HOW FAR? AGAINST WHAT?

Im, K. S., M. H. Pesaran, and Y. Shin. 2003. Testing for Unit Roots in Heterogeneous Panels.Journal of Econometrics, 115: 53–74.
Kao, C., and M. H. Chiang. 2000. On the Estimation and Inference of a Cointegrated Regressionin Panel Data. In Advances in Econometrics, vol. 15, ed. B. Baltagi and C. Kao. Burlington,MA: Elsevier Science.
Levin, A., and C. F. Lin. 1992. Unit Root Tests in Panel Data: Asymptotic and Finite Sample Properties.Discussion Paper 56. La Jolla, CA: Department of Economics, University of California, SanDiego.
MacDonald, R. 1997. What Determines the Real Exchange Rate? The Long and the Short of It. IMFWorking Paper 97/21. Washington: International Monetary Fund.
Maddala, G., and S. Wu. 1999. A Comparative Study of Unit Root Tests and a New SimpleTest. Oxford Bulletin of Economics and Statistics 61: 631–52.
Maeso-Fernandez, F., C. Osbat, and B. Schnatz. 2001. Determinants of the Euro Real EffectiveExchange Rate: A BEER/PEER Approach. ECB Working Paper 85. Frankfurt: EuropeanCentral Bank.
O’Neill, J., and R. Hormats. 2004. The G-8: Time for a Change. Global Economics Paper 112. NewYork: Goldman Sachs.
Pedroni, P. 1996. Fully Modified OLS for Heterogeneous Cointegrated Panels and the Case ofPurchasing Power Parity. Working Paper in Economics. Bloomington: Department ofEconomics, Indiana University.
Pedroni, P. 2004. Panel Cointegration: Asymptotic and Finite Sample Properties of Pooled TimeSeries Tests with an Application to the PPP Hypothesis. Econometric Theory 20(3): 597–625.
Phillips, P. C. B., and B. E. Hansen. 1990. Statistical Inference in Instrumental VariablesRegression with I(1) Processes. Review of Economic Studies 57: 99–125.
Saikkonen, P. 1991. Asymptotically Efficient Estimation of Cointegrating Regressions.Econometric Theory 58: 1–21.
Stein, Jerome. 1994. The Natural Real Exchange Rate of the US Dollar and Determinants ofCapital Flows. In Estimating Equilibrium Exchange Rates, ed. John Williamson. Washington:Institute for International Economics.
Stock, J., and M. Watson. 1993. A Simple Estimator of Cointegrating Vectors in Higher-OrderIntegrated Systems. Econometrica 61: 783–820.
Williamson, John. 1983. The Exchange Rate System. POLICY ANALYSES IN INTERNATIONAL
ECONOMICS 5. Washington: Institute for International Economics.Williamson, John. 1994. Estimates of FEERs. In Estimating Equilibrium Exchange Rates, ed. John
Williamson. Washington: Institute for International Economics.World Bank. 1994. China GNP per Capita. Report 13580-CHA. Country Operations Division,
World Bank, Washington, Document of the World Bank, December 15.Wren-Lewis, Simon, and Rebecca Driver. 1998. Real Exchange Rates for the Year 2000. POLICY
ANALYSES IN INTERNATIONAL ECONOMICS 54. Washington: Institute for InternationalEconomics.
BURDEN SHARING AND EXCHANGE RATE MISALIGNMENTS 91

Appendix 4AUnit Root and Cointegration Results
92 DOLLAR ADJUSTMENT: HOW FAR? AGAINST WHAT?
Table 4A.2 Pedroni panel cointegration testsPanel cointegration tests: Group mean cointegration tests:
q � f (nfa,rpi ) q � f (nfa,rpi )Nonparametric Parametric Nonparametric Parametric
v-test � test t-test t-test � test t-test t-test
2.9013* −1.0187 −0.9223 −1.6543* 0.0204 −0.7972 −1.5402(0.0018) (0.1542) (0.1782) (0.0490) (0.5081) (0.2126) (0.0617)
Note: p-values are given in parentheses. An asterisk indicates the rejection of the null hypothesis ofno cointegration at the 5 percent significance level (p-value less than 0.05).
Sources: Pedroni (2004) and authors’ calculations.
Table 4A.1 Panel unit root testsVariable LM t-bar LL MW
q −0.2575 −0.6299 −0.0882 32.929(0.6016) (0.2643) (0.4648) (0.3256)
nfa 0.8601 −0.7863 0.7692 36.955(0.1948) (0.2158) (0.7791) (0.1784)
cpi/ppi 1.0819 −1.8343 −1.0167 52.384(0.1396) (0.0333)* (0.1546) (0.0061)*
LL = Levin and Lin (1992) testLM = Lagrange multiplier test (Im, Pesaran, and Shin 2003)MW = Maddala and Wu (1999) testt-bar = group mean t-bar test (Im, Pesaran, and Shin 2003)
Note: p-values are given in parentheses. An asterisk indicates the rejec-tion of the unit root null hypothesis at the 5 percent significance level (p-value less than 0.05).
Source: Authors’ calculations.

Appendix 4BFrom Effective to Equilibrium Bilateral Exchange Rates
The logarithm of the real effective exchange rate for country i, qi, is thetrade-weighted average of the log of bilateral exchange rates of country iagainst trade partners j:
where ei is the log of the bilateral exchange rate of country i against thenumeraire currency, and wij denotes the share of country j in the trade ofcountry i. Note that the sum of the weights is equal to 1, that is, wij = 1.
Let Q be the vector of the 15 real equilibrium effective exchange ratespreviously estimated, and let E be the vector of the 15 equilibrium bilateralreal exchange rates. As suggested by Alberola and colleagues (1999), it ispossible to express Q, with the numeraire currency being the last element,in terms of E as follows:
where W is the (15 × 15) trade matrix and I is the identity matrix of order 15.
Because (I − W) contains only 14 independent exchange rates, it must besingular. To circumvent this problem, we have to eliminate the redundantmultilateral exchange rate. To do so, we remove the row and the columncorresponding to the numeraire currency, and the remaining 14 multilat-eral exchange rates are expressed relative to the numeraire. We can write
where the asterisk indicates that the row and column corresponding to thenumeraire currency have been removed. The vector of equilibrium bilat-eral real exchange rates, denoted as E*, is thus given by
Suppose that one country, z, keeps a fixed exchange rate against thenumeraire. We have ez = 0. According to equation 4B.1, we have
The effective exchange rate of country z reflects only the exchange ratesof third currencies against the numeraire. The effective exchange rates ofother currencies qi are also given by applying equation 4B.1:
q e w ei i zj j
j z
= −≠∑ . ( )4B.6
q w ez zj j
j i
= −≠
∑ . ( )4B.5
E I W Q* * *. ( )= −( ) −1 4B.4
Q I W E* * * ( )= −( ) 4B.3
Q I W E= −( ) ( )4B.2
j∑
q w e e e w ei ij i j
j
i ij j
j i
= −( ) = −∑ ∑≠
( )4B.1
BURDEN SHARING AND EXCHANGE RATE MISALIGNMENTS 93

Hence, the vector of flexible bilateral rates against the numeraire isobtained by inverting the system of 13 effective rates (14 currencies lesscurrency i) ∼Q* in terms of the 13 floating bilateral rates ∼E*:
where a tilde (∼ ) means that the row and column corresponding to the fixedcurrency have been removed. If more than one currency keeps a constantexchange rate against the numeraire, the same methodology applies witha reduced system size.
Now suppose that one country, z, fixes its exchange rate not against thenumeraire but against a third currency, h. Hence, we have ez − eh = 0. In thiscase, the effective rate of z is given by
The effective rates of other currencies are given by
The wizeh term comes from the fact that currency z is no longer fixedagainst the numeraire. For instance, a depreciation of currency h againstthe numeraire (rise in eh) does not have a one-for-one impact on the effec-tive rate of h (qh) because currency h does not depreciate against z. The vec-tor of bilateral rates is now given by the following 13 × 13 system:
where ∼Y is a matrix with zeros everywhere but in a column containing theshare of z in trade of each country in row (wiz). This column is located in thesame place as the column containing the share of h in the trade of eachcountry (wih) in
∼W:
This correction of the system amounts to considering an “h monetaryzone,” which includes currency z and whose impact on each effective rateqi depends on the sum of the cumulated weights of h (wih) and of z (wiz). Thesame methodology applies to more than one nonadjuster: The corre-sponding rows and columns are removed, and the weights are added tothat of the anchor currency h in the trade matrix.
˜ . ( )Y
w
w
w
z
z
z
=
0 0
0 0
0 0
1
2
13
L
L L L L4B.11
˜* ˜ ˜ * ˜ * ( )E I Y W Q= − −( ) −1 4B.10
q e w e w ei i iz h ij jj i
j z
= − −≠
≠
∑ . ( )4B.9
q e w e w ez h zh h zj jj z
j h
= − −≠
≠
∑ . ( )4B.8
˜* ˜ ˜ * ˜ * ( )E I W Q= −( ) −1 4B.7
94 DOLLAR ADJUSTMENT: HOW FAR? AGAINST WHAT?