Burden of Asthma in Wisconsin, 2013
134
The Burden of Asthma in Wisconsin 2013 BURDEN OF ASTHMA IN WISCONSIN 2013
Transcript of Burden of Asthma in Wisconsin, 2013

The Burden of Asthma in Wisconsin
2013
BURDEN OF
ASTHMAIN WISCONSIN
2013

Suggested Citation: Wisconsin Department of Health Services, Division of Public Health, Bureau of Environmental and Occupational Health. The Burden of Asthma in Wisconsin 2013. P-45055-2013 (Rev 05/2013)

Wisconsin Department of Health ServicesDivision of Public Health
Bureau of Environmental and Occupational HealthWisconsin Asthma Program
One West Wilson StreetRoom 150
Madison, WI 53702
Available online at
Funded by the Wisconsin Department of Health Services through US Centers for Disease Control and Prevention Cooperative Agreement Award Number 5U59/EH000503-04 – Addressing Asthma from a Public Health Perspective
BURDEN OF
ASTHMAIN WISCONSIN
2013
http://www.dhs.wisconsin.gov/publications/p4/p45055-2013.pdf


From the Wisconsin Department of Health Services
Asthma is a chronic inflammatory lung disease and a major health burden in Wisconsin,
affecting the quality of life for people with asthma and their families. While there is
no cure for asthma, the condition can be controlled with appropriate medical care
and effective patient self-management. In order to evaluate the burden of asthma
in the state, the Wisconsin Department of Health Services (DHS) conducts asthma
surveillance to describe and document the ways that asthma affects the residents
of our state. By summarizing the rates of asthma-related adverse health outcomes,
charting the distribution of asthma within our population, describing how asthma is
managed and estimating the costs associated with asthma, DHS seeks to provide the
information that our statewide stakeholders need in order to monitor asthma in our
state and determine what interventions are most likely to reduce the burden of asthma
in Wisconsin.
This document represents an update of the report, Burden of Asthma in Wisconsin
2010, our summary of asthma surveillance data in Wisconsin. Like its predecessor,
the Burden of Asthma in Wisconsin 2013 represents the cumulative efforts of a range
of statewide partners to comprehensively describe the current state of the burden
of asthma in Wisconsin. This report will serve as the foundation for future asthma
surveillance activities in Wisconsin, and will be an essential tool for local and statewide
planning efforts to address asthma as a continuing public health issue in Wisconsin. It is
hoped that the information in this report will help guide individuals and a broad spectrum
of organizations in Wisconsin working to improve the lives of people with asthma.
Charles Warzecha,
Director, Bureau of Environmental and Occupational Health
Henry A. Anderson, MD,
State Health Officer


BURDEN OF ASTHMA IN WISCONSIN 2013 vii
List of Figures ........................................................................................................... ix
List of Tables ............................................................................................................. xiii
Executive Summary ................................................................................................. xv
Key Findings .............................................................................................................. xvii
Introduction .............................................................................................................. 1
Who Has Asthma in Wisconsin? ............................................................................. 4 Adult Prevalence (≥ 18 years) ................................................................................ 5
Child Prevalence (≤ 17 years) ................................................................................ 9Prevalence by Geographic Region and Urban/Rural Classification ........................ 13
Factors Associated with Asthma ............................................................................ 15Obesity ................................................................................................................. 16Educational Attainment ......................................................................................... 17Poverty .................................................................................................................. 17Smoking ................................................................................................................ 18Indoor Environmental Exposures .......................................................................... 19Estimate of Asthma Risk Using a Multivariate Model .......................................... 21
Asthma Management and Quality of Life .............................................................. 22Asthma Severity ................................................................................................... 24Asthma Control ..................................................................................................... 26Medication Use .................................................................................................... 30Asthma Self-Management .................................................................................... 32Asthma Management in Wisconsin Schools ........................................................ 35Health-Related Quality of Life ............................................................................... 37
Work-Related Asthma .............................................................................................. 39Work-Related Asthma Prevalence from the Wisconsin BRFSS ............................ 40Workers’ Compensation as Primary Payer for ED Visits and Hospitalizations ...... 40Workers’ Compensation Claims Data ................................................................... 41
Health Care Utilization ............................................................................................. 42Insurance Status and Cost of Care ....................................................................... 43Emergency Department Visits .............................................................................. 43Inpatient Hospitalizations ...................................................................................... 49
Asthma in Government-Funded Programs ............................................................ 61Wisconsin Medicaid Program ............................................................................... 62Wisconsin Women, Infants and Children (WIC) Program ..................................... 76
Mortality .................................................................................................................... 80
Meeting Healthy People 2020 Asthma Goals in Wisconsin .................................. 86
Conclusions ............................................................................................................... 89
References ................................................................................................................. 91
Table of Contents

BURDEN OF ASTHMA IN WISCONSIN 2013viii
Technical Notes ........................................................................................................ 95Report Terminology ............................................................................................... 95Rate Calculations .................................................................................................. 95Determination of Statistical Significance .............................................................. 96Confidence Interval Calculations ......................................................................... 96
Acronyms ............................................................................................................. 97
Appendices ................................................................................................................ 98 Appendix A. Data Sources ................................................................................... 98 Appendix B. Detailed Data Tables ......................................................................... 103 Appendix C. Table of County-Specific Data .......................................................... 104 Appendix D. 2006 National Center for Health Statistics Urban-RuralClassification ......................................................................................................... 106 Appendix E. Population Distribution of Wisconsin ............................................... 108 Appendix F. Useful Asthma Links and Resources ................................................ 109
Acknowledgements ................................................................................................. 111
Table of Contents

BURDEN OF ASTHMA IN WISCONSIN 2013 ix
Who Has Asthma in Wisconsin?
Figure 1. The Asthma Surveillance Pyramid ...................................................... 2
Figure 2. Lifetime and Current Asthma Prevalence among Adults, Wisconsin and U.S. 2011 ..................................................................................... 6
Figure 3. Current Asthma Prevalence among Adults by State, 2011 ................. 6
Figure 4. Lifetime and Current Asthma Prevalence among Adults by Year, Wisconsin and U.S. 2002-2012… ....................................................... 7
Figure 5. Lifetime and Current Asthma Prevalence among Adults by Sex and Age Group, Wisconsin 2008-2010 ...................................................... 8
Figure 6. Lifetime and Current Asthma Prevalence among Adults by Race/Ethnicity, Wisconsin 2004-2010 ................................................. 8
Figure 7. Lifetime and Current Asthma Prevalence among Children, Wisconsin and U.S. 2011 .................................................................... 9
Figure 8. Lifetime Asthma Prevalence among Children by Sex and Age Group, Wisconsin 2008-2010 ......................................................................... 10
Figure 9. Lifetime Asthma Prevalence among Public Middle and High School Students, Wisconsin 2008 and 2010 ...................................... 12
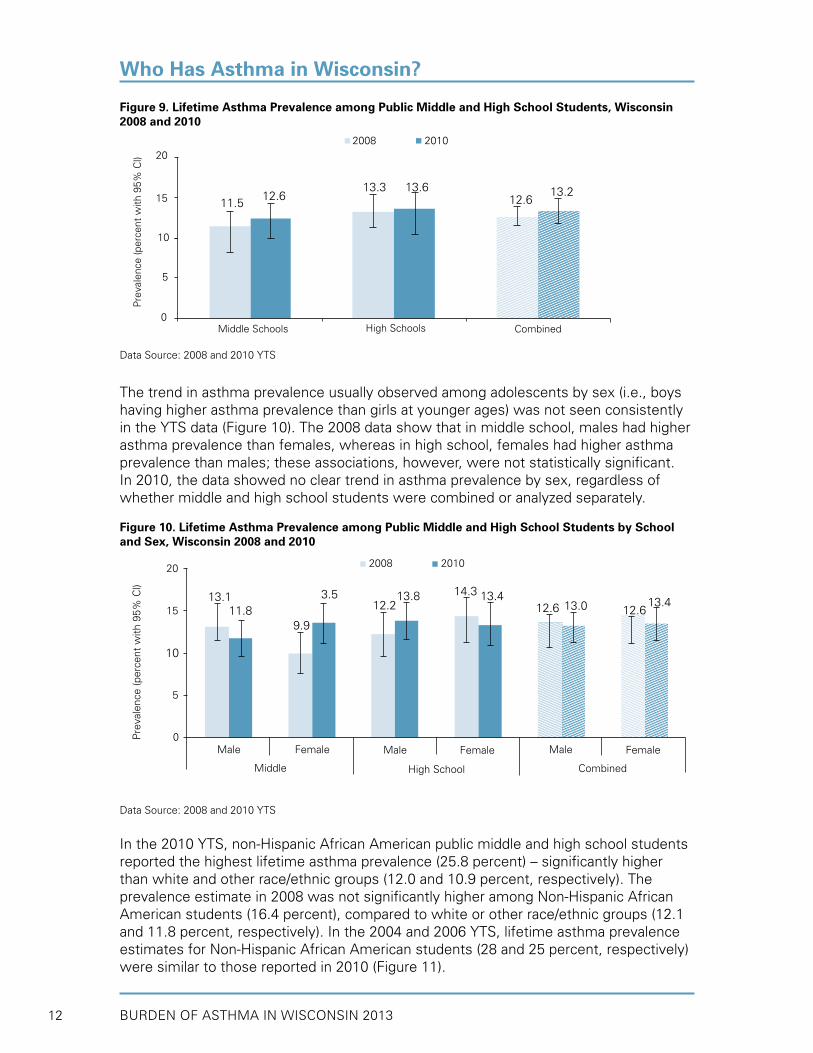
Figure 10. Lifetime Asthma Prevalence among Public Middle and High School Students by School and Sex, Wisconsin 2008 and 2010 .................... 12
Figure 11. Lifetime Asthma Prevalence among Public Middle and High School Students by Race and Ethnicity, Wisconsin 2008 and 2010 ............... 13
Figure 12. Wisconsin Department of Health Services Geographic Regions ........ 14
Factors Associated with Asthma
Figure 13. Current Asthma Prevalence among Adults by Weight Status and Sex, Wisconsin 2008-2010 ................................................................. 16
Figure 14. Current Asthma Prevalence among Adults by Educational Attainment, Wisconsin 2008-2010…... ............................................... 17
Figure 15. Current Asthma Prevalence among Adults by Household Income Level, Wisconsin 2008-2010 ............................................................... 17
Figure 16. Current Asthma Prevalence among Adults by Smoking Status and Sex, Wisconsin 2008-2010 ................................................................. 18
Figure 17. Lifetime Asthma Prevalence among Public Middle and High School Students by Exposure to Environmental Tobacco Smoke, Wisconsin 2008 and 2010 .................................................................................... 19
Figure 18. Adjusted Odds Ratios (ORadj) for Current Asthma Prevalence among Adults, Wisconsin 2007-2010 ............................................................. 21
Asthma Management and Quality of Life
Figure 19. Frequency of Asthma Symptoms in the Past 30 Days among Adults with Current Asthma,Wisconsin 2006-2010 ............................ 25
List of Figures

BURDEN OF ASTHMA IN WISCONSIN 2013x
List of Figures
Figure 20. Public Middle and High School Students with Lifetime Asthma who Experienced an Asthma Attack in the Past Year by Sex, Wisconsin 2008-2010 ......................................................................... 26
Figure 21. Overall Asthma Control among Adults and Children with Current Asthma, Wisconsin 2006-2010 ........................................................... 28
Figure 22. Asthma Control Levels within Individual Elements of Control among Adults with Current Asthma, Wisconsin 2006-2010 ............... 29
Figure 23. Well-Controlled Asthma among Adults and Children with Current Asthma by Age Group, Wisconsin 2006-2010 ....................... 29
Figure 24. Overall Asthma Control by Income Level among Adults with Current Asthma,Wisconsin 2006-2010 ............................................... 30
Figure 25. Medication Use in the Past 3 Months among Adults and Children with Current Asthma, Wisconsin 2006-2010 ...................................... 31
Figure 26. Rescue or Controller Medication Use in the Past 3 Months by Overall Asthma Control among Adults with Current Asthma, Wisconsin 2006-2010 ......................................................................... 32
Figure 27. Adults with Current Asthma Who Discussed Asthma with Their Doctor by Time Since Discussion, Wisconsin 2006-2010 ................... 33
Figure 28. Routine Health Care Visits for Asthma in the Past Year among Adults with Current Asthma by Sex and Race, Wisconsin 2006-2010 .......... 34
Figure 29. Flu Vaccine among Adults with and without Current Asthma by Age Group, Wisconsin 2008-2010 .............................................................. 35
Figure 30. Perceived Health Status among Adults with and without Current Asthma, Wisconsin 2008-2010 ........................................................... 38
Health Care Utilization
Figure 31. Emergency Department Visit Rates for Primary Diagnosis of Asthma by Age Group, U.S. 2009 .................................................................... 44
Figure 32. Asthma Emergency Department Visit Rates per 10,000, Wisconsin (2002-2011) and the U.S. (2002-2010) ............................... 45
Figure 33. Asthma Emergency Department Visit Rates per 10,000 by Age and Sex, Wisconsin 2011 .......................................................................... 45
Figure 34. Average Daily Asthma Emergency Department Visits by Month of Visit, Wisconsin 2010-2011 ................................................................. 46
Figure 35. Asthma Emergency Department Visit Rates per 10,000 by Wisconsin County, 2009-2011 ............................................................ 48
Figure 36. Estimated Rates of Asthma ED Visits per 100 Persons with Asthma, Wisconsin 2005-2011 ......................................................................... 49
Figure 37. Asthma Hospitalization Rates per 10,000, Wisconsin 1995-2011 ...... 51
Figure 38. Asthma Hospitalization Rates per 10,000, Wisconsin (2000-2011) and U.S.(2000-2010) ........................................................................... 51

BURDEN OF ASTHMA IN WISCONSIN 2013 xi
Figure 39. Asthma Hospitalization Rates per 10,000 by Principal and Underlying Diagnosis, Wisconsin 2004-2011 ........................................................ 52
Figure 40. Asthma Hospitalization Rates per 10,000 by Age and Sex, Wisconsin 2011 .................................................................................................... 52
Figure 41. Asthma Hospitalization Rates per 10,000 by Race/Ethnicity and Year, Wisconsin 2006-2011 ......................................................................... 53
Figure 42. Average Daily Asthma Hospitalizations by Month of Admission, Wisconsin 2010-2011 ......................................................................... 54
Figure 43. Distribution of the Primary Payer for Asthma Hospitalizations, Wisconsin 2011 .................................................................................. 56
Figure 44. Asthma Hospitalization Rates per 10,000 by Wisconsin County, 2009-2011 ........................................................................................... 57
Figure 45. Estimated Rates of Asthma Hospitalizations per 100 Persons with Asthma, Wisconsin 2005-2011 ........................................................... 58
Figure 46. Distribution of Patients with Asthma Hospitalizations by Number of Visits, Wisconsin 2011 .................................................................... 59
Figure 47. Distribution of Patients with Single versus Repeat Asthma Hospitalizations by Sex, Age Group and Race, Wisconsin 2011 ......... 60
Asthma in Government-Funded Programs
Figure 48. Asthma Prevalence in Wisconsin Medicaid by Year, 2009-2011 ......... 64
Figure 49. Asthma Prevalence in Wisconsin Medicaid by Age Group, 2009-2011 ........................................................................................... 64
Figure 50. Asthma Prevalence in Wisconsin Medicaid by Race/Ethnicity, 2009-2011 ........................................................................................... 65
Figure 51. Asthma Outpatient Visit Rates per 10,000 Enrollees, Wisconsin Medicaid 2009-2011 ........................................................................... 66
Figure 52. Asthma Outpatient Visit Rates per 10,000 Enrollees by Age Group and Year, Wisconsin Medicaid 2009-2011 .......................................... 66
Figure 53. Asthma Outpatient Visit Rates per 10,000 Enrollees by Race/Ethnicity and Year, Wisconsin Medicaid 2009-2011 ................... 67
Figure 54. Asthma Emergency Department Visit Rates per 10,000 Enrollees, Wisconsin Medicaid 2007-2011 .......................................................... 68
Figure 55. Asthma Emergency Department Visit Rates per 10,000 Enrollees by Age Group and Year,Wisconsin Medicaid 2009-2011 .................... 68
Figure 56. Asthma Emergency Department Visit Rates per 10,000 Enrollees by Race/Ethnicity and Year, Wisconsin Medicaid 2009-2011 .............. 69
Figure 57. Asthma Hospitalization Rates per 10,000 Enrollees, Wisconsin Medicaid 2007-2011 ........................................................................... 70
Figure 58. Asthma Hospitalization Rates per 10,000 Enrollees by Age Group and Year, Wisconsin Medicaid 2009-2011 .......................................... 70
List of Figures
BURDEN OF ASTHMA IN WISCONSIN 2013xii
List of Figures
Figure 59. Asthma Hospitalization Rates per 10,000 Enrollees by Race/Ethnicity and Year, Wisconsin Medicaid 2009-2011 ................... 71
Figure 60. Modified HEDIS Measure: Use of Appropriate Medication for People with Persistent Asthma in Wisconsin Medicaid by Age Group and Year, 2009-2011 ................................................................. 72
Figure 61. Modified HEDIS Measure: Use of Appropriate Medications for People with Persistent Asthma in Wisconsin Medicaid by Race/Ethnicity and Year, 2009-2011 .................................................... 73
Figure 62. Percent of Persistent Asthmatics in Wisconsin Medicaid with ≥1 Long-Term Control Medication and ≥1 Inhaled Corticosteroid by Sex, Age Group and Race/Ethnicity, 2011 .............. 74
Figure 63. Proportion of Long-Term Control Medication Compared to Total Medication Filled by Persistent Asthmatics in Wisconsin Medicaid by Sex, Age Group and Race/Ethnicity, 2011 ...................................... 74
Figure 64. Percent of Persistent Asthmatics in Wisconsin Medicaid with ≥7 Short-Acting Beta 2-Agonist Medications by Sex, Age Group and Race/Ethnicity, 2011 ........................................................................... 75
Figure 65. Women in the WIC Program with Asthma by Age Group and Race, Wisconsin 2012 .................................................................................................... 77
Figure 66. Women in the WIC Program with Asthma by Exposure to Specific Factors Associated with Asthma, Wisconsin 2012 ............................ 78
Figure 67. Children (under 5 years) in the WIC Program with Asthma by Race, Wisconsin 2012 .................................................................................... 78
Figure 68. Children (under 5 years) in the WIC Program with Asthma by Exposure to Specific Factors Associated with Asthma, Wisconsin 2012 .................................................................................. 79
Mortality
Figure 69. Asthma Deaths by Year, Underlying and Contributing Cause of Death, Wisconsin 2002-2011 .............................................................. 81
Figure 70. Asthma Mortality Rates by Year, Wisconsin Residents 1990-2011 .... 82
Figure 71. Asthma Mortality Rates by Year, Wisconsin (2002-2011) and U.S. (2002-2010) ......................................................................................... 82
Figure 72. Asthma Deaths and Mortality Rates by Year and Sex, Wisconsin 2006-2011 ........................................................................................... 83
Figure 73. Six-Year Asthma Mortality Rates by Race, Wisconsin 2006-201 ........ 83
Figure 74. Estimated Rate of Asthma Mortality per 100 Persons with Asthma, Wisconsin 2005-2011 ......................................................................... 85
Appendices
Appendix D Classification of Wisconsin Counties using the 2006 NCHSFigure 1. Urban-Rural Classification ................................................................... 107

BURDEN OF ASTHMA IN WISCONSIN 2013 xiii
Who Has Asthma in Wisconsin?
Table 1. Lifetime and Current Asthma Prevalence among Adults by Year, Wisconsin 2002–2011 ......................................................................... 7
Table 2. Lifetime and Current Asthma Prevalence among Children by Year, Wisconsin 2005–2011 ......................................................................... 10
Table 3. Asthma Questions on the 2008 and 2010 Wisconsin Youth Tobacco Survey (YTS) ........................................................................................ 11
Table 4. Current Asthma Prevalence among Adults and Children by Region, Wisconsin 2006-2010 ......................................................................... 13
Table 5. Current Asthma Prevalence among Adults by National Center for Health Statistics (NCHS) Urban/Rural Classification, Wisconsin 2006-2010 ........................................................................................... 14
Factors Associated with Asthma
Table 6. Prevalence of Environmental Triggers in the Homes of Adults and Children with Current Asthma, Wisconsin 2006-20010 ...................... 19
Table 7. Prevalence of Environmental Modifications in the Homes of Adults and Children with Current Asthma, Wisconsin 2006-2010 ................ 20
Asthma Management and Quality of Life
Table 8. National Asthma Education and Prevention Program Recommended Key Clinical Activities for the Diagnosis and Management of Asthma ..................................................................... 22
Table 9. Measures of Impairment and Risk among Adults and Children with Current Asthma, Wisconsin 2006-2010 .............................................. 24
Table 10. Factors Used to Classify Asthma Control in Children ≥12 Years of Age and Adults, from the Guidelines for the Diagnosis and Management of Asthma (EPR-3) ........................................................ 27
Table 11. Asthma Control Definitions using Elements from the BRFSS Asthma Callback Survey Data and National Asthma Treatment Guidelines ..... 28
Table 12. Asthma Self-Management Knowledge among Adults and Children with Current Asthma,Wisconsin 2006-20010 ..................................... 32
Table 13. Asthma Management in Wisconsin, Public Middle School and High Schools according to School principals, 2008-2012 ............................ 37
Table 14. Comorbid Conditions among Adults with Current Asthma, Wisconsin 2006-2010 ......................................................................... 38
Work-Related Asthma
Table 15. Prevalence of Work-Related Asthma among Adults with Current Asthma, Wisconsin 2006-20010 ......................................................... 40
Table 16. Asthma ED Visits and Hospitalizations with Worker’s Compensation as the Primary Payer by Year, Wisconsin 2004-2011 .......................... 41
Table 17. Classification of WRA Cases, WI Workers’ Compensation Claims Database, 2010-2011. ......................................................................... 41
List of Tables

BURDEN OF ASTHMA IN WISCONSIN 2013xiv
Health Care Utilization
Table 18. Insurance Status and Costs among Adults with Current Asthma, Wisconsin 2006-2010 ......................................................................... 43
Table 19. Number of Asthma Emergency Department (ED) Visits, Average Charge per Asthma ED visit, and Total Asthma ED Visit Charges by Sex, Age and Primary Payer Group, Wisconsin 2011 ......................... 47
Table 20. Annual and Average Asthma Hospitalization Rates per 10,000 by Race/Ethnicity,Wisconsin 2006-2011 .................................................. 53
Table 21. Number of Asthma Hospitalizations, Average Length of Stay (LOS), Average Charge per Asthma Hospitalization and Total Asthma Hospitalization Charges by Sex, Race/Ethnicity and Age, Wisconsin 2011 .................................................................................. 55
Table 22. Excess Asthma Hospital Healthcare Charges by Race/Ethnicity, Wisconsin 2011 .................................................................................. 56
Table 23. Percent of Persistent Asthmatics in Wisconsin Medicaid with Flu Vaccine by Age Group, 2009- 2011 ..................................................... 76
Mortality
Table 24. Annual and Average Age-Specific Asthma Mortality Rates per 1,000,000, Wisconsin 2006-2011 ....................................................... 84
Table 25. Six Year Age-Adjusted Asthma Mortality Rates by National Center for Health Statistics (NCHS) Urban/Rural Classification, Wisconsin 2006-2011 ......................................................................... 84
Meeting Healthy People 2010 Asthma Goals in Wisconsin
Table 26. Wisconsin, U.S. and Healthy People 2020 Baseline and Target Goals for Asthma Mortality, Hospitalization and Emergency Department Visit Rates ....................................................................... 87
Table 27. Wisconsin, U.S. and Healthy People 2020 Baseline and Target Goals for Other Asthma Objectives .................................................... 88
Appendices
Appendix B Number of Asthma Emergency Department Visits by Year, AgeTable 1. and Sex, Wisconsin 2002-2011 ........................................................... 103
Appendix B Number of Asthma Hospitalizations by Year, Age, Sex andTable 2. Race/Ethnicity, Wisconsin 2002-2011. ................................................ 103
Appendix C Hospitalization and Emergency Department Visit Rates and County Table 1. Ranks, 72 Wisconsin Counties, 2009-2011 ........................................ 104
Appendix D Classification Rules Used to Assign Counties to the Six UrbanizationTable 1. Levels of the 2006 NCHS Urban-Rural Classification. ......................... 106
Appendix E Wisconsin and U.S. Census Data by Sex, Age Group, Race andTable 1. Ethnicity, 2010 .................................................................................... 108
List of Tables

BURDEN OF ASTHMA IN WISCONSIN 2013 xv
Executive Summary
Asthma is a chronic lung condition characterized by ongoing airway inflammation associated with increased airway responsiveness to a variety of stimuli. Inflammation causes reversible airway obstruction, which results in symptoms such as episodic wheezing, chest tightness, cough and shortness of breath. A variety of factors are known to trigger asthma episodes (attacks), including allergens (pollen, dust mites and mold), viral infections, irritants (chemicals, tobacco smoke and air pollution) and other factors such as exercise, cold air and stress. Like many chronic conditions, appropriate asthma care requires routine health care visits, pharmacological treatment to effectively manage and control symptoms and an environment that minimizes exposure to asthma triggers. Uncontrolled asthma can lead to emergency department (ED) visits, inpatient hospitalizations and, on rare occasion, death.
The purpose of this report is to describe the distribution of asthma and adverse asthma-related health outcomes in Wisconsin using the most recent years of asthma surveillance data available. This report is an updated version of the report, Burden of Asthma in Wisconsin 2010. Asthma prevalence estimates in adults and children were updated using data through the 2011 Behavioral Risk Factor Surveillance System (BRFSS). The BRFSS adult and child call-back surveys were used to provide additional information on risk factors associated with asthma, asthma management and quality of life and work-related asthma. Data on asthma-related hospitalizations, ED visits and deaths were updated to include events through 2011. This report also presents the latest available data on Wisconsin’s Medicaid and Women, Infants and Children (WIC) Program populations. Data from these reports are used to design and prioritize intervention and prevention efforts to reduce the burden of asthma on our population and improve the lives of those living with asthma.
Results from the 2011 Wisconsin BRFSS indicate that 12 percent of adults and 11 percent of children have been diagnosed with asthma. In 2011, more than 4,700 Wisconsin residents were hospitalized for asthma and more than 19,000 Wisconsin residents sought emergency room care for asthma. The burden of asthma is not equally shared in the population; certain minorities, age groups, gender and geographic regions are disproportionately affected. Among racial groups, African Americans have the highest prevalence of asthma (21.8 percent in 2004-2010), are hospitalized at five times the rate of whites (31.0 versus 5.7 hospitalizations per 10,000 in 2011) and are four times more likely to die from asthma than whites (35.4 versus 7.9 deaths per million in 2006-2011). The limited data available on Wisconsin’s Native American population indicate that this population is disproportionately affected by asthma as well. Native Americans in Wisconsin have the second highest asthma prevalence - nearly two times greater than whites - and higher asthma hospitalization rates than whites (15.1 versus 5.7 hospitalizations per 10,000 in 2011).
Across age categories, children under five years of age have the highest hospitalization rate (19.6 per 10,000, 2011) and hospital ED visit rate (74.2 per 10,000, 2011) in Wisconsin. During childhood, Wisconsin males are more severely impacted by asthma, while in adulthood, females have more frequent adverse asthma outcomes. A disproportionate burden of asthma among females versus males is reflected in lifetime asthma prevalence (15.1 vs. 12.1 percent, 2011), hospital ED visits (38.7 vs. 33.2 per 10,000, 2011), inpatient hospitalizations (9.5 vs. 6.8 per 10,000, 2011) and mortality (11.6 vs. 8.5 per million in 2011).
Executive Summary

BURDEN OF ASTHMA IN WISCONSIN 2013xvi
Menominee County, which is primarily composed of members of the Menominee Tribe, has the highest rates of asthma hospitalization (19.3 per 10,000, 2009-2011) and hospital ED visits (98.0 per 10,000, 2009-2011) in the state. Milwaukee County is the most populous and urbanized county in the state and ranks second highest among counties for asthma hospitalizations and ED visits (18.2 and 80.0 per 10,000 in 2009-2011, respectively). Kenosha, Lincoln, Racine, Rock and Sawyer Counties also have both asthma ED visit and asthma hospitalization rates that fall in the highest quartile of all counties in the state.
Medical management of asthma in the state continues to fall short of the National Asthma Education and Prevention Program (NAEPP) Guidelines.1 Approximately two-thirds (67 percent) of Wisconsin adults with asthma reported experiencing symptoms in the past 30 days, and 17 percent reported daily symptoms. Only 57 percent of adults with asthma reported having a routine health care visit for their asthma in the past year. Over half of all adults with current asthma reported using a rescue medication in the last three months, while half reported using a long-term controller medication. Among adults with current asthma, 20 percent reported at least one urgent office visit for worsening symptoms and 12 percent reported having at least one ED visit in the past year. Furthermore, almost one-fourth of all adults with current asthma reported that they were unable to work or carry out usual activities due to their asthma in the past year. The disproportionate burden of asthma and lack of adherence to treatment guidelines suggest that opportunities exist to enhance the care and health of people with asthma.
Executive Summary
Executive Summary

BURDEN OF ASTHMA IN WISCONSIN 2013 xvii
Prevalence
Adults• In 2011, 11.9 percent of adults in Wisconsin had ever been diagnosed with asthma
(lifetime asthma) and 9.2 percent had current asthma. • The overall trend for both lifetime and current asthma prevalence among Wisconsin
adults has been an increase between 2002 and 2010.• Adult females had higher lifetime and current asthma prevalence than adult males,
although the differences were not statistically significant.• Among Wisconsin adults, the lifetime prevalence of asthma was nearly twice as
high in non-Hispanic African Americans as in non-Hispanic whites (data aggregated from 2004-2010).
Children• In 2011, 11.2 percent of children in Wisconsin had ever been diagnosed with asthma
(lifetime asthma) and 7.6 percent had current asthma. Prevalence among children remained steady between 2005 and 2010.
• Wisconsin boys had higher lifetime asthma prevalence than girls (12.2 percent vs. 8.8 percent in 2008-2010).
• In 2010, 12.6 percent of public middle school students and 13.6 percent of Wisconsin public high school students reported having been diagnosed with asthma.
• In 2010, Wisconsin Non-Hispanic African American public middle and high school students reported higher lifetime asthma prevalence than non-Hispanic white students (25.8 percent vs. 12.0 percent).
Factors Associated with Asthma
• In Wisconsin, obese adults had higher current asthma prevalence than normal weight adults in 2008-2010 (12.3 vs. 8.0 percent). A significantly higher percent of obese females reported having current asthma (16.3 percent), compared to both normal weight (8.6) and overweight (8.7) females. Among all obese adults, women reported significantly higher current asthma prevalence than men (16.3 vs. 8.9 percent).
• In 2008-2010, Wisconsin adults with the least formal education reported the highest current asthma prevalence (12.4 percent), compared to adults with a college education (8.6 percent), although the difference was not statistically significant.
• Adults with the lowest annual household income in 2008-2010 (less than $15,000) reported the highest asthma prevalence (16.6 percent).
• The prevalence of current asthma was slightly higher among adults who currently smoke (11.7 percent) than those who were “former” (9.2 percent) or “never” (8.2 percent) smokers (2008-2010 data), although these differences were not statistically significant.
• Public middle and high school students who reported living with a smoker also reported a slightly (but non-significantly) higher lifetime prevalence of asthma than those who indicated that they did not live with a smoker (14.2 vs. 12.1 percent in 2010).
• Exposure to indoor environmental triggers varied among adults and children with current asthma (data from 2006-2010). For example, many asthmatic adults and children reported having carpeting or rugs in their bedroom (73.2 and 69.9 percent, respectively). Over half of adults and children with current asthma reported allowing pets inside their home and bedroom.
Key Findings

BURDEN OF ASTHMA IN WISCONSIN 2013xviii
Asthma Management and Quality of Life
Wisconsin BRFSS Asthma Callback Survey (2006-2010)• Two-thirds of adults with current asthma in Wisconsin reported having asthma
symptoms in the past 30 days; 17.5 percent of adults with current asthma reported experiencing daily symptoms.
• Of the individuals with current asthma who reported experiencing asthma symptoms in the last 30 days, one-fourth reported that their asthma symptoms made it difficult to stay asleep on one or more nights during the last 30 days.
• 54.3 percent of Wisconsin adults with current asthma reported having asthma attacks in the past year; 65.4 percent of Wisconsin children with current asthma reported an attack in the last year.
• One-quarter of adults with current asthma reported being unable to carry out their usual activities because of their asthma during the last month (23.9 percent), and approximately half of all children with asthma reported missing one or more school days in the past year due to asthma (46.3 percent).
• Nearly half of the adults (47.4 percent) and one-third of the children with current asthma (33.3 percent) had “not well-controlled” or “very poorly controlled” asthma.
• Among individuals with current asthma, the prevalence of “well-controlled” asthma was highest in children (66.7 percent) and decreased with increasing age (44.9 percent among the oldest adults, those 65 years of age and older).
• Among adults with current asthma, “well-controlled” asthma was significantly more prevalent in the highest income group compared to the lowest income group (62.0 vs. 34.0 percent, respectively).
• Over half of the adults and children with current asthma reported using a rescue medication in the last three months, while approximately half reported using a long-term controller medication.
• While most adults and children with current asthma were taught to recognize asthma symptoms (67.4 and 92.6 percent, respectively), what to do during an attack (77.0 and 93.9 percent) and how to use an inhaler (96.7 and 96.3 percent), only 30.6 percent of adults and 46.9 percent of children with current asthma indicated that their doctor or health care provider gave them an asthma action plan.
• Overall, 57 percent of adults with current asthma reported having a routine visit for their asthma in the past year. Adult African Americans with current asthma were significantly more likely to report routine health care visits for asthma than white adults (80.8 and 55.3 percent, respectively).
• Adults with current asthma reported diagnoses of asthma comorbidities, such as chronic obstructive pulmonary disorder (23.7 percent) and depression (28.0 percent).
Wisconsin BRFSS Survey (2008-2010)• A higher percent of adults 18 to 49 years of age with current asthma had a flu vaccine
in the last year, compared to similarly aged adults without current asthma (40.8 vs. 28.7 percent).
• Wisconsin adults with current asthma perceived their health status as fair or poor (23.0 percent) significantly more often than adults without asthma (11.5 percent).
Key Findings
• In a multivariate model, the following risk factors were associated with higher adult asthma prevalence: female gender, younger age (18-34 years old), African American non-Hispanic race/ethnicity, current or former smoking status, obesity, and low annual household income (under $15,000).

BURDEN OF ASTHMA IN WISCONSIN 2013 xix
Wisconsin School Health Profiles (SHP) Survey (2008, 2010 and 2012)• While three-fourths of public secondary schools have adopted a policy that allows
students to carry and administer their own asthma medications, 2012 SHP data suggest that only half of the schools have implemented the policy.
• Between 2008 and 2012, the percentage of schools that reported having an asthma action plan on file for all students with asthma increased from 37.3 in 2008 to 61.0 percent in 2012.
Work-Related Asthma
• According to the Wisconsin BRFSS Adult Asthma Callback Survey data, the prevalence of work-related asthma (WRA) ranged from 8.2 percent (doctor-diagnosed WRA) to 33.9 percent (asthma aggravated by current job). Combining doctor-diagnosed and self-identified WRA resulted in an estimate of 13.5 percent. Asthma caused or made worse by exposures in a current or previous job resulted in a prevalence estimate of 46.6 percent.
• From 2004 to 2011, workers’ compensation was the primary payer in 321 cases out of 166,335 ED visits and 43 cases out of 41,548 hospitalizations where asthma was the principal diagnosis.
• Less than 1 percent of Wisconsin workers’ compensation claims were identified in 2010 and 2011 as potentially asthma-related.
• These data indicate that very few asthma events can be clearly identified as work-related through administrative data. As a result, asthma may be potentially underestimated in these populations.
Health Care Utilization
Insurance Status and Cost of Care• From 2006 to 2010, 8.2 percent of adults with asthma did not have health insurance
coverage, whether through commercial or public plans.• Over 6 percent of adults with asthma reported not being able to see their primary
care doctor for asthma, and approximately 10 percent of adults with asthma could not afford asthma medications at some point in the last year.
Hospital Emergency Department Visits• In 2011, there were 19,584 ED visits for asthma in Wisconsin, costing over $24.5
million.• Between 2002 and 2011, population-based asthma ED visit rates in Wisconsin have
significantly decreased (41.8 to 36.0 visits per 10,000 population between 2002 and 2011).
• Children aged 0-4 years had the highest asthma ED visit rate (74.2 visits per 10,000) in 2011.
• The five counties with the highest rates of asthma ED visits per 10,000 population for 2009-2011 were Menominee (98.0), Milwaukee (80.0), Sawyer (59.1), Kenosha (54.4), and Vilas (50.3).
• Risk-based rates (rates of asthma ED visits among persons with asthma) have remained steady between 2005 and 2011.
Inpatient Hospitalizations• In 2011, there were a total of 4,746 hospitalizations in Wisconsin for which asthma
was the principal diagnosis, costing an average of $13,309 per hospitalization.
Key Findings

BURDEN OF ASTHMA IN WISCONSIN 2013xx
• Over the past 15 years there has been a decline in Wisconsin population-based asthma hospitalization rates (12.0 to 8.1 hospitalizations per 10,000 population between 1995 and 2011).
• Children aged 0-4 years had the highest asthma hospitalization rate at 19.6 per 10,000 in 2011.
• Rates were over five times higher for African Americans (31.0 per 10,000) and over two times higher for American Indians (15.1 per 10,000) compared to whites (5.7 per 10,000) in 2011.
• Menominee County (19.3) and Milwaukee County (18.2) experienced the highest county-specific rates of asthma hospitalizations per 10,000 population in Wisconsin from 2009-2011.
• If the minority populations had experienced asthma hospitalization at the same rate as non-Hispanic whites in 2011, there would have been 1,095 fewer asthma hospitalizations that year, resulting in a savings of approximately $13 million.
• Although population-based rates of asthma hospitalizations have decreased between 2005 and 2011, rates among persons with asthma (risk-based rates) have remained steady during this time.
• Hospitalizations and ED visits in which asthma was identified as the primary diagnosis vary seasonally, with the highest number of visits occurring in the fall.
• Over 10 percent of the people who were hospitalized for asthma had an additional asthma hospitalization within the same year.
Asthma in Government-Funded Programs
Wisconsin Medicaid Program• Over the three year period 2009-2011, the number of Medicaid recipients increased.
However, prevalence of persistent asthma remained steady (approximately 3.7 percent), and less severe asthma (“universal” asthma) decreased slightly, from 7.6 percent in 2009 to 7.3 percent in 2011.
• The rate of asthma outpatient visits among Wisconsin Medicaid recipients decreased from 770 to 756 visits per 10,000 between 2009 and 2011. Medicaid recipients with outpatient visits for asthma averaged approximately three visits during each measurement year.
• Between 2007 and 2011, rates of asthma ED visits in the Medicaid population showed a general decline, from 130.2 to 111.3 visits per 10,000 Medicaid enrollees. The rate of asthma ED visits was highest for children under 5 years of age.
• The rate of asthma hospitalizations in the Medicaid population declined from 39.8 to 32.4 visits per 10,000 Medicaid enrollees between 2007 and 2011.
• Similar to the trend observed with asthma ED visits, African Americans had the highest rates of asthma hospitalizations, while Asians had the lowest rates.
• Rates of asthma ED visits and hospitalizations in the Medicaid population were three times greater than the rates in Wisconsin’s general population during the same time period.
• Approximately 85 percent of Wisconsin Medicaid recipients aged 5 to 50 years old with persistent asthma filled prescriptions for appropriate long-term control medication between 2009 and 2011.
• In 2011, 84.5 percent of persistent asthmatics received at least one long-term control medication, and 71.7 percent received an inhaled corticosteroid (ICS) medication.
Key Findings

BURDEN OF ASTHMA IN WISCONSIN 2013 xxi
• One-quarter (25.1 percent) of persistent asthmatics received 7 or more prescriptions for a short-acting beta 2-agonist (SABA) medication in 2011, which is an indicator of overuse of this medication.
• According to the Wisconsin Immunization Registry, approximately 88 percent of Medicaid enrollees with persistent asthma received a flu vaccination between 2009 and 2011.
Wisconsin Women, Infants and Children (WIC) Program• In 2012, the prevalence of asthma among all women in the WIC program was 2.1
percent and was similar between pregnant and postpartum women (2.3 vs. 2.0 percent, respectively).
• Prevalence of asthma was highest in women 35 years of age and older. By race, African Americans had higher asthma prevalence than whites (2.8 vs. 2.1 percent).
• Factors associated with asthma including smoking tobacco, environmental tobacco smoke (ETS), obesity and depression were associated with higher asthma prevalence in both pregnant and postpartum women. Women with depression had an asthma prevalence that was three times greater than women without depression (5.2 vs. 1.9 percent, respectively).
• In 2012, the prevalence of asthma among children under 5 years in the WIC program was 2.4 percent; African American children had an asthma prevalence that was three times higher than that of white children (5.2 vs. 1.7 percent).
• Exposure to ETS was associated with slightly higher asthma prevalence in children, compared to children without the exposure (2.8 vs. 2.4 percent).
• Being overweight at 24 months of age or older was associated with higher asthma prevalence than children who were not overweight (3.8 vs. 2.3 percent).
• Ever having been breastfed was associated with lower asthma prevalence, compared to the prevalence of children who were never breastfed (2.1 vs. 3.0 percent).
Mortality
• Between 2002 and 2011 there were approximately 65 deaths per year in Wisconsin for which asthma was the underlying cause. Additionally, an average of 159 deaths per year during this time period listed asthma as a contributing cause of death.
• Over the past decade, there has been a general decline in asthma mortality in Wisconsin from 12.6 deaths per million in 2002 to 10.3 deaths per million in 2011.
• The six year age-adjusted mortality rates from 2006-2011 showed that African Americans were 4 times more likely to die of asthma than whites (35.4 vs. 7.9 per million).
• Adults aged 65 years and older had the highest asthma mortality rates in Wisconsin (2006-2011).
• The annual crude number of deaths and age-adjusted asthma mortality rates in Wisconsin were higher among females than males (2006-2011).
Meeting Healthy People 2020 Asthma Goals in Wisconsin
• Wisconsin baseline rates for reducing asthma deaths (RD-1) are lower than U.S. baseline rates, although they are still higher than the HP2020 targets.
Key Findings
BURDEN OF ASTHMA IN WISCONSIN 2013xxii
Key Findings
• The majority of Wisconsin baseline rates corresponding to reducing asthma hospitalizations and ED visits (RD-2 and RD-3) already meet the HP 2020 targets. The one exception corresponds to children under age 5 (reducing hospitalizations for asthma), in which the Wisconsin baseline rate (21.6 per 10,000) is greater than the HP2020 target (18.1 per 10,000).
• The majority of baseline estimates related to activity limitations, school/work missed, asthma patient education and proper asthma care indicate that Wisconsin is doing better than the U.S. (at baseline); however, Wisconsin has not yet met all HP2020 targets.
• Nearly 56 percent of children and 39 percent of adults with asthma reported missing school/work days due to asthma.
• Only 35 percent of persons with asthma received written asthma management plans from their healthcare provider.

BURDEN OF ASTHMA IN WISCONSIN 2013 1
Asthma is a chronic lung disease affecting approximately 13 percent of both adults and children in the United States.2 It is characterized by ongoing airway inflammation that can result in episodic events of wheezing, shortness of breath, coughing, and chest tightness. Individuals with asthma have increased airway reactivity, often in response to stimuli such as environmental allergens and irritants, viral infections and cold air. During an asthma attack or episode, the airways that carry oxygen to the lungs become swollen and inflamed and produce excess mucus. The result is narrowing of the airways, which makes breathing difficult. The exact cause of asthma is unknown, but it is thought to be caused by both environmental and genetic factors.3
The United States Department of Health and Human Services (DHHS) recognizes asthma as a public health priority in their Healthy People 2020 national health plan (http://www.healthypeople.gov/2020/).4 The following eight objectives relate to asthma: 1) Reduce asthma deaths; 2) Reduce hospitalizations for asthma; 3) Reduce emergency department visits for asthma; 4) Reduce activity limitations among persons with current asthma; 5) Reduce the proportion of persons with asthma who miss school or work days; 6) Increase the proportion of persons with current asthma who receive formal patient education; 7) Increase the proportion of persons with current asthma who receive appropriate asthma care according to National Asthma Education and Prevention Program (NAEPP) guidelines; 8) Increase the number of states, territories, and the District of Columbia with a comprehensive asthma surveillance system for tracking asthma cases, illness, and disability at the state level.
Reducing disparities in asthma hospitalization and emergency department utilization rates is a goal of Wisconsin’s statewide public health plan, Healthiest Wisconsin 2020 (http://www.dhs.wisconsin.gov/hw2020/).5 In efforts largely funded by the Centers for Disease Control and Prevention (CDC), the Wisconsin Department of Health Services (DHS) seeks to comprehensively address the burden of asthma through surveillance, partnerships and interventions.
Wisconsin was first awarded a CDC grant (Addressing Asthma from a Public Health Perspective) to reduce the burden of asthma in the state in 2001. In 2003, the first Wisconsin Asthma Plan was adopted to provide the blueprint for addressing asthma as a public health priority through prioritized goals, objectives, and activities recommended for statewide action to reduce the burden of asthma in Wisconsin.6 The revised Wisconsin Asthma Plan 2009-2014 was approved in May 2009 (http://www.dhs.wisconsin.gov/eh/asthma/WAP.htm). The first comprehensive data report on asthma in Wisconsin was published in 2004 and updated in 2007 and 2010. The Burden of Asthma in Wisconsin 2013 includes new sources of asthma data that have become available since the last update. This report is intended to be used by a wide variety of stakeholders as a guide to focus asthma interventions and policies and to measure our progress on improving the health of individuals with asthma in Wisconsin.
Asthma Surveillance
CDC defines surveillance as, “the ongoing, systematic collection, analysis, and interpretation of health-related data essential to the planning, implementation, and evaluation of public health practice, closely integrated with the timely dissemination of
INTRODUCTION
BURDEN OF ASTHMA IN WISCONSIN 20132
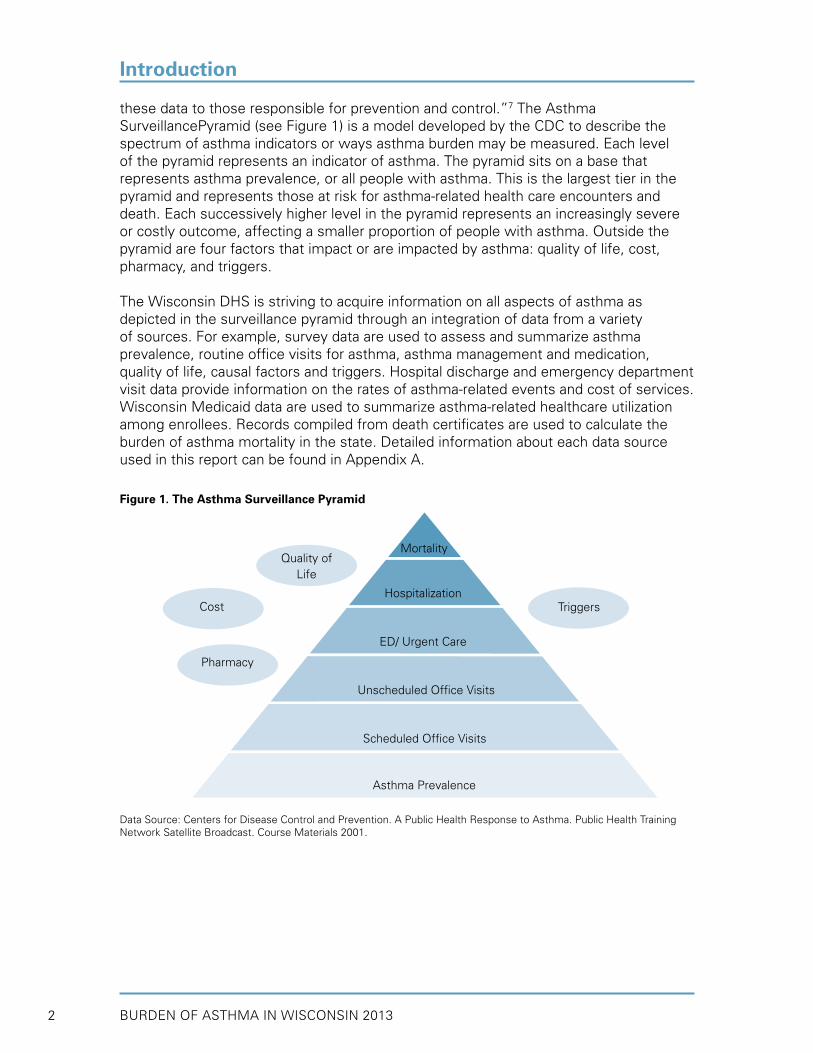
these data to those responsible for prevention and control.”7 The Asthma SurveillancePyramid (see Figure 1) is a model developed by the CDC to describe the spectrum of asthma indicators or ways asthma burden may be measured. Each level of the pyramid represents an indicator of asthma. The pyramid sits on a base that represents asthma prevalence, or all people with asthma. This is the largest tier in the pyramid and represents those at risk for asthma-related health care encounters and death. Each successively higher level in the pyramid represents an increasingly severe or costly outcome, affecting a smaller proportion of people with asthma. Outside the pyramid are four factors that impact or are impacted by asthma: quality of life, cost, pharmacy, and triggers.
The Wisconsin DHS is striving to acquire information on all aspects of asthma as depicted in the surveillance pyramid through an integration of data from a variety of sources. For example, survey data are used to assess and summarize asthma prevalence, routine office visits for asthma, asthma management and medication, quality of life, causal factors and triggers. Hospital discharge and emergency department visit data provide information on the rates of asthma-related events and cost of services. Wisconsin Medicaid data are used to summarize asthma-related healthcare utilization among enrollees. Records compiled from death certificates are used to calculate the burden of asthma mortality in the state. Detailed information about each data source used in this report can be found in Appendix A.
Figure 1. The Asthma Surveillance Pyramid
Data Source: Centers for Disease Control and Prevention. A Public Health Response to Asthma. Public Health Training Network Satellite Broadcast. Course Materials 2001.
Mortality
Hospitalization
ED/ Urgent Care
Unscheduled Office Visits
Scheduled Office Visits
Asthma Prevalence
Triggers
Quality ofLife
Cost
Pharmacy
Introduction

BURDEN OF ASTHMA IN WISCONSIN 2013 3
This report describes the current burden of asthma in Wisconsin using the most recent surveillance data available. The intent of this asthma surveillance report is to provide statewide stakeholders with the information they need in order to monitor asthma in Wisconsin and determine what interventions are most likely to reduce the burden of asthma in the state. The report does not include specific recommendations for developing state, county, school, worksite or other organizational policy or recommendations to help individuals manage their asthma. Those types of recommendations can be found in the WI Asthma Plan 2009-2014 (http://www.dhs.wisconsin.gov/eh/Asthma/WAP.htm) and in other materials and resources available from the Wisconsin Asthma Program (http://www.dhs.wisconsin.gov/eh/Asthma/index.htm).
The body of this report is divided into the following topics: prevalence risk factors, management and quality of life, work-related asthma, health care utilization, asthma in government-funded programs, and mortality. Each chapter begins with a brief introduction and key findings. Graphs and figures are accompanied by written summaries. Following the main data sections are two summary sections: how Wisconsin compares to U.S. baseline and Healthy People 2020 targets and overall conclusions.
Data are presented by year to show trends over time and are also grouped by demographics such as age, sex, and race/ethnicity. The main focus of this report is information on the statewide burden of asthma; however, some data are also presented by county (hospitalization and ED visit rates).
Race/ethnicity was categorized in a variety of ways across the data sources utilized in this report. In order to simplify and standardize data presentation, race/ethnicity labels were chosen to reflect those most commonly found in the original data sources. In this report (unless otherwise specified), race/ethnicity labels include American Indian (American Indian/Alaska Native), Asian (Asian/Pacific Islander), African American, White and Hispanic. All Hispanics are shown in the ‘Hispanic’ category, while all other groups include only non-Hispanics.Data from surveys are presented with 95 percent confidence intervals (95% CI), which are shown as error bars on graphs. 95% CIs indicate the possible margin of error associated with the estimate and allow for more accurate comparison between estimates (see Technical Notes for details on statistical significance and calculation of confidence intervals). Estimates with relative standard error (RSE) of 30%–50% are presented with an asterisk to indicate that they do not meet standards of reliability or precision. Estimates with RSE greater than 50% are suppressed.
How to Use This Report
Introduction

BURDEN OF ASTHMA IN WISCONSIN 20134
Asthma is a complex chronic respiratory disease with intermittent symptoms and varying degrees of severity. These characteristics make it difficult to determine the number of people living with asthma (known as prevalence). In addition, unlike many infectious and chronic diseases, there are no statewide registries that track the number of individuals living with asthma. Therefore, the best method for determining the prevalence of asthma is through health surveys.8 Prevalence helps us understand the impact of asthma on Wisconsin’s residents and our health care system. In addition, prevalence allows us to identify which populations are disproportionately affected and where prevention and intervention efforts should be directed.
One of the most important surveys for addressing asthma prevalence is the Behavioral Risk Factor Surveillance System (BRFSS). This is a state-based random-digit-dialed telephone survey of the non-institutionalized, civilian, adult (18 and over) population. The survey is cooperatively administered by the Centers for Disease Control and Prevention (CDC), the 50 states, the District of Columbia and three U.S. territories. Wisconsin DHS has supported the BRFSS core adult asthma prevalence module since 1999 and the childhood asthma prevalence module since 2002. Individuals who participate in the BRFSS and indicate that they have asthma are called back for a more comprehensive survey about their asthma. This “call-back” survey includes detailed questions about symptoms, medication usage, health care utilization, asthma self-management knowledge, household environment, and work-related asthma. Both the adult and child call-back surveys have been administered in Wisconsin since 2006. In 2011, BRFSS survey methodology was changed to include both landline telephone and cell/mobile phone users. These data also reflect a change in weighting methodology (raking) to adjust for differences between the demographic characteristics of respondents and the target Wisconsin population. For these reasons, estimates from 2011 cannot accurately be compared to data from prior years. Additional detail on the WI BRFSS and the Asthma Call-back Surveys is available in Appendix A.
Currently there are two questions on the Wisconsin BRFSS core module that are asked of adults every year by all states. The core questions allow for lifetime and current asthma prevalence estimates. These estimates were created to distinguish between individuals who have been diagnosed with asthma at any time in the past and those who report still having asthma.
Lifetime prevalence estimates are based on respondents who answer yes to the following question: “Have you ever been told by a doctor, nurse, or other health professional that you had asthma?”
Current prevalence estimates are based on respondents who answer yes to the lifetime prevalence question and yes to the following question: “Do you still have asthma?”
Because asthma is a disease that can occur, regress and reoccur, it is important to measure both lifetime and current asthma prevalence.3 In particular, a childhood diagnosis of asthma may not affect an individual as an adult. Many children have been known to go through long periods without symptoms or the need for medication, and the disease may appear to have resolved as they mature into adulthood.
WHO HAS ASTHMA IN WISCONSIN?

BURDEN OF ASTHMA IN WISCONSIN 2013 5
This section presents data from the BRFSS to examine characteristics of asthma in Wisconsin’s adults and children. Demographic factors including age, sex, race/ethnicity and region of residence were examined. In addition, factors known to be associated with asthma such as obesity, educational attainment, income level and smoking behaviors were compared between individuals with asthma and those without asthma. Finally, prevalence estimates of certain indoor environmental exposures were examined among individuals with current asthma.
Adults• In 2011, 11.9 percent of adults in Wisconsin had ever been diagnosed with asthma
(lifetime asthma) and 9.2 percent had current asthma. • The overall trend for both lifetime and current asthma prevalence among Wisconsin
adults has been an increase between 2002 and 2010.• Adult females had higher lifetime and current asthma prevalence than adult males,
although the differences were not statistically significant.• Among Wisconsin adults, the lifetime prevalence of asthma was nearly twice as high in
non-Hispanic African Americans as in non-Hispanic whites (data aggregated from 2004-2010).
Children• In 2011, 11.2 percent of children in Wisconsin had ever been diagnosed with asthma
(lifetime asthma) and 7.6 percent had current asthma. Prevalence among children remained steady between 2005 and 2010.
• Wisconsin boys had higher lifetime asthma prevalence than girls (12.2 percent vs. 8.8 percent in 2008-2010).
• In 2010, 12.6 percent of public middle school students and 13.6 percent of Wisconsin public high school students reported having been diagnosed with asthma.
• In 2010, Wisconsin Non-Hispanic African American public middle and high school students reported higher lifetime asthma prevalence than non-Hispanic white students (25.8 percent vs. 12.0 percent).
Adult Prevalence (≥ 18 years)
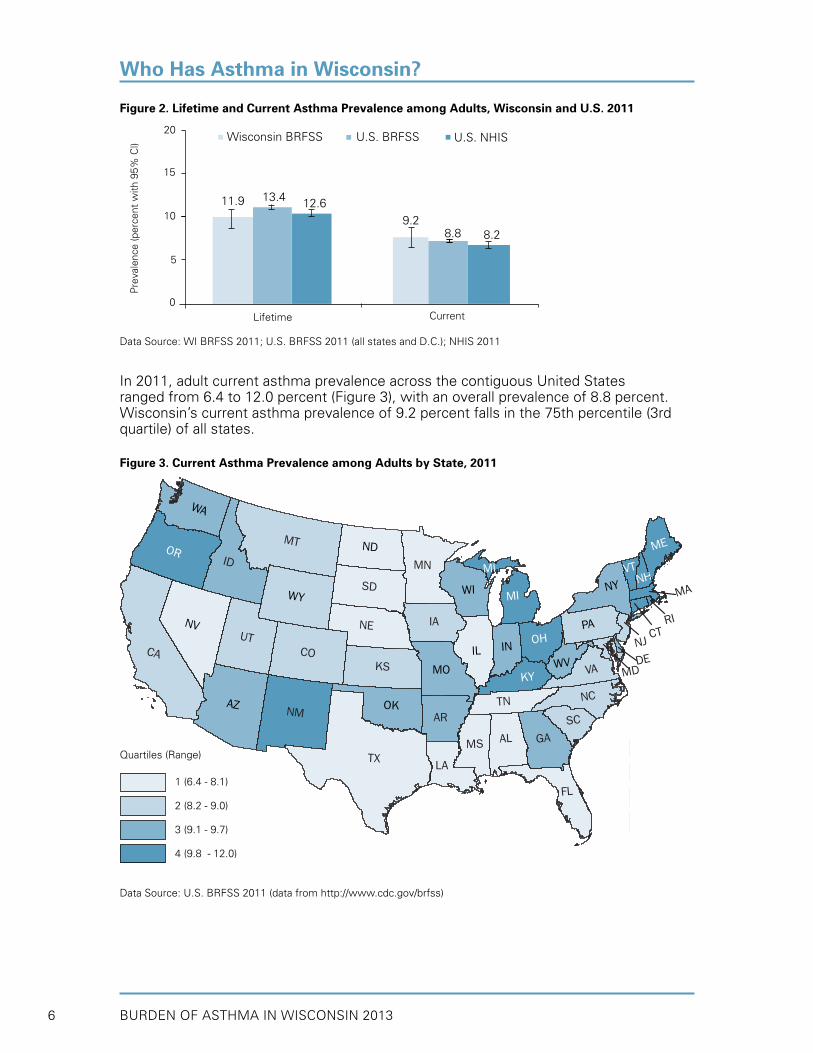
The 2011 lifetime and current asthma prevalence estimates among Wisconsin adults are presented and compared to U.S. adults using data from the BRFSS and the National Health Interview Survey (NHIS)9 in Figure 2. In 2011, 11.9 percent of adults in Wisconsin had been diagnosed with asthma in the past (lifetime asthma prevalence) and 9.2 percent had current asthma. This current prevalence estimate translates to approximately 400,000 Wisconsin adults (1 in 11 adults) affected by asthma in 2011. Compared to U.S. BRFSS and NHIS asthma estimates, Wisconsin adults had slightly lower lifetime asthma prevalence and slightly higher current asthma prevalence; however, these differences were not statistically significant. Questions on lifetime and current asthma prevalence in the BRFSS are comparable to the NHIS, but estimates vary due to sampling design. The adult prevalence estimates from the NHIS are significantly lower than those obtained from the U.S. BRFSS.
Who Has Asthma in Wisconsin?
Key Findings
BURDEN OF ASTHMA IN WISCONSIN 20136
Who Has Asthma in Wisconsin?
In 2011, adult current asthma prevalence across the contiguous United States ranged from 6.4 to 12.0 percent (Figure 3), with an overall prevalence of 8.8 percent. Wisconsin’s current asthma prevalence of 9.2 percent falls in the 75th percentile (3rd quartile) of all states.
Figure 3. Current Asthma Prevalence among Adults by State, 2011
Data Source: U.S. BRFSS 2011 (data from http://www.cdc.gov/brfss)
Figure 2. Lifetime and Current Asthma Prevalence among Adults, Wisconsin and U.S. 2011
Data Source: WI BRFSS 2011; U.S. BRFSS 2011 (all states and D.C.); NHIS 2011
TX
MT
CA
ID
AZ
NV
NM
OR
CO IL
WY
UTIA
KS
MN
SD
NE
ND
WI
WA
OK
MO
FL
MI
AL GA
PA
IN
AR
NY
LA
NC
VA
TN
KY
MS
OH
ME
SC
WV
MI VTNH
MD
NJCT
DE
RI
MA
1.
2.
3.
4.
Quartile (Range)
11.9 13.4 12.69.2
8.8 8.2
20
15
10
5
0
Wisconsin BRFSSP
reva
lenc
e (p
erce
nt w
ith 9
5% C
l)
CurrentLifetime
U.S. BRFSS U.S. NHIS
Quartiles (Range)
1 (6.4 - 8.1)
2 (8.2 - 9.0)
3 (9.1 - 9.7)
4 (9.8 - 12.0)

BURDEN OF ASTHMA IN WISCONSIN 2013 7
With some fluctuations, lifetime asthma prevalence among adults in Wisconsin increaseda from 2002 to 2010 and reached its highest value of 14.2 percent in 2008 (Table 1). Similarly, current asthma prevalence among adults in Wisconsin increasedb from 2002-2010 and reached its highest value of 9.8 percent in 2009. Both lifetime and current asthma prevalence estimates among adults in Wisconsin have been similar to the U.S. estimates during this time period (Figure 4).
Table 1. Lifetime and Current Asthma Prevalence among Adults by Year, Wisconsin 2002–2011
Who Has Asthma in Wisconsin?
Figure 4. Lifetime and Current Asthma Prevalence among Adults by Year, Wisconsin and U.S. 2002–2011
Data Source: WI BRFSS 2002-2011; U.S. BRFSS data from www.cdc.gov/brfss
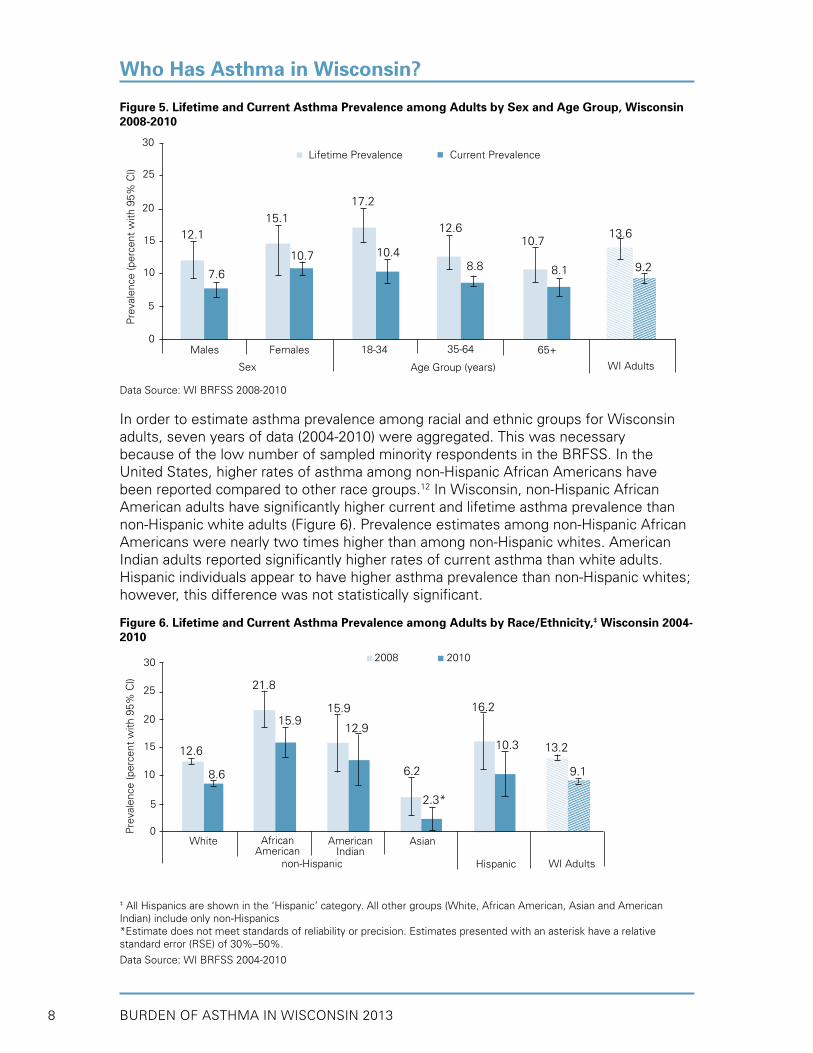
Figure 5 depicts lifetime and current asthma prevalence by sex and age group in Wisconsin adults (2008-2010 aggregated). Both current and lifetime asthma prevalence estimates were higher in adult females than in adult males, although the difference was not statistically significant. Nationally, females have had historically higher prevalence of asthma.10,11 Current and lifetime asthma prevalence estimates were slightly (but not significantly) higher in the younger adult age groups.
Year Lifetime Asthma Prevalence% (95% CI)
Current Asthma Prevalence% (95% CI)
2002 11.7 (10.5 - 12.9) 8.5 (7.5 - 9.5)2003 11.0 (9.8 - 12.2) 7.5 (6.5 - 8.5)2004 12.4 (11.2 - 13.6) 8.6 (7.6 - 9.6)2005 13.1 (11.9 - 14.3) 9.2 (8.2 - 10.2)2006 12.5 (11.1 - 13.9) 8.8 (7.6 - 10.0)2007 13.2 (11.8 - 14.6) 9.2 (8.1 - 10.3)2008 14.2 (12.8 - 15.6) 9.4 (8.2 - 10.6)2009 13.7 (12.0 - 15.4) 9.8 (8.3 - 11.3)
2010 12.8 (11.2 - 14.4) 8.3 (7.1 - 9.5)
2011* 11.9 (10.6 - 13.3) 9.2 (8.0 - 10.4)
*Due to changes in survey methodology, 2011 estimates may not be directly compared to prior years.Data Source: WI BRFSS 2002-2011
a Increase of 0.3% per year, p=0.02 (simple linear regression)b Increase of 0.2% per year, p=0.02 (simple linear regression)
Year
Pre
vale
nce
(per
cent
with
95%
Cl)
2002 2003 2004 2005 2006 2007 2008 2009 2010 2011
15
10
5
0
WI lifetime asthma
U.S. lifetime asthma
WI current asthma
U.S. current asthma
chan
ge in
sur
vey
met
hods
BURDEN OF ASTHMA IN WISCONSIN 20138
Figure 5. Lifetime and Current Asthma Prevalence among Adults by Sex and Age Group, Wisconsin 2008-2010
Data Source: WI BRFSS 2008-2010
In order to estimate asthma prevalence among racial and ethnic groups for Wisconsin adults, seven years of data (2004-2010) were aggregated. This was necessary because of the low number of sampled minority respondents in the BRFSS. In the United States, higher rates of asthma among non-Hispanic African Americans have been reported compared to other race groups.12 In Wisconsin, non-Hispanic African American adults have significantly higher current and lifetime asthma prevalence than non-Hispanic white adults (Figure 6). Prevalence estimates among non-Hispanic African Americans were nearly two times higher than among non-Hispanic whites. American Indian adults reported significantly higher rates of current asthma than white adults. Hispanic individuals appear to have higher asthma prevalence than non-Hispanic whites; however, this difference was not statistically significant.
Figure 6. Lifetime and Current Asthma Prevalence among Adults by Race/Ethnicity,‡ Wisconsin 2004-2010
‡ All Hispanics are shown in the ‘Hispanic’ category. All other groups (White, African American, Asian and American Indian) include only non-Hispanics*Estimate does not meet standards of reliability or precision. Estimates presented with an asterisk have a relative standard error (RSE) of 30%–50%.
Data Source: WI BRFSS 2004-2010
Who Has Asthma in Wisconsin?
12.6
8.6
21.8
15.915.9
12.9
2.3*
6.2
10.3
16.2
13.2
9.1
30
25
20
5
15
10
0Pre
vale
nce
(per
cent
with
95%
Cl)
WI Adults
AsianAmericanIndian
AfricanAmerican
White
non-Hispanic
2008 2010
15.112.1
10.7
17.2
10.48.8
12.6
8.1
10.713.6
9.2
25
15
20
5
0
Pre
vale
nce
(per
cent
with
95%
Cl)
WI Adults
65+35-6418-34FemalesMales
Sex Age Group (years)
10
30
7.6
Lifetime Prevalence Current Prevalence
Hispanic

BURDEN OF ASTHMA IN WISCONSIN 2013 9
Child Prevalence (≤ 17 years old)
Asthma is the most common chronic disease in childhood, affecting approximately 7.1 million children under 18 years of age in the United States.13 Asthma can be particularly difficult for children and their families as it may limit the child’s ability to play, learn and sleep and can require costly interventions.14
To determine the prevalence of asthma among Wisconsin children, the BRFSS childhood asthma module was used. National estimates from BRFSS and NHIS9 were available for comparison to Wisconsin estimates. Both BRFSS and NHIS surveys assess childhood asthma prevalence by asking an adult respondent about the asthma status of one child chosen at random living in the household. This design allows for collection of demographic characteristics such as sex and race/ethnicity of the selected child which were previously not available on the BRFSS.
The 2011 lifetime and current asthma prevalence estimates among Wisconsin children compared to U.S. children using data from BRFSS and NHIS are presented in Figure 7. In 2011, 11.2 percent of children in Wisconsin had been diagnosed with asthma in the past (lifetime asthma) and 7.6 percent had current asthma. This current prevalence estimate translates to approximately 100,000 Wisconsin children (1 in 13 children) affected by asthma in 2011. Compared to 2011 national estimates from BRFSS and NHIS, Wisconsin children had slightly lower lifetime and current asthma prevalence estimates; however, these differences were not statistically significant.
Figure 7. Lifetime and Current Asthma Prevalence among Children, Wisconsin and U.S. 2011
Data Source: WI BRFSS 2011; U.S. BRFSS 2011 (all states and D.C.); NHIS 2011
Who Has Asthma in Wisconsin?
11.2 13.6 14.0
7.6 8.7 9.5
20
15
10
5
0
Wisconsin BRFSS
Pre
vale
nce
(per
cent
with
95%
Cl)
CurrentLifetime
U.S. BRFSS U.S. NHIS
BURDEN OF ASTHMA IN WISCONSIN 201310
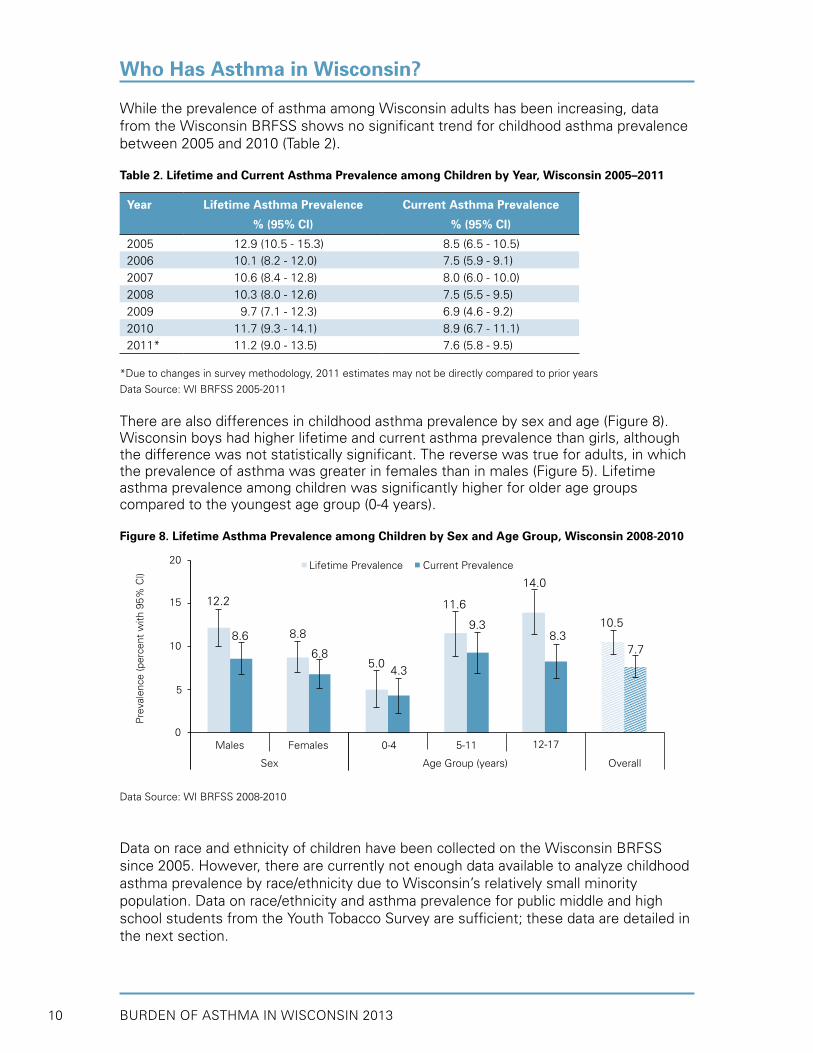
While the prevalence of asthma among Wisconsin adults has been increasing, data from the Wisconsin BRFSS shows no significant trend for childhood asthma prevalence between 2005 and 2010 (Table 2).
Table 2. Lifetime and Current Asthma Prevalence among Children by Year, Wisconsin 2005–2011
Year Lifetime Asthma Prevalence
% (95% CI)
Current Asthma Prevalence
% (95% CI)
2005 12.9 (10.5 - 15.3) 8.5 (6.5 - 10.5)2006 10.1 (8.2 - 12.0) 7.5 (5.9 - 9.1)2007 10.6 (8.4 - 12.8) 8.0 (6.0 - 10.0)2008 10.3 (8.0 - 12.6) 7.5 (5.5 - 9.5)2009 9.7 (7.1 - 12.3) 6.9 (4.6 - 9.2)2010 11.7 (9.3 - 14.1) 8.9 (6.7 - 11.1)2011* 11.2 (9.0 - 13.5) 7.6 (5.8 - 9.5)
*Due to changes in survey methodology, 2011 estimates may not be directly compared to prior years
Data Source: WI BRFSS 2005-2011
There are also differences in childhood asthma prevalence by sex and age (Figure 8). Wisconsin boys had higher lifetime and current asthma prevalence than girls, although the difference was not statistically significant. The reverse was true for adults, in which the prevalence of asthma was greater in females than in males (Figure 5). Lifetime asthma prevalence among children was significantly higher for older age groups compared to the youngest age group (0-4 years).
Figure 8. Lifetime Asthma Prevalence among Children by Sex and Age Group, Wisconsin 2008-2010
Data Source: WI BRFSS 2008-2010
Data on race and ethnicity of children have been collected on the Wisconsin BRFSS since 2005. However, there are currently not enough data available to analyze childhood asthma prevalence by race/ethnicity due to Wisconsin’s relatively small minority population. Data on race/ethnicity and asthma prevalence for public middle and high school students from the Youth Tobacco Survey are sufficient; these data are detailed in the next section.
Who Has Asthma in Wisconsin?
12.2
8.6 8.8
6.85.0
4.3
11.6
9.3
14.0
8.310.5
7.7
20
15
10
5
0
Lifetime Prevalence Current Prevalence
Pre
vale
nce
(per
cent
with
95%
Cl)
Overall
12-175-110-4FemalesMales
Sex Age Group (years)
BURDEN OF ASTHMA IN WISCONSIN 2013 11
Middle and High School Students
The Youth Tobacco Survey (YTS) is a survey administered to public middle and high school students in Wisconsin to assess health-risk behaviors and attitudes regarding tobacco use (see Appendix A). This survey includes questions about asthma prevalence and is helpful in providing additional information about asthma in Wisconsin’s youth. Unlike the BRFSS, in which adult respondents answer questions on behalf of children and adolescents in their household, questions in the YTS are answered by students directly (self-reported). In addition to providing information on the prevalence of asthma in the student population, these surveys allow prevalence to be examined based on various demographic and behavioral variables. While the information provided by these surveys is valuable, the results can only be considered representative of the public middle and high school population - not of all Wisconsin youth.
The YTS is a comprehensive measure of youth awareness, attitudes and behaviors about tobacco use in Wisconsin. This survey is coordinated by the CDC and is administered by Wisconsin DHS’ Tobacco Prevention and Control Program. In 2008 and 2010, the YTS was administered to both middle and high school students and included two asthma questions (Table 3). Asthma data from the 2012 YTS are not available. Data from earlier surveys were presented in previous asthma burden reports.
Table 3. Asthma Questions on the 2008 and 2010 Wisconsin Youth Tobacco Survey (YTS)
Lifetime Prevalence Have you ever been told by a doctor, nurse or other health professional that you have asthma?
Asthma Attacks During the past 12 months, have you had an episode of asthma or an asthma attack?
A small portion of students in each survey responded inconsistently to the two asthma questions. Results presented here are only from students who responded consistently to both questions. This may result in lower, more conservative asthma prevalence estimates.
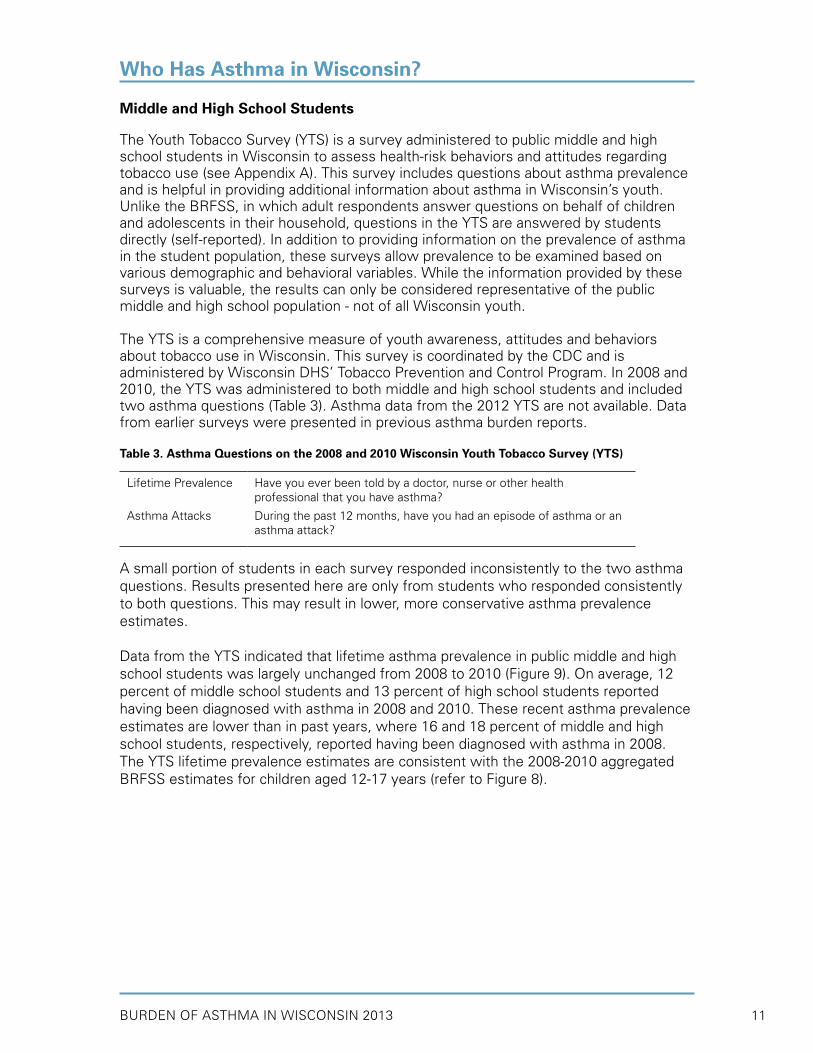
Data from the YTS indicated that lifetime asthma prevalence in public middle and high school students was largely unchanged from 2008 to 2010 (Figure 9). On average, 12 percent of middle school students and 13 percent of high school students reported having been diagnosed with asthma in 2008 and 2010. These recent asthma prevalence estimates are lower than in past years, where 16 and 18 percent of middle and high school students, respectively, reported having been diagnosed with asthma in 2008. The YTS lifetime prevalence estimates are consistent with the 2008-2010 aggregated BRFSS estimates for children aged 12-17 years (refer to Figure 8).
Who Has Asthma in Wisconsin?
BURDEN OF ASTHMA IN WISCONSIN 201312
Figure 9. Lifetime Asthma Prevalence among Public Middle and High School Students, Wisconsin 2008 and 2010
Data Source: 2008 and 2010 YTS
The trend in asthma prevalence usually observed among adolescents by sex (i.e., boys having higher asthma prevalence than girls at younger ages) was not seen consistently in the YTS data (Figure 10). The 2008 data show that in middle school, males had higher asthma prevalence than females, whereas in high school, females had higher asthma prevalence than males; these associations, however, were not statistically significant. In 2010, the data showed no clear trend in asthma prevalence by sex, regardless of whether middle and high school students were combined or analyzed separately.
Figure 10. Lifetime Asthma Prevalence among Public Middle and High School Students by School and Sex, Wisconsin 2008 and 2010
Data Source: 2008 and 2010 YTS
In the 2010 YTS, non-Hispanic African American public middle and high school students reported the highest lifetime asthma prevalence (25.8 percent) – significantly higher than white and other race/ethnic groups (12.0 and 10.9 percent, respectively). The prevalence estimate in 2008 was not significantly higher among Non-Hispanic African American students (16.4 percent), compared to white or other race/ethnic groups (12.1 and 11.8 percent, respectively). In the 2004 and 2006 YTS, lifetime asthma prevalence estimates for Non-Hispanic African American students (28 and 25 percent, respectively) were similar to those reported in 2010 (Figure 11).
Who Has Asthma in Wisconsin?
13.111.8
9.9
3.512.2
13.8 13.414.313.012.6 12.6
13.4
20
15
10
5
0Pre
vale
nce
(per
cent
with
95%
Cl)
Combined
MaleFemaleMaleFemaleMale
Middle High School
2008 2010
Female
12.611.5
13.3 13.6
20
15
10
5
0
2008 2010P
reva
lenc
e (p
erce
nt w
ith 9
5% C
l)
CombinedHigh SchoolsMiddle Schools
12.613.2
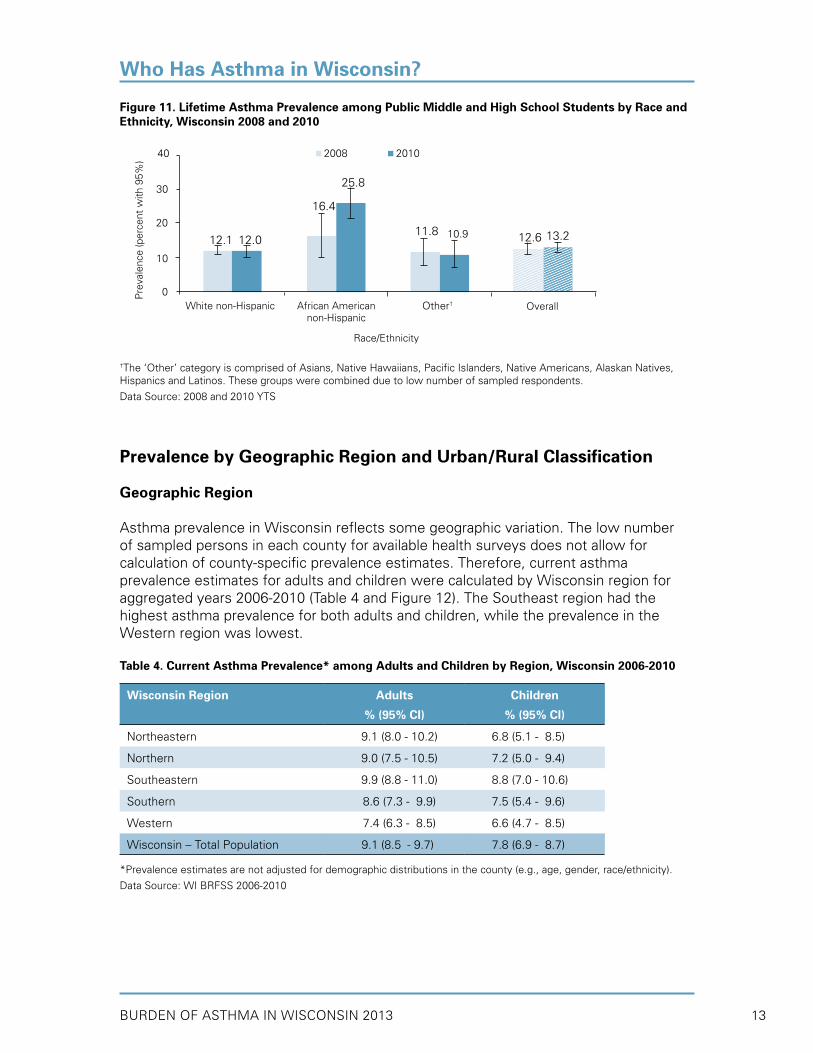
BURDEN OF ASTHMA IN WISCONSIN 2013 13
Figure 11. Lifetime Asthma Prevalence among Public Middle and High School Students by Race and Ethnicity, Wisconsin 2008 and 2010
†The ‘Other’ category is comprised of Asians, Native Hawaiians, Pacific Islanders, Native Americans, Alaskan Natives, Hispanics and Latinos. These groups were combined due to low number of sampled respondents.
Data Source: 2008 and 2010 YTS
Prevalence by Geographic Region and Urban/Rural Classification
Geographic Region
Asthma prevalence in Wisconsin reflects some geographic variation. The low number of sampled persons in each county for available health surveys does not allow for calculation of county-specific prevalence estimates. Therefore, current asthma prevalence estimates for adults and children were calculated by Wisconsin region for aggregated years 2006-2010 (Table 4 and Figure 12). The Southeast region had the highest asthma prevalence for both adults and children, while the prevalence in the Western region was lowest. Table 4. Current Asthma Prevalence* among Adults and Children by Region, Wisconsin 2006-2010
Wisconsin Region Adults
% (95% CI)
Children
% (95% CI)
Northeastern 9.1 (8.0 - 10.2) 6.8 (5.1 - 8.5)
Northern 9.0 (7.5 - 10.5) 7.2 (5.0 - 9.4)
Southeastern 9.9 (8.8 - 11.0) 8.8 (7.0 - 10.6)
Southern 9 8.6 (7.3 -09.9) 9 7.5 (5.4 -99.6)
Western 7.4 (6.3 - 8.5) 9 6.6 (4.7 -98.5)
Wisconsin – Total Population 9 9.1 (8.50 - 9.7) 9 7.8 (6.9 -98.7)
*Prevalence estimates are not adjusted for demographic distributions in the county (e.g., age, gender, race/ethnicity).
Data Source: WI BRFSS 2006-2010
Who Has Asthma in Wisconsin?
12.012.1
25.8
11.8
40
30
20
10
0
2008 2010P
reva
lenc
e (p
erce
nt w
ith 9
5%)
Overall
Race/Ethnicity
White non-Hispanic
12.6 13.210.9
16.4
African Americannon-Hispanic
Other†

BURDEN OF ASTHMA IN WISCONSIN 201314
Figure 12. Wisconsin Department of Health Services Geographic Regions
Data Source: Wisconsin Department of Health Services
Urban/Rural Classification
Table 5 provides current asthma prevalence estimates for adults and children (2006-2010 aggregated) based on the National Center for Health Statistics (NCHS) urban/rural classification (see Appendix D for definition). Some studies have suggested that asthma prevalence is higher in urban areas when compared to more rural areas. While overall differences are small (and not statistically significant), Wisconsin appears to have a higher asthma prevalence in the most urban area of the state compared to more rural areas. Milwaukee County, the only large central metro county in Wisconsin, has the highest asthma prevalence value for adults and children (10.3 and 10.7 percent, respectively).
Table 5. Current Asthma Prevalence among Adults and Children by National Center for Health Statistics (NCHS) Urban/Rural Classification, Wisconsin 2006-2010
Data Source: WI BRFSS 2006-2010
Who Has Asthma in Wisconsin?
2006 NCHS Urban/Rural Classification Adults
% (95% CI)
Children
% (95% CI)
Large Central Metro Counties (Milwaukee County) - metro areas of 1 million or more population
10.3 (8.6 - 12.0) 10.7 (7.8 - 13.6)
Large Fringe Metro Counties - Outlying (suburban) metro areas of 1 million or more population
8.9 (7.3 - 10.5) 5.7 (3.8 - 7.6)
Medium Metro Counties - metro areas of 250,000-999,999 population 9.5 (7.9 - 11.1) 7.1 (4.8 - 9.4)
Small Metro Counties - metro area of 50,000-249,999 population 9.7 (8.6 - 10.8) 8.0 (6.2 - 9.8)
Micropolitan Counties - area with an urban cluster of 10,000-49,999 population
7.7 (6.6 - 8.8) 8.1 (5.5 - 10.7)
Noncore Counties - Nonmicropolitan 8.0 (7.1 - 8.9) 6.8 (5.0 - 8.6)
Wisconsin – Total Population 9.1 (8.5 - 9.7) 7.8 (6.9 - 8.7)
Region Classification
Northeastern
Northern
Southeastern
Southern
Western

BURDEN OF ASTHMA IN WISCONSIN 2013 15
FACTORS ASSOCIATED WITH ASTHMA
There is a difference between what causes someone to have asthma and what triggers asthma attacks and symptoms. The cause of asthma is not fully understood and is probably a combination of inherited factors and environmental triggers. The cause of asthma is likely to differ for each individual, although a positive family history is associated with an increased risk of asthma. We know much more about asthma triggers — the factors that make existing asthma worse or lead to asthma attacks. A growing number of triggers have been identified, including respiratory infections; airborne allergens, such as pollen, animal dander, mold, cockroaches and dust mites; household and workplace chemicals; tobacco smoke; air pollutants; and other factors such as vigorous exercise, cold air and stress.1 Excess body weight is a risk factor for asthma in both children and adults.15,16 Lower education and income levels are also associated with asthma in adults.17
This section describes survey data related to factors associated with asthma. First, the association between current asthma prevalence and various asthma risk factors was examined using WI BRFSS adult data (2008-2010). Results on the association between asthma and exposure to environmental tobacco smoke among public middle and high school students were available from the 2008 and 2010 YTS. The WI BRFSS adult (2006-2010) and child (2006-2010) asthma call-back surveys provided data on indoor environmental risk factors associated with asthma. Lastly, BRFSS data from 2007 through 2010 were combined to estimate adjusted odds ratios for asthma prevalence among Wisconsin adults.
• In Wisconsin, obese adults had higher current asthma prevalence than normal weight adults in 2008-2010 (12.3 vs. 8.0 percent). A significantly higher percent of obese females reported having current asthma (16.3 percent), compared to both normal weight (8.6) and overweight (8.7) females. Among all obese adults, women reported significantly higher current asthma prevalence than men (16.3 vs. 8.9 percent).
• In 2008-2010, Wisconsin adults with the least formal education reported the highest current asthma prevalence (12.4 percent), compared to adults with a college education (8.6 percent), although the difference was not statistically significant.
• Adults with the lowest annual household income in 2008-2010 (less than $15,000) reported the highest asthma prevalence (16.6 percent).
• The prevalence of current asthma was slightly higher among adults who currently smoke (11.7 percent) than those who were “former” (9.2 percent) or “never” (8.2 percent) smokers (2008-2010 data), although these differences were not statistically significant.
• Public middle and high school students who reported living with a smoker also reported a slightly (but non-significantly) higher lifetime prevalence of asthma than those who indicated that they did not live with a smoker (14.2 vs. 12.1 percent in 2010).
• Exposure to indoor environmental triggers varied among adults and children with current asthma (data from 2006-2010). For example, many asthmatic adults and children reported having carpeting or rugs in their bedroom (73.2 and 69.9 percent, respectively). Over half of adults and children with current asthma reported allowing pets inside their home and bedroom.
• In a multivariate model, the following risk factors were associated with higher adult asthma prevalence: female gender, younger age (18-34 years old), African American non-Hispanic race/ethnicity, current or former smoking status, obesity, and low annual household income (under $15,000).
Key Findings

BURDEN OF ASTHMA IN WISCONSIN 201316
Obesity
Body Mass Index (BMI) is a measurement used to classify a person’s weight accounting for his/her height. BMI has a strong positive association with the risk of incident asthma, especially among young boys and adult women.15,16 Furthermore, obese adults are more likely to have worse asthma outcomes, such as poor asthma control and increased risk of asthma hospitalizations, compared to adults with normal BMIs.18,19
In Wisconsin, obese adults (BMI≥30.0) had a current asthma prevalence of 12.3 percent, while non-overweight/obese adults (BMI≤24.9) had a prevalence of 8.0 percent (Figure 13). Overweight adults (BMI 25.0 to <30.0) had similar asthma prevalence estimates to normal weight adults. When stratified by sex, females showed an association between weight status and asthma prevalence. A significantly higher percent of obese females reported having current asthma (16.3 percent), compared to approximately 9 percent in both normal weight and overweight females. Among men, there were no differences in current asthma prevalence by weight status. Among all obese adults, women reported significantly higher current asthma prevalence than men (16.3 vs. 8.9 percent).
Figure 13. Current Asthma Prevalence among Adults by Weight Status and Sex, Wisconsin 2008-2010
Data Source: WI BRFSS 2008-2010
Factors Associated with Asthma
Weight Status
8.67.16.6
20
15
10
5
0
Pre
vale
nce
(per
cent
with
95%
Cl)
Obese (BMI ≥ 30.0)Overweight (BMI 25.0<30.0)Not Overweight/Obese (BM1<25.0)
16.3
8.08.7
7.4
8.9
12.3
Males Females WI Adults

BURDEN OF ASTHMA IN WISCONSIN 2013 17
Educational Attainment
Wisconsin adults with the least formal education reported the highest current asthma prevalence (12.4 percent), compared to adults with a college education (8.6 percent), although the difference was not significant (Figure 14).
Figure 14. Current Asthma Prevalence among Adults by Educational Attainment, Wisconsin 2008-2010
Data Source: WI BRFSS 2008-2010
Poverty
Current asthma prevalence among Wisconsin adults appears to be inversely associated with income level. Adults with a lower annual household income reported higher asthma prevalence than adults with a higher household income. Adults whose income was less than $15,000 had a statistically higher current asthma prevalence than those whose household income was greater than $25,000 (Figure 15).
Figure 15. Current Asthma Prevalence among Adults by Household Income Level, Wisconsin 2008-2010
Data Source: WI BRFSS 2008-2010
Factors Associated with Asthma
12.4
20
15
10
5
0
Pre
vale
nce
(per
cent
with
95%
Cl)
College GradHigh School/GED or some post-High School
Less than High School
9.1 8.6
8.0
16.6
8.19.2
25
15
20
5
0
Pre
vale
nce
(per
cent
with
95%
Cl)
$75,000+50,000 -<75,000
25,000 -<50,000
15,000 -<25,000
<15,000
10
30
10.9
Dollars $

BURDEN OF ASTHMA IN WISCONSIN 201318
Smoking
Personal Smoking Status
The prevalence of current asthma is slightly higher among adults who currently smoke (11.7 percent) than those who are “former” (9.2 percent) or “never” (8.2 percent) smokers, although these differences are not statistically significant due to the large standard error associated with the estimates (Figure 16). When comparing asthma prevalence among current smokers by sex, the estimate for women is 1.5 times greater than the estimate for men (14.3 versus 9.5 percent, respectively), although this difference is not statistically significant.
Figure 16. Current Asthma Prevalence among Adults by Smoking Status and Sex, Wisconsin 2008-2010
Data Source: WI BRFSS 2008-2010
Exposure to Environmental Tobacco Smoke
Exposure to environmental tobacco smoke is associated with adverse asthma-related health outcomes.20 Information regarding exposure to environmental tobacco smoke among public middle and high school students was available from the 2008 and 2010 YTS. These data indicated that public middle and high school students who reported living with a smoker reported a slightly higher lifetime prevalence of asthma than those who indicated that they did not live with a smoker (Figure 17). Additionally, students who reported spending time during all of the last seven days in the same room with a smoker reported a (non-significantly) higher lifetime prevalence of asthma than those who reported spending no time in the last seven days in the same room with a smoker.
Factors Associated with Asthma
7.2
9.5
14.3
20
15
10
5
0
Pre
vale
nce
(per
cent
with
95%
Cl)
9.27.0
11.5
9.3
11.7
8.2
Smoking Status
Men
FormerCurrent NeverFormerCurrent Never FormerCurrent Never
Women All Adults

BURDEN OF ASTHMA IN WISCONSIN 2013 19
Figure 17. Lifetime Asthma Prevalence among Public Middle and High School Students by Exposure to Environmental Tobacco Smoke, Wisconsin 2008 and 2010
Data Source: 2008 and 2010 YTS
Indoor Environmental Exposures
Indoor environmental exposures, such as household pets and pests, mold and tobacco smoke are potential triggers for asthma symptoms. Carpeting can trap dust, pet dander and other allergens. Some appliances, such as gas ranges and ovens and room-vented gas or kerosene heaters, emit combustion gases and particles, including carbon monoxide, nitrogen oxides, excess moisture and sulfur oxides. Exposure to indoor environmental triggers varied among adults and children with current asthma (Table 6). Many adults and children had carpeting or rugs in their bedroom (73.2 and 69.9 percent, respectively). Three-quarters of adults and half of all children with current asthma who reported having pets in their households also allowed them in the bedroom. Approximately 18 percent of adults with current asthma reported exposure to cigarette smoke in their home within the last week.
Table 6. Prevalence of Environmental Triggers in the Homes of Adults and Children with Current Asthma, Wisconsin 2006-2010
Environmental Trigger Adults
% (95% CI)
Children
% (95% CI)
Carpeting or rugs in bedroom 73.2 (68.8 - 77.6) 69.9 (60.5 - 79.3)
Pets inside home 58.3 (53.7 - 62.9) 64.8 (55.9 - 73.7)
Pets allowed in bedroom 75.3 (70.5 - 80.1) 52.0 (43.9 - 60.1)
Cooks with gas 36.1 (31.5 - 40.7) 31.9 (22.8 - 41.0)
Uses woodstove or fireplace 18.0 (14.9 - 21.1) 21.1 (15.3 - 26.9)
Uses unvented gas logs/stove 3.9 (2.4 - 5.4) *
Mold inside home 9.8 (7.3 - 12.3) 14.6 (8.7 - 20.5)
Smoker in home last week 18.2 (14.0 - 22.4) 6.7* (1.4 - 12.0)
Saw mice or rats in home 7.7 (4.8 - 10.6) 5.1 (2.6 - 7.6)
* Estimate does not meet standards of reliability or precision. Estimates presented with an asterisk have a relative standard error (RSE) of 30%–50%. Estimates that are not shown have an RSE over 50%.
Data Source: WI BRFSS Asthma Callback Survey 2006-2010
Factors Associated with Asthma
Lives with Smoker Days Spent in Same Room with Smoker
14.213.8
12.1
20
15
10
5
0
Pre
vale
nce
(per
cent
with
95%
Cl)
Yes No All 7 Days No Days
11.9
14.017.0
12.112.1
2008 2010

BURDEN OF ASTHMA IN WISCONSIN 201320
Adults and children with current asthma were also asked about some home environmental modifications taken to decrease exposure to indoor environmental triggers (Table 7). For example, washing bed linens in hot water and using impermeable covers on pillows and mattresses are relatively simple and inexpensive remedies to reduce exposure to triggers. The majority of adults and children with asthma did not use these measures.
Table 7. Prevalence of Environmental Modifications in the Homes of Adults and Children with Current Asthma, Wisconsin 2006-2010
Environmental Modification Adults
% (95% CI)
Children
% (95% CI)
Uses bathroom fan 67.2 (62.8 - 71.6) 70.1 (61.9 - 78.3)
Uses kitchen fan 57.8 (53.1 - 62.5) 65.2 (56.4 - 74.0)
Washes sheets/pillowcases in hot water 42.1 (37.4 - 46.8) 38.4 (29.3 - 47.5)
Uses pillow cover for dust mite control 31.4 (27.0 - 35.8) 37.2 (28.0 - 46.4)
Uses mattress cover for dust mite control 29.9 (25.4 - 34.4) 47.7 (39.1 - 56.3)
Uses air cleaner/purifier 36.2 (31.2 - 41.2) 25.7 (18.5 - 32.9)
Uses dehumidifier 54.1 (49.2 - 59.0) 51.0 (43.2 - 58.8)
Data Source: WI BRFSS Asthma Callback Survey 2006-2010
Factors Associated with Asthma

BURDEN OF ASTHMA IN WISCONSIN 2013 21
Estimate of Asthma Risk Using a Multivariate Model
A multivariate logistic regression model based on WI BRFSS data was used to estimate the risk of current asthma prevalence among adults, after adjustment for other risk factors (Figure 18). The following risk factors were associated with higher asthma prevalence among adults: female gender, younger age (18-34 years old), African American non-Hispanic race/ethnicity, current or former smoking status, obesity, and low annual household income (under $15,000). Each of these risk factors was significantly associated with asthma, independent of the other variables included in the model. The strongest association with asthma was seen with increased body mass index (BMI). Obese adults (BMI 30.0 to 39.9) were 60 percent more likely to have asthma (OR 1.57; 95% CI 1.27-1.94), while morbidly obese adults (BMI≥40.0) were nearly twice as likely to have asthma (OR 2.04; 95% CI 1.41-2.95) as normal weight adults (BMI≤24.9).
Figure 18. Adjusted Odds Ratios (ORadj) for Current Asthma Prevalence among Adults, Wisconsin 2007-2010
Data Source: WI BRFSS 2007-2010
Factors Associated with Asthma
Category Level ORadj 95% Cl p*Lower Risk Higher Risk
Gender (ref Male)
Age (ref 65+ years)
Race/ Ethnicity†
(ref White NH)
Smoking (ref Never)
BMI (ref Normal)
Income (ref $75,000+)
Female
18-34
35-64
African American NH
Hispanic
Other
Current
Former
Overweight
Obese
Morbidly Obese
< 15,000
15,000 - < 25,000
25,000 - < 50,000
50,000 - < 75,000
1.56
1.38
1.06
1.65
0.90
1.08
1.26
1.29
1.03
1.57
2.04
1.56
1.22
0.94
1.07
1.30 - 1.87
1.09 - 1.74
0.87 - 1.29
1.19 - 2.29
0.42 - 1.93
0.71 - 1.64
1.01 - 1.58
1.08 - 1.54
0.83 - 1.28
1.27 - 1.94
1.41 - 2.95
1.05 - 2.32
0.90 - 1.66
0.74 - 1.19
0.82 - 1.39
* p-value from Type 3 Analysis Effects † NH=Non-Hispanic Odds Ratios OR=1 (No Association)
Odds Ratio (log scale)
0.1 1 10
< 0.0001
0.02
0.03
0.01
< 0.0001
0.04

BURDEN OF ASTHMA IN WISCONSIN 201322
To help health care professionals bridge the gap between current knowledge and practice, the National Asthma Education and Prevention Program (NAEPP) of the National Heart, Lung, and Blood Institute (NHLBI) convened expert panels to prepare guidelines for the diagnosis and management of asthma that would help clinicians and patients make appropriate decisions about asthma care. The Expert Panel Report 3 (EPR-3) Guidelines for the Diagnosis and Management of Asthma, released in 2007 by the NAEPP, is an update of previous guidelines using the most current asthma research and available medications to provide the best possible care.1 The updated guidelines emphasize the importance of asthma control by reducing impairment (preventing chronic symptoms, using short-acting beta2-agonist (SABA) medication infrequently, maintaining normal lung function and normal activity levels) and reducing risk (preventing exacerbations, minimizing need for emergency care or hospitalization, preventing loss of lung function in adults, preventing reduced lung growth in children, and having minimal or no adverse effects of therapy).1
The four components of care essential for achieving and maintaining asthma control include assessment and monitoring asthma severity and control, education for a partnership in care, control of environmental factors and comorbid conditions that affect asthma, and medications (Table 8). Each component of care is expressed in terms of several key activities.
Table 8. National Asthma Education and Prevention Program Recommended Key Clinical Activities for the Diagnosis and Management of Asthma
Clinical Issue Key Clinical Activities
Diagnosis
• Establish asthma diagnosis
Managing Asthma Long-Term: Four Components of Care
Assessment and Monitoring Asthma Severity and Control
• Assess asthma severity to initiate therapy
• Assess asthma control to monitor and adjust therapy
• Schedule follow-up care
Education for a Partnership in Care • Provide self-management education
• Develop a written asthma action plan in partnership with patient
• Integrate education into all points of care where health professionals interact with patients
Control Environmental Factors and Comorbid Conditions that Affect Asthma
• Recommend measures to control exposures to allergens and pollutants or irritants that make asthma worse
• Treat comorbid conditions
Medications • Select medication and delivery devices to meet patient’s needs and circumstances
Data Source: National Asthma Education and Prevention Program’s (NAEPP) Expert Panel Report 3, Guidelines for the Diagnosis and Management of Asthma, 2007 (http://www.nhlbi.nih.gov/guidelines/asthma/asthsumm.htm)
ASTHMA MANAGEMENT AND QUALITY OF LIFE

BURDEN OF ASTHMA IN WISCONSIN 2013 23
Wisconsin BRFSS Asthma Callback Survey (2006-2010)• Two-thirds of adults with current asthma in Wisconsin reported having asthma
symptoms in the past 30 days; 17.5 percent of adults with current asthma reported experiencing daily symptoms.
• Of the individuals with current asthma who reported experiencing asthma symptoms in the last 30 days, one-fourth reported that their asthma symptoms made it difficult to stay asleep on one or more nights during the last 30 days.
• 54.3 percent of Wisconsin adults with current asthma reported having asthma attacks in the past year; 65.4 percent of Wisconsin children with current asthma reported an attack in the last year.
• One-quarter of adults with current asthma reported being unable to carry out their usual activities because of their asthma during the last month (23.9 percent), and approximately half of all children with asthma reported missing one or more school days in the past year due to asthma (46.3 percent).
• Nearly half of the adults (47.4 percent) and one-third of the children with current asthma (33.3 percent) had “not well-controlled” or “very poorly controlled” asthma.
• Among individuals with current asthma, the prevalence of “well-controlled” asthma was highest in children (66.7 percent) and decreased with increasing age (44.9 percent among the oldest adults, those 65 years of age and older).
• Among adults with current asthma, “well-controlled” asthma was significantly more prevalent in the highest income group compared to the lowest income group (62.0 vs. 34.0 percent, respectively).
• Over half of the adults and children with current asthma reported using a rescue medication in the last three months, while approximately half reported using a long-term controller medication.
• While most adults and children with current asthma were taught to recognize asthma symptoms (67.4 and 92.6 percent, respectively), what to do during an attack (77.0 and 93.9 percent) and how to use an inhaler (96.7 and 96.3 percent), only 30.6 percent of adults and 46.9 percent of children with current asthma indicated that their doctor or health care provider gave them an asthma action plan.
• Overall, 57 percent of adults with current asthma reported having a routine visit for their asthma in the past year. Adult African Americans with current asthma were significantly more likely to report routine health care visits for asthma than white adults (80.8 and 55.3 percent, respectively).
• Adults with current asthma reported diagnoses of asthma comorbidities, such as chronic obstructive pulmonary disorder (23.7 percent) and depression (28.0 percent).
Wisconsin BRFSS Survey (2008-2010)• A higher percent of adults 18 to 49 years of age with current asthma had a flu vaccine
in the last year, compared to similarly aged adults without current asthma (40.8 vs. 28.7 percent).
• Wisconsin adults with current asthma perceived their health status as fair or poor (23.0 percent) significantly more often than adults without asthma (11.5 percent).
Wisconsin School Health Profiles (SHP) Survey (2008, 2010 and 2012)• While three-fourths of public secondary schools have adopted a policy that allows
students to carry and administer their own asthma medications, 2012 SHP data suggest that only half of the schools have implemented the policy.
• Between 2008 and 2012, the percentage of schools that reported having an asthma action plan on file for all students with asthma increased from 37.3 in 2008 to 61.0 percent in 2012.
Key Findings
Asthma Management and Quality of Life

BURDEN OF ASTHMA IN WISCONSIN 201324
Asthma Severity
The initial assessment of asthma severity is made by clinicians immediately after diagnosis, or when the patient is first encountered, usually before the patient is taking a long-term control medication. A classification system for asthma severity has been developed according to the NAEPP’s Guidelines for the Diagnosis and Management of Asthma and is based on both impairment and risk.1 Specific measures for classifying severity include daytime and nighttime asthma symptoms, the need for quick-relief medication for symptom control, activity limitations, and lung function tests. The Wisconsin BRFSS Asthma Callback Survey contained questions that measured impairment and risk among adults and children with current asthma. These questions pertained to asthma symptoms and sleep disruptions, asthma attacks, urgent and emergency department visits for asthma and activity limitations (Table 9). Note that severity according to NAEPP guidelines is assessed prior to treatment and is therefore not strictly applicable to BRFSS survey responses. BRFSS estimates do not take into account that some respondents may be using long-term controller medications and may underestimate true impairment and risk.
Table 9. Measures of Impairment and Risk among Adults and Children with Current Asthma, Wisconsin 2006-2010
Measures of Impairment and Risk Adults
% (95% CI)
Children
% (95% CI)
Had symptoms in past 30 days 66.9 (62.2 - 71.6) 57.6 (48.9 - 66.3)
Sleep disrupted by asthma in past 30 days 24.9 (20.8 - 29.0) 28.7 (22.5 - 34.9)
Asthma attack in past 12 months 54.3 (49.5 - 59.1) 65.4 (57.4 - 73.4)
Had one or more urgent office visits for worsening symptoms in past 12 months
19.8 (16.1 - 23.5) 32.1 (23.3 - 40.9)
Had one or more emergency department visits for asthma in past 12 months
11.6 ( 8.5 - 14.7) 17.3 (10.9 - 23.7)
Unable to work or carry out usual activities due to asthma in past 12 months
23.9 (20.0 - 27.8) 31.5 (22.4 - 40.6)
Missed one or more school days in past year due to asthma
46.3 (36.7 - 55.9)
Data Source: WI BRFSS Asthma Callback Survey 2006-2010
Asthma Management and Quality of Life

BURDEN OF ASTHMA IN WISCONSIN 2013 25
Symptoms
Approximately two-thirds of adults and children with current asthma reported having asthma symptoms in the past 30 days (Table 9). Seventeen percent of adults with current asthma reported experiencing daily symptoms (Figure 19).
Figure 19. Frequency of Asthma Symptoms in the Past 30 Days among Adults with Current Asthma, Wisconsin 2006-2010
Data Source: WI BRFSS Asthma Callback Survey 2006-2010
Sleep Disruptions
One-fourth of adults and children with current asthma reported that their asthma symptoms made it difficult to stay asleep one or more nights during the last 30 days (Table 9). Ten percent of adults with current asthma reported having difficulty sleeping seven or more nights in the last 30 days (results not shown).
Attacks
Asthma attacks or episodes can be triggered by a broad range of allergens, irritants and stressors. With proper asthma management, asthma attacks can be limited or prevented. In Wisconsin, over 54 percent of adults with current asthma reported having asthma attacks during the past year (Table 10). Adult females were more likely to report experiencing asthma attacks in the past year than adult males (59.0 vs. 47.1 percent), although the difference was not statistically significant. There were essentially no differences in reported frequency of asthma attacks in Wisconsin adults with asthma by income or race (results not shown). Children with current asthma were significantly more likely to have an attack than adults (65.4 vs. 54.3, Table 9). Asthma attacks are an indication of poor asthma control and may result in emergency department visits or inpatient hospitalizations. Within the past year, approximately 20 percent of adults and 32 percent of children reported at least one urgent care visit for worsening asthma symptoms. A smaller percentage of adults and children (11.6 and 17.3 percent, respectively) reported at least one emergency department visit for asthma (Table 9).Data on asthma attacks in public middle and high school students are available from the Youth Tobacco Survey (YTS). Among students who reported ever being diagnosed
Asthma Management and Quality of Life
7.9
9.6
18.9
15.6
14.9
33.1
10090
8070
60
50
40
30
20
10
0
P
reva
lenc
e (p
erce
nt)
Everyday, all the time
Everyday, not all the time
More than twice a week, not daily
Once or twice a week
Less than once a week
None

BURDEN OF ASTHMA IN WISCONSIN 201326
with asthma, about 39 percent (2008 and 2010 averaged) reported having experienced an asthma attack in the last year (Figure 20). Slightly more female than male students reported an asthma attack in the past year, although the difference was not statistically significant. Note that the population examined in this case was all students reporting having ever been diagnosed with asthma, not those with current asthma as described above. This difference in survey design may account for the lower prevalence of asthma attacks measured through the YTS.
Figure 20. Public Middle and High School Students with Lifetime Asthma who Experienced an Asthma Attack in the Past Year by Sex, Wisconsin 2008-2010
Data Source: 2008 and 2010 YTS
Activity Limitations
When adults with current asthma were asked how many days in the last year they were unable to carry out their usual activities because of their asthma, approximately 24 percent reported experiencing one or more days of limited activity (Table 9). From 2006 to 2010, significantly more adult females with current asthma reported experiencing one or more days of limited activity in the past year than adult males with current asthma (29.1 vs. 15.2 percent, data not shown). A greater percentage of children with current asthma were unable to carry out usual daily activities (31.5 percent), and nearly half of all children reported missing one or more days of school in the last year due to asthma (Table 9).
Asthma Control
Once treatment is initiated based on the appropriate severity classification, clinical management emphasizes assessing asthma control for monitoring and adjusting therapy. Similar to the classification system for asthma severity, factors used to classify asthma control have also been identified in the EPR-3 Guidelines.1 Factors used to classify asthma control in children aged 12 and older and adults are shown in Table 10 (the EPR-3 Guidelines contain similar tables for children aged 0-4 and 5-11 years of age). Impairment may be assessed using variables such as the frequency of daytime and nighttime symptoms, the frequency of quick-relief medication use and objective
Asthma Management and Quality of Life
38.643.8 40.6
33.8
60
50
30
0
2008 2010
Pre
vale
nce
(per
cent
with
95%
Cl)
CombinedMalesFemales
42.236.2
40
20
10

BURDEN OF ASTHMA IN WISCONSIN 2013 27
assessment of lung function using spirometry to measure the forced expiratory volume in one second (FEV1) or by using patients’ measurements of peak flow. In addition, validated asthma questionnaires such as the Asthma Therapy Assessment Questionnaire (ATAQ), the Asthma Control Questionnaire (ACQ) and the Asthma Control Test (ACT) are useful in helping patients and clinicians assess the degree of asthma control that patients have been experiencing over the short term.
Table 10. Factors Used to Classify Asthma Control in Children ≥12 Years of Age and Adults, from the Guidelines for the Diagnosis and Management of Asthma (EPR-3)
Components of Control Classification of Asthma Control (≥12 years of age)
Well-Controlled Not Well-ControlledVery Poorly
Controlled
Impairment
Symptoms ≤2 days/week >2 days/week Throughout the
day
Nighttime awakening ≤2x/month 1-3x/week ≥4x/week
Short-acting beta2-agonist use for symptom control
≤2 days/week >2 days/week Several times per day
FEV1 or peak flow >80% predicted/ personal best
60-80% predicted/ personal best
<60% predicted/ personal best
Validated Questionnaires
ATAQ
ACQ
ACT
0
≤0.75*
≥20
1-2
≥1.5
16-19
3-4
N/A
≤15
Risk
Exacerbations 0-1/year ≥2/year
Consider severity and interval since last exacerbation
Progressive loss of lung function
Evaluation requires long-term follow-up care
Treatment-related adverse effects
Medication side effects can vary in intensity from none to very troublesome and worrisome. The level of intensity does not correlate to specific levels of control but should be considered in the overall assessment of risk.
Data Source: Expert Panel Report 3 (EPR-3) Guidelines for the Diagnosis and Management of Asthma at http://www.nhlbi.nih.gov/guidelines/asthma/
Frequency of asthma symptoms, nighttime awakenings and rescue medication use reported by adults and children in the Wisconsin BRFSS Asthma Callback Survey were used to classify asthma control into the following categories: well-controlled, not well-controlled and very poorly controlled (Table 11). These control classifications were based on the components established in the EPR-3 Guidelines discussed above. The activity limitation question asked on the BRFSS Asthma Callback Survey was not comparable to the NAEPP guidelines, so it was not included in control classification.
Asthma Management and Quality of Life
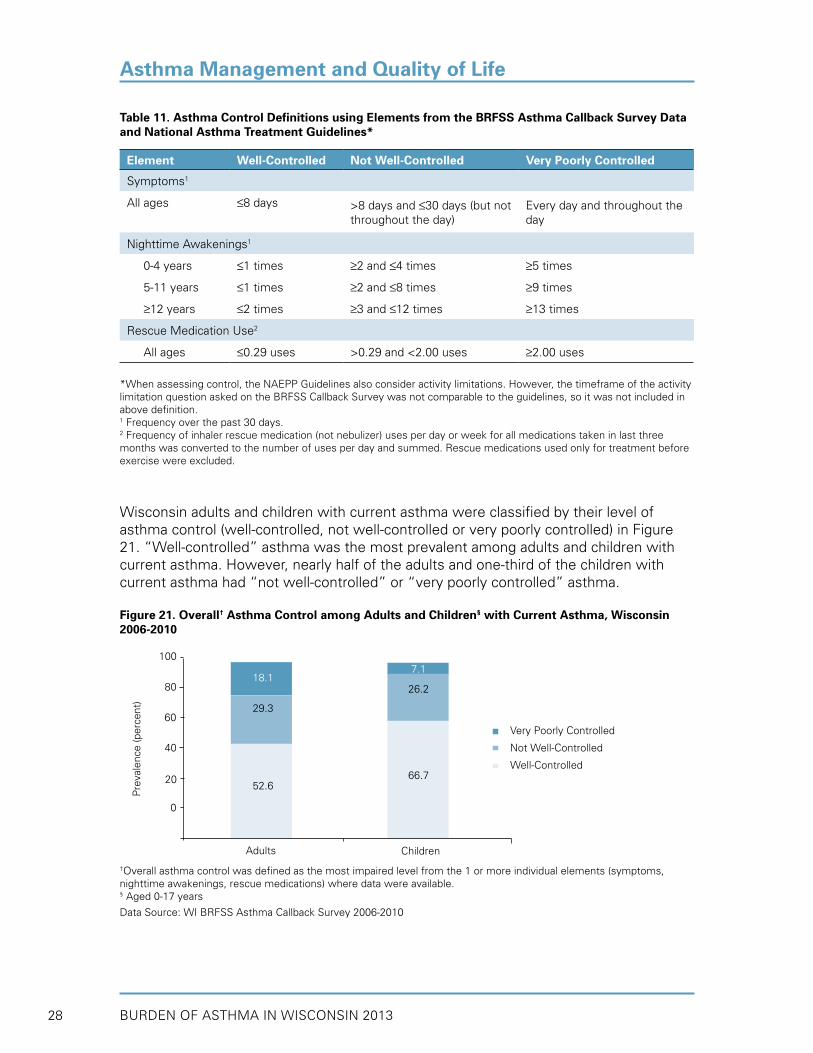
BURDEN OF ASTHMA IN WISCONSIN 201328
Asthma Management and Quality of Life
Table 11. Asthma Control Definitions using Elements from the BRFSS Asthma Callback Survey Data and National Asthma Treatment Guidelines*
Element Well-Controlled Not Well-Controlled Very Poorly Controlled
Symptoms1
All ages ≤8 days >8 days and ≤30 days (but not throughout the day)
Every day and throughout the day
Nighttime Awakenings1
0-4 years ≤1 times ≥2 and ≤4 times ≥5 times
5-11 years ≤1 times ≥2 and ≤8 times ≥9 times
≥12 years ≤2 times ≥3 and ≤12 times ≥13 times
Rescue Medication Use2
All ages ≤0.29 uses >0.29 and <2.00 uses ≥2.00 uses
*When assessing control, the NAEPP Guidelines also consider activity limitations. However, the timeframe of the activity limitation question asked on the BRFSS Callback Survey was not comparable to the guidelines, so it was not included in above definition.1 Frequency over the past 30 days.2 Frequency of inhaler rescue medication (not nebulizer) uses per day or week for all medications taken in last three months was converted to the number of uses per day and summed. Rescue medications used only for treatment before exercise were excluded.
Wisconsin adults and children with current asthma were classified by their level of asthma control (well-controlled, not well-controlled or very poorly controlled) in Figure 21. “Well-controlled” asthma was the most prevalent among adults and children with current asthma. However, nearly half of the adults and one-third of the children with current asthma had “not well-controlled” or “very poorly controlled” asthma.
Figure 21. Overall† Asthma Control among Adults and Children§ with Current Asthma, Wisconsin 2006-2010
†Overall asthma control was defined as the most impaired level from the 1 or more individual elements (symptoms, nighttime awakenings, rescue medications) where data were available.§ Aged 0-17 years
Data Source: WI BRFSS Asthma Callback Survey 2006-2010
100
80
40
Pre
vale
nce
(per
cent
)
Adults
60
20
0
18.1
29.3
52.6
7.1
26.2
66.7
Very Poorly Controlled
Not Well-Controlled
Well-Controlled
Children

BURDEN OF ASTHMA IN WISCONSIN 2013 29
Levels of asthma control (well-controlled, not well-controlled or very poorly controlled) were assessed within each individual element of control among Wisconsin adults with current asthma (Figure 22). When considering individual elements of control including symptoms, nighttime awakenings and rescue medications (as opposed to the overall control measure), a greater percentage of adults with current asthma reported “well-controlled” asthma.
Figure 22. Asthma Control Levels within Individual Elements of Control among Adults with Current Asthma, Wisconsin 2006-2010
†Overall asthma control was defined as the most impaired level from the 1 or more individual elements (symptoms, nighttime awakenings, rescue medications) where data were available.
Data Source: WI BRFSS Asthma Callback Survey 2006-2010
Among individuals with current asthma, the prevalence of “well-controlled” asthma was highest in children and lower for older age groups (Figure 23). Adults aged 65+ years had a significantly lower prevalence of “well-controlled” asthma than children aged 0-17 years (44.9 vs. 66.7 percent, respectively).
Figure 23. Well-Controlled Asthma among Adults and Children§ with Current Asthma by Age Group, Wisconsin 2006-2010
§ Aged 0-17 years
Data Source: WI BRFSS Asthma Callback Survey 2006-2010
Asthma Management and Quality of Life
100
60
Pre
vale
nce
(per
cent
)
Awakenings Medications
80
40
20
7.9
28.5
63.6
11.5
16.4
72.1
Very Poorly Controlled
Not Well-Controlled
Well-Controlled
Symptoms Nighttime Rescue Overall†0
7.810.6
81.6
18.1
29.3
52.6
Elements of Control
Age Group (years)
100
60
Pre
vale
nce
(per
cent
with
95%
Cl)
80
40
20
0-17 18-34 35-64 ≥650
7.866.7
55.851.5
44.9

BURDEN OF ASTHMA IN WISCONSIN 201330
Among adults with current asthma, “well-controlled” asthma was significantly more prevalent in the highest income group compared to the lowest income group (62.0 vs. 34.0 percent, respectively, Figure 24). Conversely, “very poorly controlled” asthma was least prevalent among adults in the highest income group (7.8 percent).
Figure 24. Overall† Asthma Control by Income Level among Adults with Current Asthma, Wisconsin 2006-2010
†Overall asthma control was defined as the most impaired level from the 1 or more individual elements (symptoms, nighttime awakenings, rescue medications) where data were available.
Data Source: WI BRFSS Asthma Callback Survey 2006-2010
Medication Use
In their “Stepwise Approach to Classifying and Treating Asthma” the NAEPP recommends pharmacologic therapy based on asthma severity and subsequent adjustments based on level of asthma control.1 Intermittent asthma may be managed using short-acting beta2-agonist (SABA) medication, while persistent asthma is best managed using an inhaled corticosteroid (ICS) alone or in combination with other therapies. All individuals with persistent asthma should be prescribed daily long-term controller medications to prevent or limit asthma symptoms or attacks.
The Wisconsin BRFSS Asthma Callback Survey contained questions on medication use among adults and children with current asthma. The prevalence of medication use in the past three months was analyzed by type (long-term controller vs. rescue), form of medication (pill, inhaler, nebulizer) and any complementary and alternative medicine (CAM) use (Figure 25). Included in CAM use were any of the following: herbs, vitamins, acupuncture, acupressure, aromatherapy, homeopathy, reflexology, yoga, breathing techniques, naturopathy, or other complementary or alternative care.
Over half of the adults and children with current asthma reported using a rescue medication in the last three months, while approximately half reported using a long-term controller medication. The most common form of medication used by adults and children was the inhaler (67.4 and 58.1 percent, respectively). Forty percent of adults with current asthma used some form of CAM to help control their asthma, while less than 20 percent of children with asthma used CAM.
Asthma Management and Quality of Life
<$25,000 $25,000-49,999 ≥$50,000
100
80
60
40
20
0
Pre
vale
nce
(per
cent
)
Household Income
Very Poorly Controlled
Not Well-Controlled
Well-Controlled
41.1
24.9
34.0
16.5
34.5
34.0
7.8
30.1
62.0

BURDEN OF ASTHMA IN WISCONSIN 2013 31
Figure 25. Medication Use in the Past 3 Months among Adults and Children with Current Asthma, Wisconsin 2006-2010
†Complementary and Alternative Medicine
Data Source: WI BRFSS Asthma Callback Survey 2006-2010
The NAEPP recommends that physicians monitor the use of quick-relief or rescue medications (such as β2-agonists) at every asthma patient visit. Frequent use of quick-relief medication is an indication that a patient’s asthma may be poorly controlled. The prevalence of medication use in the past three months was assessed among adults in each level of asthma control (Figure 26). Adults with current asthma who were “well-controlled” reported significantly less rescue medication use in the past three months than patients with “not well-controlled” and “very poorly controlled” asthma. Use of controller medications was also significantly higher among adults in the “not well-controlled” and “very poorly-controlled” groups, compared to adults with “well-controlled” asthma. These data should be interpreted with some degree of caution, since some individuals may have mild intermittent asthma and may not require the use of controller medications.
Asthma Management and Quality of Life
46.8
50.459.1
61.5
15.2
28.2
58.167.4
27.8
9.6
40.0
19.4
70
50
40
30
Pre
vale
nce
(per
cent
with
95%
Cl)
CAM† Use
NebulizerInhalerPillRescueController
Type Form of Medication
Adult Child80
60
20
10
0

BURDEN OF ASTHMA IN WISCONSIN 201332
Figure 26. Rescue or Controller Medication Use in the Past 3 Months by Overall† Asthma Control among Adults with Current Asthma, Wisconsin 2006-2010
†Overall asthma control was defined as the most impaired level from the 1 or more individual elements (symptoms, nighttime awakenings, rescue medications) where data were available.
Data Source: WI BRFSS Asthma Callback Survey 2006-2010
Asthma Self-Management
Evidence indicates that asthma self-management education improves outcomes of chronic asthma (reduced urgent care visits and hospitalizations; improved quality of life) and can be cost-effective. Self-management education is one component of care essential for long-term management of asthma.1 Self-monitoring symptoms to assess level of asthma control, using a written asthma action plan, taking medication with correct inhaler technique, avoiding asthma triggers and seeking regular medical care are all self-management skills necessary to control asthma.1 The Wisconsin BRFSS Asthma Callback Survey contained questions that assessed asthma self-management knowledge among adults and children with current asthma. Positive responses to questions regarding asthma self-management skills such as having been taught how to recognize symptoms or having taken an asthma management course are detailed in Table 12.
Table 12. Asthma Self-Management Knowledge among Adults and Children with Current Asthma, Wisconsin 2006-2010
Self-Management Knowledge Adults
% (95% CI)
Children
% (95% CI)
Taught to recognize asthma signs/symptoms 67.4 (62.8 - 72.0) 92.6 (88.8 - 96.4)
Taught what to do during an attack 77.0 (73.1 - 80.9) 93.9 (90.7 - 97.1)
Taught to use a peak flow meter 49.1 (44.2 - 54.0) 38.3 (29.9 - 46.7)
Given asthma action plan 30.6 (26.4 - 34.8) 46.9 (38.5 - 55.3)
Took course on how to manage asthma 5.9 (4.2 - 7.6) 8.7* (3.1 - 14.3)
Shown how to use inhaler by health professional 96.7 (94.9 - 98.5) 96.3 (92.6 - 100.0)
Health professional watched inhaler use 79.0 (75.3 - 82.7) 91.0 (86.8 - 95.2)
* Estimate does not meet standards of reliability or precision. Estimates presented with an asterisk have a relative standard error (RSE) of 30%–50%. Estimates that are not shown have an RSE over 50%.
Data Source: WI BRFSS Asthma Callback Survey 2006-2010
Asthma Management and Quality of Life
34.1
100
80
60
40
0
Pre
vale
nce
(per
cent
with
95%
Cl)
Well-Controlled Not Well-Controlled Very Poorly Controlled
76.5
43.3
58.7
76.8
Rescue Controller
20
64.5
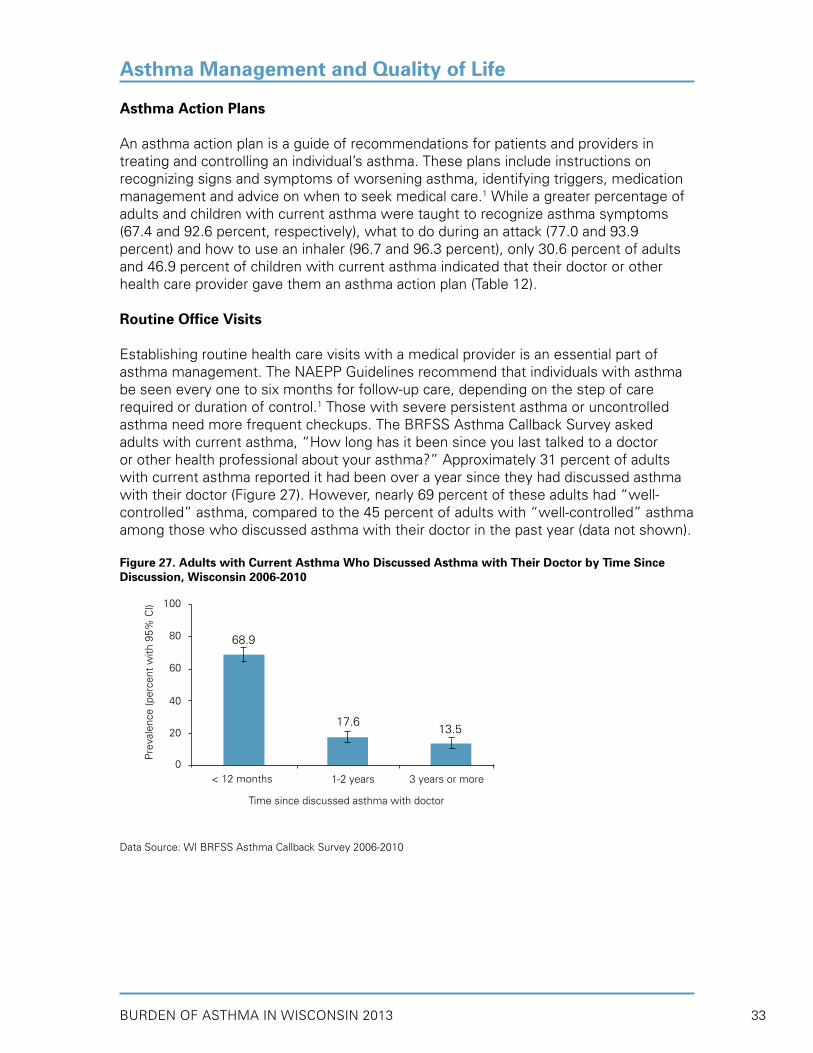
BURDEN OF ASTHMA IN WISCONSIN 2013 33
Asthma Action Plans
An asthma action plan is a guide of recommendations for patients and providers in treating and controlling an individual’s asthma. These plans include instructions on recognizing signs and symptoms of worsening asthma, identifying triggers, medication management and advice on when to seek medical care.1 While a greater percentage of adults and children with current asthma were taught to recognize asthma symptoms (67.4 and 92.6 percent, respectively), what to do during an attack (77.0 and 93.9 percent) and how to use an inhaler (96.7 and 96.3 percent), only 30.6 percent of adults and 46.9 percent of children with current asthma indicated that their doctor or other health care provider gave them an asthma action plan (Table 12).
Routine Office Visits
Establishing routine health care visits with a medical provider is an essential part of asthma management. The NAEPP Guidelines recommend that individuals with asthma be seen every one to six months for follow-up care, depending on the step of care required or duration of control.1 Those with severe persistent asthma or uncontrolled asthma need more frequent checkups. The BRFSS Asthma Callback Survey asked adults with current asthma, “How long has it been since you last talked to a doctor or other health professional about your asthma?” Approximately 31 percent of adults with current asthma reported it had been over a year since they had discussed asthma with their doctor (Figure 27). However, nearly 69 percent of these adults had “well-controlled” asthma, compared to the 45 percent of adults with “well-controlled” asthma among those who discussed asthma with their doctor in the past year (data not shown).
Figure 27. Adults with Current Asthma Who Discussed Asthma with Their Doctor by Time Since Discussion, Wisconsin 2006-2010
Data Source: WI BRFSS Asthma Callback Survey 2006-2010
Asthma Management and Quality of Life
68.9
100
80
60
40
0
Pre
vale
nce
(per
cent
with
95%
Cl)
1-2 years 3 years or more < 12 months
17.613.5
Time since discussed asthma with doctor
20

BURDEN OF ASTHMA IN WISCONSIN 201334
Asthma Management and Quality of Life
Wisconsin adults with current asthma were asked how many times they had seen a doctor, nurse or other health professional for a routine asthma checkup in the last year. Overall, 57 percent reported having had at least one routine visit for their asthma (Figure 28). Adult females with current asthma were more likely to report having a routine health care visit for asthma in the last year than adult males with current asthma, although the difference was not significant. Adult African Americans with current asthma were significantly more likely to report routine health care visits for asthma in the past year than white adults (80.8 and 55.3 percent, respectively).
Figure 28. Routine Health Care Visits for Asthma in the Past Year among Adults with Current Asthma by Sex and Race*, Wisconsin 2006-2010
*Race groups include both Hispanic and non-Hispanic individuals.† Asians, Native Hawaiians, Pacific Islanders, Native Americans, Alaskan Natives, multiracial respondents, and individuals that reported being of other races. These groups were combined due to low number of sampled respondents.
Data Source: WI BRFSS Asthma Callback Survey 2006-2010
Flu Vaccine
The Centers for Disease Control and Prevention (CDC) expanded the recommendation for annual influenza (flu) vaccination to include all people aged 6 months and older.21 While everyone should get a flu vaccine each flu season, it is especially important that individuals 50 years of age and older as well as those who are at an increased risk of developing complications from influenza get an annual flu vaccination.21 In recognition of the importance of treating and preventing comorbid conditions, the NAEPP Guidelines recommend that all persons with asthma receive a yearly flu vaccination.1
Data indicate that a significantly higher percent of adults 18 to 49 years of age with current asthma had a flu vaccine in the last year, compared to similarly aged adults without current asthma (40.8 vs. 28.7 percent, Figure 29). Adults 50 years of age and older with current asthma were significantly more likely to report having received a flu vaccine (69.5 percent) than all younger adults (40.8 and 28.7 percent) and adults 50 years of age and older without current asthma (55.7 percent).
61.0 57.0
100
80
60
40
0Pre
vale
nce
(per
cent
with
95%
Cl)
Male Female White African Other †
American
Sex Race Overall
70.9
50.4 55.3
80.8
20

BURDEN OF ASTHMA IN WISCONSIN 2013 35
Figure 29. Flu Vaccine among Adults with and without Current Asthma by Age Group, Wisconsin 2008-2010
Data Source: WI BRFSS 2008-2010
Asthma Management in Wisconsin Schools
Asthma in school-aged children remains a public health concern in Wisconsin. At the national level, asthma is one of the leading causes of school absenteeism; children miss an estimated 14 million days of school per year because of asthma.22 Because children spend a significant amount of time at school, asthma control and management in the school environment can be tremendously helpful. Schools can assist by educating teachers and staff, and adopting policies and procedures to better serve students with asthma (CDC, 2004). Asthma-friendly schools will help reduce the number of missed school days and improve the learning environment for children with asthma.
Since 1999, Wisconsin has had a law ensuring that students with asthma are allowed to carry and self-administer their asthma medications in Wisconsin public schools (Burden of Asthma 2004). In 2006, this law was revised to ensure that students could carry and use asthma medications in both public and private schools. The expansion in the scope of this law is essential to ensure that all school-aged children have access to their medications when they are needed.
To help schools address asthma management, CDC developed a document entitled Strategies for Addressing Asthma within a Coordinated School Health Program.23 This document details six strategies that schools can consider to help students with asthma, including:
1. Establish management and support systems for asthma-friendly schools.2. Provide appropriate school health and mental health services for students with asthma.3. Provide asthma education and awareness programs for students and school staff.4. Provide a safe and healthy school environment to reduce asthma triggers.5. Provide safe, enjoyable physical education and activity opportunities for students with asthma.6. Coordinate school, family and community efforts to better manage asthma symptoms and reduce school absences among students with asthma.
Asthma Management and Quality of Life
40.8
80
60
40
20
0
Pre
vale
nce
(per
cent
with
95%
Cl)
50+ years 18-49 years
28.7
69.5
Age Group
55.7
Current Asthma No Asthma

BURDEN OF ASTHMA IN WISCONSIN 201336
Information to help schools measure their progress toward the implementation of these CDC strategies is available from the School Health Profiles (SHP). SHP is a survey administered every two years by the Wisconsin Department of Public Instruction (DPI) to monitor the status of school health and physical education policies in middle and high schools (see Appendix A for more information).
In 2012, 302 of 420 randomly selected public middle and high school principals (response rate = 72 percent) completed the SHP. They were asked to indicate if their school had implemented specific school-based asthma management activities. The results were weighted and are representative of all regular public secondary schools in Wisconsin having at least one grade (6 through 12). Key asthma-related results from the 2008, 2010 and 2012 SHP are presented in Table 13. Data indicate that the majority of asthma management practices in schools have not significantly improved over this time period.
In 2012, the minority (21.3 percent) of schools in Wisconsin had a full-time registered nurse to provide health services to students. Approximately three-fourths of public middle and high schools adopted a policy stating that students are permitted to carry and self-administer asthma medications by 2012; however, only 55 percent reported implementing the policy. Half of all schools reported being able to identify and track students with poorly controlled asthma (56.0 percent in 2012), although only 23 percent of schools provided intensive case management for these students. Between 2008 and 2012, the percentage of schools that reported having an asthma action plan on file for all students with asthma increased from 37.3 percent in 2008 to 61.0 percent in 2012. One-third of schools (35.7 percent in 2012) required all staff members to receive annual training on recognizing and responding to severe asthma symptoms. These data highlight the need for continued improvement in all school asthma management practices.
Asthma Management and Quality of Life

BURDEN OF ASTHMA IN WISCONSIN 2013 37
Table 13. Asthma Management in Wisconsin Public Middle and High Schools according to School Principals, Survey Years 2008-2012
Management Practice Prevalence (%)
2008 2010 2012
Percentage of schools that ever used the School Health Index or other self-assessment tool to assess asthma school policies, activities and programs
19.7 23.8 19.8
Percentage of schools with a full-time registered nurse who provides health services to students at school
16.7 22.5 21.3
Percentage of schools that have adopted a policy stating that students are permitted to carry and self-administer asthma medications
72.0 73.5 76.6
Percentage of schools that implemented a policy permitting students to carry and self-administer asthma medications by communicating the policy to students, parents and families, and by designating an individual responsible for policy implementation
47.7 50.1 55.2
Percentage of schools that had an asthma action plan on file for all students with known asthma
37.3 53.2 61.0
Percentage of schools that identified students with poorly controlled asthma by keeping track of them in at least three different ways
54.3 50.1 56.0
Percentage of schools that provided intensive case management for students with poorly controlled asthma at school
16.1 26.0 23.0
Percentage of schools that required all school staff members to receive annual training on recognizing and responding to severe asthma symptoms
37.0 25.9 35.7
Percentage of schools that provided parents and families with health information to increase parent and family knowledge of asthma
12.2 18.1 13.3
Data Source: 2012 School Health Profiles, Trend Analysis Report – Principal Survey, Wisconsin Department of Public Instruction
Health-Related Quality of Life
Perceived Health Status
Questions on quality of life are increasingly used by clinicians in combination with clinical and physiologic measures to get a more complete picture of the overall health status of individuals with asthma. Results from the Wisconsin BRFSS (Figure 30) indicated that adults with current asthma perceived their health status as fair or poor (23.0 percent) significantly more often than adults without asthma (11.5 percent). Conversely, significantly more adults without asthma perceived their health as excellent or very good (59.1 percent) compared to adults with current asthma (45.5 percent). A national study found that U.S. adults with current asthma were more likely to report having poor or fair health than adults without asthma.24,25
Asthma Management and Quality of Life

BURDEN OF ASTHMA IN WISCONSIN 201338
Figure 30. Perceived Health Status among Adults with and without Current Asthma, Wisconsin 2008-2010
Data Source: WI BRFSS 2008-2010
Comorbid Conditions
The Wisconsin BRFSS Asthma Callback Survey asked adults with current asthma questions on the co-existing chronic conditions of chronic obstructive pulmonary disease (COPD) and depression. Chronic bronchitis, like emphysema, is among a group of lung diseases known as COPD. Because adults may know the condition by any of these names, the callback survey included a separate question for each. Overall, 24 percent of adults with asthma reported that they had also been diagnosed with COPD (Table 14). Twenty-eight percent of all adults with current asthma reported a diagnosis of depression. The coexistence of asthma with other conditions is an important consideration for asthma management that if properly addressed, may improve the health status and quality of life of patients with asthma.
Table 14. Comorbid Conditions among Adults with Current Asthma, Wisconsin 2006-2010
Comorbid Condition % (95% CI)
Chronic Obstructive Pulmonary Disease* 23.7 (20.3 - 27.1)
Depression 28.0 (24.2 - 31.8)
*Includes chronic obstructive pulmonary disease, emphysema or chronic bronchitis
Data Source: WI BRFSS Asthma Callback Survey 2006-2010
Asthma Management and Quality of Life
45.5
80.0
60.0
40.0
20.0
0
Pre
vale
nce
(per
cent
with
95%
Cl)
Excellent/ Very Good Good Fair/poor
59.1
31.529.5
23.0
11.5
Current Asthma No Asthma

BURDEN OF ASTHMA IN WISCONSIN 2013 39
• According to the Wisconsin BRFSS Adult Asthma Callback Survey data, the prevalence of work-related asthma (WRA) ranged from 8.2 percent (doctor-diagnosed WRA) to 33.9 percent (asthma aggravated by current job). Combining doctor-diagnosed and self-identified WRA resulted in an estimate of 13.5 percent. Asthma caused or made worse by exposures in a current or previous job resulted in a prevalence estimate of 46.6 percent.
• From 2004 to 2011, workers’ compensation was the primary payer in 321 cases out of 166,335 ED visits and 43 cases out of 41,548 hospitalizations where asthma was the principal diagnosis.
• Less than 1 percent of Wisconsin workers’ compensation claims were identified in 2010 and 2011 as potentially asthma-related.
• These data indicate that very few asthma events can be clearly identified as work-related through administrative data. As a result, asthma may be potentially underestimated in these populations.
Work-related asthma (WRA) is defined as asthma that is caused or exacerbated by occupational exposures. Approximately 10 to 23 percent of newly-diagnosed asthma cases in U.S. adults are thought to be work-related.26 Work-aggravated asthma symptoms are also common among adults with existing asthma.27 WRA is thought to be one of the most common occupational respiratory illnesses; however, many cases are not recognized or reported as being work-related. For a case of WRA to be recognized, a health care provider must make a diagnosis of asthma and an association must be made between symptoms of asthma and occupational exposures. Surveillance of WRA is difficult due to the complexity in diagnosing and relating symptoms to exposures in the workplace. As such, Wisconsin has taken several approaches to quantify the prevalence of WRA.
Work-Related Asthma
Key Findings
WORK-RELATED ASTHMA

BURDEN OF ASTHMA IN WISCONSIN 201340
Work-Related Asthma Prevalence from the Wisconsin BRFSS
The Wisconsin BRFSS Adult Asthma Callback Survey included six questions to assess WRA among ever-employed adults with current asthma. These data were analyzed to generate estimates of the proportion of adult asthma that is work-related (Table 15). When considering the responses from individual questions pertaining to WRA, the prevalence of WRA ranged from 8.2 percent (doctor-diagnosed WRA) to 33.9 percent (asthma aggravated by current job). Combining doctor-diagnosed and self-identified WRA resulted in an estimate of 13.5 percent. Combining the first four questions to estimate asthma caused or made worse by exposures in a current or previous job resulted in a prevalence estimate of 46.6 percent. There were no significant differences in individual or aggregate WRA prevalence estimates by sex or race (data not shown).
Table 15. Prevalence of Work-Related Asthma among Ever-Employed Adults with Current Asthma, Wisconsin 2006-2010
Measure % (95% CI)
1) Asthma CAUSED by current job 13.6 (10.0 – 17.2)
2) Asthma AGGRAVATED by current job 33.9 (28.4 – 39.4)
3) Asthma CAUSED by previous job 17.0 (13.4 – 20.6)
4) Asthma AGGRAVATED by previous job 33.2 (28.4 – 38.0)
5) Doctor-diagnosed work-related asthma 8.2 (6.1 – 10.3)
6) Self-identified work-related asthma 11.4 (8.3 – 14.5)
Doctor or self-diagnosed work-related asthmaa 13.5 (10.3 –16.7)
Asthma caused or made worse by exposures at workb 46.6 (41.9 – 51.3)
aIncludes “yes” response to any of measures 5-6bIncludes “yes” response to any of measures 1-4
Data Source: WI BRFSS Asthma Callback Survey 2006-2010
Workers’ Compensation as Primary Payer for ED Visits and Hospitalizations
Workers’ compensation is a form of insurance that covers employees who are injured or become ill because of their work. The insurance covers costs of healthcare as well as lost wages due to illness or injury. If at the time of hospitalization it is known that the costs will be paid through workers’ compensation, it can be listed as the payer. Thus, examining asthma ED visits and hospitalizations for which workers’ compensation was the primary payer is another approach to use to quantify severe WRA. From 2004 to 2011, workers’ compensation was the primary payer in 321 cases out of 166,335 ED visits and 43 cases out of 41,548 hospitalizations where asthma was the principal diagnosis (Table 16). These results indicate that very few asthma ED visits and hospitalizations can be clearly identified as work-related at the time of the event and thus appropriately billed to workers’ compensation.
Work-Related Asthma

BURDEN OF ASTHMA IN WISCONSIN 2013 41
Table 16. Asthma* ED Visits and Hospitalizations with Workers’ Compensation as the Primary Payer by Year, Wisconsin 2004-2011
Year ED Visits (#) Hospitalizations (#)
2004 46 2
2005 41 6
2006 38 9
2007 48 5
2008 33 4
2009 34 1
2010 47 7
2011 34 9
Total (2004-2011) 321 (0.2%) 43 (0.1%)
*Asthma listed as the principal diagnosis (ICD-9-CM 493.00 – 493.92)
Data Source: Emergency department visit discharge file; Inpatient hospitalization discharge file
Workers’ Compensation Claims Data
In Wisconsin, the Workers’ Compensation Act provides for payment of reasonable medical expenses and compensation for lost wages resulting from work-related injuries or disabilities. Claims are reported electronically to the Wisconsin Workers’ Compensation Division in the Department of Workforce Development (DWD). Work-related asthma may be identified in several ways in the claims database. First, injury information may be entered into a text injury description field. In addition, the claims database has three fields that correspond to Detailed Claim Information (DCI) codes, developed by the National Council on Compensation Insurance. These codes correspond to “nature of injury”, “cause of injury” and “body part”. Although there is no “nature of injury” code for asthma, there is a code for respiratory disorders resulting from exposure to gases, fumes, chemicals, etc (DCI code 65). Data presented below come from any of these three mutually exclusive queries of the claims database (Table 17). Less than one percent of claims were identified in 2010 and 2011 as potentially asthma-related.
Table 17. Classification of WRA Cases, WI Workers’ Compensation Claims Database, 2010-2011
Claim Classification # Claims (% of Total) 2010 2011
“Asthma” in the injury description field 18 23
“Respiratory” in the injury description field 19 15
DCI Nature of Injury Code 65 (respiratory disorders, resulting from exposure to gases, fumes, chemicals)
101 63
Total Reported Claims* 31,696 30,165
Potentially asthma-related (sum of three classifications) 138 (0.4%) 101 (0.3%)
* Reported claims, regardless of whether they were denied, no lost time, non-compensable or litigated, as of September 19, 2012
Work-Related Asthma

BURDEN OF ASTHMA IN WISCONSIN 201342
Asthma is a complex chronic disease with varying symptoms and severity that requires care at many levels of the health care system. This chapter examines aspects of health care utilization among individuals with asthma, including data on insurance status and cost as a barrier to care, emergency department (ED) visits, and inpatient hospitalizations. Detailed data on the cost of asthma care in Wisconsin are presented within each of these sections.
Work-Related AsthmaHEALTH CARE UTILIZATION
Insurance Status and Cost of Care• From 2006 to 2010, 8.2 percent of adults with asthma did not have health insurance
coverage, whether through commercial or public plans.• Over 6 percent of adults with asthma reported not being able to see their primary care
doctor for asthma, and approximately 10 percent of adults with asthma could not afford asthma medications at some point in the last year.
Hospital Emergency Department Visits• In 2011, there were 19,584 ED visits for asthma in Wisconsin, costing over $24.5 million.• Between 2002 and 2011, population-based asthma ED visit rates in Wisconsin have
significantly decreased (41.8 to 36.0 visits per 10,000 population between 2002 and 2011).• Children aged 0-4 years had the highest asthma ED visit rate (74.2 visits per 10,000) in
2011.• The five counties with the highest rates of asthma ED visits per 10,000 population for
2009-2011 were Menominee (98.0), Milwaukee (80.0), Sawyer (59.1), Kenosha (54.4), and Vilas (50.3).
• Risk-based rates (rates of asthma ED visits among persons with asthma) have remained steady between 2005 and 2011.
Inpatient Hospitalizations• In 2011, there were a total of 4,746 hospitalizations in Wisconsin for which asthma was
the principal diagnosis, costing an average of $13,309 per hospitalization.• Over the past 15 years there has been a decline in Wisconsin population-based asthma
hospitalization rates (12.0 to 8.1 hospitalizations per 10,000 population between 1995 and 2011).
• Children aged 0-4 years had the highest asthma hospitalization rate at 19.6 per 10,000 in 2011.
• Rates were over five times higher for African Americans (31.0 per 10,000) and over two times higher for American Indians (15.1 per 10,000) compared to whites (5.7 per 10,000) in 2011.
• Menominee County (19.3) and Milwaukee County (18.2) experienced the highest county-specific rates of asthma hospitalizations per 10,000 population in Wisconsin from 2009-2011.
• If the minority populations had experienced asthma hospitalization at the same rate as non-Hispanic whites in 2011, there would have been 1,095 fewer asthma hospitalizations that year, resulting in a savings of approximately $13 million.
• Although population-based rates of asthma hospitalizations have decreased between 2005 and 2011, rates among persons with asthma (risk-based rates) have remained steady during this time.
• Hospitalizations and ED visits in which asthma was identified as the primary diagnosis vary seasonally, with the highest number of visits occurring in the fall.
• Over 10 percent of the people who were hospitalized for asthma had an additional asthma hospitalization within the same year.
Key Findings
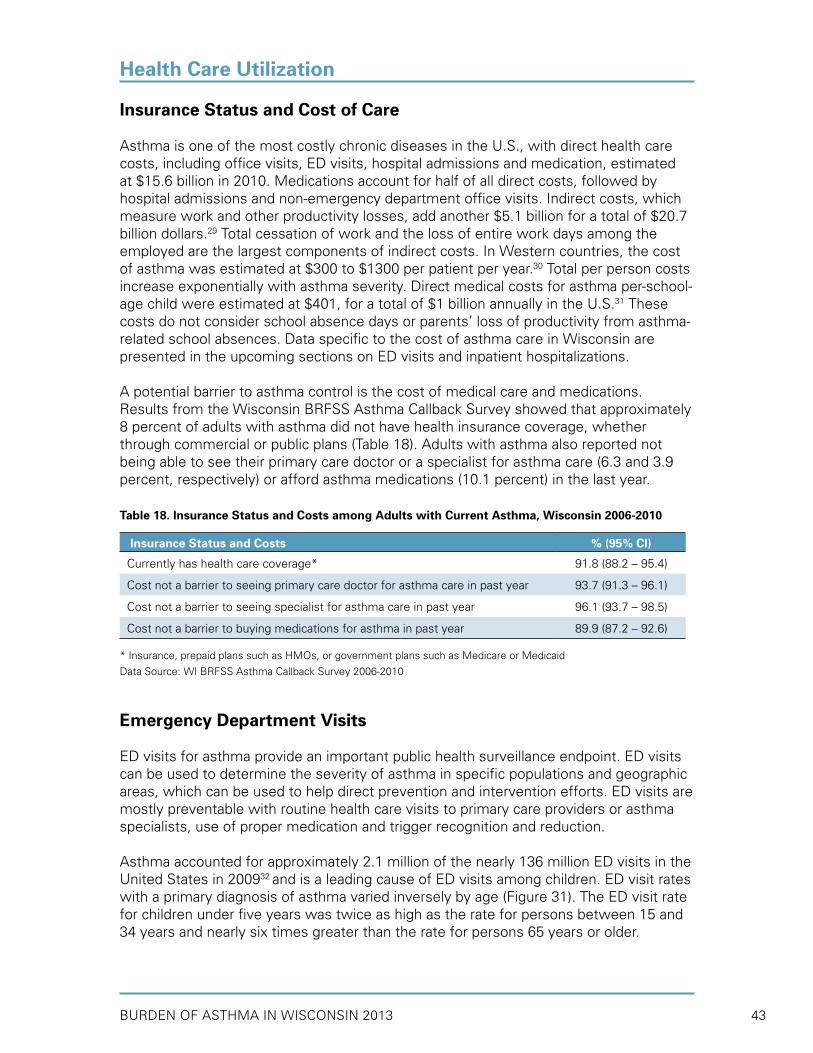
BURDEN OF ASTHMA IN WISCONSIN 2013 43
Insurance Status and Cost of Care
Asthma is one of the most costly chronic diseases in the U.S., with direct health care costs, including office visits, ED visits, hospital admissions and medication, estimated at $15.6 billion in 2010. Medications account for half of all direct costs, followed by hospital admissions and non-emergency department office visits. Indirect costs, which measure work and other productivity losses, add another $5.1 billion for a total of $20.7 billion dollars.29 Total cessation of work and the loss of entire work days among the employed are the largest components of indirect costs. In Western countries, the cost of asthma was estimated at $300 to $1300 per patient per year.30 Total per person costs increase exponentially with asthma severity. Direct medical costs for asthma per-school-age child were estimated at $401, for a total of $1 billion annually in the U.S.31 These costs do not consider school absence days or parents’ loss of productivity from asthma-related school absences. Data specific to the cost of asthma care in Wisconsin are presented in the upcoming sections on ED visits and inpatient hospitalizations.
A potential barrier to asthma control is the cost of medical care and medications. Results from the Wisconsin BRFSS Asthma Callback Survey showed that approximately 8 percent of adults with asthma did not have health insurance coverage, whether through commercial or public plans (Table 18). Adults with asthma also reported not being able to see their primary care doctor or a specialist for asthma care (6.3 and 3.9 percent, respectively) or afford asthma medications (10.1 percent) in the last year.
Table 18. Insurance Status and Costs among Adults with Current Asthma, Wisconsin 2006-2010
Insurance Status and Costs % (95% CI)
Currently has health care coverage* 91.8 (88.2 – 95.4)
Cost not a barrier to seeing primary care doctor for asthma care in past year 93.7 (91.3 – 96.1)
Cost not a barrier to seeing specialist for asthma care in past year 96.1 (93.7 – 98.5)
Cost not a barrier to buying medications for asthma in past year 89.9 (87.2 – 92.6)
* Insurance, prepaid plans such as HMOs, or government plans such as Medicare or Medicaid
Data Source: WI BRFSS Asthma Callback Survey 2006-2010
Emergency Department Visits
ED visits for asthma provide an important public health surveillance endpoint. ED visits can be used to determine the severity of asthma in specific populations and geographic areas, which can be used to help direct prevention and intervention efforts. ED visits are mostly preventable with routine health care visits to primary care providers or asthma specialists, use of proper medication and trigger recognition and reduction.
Asthma accounted for approximately 2.1 million of the nearly 136 million ED visits in the United States in 200932 and is a leading cause of ED visits among children. ED visit rates with a primary diagnosis of asthma varied inversely by age (Figure 31). The ED visit rate for children under five years was twice as high as the rate for persons between 15 and 34 years and nearly six times greater than the rate for persons 65 years or older.
Health Care Utilization

BURDEN OF ASTHMA IN WISCONSIN 201344
Figure 31. Emergency Department Visit Rates for Primary Diagnosis of Asthma by Age Group, U.S. 2009
Data Source: CDC/NCHS, National Hospital Ambulatory Medical Care Survey: 2009
All of Wisconsin’s acute care, non-federal hospitals are required to report hospital ED visits to the state according to Chapter 153, Wisconsin Statutes. Though these data are collected for billing purposes, they contain valuable surveillance information such as demographics, diagnosis, cost and payer. The data compile the number of ED visits and not the number of unique individuals who visited the ED. Thus, some of these events include individuals with multiple visits. The Wisconsin ED visit file does not include ED visits which result in inpatient hospitalizations, since these data are reported in the inpatient hospitalization file. The asthma ED visit data pertain only to patients who were treated in the ED and released or who died in the ED.
Asthma ED visit rates were based on individuals residing in Wisconsin who were seen at a Wisconsin or Minnesota hospital with a diagnosis of asthma based on ICD-9CM codes 493.00 – 493.92 (rates presented in the previous burden report33 did not include data from Minnesota hospitals). Individuals residing in another state who were seen at a Wisconsin hospital for asthma were excluded, as were Wisconsin residents receiving care in out-of-state hospitals (with the exception of Minnesota). As a result, ED visit rates for Wisconsin counties bordering Michigan, Illinois and Iowa may be slightly underestimated. Hospitals are not required to provide data on race and ethnicity in ED records; therefore, rates for racial and ethnic groups were not calculated.
Population-Based ED Visit Rates
Since Wisconsin began surveillance for ED visits in 2002, asthma-related ED visit rates have significantly decreased to a low of 36.0 visits per 10,000 individuals in 2011 (Figure 32). Wisconsin’s asthma ED visit rates have been substantially lower than national rates in all years for which data were available. Approximately half of this difference in rates (Wisconsin vs. national) is due to the fact that U.S. ED rates include visits that are subsequently admitted to the hospital, while Wisconsin’s rates exclude them.
Health Care Utilization
123.0
200
150
100
50
0
Rat
e pe
r 10
,000
0-4 5-14 15-34 35-64 65+ Overall
Age Group (years)
69.7
22.8
131.5
64.956.5

BURDEN OF ASTHMA IN WISCONSIN 2013 45
Figure 32. Asthma* Emergency Department Visit Rates§ per 10,000, Wisconsin (2002-2011) and U.S.†
(2002-2010)
*Asthma listed as the principal diagnosis (ICD-9-CM 493.00 – 493.92)§Age-adjusted to the year 2000 U.S. standard population†U.S. rates include ED visits that are subsequently admitted to the hospital; U.S. rates would be 12-15% lower if these ED visits were excluded
Data Source: 2002-2011 WI Emergency department visit discharge file; CDC/NCHS, National Hospital Ambulatory Medical Care Survey: 2002-2010
By age group, Wisconsin children aged 0-4 years had the highest asthma ED visit rate at 74.2 visits per 10,000 in 2011 (Figure 33). Asthma ED visit rates were lower among older age groups, with adults 65 years of age and older having the lowest rate (12.9 per 10,000). Younger males had significantly higher asthma ED visit rates than younger females. This trend was reversed in adulthood (i.e., adult females had higher asthma ED visit rates than adult males).
Figure 33. Asthma* Emergency Department Visit Rates per 10,000 by Age and Sex, Wisconsin 2011
*Asthma listed as the principal diagnosis (ICD-9-CM codes 493.00 – 493.92)†Age-adjusted to the year 2000 U.S. standard population
Data Source: 2011 Emergency department visit discharge file
Health Care Utilization
U.S.
Wisconsin80
60
40
20
02002 2003 2004 2005 2006 2007 2008 2009 2010 2011
Rat
e pe
r 10
,000
67.9
41.8
55.3
37.8 38.0
61.6
43.0
59.664.0
39.9 38.1
64.5
37.836.0
61.7
40.639.3
69.7
58.7
Year
96.6
74.2
56.545.5 49.0
32.8 35.940.7
19.1 14.727.5
12.910.7
120
100
80
40
0
Rat
e pe
r 10
,000
65+35-6415-345-140-4
Age Group (years)
Male Female Both
Overall†
60
20
38.736.033.234.1
50.7

BURDEN OF ASTHMA IN WISCONSIN 201346
In Wisconsin, asthma ED visits are usually highest in early spring and early fall. Factors thought to contribute to these seasonal peaks include increased numbers of respiratory infections and high pollen and/or fungal counts. Data from 2010 and 2011 showed a spike in ED visits for asthma in fall (Figure 34).
Figure 34. Average Daily Asthma* Emergency Department Visits by Month of Visit, Wisconsin 2010-2011
*Asthma listed as the principal diagnosis (ICD-9-CM 493.00 – 493.92)
Data Source: 2010-2011 Emergency department visit discharge file
Health Care Utilization
Month
4946
52 50595854 5754 57
51 4646 448 9
4549
73
57
83
59
69
47
66
51
100
80
60
20
0
2010 2011
Ave
rage
Dai
ly H
ospi
taliz
atio
ns
Jan Feb Mar Apr May Jun Jul Aug Sep Oct Nov Dec
40

BURDEN OF ASTHMA IN WISCONSIN 2013 47
Asthma ED Visit Charges
In 2011, there were 19,548 ED visits among Wisconsin residents for which asthma was the principal diagnosis (Table 19). Wisconsin females had approximately 1,500 more visits than males. The average cost of an asthma ED visit in 2011 was $1,254. The cumulative cost for asthma-related ED visits in Wisconsin in 2011 was $24.5 million. Government programs paid for over 50 percent of all ED visits (see primary payer groups in Table 19). The annual (2002-2011) number of asthma ED visits among Wisconsin residents by age group and sex can be found in Appendix B (Table 1).
Table 19. Number of Asthma* Emergency Department (ED) Visits, Average Charge per Asthma ED Visit, and Total Asthma ED Visit Charges by Sex, Age and Primary Payer Group, Wisconsin 2011
Sex, Age, Primary Payer Group ED Visits
(#)
Average Charge
per Visit ($)
Total ED Visit
Charges ($)
SexMale 9,007 1,152 10,376,460Female 10,541 1,342 14,142,551Age (years)0-4 2,631 769 2,023,9065-14 3,374 806 2,720,49715-34 6,178 1,185 7,318,394
35-64 6,339 1,630 10,330,219
65+ 1,026 2,072 2,125,995Primary Payer GroupPrivate/self-pay 8,285 1,205 9,984,925Medicare 2,302 1,847 4,252,244Medicaid/BadgerCare Plus 8,564 1,146 9,817,118Other Government Programs 214 1,281 274,206
Other/Unknown 180 1,033 185,910
Overall Wisconsin Population 19,548 1,254 24,519,011
*Asthma listed as the principal diagnosis (ICD-9-CM 493.00 – 493.92)
Data Source: 2011 Emergency department visit discharge file
Asthma ED Visit Rates by County
Age-adjusted asthma ED visit rates from 2009-2011 indicated that Menominee and Milwaukee Counties had the highest rates in the state, at 98.3 and 80.0 per 10,000 population, respectively. The overall state rate during the same time period was 37.8 per 10,000 population. Age-adjusted asthma ED visit rates for all Wisconsin counties and their rankings can be found in Appendix C. County-level asthma ED visit rates from 2009-2011 and quartile distributions are displayed in Figure 35.
Health Care Utilization

BURDEN OF ASTHMA IN WISCONSIN 201348
Figure 35. Asthma* Emergency Department Visit Rates§ per 10,000 by Wisconsin County†, 2009-2011
Overall State Rate: 37.8 per 10,000 Population
* Asthma listed as the principal diagnosis (ICD-9-CM codes 493.00 – 493.92)§ Age-adjusted to the year 2000 U.S. standard population† Events in which WI residents received emergency medical care in out-of-state facilities, with the exception of MN hospitals, were not included in these data. As a result, rates for WI counties bordering MI, IL and IA are likely underestimated.** Rates based on less than 5 visits are suppressed
Data Source: 2009-2011 Emergency department visit discharge file
Health Care Utilization
Quartiles (Range)
1 (23.16 and under)
2 (23.17 - 28.47)
3 (28.48 - 37.49)
4 (37.50 and above)

BURDEN OF ASTHMA IN WISCONSIN 2013 49
Risk-Based ED Visit Rates
Risk-based rates are provided to complement the population-based rates provided earlier in this section. The population at risk for adverse asthma outcomes such as ED visits, hospitalizations and death is persons who have asthma. Therefore, risk-based rates for asthma emergency department visits represent the number of asthma-related visits for individuals with current asthma, rather than for the general population. When the number of persons with current asthma in Wisconsin for each year is taken into account, rates of asthma ED visits show a slight (but not significant) decline between 2005 and 2011 (Figure 36), despite the significant decrease in population-based ED visit rates. The risk-based ED visit rates among all persons with asthma, as well as among the subgroups of adults and children with asthma, show this decline, suggesting that there may be a slight improvement in asthma management among individuals with asthma.
Figure 36. Estimated Rates§ of Asthma* ED Visits per 100 Persons with Asthma, Wisconsin 2005-2011
§Crude (unadjusted) risk-based rates per 100 persons with current asthma*Asthma listed as the principal diagnosis (ICD-9-CM 493.00 – 493.92)
Data Source: 2005-2011 Emergency department visit discharge file; WI BRFSS 2005-2011
Inpatient Hospitalizations
With proper medication, symptom management and avoidance of triggers, most hospitalizations from asthma can be prevented. Similar to ED visits for asthma, hospitalizations are an important surveillance endpoint because they help identify populations in most need of asthma management and preventive care. Examination of hospitalization rates also provide a useful estimate of the direct medical costs associated with poorly-managed asthma.
Health Care Utilization
Year
9
8
7
6
5
4
3
2
1
02005 2006 2007 2008 2009 2010 2011
Rat
e pe
r 10
0 pe
rson
s w
ith c
urre
nt a
sthm
a
Children (0-17)Adults (18+)Total (all ages)
chan
ge in
sur
vey
met
hods

BURDEN OF ASTHMA IN WISCONSIN 201350
An estimated 479,300 U.S. residents were hospitalized for asthma in 2009 (15.4 per 10,000 population), according to data from the National Hospital Discharge Survey.32 The highest rate of asthma hospitalizations occurred among children aged 0-4 years (40.6 per 10,000 population). The average length of stay for an asthma hospitalization was 4.3 days.34 The 2010 cost estimate for hospitalizations due to asthma in the U.S. was $5.5 billion.29 The use of clinic-based education as well as in-home education and environmental interventions could reduce costs and improve patients’ health and quality of life.35
All of Wisconsin’s acute care, non-federal hospitals are required to report hospital discharges to the state according to Chapter 153, Wisconsin Statutes. Though these data are collected for billing purposes, they contain valuable surveillance information such as demographics, diagnosis, cost and payer. The data are based on the number of hospital discharges or “events” and not the number of unique individuals who were hospitalized. Thus, some of these events may include individuals with repeat admissions. Confidential elements in the hospitalization data allowed for the identification of repeat hospitalization events for individuals within the same calendar year. These data are discussed below in the section, “Repeat Hospitalization Events.”
Hospitalization data are based on individuals residing in Wisconsin who were seen at a Wisconsin or Minnesota hospital with a diagnosis of asthma based on ICD-9CM codes 493.00 – 493.92 (rates presented in the previous burden report33 did not include data from Minnesota hospitals). Individuals residing in another state who were seen at a Wisconsin hospital for asthma were excluded, as were Wisconsin residents receiving care in out-of-state hospitals (with the exception of Minnesota). As a result, hospitalization rates for Wisconsin counties bordering Michigan, Illinois and Iowa may be slightly underestimated.
Two types of diagnosis codes are available from hospital discharge records: principal diagnosis and underlying diagnosis. Principal diagnosis refers to the primary reason for which the patient was hospitalized. In addition, notations may be included for up to eight underlying diagnoses, which refer to related conditions that may have contributed to the patient’s hospitalization. All rates presented in this section are based on asthma as the principal diagnosis, unless noted otherwise.
Population-Based Hospitalization Rates
Between 1995 and 2011, the age-adjusted hospitalization rates for which asthma was the principal diagnosis have gradually decreased to 8.1 per 10,000 population in 2011 (Figure 37). Age adjustment using the 2000 U.S. population was used to control for differences in the age distribution of the population over time, allowing for a direct comparison of rates. Asthma hospitalization rates from 2000-2011 in Wisconsin remain well below national rates (Figure 38).
Health Care Utilization

BURDEN OF ASTHMA IN WISCONSIN 2013 51
Health Care Utilization
Figure 37. Asthma* Hospitalization Rates§ per 10,000, Wisconsin 1995-2011
*Asthma listed as the principal diagnosis (ICD-9-CM 493.00 – 493.92)§Age-adjusted to the year 2000 U.S. standard population
Data Source: 1995-2011 Inpatient hospitalization discharge file
Figure 38. Asthma* Hospitalization Rates§ per 10,000, Wisconsin (2000-2011) and U.S. (2000-2010)
*Asthma listed as the principal diagnosis (ICD-9-CM 493.00 – 493.92)§Age-adjusted to the year 2000 U.S. standard population
Data Source: 2000-2011 WI Inpatient hospitalization discharge file; CDC/NCHS, National Hospital Discharge Survey: 2002-2010
Hospitalization rates for which asthma was the principal diagnosis have decreased over time. However, rates based on asthma as an underlying diagnosis have not shown a significant change between 2004 and 2011 (Figure 39) and may be due to an increase in asthma prevalence, changes in billing or coding, or other factors. Pneumonia was the most common principal diagnosis when asthma was an underlying cause in 2011. In January 2009, the adult vaccination immunization schedule was revised to include the recommendation that all adults with asthma between the ages of 18 and 65 should receive the pneumococcal vaccine.36
14
12
10
8
6
4
2
0
Rat
e pe
r 10
,000
Year
12.2 12.0
10.8
9.5
12.0
9.1
10.210.2
8.9 8.6
11.2
8.1
10.210.8
9.4 9.7 9.9
95 96 97 98 99 00 01 02 03 04 05 06 07 08 09 10 11
25
20
15
10
5
0
Rat
e pe
r 10
,000
Year
2000 2001 2002 2003 2004 2005 2006 2007 2008 2009 2010 2011
10.210.8 11.29.9
8.9
16.5 15.4
9.7
16.1
9.1 9.4
17.0
14.7 14.1
16.7
19.8
15.1
8.1
10.2
17.0
14.4
9.5 8.6
U.S.
Wisconsin

BURDEN OF ASTHMA IN WISCONSIN 201352
Figure 39. Asthma* Hospitalization Rates§ per 10,000 by Principal and Underlying Diagnosis, Wisconsin 2004-2011
*Asthma diagnosis based on ICD-9-CM 493.00 – 493.92§Age-adjusted to the year 2000 U.S. standard population
Data Source: 2004-2011 Inpatient hospitalization discharge file
By age in the U.S., children aged 0-4 years have exhibited the highest rates of asthma hospitalizations.37 In Wisconsin, asthma hospitalizations among children aged 0-4 years have declined over the past decade (Appendix B, Table 2); however, children in the youngest age group still had the highest asthma hospitalization rate (19.6 per 10,000) compared to persons in other age groups in 2011 (Figure 40). The rate of asthma hospitalizations was lowest among persons aged 15-34 years (2.9 per 10,000) and was higher for older age groups. By sex, younger males had significantly higher asthma hospitalization rates than younger females. This trend was reversed in adulthood (i.e., adult females had higher asthma hospitalization rates than adult males in all age groups).
Figure 40. Asthma* Hospitalization Rates per 10,000 by Age and Sex, Wisconsin 2011
*Asthma listed as the principal diagnosis (ICD-9-CM 493.00 – 493.92)†Age-adjusted to the year 2000 U.S. standard population
Data Source: 2011 Inpatient hospitalization discharge file
Health Care Utilization
80
70
60
50
40
30
20
10
02004 2005 2006 2007 2008 2009 2010 2011
Rat
e pe
r 10
,000
Year
62.459.6
66.2 67.064.0
9.5
66.1
10.2
65.6
9.1 8.99.98.1
67.1
9.4 8.6
Underlying
Principal
Rat
e pe
r 10
,000
25.8
4.8
30
25
20
10
0-4 5-14 15-34 35-64 65+ Overall†
15 13.2 12.3
19.6
8.59.4 10.2
5.4
16.5
7.4
13.8
1.8
6.8
4.0
9.5
2.9
8.1
Male Female Both
0
5
Age Group (years)
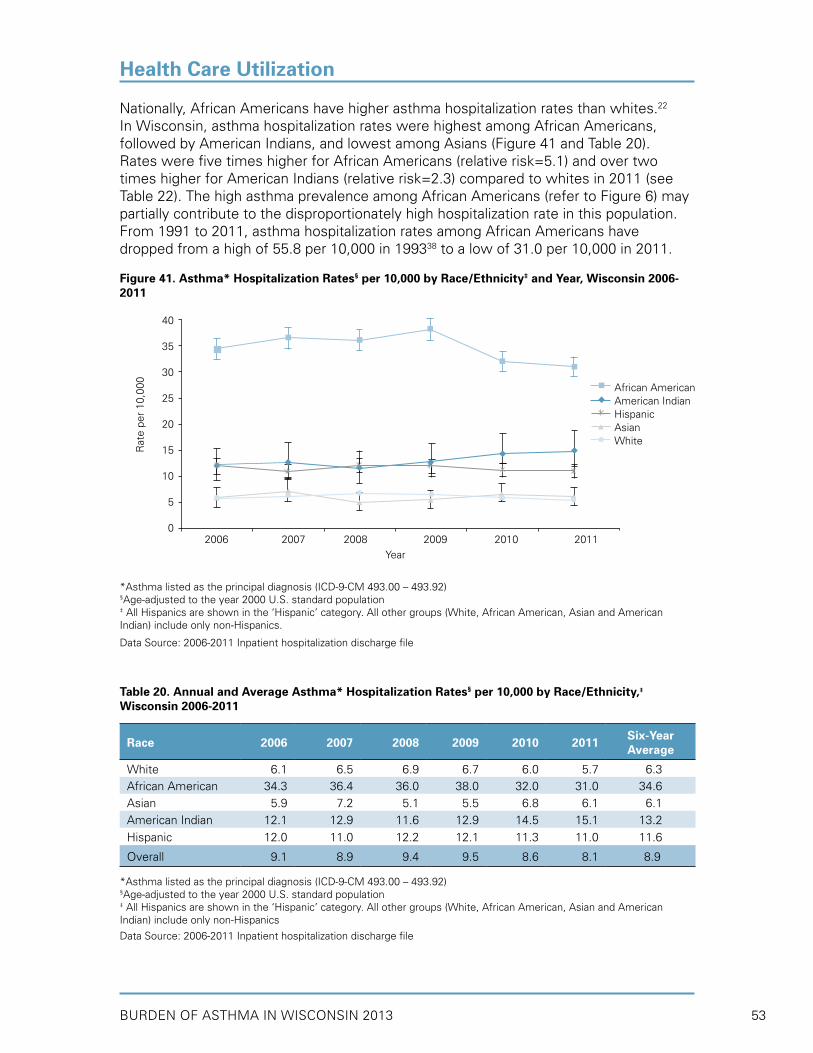
BURDEN OF ASTHMA IN WISCONSIN 2013 53
Nationally, African Americans have higher asthma hospitalization rates than whites.22 In Wisconsin, asthma hospitalization rates were highest among African Americans, followed by American Indians, and lowest among Asians (Figure 41 and Table 20). Rates were five times higher for African Americans (relative risk=5.1) and over two times higher for American Indians (relative risk=2.3) compared to whites in 2011 (see Table 22). The high asthma prevalence among African Americans (refer to Figure 6) may partially contribute to the disproportionately high hospitalization rate in this population. From 1991 to 2011, asthma hospitalization rates among African Americans have dropped from a high of 55.8 per 10,000 in 199338 to a low of 31.0 per 10,000 in 2011.
Figure 41. Asthma* Hospitalization Rates§ per 10,000 by Race/Ethnicity‡ and Year, Wisconsin 2006-2011
*Asthma listed as the principal diagnosis (ICD-9-CM 493.00 – 493.92)§Age-adjusted to the year 2000 U.S. standard population‡ All Hispanics are shown in the ‘Hispanic’ category. All other groups (White, African American, Asian and American Indian) include only non-Hispanics.
Data Source: 2006-2011 Inpatient hospitalization discharge file
Table 20. Annual and Average Asthma* Hospitalization Rates§ per 10,000 by Race/Ethnicity,‡ Wisconsin 2006-2011
Race 2006 2007 2008 2009 2010 2011 Six-Year Average
White 6.1 6.5 6.9 6.7 6.0 5.7 6.3African American 34.3 36.4 36.0 38.0 32.0 31.0 34.6Asian 5.9 7.2 5.1 5.5 6.8 6.1 6.1American Indian 12.1 12.9 11.6 12.9 14.5 15.1 13.2Hispanic 12.0 11.0 12.2 12.1 11.3 11.0 11.6
Overall 9.1 8.9 9.4 9.5 8.6 8.1 8.9
*Asthma listed as the principal diagnosis (ICD-9-CM 493.00 – 493.92)§Age-adjusted to the year 2000 U.S. standard population‡ All Hispanics are shown in the ‘Hispanic’ category. All other groups (White, African American, Asian and American Indian) include only non-Hispanics
Data Source: 2006-2011 Inpatient hospitalization discharge file
Health Care Utilization
40
35
30
25
20
15
10
5
02006 2007 2008 2009 2010 2011
Rat
e pe
r 10
,000
Year
African AmericanAmerican IndianHispanicAsianWhite

BURDEN OF ASTHMA IN WISCONSIN 201354
Asthma hospital admissions, similar to asthma ED visits, were lowest in summer and highest in early fall (Figure 42). Factors contributing to this seasonal peak include increased numbers of respiratory infections and high pollen and/or fungal counts.
Figure 42. Average Daily Asthma* Hospitalizations by Month of Admission, Wisconsin 2010-2011
*Asthma listed as the principal diagnosis (ICD-9-CM 493.00 – 493.92)
Data Source: 2010-2011 Inpatient hospitalization discharge file
Health Care Utilization
15 1416
1412
15 15 151513
1211
8 9 910
15 1517
1316
1214
11
25
20
15
5
0
2010 2011
Ave
rage
Dai
ly H
ospi
taliz
atio
ns
Jan Feb Mar Apr May Jun Jul Aug Sep Oct Nov Dec
Month
10

BURDEN OF ASTHMA IN WISCONSIN 2013 55
Asthma Hospitalization Charges and Primary Payer
In 2011 there were a total of 4,746 hospitalizations in Wisconsin for which asthma was the principal diagnosis (Table 21). Estimates of average length of stay, average billed charge per hospitalization and total billed charges were calculated by gender, race/ethnicity and age group. Hospitalizations due to asthma occurred more frequently among females and required a longer average stay than among males. Because of the increased number of female hospitalizations for asthma and longer length of stay, total hospital charges for asthma are almost twice as high for females compared to males. Over the last 21 years, the average length of stay for an asthma hospitalization in Wisconsin has decreased from 3.8 days in 199033 to 2.9 days in 2011.
Table 21. Number of Asthma* Hospitalizations, Average Length of Stay (LOS), Average Charge per Asthma Hospitalization and Total Asthma Hospitalization Charges by Sex, Race/Ethnicity‡ and Age, Wisconsin 2011
Hospitalizations (#)
Average LOS (days)
Average Charge per Hospitalization ($)
Total Hospitalization
Charges ($)SexMale 1,875 2.4 11,472 21,510,482Female 2,871 3.2 14,508 41,652,238Race/EthnicityWhite 2,919 3.2 14,088 41,121,508African American 1,131 2.3 11,850 13,401,965American Indian 78 2.9 12,521 976,625Asian 56 2.9 13,231 740,920Other 54 2.5 9,606 518,729Hispanic 299 2.4 12,126 3,625,645Age (years)0-4 695 1.7 6,816 4,736,7415-14 551 1.8 8,118 4,473,17215-34 439 2.4 11,130 4,886,07435-64 1,970 3.2 15,135 29,816,76065+ 1,091 4.0 17,644 19,249,973
Overall Wisconsin Population
4,746 2.9 13,309 63,162,720
*Asthma listed as the principal diagnosis (ICD-9-CM 493.00 – 493.92)‡ All Hispanics are shown in the ‘Hispanic’ category. All other groups (White, African American, Asian, American Indian and Other) include only non-Hispanics.
Data Source: 2011 Inpatient hospitalization discharge file
The total direct cost associated with hospitalizations in 2011 for which asthma was the principal diagnosis was approximately $63 million. The most frequent primary payer for these charges was Medicare (Figure 43). When combined, government programs were the primary payer for over 65 percent of asthma hospitalizations. The annual (2002-2011) number of asthma hospitalizations among Wisconsin residents by age group, sex, race and ethnicity can be found in Appendix B (Table 2).
Health Care Utilization

BURDEN OF ASTHMA IN WISCONSIN 201356
Figure 43. Distribution of the Primary Payer for Asthma* Hospitalizations, Wisconsin 2011
*Asthma listed as the principal diagnosis (ICD-9-CM codes 493.00 - 493.92)†Medicaid includes BadgerCare Plus and Wisconsin Medicaid programs
Data Source: 2011 Inpatient hospitalization discharge file
Excess Asthma Hospitalizations
Hispanics and non-Hispanic minority populations including African Americans and American Indians were hospitalized with a primary diagnosis of asthma at higher rates than non-Hispanic whites (refer to Table 20). Using non-Hispanic whites as the reference population, the relative risk, number of excess asthma hospitalizations and potentially avoidable (excess) charges for the minority groups were calculated for the year 2011 (Table 22). If the minority populations had experienced asthma hospitalization at the same rate as non-Hispanic whites in 2011, there would have been 1,095 fewer asthma hospitalizations that year, resulting in a savings of approximately $13 million.
Table 22. Excess Asthma* Hospital Healthcare Charges by Race/Ethnicity‡, Wisconsin 2011
RaceRate§
(per 10,000)
Relative Riska (Minority/
White)
Excess
Eventsb
Average Charges ($)
Potentially-Avoidable, Excess
Chargesc ($)
White 5.7 1.0 0 14,088 -
African American 31.0 5.1 909 11,850 10,771,650
American Indian 15.1 2.3 44 12,521 550,924
Hispanic 11.0 1.9 142 12,126 1,721,892
*Asthma listed as the principal diagnosis (ICD-9-CM 493.00 – 493.92)‡ All Hispanics are shown in the ‘Hispanic’ category. All other groups (White, African American and American Indian) include only non-Hispanics.§Age-adjusted to the year 2000 U.S. standard populationaRelative Risk is estimated to be the ratio of the minority group to the White groupbExcess Events are the hospitalizations that would not have occurred if the rate for the minority group was the same as the rate for the White group.cPotentially-Avoidable, Excess Charges are the result of multiplying excess events by the average charges
Data Source: 2011 Inpatient hospitalization discharge file
Health Care Utilization
CommercialInsurance
26.9%
Self-Pay6.5%
Unknown.4%
Medicaid†
31.0%
Medicare34.4%
OtherGovernment
Programs.8%

BURDEN OF ASTHMA IN WISCONSIN 2013 57
Asthma Hospitalization Rates by County
In Wisconsin, the overall asthma hospitalization rate from 2009-2011 was 8.7 per 10,000 population, significantly lower than the rate from 2007-2009 of 9.1 per 10,000 population.33 Figure 44 shows each county’s age-adjusted asthma hospitalization rate from 2009-2011 and its quartile distribution. Similar to the asthma ED visit rates, Menominee County (19.3 per 10,000) and Milwaukee County (18.2 per 10,000) also experienced the highest county-specific asthma hospitalization rates in Wisconsin during this time. Seven counties (Kenosha, Lincoln, Menominee, Milwaukee, Racine, Rock and Sawyer) have both asthma ED visit and asthma hospitalization rates that fall in the highest quartile of all counties in the state. Age-adjusted asthma hospitalization rates for all Wisconsin counties and their rankings are provided in Appendix C.
Figure 44. Asthma* Hospitalization Rates§ per 10,000 by Wisconsin County†, 2009-2011
* Asthma listed as the principal diagnosis (ICD-9-CM codes 493.00 – 493.92)§ Age-adjusted to the year 2000 U.S. standard population† Events in which WI residents received medical care in out-of-state facilities, with the exception of MN hospitals, were not included in these data. As a result, rates for WI counties bordering MI, IL and IA are likely underestimated.** Rates based on less than 5 visits are suppressed
Data Source: 2009-2011 Inpatient hospitalization discharge file
Health Care Utilization
Quartiles (Range)
1 (4.82 and under)
2 (4.83 - 6.48)
3 (6.49 - 7.99)
4 (8.00 and above)
Overall State Rate: 8.7 per 10,000 Population

BURDEN OF ASTHMA IN WISCONSIN 201358
Risk-Based Hospitalization Rates
Risk-based rates are provided to complement the population-based rates provided earlier in this section. The population at risk for adverse asthma outcomes such as ED visits, hospitalizations and death is persons who have asthma. Therefore, risk-based rates for asthma hospitalizations represent the number of asthma-related hospitalizations for individuals with current asthma, rather than for the general population.
When the number of persons with current asthma in Wisconsin for each year is taken into account, rates of asthma hospitalizations show a slight (but not significant) decline since 2005 (Figure 45), despite the significant decrease in population-based hospitalization rates. The risk-based hospitalization rates among all persons with asthma, as well as among the subgroups of adults and children with asthma, show this decline, suggesting that there may be a slight improvement in asthma management among individuals with asthma.
Figure 45. Estimated Rates§ of Asthma* Hospitalizations per 100 Persons with Asthma, Wisconsin 2005-2011
§Crude (unadjusted) risk-based rates per 100 persons with current asthma*Asthma listed as the principal diagnosis (ICD-9-CM 493.00 – 493.92)
Data Source: 2005-2011 Hospitalization discharge file; WI BRFSS 2005-2011
Health Care Utilization
Year
2.0
1.8
1.6
1.4
1.2
1.0
0.8
0.6
0.4
0.2
0.02005 2006 2007 2008 2009 2010 2011
Rat
e pe
r 10
0 pe
rson
s w
ith c
urre
nt a
sthm
a
Children (0-17)
Adults (18+)
Total (all ages)
chan
ge in
sur
vey
met
hods
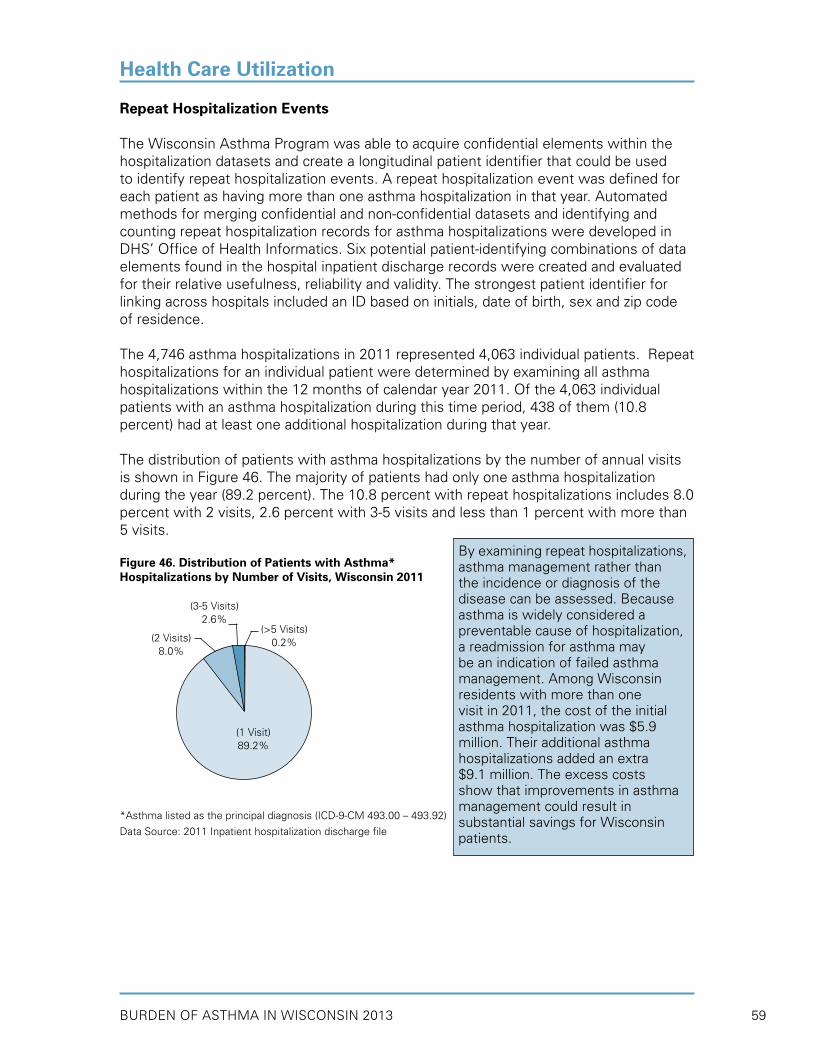
BURDEN OF ASTHMA IN WISCONSIN 2013 59
Repeat Hospitalization Events
The Wisconsin Asthma Program was able to acquire confidential elements within the hospitalization datasets and create a longitudinal patient identifier that could be used to identify repeat hospitalization events. A repeat hospitalization event was defined for each patient as having more than one asthma hospitalization in that year. Automated methods for merging confidential and non-confidential datasets and identifying and counting repeat hospitalization records for asthma hospitalizations were developed in DHS’ Office of Health Informatics. Six potential patient-identifying combinations of data elements found in the hospital inpatient discharge records were created and evaluated for their relative usefulness, reliability and validity. The strongest patient identifier for linking across hospitals included an ID based on initials, date of birth, sex and zip code of residence.
The 4,746 asthma hospitalizations in 2011 represented 4,063 individual patients. Repeat hospitalizations for an individual patient were determined by examining all asthma hospitalizations within the 12 months of calendar year 2011. Of the 4,063 individual patients with an asthma hospitalization during this time period, 438 of them (10.8 percent) had at least one additional hospitalization during that year.
The distribution of patients with asthma hospitalizations by the number of annual visits is shown in Figure 46. The majority of patients had only one asthma hospitalization during the year (89.2 percent). The 10.8 percent with repeat hospitalizations includes 8.0 percent with 2 visits, 2.6 percent with 3-5 visits and less than 1 percent with more than 5 visits.
Figure 46. Distribution of Patients with Asthma* Hospitalizations by Number of Visits, Wisconsin 2011
*Asthma listed as the principal diagnosis (ICD-9-CM 493.00 – 493.92)
Data Source: 2011 Inpatient hospitalization discharge file
Health Care Utilization
(1 Visit)89.2%
(2 Visits)8.0%
(3-5 Visits)2.6%
(>5 Visits)0.2%
By examining repeat hospitalizations, asthma management rather than the incidence or diagnosis of the disease can be assessed. Because asthma is widely considered a preventable cause of hospitalization, a readmission for asthma may be an indication of failed asthma management. Among Wisconsin residents with more than one visit in 2011, the cost of the initial asthma hospitalization was $5.9 million. Their additional asthma hospitalizations added an extra $9.1 million. The excess costs show that improvements in asthma management could result in substantial savings for Wisconsin patients.

BURDEN OF ASTHMA IN WISCONSIN 201360
The distribution of patients with a single asthma hospitalization (89.2 percent) versus patients with repeat hospitalizations (10.8 percent) was examined by sex, age at initial visit, and race (Figure 47). Females were almost twice as likely as males to have repeat asthma hospitalizations (65.5 versus 34.5 percent). A greater proportion of persons aged 35 to 64 years had repeat asthma hospitalizations, compared to other age groups. The proportion of patients with repeat to single asthma hospitalizations was greatest among African American and other racial groups, compared to whites.
Figure 47. Distribution of Patients with Single versus Repeat Asthma* Hospitalizations by Sex, Age Group and Race, Wisconsin 2011
Health Care Utilization
One visit (n=3,625) More than one visit (n=438)
34.5
59.0
15.5 13.06.8
41.0
12.6
65.5
37.6
9.0
24.9
9.6
52.7
18.3
10.5
23.1
69.6
80
60
40
0
Per
cent
(%)
Male Female 0-4 5-14 15-34 35-64 65+ White African Other
20
29.2
60.3
7.3
Sex Age Group Race

BURDEN OF ASTHMA IN WISCONSIN 2013 61
ASTHMA IN GOVERNMENT-FUNDED PROGRAMS
This chapter presents data on the asthma prevalence and health care utilization in two government-funded programs, the Wisconsin Medicaid Program and Wisconsin Women, Infants, and Children (WIC) Program.
Wisconsin Medicaid Program• Over the three year period 2009-2011, the number of Medicaid recipients increased.
However, prevalence of persistent asthma remained steady (approximately 3.7 percent), and less severe asthma (“universal” asthma) decreased slightly, from 7.6 percent in 2009 to 7.3 percent in 2011.
• The rate of asthma outpatient visits among Wisconsin Medicaid recipients decreased from 770 to 756 visits per 10,000 between 2009 and 2011. Medicaid recipients with outpatient visits for asthma averaged approximately three visits during each measurement year.
• Between 2007 and 2011, rates of asthma ED visits in the Medicaid population showed a general decline, from 130.2 to 111.3 visits per 10,000 Medicaid enrollees. The rate of asthma ED visits was highest for children under 5 years of age.
• The rate of asthma hospitalizations in the Medicaid population declined from 39.8 to 32.4 visits per 10,000 Medicaid enrollees between 2007 and 2011.
• Similar to the trend observed with asthma ED visits, African Americans had the highest rates of asthma hospitalizations, while Asians had the lowest rates.
• Rates of asthma ED visits and hospitalizations in the Medicaid population were three times greater than the rates in Wisconsin’s general population during the same time period.
• Approximately 85 percent of Wisconsin Medicaid recipients aged 5 to 50 years old with persistent asthma filled prescriptions for appropriate long-term control medication between 2009 and 2011.
• In 2011, 84.5 percent of persistent asthmatics received at least one long-term control medication, and 71.7 percent received an inhaled corticosteroid (ICS) medication.
• One-quarter (25.1 percent) of persistent asthmatics received 7 or more prescriptions for a short-acting beta 2-agonist (SABA) medication in 2011, which is an indicator of overuse of this medication.
• According to the Wisconsin Immunization Registry, approximately 88 percent of Medicaid enrollees with persistent asthma received a flu vaccination between 2009 and 2011.
Wisconsin Women, Infants and Children (WIC) Program• In 2012, the prevalence of asthma among all women in the WIC program was 2.1
percent and was similar between pregnant and postpartum women (2.3 vs. 2.0 percent, respectively).
• Prevalence of asthma was highest in women 35 years of age and older. By race, African Americans had higher asthma prevalence than whites (2.8 vs. 2.1 percent).
• Factors associated with asthma including smoking tobacco, environmental tobacco smoke (ETS), obesity and depression were associated with higher asthma prevalence in both pregnant and postpartum women. Women with depression had an asthma prevalence that was three times greater than women without depression (5.2 vs. 1.9 percent, respectively).
• In 2012, the prevalence of asthma among children under 5 years in the WIC program was 2.4 percent; African American children had an asthma prevalence that was three times higher than that of white children (5.2 vs. 1.7 percent).
• Exposure to ETS was associated with slightly higher asthma prevalence in children, compared to children without the exposure (2.8 vs. 2.4 percent).
• Being overweight at 24 months of age or older was associated with higher asthma prevalence than children who were not overweight (3.8 vs. 2.3 percent).
• Ever having been breastfed was associated with lower asthma prevalence, compared to the prevalence of children who were never breastfed (2.1 vs. 3.0 percent).
Key Findings

BURDEN OF ASTHMA IN WISCONSIN 201362
Asthma in Government-Funded Programs
Wisconsin Medicaid Program
Medicaid is a federal and state-sponsored program designed to provide health care and health-related services for people with disabilities, and low-income individuals including adults aged 65 years or older, children and their caretakers and pregnant women. In Wisconsin, two government-sponsored plans, Medicaid and BadgerCare Plus, provide health care for these individuals. Wisconsin Medicaid is a plan which provides health care for people who are elderly, blind or disabled.39 BadgerCare Plus replaced family Medicaid, BadgerCare and Healthy Start Programs in February 2008.40 This new health care program was designed to expand coverage to all uninsured children and more pregnant women. BadgerCare Plus provides health coverage to low-income pregnant women, adults without dependent children and uninsured families with children under the age of 19 who are not eligible for Medicare.41 For purposes of this report, these government health plans in Wisconsin will be referred to collectively as Medicaid. The Department of Health Services (DHS) oversees this program in Wisconsin. Because Medicaid pays for health-related office visits, procedures, outpatient emergency care, inpatient hospitalizations and prescriptions, detailed information for many of these services was available for analysis.
In January 2013, there were 1.1 million individuals in Wisconsin covered by Medicaid programs or about 19 percent of the state population.42 Approximately 65 percent of Medicaid program enrollees have BadgerCare Plus, 18 percent have elderly and disabilities coverage and 17 percent have some other Medicaid coverage. Over 42 percent of eligible Medicaid recipients are children ages 0-17 living in low-income families. An additional 46 percent of eligible recipients are adults between 18 and 64 years of age and approximately 12 percent are adults 65 years of age or older. There are more female Medicaid enrollees than male (60 vs. 40 percent). The majority of Wisconsin Medicaid enrollees are white (54 percent), while 18 percent are African American and 28 percent report some other race/ethnicity category. Due to the nature of the income and age requirements for Medicaid eligibility, individuals in these programs represent a population that is disproportionally affected by asthma.
This section will utilize Medicaid data to better understand asthma-related health care utilization in Wisconsin from 2009 to 2011. For this report, Medicaid data from both fee-for-service (FFS) claims and managed care encounters were analyzed. It is important to note that data from Medicaid are based on billed claims; therefore, information on unfilled prescriptions or test results is not available. The data presented in this section correspond to the total number of enrolled individuals with asthma or asthma-related health care services, rather than the total number of events. Finally, as this population represents a small specialized (younger and lower income) fraction of the Wisconsin population defined by eligibility requirements, results are not applicable to the general population of Wisconsin.

BURDEN OF ASTHMA IN WISCONSIN 2013 63
Asthma in Government-Funded Programs
Prevalence
Within the Wisconsin Medicaid population, two asthma prevalence estimates were calculated: persistent asthma prevalence and universal asthma prevalence. Definitions for persistent asthma and universal asthma are based on the technical specifications for the asthma-related standardized performance measure called Healthcare Effectiveness Data and Information Set (HEDIS), developed by the National Committee for Quality Assurance (NCQA).43,44 Annual prevalence estimates were generated for the entire Wisconsin Medicaid population and include recipients of all ages.
Asthma prevalence estimates defined by both “persistent” and “universal” asthma criteria were calculated in the Medicaid population by year (Figure 48). Over the three year period 2009-2011, the number of Medicaid recipients increased; however, the prevalence of “persistent” asthma remained steady, and the prevalence of less severe “universal” asthma decreased slightly. In 2009, a total of 7.6 percent of Medicaid recipients had asthma based on the “universal” definition, and 3.7 percent of Medicaid recipients had “persistent” asthma. In 2011, “universal” asthma prevalence had decreased slightly to 7.3 percent of Medicaid recipients, and 3.7 percent had “persistent” asthma. Prevalence estimates were similar among males and females (data not shown). These “universal” prevalence estimates, which were based on health care services received, are lower than the self-reported current asthma prevalence estimates from the Wisconsin BRFSS survey.
Persistent Asthma Prevalence
A person with persistent asthma was defined as someone who met at least one of the
following:
• At least four asthma medication filled prescriptions• At least one ED visit with a primary diagnosis of asthma• At least one hospital inpatient visit with a primary diagnosis of asthma• At least four outpatient visits with asthma listed as one of the diagnoses AND at
least two asthma medication filled prescriptions
Universal Asthma Prevalence
Asthma prevalence was also estimated using a slightly less-restrictive asthma case
definition in order to include persons with less severe asthma, such as those who may have had only one or two office visits for asthma during the year, as well as those with persistent asthma. Universal asthma prevalence was defined by persons who met at least one of the following:
• At least four asthma medication filled prescriptions• At least one ED visit with a primary diagnosis of asthma• At least one hospital inpatient visit with a primary diagnosis of asthma• At least one outpatient visit with asthma listed as the primary diagnosis
Note that the first three criteria are the same as in the persistent asthma definition

BURDEN OF ASTHMA IN WISCONSIN 201364
Asthma in Government-Funded Programs
Figure 48. Asthma* Prevalence in Wisconsin Medicaid by Year, 2009-2011
*Asthma defined by both “persistent” and “universal” asthma criteria
Data Source: 2009-2011 Medicaid Data, WI Division of Health Care Access and Accountability
Asthma prevalence in the Medicaid population defined by both “persistent” and “universal” asthma criteria was calculated by age group for aggregated years 2009-2011 (Figure 49). Adults aged 35-64 years had the highest persistent and universal prevalence (5.4 and 9.5 percent, respectively), followed by children aged 5-11. Adults aged 65 years and older had the lowest prevalence of all Medicaid recipients, although this may be explained by the more frequent Medicare coverage for health services in this age group.
Figure 49. Asthma* Prevalence in Wisconsin Medicaid by Age Group, 2009-2011
*Asthma defined by both “persistent” and “universal” asthma criteria
Data Source: 2009-2011 Medicaid Data, WI Division of Health Care Access and Accountability
2.8
7.6
4.0
8.2
7.3
3.6
6.0
2.8
9.5
5.4
3.8
7.5
10
8
6
4
0
Per
cent
(%)
<5 5-11 12-17 18-34 35-64 65+ Overall
Age Groups (years)
“persistent” asthma “universal” asthma
2
2.7
4.6
7.6
10
8
6
4
0
Per
cent
(%)
201120102009
7.5 7.3
3.7 3.8 3.7
Year
“persistent” asthma “universal” asthma
2

BURDEN OF ASTHMA IN WISCONSIN 2013 65
Asthma prevalence was calculated by racial and ethnic groups for the 2009-2011 period (Figure 50). African American Medicaid recipients had the highest persistent and universal asthma prevalence (4.4 and 9.9 percent, respectively) as compared to all other groups, while Asians had the lowest asthma prevalence. These prevalence trends mirror those seen among the general population in Wisconsin (Figure 6).
Figure 50. Asthma* Prevalence in Wisconsin Medicaid by Race/Ethnicity, 2009-2011
*Asthma defined by both “persistent” and “universal” asthma criteria
Data Source: 2009-2011 Medicaid Data, WI Division of Health Care Access and Accountability
Outpatient Visits
Outpatient visits or ambulatory care consists of health care that is provided on an outpatient basis, including services such as diagnosis, treatment and rehabilitation. The National Asthma Education and Prevention Program (NAEPP) recommends routine physician office follow-up care for asthma every one to six months, depending on the severity of an individual’s asthma.1 These appointments are necessary to monitor medication regimens, assess asthma control and review management plans. In 2010, the U.S. rate of physician office visits for asthma was 476.2 visits per 10,000 population, and the rate of hospital outpatient department visits for asthma was 45.2 visits per 10,000 population.45
In the rates shown below, both routine office visits as well as urgent care visits for asthma were considered outpatient visits. The percent of Wisconsin Medicaid recipients with an asthma outpatient visit decreased from 770.0 to 756.2 visits per 10,000 between 2009 and 2011 (Figure 51). The asthma outpatient visit rate was higher among female compared to male Medicaid recipients (787.2 vs. 728.8 per 10,000). Medicaid recipients with outpatient visits for asthma averaged approximately three visits during each measurement year. However, on average, females had a greater number of annual visits than males (4.2 vs. 2.9 visits in 2011).
Asthma in Government-Funded Programs
3.5
6.6
4.4
9.9
7.3
3.7
2.8
1.3
3.1
7.0
3.8
7.5
10
8
6
4
0
Per
cent
(%)
White African American Asian Hispanic Other Overall American Indian
“persistent” asthma “universal” asthma
2
4.3
8.6
Race/ Ethnicity

BURDEN OF ASTHMA IN WISCONSIN 201366
Figure 51. Asthma* Outpatient Visit Rates§ per 10,000 Enrollees, Wisconsin Medicaid 2009-2011
*Asthma listed as the principal diagnosis (ICD-9-CM 493.00 – 493.92)§Age-adjusted to the year 2000 U.S. standard population
Data Source: 2009-2011 Medicaid Data, WI Division of Health Care Access and Accountability
The rate of asthma outpatient visits also decreased between 2009 and 2011 within each age group (except within age group 65+ years), most prominently among children less than 5 years of age (Figure 52). The overall decrease in outpatient visits during this time period may be explained by the decrease in the asthma prevalence based on the universal definition between 2009 and 2011. By age group, adults 35-64 years had the highest rates of asthma outpatient visits, and adults over 65 years of age had the lowest rates. However, as mentioned above, older individuals are more likely to have Medicare coverage for health-related services.
Figure 52. Asthma* Outpatient Visit Rates per 10,000 Enrollees by Age Group and Year, Wisconsin Medicaid 2009-2011
*Asthma listed as the principal diagnosis (ICD-9-CM codes 493.00 – 493.92)
Data Source: 2009-2011 Medicaid Data, WI Division of Health Care Access and Accountability
Asthma in Government-Funded Programs
Year
600
400
200
02009 2010 2011
770.0 768.6 756.2R
ate
per
10,0
00800
817.1
691.1
1000
800
600
200
0
2009 2010 2011
Rat
e pe
r 10
,000
<5 5-11 12-17 18-34 35-64 65+
Age Group (years)
400
834.4
693.6
768.1
674.4
881.4933.9
866.8925.9
859.5
923.4
807.7
269.7
796.5
289.1
787.7
281.3
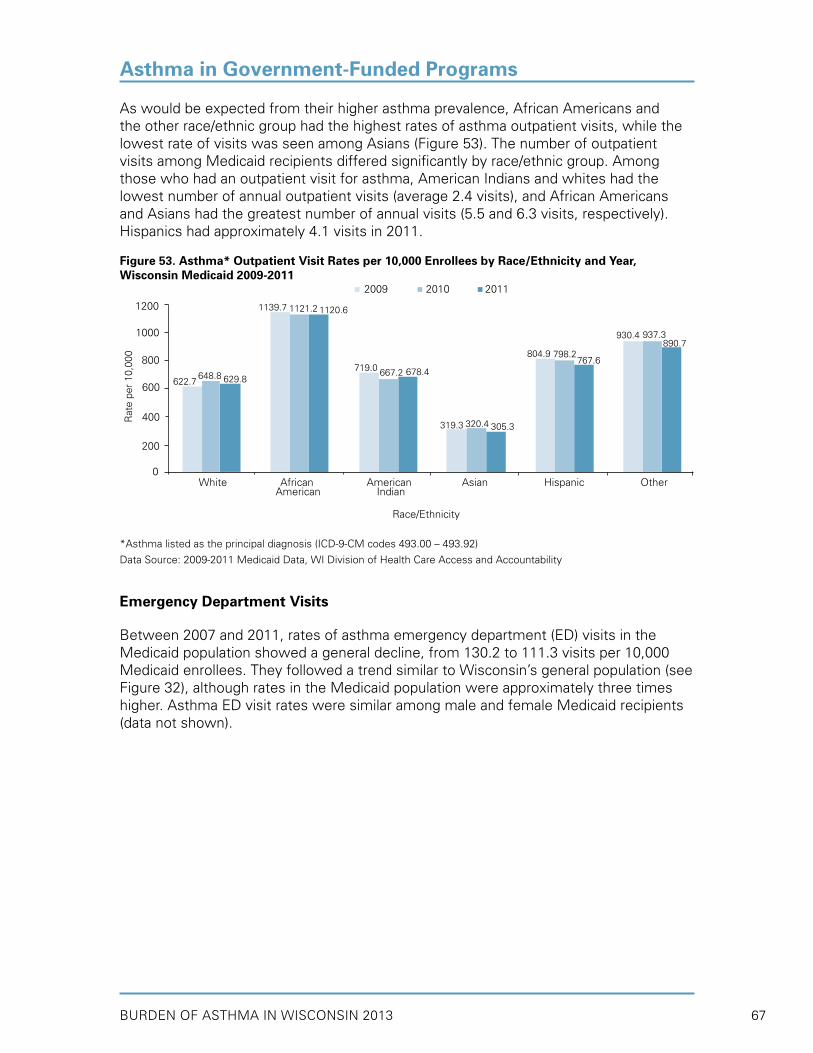
BURDEN OF ASTHMA IN WISCONSIN 2013 67
As would be expected from their higher asthma prevalence, African Americans and the other race/ethnic group had the highest rates of asthma outpatient visits, while the lowest rate of visits was seen among Asians (Figure 53). The number of outpatient visits among Medicaid recipients differed significantly by race/ethnic group. Among those who had an outpatient visit for asthma, American Indians and whites had the lowest number of annual outpatient visits (average 2.4 visits), and African Americans and Asians had the greatest number of annual visits (5.5 and 6.3 visits, respectively). Hispanics had approximately 4.1 visits in 2011.
Figure 53. Asthma* Outpatient Visit Rates per 10,000 Enrollees by Race/Ethnicity and Year, Wisconsin Medicaid 2009-2011
*Asthma listed as the principal diagnosis (ICD-9-CM codes 493.00 – 493.92)
Data Source: 2009-2011 Medicaid Data, WI Division of Health Care Access and Accountability
Emergency Department Visits
Between 2007 and 2011, rates of asthma emergency department (ED) visits in the Medicaid population showed a general decline, from 130.2 to 111.3 visits per 10,000 Medicaid enrollees. They followed a trend similar to Wisconsin’s general population (see Figure 32), although rates in the Medicaid population were approximately three times higher. Asthma ED visit rates were similar among male and female Medicaid recipients (data not shown).
Asthma in Government-Funded Programs
622.7
319.3
1200
1000
800
400
0
Rat
e pe
r 10
,000
Race/Ethnicity
600648.8
320.4
629.8
305.3
1139.7
804.9
1121.2
798.2
1120.6
767.6719.0
930.4
667.2
937.3
678.4
890.7
200
White African American Asian Hispanic Other American Indian
2009 2010 2011

BURDEN OF ASTHMA IN WISCONSIN 201368
Figure 54. Asthma* Emergency Department Visit Rates§ per 10,000 Enrollees, Wisconsin Medicaid 2007-2011
*Asthma listed as the principal diagnosis (ICD-9-CM 493.00 – 493.92)§Age-adjusted to the year 2000 U.S. standard population
Data Source: 2007-2011 Medicaid Data, WI Division of Health Care Access and Accountability; 2007-2011 Emergency department visit discharge file
Asthma ED visit rates declined from 2009 to 2011 within the majority of age groups (Figure 55). The rate of asthma ED visits for children under 5 years of age was the highest, compared to older children and adults. Similar to outpatient visits, adults aged 65 years and older had the lowest ED visit rates, which may be explained by Medicare coverage for health-related services. Individuals with ED visits for asthma had an average of 2.2 visits annually for which asthma was the primary diagnosis and was similar across age groups (data not shown).
Figure 55. Asthma* Emergency Department Visit Rates per 10,000 Enrollees by Age Group and Year, Wisconsin Medicaid 2009-2011
*Asthma listed as the principal diagnosis (ICD-9-CM codes 493.00 – 493.92)
Data Source: 2009-2011 Medicaid Data, WI Division of Health Care Access and Accountability
Asthma in Government-Funded Programs
160
140
120
100
80
60
40
20
02007 2008 2009 2010 2011
Rat
e pe
r 10
,000
130.2123.7
131.6
117.7111.3
Rat
e pe
r 10
,000
176.0
136.6
200
160
120
40
0<5 5-11 12-17 18-34 35-64 65+
Age Group (years)
80
176.6
122.6
168.2
112.3
135.3
154.7
121.5134.2
120.6 127.4110.5
36.4
92.2
37.5
86.7
35.5
2009 2010 2011

BURDEN OF ASTHMA IN WISCONSIN 2013 69
There were differences in the Medicaid population’s asthma ED visit rate by racial/ethnic group (Figure 56). The asthma ED visit rate was almost three times higher among African American recipients compared to whites. Asians had the lowest asthma ED visit rate per year. Medicaid recipients in all racial/ethnic groups had an average of 2.2 ED visits for asthma in 2011 (data not shown).
Figure 56. Asthma* Emergency Department Visit Rates per 10,000 Enrollees by Race/Ethnicity and Year, Wisconsin Medicaid 2009-2011
*Asthma listed as the principal diagnosis (ICD-9-CM codes 493.00 – 493.92)
Data Source: 2009-2011 Medicaid Data, WI Division of Health Care Access and Accountability
Hospitalizations
Between 2007 and 2011, rates of asthma hospitalizations in the Medicaid population showed a general decline, from 39.8 to 32.4 visits per 10,000 enrollees. Compared to ED visits, asthma hospitalizations occurred less frequently among Medicaid recipients. However, the rates of asthma hospitalizations within the Medicaid population were still three times higher than the rate of hospitalizations for Wisconsin’s general population (see Figure 38). Individuals with asthma hospitalizations had an average of 3 stays per year for which asthma was the primary diagnosis. In 2011, females had slightly higher rates of asthma hospitalizations than males (30.9 vs. 27.1 per 10,000 in 2011), but a similar number of hospitalizations per year.
Asthma in Government-Funded Programs
Race/Ethnicity
86.4
36.4
280
240
200
120
0
Rat
e pe
r 10
,000
160
80.7
35.3
74.5
32.0
247.0
140.0
226.5
131.4
220.5
113.5
152.8 158.4
131.3
175.0
140.6159.6
80
40
2009 2010 2011
White African American Asian Hispanic Other American Indian

BURDEN OF ASTHMA IN WISCONSIN 201370
Figure 57. Asthma* Hospitalization Rates§ per 10,000 Enrollees, Wisconsin Medicaid 2007-2011
*Asthma listed as the principal diagnosis (ICD-9-CM 493.00 – 493.92)§Age-adjusted to the year 2000 U.S. standard population
Data Source: 2007-2011 Medicaid Data, WI Division of Health Care Access and Accountability; 2007-2011 Inpatient hospitalization discharge file
The rate of asthma hospitalizations was the highest for adults aged 35-64 years, followed by children under 5 years of age (Figure 58). Similar to asthma ED visits, the rate of asthma hospitalizations declined from 2009 to 2011 within all age groups. Medicaid recipients with asthma hospitalizations had approximately three visits each year, and this number was consistent across age groups (data not shown).
Figure 58. Asthma* Hospitalization Rates per 10,000 Enrollees by Age Group and Year, Wisconsin Medicaid 2009-2011
*Asthma listed as the principal diagnosis (ICD-9-CM codes 493.00 – 493.92)
Data Source: 2009-2011 Medicaid Data, WI Division of Health Care Access and Accountability
Asthma in Government-Funded Programs
50
45
40
35
30
25
20
15
10
5
02007 2008 2009 2010 2011
Rat
e pe
r 10
,000
39.8 39.6 43.7
35.1 32.4
Year
46.4
28.6
70
60
50
40
30
20
10
0
Rat
e pe
r 10
,000
<5 5-11 12-17 18-34 35-64 65+
Age Group (years)
42.3
22.4
35.2
20.5
28.9
65.8
24.4
50.5
21.9
48.0
18.3
32.7
16.7
29.1
13.2
26.7
2009 2010 2011
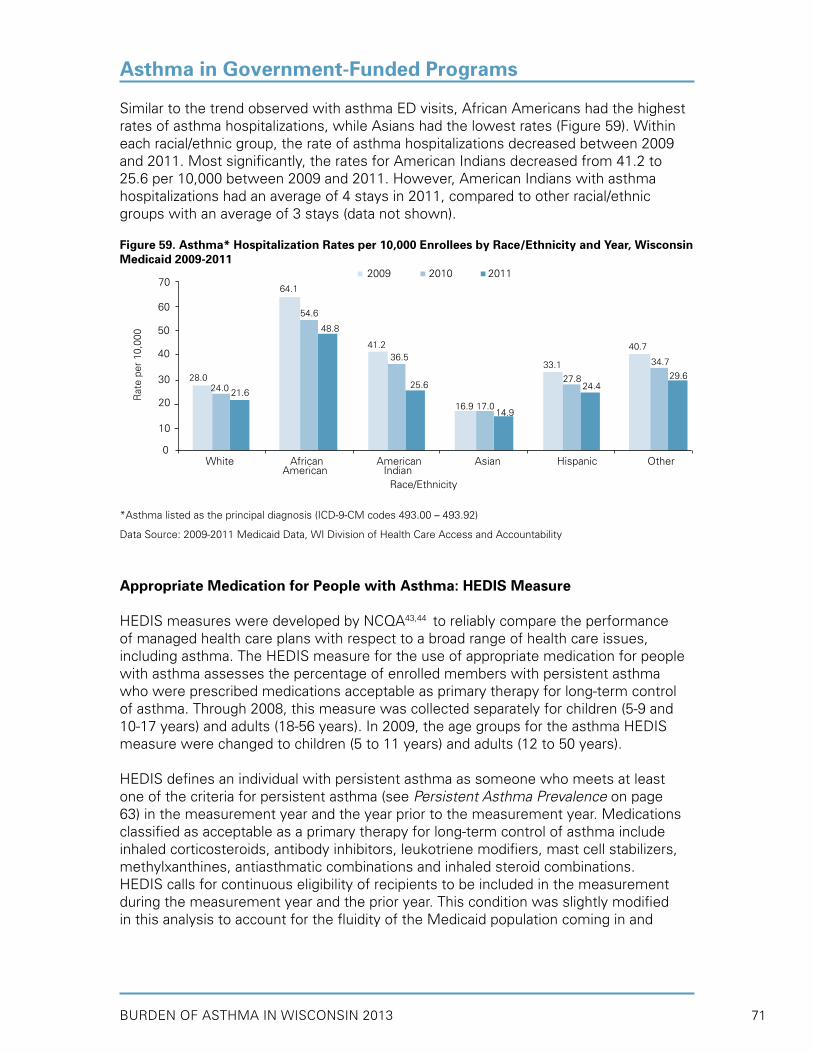
BURDEN OF ASTHMA IN WISCONSIN 2013 71
Similar to the trend observed with asthma ED visits, African Americans had the highest rates of asthma hospitalizations, while Asians had the lowest rates (Figure 59). Within each racial/ethnic group, the rate of asthma hospitalizations decreased between 2009 and 2011. Most significantly, the rates for American Indians decreased from 41.2 to 25.6 per 10,000 between 2009 and 2011. However, American Indians with asthma hospitalizations had an average of 4 stays in 2011, compared to other racial/ethnic groups with an average of 3 stays (data not shown).
Figure 59. Asthma* Hospitalization Rates per 10,000 Enrollees by Race/Ethnicity and Year, Wisconsin Medicaid 2009-2011
*Asthma listed as the principal diagnosis (ICD-9-CM codes 493.00 – 493.92)
Data Source: 2009-2011 Medicaid Data, WI Division of Health Care Access and Accountability
Appropriate Medication for People with Asthma: HEDIS Measure
HEDIS measures were developed by NCQA43,44 to reliably compare the performance of managed health care plans with respect to a broad range of health care issues, including asthma. The HEDIS measure for the use of appropriate medication for people with asthma assesses the percentage of enrolled members with persistent asthma who were prescribed medications acceptable as primary therapy for long-term control of asthma. Through 2008, this measure was collected separately for children (5-9 and 10-17 years) and adults (18-56 years). In 2009, the age groups for the asthma HEDIS measure were changed to children (5 to 11 years) and adults (12 to 50 years).
HEDIS defines an individual with persistent asthma as someone who meets at least one of the criteria for persistent asthma (see Persistent Asthma Prevalence on page 63) in the measurement year and the year prior to the measurement year. Medications classified as acceptable as a primary therapy for long-term control of asthma include inhaled corticosteroids, antibody inhibitors, leukotriene modifiers, mast cell stabilizers, methylxanthines, antiasthmatic combinations and inhaled steroid combinations.HEDIS calls for continuous eligibility of recipients to be included in the measurement during the measurement year and the prior year. This condition was slightly modified in this analysis to account for the fluidity of the Medicaid population coming in and
Asthma in Government-Funded Programs
2009 2010 2011
28.0
16.9
70
60
50
30
0
Rat
e pe
r 10
,000
40
24.0
17.0
21.6
14.9
64.1
54.6
48.8
41.2 40.7
33.136.5 34.7
27.825.6
29.624.4
Race/Ethnicity
White African American Asian Hispanic Other American Indian
20
10
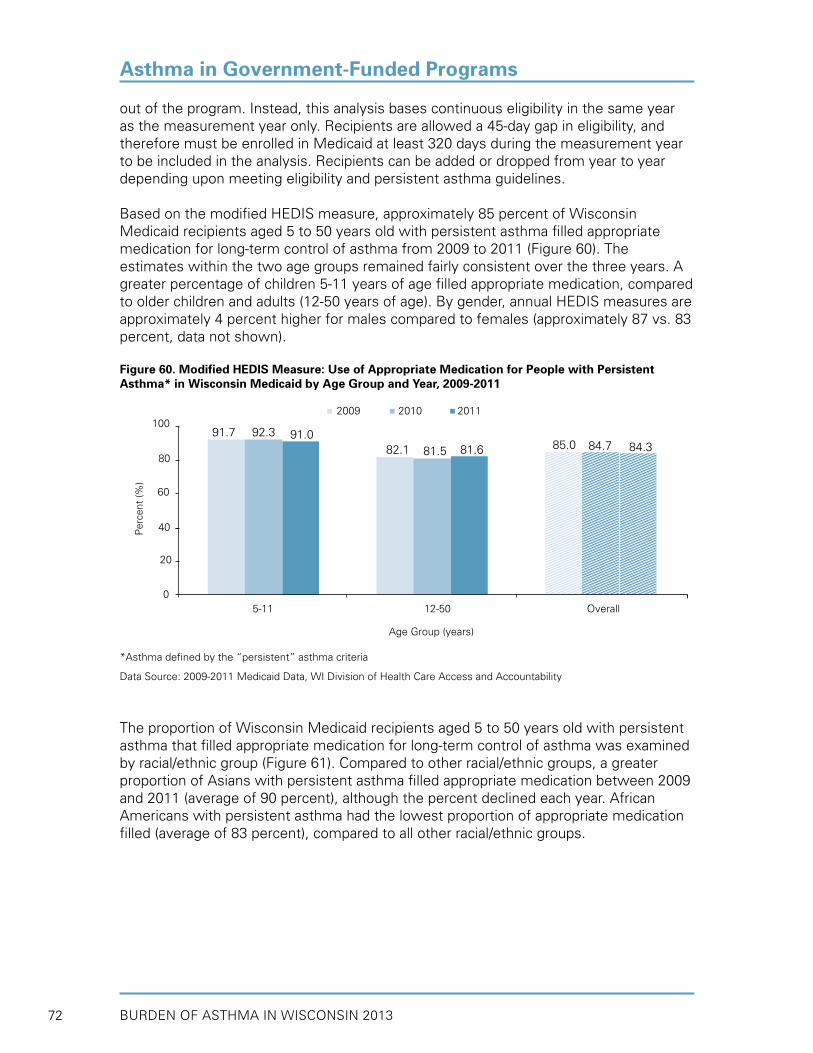
BURDEN OF ASTHMA IN WISCONSIN 201372
out of the program. Instead, this analysis bases continuous eligibility in the same year as the measurement year only. Recipients are allowed a 45-day gap in eligibility, and therefore must be enrolled in Medicaid at least 320 days during the measurement year to be included in the analysis. Recipients can be added or dropped from year to year depending upon meeting eligibility and persistent asthma guidelines.
Based on the modified HEDIS measure, approximately 85 percent of Wisconsin Medicaid recipients aged 5 to 50 years old with persistent asthma filled appropriate medication for long-term control of asthma from 2009 to 2011 (Figure 60). The estimates within the two age groups remained fairly consistent over the three years. A greater percentage of children 5-11 years of age filled appropriate medication, compared to older children and adults (12-50 years of age). By gender, annual HEDIS measures are approximately 4 percent higher for males compared to females (approximately 87 vs. 83 percent, data not shown).
Figure 60. Modified HEDIS Measure: Use of Appropriate Medication for People with Persistent Asthma* in Wisconsin Medicaid by Age Group and Year, 2009-2011
*Asthma defined by the “persistent” asthma criteria
Data Source: 2009-2011 Medicaid Data, WI Division of Health Care Access and Accountability
The proportion of Wisconsin Medicaid recipients aged 5 to 50 years old with persistent asthma that filled appropriate medication for long-term control of asthma was examined by racial/ethnic group (Figure 61). Compared to other racial/ethnic groups, a greater proportion of Asians with persistent asthma filled appropriate medication between 2009 and 2011 (average of 90 percent), although the percent declined each year. African Americans with persistent asthma had the lowest proportion of appropriate medication filled (average of 83 percent), compared to all other racial/ethnic groups.
Asthma in Government-Funded Programs
Age Group (years)
91.7
82.1 85.0
100
80
60
20
0
Per
cent
(%)
5-11 12-50 Overall
40
92.3
81.5 84.791.0
81.6 84.3
2009 2010 2011

BURDEN OF ASTHMA IN WISCONSIN 2013 73
Figure 61. Modified HEDIS Measure: Use of Appropriate Medication for People with Persistent Asthma* in Wisconsin Medicaid by Race/Ethnicity and Year, 2009-2011
*Asthma defined by the “persistent” asthma criteria
Data Source: 2009-2011 Medicaid Data, WI Division of Health Care Access and Accountability
Long-term Controller Use
Similar to the HEDIS measure described above (but without the age limitation of 5 to 50 years), data are presented on the percent of persistent asthmatics who filled at least one long-term control medication prescription, as well as the percent who filled a prescription for an inhaled corticosteroid (ICS) medication in 2011 by sex, age group and race/ethnicity (Figure 62).The percent of persistent asthmatics who filled long-term control medications was higher for males (compared to females), children under 18 years of age (compared to adults), and other racial/ethnic groups. Overall, 84.5 percent of persistent asthmatics filled at least one long-term control medication, and 71.7 percent filled an ICS in 2011 (data not shown). By age group, 70.9 percent of children and 72.2 percent of adults (≥18 years) with persistent asthma filled a prescription for an inhaled corticosteroid, the preferred, first-line medication to manage asthma. Males were slightly more likely to receive ICS medication (72.4 percent). By race/ethnicity, Asians were most likely (76.1 percent) and American Indians were least likely (65.1 percent) to receive an ICS medication in 2011.
Asthma in Government-Funded Programs
85.0
92.5100
80
60
20
0
Per
cent
(%)
40
84.390.3
84.388.3
83.089.6
83.587.5
81.887.4
83.6 86.682.1
87.6 88.7 88.4
Race/Ethnicity
White African American Asian Hispanic Other American Indian
2009 2010 2011

BURDEN OF ASTHMA IN WISCONSIN 201374
Figure 62. Percent of Persistent Asthmatics* in Wisconsin Medicaid with ≥1 Long-Term Control Medication and ≥1 Inhaled Corticosteroid by Sex, Age Group and Race/Ethnicity, 2011
*Asthma defined by the “persistent” asthma criteria
Data Source: 2011 Medicaid Data, WI Division of Health Care Access and Accountability
The overall proportion of long-term control prescriptions filled compared to total prescriptions filled (including rescue medication) by persistent asthmatics in 2011 was 57 percent (Figure 63). The proportion of long-term control medication was higher for males (57.5 percent), children (59.5 percent) and white and other race/ethnic groups (both 58.9 percent).
Figure 63. Proportion† of Long-Term Control Medication Compared to Total Medication Filled by Persistent Asthmatics* in Wisconsin Medicaid by Sex, Age Group and Race/Ethnicity, 2011
†Proportion is the number of long-term controller medications divided by the total asthma medications filled*Asthma defined by the “persistent” asthma criteria
Data Source: 2011 Medicaid Data, WI Division of Health Care Access and Accountability
Asthma in Government-Funded Programs
57.5
40
0
Per
cent
(%)
Male Female Child Adult White African American Asian Hispanic Other American Indian
Sex Age Group Race/Ethnicity Overall
20
56.759.5
56.055.758.958.9 57.058.1
50.153.0
60
86.1
72.480
0
Per
cent
(%)
Male Female Child Adult White African American Asian Hispanic Other American Indian
Sex Age Group Race/Ethnicity
20
83.4
71.270.9
72.4
88.981.281.8
87.9
70.965.1
72.4 69.4
84.9 86.281.5
85.6
72.2 76.1
100
60
40
Long-term Controller Inhaled Corticosteroid
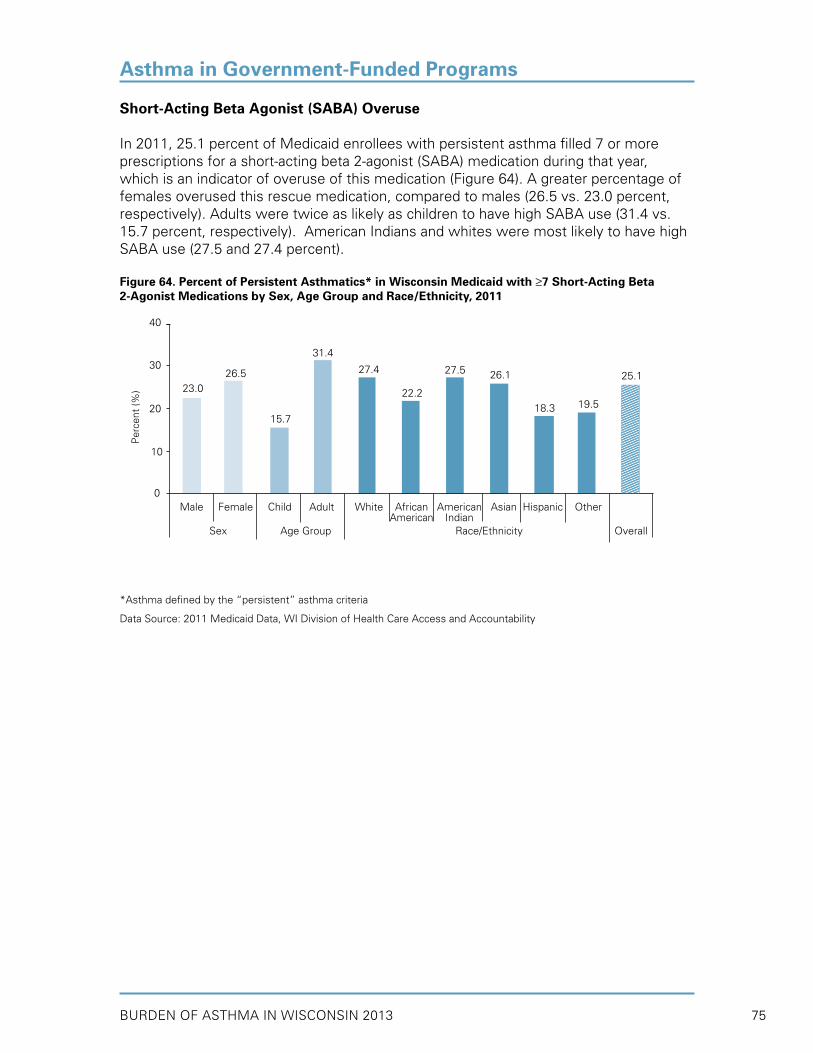
BURDEN OF ASTHMA IN WISCONSIN 2013 75
Short-Acting Beta Agonist (SABA) Overuse
In 2011, 25.1 percent of Medicaid enrollees with persistent asthma filled 7 or more prescriptions for a short-acting beta 2-agonist (SABA) medication during that year, which is an indicator of overuse of this medication (Figure 64). A greater percentage of females overused this rescue medication, compared to males (26.5 vs. 23.0 percent, respectively). Adults were twice as likely as children to have high SABA use (31.4 vs. 15.7 percent, respectively). American Indians and whites were most likely to have high SABA use (27.5 and 27.4 percent).
Figure 64. Percent of Persistent Asthmatics* in Wisconsin Medicaid with ≥7 Short-Acting Beta 2-Agonist Medications by Sex, Age Group and Race/Ethnicity, 2011
*Asthma defined by the “persistent” asthma criteria
Data Source: 2011 Medicaid Data, WI Division of Health Care Access and Accountability
Asthma in Government-Funded Programs
23.0
40
30
10
0
Per
cent
(%)
Male Female Child Adult White African American Asian Hispanic Other American Indian Sex Age Group Race/Ethnicity Overall
20
26.5 27.5
15.7
26.1 25.1
18.3 19.522.2
31.4
27.4
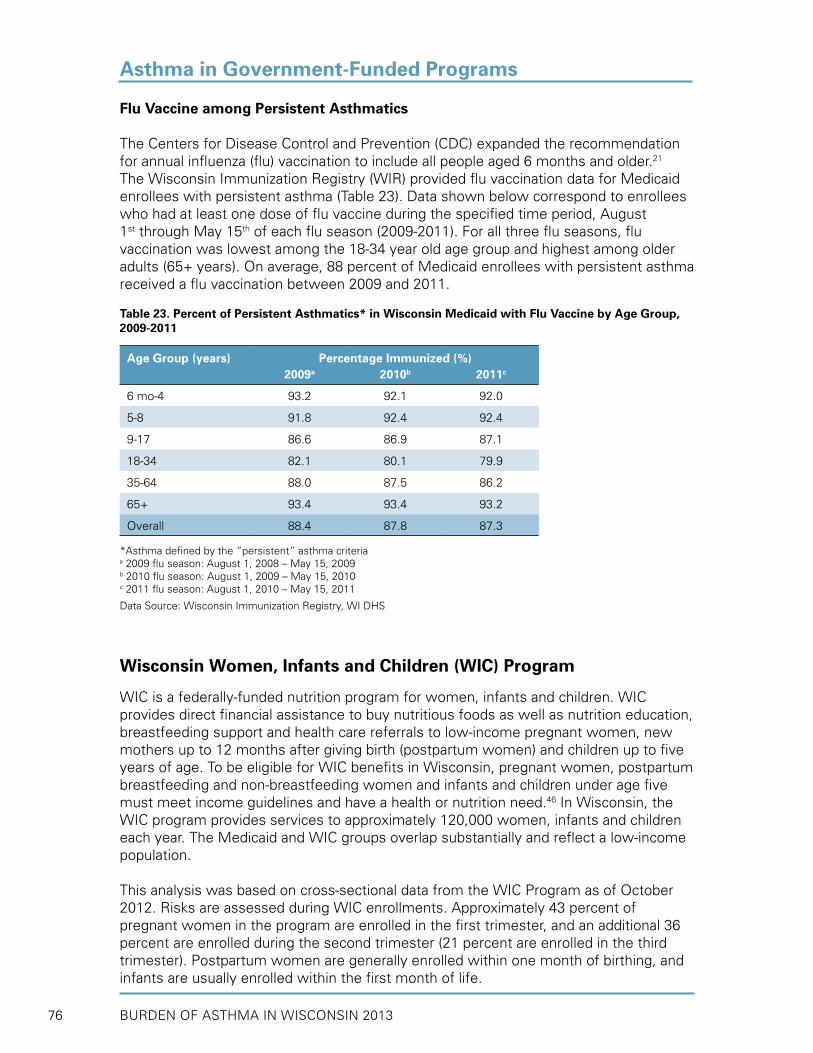
BURDEN OF ASTHMA IN WISCONSIN 201376
Flu Vaccine among Persistent Asthmatics
The Centers for Disease Control and Prevention (CDC) expanded the recommendation for annual influenza (flu) vaccination to include all people aged 6 months and older.21 The Wisconsin Immunization Registry (WIR) provided flu vaccination data for Medicaid enrollees with persistent asthma (Table 23). Data shown below correspond to enrollees who had at least one dose of flu vaccine during the specified time period, August 1st through May 15th of each flu season (2009-2011). For all three flu seasons, flu vaccination was lowest among the 18-34 year old age group and highest among older adults (65+ years). On average, 88 percent of Medicaid enrollees with persistent asthma received a flu vaccination between 2009 and 2011.
Table 23. Percent of Persistent Asthmatics* in Wisconsin Medicaid with Flu Vaccine by Age Group, 2009-2011
Age Group (years) Percentage Immunized (%)2009a 2010b 2011c
6 mo-4 93.2 92.1 92.0
5-8 91.8 92.4 92.4
9-17 86.6 86.9 87.1
18-34 82.1 80.1 79.9
35-64 88.0 87.5 86.2
65+ 93.4 93.4 93.2
Overall 88.4 87.8 87.3
*Asthma defined by the “persistent” asthma criteriaa 2009 flu season: August 1, 2008 – May 15, 2009b 2010 flu season: August 1, 2009 – May 15, 2010c 2011 flu season: August 1, 2010 – May 15, 2011
Data Source: Wisconsin Immunization Registry, WI DHS
Wisconsin Women, Infants and Children (WIC) Program
WIC is a federally-funded nutrition program for women, infants and children. WIC provides direct financial assistance to buy nutritious foods as well as nutrition education, breastfeeding support and health care referrals to low-income pregnant women, new mothers up to 12 months after giving birth (postpartum women) and children up to five years of age. To be eligible for WIC benefits in Wisconsin, pregnant women, postpartum breastfeeding and non-breastfeeding women and infants and children under age five must meet income guidelines and have a health or nutrition need.46 In Wisconsin, the WIC program provides services to approximately 120,000 women, infants and children each year. The Medicaid and WIC groups overlap substantially and reflect a low-income population.
This analysis was based on cross-sectional data from the WIC Program as of October 2012. Risks are assessed during WIC enrollments. Approximately 43 percent of pregnant women in the program are enrolled in the first trimester, and an additional 36 percent are enrolled during the second trimester (21 percent are enrolled in the third trimester). Postpartum women are generally enrolled within one month of birthing, and infants are usually enrolled within the first month of life.
Asthma in Government-Funded Programs

BURDEN OF ASTHMA IN WISCONSIN 2013 77
Asthma Prevalence among Women
Asthma prevalence was defined by the number of WIC Program recipients who self-reported taking daily medication for asthma. As a result, the estimates presented in this section likely underestimate the true asthma prevalence, since not all persons with asthma take medication. The prevalence of daily asthma medication use among all women in the WIC program was 2.1 percent (Figure 65) and was similar between pregnant and postpartum women (2.3 vs. 2.0 percent, respectively; data not shown). By age group, the prevalence of daily asthma medication use was highest in women 35 years of age and older. African American women had higher daily asthma medication prevalence than white women (2.8 vs. 2.1 percent, respectively).
Figure 65. Women† in the WIC Program with Daily Asthma Medication Use by Age Group and Race, Wisconsin 2012
†Includes pregnant and postpartum women
Data Source: 2012 WIC Program, WI DHS
Asthma prevalence estimates were compared between WIC women who reported exposure to specific factors associated with asthma (smoking tobacco, exposure to environmental tobacco smoke (ETS), obesity and depression) and those who did not (Figure 66). Exposure to all factors was associated with higher asthma prevalence in both pregnant and postpartum women; however, pregnant women had higher asthma prevalence than postpartum women, regardless of specific exposure (data not shown). The factors which were most strongly related to asthma prevalence were depression and exposure to ETS. Women with depression had an asthma prevalence that was three times greater than women without depression (5.2 vs. 1.9 percent, respectively). Exposure to ETS was associated with a 50% increase in asthma prevalence (3.3 vs. 2.0 percent).
Asthma in Government-Funded Programs
2.2
4
3
1
0
Per
cent
(%)
15-24 25-34 35+ White African American
Age Group (years) Race Overall
2
2.8
2.12.0
2.42.1
5

BURDEN OF ASTHMA IN WISCONSIN 201378
Figure 66. Women† in the WIC Program with Asthma* by Exposure to Specific Factors Associated with Asthma, Wisconsin 2012
†Includes pregnant and postpartum women*Asthma definition based on self-reported use of daily medication for asthma
Data Source: 2012 WIC Program, WI DHS
Child Asthma Prevalence
Asthma prevalence was defined by the number of WIC Program recipients who took daily medication for asthma. The prevalence of daily asthma medication use among all children under 5 years in the WIC program was 2.4 percent (Figure 67). There were too few infants with daily asthma medication use to calculate a prevalence estimate. African American children had a prevalence of daily asthma medication use that was three times higher than that of white children (5.2 vs. 1.7 percent).
Figure 67. Children (under 5 years) in the WIC Program with Daily Asthma Medication Use by Race, Wisconsin 2012
Data Source: 2012 WIC Program, WI DHS
Asthma in Government-Funded Programs
2.5
6
5
3
0
Per
cent
(%) 4
2.0 1.8
5.2
3.3
2.0 1.9
2.7
2.1
Risk Factors for Asthma
Yes No Yes No Yes No Yes No
2
1
Smoke, Tobacco Exposed to ETS Obese with Depression Overall
1.7
8
6
2
0
Per
cent
(%)
White African American
Race Overall
4
5.2
2.4
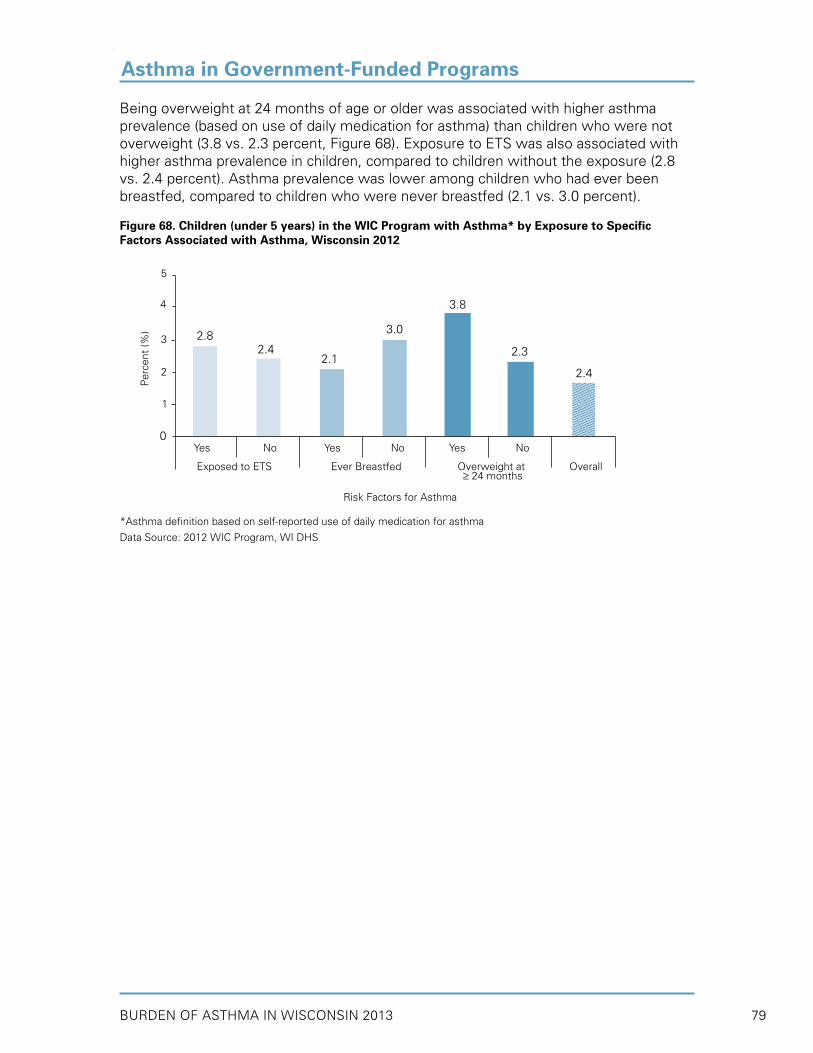
BURDEN OF ASTHMA IN WISCONSIN 2013 79
Asthma in Government-Funded Programs
Being overweight at 24 months of age or older was associated with higher asthma prevalence (based on use of daily medication for asthma) than children who were not overweight (3.8 vs. 2.3 percent, Figure 68). Exposure to ETS was also associated with higher asthma prevalence in children, compared to children without the exposure (2.8 vs. 2.4 percent). Asthma prevalence was lower among children who had ever been breastfed, compared to children who were never breastfed (2.1 vs. 3.0 percent).
Figure 68. Children (under 5 years) in the WIC Program with Asthma* by Exposure to SpecificFactors Associated with Asthma, Wisconsin 2012
*Asthma definition based on self-reported use of daily medication for asthma
Data Source: 2012 WIC Program, WI DHS
2.4
5
4
3
2
0
Per
cent
(%)
Risk Factors for Asthma
3.0
3.8
2.8
2.12.3
2.4
Yes No Yes No Yes No
Exposed to ETS Ever Breastfed Overweight at Overall ≥ 24 months
1

BURDEN OF ASTHMA IN WISCONSIN 201380
Death from asthma is a relatively uncommon event, and most asthma deaths are considered preventable. Improving access to health care and proper disease management are critical strategies in reducing deaths attributable to asthma. This section describes asthma mortality in Wisconsin from 2002-2011 and presents some demographic characteristics of residents who died of asthma during this period.
Deaths in Wisconsin are reported by the 72 county vital records offices and by two city health offices (West Allis and Milwaukee) to the Wisconsin Vital Records Office (see Appendix A). Death certificates are completed by physicians, coroners, funeral directors, or county or city health officers. For all death records, one underlying or primary cause of death and up to 20 contributing causes of death are recorded.
Key Findings
• Between 2002 and 2011 there were approximately 65 deaths per year in Wisconsin for which asthma was the underlying cause. Additionally, an average of 159 deaths per year during this time period listed asthma as a contributing cause of death.
• Over the past decade, there has been a general decline in asthma mortality in Wisconsin from 12.6 deaths per million in 2002 to 10.3 deaths per million in 2011.
• The six year age-adjusted mortality rates from 2006-2011 showed that African Americans were 4 times more likely to die of asthma than whites (35.4 vs. 7.9 per million).
• Adults aged 65 years and older had the highest asthma mortality rates in Wisconsin (2006-2011).
• The annual crude number of deaths and age-adjusted asthma mortality rates in Wisconsin were higher among females than males (2006-2011).
MORTALITY

BURDEN OF ASTHMA IN WISCONSIN 2013 81
Population-Based Mortality Rates
In 2010, 3,404 deaths occurred nationally for which asthma was the underlying cause.32 Of these, 63 deaths occurred in Wisconsin. Between 2002 and 2011 there were approximately 65 deaths per year in Wisconsin for which asthma was the underlying cause. Additionally, an average of 159 deaths per year during this time period listed asthma as a contributing cause (Figure 69).
Figure 69. Asthma* Deaths by Year, Underlying and Contributing Cause of Death, Wisconsin 2002-2011
*Asthma (ICD-10 codes J45 and J46)
Data Source: Wisconsin Vital Records Office
Since Wisconsin began conducting surveillance of asthma mortality in 1990, mortality rates under ICD-9 ranged from a low of 15.1 deaths per million in 1992 to a high of 23.2 deaths per million in 1996 (Figure 70). Since the ICD-10 coding system was implemented in 1999, the rates have ranged from a high of 15.7 deaths per million in 2000 to a low of 7.3 deaths per million in 2009. Due to the change in coding practices from ICD-9 to ICD-10, rates from each coding system may not be comparable. However, over the past 13 years (1999-2011), asthma mortality in Wisconsin has been decreasing. As with other surveillance endpoints for which there are relatively few events, annual mortality rates can be variable and yearly comparisons should be made with caution.
MORTALITY
Dea
ths
(#)
2002 2003 2004 2005 2006 2007 2008 2009 2010 2011
275
250
225
200
175
150
125
100
75
50
25
0
172 175148168 161
72 657759 63
156 162
168
168121
62 647946
65
Year
Contributing
Underlying

BURDEN OF ASTHMA IN WISCONSIN 201382
Figure 70. Asthma* Mortality Rates§ by Year, Wisconsin Residents 1990-2011
*Asthma listed as the underlying cause of death (1990-1998: ICD-9 codes 493.0-493.9; 1999-2011: ICD-10 codes J45 and J46) §Age-adjusted to the year 2000 U.S. standard population.
Data Source: Wisconsin Vital Records Office
Mortality rates from 2002-2011 in Wisconsin have been slightly below or similar to national rates and have shown an overall decline during this period (Figure 71).
Figure 71. Asthma* Mortality Rates§ by Year, Wisconsin (2002-2011) and U.S. (2002-2010)
*Asthma listed as the underlying cause of death (ICD-10 codes J45 and J46)§Age-adjusted to the year 2000 U.S. standard population.
Data Sources: Wisconsin Vital Records Office; United States Department of Health and Human Services (US DHHS), Centers for Disease Control and Prevention (CDC), National Center for Health Statistics (NCHS), Underlying Cause of Death 1999-2010 on CDC WONDER Online Database, released 2012.
MORTALITY
2002 2003 2004 2005 2006 2007 2008 2009 2010 2011
Rat
e pe
r 1,
000,
000
20
15
10
5
0
US.
Wisconsin
Year
ICD-9 (1990-1998) ICD-10 (1999-2011)
Year
21.3
11.8
25
20
15
50
0
Rat
e pe
r 1,
000,
000
10
20.3
12.6
15.1
10.4
21.6
13.1
23.2
13.5
16.9
10.7
17.0
10.2
15.5
9.3
15.7
7.3
19.2 18.7
ICD
-10
Rev
isio
n (1
999)
10.310.0
1990
1991
1992
1993
1994
1995
1996
1997
1998
1999
2000
2001
2002
2003
2004
2005
2006
2007
2008
2009
2010
2011
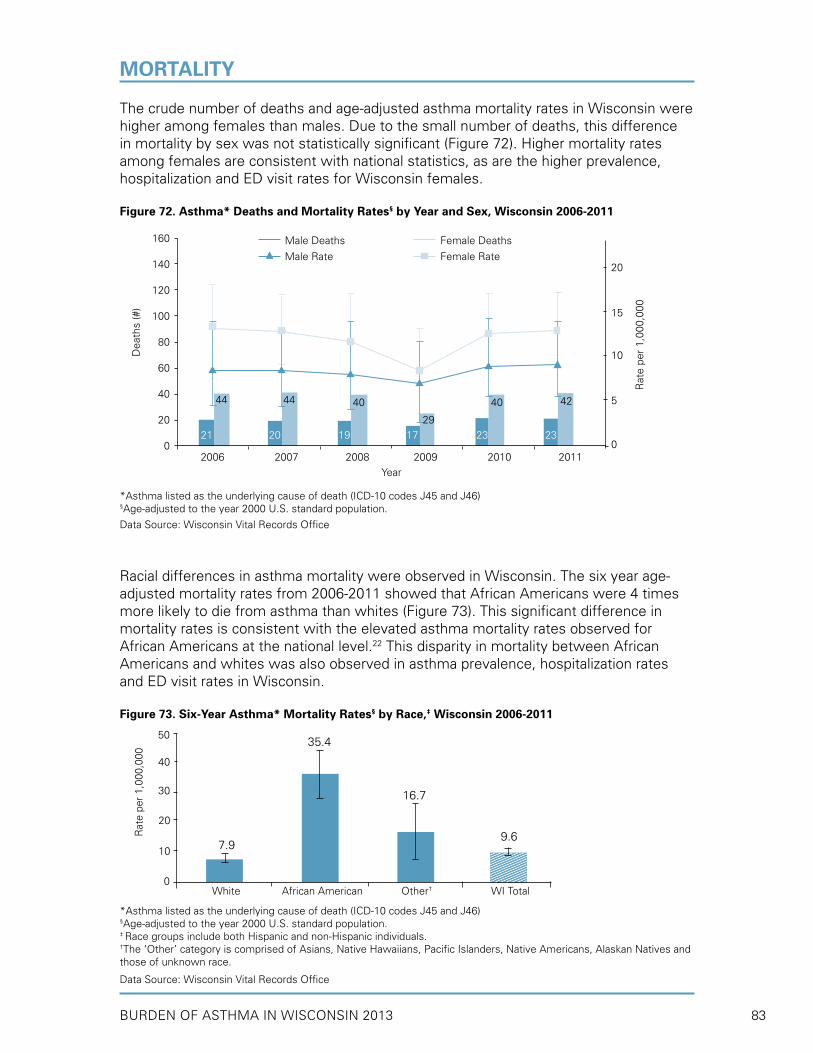
BURDEN OF ASTHMA IN WISCONSIN 2013 83
The crude number of deaths and age-adjusted asthma mortality rates in Wisconsin were higher among females than males. Due to the small number of deaths, this difference in mortality by sex was not statistically significant (Figure 72). Higher mortality rates among females are consistent with national statistics, as are the higher prevalence, hospitalization and ED visit rates for Wisconsin females.
Figure 72. Asthma* Deaths and Mortality Rates§ by Year and Sex, Wisconsin 2006-2011
*Asthma listed as the underlying cause of death (ICD-10 codes J45 and J46)§Age-adjusted to the year 2000 U.S. standard population.
Data Source: Wisconsin Vital Records Office
Racial differences in asthma mortality were observed in Wisconsin. The six year age-adjusted mortality rates from 2006-2011 showed that African Americans were 4 times more likely to die from asthma than whites (Figure 73). This significant difference in mortality rates is consistent with the elevated asthma mortality rates observed for African Americans at the national level.22 This disparity in mortality between African Americans and whites was also observed in asthma prevalence, hospitalization rates and ED visit rates in Wisconsin.
Figure 73. Six-Year Asthma* Mortality Rates§ by Race,‡ Wisconsin 2006-2011
*Asthma listed as the underlying cause of death (ICD-10 codes J45 and J46)§Age-adjusted to the year 2000 U.S. standard population.‡ Race groups include both Hispanic and non-Hispanic individuals.†The ‘Other’ category is comprised of Asians, Native Hawaiians, Pacific Islanders, Native Americans, Alaskan Natives and those of unknown race.
Data Source: Wisconsin Vital Records Office
MORTALITY
7.9
16.7
40
20
10
Rat
e pe
r 1,
000,
000
White African American Other† WI Total
50
30
35.4
0
9.6
160
140
120
100
80
60
40
20
02006 2007 2008 2009 2010 2011
Dea
ths
(#)
Year
21 20 19 17 23 23
44 42 44 40
29
40
20
15
10
5
0
Rat
e pe
r 1,
000,
000
Male Deaths
Male Rate
Female Deaths
Female Rate

BURDEN OF ASTHMA IN WISCONSIN 201384
MORTALITY
While children with asthma have higher rates of hospitalizations and ED visits compared to older adults, rates of asthma mortality are much greater among older adults than among children. Both nationally and in Wisconsin, adults aged 65 years and older had the highest asthma mortality rates. Averaged over the six-year period (2006-2011), there were 46.4 deaths per million annually in the 65 and older population in Wisconsin (Table 24). The mean age of death during this six-year period was 66 years (median age, 73.5 years).
Table 24. Annual and Average Age-Specific Asthma* Mortality Rates per 1,000,000, Wisconsin 2006-2011
Age Group 2006 2007 2008 2009 2010 2011 Average0-4 - 2.8 2.8 - 2.8 5.6 3.5
5-14 1.4 - 2.8 2.8 1.3 4.1 2.5
15-34 4.0 2.6 4.6 2.0 2.7 5.9 3.6
35-64 6.7 7.9 5.7 8.8 10.4 6.5 7.7
65+ 59.1 55.7 48.0 27.6 42.5 45.4 46.4
Overall† 10.7 10.2 9.3 7.3 10.0 10.3 9.6
*Asthma listed as the underlying cause of death (ICD-10 codes J45 and J46)†Age-adjusted to the year 2000 U.S. standard population.
Data Source: Wisconsin Vital Records Office
Because asthma mortality is relatively uncommon and mortality rates at the county level are based on a small number of events, annual county-level rates are statistically unstable and not appropriate for presentation. However, stable rates based on six years of data (2006-2011) can be calculated based on the National Center for Health Statistics (NCHS) urban/rural classification (see Appendix D for definition). Milwaukee County, the only large central metro county in Wisconsin, had the highest asthma mortality rate at 12.0 deaths per million, although this rate was not significantly different from the rates of other urban/rural classifications (Table 25).
Table 25. Six-Year Asthma* Mortality Rates§ by National Center for Health Statistics (NCHS) Urban/Rural Classification, Wisconsin 2006-2011
2006 NCHS Urban/Rural Classification Rate per 1,000,000 (95% CI)
Wisconsin – Total Population 9.6 (8.6 – 10.6)
Large Central Metro (Milwaukee County) - Central counties in metro areas of 1 million or more population 12.0 (9.3 – 15.2)
Large Fringe Metro - Outlying (suburban) counties in metro areas of 1 million or more population 7.3 (5.2 – 9.9)
Medium Metro - Counties in metro areas of 250,000-999,999 population 8.2 (6.0 – 10.9)
Small Metro - Counties in metro area of 50,000-249,999 population 10.3 (8.3 – 12.6)
Micropolitan - Counties in an area with an urban cluster of 10,000-49,999 population 9.3 (6.9 – 12.2)
Noncore – Nonmicropolitan 10.1 (7.7 – 13.0)
*Asthma listed as the underlying cause of death (ICD-10 codes J45 and J46)§Age-adjusted to the year 2000 U.S. standard population.
Data Source: Wisconsin Vital Records Office
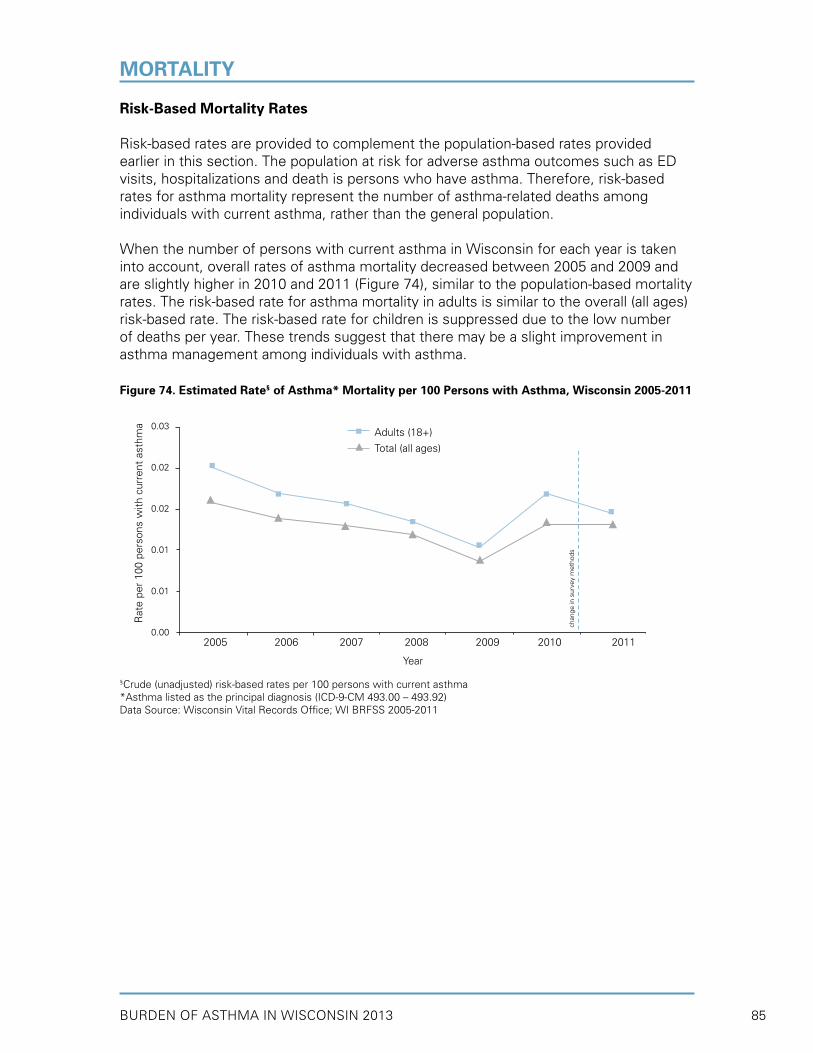
BURDEN OF ASTHMA IN WISCONSIN 2013 85
Risk-Based Mortality Rates
Risk-based rates are provided to complement the population-based rates provided earlier in this section. The population at risk for adverse asthma outcomes such as ED visits, hospitalizations and death is persons who have asthma. Therefore, risk-based rates for asthma mortality represent the number of asthma-related deaths among individuals with current asthma, rather than the general population.
When the number of persons with current asthma in Wisconsin for each year is taken into account, overall rates of asthma mortality decreased between 2005 and 2009 and are slightly higher in 2010 and 2011 (Figure 74), similar to the population-based mortality rates. The risk-based rate for asthma mortality in adults is similar to the overall (all ages) risk-based rate. The risk-based rate for children is suppressed due to the low number of deaths per year. These trends suggest that there may be a slight improvement in asthma management among individuals with asthma.
Figure 74. Estimated Rate§ of Asthma* Mortality per 100 Persons with Asthma, Wisconsin 2005-2011
§Crude (unadjusted) risk-based rates per 100 persons with current asthma*Asthma listed as the principal diagnosis (ICD-9-CM 493.00 – 493.92)Data Source: Wisconsin Vital Records Office; WI BRFSS 2005-2011
MORTALITY
Rat
e pe
r 10
0 pe
rson
s w
ith c
urre
nt a
sthm
a
2005 2006 2007 2008 2009 2010 2011
chan
ge in
sur
vey
met
hods
0.03
0.02
0.02
0.01
0.01
0.00
Adults (18+)
Total (all ages)
Year
BURDEN OF ASTHMA IN WISCONSIN 201386
Asthma is recognized as a public health priority in the United States Department of Health and Human Services’ Healthy People 2020 (HP2020), a set of disease prevention and health promotion objectives to be achieved by 2020 (http://www.healthypeople.gov/2020/).4 HP2020 objectives are national benchmarks for increasing the quality of life and number of years of healthy living and for eliminating health disparities. HP2020 asthma objectives cover the following topics: mortality, hospitalizations, emergency department (ED) visits, activity limitations, school/work missed, asthma patient education and proper asthma care. Reducing disparities in asthma hospitalization and emergency department utilization rates is a goal of Wisconsin’s statewide public health plan, Healthiest Wisconsin 2020 (http://www.dhs.wisconsin.gov/hw2020/).5
The Wisconsin Asthma Program tracks Wisconsin’s progress toward meeting asthma-related HP 2020 objectives by analyzing mortality, hospitalization, emergency department (ED), and Behavioral Risk Factor Surveillance System (BRFSS) survey data. In this section, Wisconsin baseline data are provided, along with U.S. baseline data and HP2020 targets. Please note that information is not available to measure all of the objectives at the state level.
Wisconsin baseline measures were calculated for the first three objectives using the latest available surveillance data (Table 26). These objectives included reducing asthma deaths (RD-1), reducing asthma hospitalizations (24-2) and reducing ED visits for asthma (24-3). Baseline national rates were provided for comparison. These data represent rates for the population overall; rates may differ for specific age groups, genders, race/ethnic groups or geographic regions.
Wisconsin baseline rates for reducing asthma deaths (RD-1) are lower than U.S. baseline rates, although they are still higher than the HP2020 targets. However, Wisconsin baseline rates for all but one stratum under reducing asthma hospitalizations and ED visits (RD-2 and RD-3) already meet the HP 2020 targets. The one exception corresponds to children under age 5 (reducing hospitalizations for asthma), in which the Wisconsin baseline rate (21.6 per 10,000) is greater than the HP2020 target (18.1 per 10,000). Wisconsin ED visit rates do not include those visits which resulted in an asthma hospitalization; therefore Wisconsin rates must be compared cautiously to the HP2020 target rates which do include ED visits that result in a hospital admission.
MEETING HEALTHY PEOPLE 2020 ASTHMA GOALS IN WISCONSIN
• Wisconsin baseline rates for reducing asthma deaths (RD-1) are lower than U.S. baseline rates, although they are still higher than the HP2020 targets.
• The majority of Wisconsin baseline rates corresponding to reducing asthma hospitalizations and ED visits (RD-2 and RD-3) already meet the HP 2020 targets. The one exception corresponds to children under age 5 (reducing hospitalizations for asthma), in which the Wisconsin baseline rate (21.6 per 10,000) is greater than the HP2020 target (18.1 per 10,000).
• The majority of baseline estimates related to activity limitations, school/work missed, asthma patient education and proper asthma care indicate that Wisconsin is doing better than the U.S. (at baseline); however, Wisconsin has not yet met all HP2020 targets.
• Nearly 56 percent of children and 39 percent of adults with asthma reported missing school/work days due to asthma.
• Only 35 percent of persons with asthma received written asthma management plans from their healthcare provider.
Key Findings

BURDEN OF ASTHMA IN WISCONSIN 2013 87
Appendices
Table 26. Wisconsin, U.S. and Healthy People 2020 Baseline and Target Goals for Asthma Mortality, Hospitalization and Emergency Department Visit Rates
HP 2020 Asthma Objectives WI Baseline§
(95% CI)
U.S.
Baseline§
HP 2020
Target
RD-1. Reduce asthma deaths (Rate per 1,000,000)
Children and adults under age 35 3.2 (2.1- 4.7) 3.4 *
Adults aged 35 to 64 8.6 (6.5-11.0) 11.0 6.0
Adults aged 65 and older 38.6 (31.0-47.5) 43.3 22.9
RD-2. Reduce hospitalizations for asthma (Rate per 10,000)
Children under age 5 21.6 (20.7-22.4) 41.4 18.1
Children and adults aged 5 to 64† 6.6 (6.5- 6.7) 11.1 8.6
Adults aged 65 and older† 14.6 (14.1-15.0) 25.3 20.3
RD-3. Reduce emergency department visits for asthma‡ (Rate per 10,000)
Children under age 5 76.4 (74.8-78.1) 132.7 95.5
Children and adults aged 5 to 64 36.9 (36.6-37.2) 56.4 49.1
Adults aged 65 and older 12.5 (12.0-13.0) 21.0 13.2
§ Data sources used to calculate baseline Wisconsin and U.S. objectives: RD-1: Wisconsin Vital Records Office Mortality File (2009-2011) and National Vital Statistics System-Mortality, CDC, NCHS (U.S. 2007); RD-2: Wisconsin Inpatient Hospitalization Discharge File (2009-2011) and National Hospital Discharge Survey, CDC, NCHS (U.S. 2007); RD-3: Wisconsin Emergency Department Discharge File (2009-2011) and National Hospital Ambulatory Medical Care Survey, CDC, NCHS (U.S. 2005-2007)
* Being tracked for informational purposes. If warranted, a target will be set during the decade† Age-adjusted to the U.S. 2000 standard population‡ Wisconsin excludes ED visits which result in a hospitalization; U.S. does not
The Wisconsin BRFSS Asthma Callback Survey provided data that made it possible to calculate baseline estimates for three of the remaining four HP2020 goals (RD-5, RD-6 and RD-7) related to activity limitations, school/work missed, asthma patient education and proper asthma care (Table 27). U.S. baseline estimates and HP2020 targets are not provided for developmental objectives (7.6-7.8), although Wisconsin baseline estimates were calculated when data were available.
Although the majority of baseline estimates indicate that Wisconsin is doing better than the U.S. (at baseline), not all HP2020 targets have been met and there is still room for improvement. One notable exception was objective RD-6 (proportion of adults with asthma who received formal patient education), in which the Wisconsin baseline estimate of 6.6 percent was considerably less than the 14.4 percent recommended target. Nearly 56 percent of children and 39 percent of adults with asthma reported missing school/work days due to asthma. Only 35 percent of persons with asthma received written asthma management plans, and 62 percent of persons with asthma had at least one routine follow-up visit in past 12 months. The WI BRFSS data did not contain comparable questions that allowed for assessment of two components of objective RD-7 (medication regimens that prevent the need for SABA medication and doctor assessment of asthma control in the past 12 months) or objective RD-4 pertaining to activity limitations among persons with asthma.
Meeting Healthy People 2020 Asthma Goals in Wisconsin

BURDEN OF ASTHMA IN WISCONSIN 201388
Table 27. Wisconsin, U.S. and Healthy People 2020 Baseline and Target Goals for Other Asthma Objectives
HP 2020 Asthma Objectives WI Baseline§
% (95% CI)
U.S.
Baseline§
HP 2020
Target
RD-4. Reduce activity limitations among persons with asthma (Age-adjusted percent)
- 12.7% 10.2%
RD-5. Reduce the proportion of persons with asthma who miss school or work days
5.1 Children (5 to 17 years) with asthma who miss school days 55.7 (42.2-69.1)o 58.7% 48.7%
5.2 Adults (18 to 64 years) with asthma who miss work days 39.2 (31.9-46.6) 33.2% 26.8%
RD-6. Increase the proportion of persons with asthma who receive formal patient education (Age-adjusted percent)
6.6 (4.7-8.6) 12.1% 14.4%
RD-7. Increase the proportion of persons with current asthma who receive appropriate asthma care according to NAEPP guidelines (Age-adjusted percent):
7.1 Persons with asthma who receive written asthma management plans from their healthcare provider
34.7 (30.4-39.1)o 33.4% 36.8%
7.2 Persons with asthma with prescribed inhalers who receive instruction on how to use inhaler properly
99.1 (97.7-100.0)o 95.9% *
7.3 Persons with asthma who receive education about recognizing early signs and symptoms of asthma episodes and how to respond appropriately
74.0 (70.4-77.6)o 64.8% 68.5%
7.4 Persons with asthma who do not use more than 1 canister of short-acting inhaled β-agonists per month for relief of symptoms
- 87.9% 90.2%
7.5 Persons with asthma who have been advised by a health professional to reduce exposure to irritants or allergens in their home, school, and work environments
83.7 (81.1-86.4)o 50.8% 54.5%
7.6 (Developmental) Persons with asthma who have had at least one routine follow-up visit in past 12 months
61.9 (57.6-66.2) * *
7.7 (Developmental) Persons with asthma whose doctor assessed their asthma control in the past 12 months
- * *
7.8 (Developmental) Adults with asthma who have discussed with a health professional whether their asthma was work related (Not age-adjusted)
13.5 (10.3-16.8) * *
§ Data sources used to calculate baseline objectives: WI BRFSS Asthma Callback Survey (2006-2010); National Health Interview Survey, CDC, NCHS (2008)- Comparable data not available to measure this objective at the state levelo HP 2020 target has been met or falls within the margin of error (95% CI) of the Wisconsin estimate† Age-adjusted percent* Tracked for informational purposes or developmental objective. Potential national datasets being identified; if warranted, a target will be set during the decade
AppendicesMeeting Healthy People 2020 Asthma Goals in Wisconsin

BURDEN OF ASTHMA IN WISCONSIN 2013 89
This surveillance document describes recent trends in asthma prevalence, morbidity and mortality in Wisconsin. While Wisconsin has made some progress in decreasing the burden of asthma statewide, there is still great need for improvement for people living with asthma. The prevalence of adult asthma is increasing in Wisconsin; however, there is no discernible trend in childhood asthma prevalence in Wisconsin. Although statewide population-based rates of asthma hospitalizations and emergency department (ED) visits have decreased, the rates among persons with asthma (risk-based) have remained steady. Population-based and risk-based rates of deaths due to asthma have decreased slightly. Wisconsin’s overall asthma prevalence, hospitalization, ED visit and mortality rates continue to be lower than national estimates. However, the burden of asthma in Wisconsin is spread unevenly across different ages, sex, income levels, race/ethnic groups and geographic locations.
During childhood, males tend to have higher asthma prevalence than females. This trend reverses in adulthood, at which time adult females have higher asthma prevalence than adult males. Adult females also have higher rates of asthma attacks, ED visits, hospitalizations and mortality than adult males. On average, females also have greater lengths of stay when hospitalized and increased costs. By age group, children 0-4 years of age have the highest rates of asthma hospitalizations and ED visits. Adults aged 65 years and older have the highest asthma mortality rates.
In Wisconsin, socioeconomic and racial/ethnic disparities in asthma morbidity and mortality persist. Asthma disproportionately affects individuals by income level. Households with the lowest incomes have not only the highest overall prevalence of asthma, but also the highest prevalence of poorly-controlled asthma. When compared to other race/ethnic groups in Wisconsin, African Americans have the most striking disparities in asthma morbidity and mortality. Asthma prevalence among African Americans is nearly twice as high as for whites. The disparities in asthma health care utilization and mortality are even greater. African Americans have significantly higher (four to five times higher) rates for asthma hospitalizations and mortality due to asthma in comparison to whites. Milwaukee County, which has the highest proportion of African Americans in Wisconsin, has the second highest hospitalization and ED visit rates for asthma in the state. The limited data available on Wisconsin’s Native American population indicate that this population is disproportionately affected by asthma as well. Native Americans in Wisconsin have the second highest asthma prevalence, nearly two times greater than whites. This group also has disparate rates of health care utilization for asthma. Menominee County, which is primarily composed of members of the Menominee Tribe, has the highest hospitalization and ED visit rates for asthma in the state. Kenosha, Lincoln, Racine, Rock and Sawyer Counties also have both asthma ED visit and asthma hospitalization rates that fall in the highest quartile of all counties in the state.
Significant progress remains to be achieved in assuring that people with asthma can properly manage and control their disease. Asthma symptoms are responsible for decreased quality of life, sleep disturbances and an inability to carry out one’s normal activities. Many persons with asthma do not report receiving influenza vaccines, visiting a doctor for routine asthma visits or having written asthma management plans. Limiting exposure to asthma triggers is also an important part of managing asthma, and exposure to environmental tobacco smoke (ETS) has been identified as both a cause
CONCLUSIONS

BURDEN OF ASTHMA IN WISCONSIN 201390
of asthma in children and an asthma trigger. Wisconsin public school children who are continuously exposed to ETS report higher asthma prevalence.
School interventions can play an important role in asthma management. While three-fourths of public secondary schools have adopted a policy that allows students to carry and administer their own asthma medications, survey data suggest that only half of the schools have implemented the policy. Approximately 61 percent of schools reported having an asthma action plan on file for all students with asthma. Data also suggest that there is need for intensive case management among students with asthma who are routinely absent from school. In addition, asthma education and training for staff in Wisconsin schools could be improved.
While the health impacts of poorly-managed asthma are the primary motivation for public health action, poorly-managed asthma takes a financial toll as well. In 2011, the total cost for asthma-related hospitalizations and ED visits exceeded $87.6 million. If minority populations had experienced asthma hospitalization at the same rate as non-Hispanic whites in 2011, there would have been 1,095 fewer asthma hospitalizations that year, resulting in a savings of approximately $13 million. Furthermore, 10 percent of the people who were hospitalized for asthma had an additional asthma hospitalization within the same year, resulting in excess costs of $9.1 million. Asthma-related hospitalizations and deaths are largely preventable events that could be avoided with proper prevention and management strategies. Better management of asthma would result in improved outcomes for patients as well as substantial savings in health care expenditures.
This document will serve as a foundation for prioritizing and tailoring future prevention and intervention efforts to reduce the burden of asthma in Wisconsin. In cooperation with the Centers for Disease Control and Prevention (CDC), DHS will continue to work with the Wisconsin Asthma Coalition (WAC) and stakeholders from around the state to create and implement strategies for reducing the burden of asthma in Wisconsin.
AppendicesConclusions

BURDEN OF ASTHMA IN WISCONSIN 2013 91
1. National Heart, Lung, and Blood Institute. 2007. Expert Panel Report 3 (EPR3): Guidelines for the diagnosis and management of asthma. National Institutes of Health, Bethesda, MD.
2. Centers for Disease Control and Prevention, Behavioral Risk Factor Surveillance System 2011 Survey Data and Documentation. Available at
http://www.cdc.gov/brfss/annual_data/annual_2011.htm. Accessed February 5, 2013.
3. Pearce N, Beasley R, Burgess C and Crane J. Asthma epidemiology and methods. New York, NY: Oxford University Press; 1998.
4. U.S. Department of Health and Human Services. National Center for Health Statistics. Healthy People 2020. Available at http://www.healthypeople.gov/2020/. Accessed February 4, 2013.
5. Wisconsin Department of Health Services. Wisconsin State Health Plan: Healthiest Wisconsin 2020. Available at http://www.dhs.wisconsin.gov/hw2020. Accessed March 11, 2013.
6. Wisconsin Asthma Coalition. Wisconsin Asthma Plan: Recommendations from the Wisconsin Asthma Coalition. 2003.
7. Centers for Disease Control: Comprehensive Plan for Epidemiologic Surveillance.
Atlanta, GA, Centers for Disease Control, 1986.
8. Boss L, Kreutzer R, Luttinger D, Leighton J, Wilcox K, Redd S. Public health surveillance of asthma. J Asthma 2001; 38:83-89.
9. National Health Interview Survey (NHIS), 2011 Lifetime and Current Asthma. Center for Disease Control and Prevention. Available at http://www.cdc.gov/asthma/nhis/2011/data.htm. Accessed February 5, 2013.
10. American Lung Association. Trends in Asthma Morbidity and Mortality, 2010. Epidemiology and Statistics Unit, Research and Program Services. Available at http://www.lungusa.org/finding-cures/our-research/trend-reports/asthma-trend-report.pdf. Accessed October 28, 2010.
11. Arif A, Delclos G, Lee E, Tortolero S, Whitehead L. Prevalence and risk factors of asthma and wheezing among US adults: an analysis of the NHANES III data. Eur Respir J 2003; 21:827-833.
12. Rhodes L, Moorman J, Redd S, Mannino D. Self-reported asthma prevalence and control among adults – US, 2001. MMWR 2003; 52 (17):381-384.
13. American Lung Association. Asthma and children fact sheet. 2012. Available at http://www.lung.org/lung-disease/asthma/resources/facts-and-figures/asthma-children-fact-sheet.html. Accessed April 23, 2013.
14. Williams D. Considerations in the long-term management of asthma in ambulatory patients. Am J Health Sys Pharm 2006; 63:S14-S21.
15. Camargo CA, Weiss ST, Zhang S, Willett WC, Speizer FE. Prospective study of body mass index, weight change, and risk of adult-onset asthma in women. Arch Intern Med 1999; 159(21):2582-8.
REFERENCES
BURDEN OF ASTHMA IN WISCONSIN 201392
16. Mannino DM, Mott J, Ferdinands JM, Camargo CA, Friedman M, Greves HM, Redd SC. Boys with high body masses have an increased risk of developing asthma: findings from the National Longitudinal Survey of Youth (NLSY). International Journal of Obesity 2006; 30:6-13.
17. Cesaroni G, Farchi S, Davoli M, Forastiere F, Perucci C. Individual and area-based indicators of socioeconomic status and childhood asthma. Eur Respir J 2003; 22:619-624.
18. Akerman M, Calacanis C, Madsen M. Relationship between asthma severity and obesity. J Asthma 2005; 41:521-526.
19. Mosen DM, Schatz M, Magid DJ, Camargo CA. The relationship between obesity and asthma severity and control in adults. Journal of Allergy and Clinical Immunology 2008; 122(3) 507-511.
20. Weisel C. Assessing Exposure to Air Toxics Relative to Asthma. Environ Health Persp 2002; 110:527-537.
21. CDC’s Advisory Committee on Immunization Practices (ACIP), CDC’s Advisory Committee on Immunization Practices Recommends Universal Annual Influenza Vaccination. February 24, 2010. Available at http://www.cdc.gov/media/pressrel/2010/r100224.htm. Accessed October 28, 2010.
22. Mannino DM, Homa DM, Akinbami LJ, Moorman JE, Gwynn C, Redd SC. Surveillance for asthma---United States, 1980--1999. In: CDC Surveillance Summaries, March 29, 2002. MMWR 2002; 51(No. SS-1):1-13.
23. Centers for Disease Control and Prevention. Division of Adolescent and School Health. Addressing asthma within schools, July 2004. Available at
http://www.cdc.gov/HealthyYouth/asthma/. Accessed October 28, 2010.
24. Ford E, Mannino D, Homa D, Gwynn C, Redd S, Moriarty D, Mokdad A. Self-reported asthma and health-related quality of life: Findings from the behavioral risk factor surveillance system. Chest 2003; 123 (1):119-127.
25. Strine T, Ford E, Balluz L, Chapman D, and Mokdad A. Behaviors and Health-Related Quality of Life Among Adults With Asthma. Chest 2004; 126(6):1849-1854.
26. American Thoracic Society. Guidelines for assessing and managing asthma risk at work, school, and recreation. Am J Respir Crit Care Med 2004; 169:873–881.
27. Saarinen K, Karjalainen A, Martikainen R, Uitti J, Tammilehto L, Klaukka T, and Kurppa K. Prevalence of work-aggravated symptoms in clinically established asthma. Eur Respir J 2003; 22:305–309.
28. Oguss M, Rogers P, Anderson H. Occupational Respiratory Health: A survey of Wisconsin workers who wear respirators. Wisconsin Medical Journal 2010; 109(3):130-135.
29. National Heart, Lung and Blood Institute Chartbook, U.S. Department of Health and Human Services, National Institute of Health, 2009.
30. Braman S. The global burden of asthma. Chest 2006; 130:4S-12S.
AppendicesReferences
BURDEN OF ASTHMA IN WISCONSIN 2013 93
31. Wang L, Zhong Y, Wheeler L. Direct and indirect costs of asthma in school-age children. Prev Chronic Dis 2005; 2(1):A11.
32. Moorman JE, Akinbami LJ, Bailey CM, et al. National Surveillance of Asthma: United States, 2001-2010. National Center for Health Statistics. Vital Health Stat 3(35). 2012.
33. Wisconsin Department of Health Services. Burden of Asthma in Wisconsin 2010.
34. National Center for Health Statistics (NCHS). National Hospital Discharge Survey 2009 public use data file documentation. Hyattsville, MD: NCHS, Centers for Disease Control and Prevention. Available at http://www.cdc.gov/nchs/data/nhds/2average/2009ave2_dischargessex.pdf. Accessed April 5, 2013.
35. Hoppin P, Jacobs M, Stillman L. Investing in Best Practices for Asthma: A Business
Case for Education and Environmental Interventions. Asthma Regional Council of New England. Boston, MA. 2007.
36. Centers for Disease Control and Prevention. Recommended adult immunization schedule—United States, 2010. MMWR 2010;59(1).
37. Akinbami L. The state of childhood asthma, United States, 1980-2005. Advanced data from vital and health statistics. National Center for Health Statistics. 2006; 381:1-24.
38. Wisconsin Department of Health Services. Burden of Asthma in Wisconsin 2004.
39. Wisconsin Department of Health Services. ForwardHealth: Wisconsin Medicaid, April 2013. Available at http://www.dhs.wisconsin.gov/medicaid/. Accessed April 16, 2013.
40. Wisconsin Department of Health Services. Wisconsin Medicaid and BadgerCare Update – January 2008. Available at http://www.dhs.wisconsin.gov/em/CustomerHelp/updates/pdf/phc1400.pdf. Accessed October 28, 2010.
41. Wisconsin Department of Health Services. BadgerCare Plus - A ForwardHealth Program. Available at http://www.badgercareplus.org/index.htm. Accessed April 16, 2013.
42. Wisconsin Department of Health Services. Wisconsin Forwardhealth, January 2013. Available at https://www.forwardhealth.wi.gov/WIPortal/portals/0/staticContent/Member/
caseloads/481-caseload.htm Accessed April 17, 2013.
43. National Committee for Quality Assurance. HEDIS 2007 Volume 2: Technical Specifications.Washington, DC: National Committee for Quality Assurance, 2006.
44. National Committee for Quality Assurance. HEDIS 2008 Volume 2: Technical Specifications.Washington, DC: National Committee for Quality Assurance, 2007.
45. National Center for Health Statistics (NCHS). National Ambulatory Care Medical Survey 2010. Hyattsville, MD: NCHS, Centers for Disease Control and Prevention.
AppendicesReferences

BURDEN OF ASTHMA IN WISCONSIN 201394
46. Wisconsin Department of Health Services. Wisconsin WIC Program, October 2010. Available at http://www.dhs.wisconsin.gov/wic/index.htm. Accessed March 6, 2013.
47. Schenker N and Gentleman J. On judging the significance of differences by examining the overlap between confidence intervals. The American Statistician 2001; 55(3):182-186.
48. Hamilton B, Sutton P, Ventura S. Revised birth and fertility rates for the 1990s and new rates for Hispanic populations, 2000 and 2001: United States. National vital statistics reports 2003; 51(12).
AppendicesReferences

BURDEN OF ASTHMA IN WISCONSIN 2013 95
AppendicesTECHNICAL NOTES
Report Terminology
Confidence Interval: The confidence interval is a measure of the precision of an estimate. The estimate becomes less precise as the confidence interval widens. The interpretation of the 95 percent confidence interval is that there is a 95 percent chance that the true value of the estimate falls within the range of the interval.
Current Asthma Prevalence: The proportion of the population that reports currently having asthma. This is a subset of the population that has ever been diagnosed with asthma. People can be diagnosed with asthma but may no longer have an active form of the disease.
Lifetime Asthma Prevalence: The proportion of the population that has ever been diagnosed with asthma.
Prevalence: The total number of people in a population who have a certain disease at a specified time or period of time. Prevalence may be expressed as a proportion or percentage of the population.
Rate Calculations
Rates are used throughout this report to measure the burden of asthma. A rate is a ratio of the health events (in this case, asthma-related events) in a given population to the number of people in that population who can experience the health event within a specified time period.
In this report, only events occurring among Wisconsin residents were used to calculate rates. Deaths of Wisconsin residents that occur in other states are reported to the Wisconsin Vital Records office and thus, are included in these rate calculations. Because hospitalizations and emergency department visits of Wisconsin residents occurring in other states are not reported (with the exception of Minnesota), they are not included in rate calculations. As a result, hospitalization rates for WI counties bordering MI, IL and IA are likely underestimated. All events that occurred in Wisconsin to non-Wisconsin residents were excluded in rate calculations.
Bridged-race census estimates available from the National Center for Health Statistics (http://www.cdc.gov/nchs/nvss/bridged_race.htm#data) were used to estimate the annual Wisconsin population for the years 1990 to 2011. These census estimates are from July 1st of each calendar year. These population estimates were used as the denominator when calculating asthma hospitalization, emergency department visit and mortality rates.
Risk-based rates, or rates of ED visits, hospitalizations or asthma deaths per population with current asthma, were calculated using denominators from BRFSS (i.e., the number of adults in Wisconsin with current asthma for each year).
A crude rate is the number of events that occur in a group divided by the population of that particular group. Unless otherwise notedUSn this report, rates presented for specific age groups are crude rates. When rates for all ages combined are presented, rates are age-adjusted to account for any differences in the age distribution between populations. Rates were age-adjusted using the direct method by applying the age-
BURDEN OF ASTHMA IN WISCONSIN 201396
Technical Notes
specific rates in the population of interest in Wisconsin to the 2000 U.S. standard population. Age-adjusted rates should be viewed as relative indexes rather than exact rates. Additional information on age-adjustment is available at: http://www.cdc.gov/nchs/data/statnt/statnt20.pdf.
In this report, the age categories used to present most age-specific rates (0-4, 5-14, 15-34, 35-64 and 65 and older) were chosen to allow for comparisons with national asthma surveillance data.22 Overall rates were directly age-adjusted using the age groups listed in Table 1, Appendix E.
Rates based on small numbers can be variable. For example, if 5 deaths occur in a population of one million in a year and 10 deaths occur the next year, the rate changes by 100 percent from one year to the next. If, instead, 500 deaths occurred in a population of one million in a year and 505 deaths occur the next year, the rate changes by only 1 percent even though the difference in the number of deaths (5) is the same. As illustrated, changes in rates based upon a small number of events should be interpreted with caution. In this report, where necessary, years of data have been combined to decrease rate variability due to small numbers of asthma events in a given location or time.
Determination of Statistical Significance
Determination of statistical significance for data in this report is based on non-overlapping 95 percent confidence intervals (95% CI) when the rate was based on less than 100 events. Although this is not strictly speaking a statistical test, it is a commonly accepted way to compare estimates. It has been noted to be more conservative than formal statistical testing.47 When the rate was based on 100 or more events, the difference between the two rates was calculated (subtracting the lower rate from the higher rate). If the difference exceeded the statistic from the formula below, then the difference was considered statistically significant at the 95 percent confidence interval.
= 1.96 * √ ((R1)2/ N1 + (R2)
2/ N2)
Where R1 = 1st rateR2 = 2nd rateN1 = number of events from the 1st rate N2 = number of events from the 2nd rate
Confidence Interval Calculations
The method used to calculate 95 percent confidence intervals (95% CI) for rates was based on those used by the National Center for Health Statistics in their vital statistics reports.48 95 percent confidence intervals for age-specific and age-adjusted rates were calculated in the following way:
When the rate is based on 100 or more events, the following formula was used:Lower limit = R – (1.96* R/√B)Upper limit = R + (1.96* R/√B)
Where R = the rate B = the number of hospitalizations, emergency department visits, or deaths
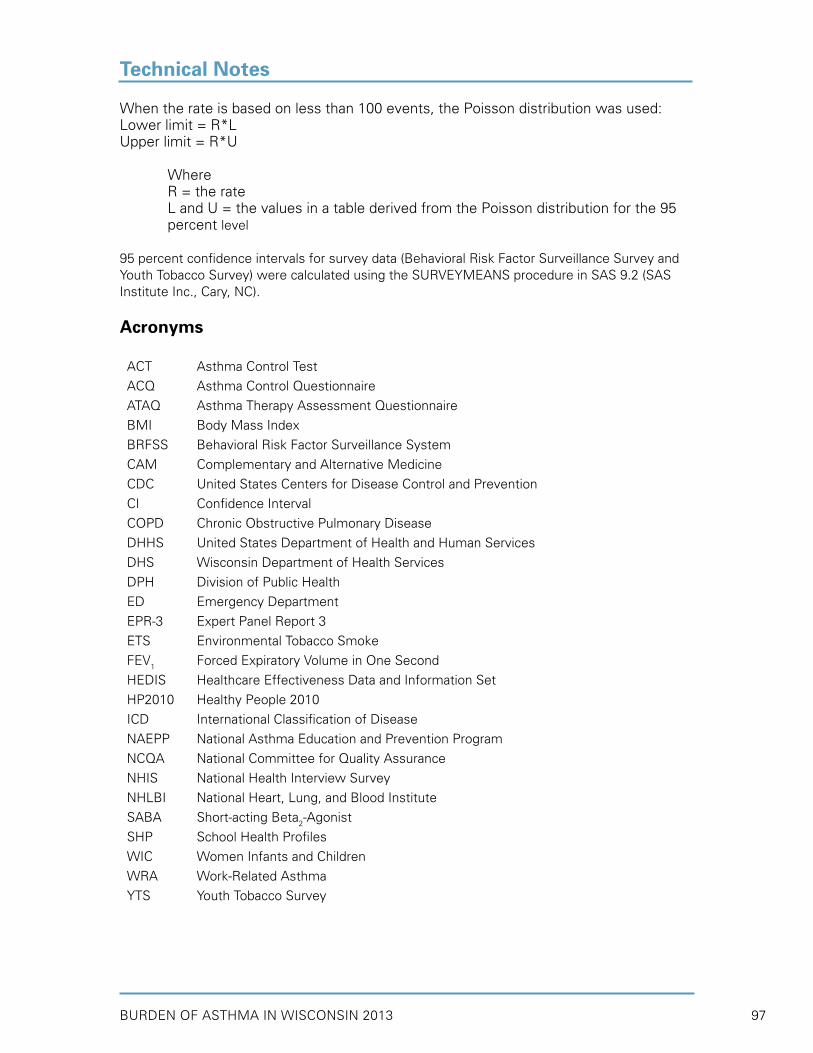
BURDEN OF ASTHMA IN WISCONSIN 2013 97
AppendicesTechnical Notes
When the rate is based on less than 100 events, the Poisson distribution was used:Lower limit = R*LUpper limit = R*U
Where R = the rate L and U = the values in a table derived from the Poisson distribution for the 95 percent level
95 percent confidence intervals for survey data (Behavioral Risk Factor Surveillance Survey and Youth Tobacco Survey) were calculated using the SURVEYMEANS procedure in SAS 9.2 (SAS Institute Inc., Cary, NC).
Acronyms
ACT Asthma Control Test
ACQ Asthma Control Questionnaire
ATAQ Asthma Therapy Assessment Questionnaire
BMI Body Mass Index
BRFSS Behavioral Risk Factor Surveillance System
CAM Complementary and Alternative Medicine
CDC United States Centers for Disease Control and Prevention
CI Confidence Interval
COPD Chronic Obstructive Pulmonary Disease
DHHS United States Department of Health and Human Services
DHS Wisconsin Department of Health Services
DPH Division of Public Health
ED Emergency Department
EPR-3 Expert Panel Report 3
ETS Environmental Tobacco Smoke
FEV1 Forced Expiratory Volume in One Second
HEDIS Healthcare Effectiveness Data and Information Set
HP2010 Healthy People 2010
ICD International Classification of Disease
NAEPP National Asthma Education and Prevention Program
NCQA National Committee for Quality Assurance
NHIS National Health Interview Survey
NHLBI National Heart, Lung, and Blood Institute
SABA Short-acting Beta2-Agonist
SHP School Health Profiles
WIC Women Infants and Children
WRA Work-Related Asthma
YTS Youth Tobacco Survey

BURDEN OF ASTHMA IN WISCONSIN 201398
APPENDICES
Appendix A. Data Sources
Behavioral Risk Factor Surveillance System (BRFSS)
The Wisconsin Behavioral Risk Factor Surveillance System (BRFSS) is an annual, statewide telephone survey of a random sample of Wisconsin household residents aged 18 and older which produces estimates representative of the non-institutionalized population living in Wisconsin. The Wisconsin BRFSS is part of the national BRFSS, which is coordinated by the U.S. Centers for Disease Control and Prevention (CDC). Every state health department, the District of Columbia and three U.S. territories conduct a survey as part of the system to measure adult health risk behaviors and attitudes and the use of preventive health services. The CDC has included questions on asthma prevalence on the BRFSS since 1999.
Currently there are two questions on the Wisconsin BRFSS core module that are asked among adults every year by all states. In addition, there are some optional modules which states may elect to administer, including the childhood asthma module (which included questions about asthma in children living in the household with the adult survey respondent) and the asthma history module (used to obtain information on risk factors associated with asthma). In 2006 the asthma history module was discontinued with the addition of the adult and child call-back surveys. Individuals who participate in the BRFSS and indicate that they have asthma are called back for a more comprehensive survey about their asthma (see BRFSS Asthma Callback Survey below). Wisconsin DHS has supported the BRFSS core adult prevalence module since 1999, the childhood asthma prevalence module since 2002 and the adult history module from 2002-2005. Both the adult and child call-back surveys have been administered in Wisconsin since 2006. In 2011, BRFSS survey methodology was changed to include both landline telephone and cell/mobile phone users. These data also reflect a change in weighting methodology (raking) to adjust for differences between the demographic characteristics of respondents and the target. For these reasons, estimates from 2011 cannot accurately be compared to data from prior years, and any trend analysis presented in this report corresponds to data through 2010 only.
While the BRFSS is a useful means of estimating the prevalence of asthma, it does have some limitations. Current BRFSS data represent only the non-institutionalized, civilian population who has access to a landline telephone. As a result, the actual prevalence of asthma in the population is probably underestimated. Responses are self-reported by respondents and may be subject to recall bias. In addition, individuals with symptoms of asthma who may never have been diagnosed by a physician or healthcare provider are not counted.
BRFSS Asthma Callback Survey
In 2006, Wisconsin began conducting the adult and child asthma call-back surveys, in which adults and children who were identified in the BRFSS as having lifetime asthma were invited to participate in an additional survey to provide in-depth information about their asthma history. This “call-back” survey includes detailed questions about symptoms, medication usage, health care utilization, asthma self-management knowledge, household environmental exposures, and work-related asthma and comorbid conditions. Five years of call-back data (2006-2010) were combined for

BURDEN OF ASTHMA IN WISCONSIN 2013 99
AppendicesAppendices
analyses in order to generate more stable estimates for subgroup comparisons among both adults and children.
For all BRFSS analyses, any responses where the respondent answered “Don’t Know/Not Sure” and “Refused” were coded as missing and not included in estimating response rates.
Death Records
Death certificates for deaths occurring in Wisconsin are collected by the Vital Records Unit, in the Office of Health Informatics (WI DPH, DHS). The death certificates are submitted by the 72 County Register of Deeds offices and by two city health offices (West Allis and Milwaukee). Deaths of Wisconsin residents that occur in other states and countries are recorded by those governments and submitted to the Wisconsin Vital Records Unit.
In 1999, the coding system used to classify causes of death changed to a newer version (from the International Classification of Diseases-9 (ICD-9) to ICD-10). Due to this change in coding, rates in 1998 and before are not directly comparable to those in 1999 and after. Mortality data were available for analysis through 2011.
Hospital Emergency Department Visits
In 2002, the Bureau of Health Information and Policy (WI DPH, DHS) began collecting data on emergency department (ED) visits from Wisconsin hospitals. In October of 2003, the Wisconsin Hospital Association assumed the collection of ED data, which is made available through the Office of Health Informatics (OHI) in the WI DPH. Information on race and ethnicity is not available in ED data. The zip code collected is used to determine county of residence. If a zip code straddled county boundaries, the patients from that zip code area were randomly allocated to a county based on a probability equal to the proportion of the zip code area’s population in each county.
Approximately 3 percent of asthma hospital ED visits each year in Wisconsin are for patients who report out-of-state zip codes. These ED visits as well as those with a missing or invalid zip code were not included in rates for this report. All asthma hospital ED visit rates presented in this report are for Wisconsin residents only. OHI (WI DPH) recently obtained data for Wisconsin residents who were seen in Minnesota hospital emergency departments and made these data available for DHS use. Events in which Wisconsin residents received medical care in out-of-state facilities, with the exception of MN hospitals, were not included in these rates. As a result, ED visit rates for WI counties bordering MI, IL and IA are likely underestimated. It is important to note that rates are based on the number of asthma hospital ED visits (principal diagnosis ICD-9-CM codes 493.00 - 493.92) and not the number of people with asthma hospital ED visits. ED visit data were available for analysis through 2011.
Inpatient Hospitalizations
Inpatient hospitalization data have been available in Wisconsin since 1989 from the Bureau of Health Information and Policy (WI DPH, DHS). In October of 2003, the collection of inpatient hospitalization data was transferred to the Wisconsin Hospital
BURDEN OF ASTHMA IN WISCONSIN 2013100
AppendicesAppendices
Association. Data are reported by all of Wisconsin’s acute care, non-federal hospitals. Zip code information collected was used to determine county of residence. If a zip code straddled county boundaries, the patients from that zip code area were randomly allocated to a county based on a probability equal to the proportion of the zip code area’s population in each county.
It is important to note that rates are based on the number of hospitalizations and not the number of individuals admitted to hospitals with asthma as the principal diagnosis (ICD-9-CM codes 493.00 - 493.92). Hospitalization events for individual patients are discussed in the section “Repeat Hospitalization Events.” Approximately 2 percent of all asthma hospitalizations each year are for non-Wisconsin residents (as determined by patient zip code data) or were missing zip codes. All asthma hospitalization rates presented in this report are for Wisconsin residents only. OHI (WI DPH) recently obtained data for Wisconsin residents who were hospitalized in Minnesota and made these data available for DHS use. Events in which Wisconsin residents received medical care in out-of-state facilities, with the exception of MN hospitals, were not included in these rates. As a result, hospitalization rates for WI counties bordering MI, IL and IA are likely underestimated. Hospitalization data were available for analysis through 2011.
Medicaid
Medicaid is a federal and state-sponsored program designed to provide health care and health-related services for people with disabilities, and low-income individuals including adults aged 65 years or older, children and their caretakers and pregnant women. In Wisconsin, two government-sponsored plans provide health care for these individuals. Wisconsin Medicaid is a plan which provides health care for people who are elderly, blind or disabled.38 BadgerCare Plus replaced family Medicaid, BadgerCare and Healthy Start Programs in February 2008. This new health care program was designed to expand coverage to all uninsured children and more pregnant women. BadgerCare Plus provides health coverage to low-income pregnant women, adults without dependent children and uninsured families with children under the age of 19 who are not eligible for Medicare.39 For purposes of this report, these government health plans in Wisconsin will be referred to collectively as Medicaid. The Wisconsin Department of Health Services oversees this program in Wisconsin.
Since the Medicaid program pays for the health care of its recipients, detailed information on procedures, outpatient visits, hospitalizations and filled prescription medications is maintained by the program for the purpose of reimbursement. This report presents data related to asthma health care utilization within the Medicaid population from 2007-2011.
National Health Interview Survey, 2011
The National Health Interview Survey (NHIS) has monitored the health of the nation since 1957. NHIS data, on a broad range of health topics, are collected through personal household interviews. For over 50 years, the U.S. Census Bureau has been the data collection agent for the National Health Interview Survey. Survey results have been instrumental in providing data to track health status, health care access and progress toward achieving national health objectives.

BURDEN OF ASTHMA IN WISCONSIN 2013 101
AppendicesAppendices
NHIS is a multistage probability sample survey conducted annually by interviewers of the U.S. Census Bureau for the CDC’s National Center for Health Statistics and is representative of the civilian non-institutionalized population of the United States. Data are collected for all family members during face-to-face interviews with adults present at the time of interview. Additional information about children is collected for one randomly selected child per family in face-to-face interviews with an adult proxy respondent familiar with the child’s health.
School Health Profile
The School Health Profile (SHP) in Wisconsin is conducted by the Wisconsin Department of Public Instruction and is used to monitor characteristics and assess trends in health education and policies in public middle/junior high and high schools. The survey is developed and supported by the CDC Division of School and Adolescent Health (DASH) Program.
The first Wisconsin SHP survey was conducted in 1994 and administration was repeated every other year. All regular public secondary schools serving at least one of grades 6 though 12 are included in the school sampling frame. The survey has two sets of questionnaires - one for the school principal and the other for the lead health teacher from each school included in the sample. Asthma policy questions were included on SHP surveys. Results reported here are from the 2008, 2010 and 2012 SHP principal surveys. In 2012, 72 percent of randomly selected public middle and high school principals (302 out of 420) completed the WI SHP.
Wisconsin Women, Infants and Children (WIC) Program
WIC is a federally-funded nutrition program for women, infants and children. WIC provides direct financial assistance to buy nutritious foods as well as nutrition education, breastfeeding support and health care referrals to low-income pregnant women, new mothers up to 12 months after giving birth (postpartum women) and children up to five years of age. To be eligible for WIC benefits in Wisconsin, pregnant women, postpartum breastfeeding and non-breastfeeding women and infants and children under age five must meet income guidelines and have a health or nutrition need. In Wisconsin, the WIC program provides services to approximately 120,000 women, infants and children each year. The Medicaid and WIC groups overlap substantially and reflect a low-income population. This report presents asthma prevalence data within the WIC population as of October 2012.
Youth Tobacco Survey
The Wisconsin Youth Tobacco Survey (YTS) is a comprehensive measure of youth awareness, attitudes and related behaviors about tobacco use in Wisconsin. The purpose of this survey is to monitor trends of these attitudes and behaviors to assist in improving youth programs and initiatives. It is a nationwide survey coordinated by the CDC that was first administered in Wisconsin in the academic year 1999-2000. In Wisconsin, the survey is coordinated by the Bureau of Community Health Promotion in the Wisconsin Department of Health Services. In Wisconsin, the survey has been continued on an annual basis in public middle school youth and biennially in public high school youth. The 2003 YTS, for the first time, included two asthma-related
BURDEN OF ASTHMA IN WISCONSIN 2013102
AppendicesAppendices
questions. The YTS randomly samples from all eligible public schools in the state. All students in the selected classes were eligible to participate in the survey. The survey is administered during the spring semester of each academic year. YTS conducted a survey in 2012; however, the two asthma questions were not included in this year. The asthma questions are expected to be added back to the 2014 YTS. Therefore, data in this report is from the 2008 and 2010 YTS, which included both public middle and high schools. The overall middle school response rate for the 2008 YTS was 76 percent; a total of 1,571 of the 1,720 sampled students completed the survey. The overall middle school response rate for the 2010 YTS was 90 percent; a total of 1,896 of the 2,051 sampled students completed the survey. The overall high school response rate for the 2008 YTS was 82 percent; a total of 1,913 of the 2,158 sampled students completed the survey. The overall high school response rate for the 2010 YTS was 86 percent; a total of 1,758 of the 1,971 sampled students completed the survey.

BURDEN OF ASTHMA IN WISCONSIN 2013 103
Appendices
Appendix B. Detailed Data Tables
Table 1. Number of Asthma* Emergency Department Visits by Year, Age and Sex, Wisconsin 2002-2011
2002 2003 2004 2005 2006 2007 2008 2009 2010 2011
Age (years)
0-4 3,083 3,067 3,072 3,137 3,088 2,875 2,694 2,681 2,918 2,631
5-14 4,102 4,179 3,795 3,713 3,586 3,344 3,426 3,859 3,633 3,374
15-34 7,691 8,275 7,188 7,365 6,602 7,140 6,744 7,213 6,751 6,178
35-64 6,486 6,590 6,416 6,578 6,091 6,308 6,562 6,589 6,407 6,339
≥ 65 994 956 976 1,072 983 987 1,106 940 948 1,026
Sex
Male 10,182 10,391 9,791 9,915 9,321 9,422 9,326 9,633 9,330 9,007
Female 12,174 12,676 11,656 11,950 11,029 11,232 11,206 11,649 11,327 10,541
Total 22,356 23,067 21,447 21,865 20,350 20,654 20,532 21,282 20,657 19,548
*Asthma listed as the principal diagnosis (ICD-9-CM codes 493.00 - 493.92)Data Source: Emergency department visit discharge file
Table 2. Number of Asthma* Hospitalizations by Year, Age, Sex and Race/Ethnicity, Wisconsin 2002-2011
2002 2003 2004 2005 2006 2007 2008 2009 2010 2011Age (years)0-4 959 1,098 995 1,020 940 820 738 798 828 695
5-14 670 779 637 732 656 584 575 693 628 551
15-34 739 866 693 653 557 588 589 605 490 439
35-64 1,894 2,165 2,019 2,032 1,849 1,943 2,160 2,110 1,898 1,970
≥ 65 971 1,175 1,075 1,169 1,048 1,057 1,314 1,204 1,105 1,091
Sex
Male 2,083 2,399 2,136 2,293 2,034 1,931 2,002 2,141 1,983 1,875
Female 3,150 3,684 3,283 3,313 3,016 3,061 3,374 3,269 2,966 2,871
Race/ Ethnicity
White 3,331 3,889 3,535 3,309 2,958 3,175 3,494 3,371 3,019 2,919
African American 1,321 1,534 1,276 1,224 1,135 1,195 1,194 1,297 1,195 1,131
American Indian 65 68 70 59 64 65 60 66 73 78
Asian 50 38 39 36 38 50 45 41 57 56
Other 58 44 53 54 55 40 57 53 42 54
Hispanic 163 189 193 204 231 259 295 303 308 299
Total 5,233 6,083 5,419 5,606 5,050 4,992 5,376 5,410 4,949 4,746
*Asthma listed as the principal diagnosis (ICD-9-CM codes 493.00 - 493.92)
Data Source: Inpatient hospitalization discharge file

BURDEN OF ASTHMA IN WISCONSIN 2013104
AppendicesAppendices
Appendix C. Table of County-Specific Data
Emergency department visit and hospitalization rates by county are summarized in Table 1. Ranks for each county by rate are presented, with a lower rank signifying a higher rate in that county. For example, Milwaukee had the highest ED visit rate by county from 2009-2011 and thus was assigned an ED visit county rank of one.
Table 1. Hospitalization and Emergency Department Visit Rates and County Ranks, 72 Wisconsin Counties, 2009-2011.
County ED Visit Rateper 10,000 (95% CI)
2009-2011
ED VisitCounty Rank
Hospitalization Rateper 10,000 (95% CI)
2009-2011
HospitalizationCounty Rank
ADAMS 39.33 (33.66 - 44.99) 17 4.02 (2.60 - 5.93) 63
ASHLAND 23.44 (18.96 - 27.92) 53 7.60 (5.35 - 10.48) 22
BARRON 34.87 (31.57 - 38.18) 23 5.51 (4.36 - 6.87) 45
BAYFIELD 27.90 (22.49 - 33.31) 37 5.77 (3.86 - 8.29) 43
BROWN 39.51 (38.07 - 40.95) 16 6.67 (6.08 - 7.25) 33
BUFFALO 27.74 (22.53 - 32.95) 38 2.71† (1.48 - 23.49) 69
BURNETT 32.14 (26.27 - 38.01) 31 6.90 (4.83 - 9.55) 28
CALUMET 11.58 (9.78 - 13.38) 70 1.72 (1.11 - 2.53) 71
CHIPPEWA 23.09 (20.85 - 25.34) 55 9.23 (7.88 - 10.57) 10
CLARK 21.88 (18.98 - 24.78) 58 7.90 (6.34 - 9.72) 19
COLUMBIA 26.66 (24.10 - 29.22) 45 7.73 (6.46 - 8.99) 21
CRAWFORD 29.59 (24.44 - 34.74) 34 5.24 (3.39 - 7.73) 48
DANE 19.90 (19.17 - 20.63) 64 7.80 (7.34 - 8.26) 20
DODGE 36.62 (34.25 - 38.98) 21 6.69 (5.73 - 7.64) 32
DOOR 25.92 (22.03 - 29.80) 46 5.05 (3.63 - 6.85) 51
DOUGLAS 46.32 (42.55 - 50.09) 9 5.49 (4.31 - 6.91) 46
DUNN 23.25 (20.55 - 25.95) 54 8.77 (7.08 - 10.46) 15
EAU CLAIRE 26.83 (24.90 - 28.76) 43 7.36 (6.38 - 8.35) 26
FLORENCE * 72 0.00 (0.00 - 0.00) 72
FOND DU LAC 24.78 (22.96 - 26.60) 50 4.05 (3.35 - 4.75) 62
FOREST 32.87 (25.71 - 40.03) 29 8.00 (5.18 - 11.81) 18
GRANT 27.38 (24.60 - 30.16) 42 4.34 (3.35 - 5.53) 58
GREEN 25.43 (22.29 - 28.58) 48 9.12 (7.41 - 10.83) 11
GREEN LAKE 40.23 (34.76 - 45.70) 14 3.03 (1.85 - 4.68) 68
IOWA 17.39 (14.18 - 20.60) 67 4.82 (3.41 - 6.61) 55
IRON 8.29† (3.97 - 15.24) 71 4.90† (2.24 - 17.08) 53
JACKSON 34.40 (29.62 - 39.17) 24 6.09 (4.33 - 8.32) 40
JEFFERSON 26.69 (24.62 - 28.75) 44 5.65 (4.73 - 6.56) 44
JUNEAU 36.98 (32.58 - 41.39) 19 9.95 (8.03 - 12.19) 8
KENOSHA 54.43 (52.37 - 56.48) 4 12.97 (11.98 - 13.96) 3
KEWAUNEE 20.18 (16.41 - 23.95) 63 2.39† (1.34 - 24.74) 70
LA CROSSE 21.67 (20.08 - 23.27) 59 4.95 (4.17 - 5.72) 52
LAFAYETTE 24.63 (20.07 - 29.19) 51 4.12 (2.52 - 6.37) 61
LANGLADE 45.42 (39.64 - 51.21) 10 6.65 (4.75 - 9.06) 34
LINCOLN 45.38 (40.54 - 50.22) 11 12.29 (9.96 - 14.62) 4
MANITOWOC 36.21 (33.67 - 38.74) 22 5.07 (4.20 - 5.95) 50

BURDEN OF ASTHMA IN WISCONSIN 2013 105
AppendicesAppendices
MARATHON 23.71 (22.16 - 25.26) 52 8.24 (7.38 - 9.10) 16
MARINETTE 33.71 (30.24 - 37.17) 27 9.10 (7.56 - 10.64) 12
MARQUETTE 27.51 (22.40 - 32.63) 41 6.40 (4.22 - 9.31) 38
MENOMINEE 98.30 (81.78 - 114.82) 1 19.25 (12.68 - 28.00) 1
MILWAUKEE 80.02 (78.98 - 81.06) 2 18.17 (17.67 - 18.67) 2
MONROE 38.00 (34.58 - 41.43) 18 4.83 (3.75 - 6.12) 54
OCONTO 25.45 (22.29 - 28.60) 47 4.62 (3.46 - 6.04) 57
ONEIDA 32.97 (29.05 - 36.88) 28 6.96 (5.53 - 8.66) 27
OUTAGAMIE 21.93 (20.65 - 23.21) 57 3.97 (3.43 - 4.50) 65
OZAUKEE 14.31 (12.78 - 15.85) 69 5.30 (4.41 - 6.20) 47
PEPIN 29.34 (22.44 - 37.69) 35 11.94 (8.17 - 16.86) 5
PIERCE 29.07 (25.94 - 32.20) 36 9.01 (7.27 - 10.75) 13
POLK 30.94 (27.81 - 34.08) 33 10.37 (8.67 - 12.08) 7
PORTAGE 19.05 (17.19 - 20.92) 65 6.44 (5.32 - 7.55) 37
PRICE 36.96 (30.43 - 43.49) 20 5.20 (3.39 - 7.61) 49
RACINE 48.53 (46.72 - 50.35) 7 10.65 (9.82 - 11.48) 6
RICHLAND 27.58 (22.93 - 32.23) 40 6.81 (4.93 - 9.18) 29
ROCK 45.17 (43.23 - 47.11) 12 9.94 (9.07 - 10.81) 9
RUSK 34.00 (28.22 - 39.77) 26 4.18 (2.55 - 6.45) 59
SAUK 34.04 (31.27 - 36.81) 25 5.94 (4.85 - 7.03) 42
SAWYER 59.12 (51.73 - 66.50) 3 8.89 (6.58 - 11.76) 14
SHAWANO 41.12 (37.39 - 44.86) 13 7.58 (6.16 - 9.23) 23
SHEBOYGAN 22.72 (21.07 - 24.36) 56 3.90 (3.26 - 4.54) 66
ST. CROIX 20.79 (18.99 - 22.58) 62 6.49 (5.49 - 7.49) 36
TAYLOR 20.97 (17.30 - 24.65) 61 6.55 (4.76 - 8.79) 35
TREMPEALEAU 21.51 (18.28 - 24.75) 60 6.04 (4.55 - 7.87) 41
VERNON 40.02 (35.77 - 44.27) 15 3.98 (2.88 - 5.36) 64
VILAS 50.26 (43.81 - 56.71) 5 7.52 (5.70 - 9.74) 24
WALWORTH 31.06 (29.01 - 33.10) 32 6.74 (5.81 - 7.66) 30
WASHBURN 49.51 (42.56 - 56.46) 6 7.38 (5.25 - 10.09) 25
WASHINGTON 17.19 (15.84 - 18.54) 68 6.30 (5.51 - 7.08) 39
WAUKESHA 18.17 (17.35 - 18.98) 66 6.70 (6.24 - 7.16) 31
WAUPACA 47.46 (43.92 - 51.00) 8 4.81 (3.82 - 5.98) 56
WAUSHARA 32.22 (27.83 - 36.60) 30 3.87 (2.57 - 5.60) 67
WINNEBAGO 24.97 (23.56 - 26.38) 49 4.15 (3.59 - 4.72) 60
WOOD 27.66 (25.35 - 29.98) 39 8.12 (6.97 - 9.27) 17
WISCONSIN OVERALL 37.75 (37.45 - 38.05) 8.72 (8.58 - 8.86)
*Rates based on less than 5 visits are suppressed†Rates are based on less than 20 visits and should be interpreted with cautionData Source: 2009-2011 Wisconsin Emergency Department Visit and Inpatient Hospitalization Files

BURDEN OF ASTHMA IN WISCONSIN 2013106
AppendicesAppendices
Appendix D. 2006 National Center for Health Statistics (NCHS) Urban-Rural Classification The NCHS has developed a six level urban/rural classification scheme as a method for studying the effect of urban versus rural environments on the health of individuals. Using this method, every county in the nation is given a classification based on three factors including:
The 2003 Office of Management and Budget (OMB) definitions of metropolitan and nonmetropolitan counties (with revisions through 2005)
The Rural-Urban Continuum Codes and the Urban Influence Codes classifications developed by the Economic Research Service of the U.S. Department of Agriculture
County-level data on several variables from Census 2000 and 2004 postcensal population estimates
The classification system divides counties into one of six categories, four metropolitan and two nonmetropolitan (Table 1). The most urban category consists of large metropolitan central counties and the most rural category consists of nonmetropolitan noncore counties. Figure 1 shows the classification of Wisconsin’s 72 counties according to the NCHS urban/rural classification system. Asthma prevalence, hospitalization, emergency department and mortality rates were calculated for Wisconsin according to this six category system to examine differences in asthma outcomes based on geography.
Table 1. Classification Rules Used to Assign Counties to the Six Urbanization Levels of the 2006 NCHS Urban-Rural Classification
Urban-rural category Classification rules
Metropolitan
Large central metro1
Counties in a metropolitan statistical area of 1 million or more population:1) that contain the entire population of the largest principal city of the metropolitan statistical area, or 2) whose entire population resides in the largest principal city of the metropolitan statistical area, or 3) that contain at least 250,000 of the population of any principal city in the metropolitan statistical area
Large fringe metroCounties in a metropolitan statistical area of 1 million or more population that do not qualify as large central
Medium metro Counties in a metropolitan statistical area of 250,000 to 999,999 population
Small metro Counties in a metropolitan statistical area of 50,000 to 249,999 population
Nonmetropolitan
Micropolitan Counties in a micropolitan statistical area
Noncore Counties that are neither metropolitan nor micropolitan
1There must be at least one large central county in each large metro areaData Source: 2006 NCHS Urban-Rural Classification Scheme for Counties Online: http://www.cdc.gov/nchs/data_access/urban_rural.htm

BURDEN OF ASTHMA IN WISCONSIN 2013 107
AppendicesAppendices
Figure 1. Classification of Wisconsin Counties using the 2006 NCHS Urban-Rural Classification
Data Source: 2006 NCHS Urban-Rural Classification Scheme for Counties Online: http://www.cdc.gov/nchs/data_access/urban_rural.htm
Urban/Rural Classification
Large Central Metro
Large Fringe Metro
Medium Metro
Small Metro
Micropollitan
Noncore

BURDEN OF ASTHMA IN WISCONSIN 2013108
AppendicesAppendices
Appendix E. Population Distribution of Wisconsin
According to the 2010 U.S. Census, the Wisconsin population was 5,686,986 persons. Although white persons continue to make up the majority of Wisconsin’s population, there has been a large increase in the proportion of the population represented by other racial and ethnic groups. Wisconsin’s total population of non-whites increased from 11.1 percent in 2000 to 13.8 percent in 2010. The fastest growing ethnic group in Wisconsin was the Hispanic population, which increased from 3.6 percent in 2000 to 5.9 percent in 2010. African Americans continue to be the second largest racial group in Wisconsin representing 6.3 percent of the population. The population distribution of the United States is included in Table 1 for comparison to the Wisconsin population distribution.
Table 1. Wisconsin and U.S. Census Data by Sex, Age Group, Race and Ethnicity, 2010
Sex, Age Group, Race and Ethnicity Population Wisconsin Population
Distribution (%)
US Population
Distribution (%)
Male 2,822,400 49.6 ) )49.2 Female 2,864,586 50.4 ) 50.8
Under 1 year of age 69,446 1.2 ) 1.31 to 4 years 288,997 5.1 ) 5.25 to 9 years 368,617 6.5 ) 6.610 to 14 years 375,927 6.6 ) 6.715 to 19 years 399,209 7.0 ) 7.120 to 24 years 386,552 6.8 ) 7.025 to 29 years 372,347 6.5 ) 6.830 to 34 years 349,347 6.1 ) 6.535 to 39 years 345,328 6.1 ) 6.540 to 44 years 380,338 6.7 ) 6.845 to 49 years 437,627 7.7 ) 7.450 to 54 years 436,126 7.7 ) 7.255 to 59 years 385,986 6.8 ) 6.460 to 64 years 313,825 5.5 ) 5.465 to 69 years 227,029 4.0 ) 4.070 to 74 years 173,467 3.1 ) 3.075 to 79 years 141,252 2.5 ) 2.480 to 84 years 117,061 2.1 ) 1.985 years and over 118,505 2.1 ) 1.8
One race 5,582,669 98.2 ) 97.1 White 4,902,067 86.2 ) 72.4 African American 359,148 6.3 ) 12.6 American Indian and Alaska Native 54,526 1.0 ) 0.9 Asian 129,234 2.3 ) 4.8 Native Hawaiian/Other Pacific Islander
1,827 * 0.2
Some other race 135,867 2.4 6.2Two or more races 104,317 1.8 2.9
Hispanic or Latino (of any race) 336,056 5.9 16.3
Total Wisconsin population 5,686,986 100.0
*Represents zero or rounds to zero.Data Source: U.S. Census Bureau, 2010 Demographic Profile Data.

BURDEN OF ASTHMA IN WISCONSIN 2013 109
AppendicesAppendices
Appendix F. Useful Asthma Links and Resources
Wisconsin Asthma Program
Program Information, Asthma Statistics, Resource Links -http://www.dhs.wisconsin.gov/eh/asthma/index.htm
Asthma Management
NIH Guidelines for Diagnosis and Management of Asthma -http://www.nhlbi.nih.gov/guidelines/asthma/asthgdln.htm
Key Clinical Activities for Quality Asthma Care -http://www.cdc.gov/mmwr/preview/mmwrhtml/rr5206a1.htm
Asthma Resources - Clinical tools, Cultural competency, Environment (indoor and outdoor), Family support, Free/low-cost clinics and services, Work-related asthma and more) -http://www.chawisconsin.org/asthma-resources.htm
Potentially Effective Interventions for Asthma -http://www.cdc.gov/asthma/interventions/default.htm
Data and Surveillance
National Asthma Surveillance Data -http://www.cdc.gov/asthma/asthmadata.htm
Wisconsin Asthma Surveillance Data –http://www.dhs.wisconsin.gov/eh/asthma/facts.htm
Forum on Child and Family Statistics -http://childstats.gov
National Diversity Data -http://diversitydata.sph.harvard.edu/#
Asthma Initiatives
Wisconsin Asthma Coalition - http://www.chawisconsin.org/wac.htm
Local Asthma Coalitions in Wisconsin - http://www.chawisconsin.org/lac.htm
BURDEN OF ASTHMA IN WISCONSIN 2013110
AppendicesAppendices
American Lung Association in Wisconsin -http://www.lungusa.org/associations/states/wisconsin/
Wisconsin Department of Natural Resources – Air quality and healthhttp://dnr.wi.gov/topic/AirQuality/
Smoke Free Wisconsinhttp://www.smokefreewi.org/
Children, Adolescent & School Health
CDC Asthma and Schoolshttp://www.cdc.gov/healthyyouth/asthma/index.htm
Asthma in Children and Adolescents Knowledge Path - http://www.mchlibrary.info/KnowledgePaths/kp_asthma.html
Health and Health Care in Schools -http://www.healthinschools.org/en/Health-in-Schools/Health-Services/School-Health-Services/School-Health-Issues/Asthma.aspx
The Link Between Asthma and Exhaust from Idling -http://www.aasa.org/uploadedFiles/Resources/Toolkits/Other_Toolkits/BusIdling.pdf
Asthma and Physical Activity -http://www.aasa.org/uploadedFiles/Resources/Toolkits/Other_Toolkits/PhysicalActivity.pdf
Environmental Health
Environmental Protection Agency (EPA) Asthma Community Network - http://www.asthmacommunitynetwork.org/
Environmental Protection Agency (EPA) Asthma - http://www.epa.gov/asthma/index.html
U.S. Department of Housing and Urban Development (HUD) - http://www.hud.gov/offices/lead/hhi/index.cfm
Environmental Health Watch, Healthy Green Housing and Asthma-http://www.ehw.org/healthy-green-housing/resources-for-a-green-healthy-home/asthma/
BURDEN OF ASTHMA IN WISCONSIN 2013 111
Wisconsin Department of Health Services
Author:
Carrie Tomasallo, PhD, MPH, Asthma Program Epidemiologist Bureau of Environmental and Occupational Health, Division of Public Health
CDC Addressing Asthma from a Public Health Perspective Cooperative Agreement
Henry Anderson, MD, Co-Principal Investigator and State Health Officer Bureau of Environmental and Occupational Health, Division of Public Health
Dawn Berney, MPA, Asthma Program Evaluation Specialist Bureau of Environmental and Occupational Health, Division of Public Health
Cristine Rameker, MPH, Asthma Program ManagerBureau of Environmental and Occupational Health, Division of Public Health
Mark Werner, PhD, Co-Principal Investigator and Chief, Health Hazard Evaluation SectionBureau of Environmental and Occupational Health, Division of Public Health
Additional Contributors:
Terrell BrockWisconsin WIC Program
Emily S. Holder, MA, CHES Consultant, Coordinated School Health ProgramsWisconsin Department of Public Instruction
Aaron Weier, GIS AnalystDivision of Enterprise Services
Anne Ziege, PhD, Behavioral Risk Factor Surveillance Survey CoordinatorOffice of Health Informatics, Division of Public Health
Centers for Disease Control and Prevention
Jeanne Moorman, MS, Survey Statistician Air Pollution and Respiratory Health Branch, National Center for Environmental Health
AppendicesACKNOWLEDGEMENTS

Wisconsin Department of Health ServicesWisconsin Department of Health Services
Division of Public HealthBureau of Environmental and Occupational Health
Wisconsin Asthma Program
One West Wilson StreetRoom 150
Madison, WI 53702
Available online athttp://www.dhs.wisconsin.gov/publications/p4/p45055.pdf
P-45055 (Rev. 05/2013)