Buoyancy and Dissolution of the Floating Crust Layer in ... · Buoyancy and Dissolution of the...
60
PNNL-13040 UC-2030 ..- ..——. ..— .—-. -—- —---——-- .... . .. .. . . .. .... ... Buoyancy and Dissolution of the Floating Crust Layer in Tank 241-SY-I 01 During Transfer and Back-Dilution CW Stewart SD Rassat JH SUkamto J-MCuts November 1999 Prepared for the U.S. Department of Energy under Contract DE-AC06-76RL0 1830 Pacific Northwest National Laboratory Richlan& Washington
Transcript of Buoyancy and Dissolution of the Floating Crust Layer in ... · Buoyancy and Dissolution of the...

PNNL-13040UC-2030
..- ..——. ..— .—-. -—-—---——--.... . .. . . . . .. .... ...
Buoyancy and Dissolution of the FloatingCrust Layer in Tank 241-SY-I 01 DuringTransfer and Back-Dilution
CW StewartSD RassatJH SUkamtoJ-MCuts
November 1999
Prepared forthe U.S. Department of Energyunder Contract DE-AC06-76RL0 1830
Pacific Northwest National LaboratoryRichlan& Washington

.——

- ...—- ~,.,, ....... ,. >. .>. !: -<., .-,, .,-.. .,, ,,...,>,-, ,.. .. . . . , - , :,,. *=., . . .: *- -2.! ,, t.
~, — .——-
. .
DISCLAIMER
This report was prepared as an account of work sponsoredby an agency of the United States Government. Neither theUnited States Government nor any agency thereof, nor anyof their employees, make any warranty, express or implied,or assumes any legal liability or. responsibility for theaccuracy, completeness, or usefulness of any information,apparatus, product, or process disclosed, or represents thatits use would not infringe privately owned rights. Referenceherein to any specific commercial product, process, orservice by trade name, trademark, manufacturer, orotherwise does not necessarily constitute or imply itsendorsement, recommendation, or favoring by the UnitedStates Government or any agency thereof. The views andopinions of authors expressed herein do not necessarilystate or reflect those of the United States Government orany agency thereof.
-.

DISCLAIMER
Portions of this document may be illegiblein electronic image products. Images areproduced from the best available originaldocument.
I
J,---- - -.—--- T--— T ~ ~.---7--W .-.,,, . ,. , ,,, .,,-. . . . . --77-=-m. .... ., .- . . . ... ..+ ., -- —~. . _ .

Abstract
To remediate gas retention in the floating crust layer and the potential for buoyantdisplacement gas releases fi-om below the crust, waste will be transferred out of Hanford Tank241-SY-101 (SY-101) in the fall of 1999 and back-diluted with water in several steps of about100,000 gallons each. To evaluate the effects of back-dilution on the crust a static buoyancymodel is derived that predicts crust and liquid surface elevations as a fimction of mixingefficiency and volume of water added during transfer and back-dilution. Experimental resultsare presented that demonstrate the basic physics involved and veri~ the operation of the models.
A dissolution model is also developecJ to evaluate the effects of dissolution of solids on crustflotation. The model includes dissolution of solids suspended in the slurry as well as in thecrust layers. The inventory and location of insoluble solids after dissolution of the solublefraction are also tracked. The buoyancy model is applied to predict the crust behavior for thefust back-dilution step in SY-101. Specific concerns addressed include conditions that couldcause the crust to sink and back-dilution requirements that keep the base of the crust well abovethe mixer pump inlet.
.. .111
..—= —,——— , ,,, ,eF.m. . . ., ., —-. . . —- -— .—-—-— —-— -- --—

,. ----
Summary
The crust layer in Hanford Tank 241-SY-101 (SY-1 O1) is a dynamic system in whichretained gas makes the crust more buoyant than the mixed slurry on which it floats. Gasretention in the crust has increased since the mixer pump was installed in 1993, causingaccelerated waste level growth and accumulation of a large volume of flammable gas.
To remediate gas retention in the crust and the potential for buoyant displacement gasreleases from below the crust, it is planned is to transfer some of the waste out of the tank andreplace it (back-dilute) with water in several steps of about 100,000 gallons each. In the firstback-dilution, water will be added at the lowest possible elevations in the tank at a low flow rateto maximize mixing and ensure that the transfer and back-dilution processes keep the base of thecrust layer well above the mixer pump inlet.
A detailed crust buoyancy model is needed to predict crust base elevation resulting hornvarious back-dilution scenarios. Because the crust is floating, it can be modeled with simplehydrostatic principles. This report documents the derivation of crust buoyancy models and thepredictions of crust behavior as a fimction of diluent mixing efficiency. First, a base buoyancymodel is derived to describe pre-dilution conditions. Based on these conditions, models werederived to predict the perturbations resulting Ii-em dilution for three cases: 1) volume of diluentnot sufficient to submerge or float the crust, 2) crust submerged in the diluent (mixture is lessdense than the crust), and, 3) crust floats on the diluent (mixture is more dense than the crust).
Simple experiments were performed using both a weighted bottle and a porous matrix ofStyrofoam@ beads and copper pellets to model the crust. These tests verified the model anddemonstrated the salient features of crust behavior. In each test, water was added with little orno mixing to a container of heavier fluid with an object floating in it. The results ‘demonstratedthat, even if the object is heavier than water, it feels the buoyant force of the water and risessome distance out of the heavier fluid. If the object is lighter than water, it rises completely outof the heavier fluid and floats entirely in the water.
Solids dissolution is calculated under the basic assumption that soluble solids will dissolveuntil the liquid mixture of dissolved solids and water is in equilibrium. The mass of dilutionwater required to dissolve a given mass of solids is therefore equal to the product of the solidsmass to be dissolved, the fraction of the solids that are soluble, and ratio of the mass of water tothe mass of dissolved solids in the saturated liquid.
As water is added below the crust, the density of the slurry above the injection pointdecreases by dilution from the added water. This is partially compensated for by the release ofgas, which is assumed to be in proportion to the fraction of solids in the slurry that are dissolved.If there is no top dilution, the analysis assumes that the crust is unaffected until all the solublesolids are dissolved from the slurry. At that point the excess water begins to dissolve the bubbleslurry layer. Because the bubble slurry contains a disproportionately high volume of gas,dissolution of this layer will greatly increase the average crust density. If this happens, thediluted slurry will no longer be able to support the heavier crust, and the crust will sink.

In the current plan, two locations will be used for low water addition: the transfer pumpinlet, 96 inches from the tank bottom, and the mixer pump burrowing ring, 9 inches from thebottom.(a) The lower the back-dilution water injection point, the larger the volume of slurryavailable to mix with the water. This means that the back-dilution volume would be less limitedif water were added through the base of the mixer pump rather than through the transfer pumpinlet.
Because the back-dilution volume is expected to be the same as the transfer volume in mostcases, larger transfer volumes will result in an increasingly dilute slurry. At some point, themixed slurry density will be too low to float the crust, and the back-dilution volume will need tobe reduced to prevent the crust from sinking. With the back-dilution volume lower than thetransfer volume the crust base will be lower, because the volume of the mixed liquid slurrydecreases as transfer volume increases. Thus transfer volume is limited to the amount thatallows maximum back-dilution to keep the crust base fm enough above the mixer pump inlet toensure effective operation. Because the mixer pump has operated effectively with the crust baseas low as 295 inches, this level has been chosen as the lower limit.
The back-dilution limitations for the important scenarios with water injected at the 96-inchtransfer pump inlet and the 9-inch mixer pump burrowing ring are listed in the following table.
Table S-1. Volume Limits for Back-Dilution below Crust
Water injected at 96 in. Water injected at 9-in. mixertransfer pump pump burrowing ring
Maximum transfer with equalback-dilution allowable to 90 kgal transfer with equal 120 kgal transfer with equalavoid sinking crust back-dilution back-dilutionMaximum transfer and back-dilution allowable to keep 143 kgal transfer 175 kgal transfercrust above 295 in. without with 80 kgal back-dilution with 112 kgal back-dilutionsinkingMaximum transfer and back-dilution allowable to keep 100 kgal transfer 125 kgal transfercrust above 295 in. with at with 72.5 kgal back-dilution with 103 kgal back-dilutionleast 10 kgal margin to sinkingMaximum transfer with equalback-dilution allowable to 128 kgal transfer with equal 160 kgal transfer with equalavoid crust sinking with 20 back-dilution back-dilutionkgal of total added on top
(a) LMHC Interoffice Memo 79000-99-053, from RE Raymond to the SY-101 Project Group, August 18,1999. Subjecc 241-SY-101 Mixer Pump Inlet Level and SY-101 mixer pump drawing H2-89953.
vi

The table shows that top dilution is very beneficial in providing operational flexibility to thetransfer and back-dilution process. The crust base remains well above the 295-inch minimumand does not limit transfer volume. In addition, there are no serious consequences related to gasrelease if moderate volumes of water are added on top of the crust layer. Recent history showsthat the crust can be confidently thinned to 60 inches without releasing bubble slurry. Thisrequires approximately 50 kgal of top dilution. Even if the entire bubble slurry layer weresuddenly released to the headspace, the hydrogen concentration would be just above 50°/0of theLFL after a 100 kgal transfer and under 50% of the LFL after a 150 kgal transfer.
We conclude that, with proper planning, a 100-150 kgal transfer and equal back-dilution canbe accomplished in the fall of 1999 without danger of sinking the crust or releasing gas from thebubble slurry. The greatest margin of safety is achieved if a significant fraction of the back-dilution water is placed on top of the crust.
vii
— ----— .-—-.,-., . . - —=-....-.—. - . . .—

●

Contents
Abstract...
..................................................................................................................................... 111
summary ....................................................................................................................................v
1.0 Introduction ......................................................................................................................... 1
2.0 Current State ofSY-101 Crust Layer ....................................................................................3
3.0 Crust Buoyancy Model ........................................................................................................53.1 Reference Buoyancy Model for Crust Flotation ..............................................................53.2 Buoyancy Model with Back.Dilution ...............................................................................6
3.2.1 Partial Submergence or Flotation .............................................................................73.2.2 Crust Completely Submerged in Diluent ....................................................................83.2.3 Crust Floats in Diluent ...............................................................................................9
3.3 Experimental Demonstration of Crust Buoyancy Model ................................................. 103.3.1 Bottle Buoyancy Expedient ................................................................................... 103.3.2 Porous Crust Buoyancy Expedients ....................................................................... 133.3.3 Comparison of Model Predictions with Experimental Results .................................. 15
4.0 Dissolution Model .............................................................................................................. 174.1 Dissolution Resulting from Low Water Addition ............................................................ 184.2 Dissolution Resulting from Water Addition on Top of the Crust .....................................224.3 Effect of Dissolution on Crust Buoymcy ........................................................................23
5.0 Crust Response to Transfer and Back-Dilution ...................................................................295.1 Parameter Values for Current Crust Conditions ..............................................................295.2 SY-101 Crust Buoyancy Predictions Including Dissolution ............................................ 31
5.2.1 Limits on Low Water Addition ................................................................................ 315.2.2 Limits on Top Dilution ............................................................................................ 34
6.0 References .........................................................................................................................37
Appendix: Crust Buoyancy Model .......................................................................................... A.1
ix
.,.-. . .. ,.,. .?J ,--- .+ .~,. .? t.,- Z2L.<.-.. ,).,-.’-. . .*--..-:., .i. , .- A - ,:. .-.~-. ,-’...: .,-, .>*- ‘ ?.

Figures
2.1
2.2
3.1
3.2
3.3
3.4
3.5
3.6
3.7
3.8
4.1
5.1
5.2
5.3
3.1
3.2
3.3
3.4
3.5
5.1
5.2
5.3
Crust Configuration as Indicated by Neutron Profiles ...........................................................3
Concept of Crust Configuration and Properties ....................................................................4
Diagram of Crust Buoyancy Model ...................................................................................... 6
Small Volume of Water Added with Little or No Mktig .....................................................7
Diluent Added so Crust Is Completely Submerged ............................................................... 9
Diluent Mixture is Dense Enough to Support the Crust ........................................................9
Bottle Buoyancy Tests for Case I Conditions ..................................................................... 11
Bottle Buoyancy Tests for Case II Conditions .................................................................... 12
Simulated Crust with Density Greater Than that of Water .................................................. 13
Simulated Crust with Density Less Than that of Water ....................................................... 14
Schematic of Back-Dilution Locations ............................................................................... 17
Limitation on Low Water Addition to Prevent Crust Sinking ............................................. 33
Limitation on Low Water Addition after 40 kgal Is Added to Crust Top .............................34
Effect of Adding Water to Crust Top after 150 kgal Trmsfer ............................................. 35
Tables
Results of Bottle Buoyancy Tests for Case I Con&tions ..................................................... 11
Results of Bottle Buoyancy Tests for Case II Conditions .................................................... 12
Results of Porous Crust Buoyancy Tests for Case I Conditions .......................................... 15
Results of Porous Crust Buoyancy Tests for Case II Conditions ........................................ . 15
Comparison of Buoyancy Model Predictions with Experimental Results ............................ 16
Crust Material Properties ...................................................................................................3O
Base Parameter Values for Buoyancy Model ......................................................................3O
Base Crust Configuration .................................................................................................. 31
x

1.0 Introduction
The mixer pump installed in Hanford Tank 241-SY-101 (SY-101) in July 1993 has preventedthe large buoyant displacement gas release events (I3D GRE) the tank has exhibited historically.But the absence of periodic disruption fi-omGREs and the action of mixing have caused the crustto grow by accumulating gas bubbles and solids from below. This has resulted in over 30 inchesof waste level growth, and the flammable gas volume stored in the crust has become a hazard.To remediate gas retention in the crust and the potential for BD GREs from below the crust,SY-101 will be diluted in the fall of 1999 to dissolve a large fraction of the solids in the tank.Waste will be transferred out of the tank and replaced (back-diluted) with water in several stepsof about 100,000 gallons each (Raymond 1999). Back-dilution water may be added at thetransfer pump inlet, the base of the mixer pump, on top of the crust, or in some combination ofthese locations (Barton 1999).
The mixer pump will continue to be required to prevent formation of a deep nonconnectivelayer and resumption of BD GREs. Therefore, it is vital to ensure that the transfer and back-dilution processes do not significantly degrade the pump’s effectiveness. Part of the strategy toavoid mixing degradation is to keep the base of the crust layer well above the mixer pump inlet,which is 236 inches above the tank bottom.(a) The crust must also be prevented from sinking.The mixer pump may not be able to mobilize a sunken crust adequately to prevent BD GREs.
Because the crust is floating, it can be modeled with simple hydrostatic principles. Mostbasic is that the weight of the crust must be equal to the weight of fluid displaced. The amountof crust submerged depends on the density of the fluid it displaces. For the crust to float, thespecific gravity of the fluid surrounding the crust must be greater than that of the crust. Duringback-dilution, the specific gravity of the fluid supporting the crust depends on how well thedilution water ties with the slurry and how the crust dissolves.
This report documents the derivation and predictions of the crust buoyancy model and thepredicted crust configuration as a function of mixing efficiency, back-dilution volume, andinjection location.’ Section 2 describes the current state of the crust layer in SY-101. Section 3presents the basic buoyancy model for crust flotation and provides a methodology for predictingthe perturbations in crust buoyancy resulting from back-dilution both above and below the crust.This section also presents results of simple experiments that verify the model and demonstratethe basic behavior. Section 4 presents a model for determiningg the effect of dissolution of solidson the volume and density (and hence the mass) of the crust and the liquid slurry. Section 5predicts the limits needed on transfer and back-dilution volumes to ensure that the crust does notsink and always floats with its base well above the level of the mixer pump inlet. References arelisted in Section 6.
(a) Lockheed Martin Interoffice Memo 79000-99-053, RE Raymond to SY-101 Project Group, August18, 1999. Subject: 241-SY-101Mtier Pump Inlet Level
1
.-, .— -.-.= ..- —%.., . ,. . . —-


2.0 Current State of SY-I 01 Crust Layer
Measurements show that the top of the crust is currently about 432 inches above the tankbottom. Neutron and gamma probe data indicate that the crust base is about310 inches from thebottom. The free liquid level in the tank is estimated at roughly 414 inches. These data indicatethat the crust is about 120 inches thick and floats on the liquid with almost two feet of“freeboard” exposed above the liquid level. This configuration is the result of a redistributionevent that occurred from mid-March through early May 1999, during which the base of the crustdropped about 30 inches. There was concurrently an abrupt and sustained increase in pump-induced gas releases and a gradual reversal of the level rise trend. The crust has remainedapproximately in its current condition since June 1999. Before the redistribution event, voidilaction instrument (VFI) (Stewart et al. 1998) and retained gas sampler (RGS) (Mahoney et al.1999) void measurements along with the fust neutron/gamma profiles showed that a high-voidlayer more than a foot thick may have existed at the base of the crust. Upward migration anddispersal of the gas in this layer may explain the redistribution. Analysis indicates that theaverage void fraction decreased as the crust thickness increased, so the total stored gas volume inthe crust remained roughly constant. Neutron probe data after July 1999 show that a high voidlayer about 10 inches thick has reformed at the new crust base level.
Recent neutron/gamma count profiles, temperature profiles, operation of the mechanicalmitigation arm (MMA) in late May 1999, and penetration of the crust with the 40-inch spraylance in August 1999 show that the crust now consists of four distinct layers. From theirphysical characteristics and position, these layers are termed “bubble slurry,” “paste,” “wet clay,” ‘and “inferred freeboard.” The neutron profiles are shown in Figure 2.1, and a conceptualunderstanding of the crust configuration is illustrated in Figure 2.2.
43’-t--OL "...""";."-.."i..F."""""""""."""""".j"""""-""""-"'-."-~astcS*face"-.FREEg;oARD".............................................................. ......... ..........&......................................
.........................
.............................,,,,,,,V.,,.,,,.,,!,’,..,...>,4,<.,4,..,,..
‘i? ,,..........?r...?r..,.,.......:...,..?...,,......5
“~ ......... .........,1.4..<..,,:................<.
..,.,....’!..,,,,,;,.,.,>,4...,,,.,,,<..~,.,.,..,.ri...,,,...:..,,,...,,4..,,,,,..:.,..,,....,.,.,.,,.!.,,..,..!,:,!,,.,,,,,,..,,..,,..;,,................,.:!!.,,,.,,,,,,,,.,,,,.!....
Crust Base ; ; ; I..................<...................................................................................... ..........
290200 240 280 320 360 400 440 480
NormalizedNeu@onCount
Figure 2.1. Crust Contlguration as Indicated by Neutron Profiles
3

. —.-.—. —
434 in.
410 in.
395 in
370 in.
March 19991
October 1999
Crust Layer
===$==Paste Layer:
z -400-3000 Pa
a = 0.3
350 in. rBubble Slurry Layer:
a = 0.67 K 100 Pa
a = 0.2
432 in.
414 in.
400 in.
\
Wet Clay Layer:a = 0.08r >3000 Pa
320 in.
— 310 in.
Figure 2.2. Concept of Crust Configuration and Properties
The “bubble slurry” is the bottom layer (310-320 inches) and consists of a relatively high-void material. It has a void fraction that may be approaching 0.6 and a relatively low yieldstress, estimated as less than 100 Pa. The “paste” layer consists of the middle two-thirds(320-400 inches) and is relatively strong, approximately the consistency of stiff peanut butter orsoft clay. It has a moderate void fraction, averaging about 0.2, which decreases with height.Estimates of the torque required to rotate the MMA indicate a yield stress on the order of400-3000 Pa.(a) The “wet clay” layer (400-414 inches) lies just below the liquid level. It has avery low void fraction, estimated at 0.08, and appears to be very strong. Although there are nodirect measurements for this quantity, its yield stxess is inferred to be greater than 3000 Pa. Thislayer may also contain old “wastebergs” that existed prior to mixing, but it is not clear whetherthey could still be distinguished from the surrounding material.
The top sixth of the crust (414-432 inches) is the porous broken material above the liquidlevel and composes the current freeboard. Water added on the waste surface readily flows intothis layer. Although individual fi-agments are quite strong and brittle, this layer has no strengthas a unit. The height of vertical ledges visible after dissolution by flush water and estimatedresistance to the cruciform lance penetration in August 1999(a)indicate a local yield stress greaterthan 10,000 Pa.
(a) Wells BE and G Terrones. October 1999. Estimates of the Yield Stress in Shear of the FloatingCrust Layer in Tank 24I-SY-101. Letter Report TWS99.60, Pacific Northwest National Laboratory,Richland, Washington.
4

3.0 Crust Buoyancy Model
This section presents an overview of the crust buoyancy model, which is used to determinethe results presented in Section 5. The crust floats on the liquid slurry by the same physicalprinciples as a bar of soap in a bathtub. The depth to which the crust is submerged, and whetheror not it floats at all, is determined by the balance between the weight of the crust and the weightof the fluid it displaces. The buoyancy model is needed because transfer and back-dilution willalter the density of the fluid currently supporting the crust. The density of the crust may alsochange due to dissolution of solids, or by the porous crust freeboard absorbing some amount ofthe fluid in which it is submerged. This means that dilution operations will change thesubmerged depth of the crust and could even cause it to sink.
This section contains a conceptual description of the crust buoyancy model. Section 3.1describes the basic model, with the main assumptions. Section 3.2 describes the three mainvariations to consider when using this model to determine crust buoyancy with back-dilution. InSection 3.3, model results are compared with experimental data from tests simulating crustbehavior for several postulated back-dilution scenarios. The derivation is presented in detail inAppendix A.
3.1 Reference Buoyancy Model for Crust Flotation
The crust buoyancy model applies the simple physical principle discovered by Archimedesmore than 2300 years ago: the weight of an object floating in a liquid must be equal to thevolume of liquid displaced by the object. The crust is an object made up of solids, retained gas,and liquid held within the porous structure of the crust. The solid material in the crust is by itselftoo dense to float on the slurry; the crust floats only by virtue of trapped gas within the crust.Gas is assumed to be retained in the crust as isolated particle-displacing bubbles that constitutesome specific void fraction relative to the total volume of the crust. The pores between particlesare assumed to be completely saturated with liquid in the submerged portion of the crust.
The overall density of the submerged portion of the crust depends on its void fraction, solidsvolume fraction, and the liquid and solid phase densities. Similarly, the density of the slurry onwhich the crust floats depends on the solids volume fraction (due to particles suspended in theliquid), the void fraction (due to small gas bubbles that may be attached to the suspendedparticles), and the phase densities. The density of the unsubmerged portion of the crust (i.e., the“freeboard”) also depends on its void fraction, solids volume fraction, and the liquid and solidphase densities. These quantities are not the same as in the submerged portion of the crust. Theexposed crust contains open pores and void spaces surrounded by solid crust material. Thesepores and void spaces are assumed open to the headspace and therefore contain the headspaceatmosphere. The pore spaces, but not the voids, are assumed to be partially filled or saturatedwith liquid due to capillary action. This model is illustrated schematically in Figure 3.1.

I& . .. .-. . .A-
FreeboardH~
+- “--”” “- ~cs4 .. -
Submerged Portion
H,
Figure 3.1. Diagram of Crust Buoyancy Model
Balancing the upward buoyancy forces and downward gravitational forces on the crust yieIdsrelationships to determine the depth the crust is submerged (S), the height of the liquid level(HL), the height of the crust surface (HS), and the height of the crust base (HB). The details ofthe derivation and formulation of these relationships are presented in Appendix A.
3.2 Buoyancy Model with Back-Dilution
The amount of mixing that occurs with injection of water during back-dilution under thecrust determines the density of the liquid slurry the crust is floating on. The mixing of the liquidslurry and added water is expected to be very good at best and essentially nonexistent at worst.To express this range of possibilities for modeling purposes, back-dilution is assumed to formtwo distinct stratified layers in the liquid. The upper layer is assumed to be a homogeneousmixture of dilution water and some specific fraction of the original mixed slurry. The volume ofmixed slurry divided by the volume of added water is defined as the mixing ratio. The lowerlayer is assumed to be essentially the same as the original undiluted slurry. This model alsoassumes that no solids dissolve when the crust comes in contact with the added water orunsaturated water-slurry solution (this assumption is relaxed in the model presented in Sec-tion 4.) The crust itself is assumed to have passages through which water can flow relativelyeasily, such that all hydrodynamic effects can be ignored. That is, the crust behaves purely as ahydrostatic system before, during, and after adding the dilution water.
Because the density of water is much lower than that of the slurry, any water that is added ontop of the crust will initially penetrate only to the existing liquid level. Similarly, even whenwater is added below the crust, the diluent mixture of water and slurry will of necessity be lighterthan the original slurry, and the diluent mixture will percolate up, through, and around the crustto strati~ on top of the unmixed slurry. The crust will rise or sink until it displaces a sufficientvolume of fluid to support its weight in the surrounding liquid. Depending on the amount ofmixing, the diluent mixture density may result in the crust being either partially or wholly

submerged in the liquid. The submerged portion of the crust may be supported entirely in thediluent mixture layer or partially in the diluent mixture layer and partially in the underlyingoriginal slurry layer.
In this section the crust buoyancy model is applied to various flotation scenarios. Section3.2.1 describes the case in which there is only a small amount of dilution that is not enough tocompletely submerge the current crust freeboard; Section 3.2.2 discusses the case in whichenough water is added for the resulting diluent mixture to filly submerge the crust, but there isinsufficient mixing and the diluent mixture is not dense enough to support the crust. In this case,the lower part of the crust is supported by the original (undiluted) slurry, and the upper part ofthe crust is submerged in the diluent mixture. Section 3.2.3 discusses the effect of water addedbeneath the crust in sufficient volume and with enough mixing for the the crust to float on thediluent mixture, with no part of the crust submerged in the original slurry.
3.2.1 Partial Submergence or Flotation
When a small volume of dilution water is added on the top of the crust or a light diluentmixture percolates up to form a stratified layer on top of the slurry, the level at which the crustfloats will change. If the added volume of water is small enough, the diluent mixture layer willnot be deep enough to completely submerge or float the crust. The conditions before and after anaddition of this type areas shown in Figure 3.2.
The density and void fraction of the originally submerged portion of the crust are assumed toremain unchanged. The density of the originally unsubmerged portion of the crust that remainsunsubmerged, above the level of the diluent mixture, is also unchanged. In the newly submergedportion of the crust, however, the diluent mixture can penetrate the pores and voids that wereformerly occupied by air. The buoyancy due to the additional subermergence increases thedifference between the new crust surface level and the level of the undiluted slurry.
INITIAL STATE DILUENT ADDED.
::22—.——..—.————— I::+
Figure 3.2. Small Volume of Water Added with Little or No Mixing
7
—— .-.———= .

Appendix A, Section A. 1 contains a detailed derivation of this case for the crust buoyancymodel, defining the relationships for the new liquid surface level, crust surface level, undilutedslurry liquid level, and the submerged depth of the crust. In addition, relationships for thedensity of the newly submerged crust freeboard and the density of the diluent mixture layer arederived. These are expessed in terms of the mixing ratio, M, for the diluent mixture. The mixingratio is defined as the ratio of the volume of slurry that mixes with the water to form the diluentmixture to the volume of water added. It is assumed that volume is conserved while the twofluids mix. For pure water added so it does not mix at all with the slurry, M = O.
The new depth to which the crust is submerged can be calculated from the volume of wateradded. The model assumes that the diluent mixture fills the available air space in the pores andvoids above the original liquid level in the crust freeboard plus any portion of the liquid surfacearea that is not occupied by crust (see Figure 3.2). This solution is applicable only if the crust isnot completely submerged or is floating entirely in the diluent mixture. The volume of mixeddiluent needed to just submerge the crust can be computed as a fimction of the crust thicknessand the mixing ratio M. If the volume of water to be added is larger than this amount, the modelis applied as described in Section 3.2.2. If the mixed diluent is of sufficient volume and densityto completely float the crust, the model is applied as described in Section 3.2.3.
3.2.2 Crust Completely Submerged in Diluent
If the diluent is less dense than the bulk crust material, the diluent mixture will remain abovethe slurry level and the crust may be entirely submerged, as shown in Figure 3.3. The lower partof the crust is submerged in the original (undiluted) slurry, and the upper part is submerged in thenew diluent mixture. The sum of the crust submergence depths is equal to the total crustthickness. The diluent mixture will also penetrate the porosity and void space throughout thenewly submerged freeboard, which was originally above the liquid surface level before the wateraddition.
The new mixture level is determined from the amount of diluent in excess of that required tofully submerge the crust and can be expressed as a function of the mixing ratio, M, the volume ofwater added, and the volume of water required to just submerge the crust (determined fromcalculations using the model as applied in Section 3.2.1). The relationships that describe theconditions illustrated in Figure 3.3 are presented in detail in Appendix A, Section A.2.
This approach is valid only if the diluent density is less than that of the crust. When thedensity of the diluent mixture is just sufficient to float the crust, the submergence depth in theoriginal (undiluted) slurry becomes zero. The mixing ratio and volume of water needed toachieve this state can be determined using the relationships described in Section A.2 ofAppendix A. If the mixture ratio is greater than this value, the crust will float in the diluentmixture without any portion of it submerged in the original slurry. In that case, the crustbuoyancy model is applied as described in Section 3.2.3.

INITIAL STATECRUST SUBMERGED
IN DILUENT::$ HM:..-...,,....,‘,8....’..,,.--.4‘*,..- ‘s,....,,,~..-,4:
z H~w
TcH:Ew
#LD1 I
1+.—
4 ‘....’..1H~w
:;:::—..———..—--———.—.—.—...—---- —..—..-—_ —.—.—..:::~.
Figure 3.3. Diluent Added so Crust Is Completely Submerged
I
3.2.3 Crust Floats in Diluent
If enough mixing occurs for the diluent mixture to be denser than the bulk crust material, thecrust will float entirely supported by the diluent mixture. This is illustrated schematically inFigure 3.4. This is similar to the original condition of crust buoyancy descibed in Section 3.1.The only difference is that the crust will be submerged to a greater depth, because the density ofthe diluent mixture must of necessity be somewhat less than that of the original slurry.
INITIAL STATECRUST FLOATS ON
DILUENT:.:;:. H~w
A H~
TcstLD fp%w
stLD
& PH~w
:;
l-.—----.-.........--: ~ -–.--–1:Figure 3.4. Diluent Mixture Is Dense Enough to Support the Crust
9
—.. -.= ,, ,, .,. .,... -> .,. ..-..,. ,.... ., . . ... --.-.—-

The volume of diluent mixture needed to float the crust entirely in the diluent mixture layer isthe volume of water required to form a mixed diluent that will submerge the crust such that itsbottom is just at the intefiace between the diluent mixture layer and the original (undiluted)slurry layer. The volume of water needed to achieve this depth of submergence for the crust is afunction of the thickness of the crust, its overall density, and the mixing ratio, M, which must belarger than the maximum value defined for the conditions described in Section 3.2.2. Thedetailed formulation of the model for this condition is presented in Appendix A, Section A.4.
3.3 Experimental Demonstration of Crust Buoyancy Model
Two simple experiments were run to verify the operation of the model and to demonstrate thebasic behavior the model is designed to predict. In these experiments, a simple model of thebuoyant crust was floated in a graduated cylinder containing a fluid that simulated the mixedslurry. One experiment used a sealed weighted bottle and another a porous cylinder to simulatethe crust. Cases with the floating object denser than the diluent fluid were run for bothexperiments. Cases with the floating object less dense than the diluent fluid were also run forboth experiments. Section 3.3.1 describes the sealed bottle tests. Section 3.3.2 describes theporous cylinder experiment. The experimental results are compared to model predictions inSection 3.3.3.
3.3.1 Bottle Buoyancy Experiment
In these experiments, the crust was simulated using a 57 I-r& Teflon@FEP bottle loadedwith different weights of copper pellets. The bottle consists of two sections. The lower sectionis 124.5 mm and has an average cross-sectional area of 41.0 cm2; the upper section is 37.5 mmtall and has an average area cross-sectional area of 16.1 cm2. This configuration is shown inFigure 3.5. A 2000-mL graduated cylinder with a cross-sectional area of 47.4 cm2 was used tomodel the tank.
Dichloromethane (CH2C12),which has a density of 1.327 g/mL, was used to represent themixed slurry. Water, which has a density of 1 g/mL, was added to represent the diluent. Thetwo liquids are immiscible. Two cases were examined. In both cases, the densest material wasthe simulated slurry. In one of these cases, the bottle was denser than water, and in the othercase, the bottle was less dense than water. The reference level for liquid level measurements wasthe bottom of the bottle before water was added.
The added water was measured by weight with an estimated uncertainty less than 0.1 mL.Levels were read by marking the side of the graduated cylinder and measuring the distancebetween them with a rule. The maximum uncertainty in measuring the distance between twomarks used for each referenced level datum is + 2 mm. The uncertainty in placing a mark was<-1 mm for the bottom of the crust model (model crust reference line) and+ lmm for the liquidsurface level. The uncertainty was larger, -2 mm, for the liquid/liquid interface because of thethickness of the miniscus. The overall standard deviation of the measurement is estimated bylinear combination of uncertainties to be + 3 mm.
10

3.3.1.1 Case I: Bottle Is Submerged, p~L> pC > PW
In Case I, the bottle weighed more than the volume of water it could displace but less than anequivalent volume of slurry. This was accomplished by adding copper pellets to the bottle untilits total weight was 601.8 g, which corresponds to a bulk density of 1.054 ghnL. Figure 3.5shows schematically the changes in simulated crust and liquid levels with water additions, andthe experimental results are summarized in Table 3.1. Because the fluids are immiscible, addedwater remains on top of the model slurry, appropriately simulating the diluent mixture layer ontop of the (undiluted) slurry. The water surrounding the bottle exerts a buoyant force, lifting thebottle out of the slurry, until enough water is added to completely submerge the bottle. After thatthere is no change in the bottle position or slurry level---only the water surface level rises.
Weighted,SealedBottle %
Reference,,”.,,,,,Level
Add Water Add Water>
%
,,,,..., s,,,4 ,”,, ,,...,, ,,,.,.,,,.,. ,, ,“,, **,.*,, c,,,.., **,*..., t,,,, w
,,- ,,-
.L /-------,.... +&>- ~:
~ .U.....,... ...-... . -,->,,., .fii...”,..,.
<:$.. -. ..’.,
.. ”,-. ~, ~- -.,, .,.
,. .. -..-..+ .. . .. . .. . ‘.. ....,.. -,, .’,. . .
. . ,., - ;., . . . .. . . . .
Initial State Intermediate State . Final State
Figure 3.5. Bottle Buoyancy Tests for Case I Conditions (psLs. pC > pw)
Table 3.1. Results of Bottle Buoyancy Tests for Case I Conditions (psLs pC > pw)
Bottom of bottle ChzClzLevel HZOLevel(mm) (m) (mm)
CH2C12only o 111.2 IWA+ 37.2 g HZO(partially submerged 5 75.2 131.7+ 152.3 g HZO(completely submerged 12.9 33.5 176.2
11
.— -~.- —-— .. . ..

3.3.1.2 Case II: Bottle Floats on Dduen~ p~L > pw > pc
h Case II, the bottle weighed less than the volume of water it could displace. Consequently,it also weighed less than an equivalent volume of slurry because the slumy simulant (CHZCIJ isdenser than water. The bottle weight was adjusted to 460.8 g, which corresponds to a density of0.807 g/mL. Figure 3.6 schematically depicts the changes in simulated crust and liquid levelswith water additions. The results are summarized in Table 3.2.
As water is added, it exerts a buoyant force on the bottle. But because the bottle is lighter inthis test, it rises farther out of the model slurry. At some point, the buoyant force of the waterbecomes sufficient to support the bottle. Further water addition raises the water level and thebottle, while the slurry level remains constant.
Weighted,SealedBottle ‘
Referen:~<,,,,Level
lA=hlA--.. -. H-W4171
II
.. . . . ...***t.*-.3*..*.,,.., w,*t,,,,.. .*. Ai,.**m - ,,, -.,,,”
- .. .,-,’.
,:. ,--... . . . ‘- ...”,-
,..::..,:; ,--: ,..,,., :.,..-..... . ,. .,. ‘-. .... ....,,,,......
.-’... .......- ,,.,-.
Initial State Intermediate State Final State
Figure 3.6. Bottle Buoyancy Tests for Case II Conditions (psL > pw > pc)
Table 3.2. Results of Bottle Buoyancy Tests for Case II Conditions (psL > pw > pc)
I Bottom of I CH,C12 I H,O level ICondition “bottle (gun) level (mm) (mm)cH2c12 only o 86.6 N/A+46.3 g HZO(partially submerged in CHQ) 7.3 40.8 110.0+ 65.6 g HZO(completely out of CTIQ) 18.5 12.3 132.8+ 47.4 QH.O (comdetelv out of CH.cl.) 28.9 1?3 1428
12

3.3.2 Porous Crust Buoyancy Experiments
Porous crust models were constructed from a thin bottom layer of metal pellets (-0.4 mmdiameter) and a thick top layer of Styrofoam@ beads (0.34.6 cm diameter). Individual pellets”and beads were coated with epoxy resin, layered in a cylindrical mold while wet, and air-dried toform a solid porous crust. The cylindrical mold was 9.5-cm in diameter and 5.1-cm high, whichcorresponds to a volume of 360 mL. Pictures of the simulated crust are shown in Figures 3.7 and3.8. The one in Figure 3.7 is denser than water; the one in Figure 3.8 has a density less than thatof water.
The crust porosity is defined as the difference between the volume of the mold and thevolume of water displaced by the simulated crust made from the mold. Because of layeringeffects and differences in packing consistency, the porosity varies both vertically and radially.The vertical variation in porosity was checked by adding water in several stages with the porouscrust held fixed in the vessel. The average porosity for each stage can be calculated from thechange in height of water for each volume added: For the heavy crust, the porosity ranged from0.34 to >0.43 (single-stage bulk measurement gave 0.43) and from 0.35 to 0.52 for the’light crust(single-stage bulk measurement was 0.50). The standard deviation in porosity is estimated asMI.07. The bulk density of the crust was controlled by varying the relative amounts of metalpellets and Styrofoam beads.
The liquid used to model the slurry was a solution of-40% ferric chloride (FeCIJ in water,which has a measured density of 1.38 g/rnL. Water was the diluent. Experiments were
Figure 3.7. Simulated Crust with Density Greater Than that of Water (pW< pc)
13
---— ,!, .,- . . -u . ... . . . . . ... ... . . .. -. .,.. . . . . . ,, ...,,, .— -

Figure 3.8. Simulated Crust with Density Less Than that of Water (pc c pw)
conducted in a 1-L beaker with a cross-sectional area of -79.6 cm2. As in the tests with thesealed bottle, the base of the crust prior to water addition was used as the reference point forfluid level measurements.
Because the water and the FeCl~ slurry are not immiscible in this test, some mixing ispossible. However, water was added gently on top of the porous crust so that mixing wasminimized. The effectiveness of this approach was verified by visual observation, since mixingis easy to detect due to the dark brown color of the FeCl~ solution. The interface was observed toremain quite sharp throughout the tests, so any effect of mixing was assumed very small and wasneglected. The level measurement and added water volume uncertainties are estimated to be thesame as for the bottle experiments, as described above in Section 3.3.1.
3.3.2.1 Case I: Crust is Submerged, psL > pC > pW
The total crust weight was adjusted to 235 g, which corresponded to a bulk density of0.653 g/niL (Figure 3.7). Water displacement measurement yielded a solid volume of 207 mL,which is equivalent to a porosity of 42.5%. Therefore, the true average density of solids in thecrust is 1.14 g/mL, which is greater than that of water but less than that of the model slurry.Table 3.3 summarizes the changes in simulated crust and liquid levels with water additions.
The results are similar to the corresponding sealed bottle test described in Section 3.3.1.1.The diluent water exerts a buoyant force on the crust proportional to the volume of solidsdisplaced so that the crust rises out of the FeCl~. This continues until water covers the crust.
14

Table 3.3. Results of Porous Crust Buoyancy Tests for Case I Conditions (psL >pc >pw)
Bottom of crust -FeCl~Level HZOlevelCondition (mm) (mm) (mm)
FeClsonly o 43.7 NIAI-49.8 g HZO(partially submerged) 5.2 36.5 50.9+ 50.2 g HZO(partially submerged) 10.1 32.2 59.8+ 149.2 g HZO(completely submerged) 14.4 30.0 77.5 i
3.3.2.2 Case II: Crust Floats on Diluen~ p~~s pWz pc
The total crust weight was adjusted to 119.8 g, which corresponded to a bulk density of 0.333ghnL (see Figure 3.8.) Water displacement measurement yielded a solid volume of 180 m3 or,equivalently, a porosity of 50%. Therefore, the true average density of soIids in the crust is0.666 g/mL, much lighter than water and also lighter than the simulated slurry. Table 3.4summarizes the changes in simulated crust and liquid levels with water additions.
As with Case I, the results are similar to the corresponding sealed bottle test described inSection 3.3.1.2. The diluent water exerts a buoyant force on the crust proportional to the volumeof solids displaced so that the crust rises out of the FeCl~. This continues until the crust floats inthe water alone, with none of it submerged in the model slurry.
Table 3.4. Results of Porous Crust Buoyancy Tests for Case H Conditions (PsL.>PW>pc)
Bottom of FeCl~level H20 levelCondition crust (mm) (mm) (mm)FeCl, only o 28.9 NIA+ 50.1 g HZO(partially submerged in FeCIq) 4.6 . 24.8 35.2+ 50.2 g HZO(partially submerged in FeCl~) 9.2 21.7 43.2+ 133.9 g HZO(completely out of FeCIg) 22.5 18.8 63.9
3.3.3 Comparison of Model Predictions with Experimental Results
The experiments above were compared with calculations using the crust buoyancy modeldescribed in Section 3. In each case, the basic buoyancy model was fnst applied to establishreference conditions consistent with the initial conditions that were the basis of the experimentalmeasurements. The degassed level was adjusted so that the level of the crust base was zero forthe reference condition. After the reference condition was determined, the partial flotationformulation horn Section 3.2.1 was applied to all cases in which the heavy simdated crust wasnot completely submerged in water or the light simulated crust floated partially in water andpartially in the slurry simulant. Submerged crust cases were modeled with the approachdescribed in Section 3.2.2. The approach in Section 3.2.3 was used when the simulated crustfloated in water entirely above the slurry simulant. Other modeling concerns are explainedbelow.
15
.,-- .--..— . ---- .-.
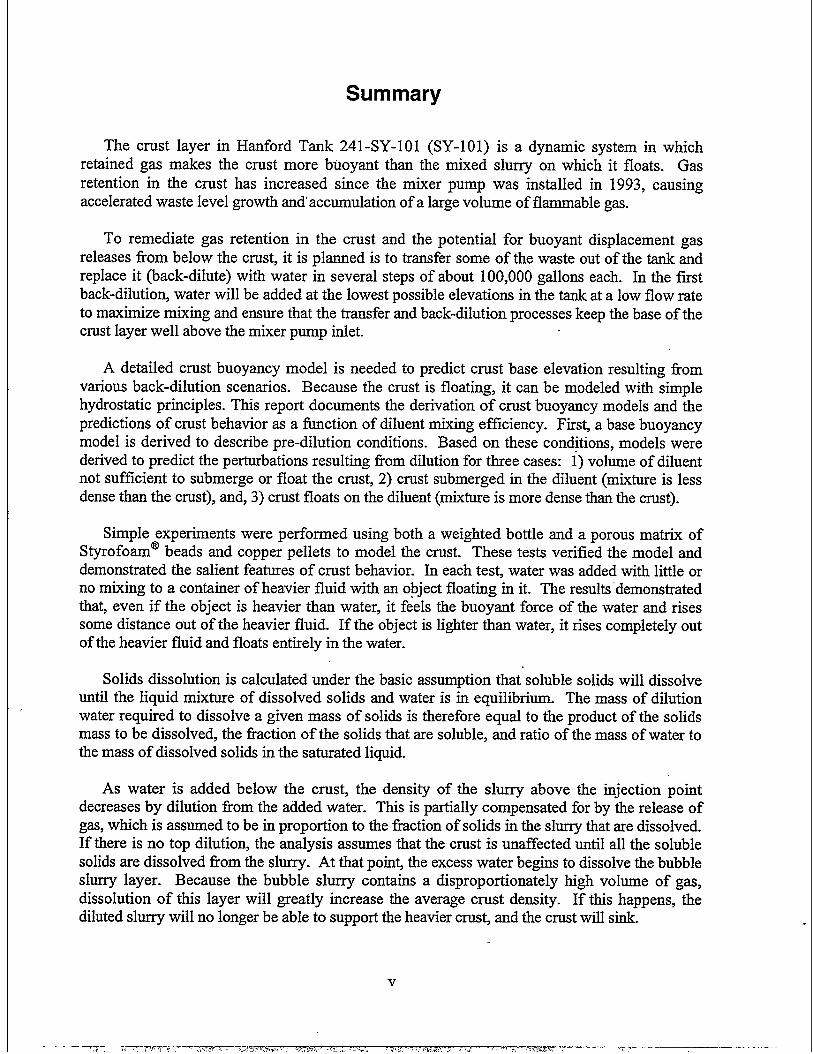
The bottle used tosimulate thecmst intheexperiments described in Section 3.3.l hadanonuniform cross-section where the top fourth of the bottle’s height necked down to less thanhalf the area of the bottom 75% (see Figures 3.5 and 3.6). However, this area change was notconsidered explicitly in applying the crust buoyancy model to the test results. In the referencecondition (with no water addition) and in the cases with partially submerged simulated crustcases, the part of the bottle that was submerged included only the part with uniform cross-section. When the bottle was fully submerged, it was necessary only to account for the totalvolume by assuming a uniform area equal to that of the straight section (41 cm2) and calculatingan equivalent height for the bottle that gave the correct initial submergence. This adjusted heightwas 14 cm for the heavy bottle and 14.24 cm for the light one. Actual bottle height was 16.2 cm.
The large pore diameter of the simulated porous crust allows liquid to flow through it withminimal resistance. Therefore, it was modeled as a uniform solid object with a cross-sectionalarea equal to the.product of the actual area (70.9 cm2) and measured average porosity (42.5% forthe simulated heavy crust and 50% for the light crust). The density was set equal to themeasured average solids density, including both Styrofoam beads and copper pellets (1. 14 g/rnLfor the heavy crust and 0.666 g/mL for the light crust).
The experimental and analytical results are compared in Table 3.5. The differences betweenmeasured and predicted levels are typically less than 2 mm, but the predicted slurry levels for thesimulated heavy porous crust were 4.4 to 6.5 mm higher than measured values. This could bebecause of variable porosity in the simulated crust. The difference between measured andpredicted values was still less than 3 mm in the light porous crust model.
Table 3.5. Comparison of Buoyancy Model Predictions with Experimental Results
Model Water Added Slurry level (cm) Crust base (cm) Water level (cm)Meas. Pred. Mess. Pred. Meas. Pred.
11.12 0.0 0.0
Float 159.3 1.23 1.17 2.89 3.09 ~14.28 14.61Heavy Base 0.0 4.37 4.37 0.0 0.0Porous Partial 49.8 3.65 4.09 0.52 0.47 5.09 5.13(Sec. 4.2.1) Partial 100.0 3.22 3.80 1.01 0.94 5.98 5.89
Submg. 249.2 3.00 3.65 1.44 1.19 7.75 7.89Light porous Base 0.0 2.89 2.89 0.0 0.0(Sec. 4.2.2) Partial 50.1 2.48 2.51 0.46 0.47 3.52 3.69
Partial 100.3 2.17 2.13 0.92 0.94 4.32 4.48Float 234.2 1.88 1.60 2.25 2.43 6.39 6.43
(a) Base Model - Section 2.(b) Partially Submerged/Floating Model - Section 3.2.1.(c) Submerged Crust Model - Section 3.2,2.(d) Floatirw Crust Model - Section 32.3
16

4.0 Dissolution Model
After waste from the mixed slurry layer is transfened out of SY-101 into SY-102, water willbe added both on top of and below the crust layer. The back-dilution scheme is sketched in Fig-ure 4.1. Water will be placed on top of the crust through a flush line in the transfer pump pit.The water will fall 15–20 ft. to the waste surface. Because the water is much less dense than theliquid surrounding the crust, it will flow out across the surface, eventually filling the open spacein the current freeboard. Since the water will flow through the freeboard in intimate contact withthe solids, dissolution of the freeboard layer is expected to be relatively rapid (on the order of aday). Dissolution depth will probably be slightly greater in the vicinity of the water addition butis expected to be relatively uniform over the entire surface of the crust because of the barrier ofthe heavier salt-saturated liquid below.
Water will be added below the crust through the in-line dilution system at the inlet of thetransfer pump, 96 inches above the tank bottom. Because water is much’lighter than the slurry, itwill rise as a plume, mixing with the slurry as it goes. Mixing above the injection point is pre-dicted to be very effective with little stratification (Antoniak and Meyer 1999). The solids sus-pended in the slurry are quite small and are expected to dissolve rapidly in contact with thewater. Assuming pure difhion, a one-micron particle is 99$Z0dissolved in less than one second.Diffusion alone will dissolve 99% of a 10-rnicron particle or 90% of a 100-rnicron particle inabout one minute (Cussler 1984).
High add Low add
FreeboardLiquid Level — ~-
Paste
Bubble_slurryCrust Base —
Diluted slurry (“layer l“)
. .
Injection Point.-—-..
Undiluted Slurry flayer 2“)
. .. . . .. .-—.—..—— —.- . . . -.--—— ..-. ---
Figure 4.1. Schematic of Back-Dilution Locations
17
.. .. .. . ..,., . .T,T .: ,, H,.. . . . . . . . . . , ,.. . . . . . . ——

Essentially no mixing or dissolutionof suspended solids can be expectedin the layerofslurry below the water injection point unless themixer pumpis run. Even then, mixing willbeIirnited ifalarge density gradient has formed. However, there isaIsoprovision foradding waterthrough the “burrowing ring” at the base of the mixer pump. The nozzles in the burrowing ringexit through holes in the bottom velocity plate, 9 inches from the tank bottom. ‘a)Adding water atthis elevation ensures that essentially all of the soluble suspended solids in the entire slurry layerwill be dissolved if enough water is added. (In this analysis, dissolution of the additional solidsthat may be present in the loosely settled layer 50–60 inches from the tank bottom is ignored.)
Solids dissolution is calculated under the basic assumption that soluble solids will dissolveuntil the liquid mixture of dissolved solids and water is in equilibrium. The mass of dilutionwater required to dissolve a given mass of solids is therefore equal to the product of the solidsmass to be dissolved, the fraction of the solids that are soluble, and ratio of the mass of water tothe mass of dissolved solids in the saturated liquid.
Based on a statistical interpretation of SY-101 waste dilution data, the saturated liquid con-tains about 0.79 grams of water for every gram of dissolved solids at tank temperature. Thesolids mass is calculated based on a density of 2200 kg/m3. This is used for undissolved anddissolved solids as well as the insoluble solids composing about 40% of the total solids mass.(b)Water density is assumed to be 1000 kg/m3. The resulting density of the saturated liquid at tanktemperature is 1485 kg/m3. If the mixed slurry layer has a solids volume fraction of 0.15 (seeSection 5.1), the slurry reaches saturation at a mixing ratio of 6.8. The calculational model fordissolution due to water addition at low injection points and specific underlying assumptions aredescribed in Section 4.1. The model for dissolution due to water addition on top of the crust isdescribed in Section 4.2. CaIcuIations of the buoyancy of the crust after dissolution by eitherlow addition or top addition of water are presented in Section 4.3.
4.1 Dissolution Resulting from Low Water Addition
The mixed slurry layer contains solid particles and gas bubbles that are assumed to be uni-formly distributed in suspension. Dissolution of suspended solids is expected to occur only inthe fluid above the water injection point. The slurry layer above the level of the injection point isreferred to as “Layer 1” in Figure 4.1, and the undiluted slurry below that level is “Layer 2.” It isassumed that no dissolution or gas release will occur in Layer 2. Water is assumed to dissolvesoluble solids in Layer 1 above the injection point until the liquid in that layer reaches saturationor until all available solids are dissolved. Insoluble particles are assumed to remain in suspen-sion. If the diluent mixture is not yet saturated after all soluble solids in Layer 1 are dissolved, itis assumed that the crust begins to dissolve. It is further assumed that gas is released inproportion to the fraction of solubIe solids dissolved. Insoluble solids left as the crust dissolves
(a) LMHC Interoffice Memo 79000-99-053 from RE Raymond to the SY-1OI Project Group. August 18,1999. Subjecti 241-SY-101 Mixer Pump Inlet Level, and SY-101 Mixer Pump Drawing H2-89953.(b) Kuhn WL and BE Wells. October 1999. Simplijled Conceptual and Mathematical Model of Dilutionof Tank 241- SY-101 Waste. Letter Report TWSO0.06, Pacific Northwest National Laboratory, Richland,Washington. Results based on data given in NHC Internal Memo 82100-99-015 from Process Chemistryto NW Kirch, April 22, 1999: Dilution Studies of Tank 241-SY-101 Waste - Preliminary Results.
18

from the bottom up areassumed tojoin the slurry. Themodel described below is used todetefine howmuch of thesoluble matetid isdissolved in Layerl andinthe crust and howmuch gas is released in the process, for a given mount of water added.
The mass of undissolved soluble solids in the existing slurry layer above the injection point iscomputed as
(4.1)
where~.= void fraction in the slurry$~~= volume fraction of undissolved solid$ in the slurry
% = density of undissolved solids (2200 kg/m3)
~L = density of saturated mixture of dissolved solids and water (1485 kg/m3)T1 = thickness of Layer 1 before dissolution, including the effect of transfer.
WhereTIO = thickness of Layer 1 before transferVT = volume of transferAT = tank cross-sectional areaFi~Wl= fraction of the total solids mass that is insoluble (40%).
Similarly, the mass of saturated liquid in the slurry layer above the injection point is
M~l =(1 – ~sL)(l – @SL)PLTIAT (4.2)
where p== density of saturated mixture of dissolved solids and water (1485 kg/m3)
The mass of water required to dissolve the soluble solids in the slurry is calculated from themass of undissolved solids computed in Ea. 4.1 as
MW,= EM~l (4.3)
where E = the ratio of water mass to dissolved solids mass in saturated liquid
For current tank conditions, E is defined as 0.79 grams of water per gram of dissolved solids.The mass of soluble solids that will be dissolved by a given volume of water is
where Mm= the total mass of water added below the crust.
19
.-. -—

Any excess water available after dissolving all the soluble solids above the injection point
~WL > Mwl) is assumed to begin dissolving the solids in the base of the crust. Figure 4.1 showsa diagram of the crust layers, with the relatively high void bubble slurry layer at the bottom, thepaste layer for the middle third or so of the crust, the wet clay layer above the paste layer, andcapped by the relatively dry freeboard (see Section 2 for a more complete discussion of crustcharacteristics.) Crust layers are assumed to dissolve sequentially from the bottom up. How farthe dissolution progresses depends on how much unsaturated diluent is available. When water isadded low in the tank, dissolution is expected to affect only the bubble slurry and paste layers.Adding enough water to dissolve higher layers would almost certainly lower the slurry densitysufficiently to sink the crust. It is necessary, therefore, to consider only the bubble slurry andpaste layers when determining the mass of dissolved solids and gas release from the crust for lowwater additions.
The mass of soluble solids dissolved in the bubble slurry layer, AM~~,is calculated as
AM& = min~w~, MWL- Mwl] / E (4.5)
The mass of the soluble solids dissolved in the paste layer is given by
AM~p= min[MwP- AM~P~E,Mw~- Mwl - MW] / E (4.6)
where AM~P~ = mass of soluble solids in paste layer already dissolved by top dilution
The water masses M“w~and MWPare the masses required to dissolve the solids in the twolayers of the crust. The water mass is computed from the solids mass by applying Eq. (4.3). Themass of undissolved soluble solids, M~a, in the i* crust layer is given by
M ‘(l-~i)OC(l-Fi~~Ol)Sci = pSTiAT AT (4.7)
The mass of saturated liquid, MLa, in the iti crust layer is given by
‘(l-ai)(l-O~)‘LCi = pLTiAT AT (4.8)
where= void fkaction in crust layer i
: = volume flaction of undissolved solids in the crustTi = thickness of crust layer i before dissolution&/A, = fraction of tank cross sectional area occupied by crust.
Besides the masses given by Eq. (4.7) and (4.8), solids and liquid also exist in the slurrysurrounding the submerged crust below the freeboard. The contribution of mass of soluble solidsin the surrounding slurry is expressed as
M ( ‘)(l-%L)kSL(l-Finsol)Ssi = pSTiAT 1 – AT
20
(4.9)
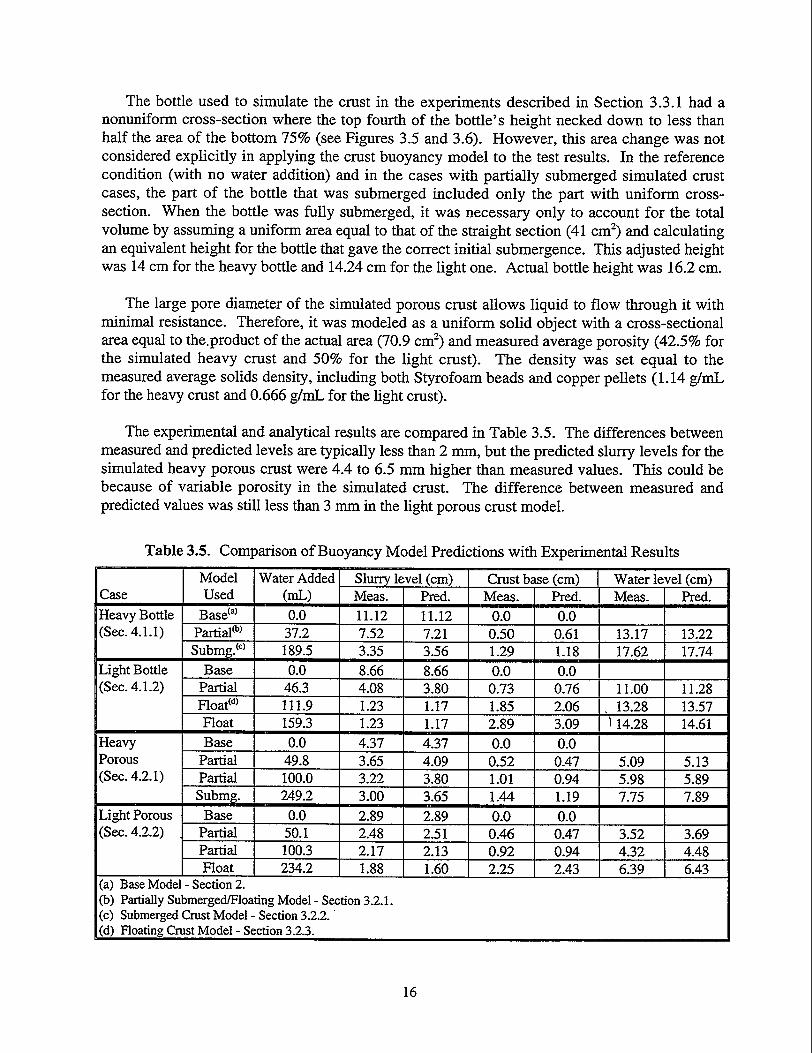
The mass of the liquid portion of the surrounding slurry.is
( -~)(%)(wdMMi = pLTiAT 1 AT (4.10)
The total mass of undissolved soluble solids in the submerged crust layers and surroundingslurry is the sum of the mass values given by Eq. (4.7) and (4.9); that is,
M~i= M~a + M~ti (4.11)
The total mass of liquid in the submerged crust layers and surrounding slurry is the sum ofthe mass values given by Eq. (4.8) and (4.10); that is,
Mu= Mm, + Mm (4.12)
The mass of insoluble solids in the i* crust layer and associated slurry can be calculateddirectly from the total soluble mass for the layer and insoluble mass fraction as
MIS= MS FiNI/ (l-Fin,Ol) (4.13)
The assumption that mixed slurry surrounds the crust is conservative. The passages availableto fluid flow around the crust are believed to be narrow, and the action of the mixer pump wouldnot be expected to push particles up into them. The solids volume fraction around the crust isapparently not affected by the mixer pump because the waste level does not rise dying pumpruns. Gas bubbles, however, are expected to rise up through these passages on their way to thetank headspace. Including bubbles but not particles in the liquid around the cni’stwould reducethe crust mass necessary to create the observed, submergence depth and freeboard height.Assuming that particles are present has the effect of overpredicting by about 10% the wateraddition required to dissolve the crust.
The fraction of the iti crust layer remaining after dissolution and the mass of formerly inter-stitial liquid and insoluble solids freed by it are assumed proportional to the fraction of solublesolids mass that is dissolved. The void fraction, solids volume fractions and other properties ofthe remaining undissolved material are assumed to remain unchanged at their original values.The decrease in layer thickness, ATi, is determined by
fw~iATi = Ti—
M~i
The mass of interstitial liquid, AMu freed from the i* crust layer by dissolution is given by
ml~iAM~i=M —LiM
Si
(4.14)
(4.15)
21
-. -,- -,, .,, ,,, ,., .5-, ---- .. .,.,.,,. ,. .. . . ..!. .<. . . .. . .. ...... . .— --r- .-——-————

Similarly, the mass of insoluble solids, AM1~,freed from the iti crust layer by dissolution is givenby
fml~i F.AMI~i = M msol. — = ‘Si 1 – ‘insO11S1 M
Si
(4.16)
The freed insoluble solids, the liquid mixture from crust dissolution (consisting of the dis-solved solids and freed interstitial liquid), and the added water are assumed to mix completelywith the diluted waste in the slurry above the water injection point.
4.2 Dissolution Resulting from Water Addition
Dissolution of the upper crust layers is assumed to proceed
on Top of the Crust
sequentially from the top down.The water dissolves ali ‘tie soluble solids available in the top layer first. Only then is anyremaining unsaturated diluent mixture available to begin dissolving the next layer down. Thetop dilution model considers dissolution only of the freeboard, wet clay, and paste layers. Cal-culations for the wet clay and paste layers use the same model as that described in Section 4.1above for dissolution of the bubble slurry and paste layers due to bottom dilution. The solids andinterstitial liquid mass quantities are determined by Eq. (4.7) through (4.13). The amount ofwater required to dissolve the soluble solids can be calculated by applying Eq. (4.3) to the layer ~being considered.
Because it is above the liquid level, the freeboard layer is a special case. Its properties differsignificantly from the submerged layers below, and it is not surrounded by mixed slurry. Thesoluble solids mass in the fkeeboard layer is computed by
(&)AT(l-Finsol)MSF = (1 – ~F)(l – ‘F)!?STF AT
wherea~ = void fraction (volume IYaction of large voids) in the freeboard~ = porosity of the non-void region (which is subject to capillary action)T~ = thickness of the freeboard layer before dissolution.
The interstitial liquid mass in the freeboard layer is given by
()~ ATM~F = (1– ~F)@FVPLTF AT
(4.17)
(4.18)
where
v = average liquid saturation in the non-void fraction due to capillary action(the porosity is filled with liquid when v = 1)
The fraction of the overall crust freeboard volume that is not solid or liquid can be computedas
22

Q~ = (l–a~)co~(l-ly)+ cx~ (4.19)
The soluble solids mass in the freeboard that is dissolved by high water addition is calculatedlike Eq. (4.4) as
AN&,= min~W~, MW~]/ E (4.20)
whereMWH = the total volume of water added on top of the crustMw~ = the mass of water to dissolve the soluble solids in the entire freeboard
(MW = EMS,).
Any excess water available after the entire freeboard layer is dissolved is assumed to firstdissolve the wet clay layer and then the paste layer, in sequence. The mass of material thatdissolves from the clay layer is expressed as follows:
AM~c= min~wc, MW - Mw~]/ E (4.21)
The mass of material that dissolves ~om the paste layer is given by
L?J& = min~wP, MW~- MW~- MWC]/ E (4.22)
Eq. (4.3) is applied to the paste layer and the wet clay layer to determine MWPand Mwc, the massof water needed to dissolve tie soluble solids in each of these layers. The solids and liquid massof the two non-freeboard layers are computed with Eq. (4.7) through (4.13).
Tlie thickness of the remaining crust layers after dissolution and the mass of formerly inter-stitialliquid and insoluble solids freed by the dissolution are assumed proportional to the fractionof the total soluble solids mass dissolved. The void fraction, solids volume fractions, and otherproperties of the remaining undissolved material are assumed to remain unchanged at theiroriginal values. The decrease in layer thickness is determined by Eq. (4.14). The mass of ,interstitial liquid freed is c@culated in Eq. (4.15). The mass of freed insoluble solids isdetermined using Eq. (4.16).
The liquid mixture consists of the dissolved solids and interstitial liquid fi-eed from pores inthe crust as a result of dissolution as well as the added water. This mixture is assumed to flowdown through the crust and mix completely with the slurry supporting the crust. The insolublesolids freed by dissolution are conservatively assumed to remain as added weight on top of thecrust.
4.3. Effect of Dissolution on Crust Buoyancy
Whether or not the crust will continue to float after dilution can be determined by applyingthe buoyancy model described in Section 3 to the diminished crust. If the new average crustdensity is still lower than that of the surrounding liquid, it will float. The density of the
I 23
.-. . ,,.—.. . ——

remaining crust is computed by summing up the remaining mass and dividing by the remainingvolume. The remaining crust volume is given by the following expression:
‘cR=AT*[[l-%}F’’-Q+(4.23)
(AM1~F+ AM1~c + AM1~p)+
PSD
whereTi = the original layer thicknessATi = the change in thickness due to dissolution calculated by Eq. (4.9)S2F = the fraction of the freeboard that is not solid or liquid, from Eq. (4.14)
PSD = the density of dissolved solids.
The last term on the right side of Eq. (4.23) represents the volume of the insoluble solidsfreed by dissolution resulting from water added on top of the crust. This material is assumed toremain on top of the crust; the masses are calculated using Eq. (4.16). The insoluble mass fromthe paste layer is only that part produced by top dilution.
The mass of the remaining crust that is contained in volume VCRis computed by multiplyingthe original layer mass (excluding the surrounding slurry) times the ratio of the remaining layerthickness to the original thickness and adding the mass of insoluble solids remaining on top ofthe crust. This is expressed by
[ )[ATF M~cFM
)[
ATC——CR=l T +MLCF + l–—
, (1- FinSOl) Tc
M‘cc + M~Cc
(1- Fi~~Ol) )
[ )[ATP MSCP+ l–—
TP (1_ Fin~Ol)‘“LCP)+[l-2)[(:E01)+MLCB)
(4.24)
+AMISF + AMISC+ AMlsp
The original freeboard mass of soluble solids and interstitial liquid is given by Eq. (4.17) and(4.18), and the original masses of the submerged layers, excluding the surrounding slurry, iscomputed from Eq. (4.7) and (4.8). Dividing the soluble solids mass by (l-Fin,OI)gives the totalsolids mass. Note that only the insoluble solids mass freed from the paste layer due to top dilu-tion is included in Eq. (4.24). That part freed by dissolution from the bottom up is assumed tomix with the slurry.
The average density of the remaining crust is simply the remaining mass divided by theremaining volume
24

MC~pCR= —
‘CR(4.25)
For the crust to float, the density of the slumy must exceed the density of the remaining crust,as computed by Eq. (4.25). The slurry density after transfer and back-dilution is determined by
●
●
●
●
●
the mass of the original slurry liquidthe mass of the suspended soluble solids in the slurry above the water injection pointthe mass of dilution water added above and belowthe total mass of dissolved solids, insoluble solids, and freed interstitial liquid resultingfrom crust dissolutionthe reduction in liquid volume due to gas release resulting from dissolution of slurrysolids above the water injection point.
The liquid from dissolving the crust will not mix effectively with the underlying liquid if it islighter than the slurry after dilution. In such a case, it will remain in a stratified layer on,top ofthe slurry. It is therefore necessary to compute the slurry density in two steps. The f~st step is tocalculate the density considering only the effects of dilution and gas release in the crust. If thisdensity is high enough to permit mixing of the two liquid layers, the second step is to add in theeffect of flowdown and mixing of the liquid portion of the dissolved crust.
Before the addition of liquid from flowdown of dissolved crust, the volume of the slurryabove the injection point, ‘V~l,is the sum of three components. These are the amount of theoriginal sluny volume that did not dissolve, the volume of the water added to the slurry that didnot dissolve crust, and the volume of the dissolved solids and associated liquid. We conserva-tively assume at this point that the insoluble crust solids released by bottom dissolution have notyet joined the sluny. This sum can be expressed as
(4.26)
whereTl = the thickness of the slurry layer above”the injection point after transfer
but before back-dilutionAML* = M@!I@l~, with M~l from Eq. (4.2)MW, = EM~l.
The quantities Ah&l, AMI~land M~, in Eq. (4.26) are defined by Eq. (4.4), (4.16) and (4.1),respectively. The corresponding total mass, Ml, is the sum of the original solids and liquid massabove the injection point and the water added
Ml= M~I + M~l + M~l + MWI (4.27)
The density of the slurry before flowdown of the dissolved crust is the mass divided by thevolume
25
. .. .---~-, ,Ys . . ..- . . .. —-7--- -- ,.- ... . . . . .,,., . ..-. ... . . . -/.

.-—.
Ml
‘l=y(4.28)
After flowdown, the volume and mass of the dissolved solids and freed liquid from both thecrust and surrounding slurry are added to VI and Ml, respectively. The insoluble solids freed bydissolution of the bottom crust layers and the total water added above the crust must also beadded to VI and MI. This yields
ANL.F + AM~c + AM~p + AM~B ‘AM1~p+ AM1~BVIF = VI + +
pSD Ps
AM~~ + AM~C+ AM~P + AM~~ Mw~ + Mw~ – Mwl+ +
pL Pl#v
The new mass after flowdown is given by
Ml~ = Ml + AM~~ + AM~C + AM~P + AMsB + AMIsP + AMIsB
+AML~ + AMLC + AMLP + AMLB + MWH + Mm – Mwl
The new density after flowdown is simply the result of Eq. (4.30) divided by Eq..(4.29):
‘lFplF = —
‘IF
(4.29)
(4.30)
(4.31)
The densities calculated using Eq. (4.28) and (4.31) assume perfect mixing in the slurry layerbetween the base of the crust and the water injection point. Of course, mixing will not be per-fect, and some degree of stratification will occur. To characterize the degree of mixing that canbe expected, the low back-dilution process was simulated using the TEMPEST code (Antoniakand Meyer 1999). The simulations predicted very good mixing, with only a slight density gradi-ent between the injection point and the crust base. Stratification is conservatively included incalculations by assuming that the liquid forms two stratified layers rather than a smooth gradient.The densities of the two layers are computed by multiplying the density of each layer by a strati-fication factor. This factor is calculated as the ratio of the minimum slurry density to the maxi-mum slurry density predicted in the simulations. The minimum specific gravity computed inTEMPEST for the liquid below the crust after adding 100 kgal of water at the transfer pump inletwas 1.52, and the maximum was 1.56. This results in a stratification factor of 1.52/1.56 = 0.97.
With the assumed stratification, the crust remaining after dilution/dissolution is predicted tofloat if the following condition is met:
p~~<0.970 min(pl, plF) (4.32)
26

If the crust remains floating after dilution and flowdown of the dissolved solids, we mustdetermine if the crust base remains above the mixer pump inlet. Conservatively assuming thatthe crust is floating with zero freeboard, the level of the crust base is given by
HB=T2+v1F/AT (4.33)
where T2= the thickness of the undiluted slurry layer below the injection point.
The total crust thickness, Tc~, remaining after dissolution and flowdown is
TCR=TO- AT~- AT=- ATP- ATB (4.34)
where TO= the original crust thickness. (The insoluble solids left on top of the crust are notincluded in the thickness calculation.)
27
---- . —-.—— —


5.0 Crust Response to Transfer and
The buoyancy and dissolution models described in Sections
Back-Dilution
3 and 4 have been applied todetermine transfer and back-dilution volumes that will not cause the crust to sink. ~{ is alsonecessary to ensure that there will be sufficient water added to float the crust well above themixer pump inlet. Input parameter values to characterize the crust and slurry for the buoyancyand dissolution models are established in Section 5.1. Section 5.2 presents the results obtainedwhen the buoyancy model is applied in conjunction with the dissolution model. This sectionincludes a parametric investigation to determine as a function of transfer volume the maximumvolume of low water addition that will not sink the crust.
5.1 Parameter Values for Current Crust Conditions
The current condition and prope~ies of the crust are needed to apply the buoyancy anddissolution models. The material properties of the crust mixed slurry have been reasonably wellestablished by ball rheometer measurements (Stewart et al. 1995) and core samples (Reynolds1993). Data from recent dissolution experiments on 1998 core samples were also interpreted toprovide consistent values at tank temperature. (a) These da~ me sumrntied in Table 5.1.
Reasonable estimates for the remaining parameters were developed by comparing the buoy-ancy model results with a series of measured levels. Table 5.2 lists data for specific dates forwhich input values are known with some confidence. The unknown parameters were adjusted togive the best match with the measured waste levels. The last column summarizes the best-esti-mate values for the parameters to be used in modeling current conditions. Measured values areshown in bold. The crust thickness was determined fi-om temperature profdes from validationprobe runs in the multi-function instrument trees (MITs). The crust and slurry void fractionswere obtained from the VFI (Stewart et al. 1998) or RGS (Mahoney et al. 1999).(b) The mea-
sured waste surface level was assumed to be the value indicated by the Enr@’ buoyancy gauge inriser 002 (1A). The liquid level was taken to be the value read on the Enraf in riser 001 (lC)after a water flush.
When the best-estimate values from Table 5.2 are applied with the current crust thickness,levels and estimated void fractions, the basic crust buoyancy model derived in Section 3 providesa description of the current cm’st configuration. The results We summarized in Table 5.3. Themeasured waste levels for mid-June 1999 match the predictions well. The crust is just over 3 mthick and about 86% submerged. It has an average void fraction of about 0.23,
(a) Kuhn WL and BE Wells. October 1999. Simplified Conceptual and Mathematical Model of Dilutionof Tank 241- SY-101 Waste. Letter Report TWSOO.06,Pacific Northwest National Laboratory, Richland,Washington. Results based on data in NHC Internal Memo 82100-99-015, from Process Chemistry toNW Kirch, April 22, 1999: Dilution Studies of Tank 241-SY-101 Waste-Preliminary Results.(b) Slurry void fractions are currently estimated ”from trends in the mixer pump nozzle pressure duringpump runs calibrated to RGS data. The pressure is approximately proportional to fluid density, which, inturn, is proportional to the non-void fraction.
29
—... ..,. , .,, ,,. ?-.. .,,,, .. . . . . .. .!.,.....,,*, . . . . . . . ...?... .,, ,., . . . . . . . . . .~——— .

Table 5.1. Crust Material Properties
Solids specific zravitv - undissolved ~Solids specific gravity - dissolved 2.2Liquid specific gravity 1.49Fraction of solids mass that is insoluble 0.4Crust submerged solids volume fraction 0.36
(results in a crust degassed specific gravity of 1.75)Mixed slurry solids volume fraction 0.15
[results in a SIUITVde~assed suecific sravitv of 1.60) I
which has been divided into the four layers described in Section 2. The bulk slurry void fractionis estimated as 0.027 from the mixer pump volute pressure trend. Two inches have been addedto the degassed level to account for the approximately 2000 gallons of water added duringoperation of the mechanical mitigation arrn(d in May and the water used in lancing and
installation of the transfer pump in August 1999.
Table 5.2. Base Parameter Values for Buoyancy Model——
Date 7/19/98 9/22/98 2/8/99Event VFI VFI RGS
Crust thickness (cm) 150 155 200Crust submerged void fraction 0.3 0.32 0.34Mixed slurry void fraction 0.013 0.015 0.025Crust freeboard void fraction 0.34 0.34 0.34Crust freeboard porosity 0.42 0.42 0:42Crust freeboard saturation 0.6 0.6 0.6Crust area fraction 0.86 0.86 0.86Degassed level (cm) 994.5 994.5 994.5
Predicted Crust Levels (inches)Surface 415.1 417.4 428.1Liquid 401.7 402.9 408.7
Measured Levels (inches)Surface 415.5 418.0 428.0Licmid 403.0 403.4 4m11-1
BestEstimate
0-34
0.420.6
0.86994.5
(a) Stewart CW. April 1999. Initial Operation Plan for Mechanical Crust Mitigation in Tank241-SY-101. Letter report TWS99.32, Pacific Northwest National Laboratory, Richland, Washington.
30

Table 5.3. Base Crust Configuration (summer 1999)
Bulk slurry void fraction 0.027 Degassed level (cm) ‘ 996.5Freeboard Thickness (cm) 50 Freeboard Void Fraction 0.34Wet Clay Thickness (cm) 32 Wet Clay Void Fraction 0.08Paste Thickness (cm) . 203 Paste Void Fraction 0.21Bubble Slurry Thickness (cm) 25 Bubble Slurry Void Fraction 0.60
Total Crust Thickness (cm) 310 Avg. Submerged Void Fraction 0.23
Measured Waste LeveIs (in.) -
Computed Values Liquid (Enraf lC) 412Submergence (cm) 260 Crust Base (in) (.Neutron Probe) 310Submerged S.G. (including gas) 1.34 Predicted Waste Levels (in.)
Freeboard S.G. 1.98 Surface 431Average crust S.G. 1.41 Liquid 412Bulk s~as) , _1.55 Crust Base 310
5.2 SY-I 01 Crust Buoyancy Predictions Including Dissolution
In order to confidently predict the behavior of the crust during back-dilution it is necess~ toaccount for dissolution when applying the crust buoyancy model to the various proposed back-dilution scenarios. The following two subsections use the models described in Sections 3 and 4to investigate the effects of water addition for two general cases. Section 5.3.1 describes thelimits when water is added only through injection points low in the t-, Section 5.3.2 describesthe limits when some portion of the total water addition is injected on top of the crust.
5.2.1 Limits on Low Water Addition
As water is added below the crust, the density of the slurry above the injection pointdecreases because the slurry is diluted by the added water. This is partially compensated for bythe release of gas, which is assumed to be in proportion to the fraction of solids in the slurry thatare dissolved. If there is no top dilution, the analysis assumes that the crust is unaffected until allthe soluble solids are dissolved from the slurry: At that point, the excess water begins to dissolvethe bubble slurry layer. Because the bubble slurry contains a disproportionately high volume ofgas, dissolution of this layer will greatly increase the average crust density. V/hen this happens,the diluted slurry will no longer be able to support the heavier crust, and the crust will sink.
In the current plan, two locations will be used for low water addition the transfer pumpinlet, 96 inches from the tank bottom, and the mixer pump burrowing ring, 9 inches from the
31
.,, .,1$..-. .. . .. .-’. .------ -. ... . . .-—. —.
.

tank bottom.(d Thelower tie back-dilution water injection point, thelmger thevolumeofsluq
available to mix with the water. This means that the back-dilution volume could be larger ifwater were added through the mixer pump base rather than through the transfer pump inlet.
For an equal back-dilution volume, larger transfer volumes will result in more dilute slurry.At some point, the resulting mixed slurry density will be too low to float the crust, and the back-dilution volume will need to be reduced below the transfer volume to prevent the crust fromsinking. With a lower back-dilution volume than transfer voIume, the crust base will ofnecessity be lower because there will be a net decrease in the volume of the mixed liquid slurryas transfer volume is increased. Transfer is finally limited to that volume for which the maxi-mum back-dilution will not raise the crust base sufficiently above the mixer pump inlet to ensureeffective operation. Because the mixer pump has operated effectively with the crust base as lowas 295 inches, this level has been chosen as the lower limit.
Figure 5.1 shows the maximum back-dilution volume and crust-base elevation as a functionof transfer volume. Different curves are shown for the two cases of water addition through themixer pump base at 9 inches and the transfer pump inlet at 96 inches. (Note that in neither caseis water added on top of the crust.) Assuming an equal back-dilution volume, the maximumtransfer volumes allowed to prevent crust sinking for these two cases are
● 90 kgal for the 96-inch injection point● 120 kgal for the 9-inch injection point.
Both of these conditions keep the crust base above 295 inches. Higher transfer volumes can beachieved by reducing the back-dilution volume enough to keep the crust from sinking while alsokeeping the crust base above 295 inches. For the two possible injection points, the maximumtransfer volumes and corresponding reduced back-dilution volumes are
● 143 kgal transfer volume, 80 kgal back-dilution volume at the 96-inch injection point. 175 kgal transfer volume, 112 kgal back-dilution at the 9-inch injection point.
To ensure that the transfer and back-dilution will not cause the crust to sink, it is advisable toreduce the transfer volume somewhat to provide a safety margin in the back-dilution volume.Applying the buoyancy/dissolution models iteratively shows that, for a 100-kgal transfer, crustsinking is predicted with a back-dilution of 84 kgal injected at 96 inches. Limiting the back-dilution to 72.5 kgal for this case, however, will keep the crust base above 295 inches. Thisprovides a safety margin of 11.5 kgal. With injection at the 9-inch elevation, crust sinking ispredicted at a back-dilution of 116.5 kgal for a 125-kgal transfer. A safety margin of 13.5 kgal isprovided if the back-dilution is limited to 103 kgal for this case.
(a) LMHC Interoffice Memo 79000-99-053, from RE Raymond to the SY-101 Project Group, August 18,1999. Subjecc 241-SY-101 Mixer Pump Inlet Level and SY-101 Mixer Pump Drawing H2-89953.
32

(
(
1
(
(
(
i
(
11f
(
33
... . . -.”... —. . . . . . . ,,>.c-,~,F., ,-*,,, ..$,,,,,., . ....?. .,, .. ..- .-- / .,.. !l-.,.,., -—,,.,
175 ,
‘BackDilution Volume ~~ 150 :......~ — Add @ 96” ""--"--"""""~"-"""-"-""""-"----"---"""-".""-";---------------------------------------
i!? 125 1....... ----- Add@9° :~ ................................................................................................._
e:--=-m--mmmm --m :#e :3 *; -- y..=--~ 100 –......~.;.......................................*.O......................................................................................................_
.8 :*9
.................................................................................................. ..<+ ~ ~ : /
.............~
0 -!“:-- ......... -""""""":"""""""""-"""""""""""""""""""""";""""""""""---------------------------*. .....Y..*...= ...............................—
E Crust Base Elevation.; 25-. ..... ‘--=- Add @ 96” ‘“””””””””Crest Base ......................... ..=.............—
: %.m.
5 o=--- Add@9° j
, I , , , , I , ! I ,
60 90 120 150 180
Transfer Volume (kgal)
Figure 5.1. Limitation on Low Water Addition to Prevent Crust Sinking
These limits can be further extended by the simple expedient of adding water to the top of thecrust to dissolve as much as possible of the heavy freeboard and wet clay layers. These layersare negatively buoyant, so removing them makes the crust much lighter. Within the uncertaintyof crust density measurements, dissolving these layers makes the crust positively buoyant almostunconditionally. This is illustrated by repeating the calculations for these two cases with 20 kga.1of water added on top of the crust and the remainder of the back-diIution volume injected at eachof the two low elevations. The results are shown in Figure 5.2.
The crust base elevation increases initially as the bubble slurry and lower paste layersdissolve, then decreases when back-dilution is limited to prevent crust sinking. For the twoinjection levels, the maximum transfers with equal back-dilution volumes that will prevent crustsinking are as follows
. 128 kgal for the 96-inch injection point
. 160 kgal for the 9-inch injection point.
Much larger transfer volumes are possible when the back-dilution volume is reduced toprevent crust sinking. However, with top back-dilution, the crust base remains well above thehistoric 295-inch minimum for any practicable transfer volume. This result shows that somesignificant amount of water addition on top of the crust is very beneficial in providingoperational flexibility to the transfer and back-dilution process.

.—— ——.... —e— — .—
175B“ackDilution Volume ~A— Add @ 96”,20 kgal top ..................~._.X.=.=.O..=..=..=.-.=.=..=.<
w
.. .................. ............... .... ......
z+
.................>...% .......––o.=
~
E Crust Base Elevation ;-~ 25 z..... —---- Add @ 96”,20 kgal top -... --.....~-.Lowest Historic -----
#o ~--- Add @ 9“, 20 kgal top. ; Crust Base
I ! I ,
60 90 120 150 180Transfer Volume (kgal)
400
380
360 f
G340 R
CDm
320 ~c?.
300 ‘:M.s
280
260
Figure 5.2. Limit on Low Water Addition after 40 kgal Is Added to Crust Top
5.2.2 Limits on Top Dilution
With top dilution, crust sinking ceases to be a concern for any transferor back-dilution vol-ume. As shown by the analyses in Section 5.3.1 above, dissolving the freeboard and wet claylayers removes the negatively buoyant portion of the crust. Dissolution of the paste layer fromthe top down results in a continuous decrease in the average crust density, which potentiallycould proceed even to the point where the crust would float in pure water. (The bubble slurrylayer by itself has a bulk specific gravity of only 0.7, with the assumed 0.6 void fraction for thislayer of the U’I.LSt.)
Top dilution raises the crust even more effectively than low addition, although it does not actas immediately. Even before the freeboard dissolves, water placed on top of the crust exerts asignificant buoyant force that lifts the crust out of the heavier slurry, as shown by the experi-mental results presented in Section 3.3 above. As solids in the upper layers dissolve, the densityof the fluid mixture on top of the crust increases. When the density of the liquid mixture layerexceeds the bulk density of the crust, the crust can float on it and the mixture flows down to jointhe slurry. Because of the intimate contact expected between the water and solids, it is estimatedthat the freeboard layer will completely dissolve within a day. Dissolution of the currently sub-merged layers will proceed more slowly, and may require on the order of a few weeks.
The only concern that could be considered a limit to top dilution is the potential for the pastelayer to be so thinned and weakened that the bubble slurry could penetrate through it. This couldrelease gas from the.bubble slurry layer so rapidly that the tank headspace could become flam-mable. However, transferring waste out and dissolving the upper layers of the crust to the pointthat the bubble slurry could release gas greatly increases the tank headspace. If all of the bubble
34

slurry layer gas were suddenly released after a transfer of 100 kgal, the hydrogen concentrationwould be only slightly above 50% of the lower flammability limit (LIZ). The concentrationwould be less than 50% of the LFL following a 150-kgal transfer (assuming that the bubbleslurry thickness remains at its present value of approximately 10 inches.)
In addition, it has been demonstrated that a much thinner past layer than presently exists isstill strong enough to contain the bubble slurry. During VFI and RGS measurements in the fallof 1998, a bubble slurry layer existed with a measured void fraction exceeding 50~0. The crust atthat time was about 60 inches thick, approximately half the current 120 inches. (Note that thecrust was only 30-40 inches thick for many years in the past, but it is impossible to determinewhether a bubble slurry layer also existed during that time.) This experience shows that the crustcan be confidently thinned to at least 60 inches without releasing the bubble slurry.
The predicted effect of top dilution on crust thickness and crust base elevation is shown inFigure 5.3. The figure assumes a 150-kgal transfer, with 30 kgal added at the transfer pump inletand an additional volume added on top of the crust. The figure shows that about 50 kgal can beplaced on top of the crust without reducing the thickness down to the historic 60 inches. Notealso that a 35-kgal top addition brings the elevation of the must base above 295 inches, andfurther top dilution continues to raise the crust. We conclude that there is no impediment toadding significant volumes of water on top of the crust layer.
140
120
100
80
60
40
20
----- Crust Base Elevation (in)
— Crust Thickness (in) “-~”.-...--””””-------------–
. ......................... “
. ...................................................
:0
v , , , I , !
380
360
340
320
300
280
260o 20 40 60 80 100
Top Dilution (kgal)
Figure 5.3. Effect of Adding Water to Crust Top after 150 kgal Transfer
35
-~~ -- - .-,- ,...,. ....7.-/! . ...,., ~., .. . . . . . ..-


6.0 References
Antoniak ZI and PA Meyer. 1999. Potential Waste Stratification from Back-Dilution in Tank241-SY-101. PNNL-13038, Pacific Northwest National Laboratory, Richland, Washington.
Barton WB. 1999. Mbximurn First Transfer and Dilution Volume for Tank 241-SY-101. RPP-5344, Lockheed Martin Hanford Company, Richland, Washington.
Cussler EL. 1984. Di@sion: Mass Transfer in Fluid Systems. Cambridge University Press.
Herting DL, DB Bechtold, BE Hey, BD Keele, L Jensen, and TL Welsh. 1992. Laborato~Characterization of Samples Taken in December 1991 (Window E) J-em Hanford Waste Tank24 I- SY-1OI. WHC-SD-WM-DTR-026, Westinghouse Hanford Company, Richland,Washington.
Mahoney LA, ZI Antoniak, JM Bates, and ME Dahl. 1999. Retained Gas Sampling Results forthe Flammable Gas Program. PNNL-13000, Pacific Northwest National Laboratory, Richland, ‘Washington.
Raymond RE. 1999. Tank 241-SY-101 Su#ace-Level-Rise Remediation Project Plan.HNF-3824 Rev. O,Lockheed Martin Hanford Corporation, Richland, Washington.
Reynolds D.A. 1993. Tank 101-SY Window E Core Sample: Interpretation of Results.WHC-EP-0628, Westinghouse Hanford Company, Richland, Washington.
Schienbein LA, SA Bryan, DL Lessor, PA Meyer and CW Stewart. 1999. Gas Retention andRelease Behavior in Hanford Double-Shell Waste Tanks. PNNL-I 1536 Rev. 2, PacificNorthwest National Laboratory, Richland, Washington.
Stewart CW, JM Alzheimer, G Chen, and PA Meyer. 1998. In Situ Void Fraction and GasVolume in Hanford Tank 241-SY-101 as Measured with the Void Fraction Instrument..PNNL-12033, Pacific Northwest National Laboratory, Richland, Washington.
I 27>1
., ,., ,, ..,. - ,.. ,,.. . ,... ,, . . .. . . !. ., . .:. /,, ... .,..-. . . . ,., “ . . ... .. . .. ,. ., . . . , . . . .,.. . . . . .- ——. . . .
I

-- -—- -.mr 7— . . ..=--. ,,. . . . . . . ,,, .>, ,. ... ,.. ..>. — -— --- .- —- ----
Appendix .
Crust Buoyancy Model

Appendix
Crust Buoyancy Model
Thecrust buoyancy model uses basic hydrostatics to establish reference conditions fromwhich the effects of dilution are then calculated. This model is illustrated in Figure A. 1. Gas isassumed to be retained in the submerged portion of the crust as particle-displacing bubbles ofvoid fraction ac. The pores between particles are assumed to be completely saturated withliquid. The overall density of the submerged material is pc, which depends on the void fraction;the solids volume fraction in the crust, $~c;and the liquid and solid phase densities, p~ and p~,bythe expression
Pc = (1 - %J[oscps+ (1 - @sc)PLl (A.1.1)
Likewise, the density of the mixed slurry, ps~,on which the crust floats depends on the voidfraction, solids volume fraction, and phase densities in that layer. It is defined by
(%L= O - %L)[hLps + U - th)%j (A.1.2)
All pores and void spaces in the exposed freeboard portion of the crust are assumed open tothe headspace and therefore contain the headspace atmosphere. The exposed crust contains voidspaces of volume fraction ctD,which may or may not be equal to etc. The solid crust materialsurrounding the void spaces has porosity @D.The pore spaces, but not the voids, are partiallyfilled with liquid at an average saturation of y. The overall density of the exposed crust is pD,which is related to the other quantities by
PD= (1 - @[ @D~pL + (1 - %)Ps] (A.1.3)
A& 1
Hs +............ .....-......- ........m.....-. ... ,,,w,,,,. +,.s,.,7,,s,1?+!1,1,,.,,,,,,,. ,,, ,+●*t,,
%(%3 ~$ aD3 k> PL) ?HL
““+ Tc-“7
s,4
PC(OSC)~c> Ps PL)
H.
l--–---–- ---- ------ ----— ----------- -–-–-———–—–— ———... 1
Figure Al. Detailed Crust Buoyancy Model
A. 1
HO
I . . : - .-,.-,7 ,.n. .—iyr~, -.~,— ,,, ,,. , . .> ,,.,.. ,,. . . . ..--.. . ...>. .—— ---- —
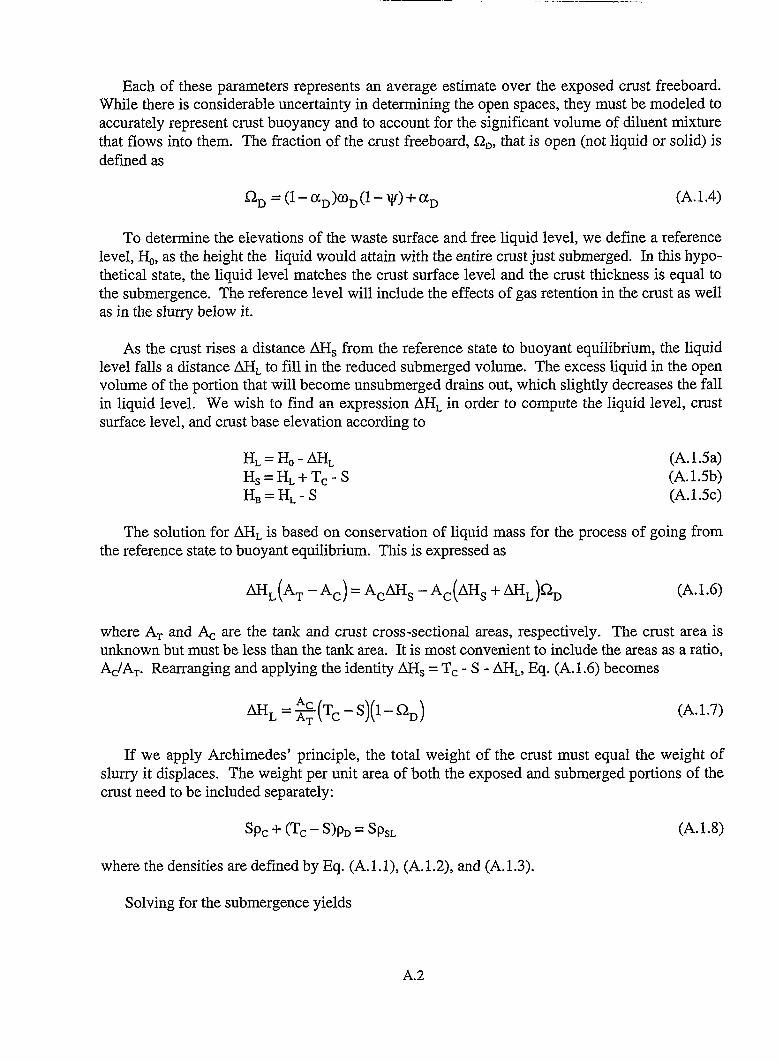
Each of these parameters represents an average estimate over the exposed crust freeboard.While there is considerable uncertainty in determining the open spaces, they must be modeled toaccurately represent crust buoyancy and to account for the significant volume of diluent mixturethat flows into them. The fraction of the crust freeboard, t2~, that is open (not liquid or solid) isdefined as
L2D= (l–c@@D(l-yo+a D (A.1.4)
To determine the elevations of the waste surface and free liquid level, we define a referenceIeveI, HO,as the height the liquid would attain with the entire crust just submerged. In this hypo-thetical state, the liquid level matches the crust surface level and the crust thickness is equal tothe submergence. The reference level will include the effects of gas retention in the crust as wellas in the slurry below it.
As the crust rises a distance AH~from the reference state to buoyant equilibrium, the liquidlevel falls a distance AH~to fill in the reduced submerged volume. The excess liquid in the openvolume of the portion that will become unsubmerged drains out, which slightly decreases the fallin liquid leveI. We wish to find an expression AHLin order to compute the liquid level, crustsurface level, and crust base elevation according to
H,= HO-AH, (A.1.5a)H~=H~+Tc-S (A.1.5b)HB=H~-S (A.1.5c)
The solution for AH~ is based on conservation of liquid mass for the process of going fromthe reference state to buoyant equilibrium. This is expressed as
(A.1.6)
where AT and & are the tank and crust cross-sectional areas, respectively. The crust area isunknown but must be less than the tank area. It is most convenient to include the areas as a ratio,&/AT. Rearranging and applying the identity AH~ = T= - S - AH., Eq. (A.1.6) becomes
AH~=fi(TC-S)(l-K2~) (A.1.7)
If we apply Archimedes’ principle, the total weight of the crust must equal the weight ofslurry it displaces. The weight per unit area of both the exposed and submerged portions of thecrust need to be included separately:
Spc+ (Tc – s)p~ = sp~~ (A.1.8)
where the densities are defined by Eq. (A. 1.1), (A. 1.2), and (A. 1.3).
Solving for the submergence yields
A.2

S=TC ‘D (A.1.9)PD + p~~ – PC
The reference level includes the in situ volume of gas retained both in the crust and in thelayers below the crust:
(A.1.1O)
where hOis the degassed waste level with all solids submerged, V~~~is the in situ gas volume inthe slurry layer below the crust, and V~c is the in situ gas volume in the crust. Because the crustis assumed submerged at the reference level, the effect of gas in the crust must be distributedover the entire surface area. The volume of gas in the crust can be expressed in terms of thesubmergence and void fraction as
v (-j~ = c@& (A.1.11)
The gas in the slurry layer can be similarly computed by assigning a void fraction, ~~, forwhich the non-gas volume is the total degassed volume less the degassed volume of the crust.The result is
‘GsL = I:; [hOAT-@-aCJsAC-(l-QD)(TC -s)AC] ‘A-1”12)SL
Combining Eq. (A. 1.10), (A. 1.11), and (A. 1.12) provides the final expression for thereference level:
AC
: [hO-(l-~C)s~-(l-QD)(TC-s&] ‘Ao1013)HO=ho+@~+l ~
SL
The steps required to determine the free liquid level, waste surface level, and crust baseelevation are as follows:
1. Determine the submergence with Eq. (A.1.9)1. Find AH, using Eq. (A.1.7)3. Calculate the reference level, HO,with Eq. (A.1.13)4. Compute H~, H~and H~ via Eq. (A. 1.5a), (A.1.5b), and (A.1.5c), respectively.
A.1 Partial Submergence or Flotation
Figure A.2 is a sketch of the condition before and after a small volume of dilution water isadded to the top of the crust or a light diluent mixture percolates to the top of the crust. Weassume that no dissolution occurs and that the diluent does not replace the liquid initiallyoccupying the pores. Thus the crust thickness, Tc, and the density and void fraction of the
A.3
---- .. .-—r -Y.-r--,-c. ... ... ..s,.... .,. ,, .——
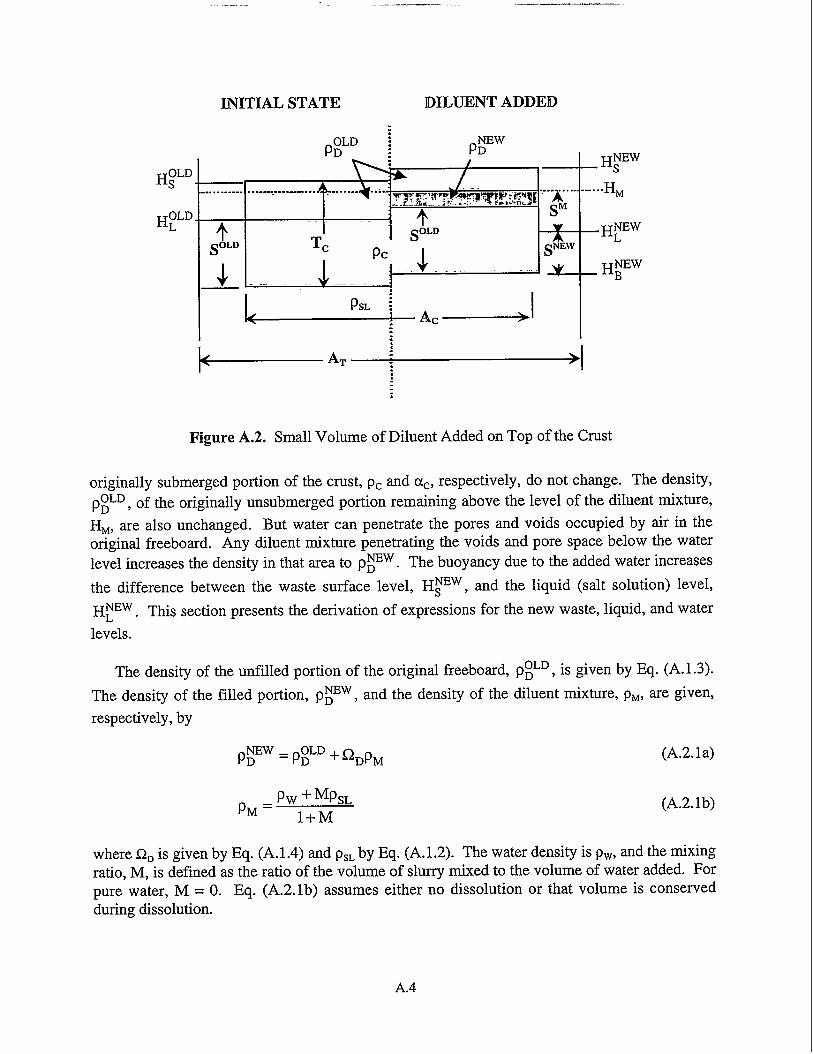
— -.
INITIAL STATE DILUENT ADDED
:
P:LD ! PFW
H~LD............. ................... -......- ..;
sOLD
4— ---
PSL :
4 Ac ~.::
Figure A.2. Small Volume of Diluent Added on Top of the Crust
originally submerged portion of the crust, pc and c+, respectively, do not change. The density,
OLD, of the originally unsubmerged portion remaining above the level of the diluent mixture,pDH~, are also unchanged. But water can penetrate the pores and voids occupied by air in theoriginal freeboard. Any diluent mixture penetrating the voids and pore space below the water
‘w The buoyancy due to the added water increaseslevel increases the density in that mea to PD .
the difference between the waste surface level, H~Ew, and the liquid (salt solution) level,
H~Ew. This section presents the derivation of expressions for the new waste, liquid, and water
levels.
The density of the unfilled portion of the original freeboard, P~LD, is given by Eq. (A. 1.3).
The density of the filled pofiion, p~w, and the density of the diluent mixture, PM,me given,
respectively, by
Pw+ ‘PSLPM= l+M
(A.2.la)
(A.2.lb)
where Q~ is given by Eq. (A. 1.4) and ps~ by Eq. (A. 1.2). The water density is pW,and the mixingratio, M, is defined as the ratio of the volume of slurry mixed to the volume of water added. Forpure water, M = O. Eq. (A.2. lb) assumes either no dissolution or that volume is conservedduring dissolution.
A.4

Archimedes’ principle for the new condition, equating the weight of the crust with wateradded to the weight of both displaced water and salt solution, can be stated as
SOLDpC+ (SNEW+ SM– SOLD)#w + (TC – SM– Smw)p~LD
= SMwp~L + S“pM
Solving Eq. (A.2.2) for the difference (SNW- SOLD)gives the following expression:
SM(p&w – p:J-D – pSNEW– SOLD=
M)+ SOLD(pC-p~L-p~LD) +TCp~LD
psL – pDNEW+ p~LD
Substituting Eq. (A.1.9) for SOLDand Eq. (A.2.la) for p~win Eq. (A.2.3) gives
SNEW– SOLD= –sMpM(l -QD)
PsL – PM~D
(A.2.2)
(A.2.1.3) ~
(A.2.4)
The depth of crust submerged in water, S“, can be calculated from the volume of diluentadded, V~, via continuity, assuming the water fills the available air space in the pores and voidsabove the original liquid level plus the space not occupied by crust (see Figure A.2).
VM= AC[SM+ SNEW– SOLD]Q~+ S“(AT – AC) (A.2.5a)
The mixture volume can also be found by using the deftition of the mixing ratio and noting that
VM= V~~ + Vw = (1+ M)VW (A.2.5b)
Solving Eq. (A.2.5a) for SMand substituting Eq. (A.2.4) for S-- SOLDgives
‘M=4%Lar (A.2.6)
With V~ calculated from the back-dilution volume and the assumed mixing ratio viaEq. (A.2.5b), SMcan be calculated with Eq. (A.2.6) and (SNEW- Sow from Eq. (A.2.4). The newsaturated salt liquid level is then calculated from conservation of liquid volume, which isexpressed as
H~LDAT– SOLDAC+ Vw = H~wAT – SmwAC + VM
Solving Eq. (A.2.7) for H~w and substituting Eq. (A.2.5b) for VMyields
A.5
(A.2.7)
--T’-= --.7’-7+ 24. . . ,. ,, ,m.-...-a ... ~ ,. .. . . . . . . .. . ... . . . r , ;. .,:,., ,-:, 1. . . . . . . . . . .-—--— -—--–—- .— -

H~Ew=H~LD+ SNEW_SOLD( )Vw
$–M—T AT
(A.2.8)
The rest of the waste levels are then determined with the following identities (Figure A.2):
H~Ew = H~Ew + Tc _ sNEW (A.2.9a)
H~Ew = H~Ew – SNEW (A.2.9b)
H~ = H~Ew + SM (A.2.9c)
This solution is applicable only if the crust is not completely submerged. The volume ofmixed diluent, Vfi, needed to submerge the crust is computed by substituting Tc - SNEWfor S~ in
Eq. (A.2.5a) and using Eq. (A.2.4) for SNEw-SOLDto give the following expression:
v:—=(TC-S
{ ‘)[PS::PMI+QDoLD) (l- QD)(l -AT
AT(A.2.1O)
If the volume of water added is greater than V~/(l+M), the methodology of the next section
should be applied.
A.3 Crust Completely Submerged in Diluent
If the mixed diluent is less dense than the bulk crust material, the diluent mixture will remainabove the liquid level such that the crust may be entirely submerged, as illustrated in Figure A.3.In this case, the sum of the crust submergence depths in the original salt solution and in themixed diluent is equal to the total crust thickness. Diluent will also penetrate the porosity andvoid space throughout the entire original freeboard. Applying Archimedes’ principle to theconfiguration of Figure A.3, we have
SOLD,c + (TC– SoLD)p~w = (TC– Smw),M + Smw,~L (A.2.11)
noting that SM= Tc - SNEWwhen the crust is submerged. Substituting Eq. (A. 1. la) for p~w and
solving Eq. (A.2. 11) for (SNW- SOLD)gives
SNEW– SOLD= _(TC _ sOLD) pM(l – ‘D) (A.2.12),,L – PM
With (SNEw-SOLD)known, the liquid level H~Ewcan be calculated with Eq. (A.2.8) and the waste
surface (which is now submerged) and crust base levels with Eq. (A.2.9a) and (A.2.9b). Thenew mixture level is determined from the amount of diluent in excess of that required tosubmerge the crust determined by Eq. (A.2.1O). This can be expressed as
A.6

@LD
@LD
INITIAL STATE CRUST SUBMERGEDIN DILUENT
::, HM;...’ 4, , ,....’4, i...., . . . M.-4. , , ,...., 4, ,...., , , . . . . ,
: r
1---- -- -- --— - --- —-- --1
Figure A.3. Diluent Added so Crust Is Completely Submerged
H~ =H~w + ‘l; M)(VW –V~) (A.2.13)
The above model applies only if the diluent density is less than that of the crust. As themixture density becomes just sufilcient to float the crust, the submergence depth in the originalsalt solution goes to zero. Therefore, to fmd the diluent mixture density that will float the crust,we set SNBWto zero in Eq. (A.2. 12) and solve for p~ to get the following expression:
sOLD
f%= PSL(1_ ~D)q + QDSoLD (A.2.14)
The required mixing ratio can be found by substituting Eq. (A.2.lb) for p~ in Eq. (A.2.14)and solving for M.
[l–~ (l–~D)~+QD
MO= pSL 1()
(A.2.15)(l– QD) *–1
This approach can be used only if p~ > p~.
If p~ > p~ (M > MO), the crust will float in the diluent mixture without any supportingsubmergence in the original salt solution and the model in Section A. 1 must be used.
A.7

.——. .. . ... ‘i .—
A.3 Crust Floats in Diluent
If the mixed diluent is more dense than the bulk crust material the crust will float, as illus-trated in Figure A.4. This is similar to the base case derived in Section 2 except that the crustwill be more deeply submerged because the density will be somewhat less than that of the origi-nal slurry. Thus, as in the other two cases, diluent will penetrate the pores and void space in partof the original freeboard. Archimedes’ principle for the configuration of Figure A.4 can bestated as
SOLDpc+ (SNEW – SOLD )p;Ew+ (TC– SNEw)pgLD= Smwp~ (A.2.16)
Substituting Eq. (A.1.9) for SOLDand Eq. (A.2.la) for P~Ew in Eq. (A.2.16) and solving for
Smw yields
sNEW = sOLD psL – ‘DpM (A.2.17)PM(l–~D)
The volume of water needed to just float the crust is the volume of mixed diluent surroundingthe crust to a depth of SNEW.Refercing to Figure A.3, we find that
V~ = SNEw(A~ – Ac) + (SNEW– SOLD)ACQD
Substituting Eq. (A.2.17) for SNEWand rearranging yields the following:
v;_s
{[
OLD pSL
q– 1}
l–(&~D)& ‘QDl–QD pM
(A.2.18)
(A.2.19)
The elevation of the surface of the mixed diluent is determined from conservation of liquidvolume before and after dilution. Liquid continuity is expressed as
H~LDA~ – SOLDAC+ Vw = H~A~ – SNEwA~ + Vfi
Substituting Eq. (A.2. 19) for V~Oand solving for H~ gives
EIM= FI:LD + SNEW– SOLD~+[Vw – (1+ M)v+j]~
(A.2.20)
(A.2.21)
where VwOis calculated from V~Ovia Eq. (A.2.5b). The level, H~Ew, of the interface between
the diluent mixture and the unmixed slurry is found by subtracting the diluent height in excess ofthat represented by Eq. (A.2. 19). Converting the diluent mixture volume to water volume with
Eq. (A.2.5b), the expression for H~Ewbecomes
A.8

@LD,
@LD,
INITIAL STATECRUST FLOATS ON
DILUENT
+4===+H”W.—..—..----:_...-...——-—.——...—.——.......————._::Figure A.4. Diluent Added so Crust Floats on It
[H~W.HM–SNEW– Vw _vo](l+M)
AT(A.2.22)
With H~ and H~wknown, the crust surface and base levels are calculated as follows:
H~w = H~ + TC– Smw (A.2.23a)
H~w = H~ – Smw (A.2.23b)
This model is valid when the diluent mixture density is greater than that necesszuy to float thecrust. The required density is defined by Eq. (A.2. 14), and the mixing ratio is defined byEq. (A.2.15).
A.9
,, .,, ..

PNNL-13040
Distribution
No. of
‘@P@
Offsite
2 Office of Scientific and TechnicalInformation
WL KubicLos Alamos National LaboratoryPO BOX1663 K575Los AkmlOS,NM 87545
Onsite
9 DOE Richland Operations Office
CA Groendyke (6) H6-60DH Ii-by H6-60JS Shuen H6-60GW Rosenwald H6-60
16 PHMC Team
WB Barton R2-11RE Bauer S7-73JR Biggs S7-07W Cash S7-73JM Conner R2-11
No. of
QU@
SD EsteyJM GrigsbyGD Johnson (3)NW KirchLJ fippSCE LeachWJ PowellRE RaymondDA Reynolds
R2-11R1-44S7-73R2-11S7-73R1-44S7-70S7-70Fall
19 Pacific Northwest National Laboratory
JM Bates K7-15SQ Bennett K7-90JW Brothers (3) K9-20J-MCuts K7-15WL Kuhn K7-15LA Mahoney K7-15PA Meyer K7-15SD Rassat K6-28CW Stewart (3) K7-15J-HSukamto K8-93Information Release (5) K1-06
Distr. 1
--7T-——— > , -—w. ,. F.. . ,.”, g.. ,., , ... . . . .=.. —..—. .—