
Bumper Car Economics You Know Where You Are …...Bumper Car Economics—You Know Where You Are...
51
Bumper Car Economics—You Know Where You Are Going But Things Keep Bumping Into You An Economic and Real Estate Forecast for 2012 Ted C. Jones, PhD, Chief Economist, Stewart Title http://blog.stewart.com/ted
Transcript of Bumper Car Economics You Know Where You Are …...Bumper Car Economics—You Know Where You Are...

Bumper Car Economics—You
Know Where You Are Going But
Things Keep Bumping Into You
An Economic and Real Estate Forecast for 2012
Ted C. Jones, PhD, Chief Economist, Stewart Title http://blog.stewart.com/ted

Faster – Quicker – Better -- Accurate

Percent of Homebuyers Using
The Internet that Drove-By or
Viewed the Home Prior
To Contacting the Listing Agent

85 – Percent of Buyers Finding
Photos Very Useful
13 – Percent of Buyers Finding
Photos Somewhat Useful
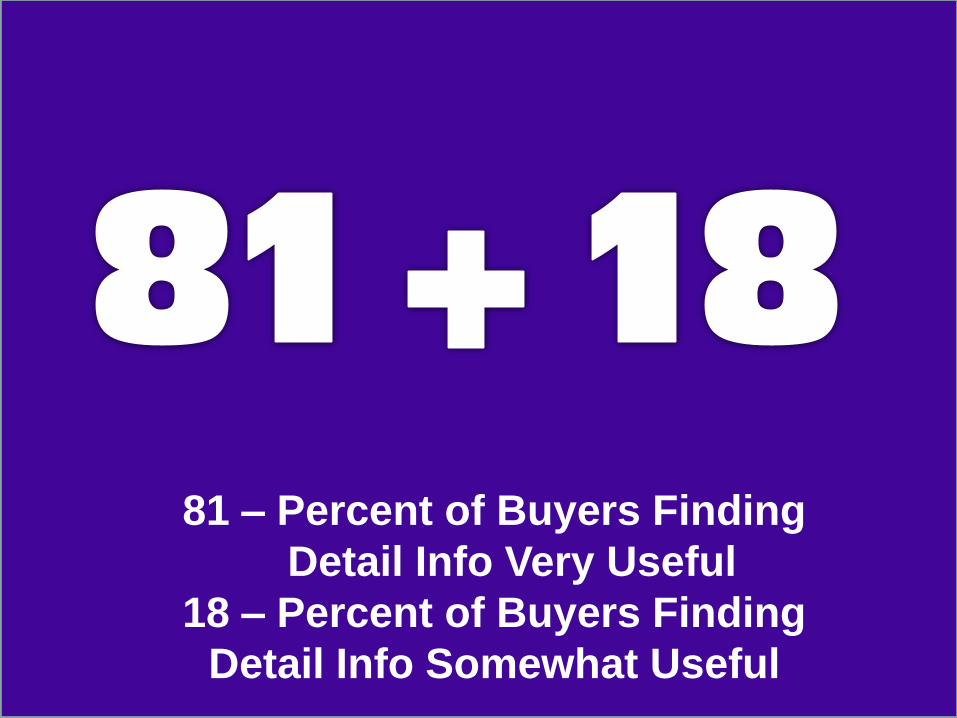
81 – Percent of Buyers Finding
Detail Info Very Useful
18 – Percent of Buyers Finding
Detail Info Somewhat Useful
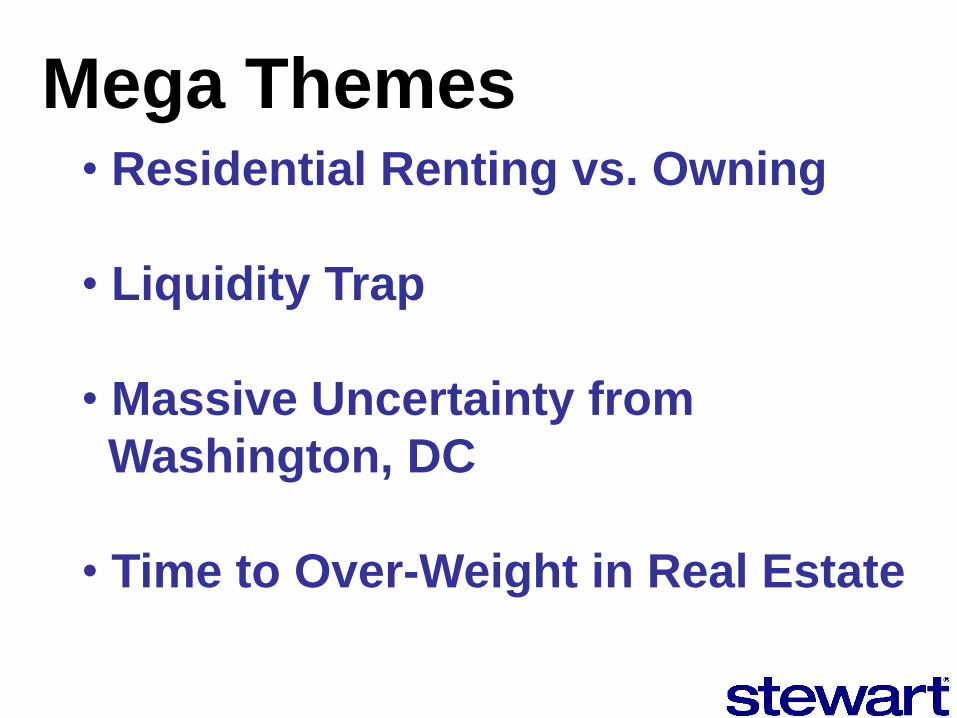
Mega Themes • Residential Renting vs. Owning
• Liquidity Trap
• Massive Uncertainty from
Washington, DC
• Time to Over-Weight in Real Estate

U.S. Job Numbers
0
75 77 79 81 83 85 87 89 91 93 95 97 99 '01 '03 '05 '07 '09 '11
70
80
90
100
110
120
130
140
150
Recession
Millions of Jobs
Seasonally-Adjusted
5.33 Million
Jobs Down
From Record
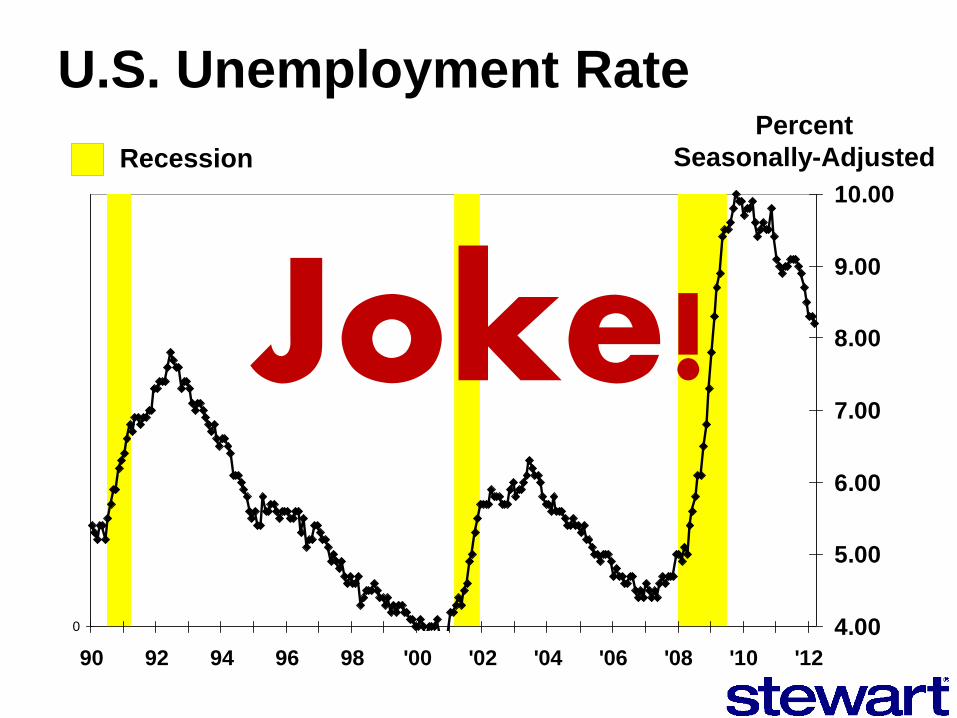
U.S. Unemployment Rate
0
90 92 94 96 98 '00 '02 '04 '06 '08 '10 '12
4.00
5.00
6.00
7.00
8.00
9.00
10.00
Recession
Percent
Seasonally-Adjusted
Joke!

128
130
132
134
136
138
'07 '08 '09 '10 '11 '12
U.S. Job Numbers
Jobs (Millions) Seasonally Adjusted
5.33 Million Fewer vs. Jan 1 2008
120,000 Gained in Mar 2012
164,000 No Longer
in Workforce

30
35
40
'07 '08 '09 '10 '11 '12
Fairbanks Jobs
Thousands -- Seasonally Adjusted
2,450
2,500
2,550
2,600
2,650
'07 '08 '09 '10 '11
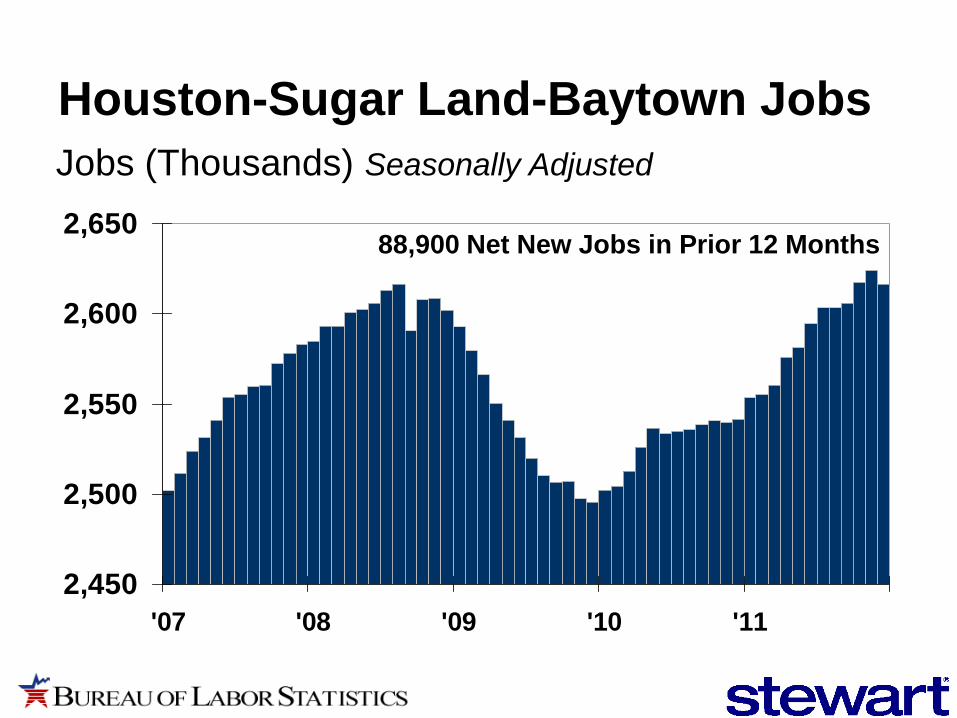
Houston-Sugar Land-Baytown Jobs
Jobs (Thousands) Seasonally Adjusted
88,900 Net New Jobs in Prior 12 Months

190
200
210
220
230
240
'07 '08 '09 '10 '11 '12
Cape Coral-Ft Myers Jobs
Jobs (Thousands) Seasonally Adjusted

Job Change From the Peak in 2007-2008 to March 2012
March
Peak Jobs Jobs
Jobs 2012 Jobs Change Percent
MSA State Change
Dalton Georgia 79.0 63.1 (15.90) -20.1%
Carson City Nevada 33.3 27.6 (5.70) -17.1%
Ocala Florida 108.0 89.7 (18.30) -16.9%
Prescott Arizona 65.3 54.4 (10.90) -16.7%
Reno-Sparks Nevada 225.4 188.1 (37.30) -16.5%
St. George Utah 55.1 46.2 (8.90) -16.2%
Monroe Michigan 44.1 37.2 (6.90) -15.6%
Fort Smith Arkansas-OK 127.1 108.2 (18.90) -14.9%
Bend Oregon 72.0 61.6 (10.40) -14.4%
Brunswick Georgia 46.3 39.8 (6.50) -14.0%
Morristown Tennessee 51.0 43.9 (7.10) -13.9%
Cape Coral-Fort Myers Florida 234.5 202.2 (32.30) -13.8%
Janesville Wisconsin 70.0 60.6 (9.40) -13.4%
Thousands

Job Change From the Peak in 2007-2008 to March 2012
March
Peak Jobs Jobs
Jobs 2012 Jobs Change Percent
MSA State Change
Columbia Missouri 93.2 96.4 3.20 3.4%
Midland Texas 71.8 74.3 2.50 3.5%
Austin-Round Rock-San Marcos Texas 778.4 806.4 28.00 3.6%
Columbus Indiana 46.3 48.0 1.70 3.7%
Morgantown West Virginia 63.8 66.6 2.80 4.4%
Laredo Texas 91.1 95.1 4.00 4.4%
Fargo ND-MN 122.3 128.0 5.70 4.7%
McAllen Edinburg-Mission Texas 220.2 231.3 11.10 5.0%
Kennewick-Richland-Pasco Washington 94.8 100.0 5.20 5.5%
Lafayette Louisiana 152.9 163.5 10.60 6.9%
Bismarck North Dakota 61.2 65.8 4.60 7.5%
Odessa Texas 64.7 70.3 5.60 8.7%
Thousands

http://taxfoundation.org/files/2012_tax_foundation_index_bp62.pdf
Missouri - 15th Best Business Tax Environment

http://www.homefair.com/real-estate/cost-of-living.asp
Cost of Living Comparison Salary Level Requirement for Equal Standard of Living
Assumes Living and Working in the Same City
How Much
Required More
City Income They Pay
Salt Lake City 93,841$ -2.4%
Kansas City 100,000$ --
Oklahoma City 103,189$ -2.7%
Atlanta 116,150$ 2.4%
Denver 121,584$ 3.4%
Los Angeles 161,108$ 12.3%

Housing Has Finally
Reached the Bottom
Nationwide
With Some Markets
Rebounding (Some Markets Never Declined)

0
2
4
6
8
10
Feb '1
1M
arApr
May Ju
nJu
l
Aug
Sep O
ctNov
Dec
12-J
an Feb Mar
Months Inventory of Existing Homes
National Association of REALTORS®
Months -- Seasonally-Adjusted Sales and Inventory

0
1,000
2,000
3,000
4,000
5,000
6,000
7,000
'01 '02 '03 '04 '05 '06 '07 '08 '09 '10 '11 '12
March Existing Home Sales Seasonally Adjusted Annualized Rate -- Thousands
National Association of REALTORS®
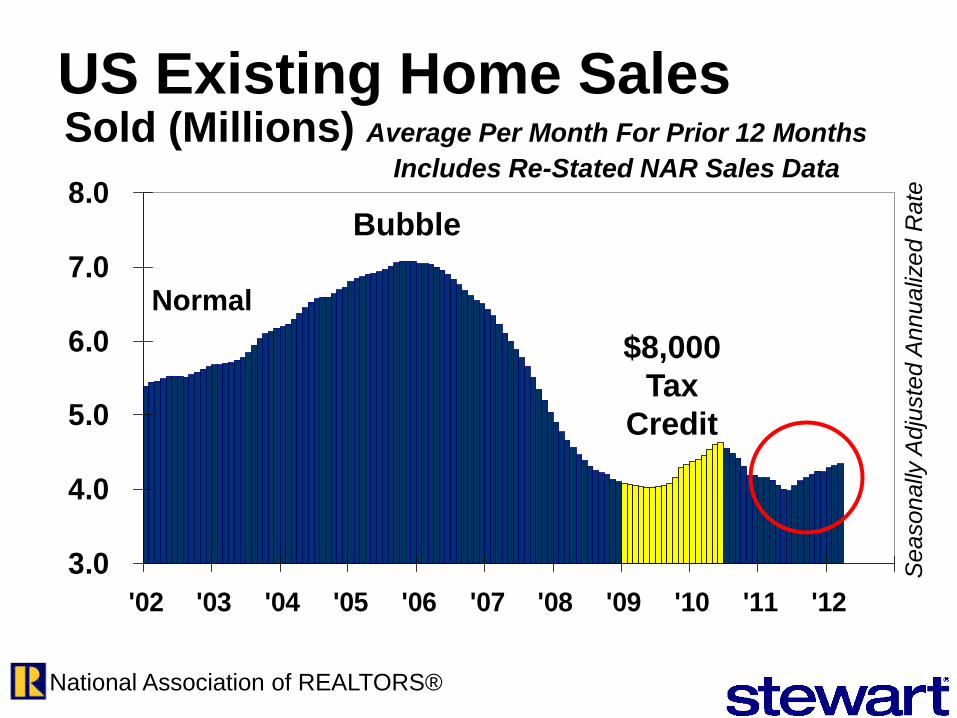
3.0
4.0
5.0
6.0
7.0
8.0
'02 '03 '04 '05 '06 '07 '08 '09 '10 '11 '12
US Existing Home Sales Sold (Millions) Average Per Month For Prior 12 Months
Includes Re-Stated NAR Sales Data
National Association of REALTORS®
$8,000
Tax
Credit
Normal
Bubble
Seasonally
Adju
ste
d A
nnualiz
ed R
ate
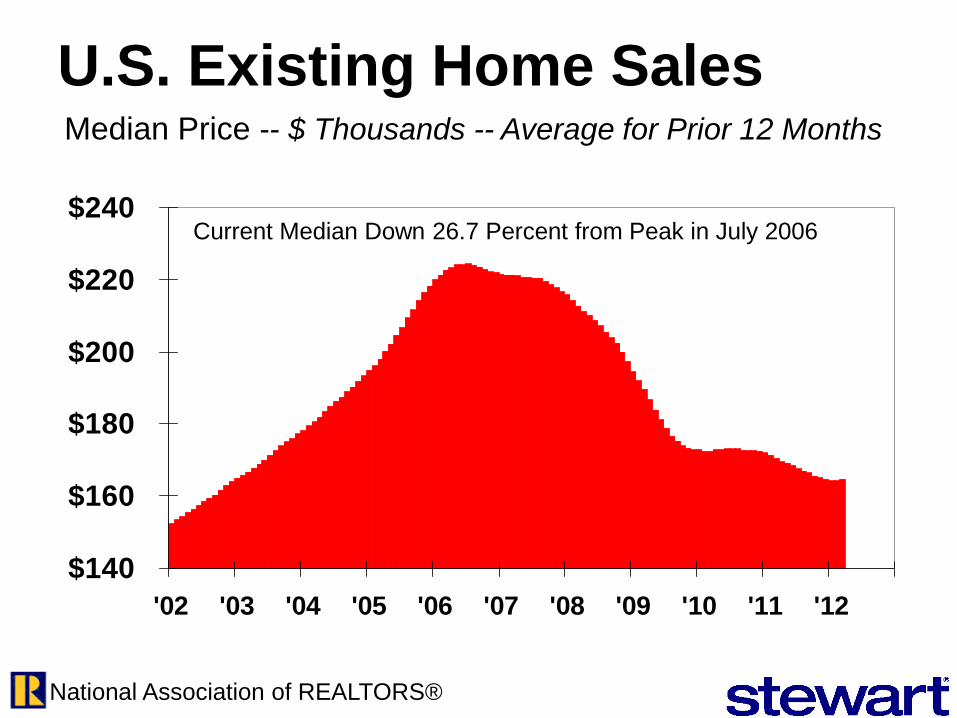
$140
$160
$180
$200
$220
$240
'02 '03 '04 '05 '06 '07 '08 '09 '10 '11 '12
U.S. Existing Home Sales Median Price -- $ Thousands -- Average for Prior 12 Months
National Association of REALTORS®
Current Median Down 26.7 Percent from Peak in July 2006

U.S. Residential Building Permits
0.0
0.3
0.6
0.9
1.2
1.5
1.8
2.1
80 82 84 86 88 90 92 94 96 98 '00
'02
'04
'06
'08
'10
Single Family Multi
Number of Dwelling Units -- Millions
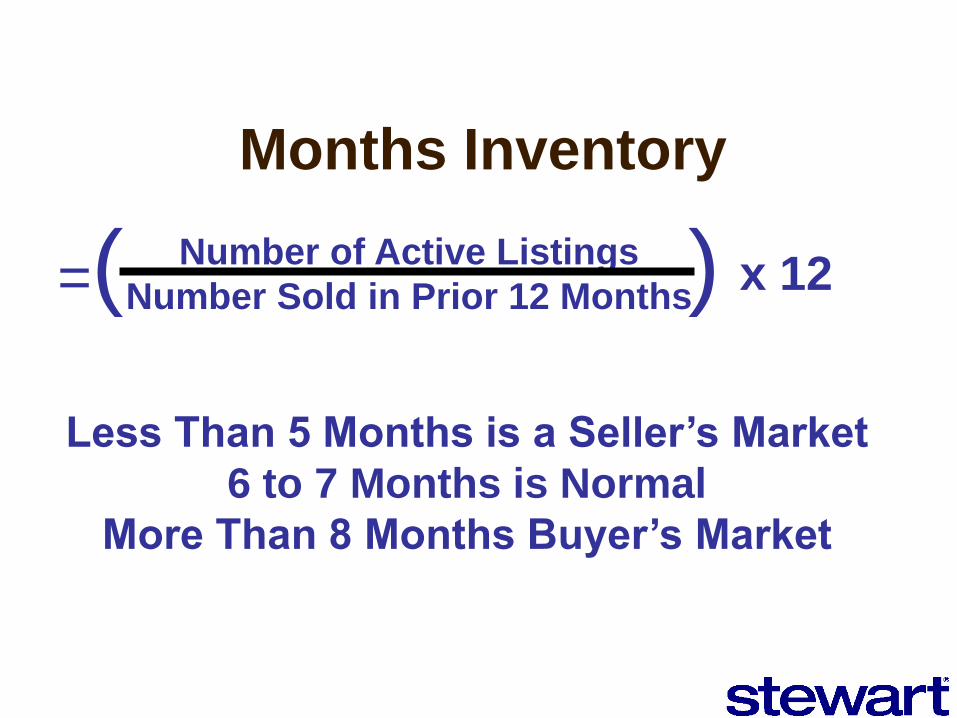
Months Inventory
Number of Active Listings
Number Sold in Prior 12 Months x 12 =( )
Less Than 5 Months is a Seller’s Market
6 to 7 Months is Normal
More Than 8 Months Buyer’s Market

Months Inventory$1 to $1.5 Million
Months
Number Average Number Average Inventory
Royden Oaks 3 1,123,872$ 1 1,350,000$ 4
River Oaks 16 1,127,000$ 11 1,199,682$ 8.3
Tanglewood 13 1,176,827$ 14 1,271,500$ 12.9
Houston 187 1,163,232$ 150 1,260,502$ 9.6
Montgomery 8 1,055,625$ 17 1,245,670$ 25.5
Sugar Land 9 1,142,514$ 9 1,242,378$ 12
Bunker Hill 6 1,181,750$ 2 1,472,500$ 4
West University 23 1,159,982$ 10 1,167,890$ 5.2
Royal Oaks 5 1,206,800$ 7 1,301,857$ 16.8
Hunters Creek 2 1,142,500$ 4 1,246,000$ 24
Sold Listings

20 Percent Plus
Down Payments
Made 34 Percent of
the Time in 2011

Short Sales in January
Made up 23.9 Percent of
All Transactions vs. 19.3
Percent Foreclosures
http://money.cnn.com//2012/04/19/real_estate/short-sale-
rise/index.htm?section=money_realestate&utm_source=feedburner&utm_m
edium=feed&utm_campaign=Feed%3A+rss%2Fmoney_realestate+%28Re
al+Estate%29

Shadow Inventory Down 10 Percent
From A Year Ago
–
For Every Two Current Homes Listed
There is One Home Still in the
‘Shadows’
http://www.housingwire.com/news/us-shadow-inventory-levels-down-year-ago

Debt Forgiveness Tax Implications Primary Dwelling
Mortgage Debt Not to Exceed Original
Loan Amount + Improvements
January 1 2007 – December 31 2012
No Income Tax on Debt Forgiveness
January 1 2013 and Forward
Forgiven Debt Taxed at Ordinary Income
Tax Rates

Cash on Hand Will
Fuel a Rocketing
Recovery Nationwide
WHEN Consumer
Confidence Returns

$0
$300
$600
$900
$1,200
$1,500
$1,800
$2,100
$2,400
'80 '83 '86 '89 '92 '95 '98 '01 '04 '07 '10
Money Supply – M1 $ Billions – Seasonally Adjusted
Federal Reserve
Currency, Checking Accounts, Demand Deposits
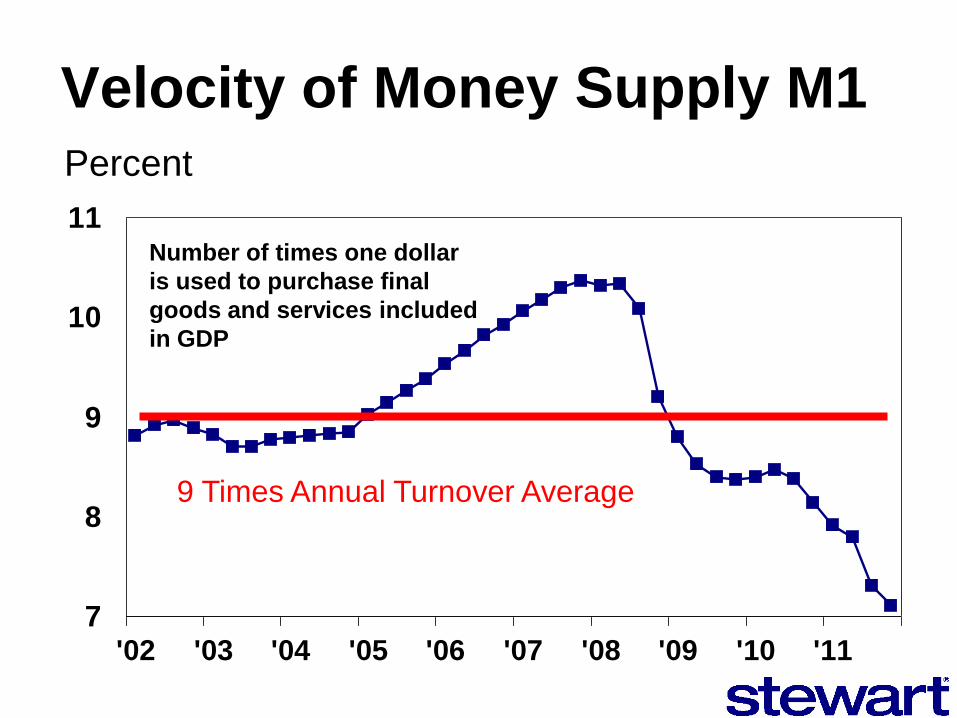
Velocity of Money Supply M1
7
8
9
10
11
'02 '03 '04 '05 '06 '07 '08 '09 '10 '11
Percent
9 Times Annual Turnover Average
Number of times one dollar
is used to purchase final
goods and services included
in GDP

$0
$20
$40
$60
$80
$100
$120
$140
72 75 78 81 84 87 90 93 96 99 '02 '05 '08 '11
4
6
8
10
12
14
16
18
Oil Prices
30-Year
Mortgage
Rate %
Oil Prices & 30-Year Mortgage Rates
March 2012 Dollars

$20
$40
$60
$80
$100
$120
$140
'02 '03 '04 '05 '06 '07 '08 '09 '10 '11 '12
$0.85
$1.05
$1.25
$1.45
$1.65
Oil Prices
Dollars
Per
Euro
Oil Prices & Exchange Rates $US Per Euro
Oil in March 2012 Dollars
Oil Price

Green Shoots
Of Recovery
are Sprouting
Everywhere

0
4
8
12
16
20
'90 '92 '94 '96 '98 '00 '02 '04 '06 '08 '10 '12
Light Weight Vehicle Sales Millions – Seasonally Adjusted Annual Rate
Bureau of Economic Analysis

0
4
8
12
16
20
'04 '05 '06 '07 '08 '09 '10 '12
Light Weight Vehicle Sales Millions – Seasonally Adjusted Annual Rate
Bureau of Economic Analysis

0
10
20
30
40
50
60
70
80
90
'80 '82 '84 '86 '88 '90 '92 '94 '96 '98 '00 '02 '04 '06 '08 '10
Business Bankruptcy Filings
Number of Filings -- Thousands

0
300
600
900
1,200
1,500
1,800
2,100
2,400
'80 '82 '84 '86 '88 '90 '92 '94 '96 '98 '00 '02 '04 '06 '08 '10
Consumer Bankruptcy Filings
Number of Filings -- Thousands
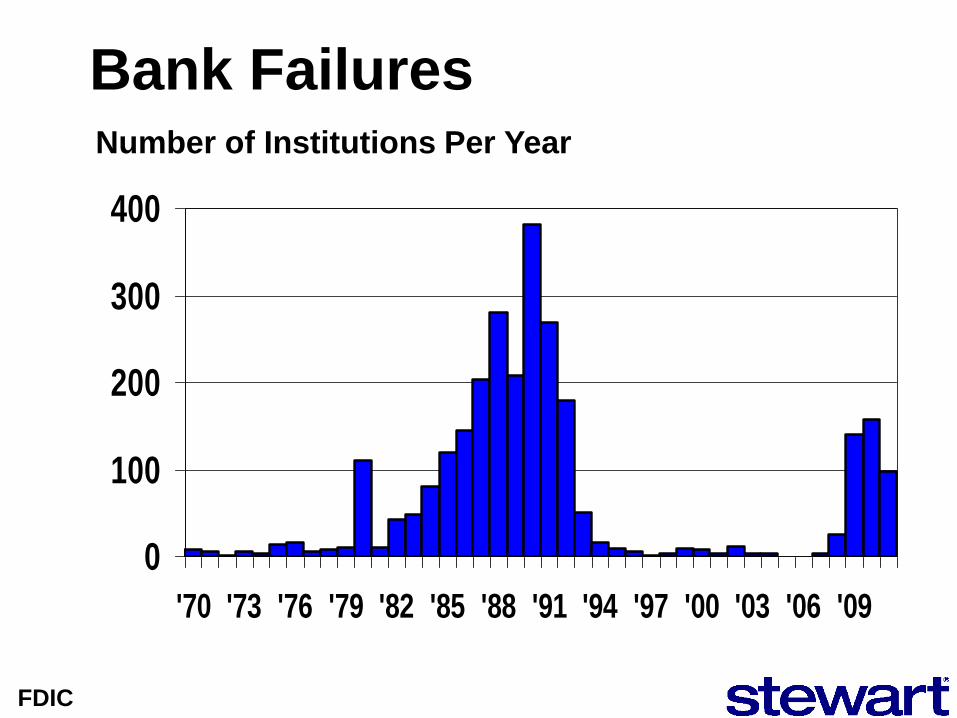
Bank Failures
0
100
200
300
400
'70 '73 '76 '79 '82 '85 '88 '91 '94 '97 '00 '03 '06 '09
Number of Institutions Per Year
FDIC

$140
$150
$160
$170
$180
$190
'02 '03 '04 '05 '06 '07 '08 '09 '10 '11 '12
U.S. Real Retail & Food Service Sales
$Billions – Seasonally Adjusted

Federal On-Budget Deficit Forecast
-$1,600.0
-$1,400.0
-$1,200.0
-$1,000.0
-$800.0
-$600.0
-$400.0
-$200.0
$0.0
'01
'02
'03
'04
'05
'06
'07
'08
'09
'10
'11
'12
'13
'14
'15
'16
'17
'18
'19
'20
$ Billions – Baseline ($10.7 Trillion Total Debt 12-31-08)
$7.6 Trillion 2011-2020
$10.7 Trillion
Cumulative Debt
Dec 31 2008
$15.2 Trillion
Dec 31 2011
2012 Budget Portends $26 Trillion Deficit in 2021

Interest Expense on Federal Debt
$0
$200
$400
$600
$800
$1,000
$1,200
88 92 96 '00
'04
'08
'12
'16
'20
$ Billions 2011
$438 Billion
2020
$1.1 Trillion
CBO Forecast
Forecast Assumes
• No Added Federal Spending Programs
Not Already in the Budget
• Healthcare Funding is Adequate (taxes)

Operation Twist
0.0
0.5
1.0
1.5
2.0
2.5
3.0
3.5
1 mo 3 mo 6 mo 1 yr 2 yr 3 yr 5 yr 7 yr 10 yr 20 yr 30 yr
Percent Treasury Yield Rates
Federal Resave
Owns $1+ Trillion
of Treasuries
Sell These
Buy These
Early 1960s Operation Twist Saw
Long-Term Rates Decline 0.15 Percent
Yield Curve Data as of Apr 23 2012

US Energy Consumption
0
20
40
60
80
100
'50
'54
'58
'62
'66
'70
'74
'78
'82
'86
'90
'94
'98
'02
'06
'10
Consumption – Quadrillion BTUs
Oil
Natural Gas Hydro
Nuclear
Other
Coal

President Obama – 80 Percent Clean Energy by 2035
Nuclear Power Plants 104
Annual Quadrillion BTUs 8.44
Quadrillion BTUs Per Plant 0.0812
Annual
Quadrillion
Current Energy Source BTUs 10% 20% 30% 40% 50%
Coal 20.71 26 51 77 102 128
Oil 35.97 44 89 133 177 222
Gas 24.67 30 61 91 122 152
Coal + Oil + Gas 81.35 100 200 301 401 501
Required Number of New Nuclear Plants
To Replace Respective Percent of Each
U.S. Nuclear Power Production

Texas Wind Energy Summary Thursday 08/11/2011 Houston Chronicle
Wind – 11 percent of Texas Power Capacity
9,500 Megawatts Installed Base
ERCOT Expects 800 Megawatts from the 9,500 megawatts 8.4 Percent
Wind contributed 1,300 to 2,400 megawatts (13.7 percent to 25.3 percent of
capacity) Mid July to Early August
Last Wednesday wind accounted for 2,000 megawatts of the 68,294
megawatts used (2.93 percent of power used and 21.05 percent of capacity)
―Most of Texas' wind farms are in West Texas and reach peak output in
the evening, when the winds blow hardest. They do little for the state's
needs during the hottest afternoon hours and are so far removed from
the areas of heaviest demand that they often have little to no impact. ―
404 Megawatt Plant Received $222.8 Million Federal Stimulus Payments

2012 Economic Concerns
• Washington DC (Congress & Prez)
• Jobs – Stimulus Did Not Work
GDP = Consumption + Investment +
Government Spending + Exports - Imports
• Rural Land Bubble
• Liquidity Trap
• Energy: US Imports 50+ Percent of Oil
• Government Can’t Fix Everything
Newton’s Third Law of Motion

Ted
’s F
ore
cast
12-1
-20
12
to
12-3
1-1
3
Big 2013
Upside…
30-Year Rates

Ted’s Blog
http://blog.stewart.com/ted

Ted C. Jones, PhD Chief Economist
Stewart Title Guaranty Company http://blog.stewart.com/ted

Four convenient ways to access your transactions –
another reason why we’re the right choice for you.
Stewart Title Company understands you deserve to choose when and where
you manage your transactions. And we provide an assortment of choices to
better meet your needs. Try them all to discover your favorite, such as:
Stewart Online™ – Access transactions online, 24/7
Stewart My Files mobile app – On-the-go access to your transactions
Weekly Summary Reports – An update in your inbox every seven days
Personal update – Friendly associates always ready to help
There are so many ways to do business with Stewart,
you’re sure to find a flavor you like.
stewart.com


![Strength Enhancement of Car Front Bumper for Slow … · Strength Enhancement of Car Front Bumper for Slow Speed ... Marzbanrad, et al [1] studied a front bumper beam made ... 15%](https://static.fdocuments.us/doc/165x107/5b0791c47f8b9a58148e78cb/strength-enhancement-of-car-front-bumper-for-slow-enhancement-of-car-front-bumper.jpg)

