![Profiling Memory in Lua · 77.20 999 MB 1295 MB 1 main chunk (main.lua) 8.65 112 MB 112 MB 147 insert [C] 7.01 91 MB 91 MB 1,000,001 for iterator [C] 5.89 76 MB 76 MB 1,000,000 gmatch](https://static.fdocuments.us/doc/165x107/6020bbf0c069bf413e212b0e/profiling-memory-in-lua-7720-999-mb-1295-mb-1-main-chunk-mainlua-865-112-mb.jpg)
Bulletin (3.74 MB)
26
Patala-Nammal Composite Total Petroleum System, Kohat-Potwar Geologic Province, Pakistan By C.J. Wandrey, B.E. Law, and Haider Ali Shah U.S. Geological Survey Bulletin 2208-B U.S. Department of the Interior U.S. Geological Survey Petroleum Systems and Related Geologic Studies in Region 8, South Asia Edited by Craig J. Wandrey
Transcript of Bulletin (3.74 MB)

Patala-Nammal Composite Total Petroleum System,Kohat-Potwar Geologic Province, Pakistan
By C.J. Wandrey, B.E. Law, and Haider Ali Shah
U.S. Geological Survey Bulletin 2208-B
U.S. Department of the InteriorU.S. Geological Survey
Petroleum Systems and Related Geologic Studies in Region 8, South AsiaEdited by Craig J. Wandrey

U.S. Department of the InteriorGale A. Norton, Secretary
U.S. Geological SurveyCharles G. Groat, Director
This publication is only available online at:http://pubs.usgs.gov/bul/b2208-b/
Posted online February 2004, version 1.0
Foreword
This report describing the petroleum resources within a total petroleum system in Pakistan was prepared as part of the World Energy Assessment Project of the U.S. Geological Survey. For this project, the world was divided into 8 regions and 937 geologic provinces, which were then ranked according to the discovered oil and gas volumes within each (Klett and others, 1997). Of these, 76 “priority” provinces (exclusive of the United States and chosen for their high ranking) and 26 “boutique” provinces (exclusive of the United States and chosen for their anticipated petroleum richness or special regional economic importance) were selected for appraisal of oil and gas resources. The petroleum geology of these priority and boutique provinces is described in this series of reports.
The purpose of the World Energy Project is to assess the quantities of oil, gas, and natural gas liquids that have the potential to be added to reserves within the next 30 years. These volumes either reside in undiscovered fi elds whose sizes exceed the stated minimum-fi eld-size cutoff value for the assessment unit (variable, but must be at least 1 million barrels of oil equivalent) or occur as reserve growth of fi elds already discovered.
The total petroleum system constitutes the basic geologic unit of the oil and gas assessment. The total petroleum system includes all genetically related petroleum that occurs in shows and accumulations (discovered and undiscovered) and that (1) has been generated by a pod or by closely related pods of mature source rock, and (2) exists within a limited, mappable geologic space, along with the other essential, mappable geologic elements (reservoir, seal, and overburden) that control the fundamental processes of generation, expulsion, migration, entrapment, and preservation of petroleum. The minimum petroleum system is that part of a total petroleum system encompassing discovered shows and accumulations along with the geologic space in which the various essential elements have been proved by these discoveries.
An assessment unit is a mappable part of a total petroleum system in which discovered and undiscovered fi elds constitute a single, relatively homogenous population such that the chosen methodology of resource assessment based on estimation of the number and sizes of undiscovered fi elds is applicable. A total petroleum system may equate to a single assessment unit, or it may be subdivided into two or more assessment units if each unit is suffi ciently homogeneous in terms of geology, exploration considerations, and risk to assess individually.
A graphical depiction of the elements of a total petroleum system is provided in the form of an event chart that shows the times of (1) deposition of essential rock units, (2) trap formation, (3) generation, migration, and accumulation of hydrocarbons, and (4) preservation of hydrocarbons.
A numeric code identifi es each region, province, total petroleum system, and assessment unit; these codes are uniform throughout the project and will identify the same type of entity in any of the publications. The code is as follows:
Example
Region, single digit 2 Province, three digits to the right of region code 2004 Total petroleum system, two digits to the right of province code 200401 Assessment unit, two digits to the right of total petroleum system code 20040101

The codes for the regions and provinces are listed in Klett and others (1997).Oil and gas reserves quoted in this report are derived from Petroconsultant’s
Petroleum Exploration and Production database (Petroconsultants, 1996) and other area reports from Petroconsultants, Inc., unless otherwise noted.
Figure(s) in this report that show boundaries of the total petroleum system(s), assessment units, and pods of active source rocks were compiled using geographic-information-system (GIS) software. Political boundaries and cartographic representations were taken, with permission, from Environmental Systems Research Institute’s ArcWorld 1:3,000,000 digital coverage (1992), have no political signifi cance, and are displayed for general reference only. Oil and gas fi eld center points, shown on these fi gures, are reproduced, with permission, from Petroconsultants (1996).
Contents
Foreword ....................................................................................................................................................... iiiIntroduction ................................................................................................................................................... 1Acknowledgments ........................................................................................................................................ 1Regional Geologic History ........................................................................................................................... 1Stratigraphy ................................................................................................................................................... 8Production History ........................................................................................................................................ 9Composite Petroleum System................................................................................................................... 10
Source Rock ....................................................................................................................................... 10Maturation .......................................................................................................................................... 11Generation and Migration ................................................................................................................ 12Reservoir Rocks ................................................................................................................................. 13Traps and Seals.................................................................................................................................. 14Assessment Unit ................................................................................................................................ 14
Assessment of Undiscovered Oil and Gas ............................................................................................. 14Summary ...................................................................................................................................................... 17Selected References.................................................................................................................................. 19
Figures
1. Map showing location of the Kohat-Potwar geologic province........................................... 2 2. Generalized geology of the Kohat-Potwar geologic province and surrounding area ...... 3 3. Generalized structure of Kohat-Potwar geologic province area ......................................... 4 4. Extent of total petroleum systems in the Kohat-Potwar geologic province area.............. 4 5. Generalized stratigraphy of the Kohat-Potwar area .............................................................. 5 6.–11. Paleogeographic maps of the: 6. Middle Jurassic (approximately 166 Ma) ...................................................................... 6 7. Early Cretaceous (approximately 130 Ma)..................................................................... 6 8. Late Cretaceous (approximately 94 Ma)........................................................................ 6 9. Latest Cretaceous (approximately 69 Ma)..................................................................... 6 10. Middle Eocene (approximately 50 Ma) .......................................................................... 7 11. Late Oligocene Epoch (approximately 27 Ma) .............................................................. 7 12. Generalized cross section showing structure through the Potwar Plateau ...................... 7 13. Generalized oil and (or) gas field and structure map of Kohat-Potwar area ..................... 8 14. Plot showing the cumulative number of new-field wildcat wells versus
well-completion year ................................................................................................................. 10 15. Maturity of exploration indicator plots showing known and grown
(expected final size when production is ended) field sizes grouped in thirds by age of discovery and ranked by size ...................................................................... 11
16. Plots showing cumulative known and grown oil volumes versus the cumulative number of new-field wildcat wells............................................................... 12
17. Plot showing field size versus field-discovery year ............................................................. 13 18. Plot showing reservoir depth versus oil-field-discovery year ............................................ 13 19. Generalized cross section showing structure through the Potwar Plateau .................... 14 20. Generalized burial-history plots for the ODGC Dakhni 1 well and the
Gulf Oil Fim Kassar well ............................................................................................................. 15 21. Distribution of producing reservoirs by age and number of fields
in which they occur.................................................................................................................... 16 22. Distribution of producing reservoirs by age, lithology, and number
of fields reporting production from that age group and lithology type.............................. 16 23. Petroleum system events chart for the Kohat-Potwar geologic province ....................... 18
Tables
1. Estimates of undiscovered oil and gas for the Patal-Nammal composite total petroleum system, Kohat-Potwar geologic province (8026), Pakistan..................... 17
2. Expected size distribution for undiscovered oil fields in the Kohat-Potwar geologic province ....................................................................................................................... 17
3. Expected size distribution for undiscovered gas fields in the Kohat-Potwar geologic province ....................................................................................................................... 18

Introduction
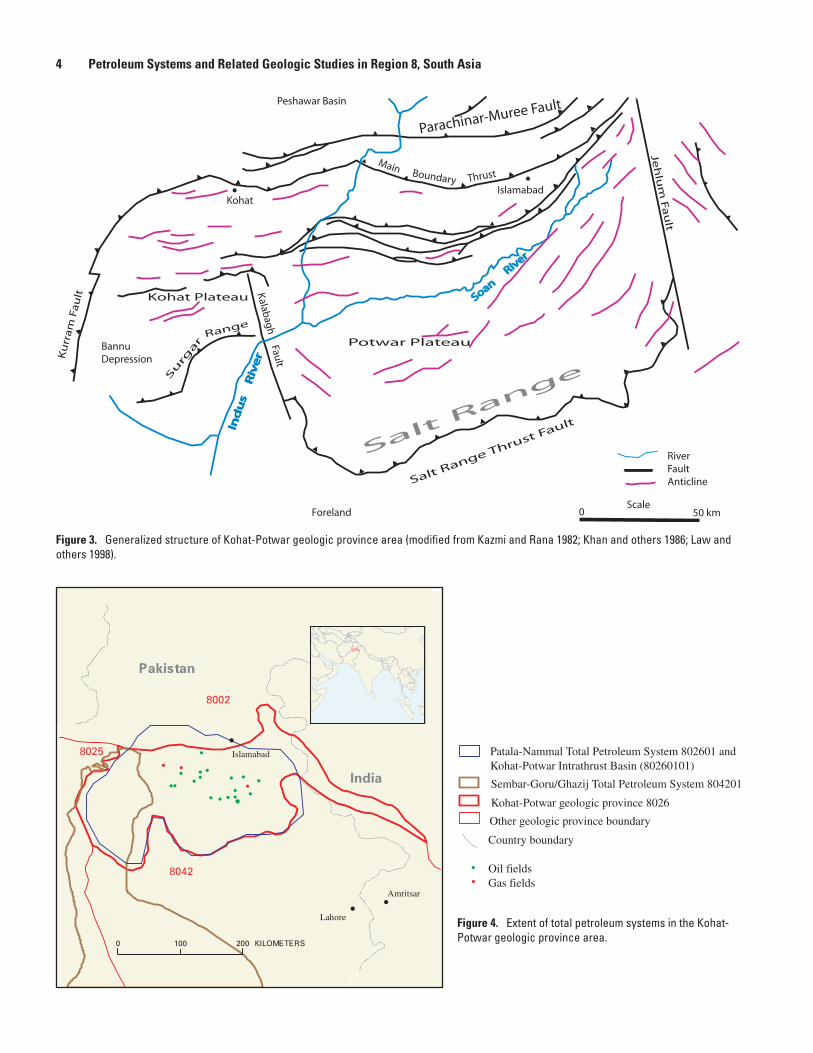
Among the 26 boutique provinces identifi ed for the World Energy Assessment Project was an onshore, oil-prone area named the Kohat-Potwar geologic province (fi g. 1). The prov-ince (part of the upper Indus Basin) is bounded on the north by the Parachinar-Murree fault, on the west by the Kurram fault, on the south by the Surghar and Salt Ranges, and on the east by the Jehlum fault (fi gs. 2 and 3). The area includes the Potwar and Kohat Plateaus and Bannu Depression. The Kohat-Potwar province consists of a portion of the Indian plate structurally deformed by plate collision and overthrust of the Himalayas on the north and northwest. Important struc-tural features (fi g. 3) include a series of faulted and unfaulted anticlines developed on multiple detachment surfaces as deep as Cambrian and thrust faults that trend generally southwest-northeast parallel to the plate-collision boundary.
Acknowledgments
Most of the data presented in this report was provided by the Oil and Gas Development Corporation (OGDC), Islam-abad, Pakistan, and Amoco Production Co., Houston, Texas. We are especially grateful to Mr. Marten James of Amoco for his help in obtaining geologic data from Pakistan.
The authors thank technical reviewers E.A. Johnson and Peter Warwick for their valuable suggestions and insight.
Regional Geologic History
The total petroleum system (TPS) and assessment unit (AU) discussed herein (fi g. 4) acquired their primary structural and stratigraphic features from events associated with plate movements that occurred from latest Paleozoic to the pres-
ent. From Permian through Middle Jurassic time, the Indian plate was located in the Southern Hemisphere—between the African, Antarctic, and Australian plates—and comprised part of southern Gondwana. The Lower Permian Tobra Forma-tion tillites (fi g. 5) in the Kohat-Potwar area and other basal Permian glacial deposits on the Indian plate are indicative of a much cooler paleoclimate (Shah and others, 1977). The area that is now the Indus Basin, Kohat-Potwar geologic province, and northern India, was a shallow continental shelf on which carbonates, shales, and sandstones were deposited. This car-bonate-dominated environment persisted at least intermittently on the western part of the shelf through the Late Jurassic and is represented by the interbedded shales and thick limestones of the Springwar Formation and as much as 1,400 m of the Middle and Upper Jurassic Sulaiman Limestone Group on western and northern portions of the plate. In the area that is now the Kohat-Potwar geologic province, shelf and shal-low-marine stages are preserved in the rocks of the Permian Nilawahan, Permian and Triassic Zaluch, Triassic Musa Khel, and Jurassic and Cretaceous Surghar Groups. During the Late Jurassic, Madagascar, India, Australia, Antarctica, and the Seychelles began to break away from Africa, forming the Somali Rift Basin (fi gs. 6 and 7). Late Jurassic rifting also ini-tiated separation of Australia and Antarctica from India.
During Early Cretaceous time, the Indian plate drifted northward, entering warmer latitudes. Along the eastern por-tion of the Indian plate, the Rajmahal Trap volcanics were deposited. On the northwest margin of the plate, marine shales and limestones of the Lower Cretaceous Sembar and Goru Formations were deposited over a regional erosional surface on the Sulaiman Group. In the Kohat Potwar area, this erosional surface is present at the top of the Samana Suk Formation and is overlain by sandstones and shales of the Lower Cretaceous Chichali Formation. On the eastern shelf of the Indian plate, the Bolpur and Ghatal Formations were deposited. Whereas carbonates are recognized primarily on the eastern and western shelves today, it is likely that they were deposited over much of the northern shelf as well. This shelf environment persisted through the Late Cretaceous when regressive sandstones such as the Lumshiwal and Pab Forma-tions in the west and Tura Formation in the east were depos-ited. During the latest Cretaceous, the Indian plate continued to drift northward toward the Eurasian plate and the seafl oor of
Patala-Nammal Composite Total Petroleum System, Kohat-Potwar Geologic Province, Pakistan
By C.J. Wandrey,1 B.E. Law,2 and Haider Ali Shah3
1 U.S. Geological Survey, Denver, Colorado.2 Consultant, Lakewood, Colorado.3 Oil and Gas Development Corporation, Ltd., Islamabad, Pakistan.
1

the Bengal Basin began to form and fl ysch accumulated on all sides of the Indian plate (fi g. 8).
Northward plate movement continued during the Late Cretaceous, and a transform fault became active along the Ninety-East Ridge (fi g. 9). Rifting between Madagascar and the Seychelles portion of the Indian plate initiated formation of the Mascarene Basin. Extensional faulting occurred as the western part of the Indian plate sheared southward relative to the main plate (Kemal and others, 1992). Counterclockwise rotation of the Indian plate was initiated, and the Seychelles portion of the Indian plate began to break away (Waples and Hegarty, 1999) (fi g. 9).
Latest Cretaceous was also a time of intense volcanism in western India, with the expulsion of the Deccan Trap basalts and further rifting, which began, and then failed, leaving the Cambay and Kutch Grabens fl oored with the Deccan Trap basalts (Biswas and Deshpande, 1983). The rifting event in the Cambay and Kutch areas might be related to the extensional
faulting and shear zone that was developing at the same time in the Indus Basin.
From the Late Cretaceous through middle Paleocene, trap deposits and basal sands continued to accumulate on the west-ern, northern, and eastern shelves of the Indian plate (fi g. 10). Oblique convergence of the Indian plate with the microplates constituting the southern edge of the Eurasian plate resulted in wrench faulting and development of regional arches such as the Jacobad and Sargodha Highs in the Indus Basin (fi g. 2) (Kemal and others, 1992).
The Indian plate continued to move northward at an accelerated rate of 15–20 cm/yr (Scotese and others, 1988). When the eastern edge of the plate passed over the Ker-guelen hot spot, a chain of islands began to form near long 90°E. Continued northward movement and counterclockwise rotation of the Indian plate slowly closed the Tethyan Sea along the northern and northwestern plate boundaries. The Sulaiman-Kirthar fold belt (Province 8025, fi g. 1) began
8003
8042
8025
80248001
8023
8022
8021
80268002
8028
8043
8063
8062
8061
8004
8044
8045
8033
80308031 8032
80468047
8034 8035
8006
8048
8005
Indus
Basin
Kohat-
Potwar
Kohat-
Potwar
8001 Southeast Afghanistan
8002 Himalayan
8003 Indian Shield
8004 Sri Lanka
8005 Indo-Burman
8006 Tenasserim-Shan
8021 Makran
8022 Baluchistan
8023 Central Afghanistan
8024 Afghan
8025 Sulaiman-Kirthar
8026 Kohat-Potwar
8028 Himalayan Foreland
8030 Chindwara
8031 Satpura-Brahmani
8032 Damodar
8033 Pranhita-Godavari
8034 Assam
8035 North Burma
8042 Indus
8043 Bombay
8044 Cauvery
8045 Krishna-Godavari
8046 Mahanadi
8047 Ganges-Brahmaputra Delta
8048 Irrawaddy-Andaman
8061 Maldives
8062 Lakshadweep
8063 Konkan
60°
60°
70°
70°
80°
80°
90°
10°10°10°
0°0°
20°20°
30°30°
40°40°
90°
100°
100°
Figure 1. Location of the Kohat-Potwar geologic province is shown in green (8026), other assessed provinces within Region 8 are shown in yellow. Region 8 geologic provinces as defi ned for the U.S. Geological Survey World Energy Project are numbered, and those not assessed are shown in brown; adjacent regions are shown in gray.
2 Petroleum Systems and Related Geologic Studies in Region 8, South Asia
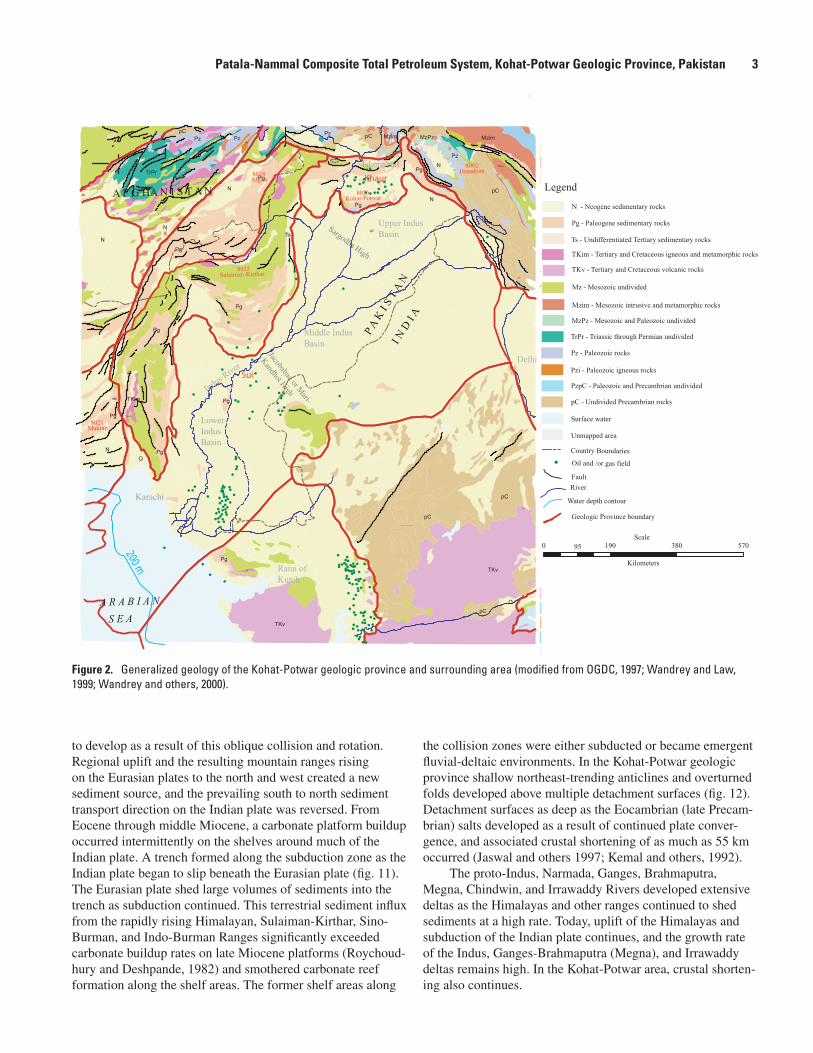
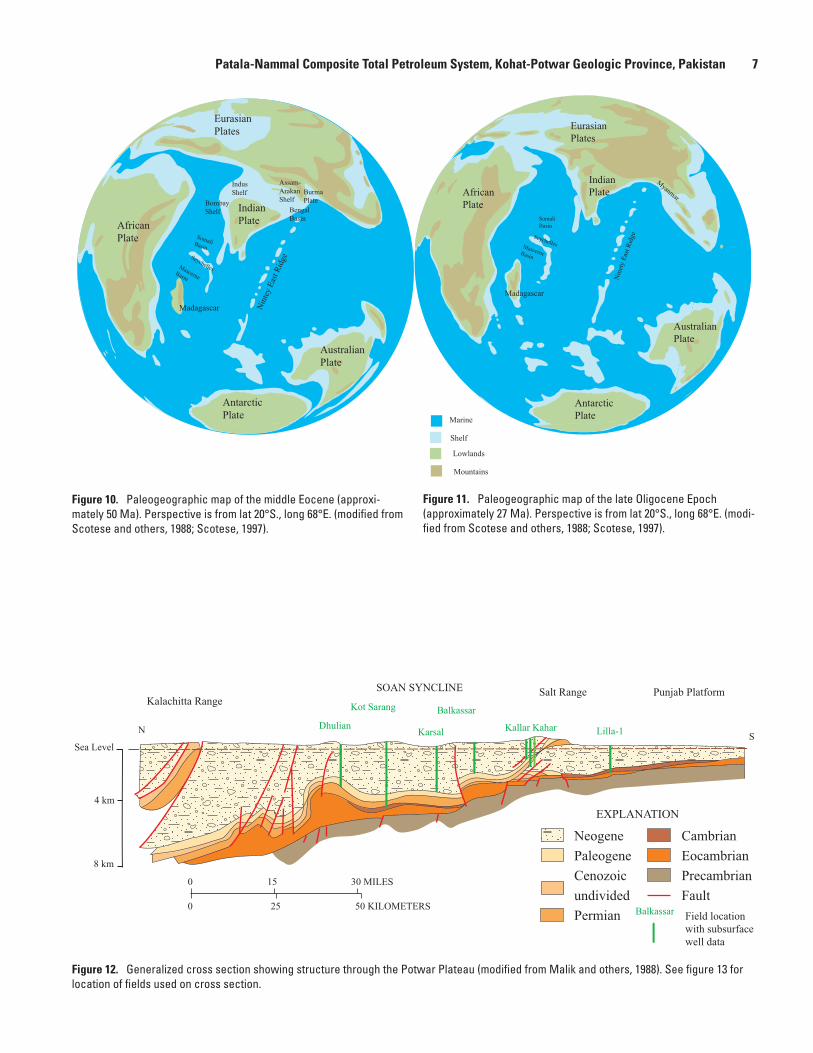
to develop as a result of this oblique collision and rotation. Regional uplift and the resulting mountain ranges rising on the Eurasian plates to the north and west created a new sediment source, and the prevailing south to north sediment transport direction on the Indian plate was reversed. From Eocene through middle Miocene, a carbonate platform buildup occurred intermittently on the shelves around much of the Indian plate. A trench formed along the subduction zone as the Indian plate began to slip beneath the Eurasian plate (fi g. 11). The Eurasian plate shed large volumes of sediments into the trench as subduction continued. This terrestrial sediment infl ux from the rapidly rising Himalayan, Sulaiman-Kirthar, Sino-Burman, and Indo-Burman Ranges signifi cantly exceeded carbonate buildup rates on late Miocene platforms (Roychoud-hury and Deshpande, 1982) and smothered carbonate reef formation along the shelf areas. The former shelf areas along
the collision zones were either subducted or became emergent fl uvial-deltaic environments. In the Kohat-Potwar geologic province shallow northeast-trending anticlines and overturned folds developed above multiple detachment surfaces (fi g. 12). Detachment surfaces as deep as the Eocambrian (late Precam-brian) salts developed as a result of continued plate conver-gence, and associated crustal shortening of as much as 55 km occurred (Jaswal and others 1997; Kemal and others, 1992).
The proto-Indus, Narmada, Ganges, Brahmaputra, Megna, Chindwin, and Irrawaddy Rivers developed extensive deltas as the Himalayas and other ranges continued to shed sediments at a high rate. Today, uplift of the Himalayas and subduction of the Indian plate continues, and the growth rate of the Indus, Ganges-Brahmaputra (Megna), and Irrawaddy deltas remains high. In the Kohat-Potwar area, crustal shorten-ing also continues.
200 m
MzimpC MzimPz
Pz
pC
Pz
Pz
MzPz
PgTrPr
N
Pg
pC
Pg
N
N
Pg
N
TsN
Pg
Pg
TKim Pg
Pg
N
Q
Pg
pC
pC
TKv
Pg
TKv
Q
pC
Mzim
Pzi
Mzim
Pz
Pz
TsTKim
Mzim
Mzim TrPr TrPr
pC
pCTi
Pz
pC
TKim
TKim
TKim
Ti
Legend
Pzi - Paleozoic igneous rocks
0 190 380 57095
Kilometers
PzpC - Paleozoic and Precambrian undivided
pC - Undivided Precambrian rocks
Surface water
Unmapped area
MzPz - Mesozoic and Paleozoic undivided
Pz - Paleozoic rocks
N - Neogene sedimentary rocks
Pg - Paleogene sedimentary rocks
Ts - Undifferentiated Tertiary sedimentary rocks
Mz - Mesozoic undivided
TKim - Tertiary and Cretaceous igneous and metamorphic rocks
TKv - Tertiary and Cretaceous volcanic rocks
Mzim - Mesozoic intrusive and metamorphic rocks
Fault
River
Water depth contour
Scale
Indus R
iver
Lower
Indus
Basin
Karachi
Rann of
Kutch
Delhi
Islamabad
Upper Indus
Basin
Middle Indus
Basin
Jacobabad or Mari-
Kandhot H
igh
Sargodha High
A R A B I A N
S E A
8021Makran
8024Afgan
8026Kohat-Potwar
8002Himalyan
A F G HA N I S T A N
P A
K I S
T A
NI N
D I A
8025Sulaiman-Kirthar
Oil and /or gas field
Country Boundaries
Geologic Province boundary
TrPr - Triassic through Permian undivided
Sui
Khaur
Figure 2. Generalized geology of the Kohat-Potwar geologic province and surrounding area (modifi ed from OGDC, 1997; Wandrey and Law, 1999; Wandrey and others, 2000).
Patala-Nammal Composite Total Petroleum System, Kohat-Potwar Geologic Province, Pakistan 3
Surg
ar
Range
Foreland
Peshawar Basin
Salt Range Thrust F
ault
Jeh
lum
Fa
ult
0 50 kmScale
Main Boundary Thrust
RiverFaultAnticline
Kalabagh Fault
Islamabad
Soan R
iver
Soan R
iver
Ind
us
R
ive
r
Ind
us
R
ive
r
Kohat
Potwar Plateau
Kohat Plateau
Parachinar-Muree Fault
BannuDepressionK
urr
am
Fa
ult
Salt R
ang
e
Figure 3. Generalized structure of Kohat-Potwar geologic province area (modifi ed from Kazmi and Rana 1982; Khan and others 1986; Law and others 1998).
•• • ••• •• • •••• •• ••• •• •
•
••
Pakistan
India
8002
8042
8025
Lahore
Amritsar
0 100 200 KILOMETERS
Islamabad
Country boundary
Oil fieldsGas fields
Patala-Nammal Total Petroleum System 802601 and Kohat-Potwar Intrathrust Basin (80260101)
Other geologic province boundary
Kohat-Potwar geologic province 8026
Sembar-Goru/Ghazij Total Petroleum System 804201
••
Figure 4. Extent of total petroleum systems in the Kohat-Potwar geologic province area.
4 Petroleum Systems and Related Geologic Studies in Region 8, South Asia
X
Shale
Limestone
Sandstone
Siltstone, shale,
and sandstone
Shale, siltstone, and sandstone
Gas production
or show
Oil production,
show, or seep
Source rock
potential
Flysch
EXPLANATION
Volcanics
Conglomerate
No deposition
or rocks eroded
PR
EC
AM
BR
IAN
CA
MB
RIA
NO
RD
OV
ICIA
N-
CA
RB
ON
IFE
RO
US
PE
RM
IAN
TR
IAS
SIC
JUR
AS
SIC
CR
ET
AC
EO
US
PA
LE
OG
EN
EN
EO
GE
NE
PLEISTOCENE
PLIOCENE
MIOCENE
OLIGOCENE
EOCENE
PALEOCENE
Kohat North Potwar Salt Range
Nagri
KhelSalt
Mianwali
Khisor
Jutana
Khewra
Kussak
Shinawuri/Springwar
Baghanwala
Dandot
Warchha
Sardhai
Amb
Chhidru
Tredian
Kingriali
Datta
Samana Suk
Chichali
Hangu
Lockhart
Patala
Nammal
Sakesar
Kuldana
JattaGypsum
Panoba
Kohat
Kirthar
MurreeKamlial
Chinji
Dhok Pathan
Soan
Siw
alik
Raw
alpin
di
Zal
uch
GroupEpoch
Gypsum and
anhydrite
Nil
awah
an
X
X
X
X
X
Torba
X
X
Jhel
um
Bar
och
MargalaHill
Kamlial
Chinji
Nagri
Dhok Pathan
UpperSiwalik
Salt Range
Wargal
Lumshiwal
Mogul Kot/Kawagarh
Surg
arC
hhar
atM
akar
wal
SakesarChorgali
Sula
iman
Goru
Sembar
Pab
QU
AT
.
Musa
Khel
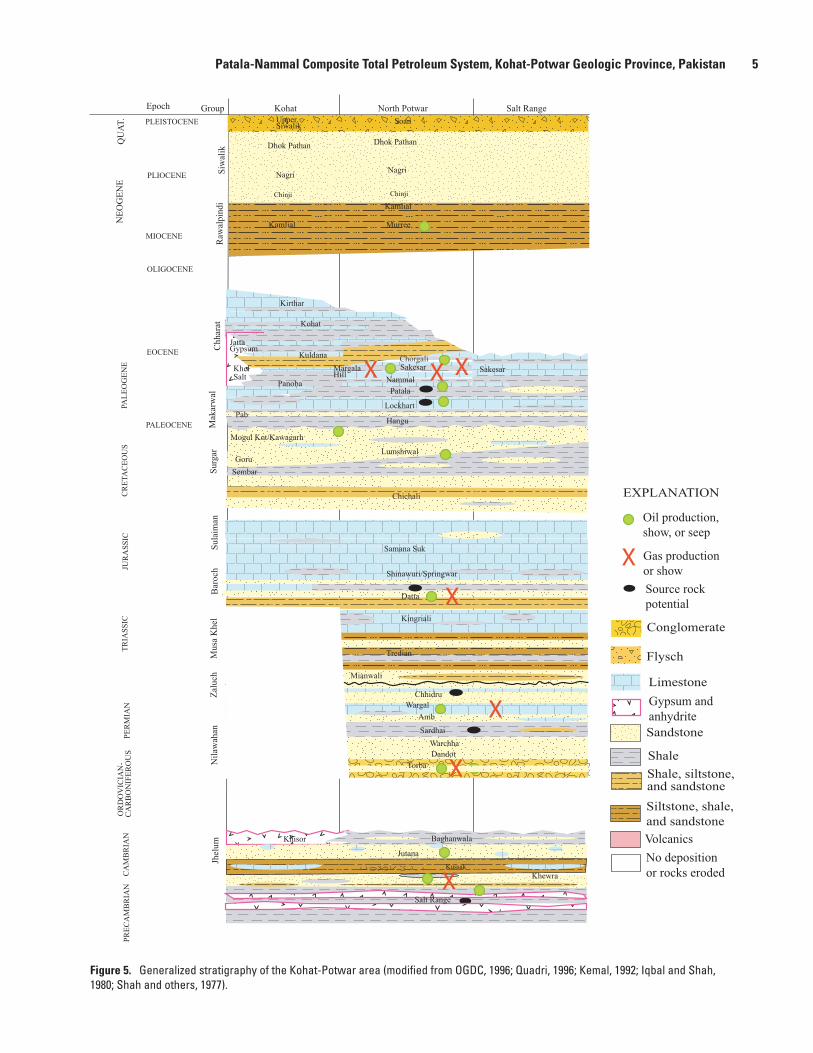
Figure 5. Generalized stratigraphy of the Kohat-Potwar area (modifi ed from OGDC, 1996; Quadri, 1996; Kemal, 1992; Iqbal and Shah, 1980; Shah and others, 1977).
Patala-Nammal Composite Total Petroleum System, Kohat-Potwar Geologic Province, Pakistan 5

Indian
Plate
Australian
Plate
African
Plate
Antarctic
Plate
BurmaPlate
Eurasian Plates
Indian
Plate
Lowlands
Mountains
Shelf
Marine
Australian
Plate
African
Plate
Antarctic
Plate
Eurasian Plates
BurmaPlate
Figure 6. Paleogeographic map of the Middle Jurassic (approxi-mately 166 Ma). Perspective is from lat 20°S., long 68°E. (modifi ed from Scotese and others, 1988; Scotese, 1997).
Figure 7. Paleogeographic map of the Early Cretaceous (approxi-mately 130 Ma). Perspective is from lat 20°S., long 68°E. (modifi ed from Scotese and others, 1988; Scotese, 1997).
Indian
Plate
Australian
Plate
African
Plate
Antarctic
Plate
Eurasian
Plates
Burma Plate
Mascarne
Basin
Lowlands
Mountains
Shelf
Marine
African
Plate
Antarctic
Plate
Indian
Plate
Australian
Plate
Burma Plate
Seychelles
Mascarene
rift basin
Nin
ety
Eas
t Rid
ge
Kerguelen
Hot Spot
Kerguelen
Hot Spot
Eurasian
Plates
Tethyan Sea
Mad
gasg
ar
Figure 8. Paleogeographic map of the Late Cretaceous (approxi-mately 94 Ma). Perspective is from lat 20°S., long 68°E. (modifi ed from Scotese and others, 1988; Scotese, 1997).
Figure 9. Paleogeographic map of the latest Cretaceous (approxi-mately 69 Ma). Perspective is from lat 20°S., long 68°E. (modifi ed from Scotese and others, 1988; Scotese, 1997).
6 Petroleum Systems and Related Geologic Studies in Region 8, South Asia
Indian
Plate
Lowlands
Mountains
Shelf
Marine
Australian
Plate
African
Plate
Antarctic
Plate
Eurasian
Plates
Nin
ety E
ast R
idge
Myanm
ar
Madagascar
Seychelles
Somali
Basin
MascerneBasin
Antarctic
Plate
African
Plate
Australian
Plate
Indian
Plate
Eurasian
Plates
Madagascar Nin
tey
Eas
t R
idge
Burma
Plate
Seychelles
SomaliBasin
MascerneBasin
Bengal
Basin
Assam-
Arakan
ShelfBombay
Shelf
Indus
Shelf
Figure 10. Paleogeographic map of the middle Eocene (approxi-mately 50 Ma). Perspective is from lat 20°S., long 68°E. (modifi ed from Scotese and others, 1988; Scotese, 1997).
Figure 11. Paleogeographic map of the late Oligocene Epoch (approximately 27 Ma). Perspective is from lat 20°S., long 68°E. (modi-fi ed from Scotese and others, 1988; Scotese, 1997).
Kalachitta RangeSalt Range Punjab Platform
Neogene
Paleogene
Cenozoic
undivided
Permian
EXPLANATION
Cambrian
Eocambrian
Precambrian
Fault0
0
15 30 MILES
25 50 KILOMETERS
SOAN SYNCLINE
Kot Sarang
DhulianKarsal
Balkassar
Kallar Kahar Lilla-1
Sea Level
4 km
8 km
NS
Balkassar Field location
with subsurface
well data
Figure 12. Generalized cross section showing structure through the Potwar Plateau (modifi ed from Malik and others, 1988). See fi gure 13 for location of fi elds used on cross section.
Patala-Nammal Composite Total Petroleum System, Kohat-Potwar Geologic Province, Pakistan 7

Stratigraphy
The Kohat-Potwar geologic province depositional record is relatively complete from Late Proterozoic to Holocene (fi g. 5). Late Proterozoic metamorphic basement rocks are over-lain by oil-impregnated shales, sandstones, and interbedded carbonates and evaporates of the Late Proterozoic and Lower Cambrian Salt Range Formation. The upper part of the Salt Range consists of thick carbonates overlain by evaporites marking the top of the formation. Potential source beds and oil shows have been identifi ed within the evaporite sections (Shah and others, 1977; Iqbal and Shah, 1980). The thickness of the Salt Range Formation varies from 50 to more than 1,000 m, due partly to dissolution of these evaporates. Above the Salt Range, evaporites are as much as 150 m of marine shales and massive sandstones representing braided-stream deposits of the Lower Cambrian Jhelum Group, Khewra Formation, which has produced oil at the Adhi, Chak Naurang, and Rajian fi elds (Khan and others, 1986; Petroconsultants, 1996) (fi g. 13). As much as 180 m of the Kussak Formation glauconitic shoreface
sandstones and siltstones overlie the Khewra. The Kussak has produced oil at the Missa Keswal fi eld (Petroconsultants, 1996). The overlying Jutana Formation consists primarily of sandy carbonates and nearshore sandstones. The Upper Cam-brian Baghanwala Formation shales and interbedded sand-stones in the Potwar Plateau and Salt Range area, and contem-poraneous Khisor Formation salts in the Kohat area, mark the top of the Cambrian stratigraphic sequence. The top of this sequence also marks the beginning of a hiatus that lasted until the Permian.
The Permian Nilawahan Group consists of the Tobra Formation glacial tillites, siltstones, and shales; the Dandot Formation alluvial or glacial coarse-grained sandstones and shales; the Warchha Formation coarse-grained argillaceous sandstones, and occasional shales; and the Sardhai Formation, which is similar to the Warchha except for a greater number of fi ne-grained-sandstone intervals (Shah and others, 1977; Iqbal and Shah, 1980; Kemal, 1992). Three fi elds in the south-east portion of the Potwar Plateau have produced oil or gas from Tobra reservoirs. Overlying the Nilawahan Group is the Zaluch Group consisting of Upper Permian Amb Formation
Soan River
Soan River
Soan River
Indus
R
iver
Indus
R
iver
Peshawar Basin
Kohat
Salt Range Thrust
Surghar
Ran
ge
Jehlu
m F
ault
Khaur
Balkassar
Chak Naurang
Karsal
DakhniDakhni
Joyamair
Bhal Sayedan
RatanaRatana
Sadkal
Turkwal
0 50 km.Scale
Main Boundary Thrust
River
Fault
Thrust fault
Anticline
Oil field
Gas field
Oil and gas
field
Insufficient
field data
Kalab
agh F
ault
Kheri Murat Fault
Adhi
TootFim Kassar
Dhulian
Bhangali
Mehal
Dhurnal
Kal
Rajian
Pariwali
Missa
Kessal
Explanation
Figure 13. Generalized oil and (or) gas fi eld and structure map of Kohat-Potwar area (modifi ed from Kemal, 1992; Government of Pakistan, 2001; Kazmi and Rama, 1982; Khan and others, 1986; Law and others, 1998; Petroconsultants, 1996).
8 Petroleum Systems and Related Geologic Studies in Region 8, South Asia

shelf carbonates, Wargal Formation shelf-carbonate sequences, and the Chhidru Formation marls and coarsening upward sandstones. The Wargal has produced oil at the Dhurnal fi eld.
Although Mesozoic rocks are generally preserved in the Salt Range and southeast Potwar Basin, part or all of the section is missing from the Kohat Plateau and northwestern Potwar deformed zone (Jaswal and others, 1997). Depositional thinning toward the west combined with erosion accounts for the missing rocks. Deposited on the unconformable Perm-ian strata are continental, coarse- to fi ne-grained sandstones, shales, and carbonates of the Triassic Musa Kehl Group Mianwali and Tredian Formations. Overlying the Tredian are shelf carbonates of the Triassic Kingriali Formation. The Triassic Formations were formerly referred to collectively as the Wulgai Formation (Shah and others, 1977). The Jurassic strata include the Shirinab or Datta and Shinawari Formations consisting of nearshore variegated siliciclastics that contain some nonmarine-sandstone intervals (Khan and others, 1986). The Datta has produced oil and gas from three fi elds, includ-ing Dhulian, in the northwest Potwar Plateau area. Overlying these nearshore formations are as much as 900 m of Samana Suk Formation platform carbonates. The Lower Cretaceous section consists of Chichali Formation basinal shales, Sembar and Lower Goru Formations coarsening-upward shoreline packages (late highstand), and Lumshiwal Formation sand-stones (maximum basin fl ooding surface). The Upper Goru, Kawagarh, or upper Moghul Kot siliciclastics representing Late Cretaceous lowstand events are present southeast of the Salt Range and on the Kohat Plateau but are not reported within the Potwar Basin.
Cenozoic deposition began with the Paleocene-Eocene Makarwal Group. Hangu Formation siliciclastics were deposited fi rst on an erosional surface marking the top of the Cretaceous Lumshiwal Formation. There is a transitional contact between the Hangu and Pab and the overlying Lock-hart Formation carbonate-shelf system. The contact between the Lockhart and the shallow-marine shales and subordinate carbonates of the Patala Formation is also transitional (Shah and others, 1977; Iqbal and Shah, 1980; Kemal, 1992). Oil production has been attributed to the Lockhart and Patala. The overlying Eocene Nammal and Panoba Formations are shal-low-marine to lagoonal shales and interbedded limestones with a transitional contact between the Patala and the Nammal. Overlying the Nammal and Panoba are the lower Eocene Sakesar or Margala Hill Formation marine limestones and shales. Oil or gas production from eight fi elds spanning the Potwar Plateau are attributed to the Margala Hill. Even though Iqbal and Shah (1980) indicated that the probably contempo-raneous lower Eocene Bahadur Khel Salt is present only in the Kohat Plateau area (fi g. 5), oil or gas production at three fi elds on the Potwar Plateau has been attributed (Petroconsultants, 1996) to the Bahadur Khel Salt Formation (Shah and others, 1977; Petroconsultants, 1996). The Chharat Group includes marine shales and interbedded limestones of the lower Eocene Chorgali Formation, the shales of the upper Eocene Kohat Formation, and the highstand shales and ramp carbonates of
the Oligocene Kirthar Formation that were deposited at least in the Kohat and northern Potwar area. Oligocene rocks are missing from most of the basin. An erosional surface marks a change to alluvial environments represented by the Miocene to Pliocene Murree Formation fl uvial sandstones and siltstones and the Kamlial Formation fl uvial sandstones and clays of the Rawalpindi Group. The Murree Formation contains the young-est reported oil-producing reservoirs in the Kohat-Potwar geo-logic province. Pliocene and Pleistocene Siwalik Group fl uvial sandstones and conglomerates mark the top of the stratigraphic column in the area.
Production History
In 1866, the fi rst oil well on the western Indian subcon-tinent was drilled at Kundal (fi g. 13). The fi rst commercial oil discovery occurred in 1914 when the Attock Oil Company completed a 214-ft well on a thrust-faulted anticline near the town of Khaur (Khan and others, 1986) (fi g. 13). Since the discovery, there have been more than 340 wells drilled in the fi eld. Production at Khaur is from Sakesar and Murree Forma-tion reservoirs. Drilling from 1920 to 1935 resulted in success at Dhulian, a structural dome 17 km southeast of Khaur. Other discoveries followed with Joya Mair in 1944, Balkassar in 1946, Karsal in 1956, and Tut in 1967 (fi g. 13). The fi rst com-mercial gas fi eld—Adhi—was found in 1979. The Adhi gas fi eld produced from rocks ranging in age from Cambrian to Eocene (Petroconsultants, 1996). Eighteen oil and three gas fi elds were discovered in the Kohat-Potwar geologic prov-ince between 1915 and 1996, and several prospects that were unsuccessfully tested in the 1950s and 1960s are now being reexamined with good results (Quadri and Quadri, 1998). Production in the Kohat-Potwar geologic province comes primarily from faulted anticlinal traps in rocks ranging in age from Cambrian to Miocene, and at depths of less than 20 m to greater than 1,030 m. The largest oil and gas fi eld found to date is the Dhurnal fi eld with areal closure of 13.5 km2 and vertical closure of 500 m. The initial in-place oil estimate for Dhurnal was 102 MMBO (million barrels of oil) (Jaswal and others, 1997)
The plot of cumulative new-fi eld wildcat wells versus completion year for the Kohat-Potwar geologic province (fi g. 14) shows that the rate of fi eld discovery through time has increased. The known oil fi elds ranked by size and grouped in discovery thirds does not show a signifi cant decrease in fi eld size in progressive thirds (fi g. 15). The small decrease in fi eld size through time indicates that the province is still not mature in terms of exploration. A mature province would show a larger decrease in fi eld sizes between the fi rst and third thirds. The small range of fi eld sizes shown in fi gure 15 may also be the result of relatively consistent thrust mechanisms creating many anticlinal traps of similar volume and orienta-tion. The size of oil fi elds discovered during the second and third third of the exploration history further indicates that,
Patala-Nammal Composite Total Petroleum System, Kohat-Potwar Geologic Province, Pakistan 9
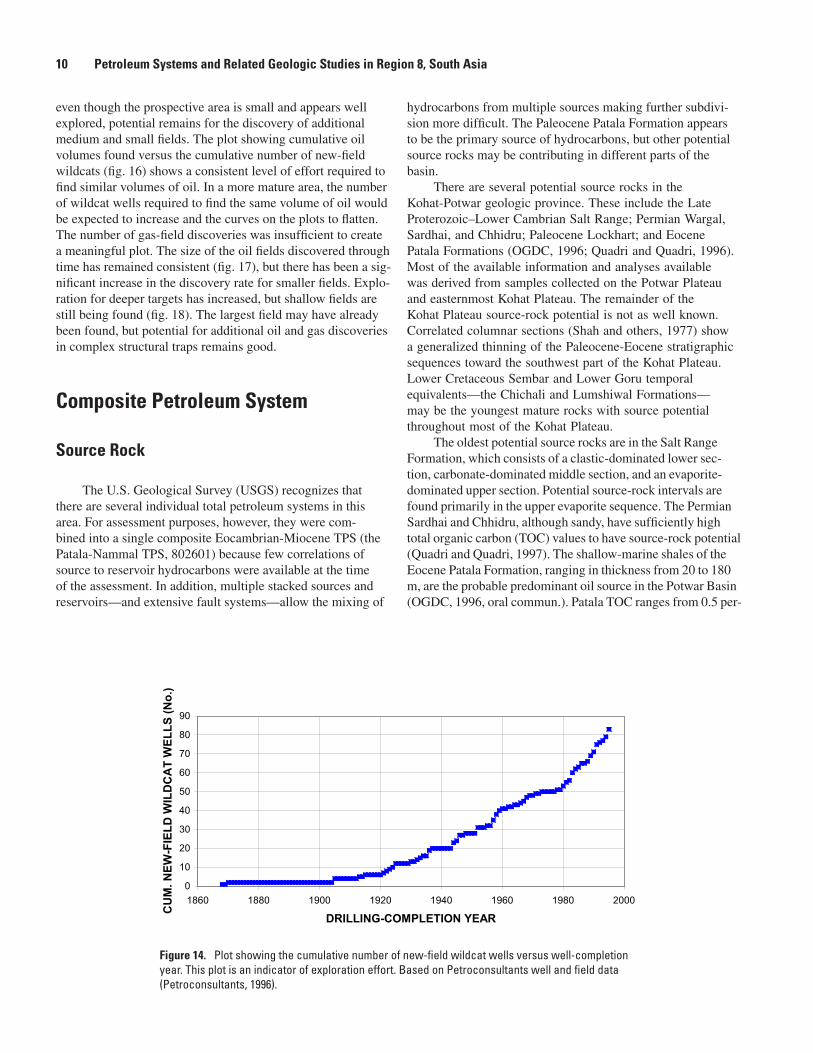
even though the prospective area is small and appears well explored, potential remains for the discovery of additional medium and small fi elds. The plot showing cumulative oil volumes found versus the cumulative number of new-fi eld wildcats (fi g. 16) shows a consistent level of effort required to fi nd similar volumes of oil. In a more mature area, the number of wildcat wells required to fi nd the same volume of oil would be expected to increase and the curves on the plots to fl atten. The number of gas-fi eld discoveries was insuffi cient to create a meaningful plot. The size of the oil fi elds discovered through time has remained consistent (fi g. 17), but there has been a sig-nifi cant increase in the discovery rate for smaller fi elds. Explo-ration for deeper targets has increased, but shallow fi elds are still being found (fi g. 18). The largest fi eld may have already been found, but potential for additional oil and gas discoveries in complex structural traps remains good.
Composite Petroleum System
Source Rock
The U.S. Geological Survey (USGS) recognizes that there are several individual total petroleum systems in this area. For assessment purposes, however, they were com-bined into a single composite Eocambrian-Miocene TPS (the Patala-Nammal TPS, 802601) because few correlations of source to reservoir hydrocarbons were available at the time of the assessment. In addition, multiple stacked sources and reservoirs—and extensive fault systems—allow the mixing of
0
10
20
30
40
50
60
70
80
90
1860 1880 1900 1920 1940 1960 1980 2000
DRILLING-COMPLETION YEAR
CU
M. N
EW
-FIE
LD
WIL
DC
AT
WE
LL
S (
No
.)
Figure 14. Plot showing the cumulative number of new-fi eld wildcat wells versus well-completion year. This plot is an indicator of exploration effort. Based on Petroconsultants well and fi eld data (Petroconsultants, 1996).
hydrocarbons from multiple sources making further subdivi-sion more diffi cult. The Paleocene Patala Formation appears to be the primary source of hydrocarbons, but other potential source rocks may be contributing in different parts of the basin.
There are several potential source rocks in the Kohat-Potwar geologic province. These include the Late Proterozoic–Lower Cambrian Salt Range; Permian Wargal, Sardhai, and Chhidru; Paleocene Lockhart; and Eocene Patala Formations (OGDC, 1996; Quadri and Quadri, 1996). Most of the available information and analyses available was derived from samples collected on the Potwar Plateau and easternmost Kohat Plateau. The remainder of the Kohat Plateau source-rock potential is not as well known. Correlated columnar sections (Shah and others, 1977) show a generalized thinning of the Paleocene-Eocene stratigraphic sequences toward the southwest part of the Kohat Plateau. Lower Cretaceous Sembar and Lower Goru temporal equivalents—the Chichali and Lumshiwal Formations—may be the youngest mature rocks with source potential throughout most of the Kohat Plateau.
The oldest potential source rocks are in the Salt Range Formation, which consists of a clastic-dominated lower sec-tion, carbonate-dominated middle section, and an evaporite-dominated upper section. Potential source-rock intervals are found primarily in the upper evaporite sequence. The Permian Sardhai and Chhidru, although sandy, have suffi ciently high total organic carbon (TOC) values to have source-rock potential (Quadri and Quadri, 1997). The shallow-marine shales of the Eocene Patala Formation, ranging in thickness from 20 to 180 m, are the probable predominant oil source in the Potwar Basin (OGDC, 1996, oral commun.). Patala TOC ranges from 0.5 per-
10 Petroleum Systems and Related Geologic Studies in Region 8, South Asia

cent to more than 3.5 percent, with an average of 1.4 percent, and are type-II and -III kerogens. The exception to this may be the Dhurnal fi eld (fi g. 14), where Patala samples have low TOC values, whereas TOC values in the Permian Wargal are 1.0 per-cent and in the Lockhart they are 1.4 percent (Jaswal and others, 1997). Oil samples from Dhurnal fi eld also do not match those known to be sourced by the Patala. Sulfur content of the oils is less than 0.65 percent, except at Joyamair where sulfur content is greater than 2 percent (Khan and others, 1986).
Maturation
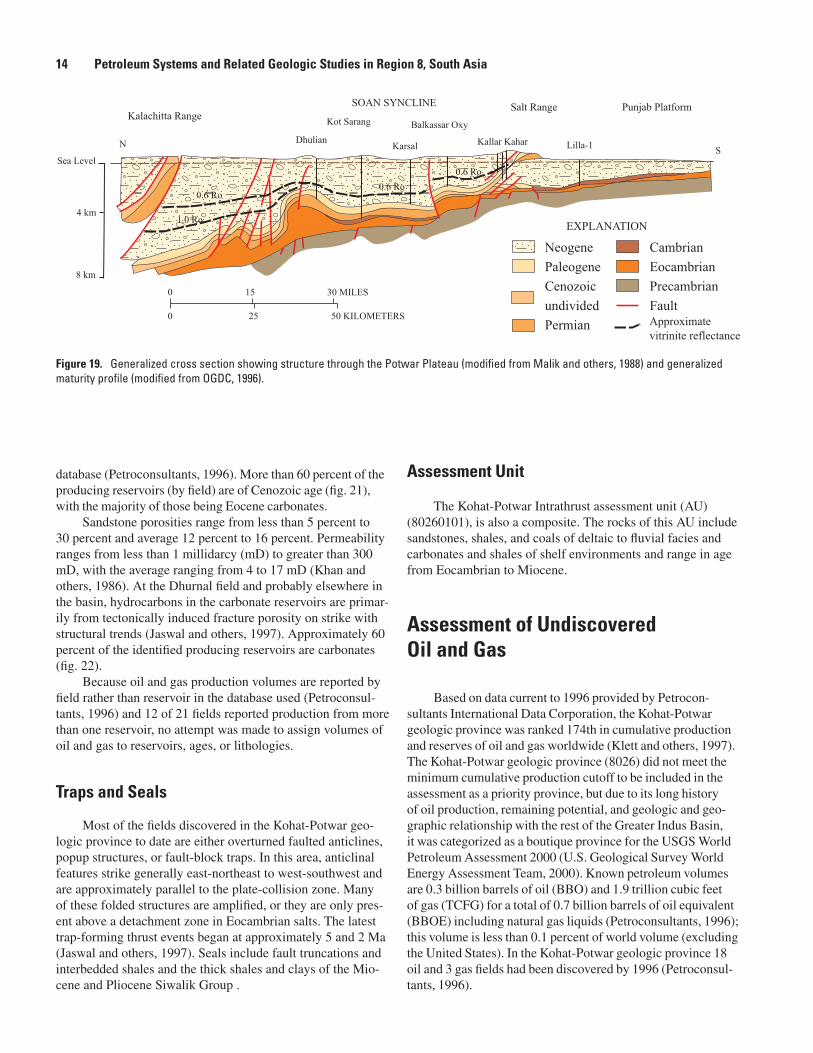
Thermal maturities for Kohat-Potwar rocks range, from Ro 0.3 to more than 1.6 percent. A basin profi le (OGDC, 1996) indicates vitrinite refl ectance equivalent maturities of 0.62 to 1.0 percent for Tertiary rocks in the productive part of the Potwar Basin (fi g. 19). Fluid-inclusion data, with vitrinite-refl ectance data used for calibration, shows calculated and measured Ro samples between 0.6 and 1.1 percent for
1
10
100
1,000
0 1 2 3 4 5 6
OIL-FIELD RANK BY SIZE
KN
OW
N O
IL-F
IEL
D S
IZE
(M
MB
O
First third of fields discovered
Second third of fields discovered
Third third of fields discovered
1
10
100
1,000
0 1 2 3 4 5 6
OIL-FIELD RANK BY SIZE
GR
OW
N O
IL-F
IEL
D S
IZE
(M
MB
O)
Figure 15. Maturity of exploration indicator plots showing known and grown (expected fi nal size when production is ended) fi eld sizes grouped in thirds by age of discovery and ranked by size. Based on Petroconsultants fi eld data (Petroconsultants, 1996).
Patala-Nammal Composite Total Petroleum System, Kohat-Potwar Geologic Province, Pakistan 11
(MM
BO
)

Cretaceous, 0.5 to 0.9 percent for Jurassic, and 0.65 to 0.95 percent for Permian rocks (Tobin and Claxton, 2000). North of the main boundary thrust fault, maturities are higher. In the northern and probably central basin, Cretaceous rocks are in the 1.0 to 1.6 percent Ro range. Dry gas generation begins near 1.3 percent Ro.
Generation and Migration
Generation of hydrocarbons most likely began in Late Cretaceous time for Cambrian through Lower Cretaceous source rocks and again from Pliocene time to the present for younger source rocks (OGDC, 1996). Burial-history plots by Law and others (1998) (fi g. 20) start at about 30 Ma and there-
fore show only a late or second period of generation beginning 20 to 15 Ma and continuing to the present. Two distinct over-pressuring regimes were reported by Law and others (1998). A Neogene overpressuring regime was attributed to tectonic compression and undercompaction, and a pre-Neogene over-pressuring regime is attributed to combined hydrocarbon gen-eration and tectonic compression The burial-history plots of Law and others (1998) also indicate that maximum burial was reached approximately 2 million years ago. Even though there were probably two distinct periods of generation from two different groups of source rocks, suffi cient source-to-reservoir correlation data were not available to clearly defi ne sepa-rate petroleum systems. In many oil and gas fi elds, there are stacked source and reservoir rocks possibly resulting in mixing of oils. Migration is primarily over short distances updip and
0
100
200
300
400
500
600
700
0 10 20 30 40 50 60 70 80 9
CUM. NEW-FIELD WILDCAT WELLS (No.)
CU
M. K
NO
WN
OIL
VO
LU
ME
(M
MB
O)
0
0
100
200
300
400
500
600
700
0 10 20 30 40 50 60 70 80 9
CUM. NEW-FIELD WILDCAT WELLS (No.)
CU
M. G
RO
WN
OIL
VO
LU
ME
(M
MB
O)
0
Figure 16. Plots showing cumulative known and grown oil volumes versus the cumulative number of new-fi eld wildcat wells. The trends exhibited indicate continued success in fi nding relatively consistent volumes of oil with a similar amount of exploration effort. Based on Petroconsultants fi eld data (Petroconsultants, 1996).
12 Petroleum Systems and Related Geologic Studies in Region 8, South Asia
(MM
BO
)

Figure 17. Plot showing fi eld size versus fi eld-discovery year serves as an indicator of exploration maturity. Based on Petroconsultants fi led data (Petroconsultants, 1996).
Figure 18. Plot showing reservoir depth versus oil-fi eld-discovery year. This plot shows increasing depth of discoveries through time. Based on Petroconsultants fi eld data (Petroconsultants, 1996).
Patala-Nammal Composite Total Petroleum System, Kohat-Potwar Geologic Province, Pakistan 13
0
500
1,000
1,500
2,000
2,500
3,000
3,500
4,000
4,500
5,000
1860 1880 1900 1920 1940 1960 1980 2000
FIELD-DISCOVERY YEAR
RE
SE
RV
OIR
DE
PT
H, O
IL F
IEL
DS
(m(m
)
1
10
100
1,000
1860 1880 1900 1920 1940 1960 1980 2000
FIELD-DISCOVERY YEAR
KN
OW
N O
IL-F
IEL
D S
IZE
(MM
BO
)
vertically into adjacent reservoirs and through faults and frac-tures associated with plate collision and thrusting.
Reservoir Rocks
Reservoir rocks include Miocene alluvial sandstones, Paleogene shelf carbonates, Jurassic and Permian continental sandstones, and Cambrian alluvial and shoreface sandstones
(Shah and others, 1977; Iqbal and Shah, 1980). On the Potwar Plateau, oil or gas has been produced from the following forma-tions: Cambrian Kherwa, Kussak, and Jutana; Permian Tobra, Amb, and Wargal; Jurassic Datta; Cretaceous Lumshiwal; Paleocene Khairabad, Lockhart, Patala, and Nammal; Eocene Bhadrar, Chorgali, and Margala Hill Limestone; and Miocene Murree (Khan and others, 1986; Petroconsultants, 1996) (fi g. 5). Production from more than one of these reservoirs (in one case fi ve reservoirs) was reported at 12 of the 22 fi elds in the
database (Petroconsultants, 1996). More than 60 percent of the producing reservoirs (by fi eld) are of Cenozoic age (fi g. 21), with the majority of those being Eocene carbonates.
Sandstone porosities range from less than 5 percent to 30 percent and average 12 percent to 16 percent. Permeability ranges from less than 1 millidarcy (mD) to greater than 300 mD, with the average ranging from 4 to 17 mD (Khan and others, 1986). At the Dhurnal fi eld and probably elsewhere in the basin, hydrocarbons in the carbonate reservoirs are primar-ily from tectonically induced fracture porosity on strike with structural trends (Jaswal and others, 1997). Approximately 60 percent of the identifi ed producing reservoirs are carbonates (fi g. 22).
Because oil and gas production volumes are reported by fi eld rather than reservoir in the database used (Petroconsul-tants, 1996) and 12 of 21 fi elds reported production from more than one reservoir, no attempt was made to assign volumes of oil and gas to reservoirs, ages, or lithologies.
Traps and Seals
Most of the fi elds discovered in the Kohat-Potwar geo-logic province to date are either overturned faulted anticlines, popup structures, or fault-block traps. In this area, anticlinal features strike generally east-northeast to west-southwest and are approximately parallel to the plate-collision zone. Many of these folded structures are amplifi ed, or they are only pres-ent above a detachment zone in Eocambrian salts. The latest trap-forming thrust events began at approximately 5 and 2 Ma (Jaswal and others, 1997). Seals include fault truncations and interbedded shales and the thick shales and clays of the Mio-cene and Pliocene Siwalik Group .
Assessment Unit
The Kohat-Potwar Intrathrust assessment unit (AU) (80260101), is also a composite. The rocks of this AU include sandstones, shales, and coals of deltaic to fl uvial facies and carbonates and shales of shelf environments and range in age from Eocambrian to Miocene.
Assessment of Undiscovered Oil and Gas
Based on data current to 1996 provided by Petrocon-sultants International Data Corporation, the Kohat-Potwar geologic province was ranked 174th in cumulative production and reserves of oil and gas worldwide (Klett and others, 1997). The Kohat-Potwar geologic province (8026) did not meet the minimum cumulative production cutoff to be included in the assessment as a priority province, but due to its long history of oil production, remaining potential, and geologic and geo-graphic relationship with the rest of the Greater Indus Basin, it was categorized as a boutique province for the USGS World Petroleum Assessment 2000 (U.S. Geological Survey World Energy Assessment Team, 2000). Known petroleum volumes are 0.3 billion barrels of oil (BBO) and 1.9 trillion cubic feet of gas (TCFG) for a total of 0.7 billion barrels of oil equivalent (BBOE) including natural gas liquids (Petroconsultants, 1996); this volume is less than 0.1 percent of world volume (excluding the United States). In the Kohat-Potwar geologic province 18 oil and 3 gas fi elds had been discovered by 1996 (Petroconsul-tants, 1996).
0.6 Ro
1.0 Ro
0.6 Ro
0.6 Ro
Approximate
vitrinite reflectance
Kalachitta RangeSalt Range Punjab Platform
Neogene
Paleogene
Cenozoic
undivided
Permian
EXPLANATION
Cambrian
Eocambrian
Precambrian
Fault0
0
15 30 MILES
25 50 KILOMETERS
SOAN SYNCLINE
Kot Sarang
DhulianKarsal
Balkassar Oxy
Kallar Kahar Lilla-1
Sea Level
4 km
8 km
NS
Figure 19. Generalized cross section showing structure through the Potwar Plateau (modifi ed from Malik and others, 1988) and generalized maturity profi le (modifi ed from OGDC, 1996).
14 Petroleum Systems and Related Geologic Studies in Region 8, South Asia

0 0
5,000
10,000
15,000
20,000
30 25 20 15 10 5
2,000
4,000
6,000
Dep
th i
n M
eter
s
0 0
5,000
10,000
15,000
20,00030 25 20 15 10 5
2,000
4,000
6,000
meters
Dep
th i
n F
eet
300 (F)
250 (F)
150 (F)
Time (Ma)
300 (F)
250 (F)
200 (F)
150 (F)
Paleocene
rocks
Paleocene
rocks
Cambrian and
Precambrian
rocks
Cambrian and
Precambrian
rocks
100 (F)
00
Oil Window
100 (F)
Other
Paleozoic
rocks
Other
Paleozoic
rocks200 (F)
Mesozoic
rocks
Mesozoic
rocks
Neogene
rocks Neogene
rocks
Paleocene
rocks
Paleocene
rocks
Dep
th i
n M
eter
s
Dep
th i
n F
eet
Time (Ma)
Peshawar Basin
Salt Range Thrust
Jehlu
m F
ault
0 50 km.Scale
Main Boundary Thrust
River
Fault
Anticline
Oil field
Gas field
Oil and Gas
field
Insufficient
field data
Kalab
agh F
ault
Islamabad
Index Map
Fim Kassar
Dakhni
Indu
s R
iver
Figure 20. Generalized burial-history plots for the ODGC Dakhni 1 well (left) and the Gulf Oil Fim Kassar well (right) (modifi ed from Law and others, 1998)
Patala-Nam
mal Com
posite Total Petroleum System
, Kohat-Potwar G
eologic Province, Pakistan
15

0
2
4
6
8
10
12
14
16
18
20
Miocene Eocene Paleocene Jurassic Permian Cambrian
Age
Nu
mb
er
of
Fie
lds
Figure 21. Distribution of producing reservoirs by age and number of fi elds in which they occur (based on Petroconsultants reservoir and fi eld data; Petroconsultants, 1996).
Figure 22 - Distribution of producing reservoir lithology by age and
number of fields reporting production from that age group and lithology type.
Based on Petroconsultants field and reservoir data (Petroconsultants, 1996).511
6
3
6
15 fields
reported
Eocene Limestone
Paleocene Limestone
Permian Limestone
Cambrian Dolomite
Jurassic Sandstone
Permian Sandstone
Cambrian Sandstone
Figure 22. Distribution of producing reservoirs by age, lithology, and number of fi elds reporting pro-duction from that age group and lithology type. Based on Petroconsultants fi eld and reservoir data (Petroconsultants, 1996).
16 Petroleum Systems and Related Geologic Studies in Region 8, South Asia

Previous estimates of undiscovered oil and gas in this region include those by Kingston (1986) and Masters and others (1998). Kingston (1986) estimated the mode of undis-covered oil in the Kohat-Potwar province at 0.1 BBO and gas at 0.1 TCF. Masters and others (1998) estimated the mean for undiscovered oil in this province as 0.12 BBO and the mean for undiscovered gas as 3.0 TCF. The methodology utilized in those assessments employed analogs from well-known pro-ductive regions of the world and also relied heavily on volu-metric considerations.
The 2000 assessment incorporates the petroleum system concept as defi ned by Magoon and Dow (1994). The TPS used as the geologic basis of the 2000 assessment in the Kohat-Potwar geologic province is the Patala-Nammal TPS (802601). Tables 1, 2, and 3 show the estimated ranges of assessed undiscovered oil and gas volumes allocated by assessment unit and the totals for the composite Patala-Nammal TPS.
Summary
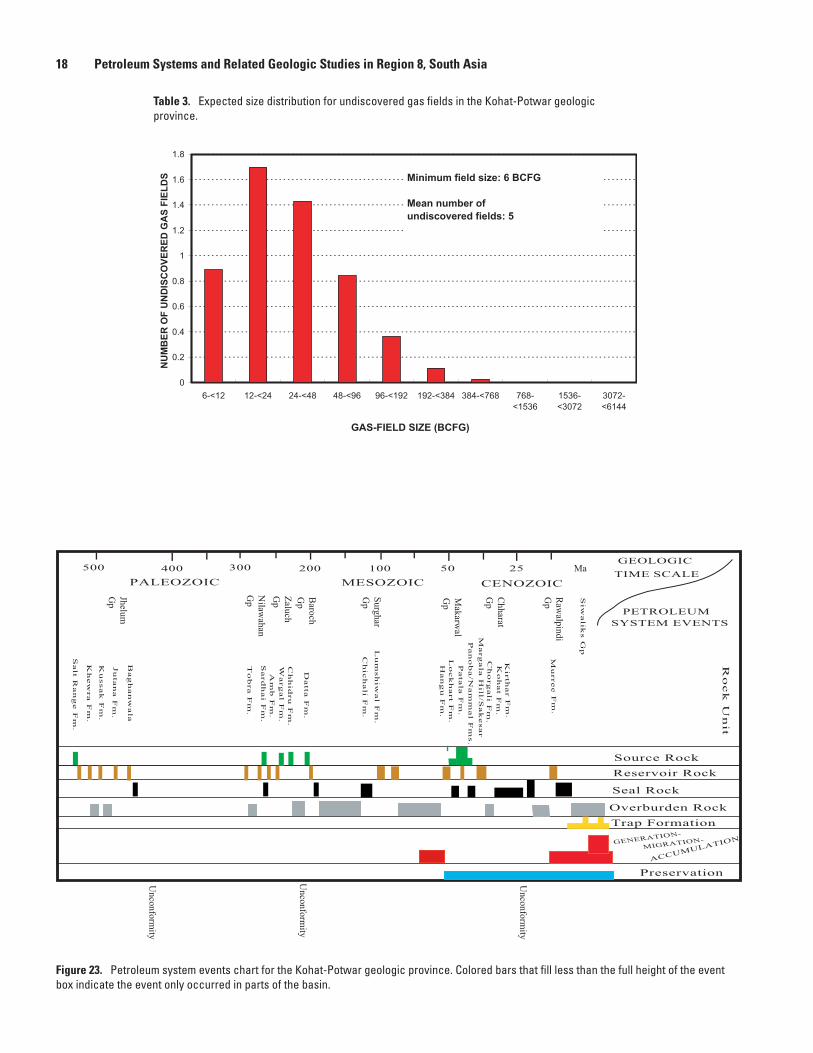
Source-rock quality in the Kohat-Potwar geologic province is fair to good in numerous stratigraphic intervals (fi g. 23). Burial depths were in the past, and are today, great enough for continued generation from many of these source intervals. The Paleocene and Eocene source intervals have been in the oil and gas generation window in parts of the Kohat-Potwar geologic province for as long as 15 m.y., and, in places, generation continues today. Reservoirs are of fair to very good quality and exist in close proximity to source rocks. The presence of stacked reservoirs greatly improves opportu-nities for discoveries. Trap development, although widespread, was relatively late but coincided with maximum burial and probably maximum hydrocarbon generation. Continued crustal shortening and uplift in some cases enhanced trap quality and
Code Undiscovered resources
and field MFS Prob. Oil (MMBO)
type (0-1) F95 F50 F5 Mean F95 F50 F5 Mean F95 F50 F5 Mean
Grand Total: Assessed portions of Kohat-Potwar Province (8026)
Oil fields 54 140 274 149 110 299 637 327 6 17 40 20
Gas fields 273 881 2,054 987 9 30 75 35
Total 1.00 54 140 274 149 383 1,180 2,691 1,314 15 48 115 54
1.00
Gas (BCFG) NGL (MMBNGL)
Table 1. Estimates of undiscovered oil and gas for the Patal-Nammal composite total petroleum system, Kohat-Potwar geologic province (8026), Pakistan.
[MMBO, million barrels of oil. BCFG, billion cubic feet of gas. MMBNGL, million barrels of natural gas liquids. MFS, minimum fi eld size assessed (MMBO or BCFG). Prob., probability (including both geologic and accessibility probabilities) of at least one fi eld equal to or greater than the MFS. Results shown are fully risked estimates. For gas fi elds, all liquids are included under the NGL (natural gas liquids) category. F95 represents a 95-percent chance of at least the amount tabulated. Other fractiles are defi ned similarly. Fractiles are additive under the assumption of perfect positive correlation. Shading indicates not applicable]
0
1
2
3
4
5
6
7
1-<2 2-<4 4-<8 8-<16 16-<32 32-<64 64-<128 128-
<256
256-
<512
512-
<1024
1024-
<2048
OIL-FIELD SIZE (MMBO)
NU
MB
ER
OF
UN
DIS
CO
VE
RE
D O
IL F
IEL
DS
Minimum field size: 1 MMBO
Mean number of
undiscovered fields: 21
Table 2. Expected size distribution for undiscovered oil fi elds in the Kohat-Potwar geologic province.
Patala-Nammal Composite Total Petroleum System, Kohat-Potwar Geologic Province, Pakistan 17
0
0.2
0.4
0.6
0.8
1
1.2
1.4
1.6
1.8
6-<12 12-<24 24-<48 48-<96 96-<192 192-<384 384-<768 768-
<1536
1536-
<3072
3072-
<6144
GAS-FIELD SIZE (BCFG)
NU
MB
ER
OF
UN
DIS
CO
VE
RE
D G
AS
FIE
LD
S
Minimum field size: 6 BCFG
Mean number of
undiscovered fields: 5
Table 3. Expected size distribution for undiscovered gas fi elds in the Kohat-Potwar geologic province.
GENERATION-
MIGRATION-
Ro
ck
U
nit
Reservoir Rock
Seal Rock
Overburden Rock
Trap Formation
Preservation
GEOLOGIC
TIME SCALE
PETROLEUM
SYSTEM EVENTS
500 100
MESOZOIC CENOZOIC
Un
confo
rmity
Source Rock
ACCUMULATION
200300400
Salt R
an
ge F
m.
Kirth
ar F
m.
Ko
hat F
m.
Patala F
m.
Marg
ala H
ill/S
ak
esar
Siw
alik
s G
p
Bag
han
wala
Un
con
form
ity
PALEOZOIC
Lu
msh
iw
al F
m.
Pan
ob
a/N
am
mal F
ms.
Kh
ew
ra F
m.
Ku
ssak
F
m.
Ju
tan
a F
m.
To
bra F
m.
Sard
hai F
m.
Am
b F
m.
Un
confo
rmity
Datta F
m.
Lo
ck
hart F
m.
Han
gu
F
m.
Ch
ich
ali F
m.
50 25
Ch
org
ali F
m.
Warg
al F
m.
Ch
hid
ru
F
m.
Mu
rree F
m.
Jhelu
m
Gp
Zalu
ch
Gp
Nilaw
ahan
Gp
Baro
ch
Gp
Su
rgh
ar
Gp
Mak
arwal
Gp
Ch
harat
Gp
Raw
alpin
di
Gp
Ma
Figure 23. Petroleum system events chart for the Kohat-Potwar geologic province. Colored bars that fi ll less than the full height of the event box indicate the event only occurred in parts of the basin.
18 Petroleum Systems and Related Geologic Studies in Region 8, South Asia
in others diminished or destroyed it. Complex structures and overpressuring, although creating exploration and drilling challenges, also offer additional opportunities. Further oppor-tunities also exist in the Kohat Plateau area where few wells have been drilled, but source-rock quality or thickness may be lower. The northern folded zone also has potential, although structural complexity makes exploration diffi cult.
Selected ReferencesAhmad, S., Alam, Z., and Khan, A.R., 1996, Petroleum exploration and
production activities in Pakistan: Pakistan Petroleum Information Service, 72 p.
Biswas, S.K., and Deshpande, S.V., 1983, Geology and hydrocarbon prospects of Kutch, Saurashtra, and Narmada Basins: Petroleum Asia Journal, v. 6, no. 4, p. 111–126.
Drewes, H.,1995, Tectonics of the Potwar Plateau region and the development of syntaxes, Punjab, Pakistan: U.S. Geological Survey Bulletin 2126, 25 p.
Environmental Systems Research Institute Inc., 1992, ArcWorld 1:3M digital database: Environmental Systems Research Institute, Inc. [ESRI], scale: 1:3,000,000, [available from ESRI, Redlands, Calif.].
Government of Pakistan, 2001, Privatisation Commission Finance Division: Government of Pakistan Web page, [URL <www.gop-sale.com/index.htm?press_release.htm&2>].
Iqbal, M.W.A., and Shah, S.M.I., 1980, A guide to the stratigraphy of Pakistan: Quetta, Geological Survey of Pakistan Records, v. 53, p. 34.
IHS Energy Group[ formerly Petroconsultants], 2001, Probe 4.0 petroleum exploration and production database:Englewood, Colo., IHS Energy Group [database available from IHS Energy Group, 15 Inverness Way East, D205, Englewood, CO 80112, U.S.A.—includes data current as of September 2001].
Jaswal, T.M., Lillie, R.J., and Lawrence, R.D., 1997, Structure and evolution of the northern Potwar deformed zone, Pakistan: American Association of Petroleum Geologists Bulletin, v. 81, no. 2, p. 308–328.
Johnson, E.A., Warwick, P.D., Roberts, S.B., and Khan, I.H., 1999, Lithofacies, depositional environments, and regional stratigraphy of the lower Eocene Ghazij Formation, Balochistan, Pakistan: U.S. Geological Survey Professional Paper 1599, 76 p.
Kazmi, A.H., and Rana, R.A., 1982, Tectonic map of Pakistan: Geological Survey of Pakistan, scale: 1:2,000,000.
Kemal, A., 1992, Geology and new trends for hydrocarbon exploration in Pakistan, in Ahmed, G., Kemal, A., Zaman, A.S.H., and Humayon, M., eds., New directions and strategies for accelerating petroleum exploration and production in Pakistan: Proceedings, international petroleum seminar, November, 22–24, 1991: Islamabad, Pakistan, Ministry of Petroleum and Natural Resources, p. 16–57.
Kemal, A., Balkwill, H.R., and Stoakes, F.A., 1992, Indus Basin hydrocarbon plays, in Ahmed, G., Kemal, A., Zaman, A.S.H., and Humayon, M., eds., New directions and strategies for accelerating
petroleum exploration and production in Pakistan: Proceedings, international petroleum seminar, November, 22–24, 1991: Islamabad, Pakistan, Ministry of Petroleum and Natural Resources, p. 76–105.
Khan, M.A., Ahmed, R., Raza, H.A., and Kemal, A., 1986, Geology of petroleum in Kohat-Potwar Depression, Pakistan: American Association of Petroleum Geologists Bulletin, v. 70, no. 4, p. 396–414.
Kingston, J., 1986, Undiscovered petroleum resources of South Asia: U.S. Geological Survey Open-File Report 86-80, 131 p.
Klett, T.R., Ahlbrandt, T.A., Schmoker, J.W., and Dolton, G.L., 1997, Ranking of the world’s oil and gas provinces by known petroleum volumes: U.S. Geological Survey Open-File Report 97-463, one CD-ROM.
Law, B.E., Shah, S.H.A., and Malik, M.A., 1998, Abnormally high formation pressures, Potwar Plateau, Pakistan, in Law, B.E., Ulmishek, G.F., and Slavin, V.I., eds., Abnormal pressures in hydrocarbon environments: American Association of Petroleum Geologists Memoir 70, p. 247–258.
Magoon, L.B., and Dow, W.G., 1994, The TPS—From source to trap: American Association of Petroleum Geologists Memoir 60, 60 p.
Masters, C.D., Root, D.H., and Turner, R.M., 1998, World conventional crude oil and natural gas identifi ed reserves, undiscovered resources, and futures: U.S. Geological Survey Open-File Report 98-468, 105 p.
Peeock, E.S., Lillie, R.J., Zaman, A.S.H., and Yousaf, M., 1989, Structural interpretation of seismic refl ection data from eastern Salt Range and Potwar Plateau, Pakistan: American Association of Petroleum Geologists Bulletin, v. 73, p. 841–857.
Oil and Gas Development Corporation [OGDC], 1995, Pakistan petroleum prospects—An overview: Islamabad, Oil & Gas Development Corporation, 22 p.
Oil and Gas Development Corporation [OGDC], 1996, Pakistan petroleum prospects—An overview: Islamabad, Oil & Gas Development Corporation, 22 p.
Petroconsultants, 1996, Petroleum exploration and production digital database: Petroconsultants, Inc., [P.O. Box 740619, 6600 Sands Point Drive, Houston TX 77274-0619, U.S.A. or Petroconsultants, Inc., P.O. Box 152, 24 Chemin de la Mairie, 1258 Perly, Geneva, Switzerland].
Powell, C. M.A., 1979, A speculative tectonic history of Pakistan and surroundings; some constraints from the Indian Ocean, in Farah, Abdul, and Dejohn, K.A., eds., Geodynamics of Pakistan: Geological Survey of Pakistan, p. 5–24.
Quadri, Viqar-un-Nisa, and Quadri, S.M.G.J., 1996, Exploration anatomy of success in oil and gas exploration in Pakistan, 1915–94, Oil and Gas Journal, v. 94, issue 20.
Quadri, V.N., and Quadri, S.M.J.G., 1998, Failure-to-success targets may lie in Pakistan basins: Oil and Gas Journal archives, v. 96, issue 1, [accessed 3/2/2000 at URL <http//ogj.pennwellnet.com>].
Quadri, V.N., and Quadri, S.M.J.G., 1998, Pakistan has unventured regions, untested plays: Oil and Gas Journal archives, v. 96, issue 12, [accessed 3/2/2000 at URL <http//ogj.pennwellnet.com>].
Patala-Nammal Composite Total Petroleum System, Kohat-Potwar Geologic Province, Pakistan 19
Quresihi, M.J., Tariq, M.A., and Abid, Q.Z. [Raza, S.M., Hussain, A., and Khan, S.H., eds.], 1993, Geological map of Pakistan: Geological Survey of Pakistan, scale 1:1,000,000.
Scotese, C.R., Gahagan, L.M., and Larson, R.L., 1988, Plate tectonic reconstructions of the Cretaceous and Cenozoic ocean basins: Tectonophysics, v. 155, p. 27–48.
Scotese, C.R., 1997, PALEOMAP Software, Paleomap project, [available at URL http://scotese.com].
Sercombe, W.J., Stratton, M., Albertin, M., Wilson, W.P., Roth, B.L., Van Nieuwenhuise, R., Pivnik, D.A., and Beck, R.A., 1994, Wrench faulting in the northern Pakistan foreland region: The Leading Edge, November 1994, p. 1107–1110.
Sercombe, W.J., Pivnik, D.A., Wilson, W.P., Albertin, M.L., Beck, R.A., and Stratton, M.A., 1998, Wrench faulting in the northern Pakistan foreland: American Association of Petroleum Geologists Bulletin, v. 82, no. 11, p. 2003–2030.
Shah, S.M.I., Ahmed, R., Cheema, M.R., Fatmi, A.N., Iqbal, M.W.A., Raza, H.A., and Raza, S.M., 1977, Stratigraphy of Pakistan: Geological Survey of Pakistan, Memoirs, v. 12, 137 p.
Soulsby, A., and Kemal, A., 1988, A review of exploration activity in Pakistan: Oil and Gas Journal, November 21, 1988, p. 56–59.
Soulsby, A., and Kemal, A., 1988, Source rock maturity key to new plays: Oil and Gas Journal, November 28, 1988, p. 81–83.
Raza, H.A., 1992, Petroleum source rocks in Pakistan, in Gulfaraz, A., Kemal, A., Zaman, A.S.H, and Humayon, M., eds., New directions and strategies for acceleration petroleum exploration in Pakistan: Islamabad, Pakistan, Proceedings of an international petroleum seminar, Ministry of Petroleum & Natural Resources, Nov. 22–24, 1991, p. 129–136.
Roychoudhury, S.C., and Deshpande, S.V., 1982, Regional distribution of carbonate facies, Bombay offshore region, India: American Association of Petroleum Geologists Bulletin, v. 66, no. 10, p. 1483–1496.
Tobin, R.C., and Claxton, B.L., 2000, Multidisciplinary thermal maturity studies using vitrinite refl ectance and fl uid inclusion microthermometry; A new calibration of old techniques: American Association of Petroleum Geologists Bulletin, v. 84, no. 10, p. 1647–1665.
U.S. Geological Survey World Energy Assessment Team, 2000, U.S. Geological Survey World Petroleum Assessment 2000—Description and results: U.S. Geological Survey Digital Data Series DDS-60, version 1.1, 4 CD-ROMs.
Wandrey, C.J., and Law, B.E., 1999, Map showing geology, oil and gas fi elds, and geologic provinces of South Asia: U.S. Geological Survey Open File Report 97-470C, version 2, 1 CD-ROM.
Wandrey, C.J., Milici, R.C., and Law, B.E., 2000, Region 8, South Asia, in U.S. Geological Survey World Petroleum Assessment 2000—Description and results: U.S. Geological Survey Digital Data Series DDS-60, version 1.1, 4 CD-ROMs.
Waples, D.W., and Hegarty, K., 1999, Seychelles thermal history hydrocarbon generation traced: Oil and Gas Journal, v. 97, no. 21, p. 78–82.
Warwick, P.D., Javed, S., Mashhadi, S.T.A., Shakoor. T., Khan, A.M., and Khan, A.L., 1993, Lithofacies and palynostratigraphy of some Cretaceous and Paleocene rocks, Surghar and Salt Range coal fi elds, northern Pakistan: U.S. Geological Survey Bulletin 2096, 35 p.
Warwick, P.D., and Shakoor. T., 1993, Lithofacies and depositional environments of the coal-bearing Paleocene Patala Formation, Salt Range coal fi eld, northern Pakistan: Geological Survey of Pakistan, Project Report (IR)PK-109.5, 52 p.
Zaigham N.A., and Mallick, K.A., 2000, Prospect of hydrocarbon associated with fossil-rift structures of the southern Indus Basin, Pakistan: American Association of Petroleum Geologists Bulletin, v. 84, no. 11, p. 1833–1848.
Manuscript approved for publication January 9, 2004Published in the Central Region, Denver, ColoradoEditing, page layout, photocomposition, Richard W. Scott, Jr.Section 508 compliance, David G. WaltersWebmaster. Tracy A. PintoGraphics by the authors
20 Petroleum Systems and Related Geologic Studies in Region 8, South Asia