BULLETI FEDERAL RESERVNE Reserve Bulletin/Federal Reserve Bulletin...maintained their profit margins...
137
VOLUME 74 • NUMBER 9 • SEPTEMBER 1988 FEDERAL RESERVE BULLETIN BOARD OF GOVERNORS OF THE FEDERAL RESERVE SYSTEM, WASHINGTON, D.C. PUBLICATIONS COMMITTEE Joseph R. Coyne, Chairman • Michael Bradfield • S. David Frost • Griffith L. Garwood • Donald L. Kohn • Michael J. Prell • Edwin M. Truman The FEDERAL RESERVE BULLETIN is issued monthly under the direction of the staff publications committee. This committee is responsible for opinions expressed except in official statements and signed articles. It is assisted by the Economic Editing Section headed by Mendelle T. Berenson, the Graphic Communications Section under the direction of Peter G. Thomas, and Publications Services supervised by Linda C. Kyles.
Transcript of BULLETI FEDERAL RESERVNE Reserve Bulletin/Federal Reserve Bulletin...maintained their profit margins...

VOLUME 74 • NUMBER 9 • SEPTEMBER 1988
FEDERAL RESERVE
BULLETIN
BOARD OF GOVERNORS OF THE FEDERAL RESERVE SYSTEM, WASHINGTON, D.C.
PUBLICATIONS COMMITTEE
Joseph R. Coyne, Chairman • Michael Bradfield • S. David Frost• Griffith L. Garwood • Donald L. Kohn • Michael J. Prell • Edwin M. Truman
The FEDERAL RESERVE BULLETIN is issued monthly under the direction of the staff publications committee. This committee is responsible foropinions expressed except in official statements and signed articles. It is assisted by the Economic Editing Section headed by Mendelle T.Berenson, the Graphic Communications Section under the direction of Peter G. Thomas, and Publications Services supervised by Linda C. Kyles.

Table of Contents
591 PERSONAL BANKRUPTCIES
This article describes the evolution of bank-ruptcy law, discusses the causes and effectsof personal bankruptcy, and examines thehistorical trends in bankruptcy filings, par-ticularly since 1984, which marked the be-ginning of a countercyclical upswing in thenumber of bankruptcy filings.
604 INDUSTRIAL PRODUCTION
Industrial production increased an esti-mated 0.4 percent in June.
607 STATEMENT TO CONGRESS
Alan Greenspan, Chairman, Board of Gov-ernors, reviews the recent and prospectivemonetary policy and the economic outlook,including our nation's longer-term eco-nomic objectives, the overall strategy forfiscal and monetary policies needed toreach those objectives, and the appropriatetactics for implementing monetary policywithin that strategic framework, before theSenate Committee on Banking, Housing,and Urban Affairs, July 13, 1988.
614 ANNOUNCEMENTS
Appointment of John P. La Ware as a mem-ber of the Board of Governors.
Publication of a new handbook for the Reg-ulatory Service.
Two studies on managing risk in the pay-ments system now available.
Update to staff guidelines under RegulationAA.
Revised List of OTC Stocks Subject toMargin Regulations now available.
Extension of comment period on same-daypayment of checks.
Informal hearing held on proposed rule toimplement the limitations placed on grand-fathered nonbank banks by the CompetitiveEquality Banking Act of 1987.
Change in Board staff.
617 LEGAL DEVELOPMENTS
Various bank holding company, bank ser-vice corporation, and bank merger orders;and pending cases.
630 MEMBERSHIP OF THE BOARD OFGOVERNORS OF THE FEDERALRESERVE SYSTEM, 1913-88.
List of appointive and ex officio members.
AI FINANCIAL AND BUSINESS STATISTICSThese tables reflect data available as ofJuly 28, 1988.
A3 Domestic Financial StatisticsA4 Domestic Nonfinancial StatisticsA5 International Statistics
A69 GUIDE TO TABULAR PRESENTATION,STATISTICAL RELEASES, AND SPECIALTABLES
A86 BOARD OF GOVERNORS AND STAFF
A88 FEDERAL OPEN MARKET COMMITTEEAND STAFF; ADVISORY COUNCILS
A90 FEDERAL RESERVE BOARDPUBLICATIONS
A93 INDEX TO STATISTICAL TABLES
A95 FEDERAL RESERVE BANKS,BRANCHES, AND OFFICES
A96 MAP OF FEDERAL RESERVE SYSTEM
Personal Bankruptcies
Charles A. Luckett of the Board's Division ofResearch and Statistics prepared this article withthe assistance of Nellie D. Middleton and WayneC. Cook. Footnotes appear at the end of thearticle.
Declarations of bankruptcy by nonbusiness peti-tioners have risen sharply over the past 3'/2years, even as employment and aggregate per-sonal income registered solid growth. This ratherunusual countercyclical upswing in nonbusinessbankruptcies (hereafter called "personal" bank-ruptcies) has generated considerable puzzlementand some concern.
The consumption-related debt of the house-hold sector also has grown substantially duringthe current economic advance, both absolutelyand relative to disposable income, a trend that islikely a key factor underlying the rise inbankruptcies.1 In addition, revisions to bank-ruptcy laws and changes in consumer attitudestoward bankruptcy may have fostered a climatein which people regard bankruptcy as a moreplausible remedy for financial problems than theyonce did. Despite the rising number of bankrupt-cies, however, credit suppliers apparently havemaintained their profit margins relatively well.So far, the surge in bankruptcies does not seemto have motivated any measurable restriction onthe supply of credit to consumers.
This article will describe the historical trendsof bankruptcy filings and the evolution of bank-ruptcy law, examine the causes and effects ofpersonal bankruptcy, briefly review relevantstudies, and then close with a detailed scrutiny ofthe trend in bankruptcies since 1984.
HISTORICAL I'KISDS IS H.WKRUFK.r
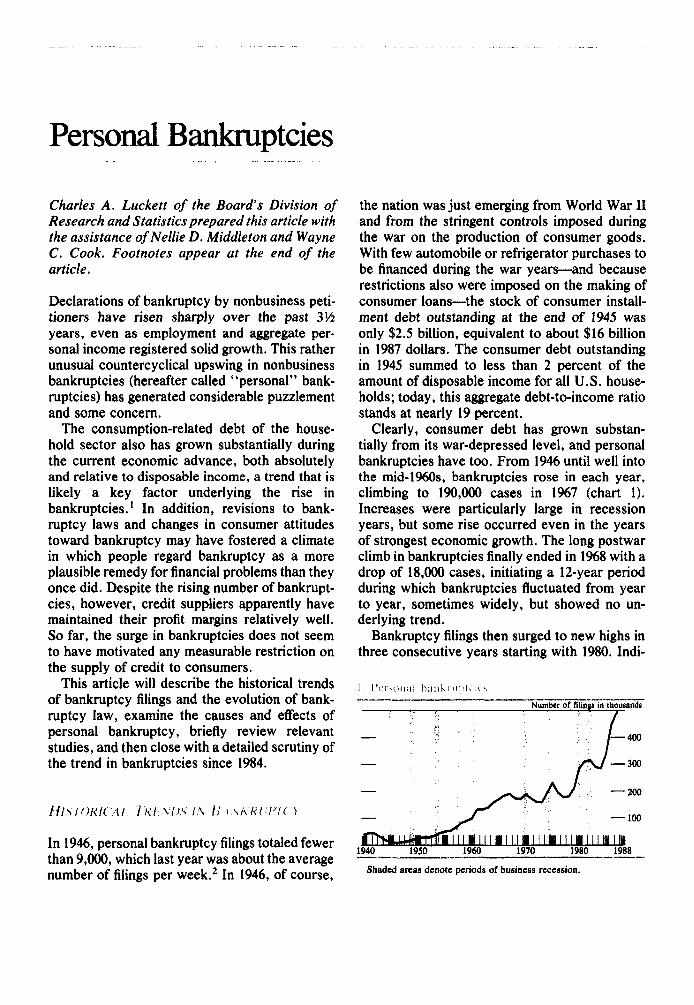
In 1946, personal bankruptcy filings totaled fewerthan 9,000, which last year was about the averagenumber of filings per week.2 In 1946, of course,
the nation was just emerging from World War IIand from the stringent controls imposed duringthe war on the production of consumer goods.With few automobile or refrigerator purchases tobe financed during the war years—and becauserestrictions also were imposed on the making ofconsumer loans—the stock of consumer install-ment debt outstanding at the end of 1945 wasonly $2.5 billion, equivalent to about $16 billionin 1987 dollars. The consumer debt outstandingin 1945 summed to less than 2 percent of theamount of disposable income for all U.S. house-holds; today, this aggregate debt-to-income ratiostands at nearly 19 percent.
Clearly, consumer debt has grown substan-tially from its war-depressed level, and personalbankruptcies have too. From 1946 until well intothe mid-1960s, bankruptcies rose in each year,climbing to 190,000 cases in 1967 (chart 1).Increases were particularly large in recessionyears, but some rise occurred even in the yearsof strongest economic growth. The long postwarclimb in bankruptcies finally ended in 1968 with adrop of 18,000 cases, initiating a 12-year periodduring which bankruptcies fluctuated from yearto year, sometimes widely, but showed no un-derlying trend.
Bankruptcy filings then surged to new highs inthree consecutive years starting with 1980. Indi-
I . Personal bnnknij)loc\
Number of filings in thousands
1940 1950 1960 1988
Shaded areas denote periods of business recession.
592 Federal Reserve Bulletin • September 1988
viduals had amassed substantial debts during thehigh-inflation years of the late 1970s, and theeconomy endured back-to-back recessions dur-ing the early 1980s that carried the unemploy-ment rate from less than 6 percent to more than10 percent. Moreover, a major revision to federalbankruptcy law took effect in the fall of 1979.This revision made bankruptcy a more attractiveoption to troubled debtors, particularly becauseit increased the amount of assets that could beexempt from liquidation. Whatever the effect ofthese various factors, bankruptcies jumped fromabout 200,000 cases in 1979 to nearly 315,000 in1982. This figure was even understated some-what in comparison with previous years becausehusband-and-wife bankruptcies were treated astwo cases under the old law and as one case afterthe revisions became effective.
As economic activity regained momentum in1983 and 1984, bankruptcies declined once more,as they had during three previous cyclical up-swings. But historical patterns went awry in 1985and 1986 when bankruptcies shot up more than20 percent in each year despite the strength of theeconomy. The uptrend in bankruptcies slowed toa 10 percent rate in 1987, but the number of casesfiled totaled nearly 500,000, substantially abovethe 1982 cyclical high. Sizable additions to con-sumer debt during the period no doubt contrib-uted to the surge in bankruptcies; still, the latestrise in bankruptcies, because it occurred during abusiness expansion, seems larger than the eco-nomic fundamentals would suggest. On thewhole, the 1985-87 surge in bankruptcies is apuzzling development, one that will be addressedfurther in later sections.
iiVOI.UIION ()'. llANKIiUPTCY I .AW
The purpose and characteristics of bankruptcyprocedures in the United States are considerablydifferent from their antecedents in Roman law.For most of history, bankruptcy was a procedureimposed by creditors to confiscate and distributethe assets of a delinquent debtor. In more recenttimes, U.S. bankruptcy law has been restruc-tured to achieve more of a balancing of theinterests of creditors and debtors and to providedebtors with a fresh start.
The word "bankruptcy" has its roots in theLatin words for "bench" and "break"; its literalmeaning is "broken bench." Under Roman law,creditors, after gathering together and dividingup the assets of a delinquent debtor, wouldphysically break the debtor's workbench as apunishment and perhaps as a warning to otherindebted tradesmen. Bankrupts were regarded asperpetrators of fraud who deserved severe pen-alty; the Romans deprived bankrupts of theircivil rights, and many other societies stigmatizedthem by requiring that they dress in a particularidentifying garb.
Early law, then, sought merely to establish anorderly means of satisfying the claims of credi-tors; neither discharge of debt nor rehabilitationof debtors constituted an element of the bank-ruptcy process as it evolved in Western societiesthrough the centuries. Not until 1705 did Englishlaw provide for remission of the debts of bank-rupts, and even then not as a humane gesture togive the bankrupt a new start, but as a practicalmeans to counter the concealment of assets bydebtors. By assuring bankrupts that their credi-tors would forswear future collection efforts if allcurrently owned assets were surrendered, thelaw created an incentive for debtors to comply.
The first bankruptcy law in the United Stateswas passed in 1800, but was repealed three yearslater. Reflecting its heritage from English law,the statute applied only to tradesmen, mer-chants, and others in business (virtually no "con-sumer" credit existed); it made no provision forvoluntary bankruptcy, discharge of debts, ex-emption of any assets, or payment of debts out offuture income. Equally short-lived bankruptcylaws were passed in 1842 and 1867 in response tofinancial panics.
After another major financial crisis in the1890s, the Congress adopted the Bankruptcy Actof 1898, which survived, with amendments, untilenactment of a new statute in 1978. The 1898 actrepresented a significant liberalization of bank-ruptcy practice. It brought consumer as well ascommercial debtors under its wing, and ex-panded bankruptcy from a remedy that wasimposed by creditors to one that could be volun-tarily sought by debtors. It provided for thedischarge of debts that were not satisfied byliquidation of the debtor's assets, and also autho-
Personal Bankruptcies 593
rized state legislatures to establish categories ofassets that would be exempt from the claims ofcreditors. Thus, at the close of the 19th century,a body of law originally designed to serve credi-tors took on a significant aspect of debtor pro-tection.
The most important of several amendments tothe Bankruptcy Act was the Chandler Act in1938, which established a procedure for insolventdebtors to retain their assets and to repay allor part of their obligations over a three-yearperiod with court protection from their credi-tors. Available to employed persons with aregular income, these court-administered repay-ment schedules were known as "wage-earnerplans."
Following extensive study and congressionalhearings on the functioning of the bankruptcyprocess, a revised bankruptcy code, enacted in1978 (the Bankruptcy Reform Act of 1978), tookeffect on October 1, 1979. The code consolidatedsome chapters of previous law pertaining tobusiness reorganizations and sought to stream-line the administration of the bankruptcy courts,but its most sweeping changes involved personalbankruptcy. It erected greater protection againstrepossession of collateral for consumer loans andmade it more difficult for creditors to elicit anindividual's reaffirmation of a discharged debtafter bankruptcy. Most important, the code in-troduced federal asset exemptions ($7,500 ofequity in a home and approximately $3,000 inother designated assets) that were considerablymore generous than were most state exemptions.It also permitted each individual of a marriedcouple to claim such exemptions, thus doublingthe amount of exemptions available to marriedpersons.3
Provisions for the wage-earner repaymentplans were redrafted to cover some debts thatcould not be discharged under "straight" bank-ruptcy, such as student loans, government finesand penalties, and loans obtained through falsefinancial statements. The new code also removeda provision of the old law that creditors mustapprove any plan for repayment, and gave thecourt sole discretion to accept a plan offered by apetitioner. A plan was to be confirmed if thecourt found that it had been proposed in goodfaith, that the amount to be paid the creditors
THE U.S. BANKRUPTCY CODE
In its current form, the U.S. bankruptcy codecontains five "operative" chapters (7, 9, 11, 12,and 13) under which bankruptcy petitions may befiled. Chapter 9 applies exclusively to municipal-ities and chapter 11 primarily to business reorga-nizations. Individuals most commonly file underchapters 7 or 13. Chapter 7 provides for"straight" bankruptcy—that is, liquidation of as-sets and discharge of debts—and may be usedeither by business or nonbusiness petitioners. Itaccounts for about 70 percent of all bankruptcies,and typically, 85 percent of chapter 7 cases areclassified as nonbusiness. Chapter 13 provides forthe "wage-earner plans" that involve the full orpartial repayment of debts while assets areshielded from creditor action. It is limited toindividuals, but insofar as an individual may be asole proprietor with mostly business-relateddebts, chapter 13 also embraces both business andnonbusiness cases. About 95 percent of Chapter13 cases involve nonbusiness petitioners. Chapter12, added to the statute in 1986, is the newestoperative section of the bankruptcy code. Itmakes available to "family farmers" (as definedin the code) the equivalent of a chapter 13 repay-ment program. Chapter 12 cases are classifed asbusiness bankruptcies.
was not less than what would have been paid tothem through liquidation, and that the debtorwould be able to make the payments contem-plated by the plan.
As noted, filings for personal bankruptcy shotup in 1980 and 1981. This surge in filings openeda debate on whether the 1978 reforms had gonetoo far, and led eventually to some retooling ofthe bankruptcy code in 1984. Courts were re-quired, for instance, to prohibit discharge ofdebts that financed eve-of-bankruptcy spendingsprees. Section 707(b) of the code embodied apotentially major change, which provided thatthe court could dismiss a discharge petition of anindividual debtor if it found that the granting ofrelief would constitute "a substantial abuse."The law did not establish specific standards forsuch a finding, however, and in practice thesubstantial-abuse test has not been vigorouslyapplied.

594 Federal Reserve Bulletin • September 1988
w •• n
Reasons for the long postwar uptrend in bank-ruptcies and the more recent large jumps are-generally interpreted from one of two perspec-tives. Some researchers have emphasized amacroeconomic approach that relates the totalnumber of bankruptcy filings in a period tomovements in such broad economic factors asthe rate of unemployment and the degree ofindebtedness. Others have adopted the micro-economic approach of examining individual casehistories to identify economic and demographicattributes that appear to characterize bankruptindividuals.
M<>\
Study of the broad economic forces affectingbankruptcies was relatively neglected until the1980s, when the revisions to the federal bank-ruptcy code and the explosion in the number offilings stimulated several efforts to determinehow much of the rise was attributable to the newlaw. Earlier studies had simply observed, ordemonstrated with a rudimentary statisticalmodel, that the postwar uptrend in bankruptciesrather closely paralleled the expansion of con-sumer debt. One study, for instance, using an-nual data for 1946-70, calculated a high statisti-cal correlation between the number ofbankruptcies per capita and the ratio of con-sumer installment debt to disposable personalincome.4 Such a result is not especially surpris-ing, in that being in debt is a necessary conditionfor bankruptcy. But, without a more rigorouslyspecified model, there is no way to determinewhether other factors might serve either to miti-gate or to intensify the effect of aggregate indebt-edness on total bankruptcies, or whether thesensitivity of bankruptcies to changes in indebt-edness might vary with different absolute levelsof debt burden.
Another study, which examined reasons fordifferences in bankruptcy rates among states,attributed most of the interstate variation todifferences in wage garnishment laws, and rela-tively little to different levels of debt-to-incomeratio and unemployment rate.5 An attempt toassess the effects over time of the economic
variables within each state was largely unsuc-cessful, partly because the number of annualobservations (12) was too few to yield reliableresults.
In the early 1980s researchers needed a work-able model of the macroeconomic forces under-lying national bankruptcy trends to help answerquestions about the effects of the new federalbankruptcy law. The typical approach of theirstudies was to estimate the parameters of abankruptcy model for a period ending just beforethe effective date of the law, to project bankrupt-cies into the subsequent period on the basis ofthe model, and to interpret the differences be-tween actual and projected bankruptcies as theresult of the alteration in the legal environment.(Table 1 presents data on bankruptcy rates andsome variables frequently associated with bank-ruptcy.)
Some of the models to project bankruptcieswere specified in no greater detail than the earliermodels had been. One, for instance, simply ex-trapolated previous bankruptcy trends withoutallowing for movements in economic variables;another projected the normal level of bankrupt-cies during 1980, a year of recession, on the basisof the severity of declines in manufacturing em-ployment in 1980 relative to such declines in pastrecessions.6 These studies found as much asthree-fourths of the actual climb in bankruptciesto be unexplained by the projection method, andtherefore attributable to changes in the law, inthe absence of other obvious explanatory fac-tors.
Other studies placed more emphasis on modeldevelopment by testing the explanatory power ofa wider variety of economic variables. Onestudy, by Richard Peterson and Kiyomi Aoki,built upon earlier work by analyzing differencesamong states in numbers of bankruptcies as afunction of both legal and economic variables.7
Using data for two quarters, one before and oneafter the effective date of the new law, the studyestimated explanatory equations for the two pe-riods separately and in combination. In contrastto the earlier study of differences among states inbankruptcy rates, this one found a considerablystronger and more consistent relationship be-tween employment indicators and bankruptcy,and correspondingly weaker links between gar-
Personal Bankruptcies 595
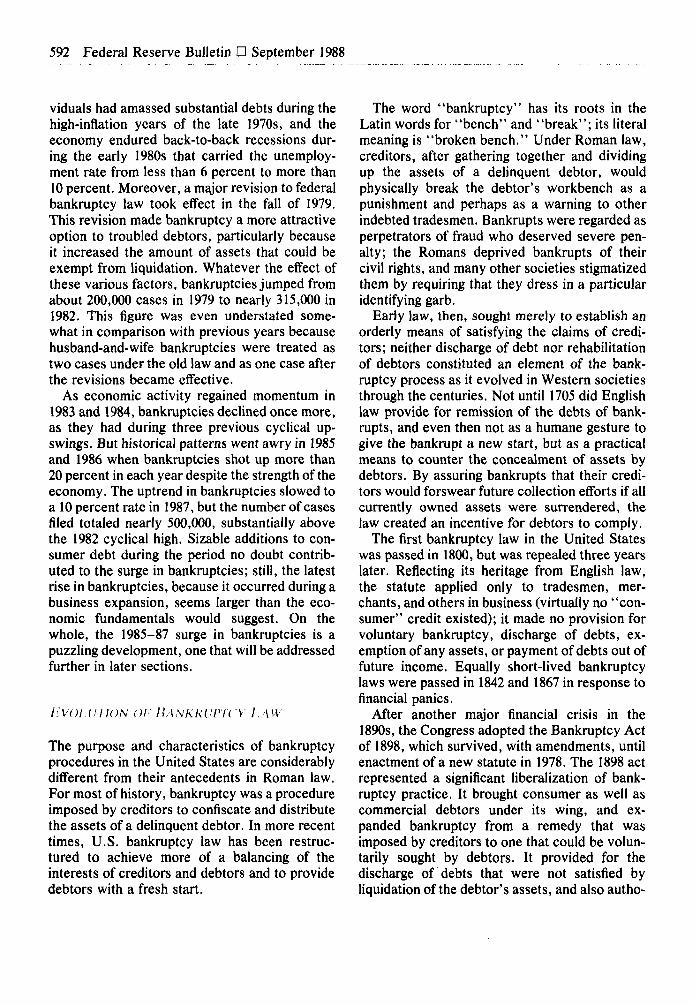
1. Bankruptcy rale*
Year
194J19501955I9601965..197019751980
1981198219831984198519861987
a i l i i v; • i a r
Bankruptcies per1,000 persons
.07
.16
.27;
.54
.88
.92
.07
.25
.35
.35
.24
.20
.438601
i lcu a s p o s s i b l e i . i c l u r s .
Debt-to-income ratio(percent)
Variable
Unemployment rate(percent)
1.77.3
10.712.415.014.514.615.5
14.614.315.216.618.218.619,3
n.a.5.24.45.54.55.08.57.2
7.69.79.67.57.27.06.2
Divorces per 1,000persons
3.52.62.32.22.53.54.85.2
5.35.04.95.05.04.8n.a.
Real household networth, per capita
(thousands of dollars)
n.a.n.a.29.431.936.438.339.445.1
45.243.846.946.948.451.853.6
SOURCES. Administrative Office of the U.S. Courts, U.S. Depart-ment of Commerce, Board of Governors of the Federal Reserve
System, U.S. Department of Labor, and U.S. National Center forHealth Statistics.
nishment laws and bankruptcy.8 Debt burdenwas not examined because data at the state levelwere not available.
Another result of interest from this study wasthat the employment variables (the unemploy-ment rate and average hours worked per week)had a much stronger influence in the post-enact-ment equation than in the pre-enactment equa-tion, a result that may have been associated withthe recession that took place in 1980. The in-crease in the significance of the employmentvariables during a recession suggests that therelationship between employment conditions andbankruptcy may be more complex than verysimple models can describe. The unemploymentrate may not be significant as long as it fluc-uates between, say, 3 and 5 percent, but maybegin to make a difference once it crosses somecritical level. The level of the unemploymentrate also may interact with the change in unem-ployment, so that a high level alone may notnecessarily correspond with bankruptcy rates.Insofar as unemployment was rising sharply in1980 in many areas, the sensitivity of bankrupt-cies to unemployment levels may have beengreater.
The debt-to-income ratio reemerged as an im-portant explanatory variable in a study of annualbankruptcies at the national level conducted byLawrence Shepard.9 Shepard concluded that the
sharp increases in debt accounted for much ofthe steep climb in bankruptcies through the early1960s, and that the subsequent leveling off ofbankruptcies resulted from the slowing uptrendin the debt-to-income ratio and from more rapidgains in household wealth. In fact, he observed,these developments should have caused the num-ber of bankruptcies to fall after the mid-1960s.Shepard attributed the absence of any decline toa vast expansion in the level of public assistance,which he believed was likely to make individualsincreasingly willing to risk the financial setbacksthat could result in bankruptcy.10
Perhaps the most thoroughly structured theo-retical approach to the causes of bankruptcy wasthat of K.J. Kowalewski." Kowalewski devel-oped an intertemporal utility-maximizationmodel that weighed a given consumer's prefer-ences between present and future consumptionagainst a budget constraint imposed by the con-sumer's endowment of present and future in-come (discounted to present value). A consumercould borrow against future income to increasecurrent consumption or could enhance futureconsumption by saving part of present income.Kowalewski introduced such realistic complica-tions as the existence of accumulated savings andnonequal interest rates on savings and borrow-ing. A key complexity examined was that ofuncertainty about future income, which could
596 Federal Reserve Bulletin • September 1988
affect the terms on which lenders would makecredit available: if actual income were to fallshort of the expected level in some future period,a consumer could be unable to meet that period'spayment obligations.
In the empirical estimation of the model,Kowalewski used quarterly data for 1961 through1979, with bankruptcy filings per capita for thenation as a whole as his dependent variable. Asexplanatory variables, he used measures of both"permanent" and "transitory" income, an inter-est rate series, and a variable for "nondiscre-tionary payments" constructed to include expen-ditures on food, utilities, and other necessities,as well as scheduled debt payments. The modelalso included three "portfolio" variables bearingupon the costs and benefits of filing for bank-ruptcy: the stock of consumer durable goods andresidential structures, household liabilities, andhousehold liquid assets, all measured in terms ofconstant dollars per capita. All of the variablesexcept the interest rate series were statisticallysignificant, with expected signs and reasonablecoefficients.12
Inasmuch as the projections of the modelthrough the end of 1981 accounted for a fairlysubstantial portion of the actual numbers ofbankruptcy cases filed, it appeared that observ-able economic factors generated more of thebankruptcy surge than most other researchershad estimated. Kowalewski found that one-thirdof the rise in bankruptcies in the two-year pro-jection period may have been attributable tochanges in the law; estimates of other investiga-tors had ranged from one-half to three-fourths.
Several studies have sought to identify thecauses of bankruptcy by inspecting the demo-graphic and financial characteristics of individualbankrupts, either by examination of actual bank-ruptcy petitions or by personal interview orquestionnaire. The findings of these several stud-ies have been consistent in most respects.
Studies of individual bankrupts in Michiganand Utah in the early 1960s found that most ofthem worked at lower-paying unskilled or semi-skilled manual labor, and that most were em-ployed at the time they filed for bankruptcy.13
These employment characteristics were verifiedby two broader surveys in the 1980s: a study of1,600 bankrupt customers of four finance compa-nies conducted by Brimmer and Company, Inc.,and a study of 1,200 bankrupts from ten differentstates carried out by researchers at PurdueUniversity.14 In both studies, about 80 percent ofthe bankrupts were employed when surveyed,generally in blue collar jobs. The Purdue studyalso observed that about 20 percent of the bank-ruptcies involved two-income families.
Age as well as occupation and income level hasemerged as an important factor in studies ofbankruptcy petitioners. Most studies have foundthat families involved in bankruptcy were rela-tively young and often had more than the averagenumber of children. The Purdue study furtherobserved that persons (of any age) who were notcurrently married and who had children weretwice as common among bankrupts as amongdebtors in general.
Some studies of individual bankrupts haveinquired into the reasons for the bankruptcydeclaration. Results are somewhat difficult tointerpret because some responses, such as "toomuch debt," might reasonably apply in virtuallyevery instance. In a 1971 study of the bankruptcyprocess, David Stanley and Marjorie Girth triedto identify the "underlying" and "immediate"causes of bankruptcy from interviews with 400former bankrupts.15 The most frequently men-tioned underlying cause was poor debt manage-ment, followed closely by family health reasonsand then by job problems, including strikes,layoffs, and loss of overtime. The most commonimmediate causes triggering a bankruptcy werethreats of legal action, poor debt management,actual legal action, and the desire to avoid payingcertain debts. The Brimmer study likewise foundoveruse of credit, employment problems, andmedical expenses among the factors cited mostoften, along with marital problems, which werementioned much more frequently than they werein the Stanley and Girth study.
On balance, then, the various studies of indi-vidual cases agree that bankruptcy (at leastthrough the early 1980s) has been experiencedmainly by lower-income households with princi-pal wage-earners employed as manual, oftenunskilled, workers. Outright unemployment
Personal Bankruptcies 597
seems to have been a less critical determinantthan the researchers had anticipated, althoughjob-related conditions, such as loss of overtime,were frequently a factor. Marital problems, largemedical bills, and other personal trauma contrib-uted to many of the decisions to file for bank-ruptcy, t
iy.'lS ()!•'
The disruption that serious financial stress bringsto individual lives is perhaps the major conse-quence of bankruptcy. It is an important concernfor sociologists and legislators alike, but one thatlies outside the predominantly macroeconomiccontext of this article. This article views theeffects of bankruptcy as they pertain to thefunctioning of the consumer credit markets, ormore broadly, to the major economic aggregates.These two spheres are not entirely separate; anissue such as the impact of personal bankruptcieson lender profit margins, for example, has impli-cations for total consumer spending through itsrole in shaping the aggregate supply function ofconsumer credit.
Effects on Credit Supply
A clear consensus on the effects of personalbankruptcy is that, in the long run, the lossesfrom discharged debts are transmitted to all otherborrowers in the form of more expensive creditor reduced availablity of credit. Researchersusually assert this conclusion on the basis ofwell-known economic principles, but say littleabout the process by which the market arrives atthe ultimate outcome. Two important aspects ofthat process involve the magnitude of the effectsof bankruptcy on profits and the real-world com-plexities faced by creditors having to assess howbankruptcies are affecting profits and to respondin an effective way.
Several studies have attempted to estimate thetotal amount of debts discharged in a year as ameasure of the cost of bankruptcy to the creditindustry and, ultimately, to the economy. Thestudies by Brimmer and Company and by thegroup at Purdue estimated bankruptcy chargeoffsin 1980 and 1981 to be about $3'/4 billion to $4>/4
billion. The Federal Reserve figure for consumercredit outstanding at the end of 1980 was $350billion; estimated losses from bankruptcy thusamounted to about 1 percent of credit outstand-ing, a figure arguably large enough to influencethe behavior of lenders that typically earn be-tween 2 and 3 percent net on their consumerreceivables.
In assessing the implications of such a lossrate, some caveats are in order. One is that asubstantial portion of the debts discharged inbankruptcy are owed to hospitals and otherclaimants that are not part of the consumer creditstatistics; thus the estimated 1 percent rate ofloss no doubt overstates actual rates of bank-ruptcy loss.16 Moreover, since creditors are con-cerned with their overall loan-loss experience,whether or not a particular bad debt was owed bya bankruptcy petitioner may not matter to thecreditor if the debt would have been charged offanyway. Only when bankruptcy results in acreditor writing off a debt that would otherwisehave been paid is the loss attributable in ameaningful way to "bankruptcy." But accordingto findings of the Purdue studies, only about aquarter of the debts owed by bankrupts at thetime of filing would have been recoverable in theabsence of the bankruptcy. That is, only $1billion of the total loss of $4 billion was truly aresult of bankruptcy.
Some data available from trade sources mayhelp to illuminate the issue of how large an effectbankruptcy declarations have on the credit lossesof lenders. The American Bankers Association(ABA) publishes annual statistics covering netloss rates on consumer lending at commercialbanks and also the proportion of losses associ-ated with bankruptcy (table 2), a part of which,as suggested above, would likely be written off inany event.17
According to the ABA data for 1978 to 1986,banks charge off about 0.5 percent of theirclosed-end installment loans in a year, give ortake 0.1 percent; the highest loss rate, in therecession year 1980, was 0.63 percent. The pro-portion of losses identified with bankruptcy dur-ing the period ranged from 15 to 24 percent.Together, these statistics suggest that bank-ruptcy losses amounted to about 0.1 to 0.2 per-cent of credit outstanding. Even during the re-

598 Federal Reserve Bulletin • September 1988
Year
19781979198019811982
1983 . . . .198419851986
19781979198019811982. . . .
1983198419851986. . . .
; ! . - • • - . : • . ' • • ;
Losses net ofrecoveries as a
percent ofcredit
outstanding
Percent oflosses due tobankruptcy1
Losses due tobankruptcy asa percent of
creditoutstanding2
Closed-end installment loans
.38
.44
.63
.50
.40
.36
.28
.39
.47
.34
.87'.29.96.67
.34
.27
.35
.40
15.116.419.923.123.6
21.821.923.022.7
Jank-card credit
n.a.n.a.n.a.n.a.n.a.
25.625.237.932.7
.06
.07
.13
.12
.09
.08
.06
.09
.11
n.a.n.a.n.a.n.a.n.a.
.34
.32
.51
.46
1. The ABA reports data for five asset-size categories of banks, butno overall average figure for all banks. For this table, the average forall banks was calculated by weighting the ABA's figure for each sizegroup by the proportion of total consumer installment credit (or totalbank-card credit, as appropriate) held by the given group.
2. Calculated for this table by multiplying column I by column 2.n.a. Not available.SOURCE. American Bankers Association, Retail Bank Credit Re-
port, issues for 1981 through 1987.
cent surge in bankruptcies, losses at commercialbanks due to personal bankruptcy rose only 0.05percentage point—from 0.06 in 1984 to 0.11 per-cent in 1986 (latest data available). While thatperformance represents an increase of 80 per-cent, even steeper than the rise in the number ofbankruptcies nationally, the incremental loss rate
has an almost negligible impact on profitability.Similar statistics for bank credit cards revealhigher loss ratios than for closed-end lending,and somewhat higher proportions attributable tobankruptcies, but they still show rather smallvariations from year to year in the proportion ofoutstandings written off in bankruptcy cases(table 2).
Table 3 presents net earnings and credit lossstatistics on installment loans and bank-cardcredit from another source, the Federal Re-serve's Functional Cost Analysis (FCA).18 Thecredit loss ratios in the FCA are somewhat higherthan the ABA estimates, but are still reasonablyclose and show the same patterns year to year.The loss ratios are clearly high enough relative toearnings so that substantial changes in loss expe-rience could significantly affect a firm's bottomline.
During the years examined, however, lossrates just as clearly have not been the primedeterminant of variation in net earnings onclosed-end installment loans. Net earnings havefluctuated considerably more than have creditlosses for this type of lending. The largest move-ment in loan losses was the increase of 0.28percentage point in 1980, which, other thingsequal, should have reduced net earnings by thatamount. However, net earnings actually declined0.86 percentage point, or three times as much.Similarly, big increases in profitability occurredin 1982 and 1983, but in tandem with only mod-erate dips in loss rates. Then in 1984, profitabilityeased off despite the positive influence of anothersmall decline in chargeoffs. Loss rates have beenhigher on credit cards than on closed-end loans,and a substantial rise in credit-card losses appar-
• . ' ! ] M i ! l ' . i ! U ! .
; ! • • ! - i r , i , V ' . i l i
Type of credit1979
• . ! ( ! o n l . t ; ' • ( < ! : n ! • a i U t n ; - .
1980 1981 1982 1983 1984 1985 1986
Installment creditNet earningsCredit losses
Bank-card creditNet earningsCredit losses
2.20.55
1.801.75
1.34.83
-1.782.35
1.63.66
1.332.15
2.83.55
2.891.72
3.20.42
2.461.21
2.85.38
3.741.09
SOURCE. Federal Reserve Bank of New York, Functional Cost Analysis, annual issues.
2.74.39
3.991.68
2.62.61
3.282.23
Personal Bankruptcies 599
ently accounted for most of a drop in profitabilityin 1986. On the whole, however, for this type oflending also, changes in net earnings do notappear closely related to the pattern of creditlosses.
In trying to make the leap from statisticalevidence about how bankruptcies affect profits tothe long-run adjustments in rates and creditterms that are indicated by theory, considerationof the circumstances in which lenders have tomake their pricing and marketing decisions maybe helpful. A surge in bankruptcies would tend toreduce profits by causing larger writeoffs—but,as just discussed, the size of any drop in profitswould be rather small, making a creditor's re-sponse more problematic. For instance, a lenderfirst would have to decide whether an observeddecline in net earnings from, say, 1.65 percent to1.55 percent, was a development to which aspecific response was needed, and would thenhave to determine whether the worsened perfor-mance was attributable to bankruptcies ratherthan to some other factor.
If bankruptcy were in fact isolated as a causeof the increased writeoffs, the creditor wouldhave to choose among several possible re-sponses: raise interest rate quotations across theboard, set higher minimum standards to qualifyfor loans, increase collateral requirements, orperhaps try to identify potential bankrupts moreprecisely so they can be weeded out. The lastresponse would entail direct costs of its own, andthe other alternatives could have undesirablecompetitive consequences. For instance, unlessother credit suppliers also opted to nudgetheir interest rates up, a price-raising creditormight find itself losing its most creditworthyapplicants.
Another factor that may deter lenders fromresponding quickly to an increase in bankrupt-cies is that other developments in the economycan overshadow the specific effect of bankruptcytrends. For example, if money costs are falling,as they were during the mid-1980s, bottom-lineresults may be improving even if bankruptcylosses are rising. If so, a lender may deliberatelychoose to lower credit standards and tolerate ahigher loss rate because of the enhanced profit-ability of "good" loans.
/.;//< r . ' v •>n flu' IJ <>notnx
The foregoing discussion of the effects of bank-ruptcy on profitability has implications for issuesthat extend beyond the operation of a creditdepartment. Economic policymakers and regula-tors of financial institutions, for instance, mightbe concerned with the possible effects of bank-ruptcy on economic activity and on the sound-ness of lending institutions. On both counts theevidence suggests that such effects are small.With losses due to bankruptcy apparently ac-counting for between 0.1 and 0.5 percent ofvarious types of consumer receivables at banks,and with consumer lending constituting less thana fifth of total bank lending, even sharp increasesin personal bankruptcy seem unlikely to endan-ger the financial health of these institutions toany significant extent. Overall economic activitymight be constrained if financially strapped indi-viduals decided to repair their balance sheets bycutting back on their spending, or if creditorsresponded to rising bankruptcy losses by tight-ening their loan approval standards, thereby pre-venting some credit seekers from makingintended expenditures. But, as the earlierdiscussion has indicated, creditors may well havelittle incentive to change lending standards inview of the relatively small impact of bankrupt-cies on earnings and the uncertain outcome of ashift in strategy.
In practice, the principal macroeconomic useof bankruptcy statistics has been in qualitativeassessments of the financial state of the house-hold sector, in which bankruptcies serve as oneof many barometers of the primary, but harder-to-measure, concept of financial stress. Gener-ally speaking, such variables as bankruptcies andloan delinquency rates have not been very widelyor very successfully used in econometric analy-ses of consumer behavior. They are typicallyviewed as providing supplementary rather thanfundamental clues as to the prospective strengthof consumer demand. Nevertheless, the sharprise in bankruptcies since 1984 has stimulatedwider interest in the causes and consequences ofbankruptcy. The next section provides a detailedexamination of the forces that may underlie thisrecent trend.

600 Federal Reserve Bulletin D September 1988
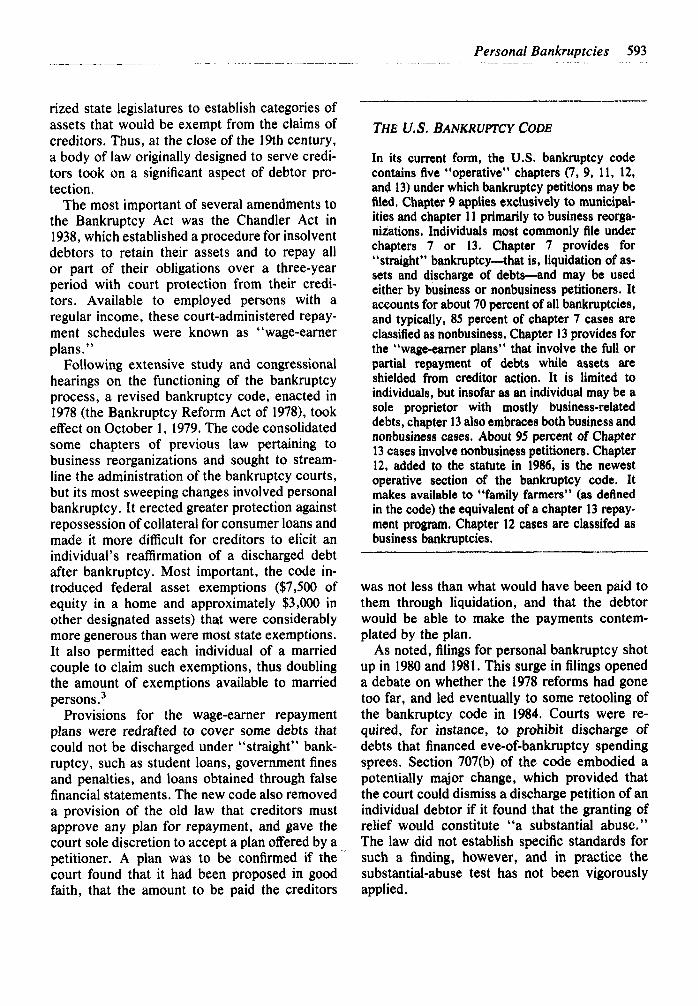
' . ) } ; i i i l . i l i i i i v ' l i 1 - . . i i i i ! I l l ' " u u n j i ' i i o i i v i l M i n i r i J i ' b l
Number per 1,000 persons
I I I I I i I
' B a n k r u p t c i e s
I 1 I I I I
2.0
1.5
1.0
I I i1965 1970 1975 1980 1985 1988
i'l'Ci'Ni TKi'NDS: A I'lili'l'tll-n LiH/k
What is particularly noteworthy about the surgein bankruptcies since 1984 is that it has occurredduring an extended economic upswing. The ratesof increase in bankruptcy for 1985 and 1986 wereunmatched in any other year since 1950 that wasnot a recession year. Many observers have notedthe unevenness of the current expansion, how-ever, citing persistently distressed conditions inthe "oil patch" states and, until very recently,the centers of heavy manufacturing in the Mid-west. Such regions could be generating a highvolume of personal bankruptcies despite the na-tion's general prosperity.
In fact, the number of bankruptcies has risenmost rapidly in the major oil-producing states.On the other hand, subtracting these states fromthe total still leaves a very rapid rate of increasenationally. Between the second quarters of 1985and 1986, for instance, bankruptcies increased 36percent nationally, while soaring 62 percent infive oil patch states (table 4). Yet, when thesefive states were excluded from the calculations,the growth in bankruptcies still topped 30 percentbetween the two quarters. In fact, nearly three-
fourths of all states experienced increases inbankruptcy of more than 25 percent over thatperiod. Thus the recent surge does not appearattributable in any significant way to specialproblems in specific regions.
Several of the quantitative studies discussedhere cited rapid growth in consumer debt as akey factor underlying rapid growth in bankrupt-cies. Such results, however, were dominated bythe sharp upward movements in both debt andbankruptcy for nearly two decades after WorldWar II; movements in debt (relative to income)and bankruptcies (per capita) were less closelycorrelated after the mid-1960s (chart 2). Both thedebt-burden measure and bankruptcies per cap-ita fluctuated around flat trendlines during the1970s, with little uniformity in the size or timingof movements in the two series. Such diver-gences might indicate an inherently weak rela-tionship between debt and bankruptcy. Or theymight mean only that the relationship is inoper-ative below certain key levels or rates of increasein the burden of debt on income. The linkagebetween aggregate debt and bankruptcy couldstill be strong beyond some threshhold level ofdebt burden, even though it is likely to be ob-
Bnnki upk 'k 's III Ihi' United Stales ami m maior oil producing status
Item
U.S. totalFive "oil patch" states'Total, less oil patch states. . . .
1985:2
84,2438,428
75,815
Number of cases
1986:2
114,38413,682
100,702
1987:2
122,68916,399
106,290
Percent change
1985:2-1986:2 1986:2-1987:2
35.8 7.362.3 19.932.8 5.5
1. Oklahoma. Texas, Louisiana, Colorado, and Wyoming.SOURCE. Administrative Office of the U.S. Courts.

Personal Bankruptcies 601
scured by statistical tests covering periods whengrowth in debt has been subdued.
But, as pointed out, the aggregate debt-to-income ratio broke out of its meandering patternand climbed quite sharply between 1984 and1988. It rose from the level of around 14 percentthat had held during most of the previous decade,to a record 19 percent by mid-1987. Thus, onceagain, during the current business expansion, arapid rise in bankruptcies and a strong upsurge indebt burden have occurred together. This corre-spondence in itself hardly proves that a closecausal connection exists, but, with unemploy-ment trending downward and household wealthand incomes growing substantially during theperiod, the growth of debt appears to be the onemajor macroeconomic force that moved in adirection consistent with increases in bankrupt-cies.
Aggregate figures on debt can mask importantdistributional features that may affect bank-ruptcy rates. Findings from two major surveys ofconsumer finances shed some light on thisissue.19 One fact these findings point up is thatdebt is concentrated among people with theincome and assets to cover it. Nevertheless,between the two survey years of 1983 and 1986,a large increase occurred in the proportion ofdebt that was held by people with high ratios ofdebt to income (40 percent or higher). Theheavily indebted category held 7 percent of thedebt covered in 1983's survey, but those whowere in that category in 1986 held 16 percent, achange that suggests that the pool of potentialbankrupts may have been considerably larger inthe latter year. Only about half of the high-debtrespondents in 1986 had asset holdings (includinghome equity) large enough to fully retire theirdebts—considerably less than the 80 percent ofall debtors whose assets provided full coverageof debts in 1983.
Changing attitudes toward bankruptcy may beanother factor that helps to account for theaccelerated pace of bankruptcy filings. This hy-pothesis is not readily testable, however. Attitu-dinal changes are difficult to measure, and be-cause they generally occur gradually, areunlikely to cause sudden shifts in behavior, suchas characterized the course of bankruptcy filingsin 1985-86. On the other hand, a gradual redirec-
tion over the years in attitudes toward bank-ruptcy could have laid the groundwork for amore pronounced response to some other trigger-ing variable, such as debt burden, whenever thatvariable happened to move in a particular way.
The evidence for changing attitudes towardbankruptcy is largely circumstantial. However,several societal developments have seemed todiminish the stigma that once attached to bank-ruptcy. The simple fact that consumer credit ismore widely used today has made bankruptcyless rare, and therefore has rendered the bank-rupt individual a less conspicuous figure. Cer-tainly, too, the many revisions in the laws andregulations concerning debtor rights, from theTruth-in-Lending Act, to restrictions on collec-tion tactics of creditors, to the Bankruptcy Re-form Act of 1978 itself, have fostered the notionthat bankruptcy is not necessarily a shamefulprocess resulting from personal failings, but of-ten a perfectly respectable means of handling asituation for which the debtor may be largelyblameless. By the same token, the laws them-selves may be a reflection of changed attitudes.
Advertising by lawyers—which was made le-gally permissible in 1977—also has been cited bysome commentators as a possible stimulant tobankruptcies. Measurement problems also makethis notion difficult to test empirically, but Peter-son and Aoki attempted to do so by constructinga variable based on a count of the number ofnewspaper ads by bankruptcy attorneys in vari-ous localities. In the two quarters they studied,the variable did not help to explain differences inbankruptcy rates among states; nonetheless, theproposition seems reasonable that such advertis-ing helps create a climate in which the declara-tion of bankruptcy is more readily seen as alegitimate response to financial distress.
Other social factors could be contributing atleast in a small way to the rise in bankruptcies.Some surveys of individual bankrupts have sug-gested that marital problems often play a role inbankruptcy decisions, and the divorce rate—aconcrete, though perhaps imperfect, measure ofsuch problems—rose steadily in the 1960s and1970s. Inclusion of the national divorce rate byShepard in his model of bankruptcy did notenhance the model's explanatory power, but twoother studies have found differences in divorce

602 Federal Reserve Bulletin • September 1988
rates among states to help account for interstatedifferences in the number of bankruptcies percapita.20 In any case, stability in the overalldivorce rate since 1980 seems to belie any notionthat a sudden worsening of marital relationsmight account for the bankruptcy activity inrecent years.
Paradoxically, the trend toward two-earnerfamilies might provide some marginal boost tothe likelihood of bankruptcy. If people base thelevels of their spending and borrowing on thetotal amount of their dual incomes, interruptionof either income stream could jeopardize a fami-ly's financial stability. On the other hand, it couldbe argued, multiple sources of income reduce therisk that any single employment problem willdevastate a family's financial position. A lotwould depend therefore on whether a familytreated a second income as a buffer or used it tosupport proportionally higher levels of spendingand debt.
In sum, the rise in bankruptcies since 1984seems most readily attributable to the large ex-pansion of consumer debt, which has boosted the
aggregate indebtedness of households from 14 to19 cents per dollar of disposable income. Alessening of the stigma of bankruptcy and theevolution of a legal structure favorable to bank-rupts have helped establish a setting in whichbankruptcy may be more readily embraced byfinancially strapped households.
Whether the resort to bankruptcy has becomefrequent enough to provoke a curtailment oflending seems doubtful considering the still smallimpact of bankruptcy on profit margins and theabsence of any evidence that creditors havetightened loan standards. Moreover, the stabilityof the debt-to-income ratio since its peak in early1987 provides some hope of moderation in bank-ruptcy increases—indeed, last year's 10 percentrise (and an equivalent rate of increase early thisyear) already represents considerable abatementfrom the previous two years. Nevertheless, thepossibility that rising numbers of bankruptcieswill begin to affect lending or spending patternscannot be dismissed, particularly if the currentstrength in employment and household net worthshould wane.
1. The discussion of debt in this article is limited toconsumer debt, although home mortgage debt has also grownsubstantially since World War II. However, insofar as amortgage usually represents acquisition of an appreciatingasset and the mortgage lender's lien on the property is notcompromised by a mortgagee's bankruptcy, mortgage debt isseldom a precipitating cause of bankruptcy. Moreover, toinclude mortgage debt in a measure of debt burden withouttaking account of rent payments in some fashion would tendto portray the household sector's financial situation as wors-ening whenever a shift away from renting to homeownershipwas taking place. On the whole, it seemed best to comparebankruptcy trends with a form of debt that was generallyunsecured or eollateralized by depreciating assets, a practicefollowed in most of the research reviewed later in thisarticle.
2. National bankruptcy statistics are compiled by theAdministrative Office of the U.S. Courts from case countsprovided by each district court.
3. At the same time, the code contained an overrideprovision that /permitted states to opt out of the federalexemptions within a two-year period by enacting new legis-lation of their own. In all, 32 states exercised this right. Thenew state exemptions were generally less liberal than thefederal standard, but frequently more liberal than the previ-ous state exemption had been.
4. Frederick C. Yeager, "Personal Bankruptcy and Eco-
nomic Stability," Southern Economic Journal, vol. 41 (July1974), pp. 96-102.
5. Vincent P. Apilado, Joel J. Dauten, and Douglas E.Smith, "Personal Bankruptcies," Journal of Legal Studies,vol. 7 (June 1978), pp. 371-91.
6. William J. Boyes and Roger L. Faith, "Some Effects ofthe Bankruptcy Reform Act of 1978," Journal of Law andEconomics, vol. 29 (April 1986), pp. 139-49; and CharlieCarter, "The Surge in Bankruptcies: Is the New Law Re-sponsible?" Federal Reserve Bank of Atlanta, EconomicReview, vol. 67 (January 1982), pp. 20-30.
7. Richard L. Peterson and Kiyomi Aoki, "BankruptcyFilings Before and After Implementation of the BankruptcyReform Law," Journal of Economics and Business, vol. 36(February 1984), pp. 95-105.
8. By the period studied by Peterson and Aoki, the gar-nishment process had been made generally less onerous thanbefore both by provisions in federal law that took effect in1970 and by widespread revisions at the state level. Theprincipal changes reduced the proportion of a debtor's wagesthat could be garnished and prevented employers from firingworkers because their wages were subjected to garnishment.Some states prohibited garnishment entirely. With generallymore lenient practices and with less variation among states,it is not surprising that garnishment laws were less of a factorin explaining state-level differences in bankruptcies in thePeterson-Aoki study.
9. Lawrence Shepard, "Personal Failures and the Bank-ruptcy Reform Act of 1978," Journal of Law and Economics,vol. 27 (October 1984), pp. 419-37.

Personal Bankruptcies 603
10. While the statistical results were not inconsistent withsuch a thesis, the strong time trends characterizing bothbankruptcies and transfer payments could reflect coincidenceas well as causation. And on strictly theoretical grounds, agenerous system of transfer payments might be expected toserve less as a safety net to make people more comfortableabout bankruptcy than as a buffer to help them avoid bank-ruptcy.
11. K.J. Kowalewski, "Personal Bankruptcy: Theory andEvidence," Federal Reserve Bank of Cleveland, EconomicReview (Spring 1982), pp. 1-29.
12. Another utility-maximization model of bankruptcychoice is presented in Michelle J. White, "Personal Bank-ruptcy Under the 1978 Bankruptcy Code: An EconomicAnalysis," Indiana Law Journal, vol. 63 (1987-88), pp. 1-53.White's incorporation of economic variables is less extensivethan Kowalewski's, but her examination of legal effects ismore direct. In contrast to Kowalewski's aggregate time-series approach, White's model examines differences amongcounties in bankruptcies per capita, a framework that sheuses to study the effects of different levels of asset exemp-tions and to look at straight bankruptcy and wage-earnerplans separately. One conclusion of White's study is that thenumber of bankruptcies responds about equally to differencesof comparable magnitudes in exemption levels and in unem-ployment rates.
13. Robert Dolphin, Jr., "An Analysis of Economic andPersonal Factors Leading to Consumer Bankruptcy," Occa-sional Paper 15 (Michigan State University, Graduate Schoolof Business Administration, Bureau of Business and Eco-nomic Research, 1965); and Grant L. Misbach, "PersonalBankruptcy in the United States and Utah," (MBA thesis,University of Utah, College of Business, May 1964).
14. Andrew F. Brimmer, Public Policy and the EconomicImplications of Personal Bankruptcies, in Hearings on theBankruptcy Reform Act of 1978, before the Subcommittee on
Courts of the Senate Judiciary Committee, 97 Cong. 1 Sess.(Government Printing Office, 1981), pp. 6-38; Credit Re-search Center in cooperation with Arthur D. Little, Inc. andOpinion Research Corporation, Consumers' Right to Bank-ruptcy: Origins and Effects, Consumer Bankruptcy Study,Monograph 23 (Purdue University, Krannert GraduateSchool of Management, Credit Research Center, 1982), vol. 1and A. Charlene Sullivan, Personal Bankruptcy: Causes,Costs and Benefits, Consumer Bankruptcy Study, Mono-graph 24 (Purdue University, Krannert Graduate School ofManagement, Credit Research Center, 1982), vol. 2.
15. David T. Stanley and Marjorie Girth, with the collab-oration of Vern Countryman and others, Bankruptcy: Prob-lem, Process, Reform (Brookings Institution, 1971).
16. Federal Reserve statistics on consumer credit covercommercial banks, finance companies, credit unions, savingsinstitutions (savings and loans, federal savings banks, andmutual savings banks), retail stores, and gasoline companies.
17. American Bankers Association, Retail Bank CreditReport, issues for 1981 through 1987.
18. Federal Reserve Bank of New York, Functional CostAnalysis, annual issues.
19. The surveys were conducted in 1983 and 1986 by theSurvey Research Center at the University of Michigan onbehalf of the Federal Reserve and other sponsoring federalagencies, under the title "Survey of Consumer Finances."Results summarized here were presented in Robert B. Avery,Gregory E. Elliehausen, and Arthur B. Kennickell,"Changes in Consumer Installment Debt: Evidence from the1983 and 1986 Surveys of Consumer Finances," FEDERALRESERVE BULLETIN, vol. 73 (October 1987), pp. 761-78.
20. See White, "Personal Bankruptcy," and A. CharleneSullivan and Debra Drecnik Worden, "The Law, the Econ-omy, and Consumer Demand for Debt Relief under theBankruptcy Code" (Purdue University, Krannert GraduateSchool of Management, no date).
604
Industrial Production
Released for publication July 15
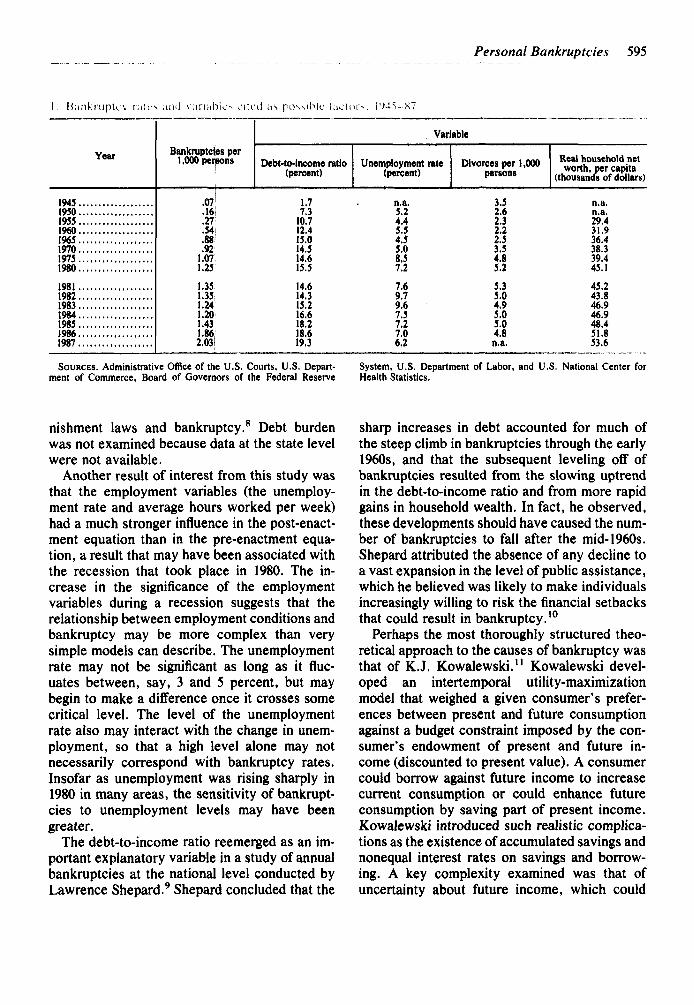
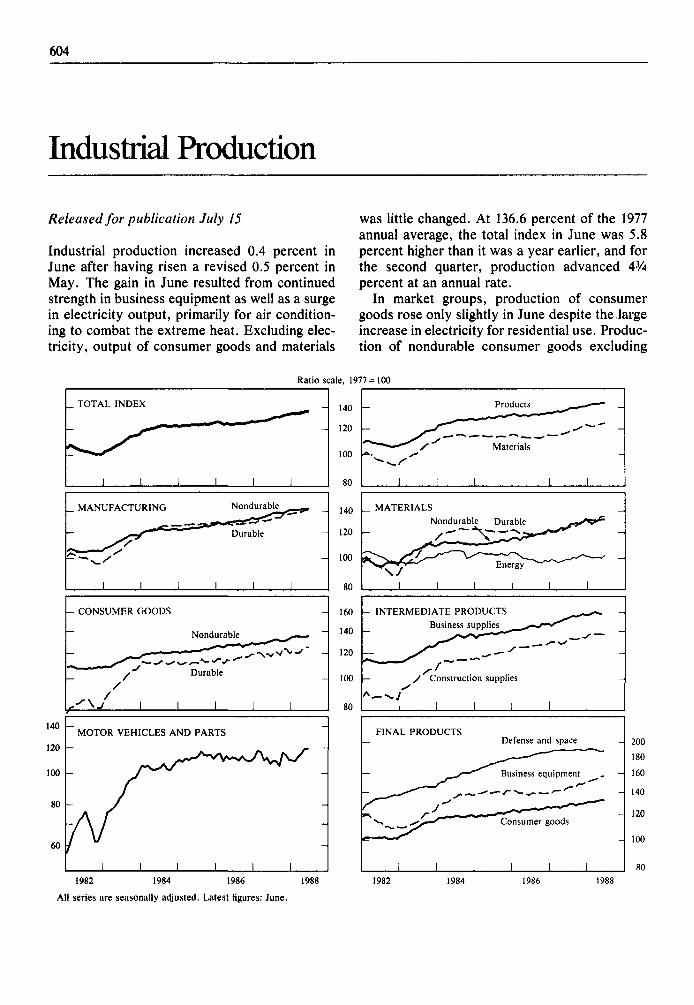
Industrial production increased 0.4 percent inJune after having risen a revised 0.5 percent inMay. The gain in June resulted from continuedstrength in business equipment as well as a surgein electricity output, primarily for air condition-ing to combat the extreme heat. Excluding elec-tricity, output of consumer goods and materials
was little changed. At 136.6 percent of the 1977annual average, the total index in June was 5.8percent higher than it was a year earlier, and forthe second quarter, production advanced 43Apercent at an annual rate.
In market groups, production of consumergoods rose only slightly in June despite the largeincrease in electricity for residential use. Produc-tion of nondurable consumer goods excluding
Ratio scale, 1977 = 100
140
120
100
80
60
_ TOTAL
1
INDEX
s*—i
_ MANUFACTURING
-
1
y
i
- CONSUMER GOODS
:
—*
~ MOTOR
L-
1
/
1
I
I
1
Nondurable
Durable
1
Nondurable
Durable
1
VEHICLES AND PARTS
y^-A/
/
i 1 1
1
-
1
-
• • —
-
y -
-
_
1
1982 1984 1986 1988
140
120
100
80
140
120
100
80
160
140
120
100
80
-
—
r—^i
Products-^*-——
y Materials
1 1 1
_ MATERIALS
-
1
Nondurable Durable
f_y v ^ \ _^ Energy
1 1 1
- INTERMEDIATE PRODUCTS
-
— ^
Business supplies _^»»
^ '
' Construction supplies
1 1 1
-
\ 1
^ • ^ ^
1 1
. / • —
-
1 1
FINAL PRODUCTSi— Defense and space
-
1
^^-y"^ Business equipment
•f~r Consume
1 1 1
r goods
1 I
200
180
160
140
120
100
80
1982 1984 1986 1988
All series are seasonally adjusted. Latest figures: June.

605
Group
1977 = 100
1988
May June
Percentage change from preceding month
1988
Feb. Mar. Apr. May June
Percentagechange,
June 1987to June
1988
Major market groups
Total industrial production
Products, totalFinal products
Consumer goodsDurableNondurable
Business equipment..Defense and space
Intermediate products..Construction supplies
Materials
ManufacturingDurableNondurable
MiningUtilities
136.1
144.6143.4132.5125.4135.1156.5187.1149.0137.3124.5
136.6
145.0143.8132.7125.5135.3157.3187.9149.3136.7125.2
.0
.5
.3
.1- 1 . 0
.4
.8
.2
.9
.6- .7
.2
.2
.1-.1- .2-.1
.6- .6
.3- .3
.3
.5
.2
.4
.52.3-.2
.8-.7-.5
.1
.9
.5
.4
.6
.61.8.1
1.3- .8-.2-.1
.7
.4
.3
.3
.1
.0
.1
.5
.4
.2- .4
.6
Major industry groups
141.6141.2142.1103.4111.8
5.8
5.25.54.36.93.49.1- . 44.24.06.8
141.9141.7142.2104.0114.7
.1
.4- .2
-1.7.3
.4
.3
.51.2
-2.0
.5
.6
.32.1
-2.2
.6I.I
- . 1-1.4
.9
.2
.3
.1
.62.6
5.97.43.94.94.9
N O T E . Indexes are seasonally adjusted.
electricity was sluggish. Auto assemblies in June,at an annual rate of 7.5 million units, were thesame as in May. Production of light trucks, whilestill at a high level, declined last month. Outputof home goods edged up, but has changed little,on balance, since the end of last year. In con-Total industrial production—RevisionsEstimates as shown last month and current estimates
Month
MarchAprilMayJune
Index (1977=100)
Previous Current
Percentage changefrom previous
months
Previous Current
134.7 134.7 .2 .2135.5 135.4 .6 .5136.0 136.1 .4 .5
136.6 . . . .4
trast, production of business equipment contin-ued to post solid gains in June, with strength inall major components except construction, min-ing, and farm machinery.
Output of construction supplies remainedweak for the fourth successive month. Produc-tion of durable materials rose slightly in Juneafter two months of rapid advances. Nondurablematerials were unchanged as chemicals rose fur-ther, but textiles and paper declined.
In industry groups, manufacturing output rose0.2 percent in June. Durable manufacturing wasup 0.3 percent, with fabricated metals and elec-trical and nonelectrical machinery registering thelargest gains. Production at utilities, mainly elec-tric, was up 2.6 percent, and mining output rose0.6 percent.

Statement to Congress
607
Statement by Alan Greenspan, Chairman, Boardof Governors of the Federal Reserve System,before the Committee on Banking, Housing, andUrban Affairs of the U.S. Senate, July 13, 1988.
I appreciate this opportunity to review with yourecent and prospective monetary policy and theeconomic outlook. I would also like to provide abroader perspective by discussing in some detailour nation's longer-term economic objectives,the overall strategy for fiscal and monetary poli-cies needed to reach those objectives, and theappropriate tactics for implementing monetarypolicy within that strategic framework.
THE ECONOMIC SETTING AND MONETARYPOLICY SO FAR IN 1988
The macroeconomic setting for monetary policyhas changed in some notable respects since Itestified last February. At that time, the fullaftereffects of the stock market plunge on spend-ing and financial markets were still unclear.While most members of the Federal Open Mar-ket Committee were forecasting moderategrowth, in view of rapid inventory building andsome signs of a weakening of labor demand, thepossibility of a decline in economic activity couldnot be ruled out. To guard against this outcome,in the context of a firmer dollar on exchangemarkets, the Federal Reserve undertook a fur-ther modest easing of reserve pressures in lateJanuary, which augmented the more substantialeasing after October 19. Short-term interest ratescame down another notch, and, with a delay,helped to push the monetary aggregates higherwithin their targeted annual ranges.
In the event, the economy proved remarkablyresilient to the loss of stock market wealth.Economic growth remained vigorous through thefirst half of the year. Continuing brisk advancesin exports, together with moderating growth inimports, supported expansion in output, espe-
cially in manufacturing. Some strengthening alsowas evident in business outlays for equipment,especially computers, and consumer purchasesof durables, including autos.
Financial markets also returned to more nor-mal functioning. Although trading volumes didnot regain precrash levels in many markets, pricevolatility diminished somewhat and quality dif-ferentials stayed considerably narrower than inthe immediate aftermath of the stock marketplunge. In response, the Federal Reserve gradu-ally was able to restore its standard procedure ofgearing open market operations to the intendedpressure on reserve positions of depository insti-tutions. We thereby discontinued the procedureof reacting primarily to day-to-day variations inmoney market interest rates that had beenadopted right after the stock market break.
As the risks of faltering economic expansionand further financial market disruptions dimin-ished, the dangers of intensified inflationary pres-sures reemerged. Utilization of labor and capitalreached the highest levels in many years, andhints of acceleration began to crop up in wageand price data. Strong gains in payroll employ-ment that continued through the spring combinedwith slower growth in the labor force to lower theunemployment rate about V* percentage point,even before the strong labor market report forJune; the industrial capacity utilization ratemoved up as well. In part reflecting the payrolltax increase, broad measures of hourly compen-sation picked up somewhat in the first quarter.Prices for a wide range of domestic and importedindustrial materials and supplies rose even moresteeply than they did last year. The price inflationof finished goods has not reflected this step-up inprice increases for intermediate goods, in part asproductivity gains kept unit labor costs undercontrol. Even so, continued increases in materi-als prices at the recent pace were seen as point-ing to a potential intensification in inflation moregenerally, since based on historical experience

608 Federal Reserve Bulletin • September 1988
such increases have tended to show through tofinished goods prices.
In these circumstances, the Federal Reservewas well aware that it should not fall behind inestablishing enough monetary restraint to effec-tively resist these inflationary tendencies. TheSystem took a succession of restraining stepsfrom late March through late June. The shortest-term interest rates gradually rose to levels nowaround highs reached last fall. Responding aswell to the unwinding of a tax-related buildup inliquid balances, M2 and M3 growth slowed no-ticeably after April.
In contrast to the shortest-maturity interestrates, long-term bond and mortgage rates, thoughalso above February lows, still remain well be-low last fall's peaks. The timely tightening ofmonetary policy this spring, along with percep-tions of better prospects for the dollar in foreignexchange markets in light of the narrowing in ourtrade deficit, seemed to improve market confi-dence that inflationary excesses would beavoided. Both bond prices and the dollar ralliedin June despite increases in interest rates inseveral major foreign countries and jumps insome agricultural prices resulting from thedrought in important growing areas.
THE ECONOMIC OUTLOOK ANDMONETARY POLICY THROUGH 1989
The monetary actions of the first half of the yearwere undertaken so that economic expansioncould be maintained, recognizing that to do soadditional price pressures could not be permittedto build and that progress toward external bal-ance had to be sustained. The projections ofFOMC members and nonvoting presidents indi-cate that they do expect economic growth tocontinue and inflation to be contained.
The central tendency of FOMC members' ex-pectations of 23/4 to 3 percent for real growth ofGNP over the four quarters of this year implies adeceleration over the rest of the year to a pacemore in line with their expectations of realgrowth of 2 to 2'/2 percent over 1989 and with thelong-run potential of the economy. The droughtwill reduce farm output for a time, and it isimportant that nonfarm inventory accumulationslow before long if we are to avoid a troublesome
imbalance. Still, further gains in our internationaltrade position should continue to provide a majorstimulus to real GNP growth through next year,reflecting the lagged effects of the decline in theexchange value of the dollar through the end oflast year. Although the month-to-month patternin our trade deficit can be expected to be erratic,the improvement in the external sector on bal-ance over time is expected to replace much of thereduced expansion in domestic final demandsfrom our consumer, business, and governmentsectors.
Employment growth is anticipated to be sub-stantial, though some updrift in the unemploy-ment rate may occur over the next year and ahalf. Capacity utilization could well top out soon,as growth in demands for manufactured goodsslows to match that of capacity.
Considering the already limited slack in avail-able labor and capital resources, a leveling of theunemployment and capacity utilization rates isessential if more intense inflationary pressuresare to be avoided in the period ahead. Otherwise,aggregate demand would continue growing at anunsustainable pace and would soon begin tocreate a destabilizing inflationary climate. Supplyconditions for materials and labor would tightenfurther, and costs would start to rise more rap-idly; businesses would attempt to recoup profitmargins with further price hikes on final goodsand services. These faster price rises would, inturn, foster an inflationary psychology, cut intoworkers' real purchasing power, and prompt anattempted further catchup of wages, setting inmotion a dynamic process in which neither work-ers nor businesses would benefit. The hard-wongains in our international competitiveness wouldbe eroded, with feedback effects depressing theexchange value of the dollar. Excessive domesticdemands and inflation pressures in this country,with its sizable external deficit, would be disrup-tive to the ongoing international adjustment oftrade and payments imbalances.
Not only the reduced slack in the economy butalso several prospective adjustments in relativeprices have accentuated inflation dangers. One isthe upward movement of import prices relativeto domestic prices, which is a necessary part ofthe process of adjustment to large imbalances ininternational trade and payments. Another is the

Statement to Congress 609
recent drought-related increases in grain andsoybean prices. It is essential that we keep theseprocesses confined to a one-time adjustment inthe level of prices and not let them spill over to asustained higher rate of increase in wages andprices. Elevated import and farm prices must beprevented from engendering expectations ofhigher general inflation, with feedback effects onlabor costs. A more serious long-run threat toprice stability could come from government ac-tions that introduced structural rigidities andincreased costs of production. Protectionist leg-islation, inordinate hikes in the minimum wage,and other mandated programs that would imposecosts on U.S. producers would adversely affecttheir efficiency and international competitive-ness.
The costs to our economy and society ofallowing a more intense inflationary process tobecome entrenched are serious. As the experi-ence in the past two decades has clearly shown,accelerating wages and prices would have to becountered later by quite restrictive policies, withunavoidably adverse implications for productionand employment. The financial health of manyindividual and business debtors, as well as ofsome of their creditors, then would be threat-ened. The long-run costs of a return to higherinflation and the risks of this occurring undercurrent circumstances are sufficiently great thatFederal Reserve policy at this juncture might bewell advised to err more on the side of restric-tiveness rather than of stimulus.
We believe that monetary policy actions todate, together with the fiscal restraint embodiedin last fall's agreement between the Congress andthe administration, have set the stage for contain-ing inflation through next year. The central ten-dency of FOMC members' expectations for in-flation in the GNP deflator ranges from 3 to 33/4percent over this year to 3 to 4'/2 percent nextyear. But in one sense the GNP deflator under-states this year's rate of inflation, and the com-parison with next year overstates the pickup.The deflator represents the average price of finalgoods and services produced in the United Statesor, equivalently, domestic value added, usingcurrent quantity weights. This measure was arti-ficially held down in the first quarter by a shift inthe composition of output; especially by the
surge in sales of computers whose prices havedropped sharply since the 1982 base year usedfor constructing the deflator. Indeed, if the de-flator were indexed with a 1987 base year, itwould have risen appreciably faster in the firstquarter.
Another understatement of inflation in the de-flator this year arises from its exclusion of im-ported goods, which are not directly encom-passed because they are produced abroad. Inpart because import prices have continued to risesignificantly faster than prices of domesticallyproduced goods, consumer price indexes haveincreased more than the GNP deflator.
The FOMC believes that efforts to containinflation pressures and sustain the economic ex-pansion would be fostered by growth of themonetary aggregates over 1988 well within theirreaffirmed annual ranges of 4 to 8 percent, fol-lowed by some slowing in money growth over thecourse of next year. M2 should move close to themidpoint of its range by late 1988 if depositorsreact as expected to the greater attractiveness ofmarket instruments, compared with liquid moneybalances, that was brought about by recent in-creases in short-term market rates relative todeposit rates. M3 could end the year somewhatabove its midpoint, though comfortably within itsrange if depository institutions retain their recentshare of overall credit expansion. The debt ofnonfinancial sectors, which so far this year hasbeen near the midpoint of its reaffirmed monitor-ing range of 7 to 11 percent, is anticipated to postsimilar growth through the year-end.
For 1989, the FOMC has underscored its in-tention to encourage progress toward price sta-bility over time by lowering its tentative rangesfor money and debt. We have preliminarily re-duced the growth range for M2 by 1 full percent-age point, to 3 to 7 percent; last February, theFOMC also had reduced the midpoint of the 1988range for M2 by 1 percentage point from that for1987. We have adjusted the tentative 1989 rangefor M3 downward by Vz percentage point, to VAto Vh percent. This configuration is consistentwith the observed tendency for M3 velocity overtime to fall relative to the velocity of M2; overthe last decade, the Federal Reserve's rangesfrequently allowed for faster growth of M3 thanof M2. The monitoring range for domestic nonfi-
610 Federal Reserve Bulletin • September 1988
nancial debt for 1989 also has been lowered V2percentage point to a tentative 6V2 to IOV2 per-cent.
The specific ranges chosen for 1989 are, asusual, provisional, and the FOMC will reviewthem carefully next February, in light of inter-vening developments. Anticipating today howthe outlook for the economy in 1989 will appearnext February is difficult, and a major reassess-ment of that outlook would have implications forappropriate money growth ranges for that year.Unexpectedly strong or weak economic expan-sion or inflation pressures over the next sixmonths also could have implications for thebehavior of interest rates and their prospects for1989. The sensitivity of the monetary aggregatesto movements in market interest rates means thatthe appropriate growth next year in M2, M3, anddebt could seem different next February fromnow, necessitating a revision in the annualgrowth ranges. As the aggregates have becomemore responsive to interest rate changes in the1980s, judgments about possible ranges for thenext year necessarily have become even moretentative and subject to revision.
THE PERSISTENT U.S. EXTERNAL ANDFISCAL IMBALANCES
Despite the changes in the economic setting overthe last six months, other features of the macro-economic landscape remain much the same.Most notable are the continuing massive deficitsin our external payments and internal fiscal ac-counts. As a nation, we still are living wellbeyond our means; we consume much more ofthe world's goods and services each year than weproduce. Our current account deficit indicateshow much more deeply in debt to the rest of theworld we are sliding each year.
The consequence of this external imbalancewill be a steady expansion in our external debtburden in the years ahead. No household orbusiness can expect to have an inexhaustiblecredit line with borrowing terms that stay thesame as its debt mounts relative to its wealth andincome. Nor can we as a nation expect ourforeign indebtedness to grow indefinitely relativeto our servicing capacity without additional in-
ducements to foreigners to acquire dollar as-sets—either higher real interest returns, or acheaper real foreign exchange value for dollarassets, or both. To be sure, such changes inmarket incentives would have self-correcting ef-fects over time in reducing the imbalance be-tween our domestic spending and income.Higher real interest rates would curtail domesticinvestment and other spending. A lower realvalue of the dollar would make U.S. goods andservices relatively less expensive to both U.S.and foreign residents, damping our spending onimports out of U.S. income and boosting ourexports.
But simply sitting back and allowing such aself-correction to take place is not a workablepolicy alternative. Trying to follow such a coursecould have severe drawbacks now that our econ-omy is operating close to effective capacity andpotential inflationary pressures are on the hori-zon. The time is hardly propitious to discourageinvestment in needed plant and equipment, toadd further impulses for import price hikes ontop of the upward tendencies already in themaking, or to push our export industries as wellas import-competing industries to their capacitylimits.
Fortunately, we have a better choice for right-ing the imbalance between domestic spendingand income—one over which we have directcontrol. That is to resume reducing substantiallythe still massive federal budget deficit, whichremains the most important source of dissavingin our economy. The fall in the dollar that wehave already experienced over the past fewyears, even allowing for the dollar's appreciationfrom the lows reached at the end of last year, hasset in motion forces that should continue tonarrow our trade and current account deficits inthe years ahead. The associated loss of foreign-funded domestic investment is likely to adverselyaffect overall investment unless it can be re-placed by greater domestic investment financedby domestic saving. A sharp contraction in thefederal deficit appears to be the only assuredsource of augmented domestic net saving. Such afiscal cutback should help counter future tenden-cies for further increases in U.S. interest ratesand declines in the dollar, partly by instillingconfidence on the part of international investors

Statement to Congress 611
in the resolve of the United States to address itseconomic problems.
Fiscal restraint in the years ahead would assistin making room for the needed diversion of moreof our productive resources to meeting demandsfrom abroad. Domestic demands will have tocontinue growing more slowly than our produc-tive capacity, as seems to have been the case sofar this year, if net exports are to expand furtherwithout resulting in an inflationary overheating ofthe economy. Absent this fiscal restraint, higherinterest rates would become the only channel fordamping domestic demands if they were becom-ing excessive. If a renewed decline in the dollarwere adding further inflationary stimulus at thesame time, upward pressures on interest rateswould be even more likely. The restrictive im-pact would be felt most by the interest-sensitivesectors—homebuilding, business fixed invest-ment, and consumer durables.
In terms of federal deficit reduction, the sched-ule under the Gramm-Rudman-Hollings law is agood baseline for a multiyear strategy, and I trustthe Congress will stick with it. But we should gofurther. Ideally, we should be aiming ultimatelyat a federal budget surplus, so that governmentsaving could supplement private domestic savingin financing additional domestic investment. His-torically, the United States has not been a low-saving, low-investing economy. From the post-Civil War period through the 1920s, the UnitedStates consistently saved more as a fraction ofGNP than did Japan and Germany, and we savedmuch more as a share of GNP then than we havesince the end of World War II. A turnaround inour current domestic saving performance is es-sential to a smooth reduction in our dependenceon foreign saving, and the federal governmentshould take the lead.
It is also apparent that redressing our externalimbalances must encompass cooperative policieswith our trading partners. These partners includeboth the established industrial powers, the newlyindustrialized economies, and the developingcountries, whose debt problems must be workedthrough as part of the international adjustmentprocess.
This is the strategy that U.S. fiscal policy aswell as economic policies abroad should follow inmost effectively promoting our shared economic
objectives. The strategic role of U.S. monetarypolicy is implied by a clear statement of whatthose ultimate objectives are. We should not besatisfied unless the U.S. economy is operating athigh employment with a sustainable externalposition and above all stable prices.
High employment is consistent with steadilyrising nominal wages and real wages growing inline with productivity gains. Some frictional un-employment will exist in a dynamic labor market,reflecting the process of matching availableworkers with available jobs. But every effortshould be made to minimize both impedimentsthat contribute to structural unemployment anddeviations of real economic growth from theeconomy's potential that cause cyclical unem-ployment.
By a sustainable external position, I am refer-ring to a situation in which our foreign indebted-ness is not persistently growing faster than ourcapacity to service it out of national income. Ourinternational payments need not be in exactbalance from one year to the next, and theexchange value of the dollar need not be per-fectly stable, but wide swings in the dollar, andboom and bust cycles in our export and import-competing industries, should be avoided.
By price stability, I mean a situation in whichhouseholds and businesses in making their savingand investment decisions can safely ignore thepossibility of sustained, generalized price in-creases or decreases. Prices of individual goodsand services, of course, would still vary to equil-ibrate the various markets in our complex na-tional and world economy, and particular priceindexes could still show transitory movements.A small persistent rise in some of the indexeswould be tolerable, given the inadequate adjust-ment for trends in quality improvement andthe tendency for spending to shift toward goodsthat have become relatively cheap. But essen-tially the average of all prices would exhibit notrend over time. Price movements in these cir-cumstances would reflect relative scarcities ofgoods, and private decisionmakers could focustheir concerns on adjusting production andconsumption patterns appropriately to changingindividual prices, without being misled bygeneralized inflationary or deflationary pricemovements.
612 Federal Reserve Bulletin • September 1988
The strategy for monetary policy needs to becentered on making further progress toward andultimately reaching stable prices. Price stabilityis a prerequisite for achieving the maximumeconomic expansion consistent with a sustain-able external balance at high employment. Pricestability reduces uncertainty and risk in a criticalarea of economic decisionmaking by householdsand businesses. In the process of fostering pricestability, monetary policy also would have tobear much of the burden for countering anypronounced cyclical instability in the economy,especially if fiscal policy is following a programfor multiyear reductions in the federal budgetdeficit. While recognizing the self-correcting na-ture of some macroeconomic disturbances, mon-etary policy does have a role to play over time inguiding aggregate demand into line with the econ-omy's potential to produce. This may involveproviding a counterweight to major, sustainedcyclical tendencies in private spending, thoughwe can not be overconfident in our ability toidentify such tendencies and to determine ex-actly the appropriate policy response. In thisregard, it seems worthwhile for me to offer somethoughts on the approach the Federal Reserveshould take in implementing this longer-termstrategy for monetary policy.
THE APPROPRIATE TACTICS FORMONETARY POLICY
For better or worse, our economy is enormouslycomplex, the relationships among macroecono-mic variables are imperfectly understood, and asa consequence economic forecasting is an uncer-tain endeavor. Nonetheless, the forecasting ex-ercise can aid policymaking by helping to refinethe boundaries of the likely economic conse-quences of our policy stance. But forecasts willoften go astray to a greater or lesser degree, andmonetary policy has to remain flexible to respondto unexpected developments.
A perfectly flexible monetary policy, however,without any guideposts to steer by, can risklosing sight of the ultimate goal of price stability.In this connection, the requirement under theHumphrey-Hawkins Act for the Federal Reserveto announce its objectives and plans for growthof money and credit aggregates is a very useful
device for calibrating prospective monetary pol-icy. The announcement of ranges for the mone-tary aggregates represents a way for the FederalReserve to communicate its policy intentions tothe Congress and the public. And the undisputedlong-run relation between money growth andinflation means that trend growth rates in themonetary aggregates provide useful checks onthe thrust of monetary policy over time. It isclear to all observers that the monetary rangeswill have to be brought down further in the futureif price stability is to be achieved and thenmaintained.
But, in a shorter-run countercyclical context,monetary aggregates have drawbacks as rigidguides to monetary policy implementation. As Idiscussed in some detail in my February testi-mony, financial innovation and deregulation inthe 1980s have altered the structure of deposits,lessened the predictability of the demands for theaggregates, and made the velocities of Ml andprobably M2 over periods of a year or so moresensitive to movements in market interest rates.Movements in short-term market rates relative tosluggishly adjusting deposit rates can result inlarge percentage changes in the opportunity costsof holding liquid monetary assets. Depositor re-sponses can induce divergent growth betweenmoney and nominal GNP for a time. I might addthat it was partly these considerations that ledthe FOMC to retain the wider 4 percentage pointranges for money and credit growth for this yearand next.
Nonetheless, the demonstrated long-run con-nection of money and prices overshadows theproblems of interpreting shorter-run swings inmoney growth. I certainly do not want to leavethe impression that the aggregates have littleutility in implementing monetary policy. Theyhave an important role, and it is quite possiblethat their importance will grow in the yearsahead. Currently, the FOMC keeps M2 and M3under careful scrutiny and judges their actualmovements relative to assessments of their ap-propriate growth at any particular time. In thiscontext, these aggregates are among the indica-tors that influence adjustments to the stance ofpolicy, both at regular FOMC meetings andbetween meetings, as the FOMC's directive tothe Federal Reserve Bank of New York's Trad-

Statement to Congress 613
ing Desk indicates. The FOMC also regularlymonitors a variety of other monetary aggregates.At times in recent years, we have intensivelyexamined the properties of several alternativemeasures and reported the results to the Con-gress. These measures have included Ml, Ml-A(Ml less NOW accounts), monetary indexes, andmost recently the monetary base.
An analysis of the monetary base appears as anappendix to the Board's Humphrey-Hawkinsreport.1 This aggregate, essentially the sum ofcurrency and reserves, did not escape the sharpvelocity declines of other money measures ear-lier in the 1980s. Its velocity behavior stemmedfrom relatively strong growth in transaction de-posits compared with that of GNP, which wasmirrored in the reserve component of the base.In this sense, some of the problems plaguing Mlalso have shown through to the base, though insomewhat muted form. Moreover, the three-fourths share of currency in the base raises somequestion about the reliability of its link to spend-ing. The high level of currency holdings—$825per man, woman, and child living in the UnitedStates—suggests that vast, indeterminateamounts of U.S. currency circulate or arehoarded beyond our borders. Indeed, over thelast year and a half, currency has grown notice-ably faster than would have been expected fromits historical relationships with U.S. spendingand interest rates.
Although the monetary base has exhibitedsome useful properties over the past three dec-ades as a whole, the FOMC's view is that thebehavior of the monetary base has not consis-tently added to the information provided by thebroader aggregates, M2 and M3. The Committeeaccordingly has decided not to establish a rangefor this aggregate, although it has requested thestaff to intensify research into the ability of
I. See "Monetary Policy Report to the Congress," FED-ERAL RESERVE BULLETIN, vol. 73 (August 1988), pp. 517-33.
various monetary measures to indicate long-runprice trends.
Because the Federal Reserve cannot reliablytake its cue for shorter-run operations solelyfrom the signals being given by any or all of themonetary aggregates, we have little alternativebut to interpret the behavior of a variety ofeconomic and financial indicators. They can sug-gest the likely future course of the economygiven the current stance of monetary policy.
Judgments about the balance of various risksto the economic outlook need to adapt over timeto the shifting weight of incoming evidence; thispoint is well exemplified so far this year, as notedearlier. The Federal Reserve must be willing toadjust its instruments fairly flexibly as thesejudgments evolve; we must not hesitate to re-verse course occasionally if warranted by newdevelopments. To be sure, we should not over-react to every bit of new information, becausethe frequent observations for a variety of eco-nomic statistics are subject to considerable tran-sitory "noise." But we need to be willing torespond to indications of changes in underlyingeconomic trends, without losing sight of theultimate policy objectives.
To the extent that the underlying economictrends are judged to be deviating from a pathconsistent with reaching the ultimate objectives,the Federal Reserve would need to make "mid-course" policy corrections. Such deviationsfrom the appropriate direction for the economywill be inevitable, given the delayed and imper-fectly predictable nature of the effects of previ-ous policy actions. Numerous unforeseen forcesnot related to monetary policy will continue tobuffet the economy. The limits of monetary pol-icy in short-run stabilization need to be borne inmind. The business cycle cannot be repealed, butI believe it can be significantly damped by appro-priate policy action. Price stability cannot bedictated by fiat, but governmental decisionmak-ers can establish the conditions needed to ap-proach this goal over the next several years. •
Chairman Greenspan presented identical testimony before the Domestic Monetary PolicySubcommittee of the House Committee on Banking, Finance and Urban Affairs, July 28, 1988.

614
Announcements
JOHN P. LA WARE: APPOINTMENT AS AMEMBER OF THE BOARD OF GOVERNORS
On May 23, 1988, President Reagan announcedhis intention to nominate John P. La Ware as amember of the Board of Governors. Mr. LaWarewas subsequently confirmed by the Senate onAugust 4 and took the oath of office, adminis-tered by Chairman Greenspan, on August 15.The text of the White House announcement ofMay 23 follows:
The President today announced his intention tonominate John P. LaWare, of Massachusetts, District1, to be a Member of the Board of Governors of theFederal Reserve System for a term of 14 years fromFebruary 1, 1988. He would succeed Henry C. Wal-lich.
Since 1978, Mr. LaWare has been Chairman andDirector of Shawmut National Corporation and Shaw-mut Bank in Boston, Massachusetts; he was namedChairman and Chief Executive Officer of both thecorporation and the bank in 1980. Mr. LaWare joinedChemical Bank & Trust Company in 1953, serving invarious capacities: Senior Vice President, Vice Presi-dent, and Assistant Secretary.
Mr. LaWare graduated from Harvard University(B.A., 1950) and the University of Pennsylvania(M.A., 1951). He was born February 20, 1928, inColumbus, Wisconsin. He served in the United StatesAir Force, 1951-53, and the New York Air NationalGuard, 1954-59. He is married, has two children, andresides in Brookline, Massachusetts.
PUBLICATION OF NEW HANDBOOK FORTHE REGULATORY SERVICE
The Federal Reserve Board announced on July 6,1988, that it will begin publication in Septemberof a new handbook to its Regulatory Service thatwill incorporate regulations, interpretations, pol-icy statements, and commentary on the pay-ments system and the Expedited Funds Avail-ability Act in a single looseleaf publication.
The Federal Reserve Regulatory Service cur-rently consists of four books—a complete service
covering all Board regulations and related materials,and three separate handbooks on securities credit(Regulations G, T, U, and X), consumer regulations(B, C, E, M, Z, AA, and BB), and regulationsrelating to monetary policy (A, D, and Q).
The new handbook will contain all Board reg-ulations governing the payments system, includ-ing Regulation J (Collection of Checks and OtherItems and Wire Transfers of Funds), and Regu-lation CC (Expedited Funds Availability), andthe Board's policy statements on payments-system risk.
Regulation CC was adopted by the Board onMay 11, 1988, and became effective on Septem-ber 1, 1988.
Subscribers to the full Regulatory Service willautomatically receive these materials as part oftheir subscriptions.
The new handbook, which will be updated on amonthly basis and will be cross-indexed, is designedto help those who must refer frequently to theBoard's regulatory material in the payments area.Cost of the new handbook will be $75 annually.Inquiries should be addressed to Publications Ser-vices, Board of Governors of the Federal ReserveSystem, Washington, D.C. 20551.
Two STUDIES ON CONTROLLING RISK INTHE PAYMENTS SYSTEM NOW AVAILABLE
The Board of Governors has issued two separatebut parallel studies regarding risk in the pay-ments system and the advantages and drawbacksof various policies for controlling this risk. Thepurpose of the two studies was to reexamine thedirection of the Board's policy on reducing riskin the payments system with the aim of refiningthe understanding of basic objectives and ofalternative policies. A Task Force on ControllingPayments-System Risk, comprising members ofthe staffs of the Board and of the Federal ReserveBanks, prepared one report, entitled Controlling
615
Risk in the Payments System. The Board'sLarge-Dollar Payments System Advisory Group,composed of senior officers of several privatedepository institutions, prepared the second re-port, entitled A Strategic Plan for ManagingRisk in the Payments System.
The Board's Payments System Policy Committeecommissioned the two studies in August 1987 aspart of its review and revision of its initial policy.The report by the Advisory Group was preparedfrom the perspective of the private sector and makesspecific recommendations. The report by theBoard's Task Force analyzes the advantages anddisadvantages of various policy options.
UPDATE TO STAFF GUIDELINES UNDERREGULATION AA
The Federal Reserve Board published on July 29,1988, the second update to its staff guidelines onthe Credit Practices Rule under Regulation AA.The updated guidelines became effective August1, 1988.
The Board's Credit Practices Rule, applicableto all banks and their subsidiaries, addresses un-fair or deceptive acts or practices in the extendingof consumer credit. The rule does not apply toloans for the purchase of real property. Banks areprohibited from using certain remedies to enforceconsumer credit obligations and from using a latecharge practice commonly referred to as "pyra-miding." The rule also provides protections forcosigners of consumer credit obligations.
list have been removed for substantially failing tomeet the requirements for continued listing; 77stocks have been removed for reasons such aslisting on a national securities exchange or in-volvement in an acquisition.
The list includes all over-the-counter securitiesdesignated by the Board pursuant to its estab-lished criteria as well as all stocks designated asNMS securities for which transaction reports arerequired to be made pursuant to an effectivetransaction reporting plan. Additional OTC secu-rities may be designated as NMS securities in theinterim between the Board's quarterly publica-tions and will be immediately marginable. Thenext publication of the Board's list is scheduledfor November 1988.
Besides NMS-designated securities, the Boardwill continue to monitor the market activity ofother OTC stocks to determine which stocksmeet the requirements for inclusion and contin-ued inclusion on the list.
EXTENSION OF COMMENT PERIOD ONSAME-DAY PAYMENT OF CHECKS
The Federal Reserve Board has extended theperiod for comment on its proposed concept ofsame-day payment for checks presented to payingbanks by private-sector collecting banks. In re-sponse to requests for additional time to preparecomments, the Board is extending the commentperiod through December 1, 1988. The proposedconcept was published on April 5, 1988, with thecomment period ending August 3, 1988.
REVISED LIST OF OTC STOCKS SUBJECTTO MARGIN REGULATIONS NOW AVAILABLE
The Federal Reserve Board published on July 22,1988, a revised list of over-the-counter (OTC)stocks that are subject to its margin regulations,effective August 8, 1988.
This revised List of Marginable OTC Stockssupersedes the list that was effective on May 9,1988. The changes that have been made in thelist, which now includes 3,147 OTC stocks, areas follows: 77 stocks have been included for thefirst time, 63 under National Market System(NMS) designation; 68 stocks previously on the
INFORMAL HEARING HELD
The Federal Reserve Board held an informalhearing on July 29, 1988, on a proposed rule toimplement the limitations placed on grandfa-thered nonbank banks by the Competitive Equal-ity Banking Act of 1987.
CHANGE IN BOARD STAFF
Anthony Cornyn, Assistant Director, Division ofBanking Supervision and Regulation, resignedeffective August 5, 1988.

Legal Developments
617
REVISION OF STAFF GUIDELINES ON THECREDIT PRACTICES RULE
The Board of Governors is revising 12 C.F.R. Part227, its Staff Guidelines on the Credit Practices Rule,Subpart B of Regulation AA (Unfair or Deceptive Actsor Practices). The rule prohibits banks and their sub-sidiaries from using certain creditor remedies in con-nection with a consumer credit obligation, from usinga late-charge practice commonly referred to as pyra-miding, and from obligating a cosigner prior to giving arequired notice explaining the cosigner's obligations.The update addresses questions on the use of multi-purpose credit documents, the acquisition of a securityinterest in household goods from a purchase-moneylender, and exemptions from the rule.
Effective August 1, 1988, 12 C.F.R. Part 227 isrevised as follows:
Section 227.13—Unfair Credit ContractProvisions
* * * * *
13(a) Confessions of Judgment
Q13(a)-2: Language limiting confession of judgmentprovision. If a bank uses multi-purpose credit con-tracts, may the bank include a confession of judgmentclause with qualifying language indicating that theclause is not applicable in a consumer purpose loan—such as, "You confess judgment to the extent the lawallows," or "This clause applies only in businesspurpose loans"?
A: No. Given the public policy purpose of the rule, abank may not have a confession of judgment clause ina consumer credit contract, even with limiting lan-guage. Therefore, when a multi-purpose form is usedfor a consumer purpose loan, the bank must cross out,blacken in, or otherwise indicate clearly the removalof the prohibited clause from the loan document.
* * * * *
13(d) Security Interest in Household Goods
Q13(d)-3a: Refinancing (new creditor)-original loanpurchase money. On the same facts as those detailedin Q13(d)-3, assume that the consumer refinances theloan with a different bank. May that bank acquire thesecurity interest of the purchase-money lender inhousehold goods without violating the rule?
A: Yes, the bank may acquire the security interest ofthe purchase-money lender without violating the rule.
Section 227.16—State Exemptions
* * * * *
Q16(b)-3. Exemptions granted. What states have beengranted an exemption from the Board's rule?
A: The state of Wisconsin was granted an exemptionfrom all provisions of the Board's rule effective No-vember 20, 1986, for transactions of $25,000 or less.The state of New York was granted an exemption fromthe cosigner provisions of the Board's rule effectiveJanuary21,1987, for transactions of $25,000 or less. Inboth Wisconsin and New York, transactions over$25,000 are subject to the Board's rule but compliancewith state law is deemed compliance with the federallaw. The state of California was granted an exemptionfrom the cosigner provisions of the Board's rule effec-tive August 1,1988. These exemptions do not apply tofederally-chartered institutions.
ORDER GRANTING AN EXEMPTION TO THESTATE OF CALIFORNIA FROM THE CREDITPRACTICES RULE
The Board of Governors is amending 12 C.F.R. Part227, its Regulation AA, to determine that the exemp-tion from the cosigner provision of the Board's CreditPractices Rule, Subpart B, requested by the state ofCalifornia will be granted with respect to state-char-tered institutions.
Effective August 1, 1988, the Board amends12 C.F.R. Part 227 as follows:

618 Federal Reserve Bulletin D September 1988
ORDER
The state of California has applied for an exemptionfrom the cosigner provision of the Board's CreditPractices Rule which became effective January 1,1986. Pursuant to section 227.16 of Regulation AA, theBoard has determined that the relevant laws of thisstate are substantially equivalent to the federal law andthat the state administers and enforces its law effec-tively. The Board hereby grants the exemption asfollows:
Effective August 1, 1988, consumer credit transactions thatare subject to the California Civil Code and California Busi-ness and Professions Code are exempt from the cosignerprovision of the Board's Credit Practices Rule, 12 C.F.R.§ 227.14. This exemption does not apply to transactions inwhich a federally chartered institution is a creditor.
ORDERS ISSUED UNDER BANK HOLDINGCOMPANY ACT
Orders Issued Under Section 3 of the BankHolding Company Act
NCNB CorporationCharlotte, North Carolina
Order Approving Acquisition of a Bank
NCNB Corporation, Charlotte, North Carolina, abank holding company within the meaning of the BankHolding Company Act (the "BHC Act") (12 U.S.C.§ 1841 et seq.), has applied for the Board's approvalunder section 3 of the BHC Act (12 U.S.C. § 1842) toacquire control of JRB Bank, National Association, abridge bank ("Bank") created by the Federal DepositInsurance Corporation ("FDIC") to acquire the assetsand assume the deposits and liabilities of First Repub-lic Bank Dallas, N.A., and other bank subsidiaries ofFirst RepublicBank Corporation, Dallas, Texas. Ap-plicant proposes to immediately enter into a manage-ment agreement with the FDIC that provides thatApplicant will operate Bank under the name NCNBTexas National Bank with full discretion over, andresponsibility for, the daily operations of Bank. Appli-cant also proposes to acquire all of the voting shares ofBank. In addition, Applicant proposes to acquireindirectly First RepublicBank International, NewYork, New York, a company organized and heldpursuant to the Edge Act (12 U.S.C. §611 e/ seq.).
On July 29, 1988, First RepublicBank Dallas, N.A.,and other bank subsidiaries of First RepublicBankCorporation were declared insolvent and the FDIC
was appointed receiver. Pursuant to section ll(i) ofthe Federal Deposit Insurance Act ("FDI Act") asamended by the Competitive Equality Banking Act of1987 (12 U.S.C. § 1821(0), the FDIC established Bankto acquire the assets and to assume the liabilities anddeposits of the closed banks. The FDIC solicited offersfor the acquisition of Bank from qualified bidderspursuant to section 13(0 of the FDI Act (12 U.S.C.§ 1823(f)). On July 29, 1988, the FDIC selected Appli-cant's bid for Bank. On the same day, the FDICadvised that Applicant had been selected as the win-ning bidder, and recommended immediate action onthis application in order to permit Bank to open andoperate without the need for liquidation. The OCC hasalso recommended approval of the transaction.
In view of this situation and the need for immediateaction to prevent the failure of the institution and toprotect the interest of Bank's depositors, it has beendetermined, pursuant to section 3(b) of the BHC Act(12 U.S.C. § 1842(b)), section 225.14 (h) of Regula-tion Y (12 C.F.R. § 225.14(h)), and section 262.3(1) ofthe Board's Rules of Procedure (12 C.F.R. § 262.3(1)),to dispense with the notice provisions of the BHC Act.
Under section 3(d) of the BHC Act (12 U.S.C.§ 1842(d)), the Douglas Amendment, a bank holdingcompany generally may not be allowed to acquirecontrol of any bank located outside of the holdingcompany's principal state of operations.1 NCNB Cor-poration, with approximately $29 billion in total assetsas of March 31, 1988, is a bank holding company thatprincipally operates in North Carolina for purposes ofthe Douglas Amendment. As noted above, Bank islocated in Texas.
Section 11(0(9) of the FDI Act (12 U.S.C.§ 1821(0(9)) specifically provides that a bank holdingcompany may acquire a bridge bank located in anotherstate, without regard to the limitations on interstatebank acquisitions contained in the Douglas Amend-ment or in any relevant state law, where the bridgebank has total assets of at least $500,000,000. See also12 U.S.C. § 1823(O(4)(A). Bank, with total assets ofapproximately $25 billion, was established by theFDIC pursuant to section 1 l(i) of the FDI Act and willbe acquired by Applicant in an assisted transaction.Accordingly, the provisions of section 3(d) of the BHCAct and of any relevant state law do not bar approvalof the proposed transaction.
In evaluating an application under section 3 of theBHC Act, the Board is required to consider the
1. A bank holding company's principal state of banking operationsis the state in which the operations of the bank holding company'sbanking subsidiaries were principally conducted on the later of July 1,1966, or the date on which the company became a bank holdingcompany.

Legal Developments 619
financial and managerial resources and future pros-pects of the companies involved, the effect of theproposal on competition, and the convenience andneeds of the communities to be served. Under theproposal, Applicant would immediately provide Bankwith new management officials, with proven manage-ment capability, and would reopen and operate Bank,which would continue to provide a full range ofservices to customers of Bank. The agreement inprinciple between Applicant and the FDIC will alsorecapitalize Bank. With respect to the financial fac-tors, note has been taken of Applicant's existingfinancial strength on a consolidated basis and Appli-cant's plans to supplement its own capital resources tosupport the new investment.
Based on these and all of the other facts of record,including the bid proposal made by Applicant andaccepted by the FDIC, the financial and managerialresources and future prospects of Applicant, its sub-sidiaries and Bank are consistent with approval of thisapplication. The benefits to the convenience and needsof the communities in Texas of maintaining Bank as aviable competitor in Texas weigh in favor of approvalof this application.
Applicant owns over 25 percent of the voting sharesof Charter Bancshares, Houston, Texas, whose banksoperate in the Houston banking market. The affiliationof Charter Bancshares and Bank will not result in asignificant increase in market concentration or haveany other significant adverse effects on competition inthe Houston banking market. In addition, while Ap-plicant maintains several offices engaged in variousnonbanking activities in Texas, there is no significantcompetition in these areas between Applicant andBank. Accordingly, consummation of the proposalwould not increase the concentration of banking re-sources or have any significant adverse effects oncompetition in Texas or any other relevant market.
Based on the foregoing and all of the facts of record,the General Counsel and the Staff Director of theDivision of Banking Supervision and Regulation havedetermined, acting pursuant to authority specificallydelegated by the Board in this case, that the applica-tion under section 3 of the Act should be, and herebyis, approved. This action is limited to approval of thetransaction according to the terms and conditions ofApplicant's bid as presented to the Board, and anysignificant change in those terms or conditions mayrequire further review by the Board. Moreover, as acondition of this Order, further investments in theequity of Bank by Applicant as permitted under theagreement in principal between Applicant and theFDIC will require the prior approval of the Board.
The acquisition of Bank by Applicant would alsoresult in the continuation of the international services
currently provided by the Edge Corporation of Bank.In light of the facts in this case, approval of thisacquisition would be in the public interest and consis-tent with the purposes of the Edge Act.
The FDIC has informed the Board that immediateaction on Applicant's proposal is necessary in order topermit Bank to open and operate as a viable competi-tor that will continue to serve its communities. In lightof these and all the facts of record in this case, theGeneral Counsel and the Staff Director of the Divisionof Banking Supervision and Regulation, acting pursu-ant to authority delegated by the Board, have deter-mined, in accordance with section ll(b) of the BHCAct, that Applicant may immediately acquire controlof Bank through the management agreement with theFDIC, and that Applicant may consummate its pro-posed investment in Bank on or after the fifth calendarday following the effective date of this Order. Thetransaction shall not be consummated later than threemonths after the effective date of this Order, unless theperiod for consummation is extended for good causeby the Board or the Federal Reserve Bank of Rich-mond under delegated authority.
By order, approved pursuant to authority delegatedby the Board, effective July 29, 1988.
MICHAEL BRADAELD
General Counsel
WILLIAM TAYLOR
Staff DirectorDivision of Banking Supervision
and Regulation
Somerset Bankshares, Inc.Somerville, Massachusetts
Order Approving Formation of a Bank HoldingCompany
Somerset Bankshares, Inc., Somerville, Massachu-setts ("Somerset"), has applied for the Board's ap-proval under section 3(a)(l) of the Bank Holding Com-pany Act of 1956, as amended (12 U.S.C. § 1842(a)(l))("BHC Act"), to become a bank holding company byacquiring all of the outstanding voting shares ofSomerset Savings Bank, Somerville, Massachusetts("Bank"), an FDIC-insured savings bank.'
Notice of the application, affording an opportunityfor interested persons to submit comments, has been
1. As an FDIC-insured institution, Bank would qualify as a "bank"under section 2(c) of the BHC Act, as amended by section 101(a) of theCompetitive Equality Banking Act of 1987, Pub. L. No. 100-86, 100Stat. 552, 554 (1987) (to be codified at 12 U.S.C. i 1841(c».
620 Federal Reserve Bulletin • September 1988
given in accordance with section 3(b) of the BHC Act,(52 Federal Register 21,739 (June 9, 1987)). The timefor filing comments has expired, and the Board hasconsidered the application and all comments receivedin light of the factors set forth in section 3(c) of theBHC Act (12 U.S.C. § 1842(c)).
Somerset is a non-operating corporation formed forthe purpose of acquiring Bank. Principals of Somersetare also principals of Bank. Bank is the 14th largestcommercial banking organization in Massachusetts,with total deposits of $378.1 million, representing lessthan one percent of total deposits in commercial banksin the state.2 This proposal represents a restructuringof existing ownership interests. Consummation of thisproposal would not result in any significant adverseeffect on the concentration of banking resources inMassachusetts.
Bank competes in the Boston banking market,3
where it is the 11th largest commercial banking orga-nization, controlling less than one percent of totaldeposits in commercial banks in the market. Principalsof Somerset and Bank are not associated with anyother financial institution located in the market. Con-summation of this transaction would not result in anysignificant adverse competitive effects in any relevantgeographic area.
The financial and managerial resources and futureprospects of Somerset and Bank are considered satis-factory and consistent with approval.
In considering the convenience and needs of thecommunity to be served, the Board has taken intoaccount the record of Bank under the CommunityReinvestment Act (12 U.S.C. § 2901 et seq.) ("CRA")and various consumer compliance statutes. The CRArequires the federal bank supervisory agencies toencourage financial institutions to help meet the creditneeds of the local communities in which they arechartered consistent with the safe and sound operationof such institutions. To accomplish this end, the CRArequires the appropriate federal supervisory authorityto "assess the institution's record of meeting the creditneeds of its entire community, including low- andmoderate-income neighborhoods, consistent with thesafe and sound operation of the institution." TheBoard is required to "take such record into account inits evaluation" of applications under section 3 of theBHC Act.
Somerset filed its application to acquire Bank ap-proximately one year ago. Because of concern regard-ing Bank's CRA record, the Board requested that theCommonwealth of Massachusetts examine Bank todetermine the bank's compliance with the CRA andother consumer laws. The Commonwealth's examina-tion uncovered numerous violations and deficienciesin these areas, and based on these deficiencies, theCommonwealth determined that Bank's overall recordwas less than satisfactory. The examination foundviolations of certain state consumer laws and provi-sions of the Board's Regulation B. The examinationalso indicated that Bank had not instituted proceduresto determine adequately the credit needs of its com-munity. For example, Bank was unable to documentits officer call program to potential customers, and theofficers' participation in various civic organizationswas not part of an organized effort to help the com-munity or solicit information on its credit needs.Although Bank advertised its deposit services, Bankfailed to advertise its credit products to the public. Theexamination also indicated that Bank was not an activeparticipant in community development programs orgovernment supported housing and small businessprograms in recent years, and many of the activitiesthat Bank used as evidence to support its developmentrecord were out-dated or were specific programs re-quired by state law. Finally, the Bank's lending recordindicated that a substantial portion of Bank's loanswere made to borrowers outside Bank's designatedcommunity, despite evidence of loan demand withinthe community.
In response to the examination findings, Somersetmade a number of commitments to the Board and theCommonwealth to improve Bank's consumer compli-ance and CRA record.4 Bank has committed to theBoard (1) to strengthen its community outreach activ-ities by meeting regularly with local community repre-sentatives, (2) to review its participation in govern-mental credit programs and to inform the public of theavailability of funds under such programs, and (3) todevelop further its plans for making its entire commu-nity more fully aware of its credit services throughadvertising and a call program. Bank has providedreports to the Federal Reserve Bank of Boston and theCommonwealth over the past six months detailing its
2. AH banking data are as of December 31,1987.3. The Boston banking market is approximated by the Boston RMA
minus the New Hampshire towns of Brentwood, Chester, and Derryand the Massachusetts towns of Ayer, Berlin, Groton, Harvard,Pepperell, and Shirley. The Boston market also includes those por-tions of Bellingham, Carver, Lakeville, Middleboro, and Plymouthnot included in the Boston RMA.
4. Bank committed to the Commonwealth to take all necessarysteps to alleviate the deficiencies revealed in the examination report.Bank also made a number of specific commitments, including com-mitments to better market its credit services, to offer mortgages onless restrictive terms and to become involved with certain governmentlending programs and community development projects. Bank hascorrected its technical CRA violations and has made substantialefforts to fulfill these commitments.

Legal Developments 621
efforts to implement the commitments that it made toeach regulator.
In December 1987, Bank's board of directorsadopted a new CRA statement. As part of Bank'scommitment to ascertain the credit needs of its com-munity, Bank has assigned a vice president as theBank's compliance officer to oversee its CRA activi-ties. This officer will report to Bank's board of direc-tors on a quarterly basis, and the Bank's board willrecord its actions regarding Bank's CRA efforts. Aspart of Bank's new program, Bank's employees arerequired to increase their calls to potential smallbusiness borrowers, and Bank is in the process ofcreating a detailed centralized reporting system forjudging the success of its call program.
In addition, Bank will initiate meetings with localgroups involved with housing and other credit-relatedareas. In order to inform the local community of itscredit services, Bank has begun to advertise its creditproducts in local papers and now has its mortgageprogram included as part of the mortgage rate report inthe local newspapers. Bank has taken steps to increaseits participation in community development projectsand recently obtained approval to participate in thePHA loan program. Finally, Bank has made certainfinancial commitments to a number of state and localhousing authorities and community assistance pro-grams. After a review of the actions and ongoing plansSomerset has taken to improve its CRA record, theCommonwealth of Massachusetts approved Somer-set's application to acquire Bank.
The Board has stated that an applicant's commit-ments to correct its deficiencies in its CRA programare an important aspect of the Board's role in encour-aging performance under CRA. This is especiallyimportant where, as here, Bank has taken substantialactions to correct its deficiencies.5 Accordingly, inlight of Bank's actions over the past six months tocorrect the deficiencies in its CRA performance, itscommitments to continue to strengthen its CRA per-formance, and the favorable recommendation by theCommonwealth of Massachusetts, the Board con-cludes that the factors relating to the convenience andneeds of the communities to be served are consistentwith approval.6
5. See Advance Bancorp, Inc., 72 FEDERAL RESERVE BULLETIN 834(1986); Board Statement of January 3,1980, Federal Reserve Regula-tory Service, 1 6-1312.
6. The Board also has received a protest concerning Bank's CRAperformance from the Somerville Corporation, Somerville, Massachu-setts ("Protestant"), a local non-profit development corporation.Protestant alleged that Bank has not participated in any developmentprojects for low- and moderate-income families in Somerville, eventhough many of Bank's depositors fall in that category. Somerset andProtestant reached an agreement that Somerset will increase itslending over the next four years to non-profit developers of affordable
As a condition of approval of this application,Somerset and Bank shall continue to submit quarterlyreports to the Reserve Bank concerning the progressof Bank's CRA program. The Board will also carefullyreview all future applications to determine whetherSomerset has made substantial measurable progress infulfulling the commitments it has made to the Board toimprove its service to the convenience and needs of itscommunity.
Based on the foregoing and other facts of record, theBoard has determined that approval of the applicationwould be consistent with the public interest and thatthe application should be, and hereby is, approved.The transaction shall not be consummated before thethirtieth calendar day following the effective date ofthis Order, or later than three months after the effec-tive date of this Order, unless such period is extendedfor good cause by the Board or by the Federal ReserveBank of Boston, acting pursuant to delegated author-ity.
By order of the Board of Governors, effectiveJuly 25, 1988.
Voting for this action: Vice Chairman Johnson and Gover-nors Seger, Angell, and Heller. Absent and not voting:Chairman Greenspan and Governor Kelley.
JAMES MCAFEEAssociate Secretary of the Board
Taiyo Kobe Bank, Ltd.Kobe, Japan
Order Approving Formation of a Bank HoldingCompany
Taiyo Kobe Bank, Ltd., Kobe, Japan ("Applicant"),has applied for the Board's approval under section3(a)(l) of the Bank Holding Company Act (12 U.S.C.§ 1842(a)(l)) ("BHC Act"), to become a bank holdingcompany by acquiring all of the voting shares of TaiyoKobe Bank & Trust Company ("Bank"), New York,New York, a de novo trust bank.
Notice of the application, affording an opportunityfor interested persons to submit comments, has beengiven in accordance with section 3 of the BHC Act. (52Federal Register 22,527 (1987)). The time for filingcomments has expired, and the Board has consideredthe application and all comments received in light ofthe factors set forth in section 3(c) of the BHC Act(12 U.S.C. § 1842(c)).
housing for low- and moderate-income residents in the local commu-nity or permanent financing for such residents. Based on this commit-ment, the protest was withdrawn.
622 Federal Reserve Bulletin • September 1988
Applicant, with total assets of approximately $175billion, is the 27th largest bank worldwide and theeighth largest city bank in Japan.1 Applicant engagesin a variety of banking activities on a world-wide basis.Applicant operates branches in New York, Chicagoand Seattle, as well as an agency in Los Angeles, andhas selected New York as its home state under theBoard's Regulation K (12 C.F.R. § 211.22(b)).2 Appli-cant is permitted under section 5 of the InternationalBanking Act, 12 U.S.C. § 3103(b), to retain itsbranches outside of New York because the Seattleoffice was opened prior to July 27, 1978, the statutorygrandfather date, and because the Chicago branch wasestablished to receive only such deposits as would bepermissible for a corporation organized under section25(a) of the Federal Reserve Act. 12 U.S.C.§ 31O3(a)(l).
In addition to traditional lending and deposit-takingactivities, Bank will offer wholesale trust services tocustomers in metropolitan New York3 and throughoutthe United States. Bank also will undertake debtparticipations in lease and municipal financing activi-ties nationwide. Bank thereby will expand the scope ofApplicant's banking operations beyond those retailservices currently provided by Applicant's UnitedStates branches and agency. Based upon the facts ofrecord, including the de novo status of Bank, theBoard concludes that the proposed transaction wouldhave no adverse effects on competition. Accordingly,competitive considerations are consistent with ap-proval.
Section 3(c) of the BHC Act requires the Board inevery case to consider the financial resources of anapplicant organization and the bank or bank holdingcompany to be acquired. In accordance with theprinciples of national treatment and competitive eq-uity, the Board has previously stated that it expectsforeign banks seeking to establish or acquire bankingorganizations in the United States to meet the samegeneral standards of strength, experience and reputa-tion as domestic banking organizations, and to be ableto serve as a source of financial strength to their
United States banking operations.4 In considering ap-plications of foreign banking organizations, the Boardhas noted that foreign banks operate outside theUnited States in accordance with different regulatoryand supervisory requirements, accounting principles,asset quality standards, and banking practices andtraditions, and that these differences make it difficultto compare the capital positions of domestic andforeign banks. The Board has addressed the complexissues involved in balancing these concerns in thecontext of individual applications on a case-by-casebasis, making adjustments as appropriate to an appli-cant's capital to reflect differences in accounting treat-ment and regulatory practices.
The Board recently has announced a proposal tosupplement its consideration of capital adequacy witha risk-based system that is simultaneously being pro-posed by the member countries of the Basle Commit-tee on Banking Regulations and Supervisory Practicesand the other domestic federal banking agencies.3 TheJapanese Ministry of Finance in April of this yearacted to implement for Japanese banking organizationsthe risk-based capital framework developed by theBasle Committee. The Board considers the BasleCommittee proposal an important step toward a moreconsistent and equitable international norm for assess-ing capital adequacy. Until that framework becomeseffective, however, the Board will continue to evaluateapplications involving foreign banking organizationson a case-by-case basis consistent with its prior pre-cedent.
In this case, the primary capital ratio of Applicant,as publicly reported, is well below the 5.5 percentminimum level specified in the Board's Capital Ade-quacy Guidelines.6 After making adjustments to reflectJapanese banking and accounting practices, however,including consideration of a portion of the unrealizedappreciation in Applicant's portfolio of equity securi-ties consistent with the principles in the Basle capitalframework, Applicant's capital ratio meets UnitedStates standards.
The Board has also considered several additionalfactors that mitigate its concern in this case. The
1. Banking data are as of March 31, 1988, based on the dollar/yenexchange rate as of that date. Applicant's market rank is as of July1987.
2. As of September 30, 1987, the New York branch reported totalassets of $4.7 billion; the Chicago branch reported total assets of $300million; the Seattle branch reported total assets of $800 million; andthe Los Angeles office reported total assets of $1.2 billion.
3. The Metropolitan New York-New Jersey market is defined toinclude New York City and Long Island, New York; Putnam, Orange,Westchester, Rockland and Sullivan Counties in New York; Bergen,Essex, Hudson, Hunterdon, Middlesex, Monmouth, Morris, Ocean,Passaic, Somerset, Sussex, Union and Warren Counties in NewJersey; and portions of Fairfield County in Connecticut.
4. See Sumitomo Trust & Banking Co., Ltd. 73 FEDERAL RESERVEBULLETIN 749 (1987). Accord, Long-Term Credit Bank of Japan,Board Order dated June 6,1988; Ljubljanska Banka-Associated Bank,72 FEDERAL RESERVE BULLETIN 489 (1986); The Mitsubishi Trust andBanking Corporation, 72 FEDERAL RESERVE BULLETIN 256 (1986);The Industrial Bank of Japan, Ltd., 72 FEDERAL RESERVE BULLETIN71 (1986); The Mitsubishi Bank, Limited, 70 FEDERAL RESERVEBULLETIN 518 (1984). See also Policy Statement on Supervision andRegulation of Foreign-Based Bank Holding Companies, Federal Re-serve Regulatory Service 14-835 (1979).
5. 53 Federal Register 8,549 (1988).6. Capital Adequacy Guidelines, 50 Federal Register 16,057 (1985),
71 FEDERAL RESERVE BULLETIN 445 (1985).
Legal Developments 623
Board has placed considerable emphasis on the factthat Applicant will establish Bank de novo, and thatBank will be strongly capitalized and small in relationto Applicant. The Board expects that Applicant willmaintain Bank among the more strongly capitalizedbanking organizations of comparable size in theUnited States. The Board notes further that Applicantis in compliance with the capital and other financialrequirements of Japanese banking organizations. Inthis regard, the Board has considered as favorablefactors that, in anticipation of implementation of theBasle Committee risk-based capital framework, Appli-cant has, through the issuance of common stock andretention of earnings, increased its equity capital byapproximately $640 million in its latest fiscal year, andthat Applicant's capital improvement program is con-sistent with meeting the standards in the Basle Com-mittee capital framework for 1990 and 1992.
Based on these and other facts of record, includingcertain commitments made by Applicant, the Boardconcludes that financial and managerial factors areconsistent with approval of this application to acquireBank. Considerations relating to the convenience andneeds of the communities to be served are also con-sistent with approval.
Accordingly, the Board has determined that thisapplication under section 3 of the BHC Act should be,and hereby is, approved. The proposed acquisition ofBank shall not be consummated before the thirtiethcalendar day following the effective date of this Order.The proposal shall not be consummated later thanthree months after the effective date of this Order, andBank shall be opened for business not later than sixmonths after the effective date of this Order. The lattertwo periods may be extended for good cause by theBoard or by the Federal Reserve Bank of New York,pursuant to delegated authority.
By order of the Board of Governors, effectiveJuly 8, 1988.
Voting for this action: Chairman Greenspan and GovernorsJohnson, Angell, and Heller. Voting against this action:Governor Seger. Absent and not voting: Governor Kelley.
JAMES MCAFEE
Associate Secretary of the Board
Dissenting Statement of Governor Seger
I dissent from the Board's action in this case. I believethat foreign banking organizations whose publicly re-ported capital, based on U.S. accounting principles, iswell below the Board's capital guidelines for U.S.banking organizations have an unfair competitive ad-vantage in the United States over domestic banking
organizations and should be judged against the samefinancial and managerial standards, including theBoard's capital adequacy guidelines, as are applied todomestic banking organizations.
In addition, I am concerned that while this applica-tion would permit a large Japanese banking organiza-tion to acquire a bank in the U.S., U.S. bankingorganizations are not permitted to make comparableacquisitions in Japan. While some progress is beingmade in opening Japanese markets to U.S. bankingorganizations, U.S. banking organizations and otherfinancial institutions, in my opinion, are still far frombeing afforded the full opportunity to compete inJapan.
July 8, 1988
Toyo Trust and Banking Co., Ltd.Tokyo,Japan
Order Approving the Formation of a Bank HoldingCompany
Toyo Trust and Banking Co., Ltd., Tokyo, Japan("Applicant"), has applied for the Board's approvalunder section 3(a)(l) of the Bank Holding CompanyAct (the "Act") (12 U.S.C. § 1842(a)(l)), to become abank holding company by acquiring 100 percent of thevoting shares of Toyo Trust Company of New York,New York, New York ("Bank"), a de novo bank.
Notice of the application, affording an opportunityfor interested persons to submit comments, has beengiven in accordance with section 3(b) of the Act. Thetime for filing comments has expired, and the Boardhas considered the application and all comments re-ceived in light of the factors set forth in section 3(c) ofthe Act (12 U.S.C. § 1842(c)).
Applicant, with total consolidated assets equivalentto approximately $84 billion,1 ranks as the sixth largestof eight trust banks in Japan. Worldwide, Applicantranks as the 33rd largest bank. Applicant operates 55offices throughout Japan as well as five foreignbranches and agencies and five representative offices.In addition, Applicant engages in financially relatedactivities through three wholly owned subsidiariesoutside Japan and owns 30 percent of a leasing com-pany in the People's Republic of China.
In the United States, Applicant operates a branch inNew York, New York, with total assets of $3.2billion,2 and an agency in Los Angeles, California,with total assets of $1.6 billion. Applicant has selected
1. Banking data are as of March 31,1988, and reflect the yen/dollarexchange rate as of that date. Rankings are as of July 31, 1987.
2. Banking data for branch and agency are as of December 31,1987.

624 Federal Reserve Bulletin • September 1988
New York as its home state under the Board's Regu-lation K (12 C.F.R. 211.22(b)). Bank will be located inApplicant's home state. Accordingly, the Board con-cludes that the acquisition of Bank by Applicant isconsistent with Section 5 of the International BankingAct of 1978 (12 U.S.C. §3103).
Bank, a de novo institution, is being organized as astate-chartered, nonmember bank. It will place pri-mary emphasis on providing trust related services, andwill also provide a full range of commercial bankingservices in the Metropolitan New York-New Jerseybanking market.3 In view of the de novo status of Bankand based upon the facts of record, the Board con-cludes that the proposed transaction will have nosignificant adverse effects on existing or probablefuture competition, and will not significantly increasethe concentration of resources in any relevant market.Thus, competitive considerations are consistent withapproval of the application.
Section 3(c) of the Act requires the Board in everycase to consider the financial resources of the appli-cant organization and the bank or bank holding com-pany to be acquired. In accordance with the principlesof national treatment and competitive equity, theBoard has previously stated that it expects foreignbanks seeking to establish or acquire banking organi-zations in the United States to meet the same generalstandards of strength, experience, and reputation asdomestic banking organizations, and to be able toserve as a source of strength to their banking opera-tions in the United States.4 In considering applicationsof foreign banking organizations, the Board has notedthat foreign banks operate outside the United States inaccordance with different regulatory and supervisoryrequirements, accounting principles, asset qualitystandards, and banking practices and traditions, andthat these differences make it difficult to compare thecapital positions of domestic and foreign banks. TheBoard has addressed the complex issues involved in
3, The Metropolitan New York-New Jersey market is defined toinclude New York City and Long Island, New York; Putnam,Sullivan, Westchester, Rockland, and Orange Counties in New York;Bergen, Essex, Hudson, Hunterdon, Middlesex, Monmouth, Morris,Ocean, Passaic, Somerset, Sussex, Union and Warren Counties inNew Jersey; and portions of Fairfield County in Connecticut.
4. See [Jubljanska Banka-Associated Bank, 72 FEDERAL RESERVEBULLETIN 489 (1986); The Mitsubishi Trust and Banking Corporation,72 FEDERAL RESERVE BULLETIN 256 (1986); The Industrial Bank ofJapan, Ltd., 72 FEDERAL RESERVE BULLETIN 71 (1986); The Mitsu-bishi Bank, Limited, 70 FEDERAL RESERVE BULLETIN 518 (1984). Seealso Policy Statement on Supervision and Regulation of Foreign-Based Holding Companies, Federal Reserve Regulatory Service11 4-835 (1979).
balancing these concerns in the context of individualapplications on a case-by-case basis, making adjust-ments as appropriate to an applicant's capital to reflectdifferences in accounting treatment and regulatorypractices.
The Board recently has announced a proposal tosupplement its consideration of capital adequacy witha risk-based system that is simultaneously being pro-posed by the member countries of the Basle Commit-tee on Banking Regulations and Supervisory Practicesand the other domestic federal banking agencies.5 TheJapanese Ministry of Finance in April of this yearacted to implement for Japanese banking organizationsthe risk-based capital framework developed by theBasle Committee. The Board considers the BasleCommittee proposal an important step toward a moreconsistent and equitable international norm for assess-ing capital adequacy. Until that framework becomeseffective, however, the Board will continue to evaluateapplications involving foreign banking organizationson a case-by-case basis consistent with its prior pre-cedent.
In this case, the primary capital ratio of Applicant,as publicly reported, is well below the 5.5 percentminimum level specified in the Board's Capital Ade-quacy Guidelines.* After making adjustments to reflectJapanese banking and accounting practices, however,including consideration of a portion of the unrealizedappreciation in Applicant's portfolio of equity securi-ties consistent with the principles in the Basle capitalframework, Applicant's capital ratio meets UnitedStates standards.
The Board has also considered several additionalfactors that mitigate its concern in this case. TheBoard has placed considerable emphasis on the factthat Applicant will establish Bank de novo, and thatBank will be strongly capitalized and small in relationto Applicant. The Board expects that Applicant willmaintain Bank among the more strongly capitalizedbanking organizations of comparable size in theUnited States. The Board notes further that Applicantis in compliance with the capital and other financialrequirements of Japanese banking organizations. Inthis regard, the Board has considered as favorablefactors that, in anticipation of implementation of theBasie Committee risk-based capital framework, Appli-
5. 53 Federal Register 8,549 (1988).6. Capital Adequacy Guidelines, 50 Federal Register 16,057 (1985),
71 FEDERAL RESERVE BULLETIN 445 (1985).

Legal Developments 625
cant has, through the issuance of common stock andretention of earnings, increased its equity capital byapproximately $225 million in its latest fiscal year, andby another $280 million in the first quarter of this fiscalyear. The Board also notes that Applicant's capitalimprovement program is consistent with meeting thestandards in the Basle Committee capital frameworkfor 1990 and 1992.
Based on these and other facts of record, includingcertain commitments made by Applicant, the Boardconcludes that the financial and managerial factors areconsistent with approval of this application. Consider-ations relating to the convenience and needs of thecommunity to be served are also consistent withapproval.
Based upon the foregoing and other facts of record,the Board has determined that consummation of thetransaction would be in the public interest and that theapplication should be, and hereby is, approved. Thetransaction shall not be consummated before the thir-tieth calendar day following the effective date of thisOrder, or later than three months after the effectivedate of this Order, and Bank shall be opened forbusiness not later than six months after the effectivedate of this Order. The latter two periods may beextended for good cause by the Board or the FederalReserve Bank of New York, pursuant to delegatedauthority.
By order of the Board of Governors, effectiveJuly 11, 1988.
Voting for this action: Chairman Greenspan and GovernorsAngell and Heller. Voting against this action: GovernorSeger. Absent and not voting: Governors Johnson and Kelly.
JAMES MCAFEE
Associate Secretary of the Board
Dissenting Statement of Governor Seger
I dissent from the Board's action in this case. I believethat foreign banking organizations whose publicly re-ported capital, based on U.S. accounting principles, iswell below the Board's capital guidelines for U.S.banking organizations have an unfair competitive ad-vantage in the United States over domestic bankingorganizations and should be judged against the samefinancial and managerial standards, including theBoard's capital adequacy guidelines, as are applied todomestic banking organizations.
In addition, I am concerned that while this applica-tion would permit a large Japanese banking organiza-tion to acquire a bank in the U.S., U.S. bankingorganizations are not permitted to acquire banks inJapan. While some progress is being made in openingJapanese markets to U.S. banking organizations, U.S.banking organizations and other financial institutions,in my opinion, are still far from being afforded the fullopportunity to compete in Japan.
July 11, 1988
APPLICATIONS APPROVED UNDER BANK HOLDING COMPANY ACT
By Federal Reserve Banks
Recent applications have been approved by the Federal Reserve Banks as listed below. Copies are available uponrequest to the Reserve Banks.
Section 3
Applicant Bank(s)Reserve
BankEffective
date
Baden Bancorp, Inc.,Wilmington, Delaware
1889 Bankcorp,East Lansing, Michigan
Bank of New Baden,New Baden, Illinois
Lookingglass Bane Corp.,Albers, Illinois
Pioneer Bank,North Branch, Michigan
St. Louis July 15, 1988
Chicago June 21, 1988

626 Federal Reserve Bulletin • September 1988
Section 3—Continued
Applicant
Bank South Corporation,Atlanta, Georgia
Bank South Pensacola, Inc.,Atlanta, Georgia
B.M.J. Financial Corp.,Bordentown, New Jersey
Britt Bancshares, Inc.,St. Paul, Minnesota
Cardinal Bancshares, Inc.,Lexington, Kentucky
CB&T Bancshares, Inc.,Columbus, Georgia
Colorado Western Bancorp, Inc.,Montrose, Colorado
Danville Bancshares, Inc.,Danville, Iowa
Family Bancorp,Haverhill, Massachusetts
First Affiliated Bancorp, Inc.,Watseka, Illinois
First Colonial BanksharesCorporation,Chicago, Illinois
First Commercial Bancshares,Inc.,Jasper, Alabama
First Financial Corporation,Terre Haute, Indiana
The First Jermyn Corp.,Jermyn, Pennsylvania
First Litchfield FinancialCorporation,Litchfield, Connecticut
Firstmondovi, Inc.,Mondovi, Wisconsin
GEBSCO, Inc.,Cochrane, Wisconsin
FirstMorrillCo.,Omaha, Nebraska
First United Bancshares, Inc.,El Dorado, Arkansas
FNBH Bancorp, Inc.,Howell, Michigan
Bank(s)
C&P Bank Corporation ofPensacola,Pensacola, Florida
The Citizens and PeoplesNational Bank of Pensacola,Pensacola, Florida
Southern Ocean State Bank,Little Egg Harbor Township,Tuckerton, New Jersey
First State Bank,Britt, Iowa
Harco Bankshares, Inc.,Harlan, Kentucky
Fort Rucker Bancshares, Inc.,Chillicothe, Missouri
First National Bank of Montrose,Montrose, Colorado
Danville State Savings Bank,Danville, Iowa
The Family Mutual SavingsBank,Haverhill, Massachusetts
Watseka First National Bank,Watseka, Illinois
First Colonial Bank of LakeCounty,Vernon Hills, Illinois
Cahaba Bancorp,Trussville, Alabama
First Citizens of Paris, Inc.,Paris, Illinois
First Jessup Corp.,Jessup, Pennsylvania
The First National Bank ofLitchfield,Litchfield, Connecticut
Bank of Mondovi,Mondovi, Wisconsin
Security State Bank,Ansley, Nebraska
First City Corp.,Fort Smith, Arkansas
First National Bank in Howell,Howell, Michigan
ReserveBank
Atlanta
Atlanta
Philadelphia
Chicago
Cleveland
Atlanta
Kansas City
Chicago
Boston
Chicago
Chicago
Atlanta
Chicago
Philadelphia
Boston
Minneapolis
Kansas City
St. Louis
Chicago
Effectivedate
July 20, 1988
July 20, 1988
July 5, 1988
June 30, 1988
June 28, 1988
July 20, 1988
June 29, 1988
June 22, 1988
July 14, 1988
June 22, 1988
July 6, 1988
July 18, 1988
July 7, 1988
June 23, 1988
June 20, 1988
July 1, 1988
July 1, 1988
June 24, 1988
July 19, 1988

Legal Developments 627
Section 3—Continued
Applicant Bank(s)Reserve
BankEffective
date
Fryburg Banking Company,Fryburg, Pennsylvania
Gillespie Bancshares, Inc.,De Soto, Wisconsin
Gustine-DeLeon Bancshares,Inc.,Gustine, Texas
Hasten Bancorp,Indianapolis, Indiana
Keystone Financial, Inc.,Harrisburg, Pennsylvania
Lincoln Financial Corporation,Fort Wayne, Indiana
Lone Star Bancshares, Inc.,Victoria, Texas
Market Street Bancshares, Inc.,McLeansboro, Illinois
McCamey Financial Corporation,McCamey, Texas
Montclair Bancorp, Inc.,Montclair, New Jersey
NBA Holding Company,Davenport, Iowa
NSB Bancshares, Inc.,La Crosse, Kansas
Northwest Bancorporation Inc.,Houston, Texas
Northwest Illinois Bancorp, Inc.,Freeport, Illinois
Norwich Financial Corp.,Norwich, Connecticut
Suburban Bancorp, Inc.,Palatine, Illinois
First United National Bank,Fryburg, Pennsylvania
De Soto State Bank,De Soto, Wisconsin
The First State Bank,Gustine, Texas
Sullivan State Bank,
Cleveland
Chicago
Dallas
Chicago
July 11,
June 23
July 1,
June 29
, 1988
, 1988
1988
, 1988Sullivan, Indiana
Peoples State Bank,Farmersburg, Indiana
First Bank and Trust Company ofClay County,Brazil, Indiana
Farmers Bane, Inc.,Tipton, Indiana
Security National Bank,Pottstown, Pennsylvania
Peoples Bancshares Corporation,Van Wert, Ohio
Texas National Bank of Victoria,Victoria, Texas
Peoples National Bank,McLeansboro, Illinois
McCamey Bancshares, Inc.,McCamey, Texas
Montclair Savings Bank,Montclair, New Jersey
National Bank of Aledo,Aledo, Illinois
The Nekoma State Bank,LaCrosse, Kansas
Northwest Bank,Houston, Texas
First State Bank and TrustCompany,Rockford, Illinois
First State Financial Corporationof Rockford,Rockford, Illinois
NWIB Acquisition Corporation,Inc.,Freeport, Illinois
Norwich Savings Society,Norwich, Connecticut
Continental Bank of OakbrookTerrace,Oakbrook Terrace, Illinois
Philadelphia
Chicago
Dallas
St. Louis
Dallas
New York
Chicago
Kansas City
Dallas
Chicago
July
July
June
July
July
July
July
July
June
July
12, 1988
12, 1988
30, 1988
7, 1988
12, 1988
13, 1988
7, 1988
14, 1988
23, 1988
15, 1988
Boston
Chicago
July 8, 1988
July 6, 1988
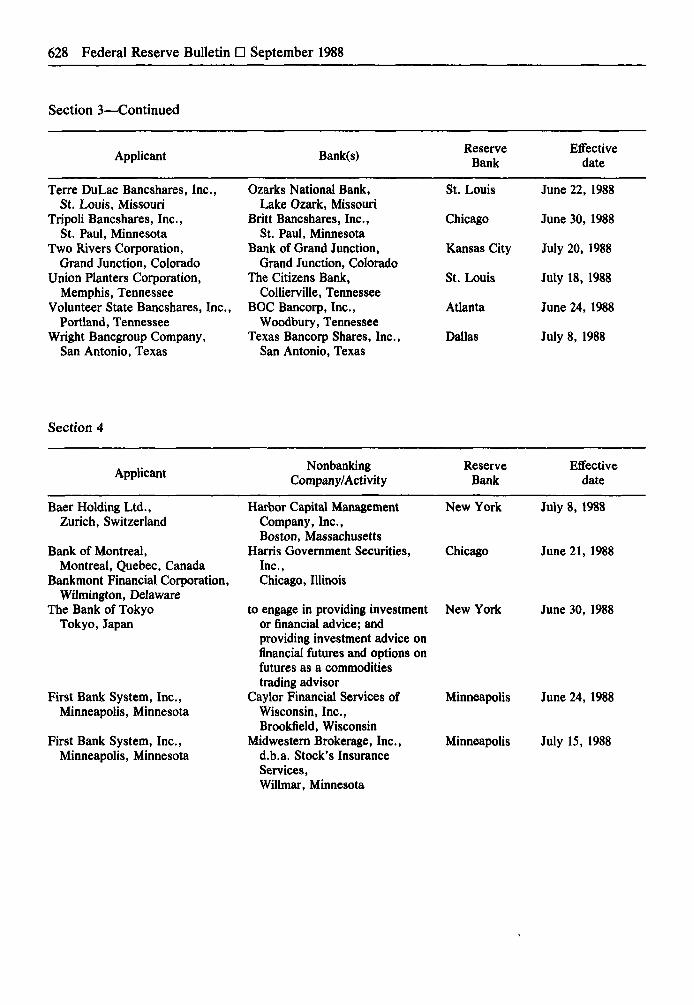
628 Federal Reserve Bulletin D September 1988
Section 3—Continued
Applicant Bank(s)Reserve
BankEffective
date
Terre DuLac Bancshares, Inc.,St. Louis, Missouri
Tripoli Bancshares, Inc.,St. Paul, Minnesota
Two Rivers Corporation,Grand Junction, Colorado
Union Planters Corporation,Memphis, Tennessee
Volunteer State Bancshares, Inc.,Portland, Tennessee
Wright Bancgroup Company,San Antonio, Texas
Ozarks National Bank,Lake Ozark, Missouri
Britt Bancshares, Inc.,St. Paul, Minnesota
Bank of Grand Junction,Grand Junction, Colorado
The Citizens Bank,Collierville, Tennessee
BOC Bancorp, Inc.,Woodbury, Tennessee
Texas Bancorp Shares, Inc.,San Antonio, Texas
St. Louis
Chicago
Kansas City
St. Louis
Atlanta
Dallas
June
June
July
July
June
July
22, 1988
30, 1988
20, 1988
18, 1988
24, 1988
8, 1988
Section 4
Applicant
Baer Holding Ltd.,Zurich, Switzerland
Bank of Montreal,Montreal, Quebec, Canada
Bankmont Financial Corporation,Wilmington, Delaware
The Bank of TokyoTokyo, Japan
NonbankingCompany/Activity
Harbor Capital ManagementCompany, Inc.,Boston, Massachusetts
Harris Government Securities,Inc.,Chicago, Illinois
to engage in providing investmentor financial advice; and
ReserveBank
New York
Chicago
New York
Effectivedate
July 8, 1988
June 21, 1988
June 30, 1988
First Bank System, Inc.,Minneapolis, Minnesota
First Bank System, Inc.,Minneapolis, Minnesota
providing investment advice onfinancial futures and options onfutures as a commoditiestrading advisor
Caylor Financial Services ofWisconsin, Inc.,Brookfield, Wisconsin
Midwestern Brokerage, Inc.,d.b.a. Stock's InsuranceServices,Willmar, Minnesota
Minneapolis
Minneapolis
June 24, 1988
July 15, 1988

Legal Developments 629
Sections 3 and 4
Applicant NonbankingCompany/Activity
ReserveBank
Effectivedate
NBD Bancorp, Inc.,Detroit, Michigan
NBD Midwest Corporation,Detroit, Michigan
Charter Bank Group, Inc., Chicago July 13, 1988Northfield, Illinois
APPLICATIONS APPROVED UNDER BANK MERGER ACT
By Federal Reserve Banks
Recent applications have been approved by the Federal Reserve Banks as listed below. Copies are available uponrequest to the Reserve Banks.
Applicant Bank(s) ReserveBank
Effectivedate
Bank One, Mansfield,Mansfield, Ohio
Sovran Bank/Central South,Nashville, Tennessee
Bank One, Ashland, Cleveland July 13, 1988Ashland, Ohio
Sovran Bank/Williamson County, Atlanta July 1, 1988Franklin, Tennessee
PENDING CASES INVOLVING THE BOARD OF GOVERNORS
This list of pending cases does not include suits against the Federal Reserve Banks in which the Board ofGovernors is not named a party.
Whitney v. United States, et al., No. CA3-88-1596-H(N.D. Tex., filed July 7, 1988).
Credit Union National Association, Inc., et al., v.Board of Governors, No. 88-1295 (D.D.C. May 13,1988).
Bonilla v. Board of Governors, No. 88-1464 (7th Cir.,filed March 11, 1988).
Cohen v. Board of Governors, No. 88-1061 (D.N.J.,filed March 7, 1988).
Stoddard v. Board of Governors, No. 88-1148 (D.C.Cir., filed Feb. 25, 1988).
Independent Insurance Agents of America, Inc. v.Board of Governors, No. 87-1686 (D.C. Cir., filedNov. 19, 1987).
National Association of Casualty and Surety Agents,et al., v. Board of Governors, Nos. 87-1644,87-1801, 88-1001, 88-1206,88-1245, 88-1270 (D.C.
Cir., filed Nov. 4, Dec. 21, 1987, Jan. 4, March 18,March 30, April 7, 1988).
Teichgraeber v. Board of Governors, No. 87-2505-0(D. Kan., filed Oct. 16, 1987).
Northeast Bancorp v. Board of Governors, No.87-1365 (D.C. Cir., filed July 31, 1987).
National Association of Casualty & Insurance Agentsv. Board of Governors, Nos. 87-1354,87-1355 (D.C.Cir., filed July 29, 1987).
The Chase Manhattan Corporation v. Board of Gov-ernors, No. 87-1333 (D.C. Cir., filed July 20, 1987).
Lewis v. Board of Governors, Nos. 87-3455, 87-3545(11th Cir., filed June 25, Aug. 3, 1987).
Securities Industry Association v. Board of Gover-nors, et al., No. 87-1169 (D.C. Cir., filed April 17,1987).
CBC, Inc. v. Board of Governors, No. 86-1001 (10thCir., filed Jan. 2, 1986).
630
Membership of the Board of Governorsof the Federal Reserve System, 1913-88APPOINTIVE MEMBERS1
Name Federal ReserveDistrict
Date of initialoath of office
Other dates and information relatingto membership2
Charles S. Hamlin. .Boston Aug. 10, 1914
Paul M. Warburg...,Frederic A. Delano.W.P.G. HardingAdolphC. Miller....
.New York
.Chicago
.Atlanta
.San Francisco.
dodododo
Albert Strauss New YorkHenry A. Moehlenpah ChicagoEdmund Platt New York ,
David C. Wills ClevelandJohn R. Mitchell Minneapolis...Milo D. Campbell ChicagoDaniel R. Crissinger ClevelandGeorge R. James St. Louis
.Oct. 26, 1918
.Nov. 10, 1919June 8, 1920
.Sept. 29, 1920
.May 12, 1921
.Mar. 14, 1923
.May 1, 1923
.May 14, 1923
Edward H. Cunningham...ChicagoRoy A. Young Minneapolis...Eugene Meyer New YorkWayland W. Magee Kansas City...Eugene R. Black AtlantaM.S. Szymczak Chicago
J.J. Thomas Kansas City....Marriner S. Eccles San Francisco ,
Joseph A. Broderick New YorkJohnK. McKee ClevelandRonald Ransom AtlantaRalph W. Morrison DallasChester C. Davis RichmondErnest G. Draper New YorkRudolph M. Evans RichmondJames K. Vardaman, Jr. ..St. LouisLawrence Clayton BostonThomas B. McCabe Philadelphia...Edward L. Norton AtlantaOliver S. Powell Minneapolis...Wm. McC. Martin, Jr New York
do.Oct. 4, 1927.Sept. 16, 1930.May 18, 1931.May 19, 1933June 14, 1933
do.Nov. 15, 1934
.Feb. 3, 1936dodo
.Feb. 10, 1936June 25, 1936.Mar. 30, 1938.Mar. 14, 1942.Apr. 4, 1946.Feb. 14, 1947.Apr. 15, 1948.Sept. 1, 1950
do.April 2, 1951
A.L. Mills, Jr San Francisco ,J.L. Robertson Kansas City....C. Canby Balderston PhiladelphiaPaul E. Miller Minneapolis....Chas. N. Shepardson DallasG.H. King, Jr Atlanta
.Feb. 18, 1952do
.Aug. 12, 1954
.Aug. 13, 1954
.Mar. 17, 1955
.Mar. 25, 1959
George W. Mitchell Chicago Aug. 31, 1961
Reappointed in 1916 and 1926. Served untilFeb. 3, 1936.3
Term expired Aug. 9, 1918.Resigned July 21, 1918.Term expired Aug. 9, 1922.Reappointed in 1924. Reappointed in 1934
from the Richmond District. Served untilFeb. 3, 1936.3
Resigned Mar. 15, 1920.Term expired Aug. 9, 1920.Reappointed in 1928. Resigned
Sept. 14, 1930.Term expired Mar. 4, 1921.Resigned May 12, 1923.Died Mar. 22, 1923.Resigned Sept. 15, 1927.Reappointed in 1931. Served until
Feb. 3, 1936."Died Nov. 28, 1930.Resigned Aug. 31, 1930.Resigned May 10, 1933.Term expired Jan. 24, 1933.Resigned Aug. 15, 1934.Reappointed in 1936 and 1948. Resigned
May 31, 1961.Served until Feb. 10, 1936.3Reappointed in 1936, 1940, and 1944.
Resigned July 14, 1951.Resigned Sept. 30, 1937.Served until Apr. 4, 1946.3Reappointed in 1942. Died Dec. 2, 1947.Resigned July 9, 1936.Reappointed in 1940. Resigned Apr. 15, 1941.Served until Sept. 1, 1950.3Served until Aug. 13, 1954.3Resigned Nov. 30, 1958.Died Dec. 4, 1949.Resigned Mar. 31, 1951.Resigned Jan. 31, 1952.Resigned June 30, 1952.Reappointed in 1956. Term expired
Jan. 31, 1970.Reappointed in 1958. Resigned Feb. 28, 1965.Reappointed in 1964. Resigned Apr. 30, 1973.Served through Feb. 28, 1966.Died Oct. 21, 1954.Retired Apr. 30, 1967.Reappointed in 1960. Resigned
Sept. 18, 1963.Reappointed in 1962. Served until
Feb. 13, 1976.3

631
Name Federal ReserveDistrict
Date of initialoath of office
Other dates and information relatingto membership2
J. Dewey Daane Richmond Nov. 29, 1963Sherman J. Maisel San Francisco Apr. 30, 1965Andrew F. Brimmer Philadelphia Mar. 9, 1966William W. Sherrill Dallas May 1, 1967Arthur F. Burns New York Jan. 31, 1970
John E. Sheehan St. Louis Jan. 4, 1972Jeffrey M. Bucher San Francisco June 5, 1972Robert C. Holland Kansas City June 11, 1973Henry C. Wallich Boston Mar. 8, 1974Philip E. Coldwell Dallas Oct. 29, 1974Philip C. Jackson, Jr Atlanta July 14, 1975J. Charles Partee Richmond Jan. 5, 1976Stephen S. Gardner Philadelphia Feb. 13, 1976David M. Lilly Minneapolis June 1, 1976G. William Miller San Francisco Mar. 8, 1978Nancy H. Teeters Chicago Sept. 18, 1978Emmett J. Rice New York June 20, 1979Frederick H. Schultz Atlanta July 27, 1979Paul A. Volcker Philadelphia Aug. 6, 1979Lyle E. Gramley Kansas City May 28, 1980Preston Martin San Francisco Mar. 31, 1982Martha R. Seger Chicago July 2, 1984Wayne D. Angell Kansas City Feb. 7, 1986Manuel H. Johnson Richmond Feb. 7, 1986H. Robert Heller San Francisco Aug. 19, 1986Edward W. Kelley, Jr Dallas May 26, 1987Alan Greenspan New York Aug. 11, 1987John P. LaWare Boston Aug. 15, 1988
Served until Mar. 8, 1974.3Served through May 31, 1972.Resigned Aug. 31, 1974.Reappointed in 1968. Resigned Nov. 15, 1971.Term began Feb. 1, 1970. Resigned
Mar. 31, 1978.Resigned June 1, 1975.Resigned Jan. 2, 1976.Resigned May 15, 1976.Resigned Dec. 15, 1986.Served through Feb. 29, 1980.Resigned Nov. 17, 1978.Served until Feb. 7, 1986.3Died Nov. 19, 1978Resigned Feb. 24, 1978.Resigned Aug. 6, 1979.Served through June 27, 1984.Resigned Dec. 31, 1986.Served through Feb. 11, 1982.Resigned August 11, 1987.Resigned Sept. 1, 1985.Resigned April 30, 1986.
Chairmen4
Charles S. Hamlin Aug.W.P.G. Harding Aug.Daniel R. Crissinger MayRoy A. Young Oct.Eugene Meyer Sept.Eugene R. Black MayMarriner S. Eccles Nov.Thomas B. McCabe Apr.Wm. McC. Martin, Jr. ..Apr.Arthur F. Burns Feb.G. William Miller Mar.Paul A. Volcker Aug.Alan Greenspan Aug.
10, 1914-Aug. 9, 191610, 1916-Aug. 9, 19221, 1923-Sept. 15, 19274, 1927-Aug. 31, 1930
16, 1930-May 10, 193319, 1933-Aug. 15, 193415, 1934-Jan. 31, 1948
15, 1948-Mar. 31, 19512, 1951-Jan. 31, 19701, 1970-Jan. 31, 19788, 1978-Aug. 6, 19796, 1979-Aug 11, 198711, 1987-
Vice Chairmen4
Frederic A. Delano Aug.Paul M. Warburg Aug.Albert Strauss Oct.Edmund Platt JulyJ.J. Thomas Aug.Ronald Ransom Aug.C. Canby Balderston Mar.J.L. Robertson Mar.George W. Mitchell MayStephen S. Gardner Feb.Frederick H. Schultz JulyPreston Martin Mar.Manuel H. Johnson Aug.
10, 1914-Aug. 9, 191610, 1916-Aug. 9, 191826, 1918-Mar. 15, 192023, 1920-Sept. 14, 193021, 1934-Feb. 10, 19366, 1936-Dec. 2, 194711, 1955-Feb. 28, 19661, 1966-Apr. 30, 19731, 1973-Feb. 13, 197613, 1976-Nov. 19, 197827, 1979-Feb. 11, 198231, 1982-Mar. 31, 198622, 1986-
EX-OFFICIO MEMBERS'
Secretaries of the TreasuryW.G. McAdoo Dec. 23, 1913-Dec. 15, 1918Carter Glass Dec. 16, 1918-Feb. 1, 1920David F. Houston Feb. 2, 1920-Mar. 3, 1921Andrew W. Mellon .Mar. 4, 1921-Feb. 12, 1932Ogden L. Mills Feb. 12, 1932-Mar. 4, 1933William H. Woodin Mar. 4, 1933-Dec. 31, 1933Henry Morgenthau, Jr. Jan. 1, 1934-Feb. 1, 1936
1. Under the provisions of the original Federal Reserve Act, theFederal Reserve Board was composed of seven members, includingfive appointive members, the Secretary of the Treasury, who wasex-omcio chairman of the Board, and the Comptroller of theCurrency. The original term of office was ten years, and the fiveoriginal appointive members had terms of two, four, six, eight, andten years respectively. In 1922 the number of appointive memberswas increased to six, and in 1933 the term of office was increased totwelve years. The Banking Act of 1935, approved Aug. 23, 1935,changed the name of the Federal Reserve Board to the Board ofGovernors of the Federal Reserve System and provided that theBoard should be composed of seven appointive members; that the
Comptrollers of the CurrencyJohn Skelton Williams ...Feb. 2, 1914-Mar. 2, 1921Daniel R. Crissinger Mar. 17, 1921-Apr. 30, 1923Henry M. Dawes May 1, 1923-Dec. 17, 1924Joseph W. Mclntosh Dec. 20, 1924-Nov. 20, 1928J.W. Pole Nov. 21, 1928-Sept. 20, 1932J.F.T. O'Connor May 11, 1933-Feb. 1, 1936
Secretary of the Treasury and the Comptroller of the Currencyshould continue to serve as members until Feb. 1, 1936, or untiltheir successors were appointed and had qualified; and thatthereafter the terms of members should be fourteen years and thatthe designation of Chairman and Vice Chairman of the board shouldbe for a term of four years.
2. Date after words "Resigned" and "Retired" denotes final dayof service.
3. Successor took office on this date.4. Chairman and Vice Chairman were designated Governor and
Vice Governor before Aug 23, 1935.

Al
Financial and Business Statistics
CONTENTS
Domestic Financial Statistics
MONEY STOCK AND BANK CREDIT
A3 Reserves, money stock, liquid assets, and debtmeasures
A4 Reserves of depository institutions, ReserveBank credit
A5 Reserves and borrowings—Depositoryinstitutions
A6 Selected borrowings in immediately availablefunds—Large member banks
POLICY INSTRUMENTS
A7 Federal Reserve Bank interest ratesA8 Reserve requirements of depository institutionsA9 Federal Reserve open market transactions
FEDERAL RESERVE BANKS
A10 Condition and Federal Reserve note statementsAll Maturity distribution of loan and security
holdings
MONETARY AND CREDIT AGGREGATES
A12 Aggregate reserves of depository institutionsand monetary base
A13 Money stock, liquid assets, and debt measuresA1S Bank debits and deposit turnoverA16 Loans and securities—All commercial banks
COMMERCIAL BANKING INSTITUTIONS
A17 Major nondeposit fundsA18 Assets and liabilities, last-Wednesday-of-month
series
WEEKLY REPORTING COMMERCIAL BANKS
Assets and liabilitiesA19 All reporting banksA20 Banks in New York CityA21 Branches and agencies of foreign banksA22 Gross demand deposits—individuals,
partnerships, and corporations
FINANCIAL MARKETS
A23 Commercial paper and bankers dollaracceptances outstanding
A23 Prime rate charged by banks on short-termbusiness loans
A24 Interest rates—money and capital marketsA25 Stock market—Selected statisticsA26 Selected financial institutions—Selected assets
and liabilities
FEDERAL FINANCE
A28 Federal fiscal and financing operationsA29 U.S. budget receipts and outlaysA30 Federal debt subject to statutory limitationA30 Gross public debt of U.S. Treasury—Types
and ownershipA31 U.S. government securities dealers—
TransactionsA32 U.S. government securities dealers—Positions
and financingA33 Federal and federally sponsored credit
agencies—Debt outstanding
SECURITIES MARKETS ANDCORPORATE FINANCE
A34 New security issues—State and localgovernments and corporations
A35 Open-end investment companies—Net salesand asset position
A35 Corporate profits and their distribution
A2 Federal Reserve Bulletin • September 1988
A36 Total nonfarm business expenditures on newplant and equipment
A37 Domestic finance companies—Assets andliabilities and business credit
A55 Foreign branches of U.S. banks—Balancesheet data
AS7 Selected U.S. liabilities to foreign officialinstitutions
REAL ESTATE
A38 Mortgage marketsA39 Mortgage debt outstanding
CONSUMER INSTALLMENT CREDIT
A40 Total outstanding and net changeA41 Terms
REPORTED BY BANKS IN THE UNITED STATES
AS7 Liabilities to and claims on foreignersAS8 Liabilities to foreignersA60 Banks' own claims on foreignersA61 Banks' own and domestic customers' claims on
foreignersA61 Banks' own claims on unaffiliated foreignersA62 Claims on foreign countries—Combined
domestic offices and foreign branches
FLOW OF FUNDS
A42 Funds raised in U.S. credit marketsA43 Direct and indirect sources of funds to credit
markets
REPORTED BY NONBANKING BUSINESSENTERPRISES IN THE UNITED STATES
A63 Liabilities to unaffiliated foreignersA64 Claims on unaffiliated foreigners
Domestic Nonfinancial Statistics
SELECTED MEASURES
A44 Nonfinancial business activity—Selectedmeasures
A45 Labor force, employment, and unemploymentA46 Output, capacity, and capacity utilizationA47 Industrial production—Indexes and gross valueA49 Housing and constructionA50 Consumer and producer pricesA51 Gross national product and incomeA52 Personal income and saving
International Statistics
SECURITIES HOLDINGS AND TRANSACTIONS
A65 Foreign transactions in securitiesA66 Marketable U.S. Treasury bonds and notes—
Foreign transactions
INTEREST AND EXCHANGE RATES
A67 Discount rates of foreign central banksA67 Foreign short-term interest ratesA68 Foreign exchange rates
A69 Guide to Tabular Presentation,Statistical Releases and SpecialTables
SUMMARY STATISTICS
A53 U.S. international transactions—SummaryA54 U.S. foreign tradeA54 U.S. reserve assetsA54 Foreign official assets held at Federal Reserve
Banks
SPECIAL TABLES
A70 Terms of lending at commercial banks,May 2-6, 1988
A76 Terms of lending at commercial banks,November 2-6, 1987
A82 Assets and liabilities, U.S. branches andagencies of foreign banks, March 31, 1988

Money Stock and Bank Credit A3
1.10 RESERVES, MONEY STOCK, LIQUID ASSETS, AND DEBT MEASURES
Hem
Monetary and credit aggregates(annual rates of change, seasonally adjusted in percent)
1987
Q3 Q4
1988
Ql Q2
1988
Feb. Mar. Apr. May' June
Reserves of depository institutions1
1 Total2 Required3 Nonborrowed,,4 Monetary base
Concepts of money, liquid assets, and debt*5 Ml6 M27 M38 L9 Debt
Sontrgnsaction components10 I n M 2 * . . . .11 In M3 only*
Time and savings depositsCommercial banks
12 Savings 413 Small-denomination time"14 Large-denomination time'1'"
Thrift institutions15 Savings'16 Small-denomination time17 Large-denomination time"
Debt components*18 Federal19 Nonfederal20 Total loans and securities at commercial banks"
- . 9.3.3
5.1
.82.84.54.37.9
3.611.0
10.17.46.8
7.09.39.9
5.88.56.2
2.51.42.47.8
3.93.95.45.7'
10.1
3.911.3
.714.810.5
-3.816.022.2
7.610.9'5.5
3.52.91.58.3
3.8'6.77.0'6.5'8.3'
7.8'
6.313.73.4'
-2.421.315.7
9.3s.v5.1
5.87.2
-6.57.6
6.27.97.1
n.a.8.4
8.54.2
11.011.77.4
6.814.28.5
8.28.5
10.8
2.35.7
16.56.0
1.18.7'
10.6'8.6'7.9'
11.218.3'
13.417.617.2'
- . 525.016.2
11.26 ^9.3
3.88.0
-23.75.9
5.58.88.1'7.3'8.7'
9.95.4'
14.611.65.5'
7.118.01.5
15.26.8'7.9
12.313.9
-13.011.4
11.29.8'7.2
11.5'8.3'
9.4'-2.5'
6.5'15.1
-2 .2 '
10.113.8'15.3
7.18.7'
11.4
- . 2-3.8
8.55.0
.04.94.47.78.0
6.52.8
11.76.3
11.8
3.510.76.5
2.79.7
13.0
5.48.7
-4 .86.3
9.85.76.6
n.a.n.a.
4.210.2
12.96.2
21.9
10.03.0
-1 .4
n.a.n.a.11.1
1. Unless otherwise noted, rates of change are calculated from averageamounts outstanding in preceding month or quarter.
2. Figures incorporate adjustments for discontinuities associated with theimplementation of the Monetary Control Act and other regulatory changes toreserve requirements. To adjust for discontinuities due to changes in reserverequirements on reservable nondeposit liabilities, the sum of such requiredreserves is subtracted from the actual series. Similarly, in adjusting for discon-tinuities in the monetary base, required clearing balances and adjustments tocompensate for float also are subtracted from the actual series.
3. The monetary base not adjusted for discontinuities consists of total
d l R B k l h t f th tk lat Federal Reserve Banks plus the currency component of the money stock lessthe amount of vault cash holdings of thrift institutions that is included in thecurrency component of the money stock plus, for institutions not having requiredreserve balances, the excess of current vault cash over the amount applied tosatisfy current reserve requirements. After the introduction of contemporaneousreserve requirements (CRR), currency and vault cash figures are measured overthe weekly computation period ending Monday.
Before CRR, all components of the monetary base other than excess reservesare seasonally adjusted as a whole, rather than by component, and excessreserves are added on a not seasonally adjusted basis. After CRR, the seasonallyadjusted series consists of seasonally adjusted total reserves, which includeexcess reserves on a not seasonally adjusted basis, plus the seasonally adjustedcurrency component of the money stock plus the remaining items seasonallyadjusted as a whole.
4. Composition of the money stock measures and debt is as follows:Ml: (1) currency outside the Treasury, Federal Reserve Banks, and the vaults
of depository institutions; (2) travelers checks of nonbank issuers; (3) demanddeposits at all commercial banks other than those due to depository institutions,the U.S. government, and foreign banks and official institutions less cash items inthe process of collection and Federal Reserve float; and (4) other checkabledeposits (OCD) consisting of negotiable order of withdrawal (NOW) and auto-matic transfer service (ATS) accounts at depository institutions, credit unionshare draft accounts, and demand deposits at thrift institutions.
M2; Ml plus overnight (and continuing contract) repurchase agreements (RPs)issued by all commercial banks and overnight Eurodollars issued to U.S. residentsby foreign branches of U.S. banks worldwide, Money Market Deposit Accounts(MMDAs), savings and small-denomination time deposits (time deposits—includ-ing retail RPs—in amounts of less than $100,000), and balances in both taxable andtax-exempt general purpose and broker-dealer money market mutual funds.Excludes individual retirement accounts (IRA) and Keogh balances at depository
institutions and money market funds. Also excludes all balances held by U.S.commercial banks, money market funds (general purpose and broker-dealer),foreign governments and commercial banks, and the U.S. government.
M3: M2 plus large-denomination time deposits and term RP liabilities (inamounts of $100,000 or more) issued by commercial banks and thrift institutions,term Eurodollars held by U.S. residents at foreign branches of U.S. banksworldwide and at all banking offices in the United Kingdom and Canada, andbalances in both taxable and tax-exempt, institution-only money market mutualfunds. Excludes amounts held by depository institutions, the U.S. government,money market funds, and foreign banks and official institutions. Also subtractedis the estimated amount of overnight RPs and Eurodollars held by institution-onlymoney market mutual funds.
L: M3 plus the nonbank public holdings of U.S. savings bonds, short-termTreasury securities, commercial paper and bankers acceptances, net of moneymarket mutual fund holdings of these assets.
Debt: Debt of domestic nonflnancial sectors consists of outstanding creditmarket debt of the U.S. government, state and local governments, and privatenonflnancial sectors. Private debt consists of corporate bonds, mortgages, con-sumer credit (including bank loans), other bank loans, commercial paper, bankersacceptances, and other debt instruments. The source of data on domesticnonflnancial debt is the Federal Reserve Board's flow of funds accounts. Debtdata are based on monthly averages. Growth rates for debt reflect adjustments fordiscontinuities over time in the levels of debt presented in other tables.
5. Sum of overnight RPs and Eurodollars, money market fund balances(general purpose ana broker-dealer), MMDAs, and savings and small timedeposits less the estimated amount of demand deposits and vault cash held bythrift institutions to service their time and savings deposit liabilities.
6. Sum of large time deposits, term RPs, and Eurodollars of U.S. residents,money market fund balances (institution-only), less a consolidation adjustmentthat represents the estimated amount of overnight RPs and Eurodollars held byinstitution-only money market mutual funds.
7. Excludes MMDAs.8. Small-denomination time deposits—Including retail RPs—are those issued
in amounts of less than $100,000. All IRA and Keogh accounts at commercialbanks and thrifts are subtracted from small time deposits.
9. Large-denomination time deposits are those issued in amounts of $100,000or more, excluding those booked at international banking facilities.
10. Large-denomination time deposits at commercial banks less those held bymoney market mutual funds, depository institutions, and foreign banks andofficial institutions.
11. Changes calculated from figures shown in table 1.23.
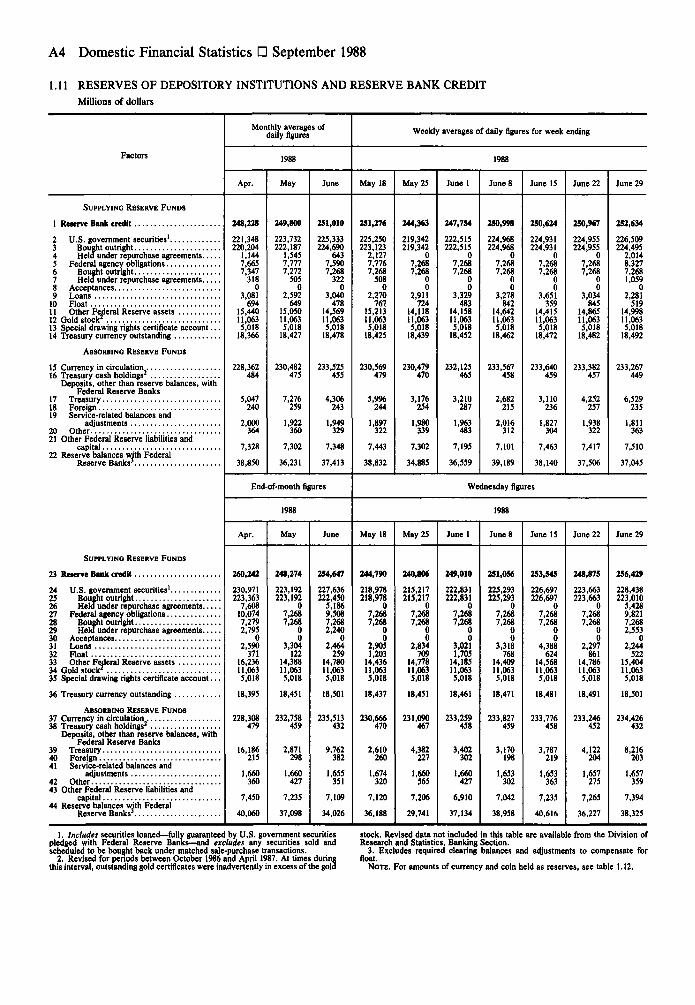
A4 Domestic Financial Statistics • September 1988
1.11 RESERVES OF DEPOSITORY INSTITUTIONS AND RESERVE BANK CREDITMillions of dollars
Factors
Monthly averages ofdaily figures
1988
Apr. May June
Weekly averages of daily figures for week ending
May 18 May 25 June 1 June 8 June 15 June 22 June 29
SUPPLYING RESERVE FUNDS
1 Reserve Bank credit
2 U.S. government securities'3 Bought outright4 Held under repurchase agreements5 Federal agency obligations6 Bought outright7 Held under repurchase agreements8 Acceptances9 Loans
10 Float11 Other Federal Reserve assets12 Gold stock1
13 Special drawing rights certificate account..14 Treasury currency outstanding
ABSORBING RESERVE FUNDS
15 Currency in circulation.16 Treasury cash holdings2
Deposits, other than reserve balances, withFederal Reserve Banks
17 Treasury18 Foreign19 Service-related balances and
adjustments20 Other21 Other Federal Reserve liabilities and
capital22 Reserve balances with Federal
Reserve Banks3
248,228
221,348220,204
1,1447,6657,347
3180
3,081694
15,44011,0635,018
18,366
228,362484
5,047240
2,000364
7,328
38,850
249,800
223,732222,187
1,5457,7777,272
5050
2,592649
15,05011,0635,018
18,427
230,482475
7,276259
1,922360
7,302
36,231
251,010
225,333224,690
6437,5907,268
3220
3,040478
14,56911,0635,018
18,478
233,525455
4,306243
1,949329
7,348
37,413
251,276
225,250223,123
2,1277,7767,268
5080
2,270767
15,21311,0635,018
18,425
230,569479
5,996244
1,897322
7,443
38,832
244,363
219,342219,342
07,2687,268
00
2,911724
14,11811,0635,018
18,439
230,479470
3,176254
1,980339
7,302
34,885
247,754
222,515222,515
07,2687,268
00
3,329483
14,15811,0635,018
18,452
232,125465
3,210287
1,963483
7,195
36,559
250,998
224,968224,968
07,2687,268
00
3,278842
14,64211,0635,018
18,462
233,567458
2,682215
2,016312
7,101
39,189
250,624
224,931224,931
07,2687,268
00
3,651359
14,41511,0635,018
18,472
233,640459
3,110236
1,827304
7,463
38,140
250,967
224,955224,955
07,2687,268
00
3,034845
14,86511,0635,018
18,482
233,382457
4,252257
1,938
322
7,417
37,506
End-of-month figures Wednesday figures
1988 1988
Apr.
SUPPLYINO RESERVE FUNDS
23 Reserve Bank credit
24 U.S. government securities1
25 Bought outright26 Held under repurchase agreements27 Federal agency obligations28 Bought outright29 Held under repurchase agreements30 Acceptances31 Loans32 Float33 Other Federal Reserve assets34 Gold stock r
35 Special drawing rights certificate account..
36 Treasury currency outstanding
ABSORBING RESERVE FUNDS37 Currency in circulation38 Treasury cash holdings2
Deposits, other than reserve balances, withFederal Reserve Banks
39 Treasury40 Foreign41 Service-related balances and
adjustments42 Other43 Other Federal Reserve liabilities and
capital44 Reserve balances with Federal
Reserve Banks3
260,242
230,971223,363
7,60810,0747,2792,795
02,590
37116,23611,0635,018
18,395
228,308479
16,186215
1,660360
7,450
40,060
May
248,274
223,192223,192
07,2687,268
00
3,304122
14,38811,0635,018
18,451
232,758459
2,871298
1,660
427
7,235
37,098
June May 18
254,647
227,636222,450
5,1869,5087,2682,240
02,464
25914,78011,0635,018
18,501
235,513432
9,762382
1,655351
7,109
34,026
244,790
218,978218,978
07,2687,268
00
2,9051,203
14,43611,0635,018
18,437
230,666470
2,610260
1,674320
7,120
36,188
May 25
240,806
215,217215,217
07,2687,268
00
2,834709
14,77811,0635,018
18,451
231,090467
4,382227
1,660565
7,206
29,741
June 1
249,010
222,831222,831
07,2687,268
00
3,0211,705
14,18511,0635.018
18,461
233,259458
3,402302
1,660427
6,910
37,134
June 8 June 15
251,056
225,293225,293
07,2687,268
00
3,318768
14,40911,0635,018
18,471
233,827459
3,170198
1,653302
7,042
38,958
253,545
226,697226,697
07,2687,268
00
4,388624
14,56811,0635,018
18,481
233,776458
3,787219
1,653363
7,235
40,616
June 22
248,875
223,663223,663
07,2687,268
00
2,297861
14,78611,0635,018
18,491
233,246452
4,122204
1,657
275
7,265
36,227
252,634
226,509224,495
2,0148,3277,2681,059
02,281
51914,99811,0635,018
18,492
233,267449
6,529235
1,811363
7,510
37,045
June 29
256,429
228,438223,010
5,4289,8217,2682,553
02,244
52215,40411,0635,018
18,501
234,426432
8,216203
1,657359
7,394
38,325
1. Includes securities loaned—fully guaranteed by U.S. government securitiespledged with Federal Reserve Banks—and excludes any securities sold andscheduled to be bought back under matched sale-purchase transactions.
2. Revised for periods between October 1986 and April 1987. At times duringthis interval, outstanding gold certificates were inadvertently in excess of the gold
stock. Revised data not included in this table are available from the Division ofResearch and Statistics, Banking Section.
3. Excludes required clearing balances and adjustments to compensate forfloat.
NOTE. For amounts of currency and coin held as reserves, see table 1.12.

Money Stock and Bank Credit A5
1.12 RESERVES AND BORROWINGS Depository Institutions1
Millions of dollars
Reserve classification
Monthly averages9
1985
Dec.
1986
Dec.
1987
Dec.
1987
Nov. Dec. Jan. Feb. Mar. Apr. May
1 Reserve balances with Reserve Banks1
2 Total vault cash*3 Vault*..4 Surplus5... k5 Total reserves6
6 Required reserves i7 Excess reserve balances at Reserve Banks'8 Total borrowings at Reserve Banks9 Seasonal borrowings at Reserve Banks
10 Extended credit at Reserve Banks8
27,62022,95320,5222,431
48,14247,085
1,0581,318
56499
37,36024,07922,199
1,87959,56058,191
1,36982738
303
37,67326,15524,449
1,70662,12361,094
93483
37,45325,43123,752
1,67961,20560,282
923625126394
37,67326,15524,449
1,70662,12361,094
1,02977793
483
37,48526,91925,155
1,76462,64061,345
1,2951,082
59372
34,21128,11925,836
2,28360,04758,914
1,1333%75
205
36,02725,92624,049
1,87760,07659,147
9291,752
1191,478
38,42925,20023,636
1,56462,06461,205
8592,993
1462,624
Biweekly averages of daily figures for weeks ending
1988
Mar. 9
11 Reserve balances with Reserve Banks2
12 Total vault cash'13 Vault*14 Surplus'.15 Total reserves'16 Required reserves i17 Excess reserve balances at Reserve Banks'18 Total borrowings at Reserve Banks19 Seasonal borrowings at Reserve Banks20 Extended credit at Reserve Banks"
35,57525,98723,998
1,98959,57358,607
966537111255
Mar. 23 Apr. 6
35,76126,22424,332
1,89260,09359,182
9111,924
1231,685
37,00325,33623,610
1,72660,61359,696
9172,817
1222,494
Apr. 20
39,12325,20523,709
1,49762,83162,145
6863,619
1243,278
May 4
38,31325,11223,549
1,56361,86260,796
1,0672,224
1911,787
May 18
36,73725,72624,122
1,60460,85959,959
9012,175
2411,798
June 1
35,70726,26524,418
1,84760,12558,943'
l,182r
3,120269
2,538
June 15'
38,64425,11823,614
1,50462,25861,563
6963,465
2872,986
June 29
37,26026,23724,492
1,74561,75260,692
1,0602,658
3372,138
36,50925,87324,172
1,70060,68159,641
1,0402,578
2462,107
July 13
38,82126,27024,628
1,64263,44962,575
8743,656
3522,340
1. These data also appear in the Board's H.3 (502) release. For address, see in-side front cover.
2. Excludes required clearing balances and adjustments to compensate forfloat.
3. Dates refer to the maintenance periods in which the vault cash can be usedto satisfy reserve requirements. Under contemporaneous reserve requirements,maintenance periods end 30 days after the lagged computation periods in whichthe balances are held.
4. Equal to all vault cash held during the lagged computation period byinstitutions having required reserve balances at Federal Reserve Banks plus theamount of vault cash equal to required reserves during the maintenance period atinstitutions having no required reserve balances.
5. Total vault cash at institutions having no required reserve balances less theamount of vault cash equal to their required reserves during the maintenanceperiod.
6. Total reserves not adjusted for discontinuities consist of reserve balances
with Federal Reserve Banks, which exclude required clearing balances andadjustments to compensate for float, plus vault cash used to satisfy reserverequirements. Such vault cash consists of all vault cash held during the laggedcomputation period by institutions having required reserve balances at FederalReserve Banks plus the amount of vault cash equal to required reserves during themaintenance period at institutions having no required reserve balances.
7. Reserve balances with Federal Reserve Banks plus vault cash used to satisfyreserve requirements less required reserves.
8. Extended credit consists of borrowing at the discount window under theterms and conditions established for the extended credit program to helpdepository institutions deal with sustained liquidity pressures. Because there isnot the same need to repay such borrowing promptly as there is with traditionalshort-term adjustment credit, the money market impact of extended credit issimilar to that of nonborrowed reserves.
9. Data are prorated monthly averages of biweekly averages.

A6 Domestic Financial Statistics • September 1988
1.13 SELECTED BORROWINGS IN IMMEDIATELY AVAILABLE FUNDS Large Member Banks1
Averages of daily figures, in millions of dollars
Maturity and source1987 week ending Monday
Nov. 23 Nov. 30 Dec. 7 Dec. 14 Dec. 21 Dec. 28 Jan. 4 Jan. 11 Jan. 18
Federal funds purchased, repurchase agreements, andother selected borrowing in immediately availablefunds
From commercial banks in the United States1 For one day or under continuing contract2 For all other maturities
From other depository institutions, foreign banks andforeign official institutions, and U.S. governmentagencies
3 For one day or under continuing contract4 For all other maturities
Repurchase agreements on U.S. government and federalagency securities In immediately available funds
Brokers and nonbank dealere in securities5 For one day or under continuing contract6 For all other maturities
All other customers7 For one day or under continuing contract8 For all other maturities
MEMO: Federal funds loans and resale agreements inimmediately available funds in maturities of one dayor under continuing contract
9 To commercial banks in the United States10 To all other specified customers2
70,72510,190
26,2657,762
13,97212,622
27,8409,662
29,89512,211
70,17411,547
24,6798,848
13,13613,982
24,07113,855
32,95211,190
75,6389,694
29,9307,160
13,38813,240
27,0779,972
31,27611,795
75,7749,608
27,2767,468
14,05213,274
27,0939,942
30,47211,027
70,8568,953
24,7256,968
14,74112,119
24,8879,886
31,14711,062
67,5369,409
22,8607,191
12,17012,603
24,51212,018
30,35210,326
75,0908,611
23,6026,886
15,7818,110
25,7939,675
34,04110,793
75,1889,297
28,2545,920
14,66010,653
27,6739,984
35,78312,665
70,8709,300
29,9545,897
14,42712,060
27,3279,420
35,35612,541
1. Banks with assets of $1 billion or more as of Dec. 31,1977.These data also appear in the Board's H.5 (507) release. For address, see inside
front cover.
2. Brokers and nonbank dealers in securities; other depository institutions;foreign banks and official institutions; and United States government agencies.

Policy Instruments A7
1.14 FEDERAL RESERVE BANK INTEREST RATES
Percent per year
Current and previous levels
Federal ReserveBank
New YorkPhiladelphiaClevelandRichmond
MinneapolisKansas CityDallas .San Francisco. . .
Adjustment credit
Seasonal credit1
On7/27/88
6
6
Effectivedate
9/9/879/4/879/4/879/4/879/5/879/4/87
9/4/879/9/879/8/879/4/87
9/11/879/9/87
Previousrate
SVi
514
Extended credit2
First 30 days of borrowing
On7/27/88
6
6
Effectivedate
9/9/879/4/879/4/879/4/879/5/879/4/87
9/4/879/9/879(8/879/4/87
9/11/879/9/87
Previousrate
514
514
After 30 days of borrowing3
On7/27/88
8.25
8.25
Effectivedate
7/14/887/14/887/14/887/14/887/14/887/14/88
7/14/887/14/887/14/887/14/887/14/887/14/88
Previousrate
8.05
8.05
Effective date
6/30/886/30/886/30/886/30/886/30/886/30/88
6/30/886/30/886/30/886/30/886/30/886/30/88
Range of rates for adjustment credit in recent years4
Effective date
In effect Dec. 31, 19771978—Jan. 9
20May 11
12July 3
10Aug. 21Sept. 22Oct. 16
20Nov. 1
3
1979-July 20
A u g 2 o 7 : : : : : : : : : : : : : :
T:::::::::::::Oct. 8
10
1980—Feb. 1519
May 2930
June 1316
Range (orlevel)—A11F.R.Banks
66-6M
614614-7
77-7V4
7147V*
88-814
814814-9V5
914
1010-IQV2
10141014-11
111M2
12
12-1313
12-1312
11-1211
F.R.Bank
ofN.Y.
66W614777V*IV*7V48814814914Wi
1010W101411111212
131313121111
Effective date
1980—July 2829
Sept. 26Nov. 17Dec. 5
1981 May 5
Nov. 26
Dec. 4
1982—July 20
Aug. 2
162730
Oct. 1213
Nov. 2226
Dec. 141517
Range (orlevel)—All F.R.
Banks
10-11101112
12-13
13-1414
13-141312
11VS-121114
11-11W11
101410-1014
10914-10
9Vi9-9 Vi
9814-9814-9
814
F.R.Bank
ofN.Y.
1010111213
1414131312
11141114111110V410109H914999814814
Effective date
1984—Apr. 9
Nov. 2126
Dec. 24
1985—May 2024
1986—Mar. 710
Apr. 21July 11A u 8 - 2 i : : : : : : : : : : : : : :
1987—Sept. 411
In effect July 27,1988
Range(orlevel)—A11F.R.Banks
8VS-99
8H-9814
8
7V4-8714
7-714
614-76
514-6514
514-66
6
F.R.Bank
ofN.Y.
998148148
7V4714
776146514514
66
6
1. Adjustment credit is available on a short-term basis to help depositoryinstitutions meet temporary needs for funds that cannot be met through reason-able alternative sources. After May 19,1986, the highest rate established for loansto depository institutions may be charged on adjustment credit loans of unusualsize that result from a major operating problem at the borrower's facility.
Seasonal credit is available to help smaller depository institutions meet regular,seasonal needs for funds that cannot be met through special industry lenders andthat arise from a combination of expected patterns of movement in their depositsand loans. A temporary simplified seasonal program was established on Mar. 8,1985, and the interest rate was a fixed rate 14 percent above the rate on adjustmentcredit. The program was reestablished on Feb. 18, 1986 and again on Jan. 28,1987; the rate may be either the same as that for adjustment credit or a fixed rateW percent higher.
2. Extended credit is available to depository institutions, where similar assist-ance is not reasonably available from other sources, when exceptional circum-stances or practices involve only a particular institution or when an institution isexperiencing difficulties adjusting to changing market conditions over a longerperiod of time.
3. For extended-credit loans outstanding more than 30 days, a flexible rate
somewhat above rates on market sources of funds ordinarily will be charged, butin no case will the rate charged be less than the basic discount rate plus 50 basispoints. The flexible rate is reestablished on the first business day of eachtwo-week reserve maintenance period. At the discretion of the Federal ReserveBank, the time period for which the basic discount rate is applied may beshortened.
4. For earlier data, see the following publications of the Board of Governors:Banking and Monetary Statistics, 1914-1941, and 1941-1970; Annual StatisticalDigest, 1970-1979,
In 1980 and 1981, the Federal Reserve applied a surcharge to short-termadjustment credit borrowings by institutions with deposits of $500 million or morethat had borrowed in successive weeks or in more than 4 weeks in a calendarquarter. A 3 percent surcharge was in effect from Mar. 17, 1980 through May 7,1980. There was no surcharge until Nov. 17,1980, when a 2 percent surcharge wasadopted; the surcharge was subsequently raised to 3 percent on Dec. 5,1980, andto 4 percent on May 5, 1981. The surcharge was reduced to 3 percent effectiveSept. 22, 1981, and to 2 percent effective Oct. 12, 1981. As of Oct. 1, 1981 theformula for applying the surcharge was changed from a calendar quarter to amoving 13-week period. The surcharge was eliminated on Nov. 17, 1981.
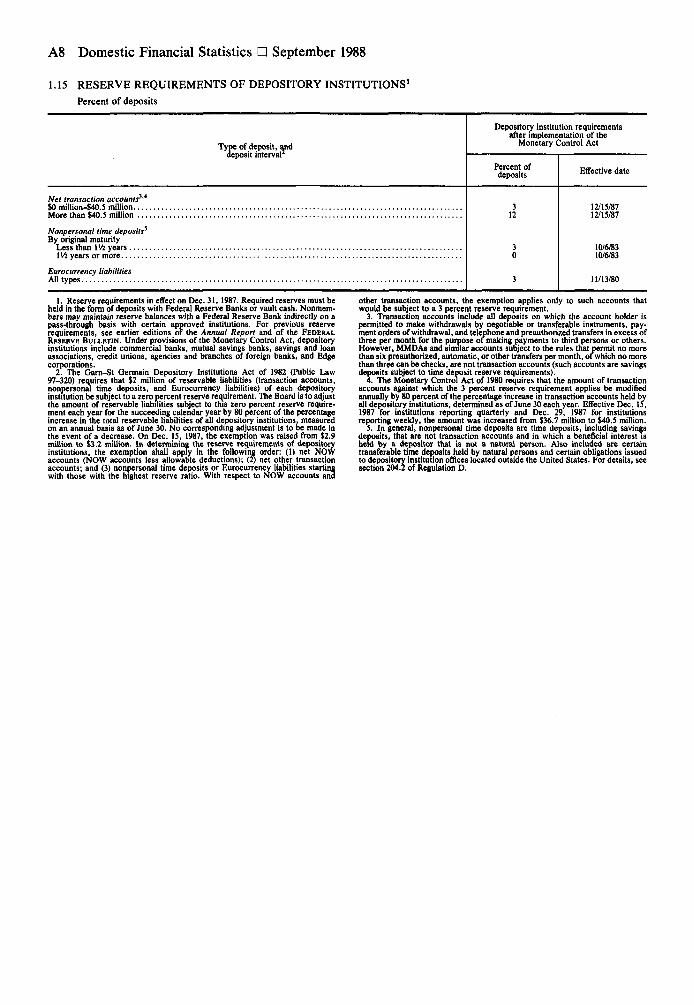
A8 Domestic Financial Statistics • September 1988
1.15 RESERVE REQUIREMENTS OF DEPOSITORY INSTITUTIONS'
Percent of deposits
Type of deposit, anddeposit interval
Depository institution requirementsafter implementation of the
Monetary Control Act
Effective date
Set transaction accounts1'*$0miHion-$40.5 million.. . .More than $40.5 million . . .
Nonpersonal time deposits*By original maturity
Less than Wi yearst Vi years or more
Eurocurrency liabilitiesAll types
12/15/8712/15/87
10/6/8310/6/83
11/13/80
1. Reserve requirements in effect on Dec. 31, 1987. Required reserves must beheld in the form of deposits with Federal Reserve Banks or vault cash. Nonmem-bers may maintain reserve balances with a Federal Reserve Bank indirectly on apass-through basis with certain approved institutions. For previous reserverequirements, see earlier editions of the Annual Report and of the FEDERALRESERVE BULLETIN. Under provisions of the Monetary Control Act, depositoryinstitutions include commercial banks, mutual savings banks, savings and loanassociations, credit unions, agencies and branches of foreign banks, and Edgecorporations.
2. The Garn-St Germain Depository Institutions Act of 1982 (Public Law97-320) requires that $2 million of reservable liabilities (transaction accounts,nonpersonal time deposits, and Eurocurrency liabilities) of each depositoryinstitution be subject to a zero percent reserve requirement. The Board is to adjustthe amount of reservable liabilities subject to this zero percent reserve require-ment each year for the succeeding calendar year by 80 percent of the percentageincrease in the total reservable liabilities of all depository institutions, measuredon an annual basis as of June 30. No corresponding adjustment is to be made inthe event of a decrease. On Dec. 15, 1987, the exemption was raised from $2.9million to $3.2 million. In determining the reserve requirements of depositoryinstitutions, the exemption shall apply in the following order: (1) net NOWaccounts (NOW accounts less allowable deductions); (2) net other transactionaccounts; and (3) nonpersonal time deposits or Eurocurrency liabilities startingwith those with the highest reserve ratio. With respect to NOW accounts and
other transaction accounts, the exemption applies only to such accounts thatwould be subject to a 3 percent reserve requirement.
3. Transaction accounts include all deposits on which the account holder ispermitted to make withdrawals by negotiable or transferable instruments, pay-ment orders of withdrawal, and telephone and preauthorized transfers in excess ofthree per month for the purpose of making payments to third persons or others.However, MMDAs and similar accounts subject to the rules that permit no morethan six preauthorized, automatic, or other transfers per month, of which no morethan three can be checks, are not transaction accounts (such accounts are savingsdeposits subject to time deposit reserve requirements).
4. The Monetary Control Act of 1980 requires that the amount of transactionaccounts against which the 3 percent reserve requirement applies be modifiedannually by 80 percent of the percentage increase in transaction accounts held byall depository institutions, determined as of June 30 each year. Effective Dec. 15,1987 for institutions reporting quarterly and Dec. 29, 1987 for institutionsreporting weekly, the amount was increased from $36.7 million to $40.5 million.
5. In general, nonpersonal time deposits are time deposits, including savingsdeposits, that are not transaction accounts and in which a beneficial interest isheld by a depositor that is not a natural person. Also included are certainA - » i - - .. » . _ *'~ns issuedto depository institution offices located outside the United States. For details, seesection 204.2 of" 'I of Regulation D.

Policy Instruments A9
1.17 FEDERAL RESERVE OPEN MARKET TRANSACTIONS'
Millions of dollars
Type of transaction 1985 1986 1987
1987
Nov. Dec.
1988
Jan. Feb. Mar. Apr. May
U.S. TREASURY SECURITIES
Outright transactions (excluding matchedtransactions)
Treasury bills1 Gross purchases2 Gross sales3 Exchange4 Redemptions
Others within 1 year5 Oross purchases6 Gross sales7 Maturity shift8 Exchange9 Redemptions
1 to 5 years10 Gross purchases11 Gross sales12 Maturity shift13 Exchange
5 to 10 years14 Gross purchases15 Gross sales16 Maturity shift17 Exchange
Over 10 years18 Gross purchases19 Oross sales20 Maturity shift21 Exchange
All maturities22 Gross purchases23 Gross sales24 Redemptions
Matched transactions25 Gross soles26 Gross purchases
Repurchase agreements1
27 Gross purchases28 Gross sales
29 Net change in U.S. government securities
FEDERAL AOENCY OBLIGATIONS
Outright transactions30 Oross purchases31 Oross sales32 Redemptions
Repurchase agreements1
33 Gross purchases34 Oross sales
35 Net change in federal agency obligations .
36 Total net change In System Open MarketAccount
22,2144,118
03,500
1,349
19,763-17,717
0
2,1850
-17,45913,853
458100
-1,8572,184
2930
-4471,679
26,4994,2183,500
866,175865,968
134,253132,351
20,477
00
162
22,18320,877
1,144
21,621
22,6022,502
01,000
1900
18,673-20,179
0
8930
-17,05816,984
2360
-1,6202,050
15800
1,150
24,0782,5021,000
927,997927,247
170,431160,268
29,989
00
J98
31,14230,522
222
30,211
18,9836,050
09,029
3,658300
21,502-20,388
70
10,231452
-17,97418,938
2,4410
-3,529950
1,85800
500
37,1716,8029,099
950,923950,935
314,620324,666
11,235
00
276
80,35381,351
-1,274
9,961
3,388000
6700
2,247-3,728
70
500
-1,9003,278
00
-347300
000
150
4,1080
70
85,28885,494
15,85318,751
1,346
6,7867,425
-640
706
150000
4790
1,400-1,742
0
2,5890
-1,4001,742
596000
445000
4,25900
104,833105,917
23,51225,264
3,591
9,71810,679
-975
2,617
049
0600
00
950-754
0
00
-840749
00
-110
049
600
78,35878,513
10,59114,237
-4,140
00
131
4,0425,357
-1,446
-5,586
346538
01,600
00
1,939-2,868
0
0800
-9522,643
0175
-987150
000
75
3461,5131,600
97,89299,139
00
-1,520
00
21
-21
-1,541
560000
00
2,051-2,089
0
00
-2,0512,089
56000
104,527104,572
605
-3
602
423000
1,0920
3,6610
-8231,434
1,0170
- 4 5254
966000
7,16000
86,90085,608
18,69611,088
13,476
00
120
4,2431,447
2,676
16,151
00
1,646-4,324
0
00
-1,1023,724
00
-387400
00
-157200
115,287115,115
15,87123,478
-7,779
00
11
4,7717,566
-2,807
-10,585
1. Sales, redemptions, and negative figures reduce holdings of the System OpenMarket Account; all other figures increase such holdings. Details may not add tototals because of rounding.
2. In July 1984 the Open Market Trading Desk discontinued accepting bankersacceptances in repurchase agreements.
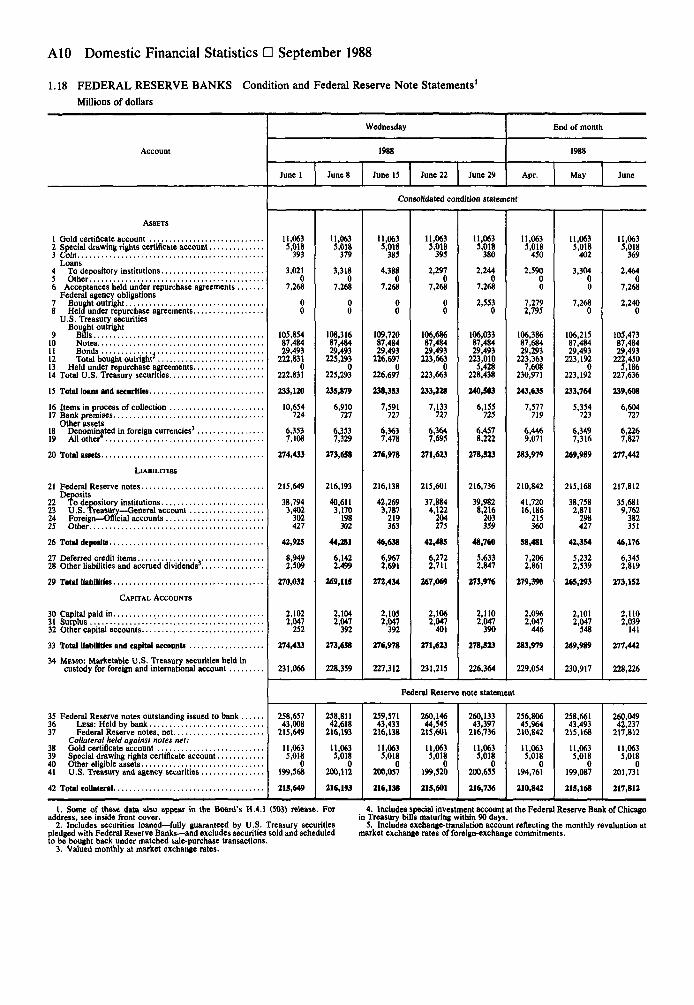
A10 Domestic Financial Statistics • September 1988
1.18 FEDERAL RESERVE BANKS Condition and Federal Reserve Note Statements1
Millions of dollars
Account
Wednesday
June 1 June 8 June 13 June 22 June 29
End of month
1988
Apr. May June
Consolidated condition statement
ASSETS
1 Gold certificate account2 Special drawing rights certificate account3 Coin
Loans4 To depository institutions5 Other6 Acceptances held under repurchase agreements . . .
Federal agency obligations7 Bought outright8 Held under repurchase agreements
U.S. Treasury securitiesBought outright
9 Bills10 Notes11 Bonds12 Total bought outright2
13 Held under repurchase agreements14 Total U.S. Treasury securities
15 Total loans and securities
16 Items in process of collection17 Bank premises
Other assets18 Denominated in foreign currencies3
19 All other*
20 Total assets
LIABILITIES
21 Federal Reserve notesDeposits
22 To depository institutions23 U.S. Treasury—General account24 Foreign—Official accounts25 Other
26 Total deposits
27 Deferred credit items t
28 Other liabilities and accrued dividends3
29 Total liabilities
CAPITAL ACCOUNTS
30 Capital paid in31 Surplus
32 Other capital accounts
33 Total liabilities and capital accounts
34 MEMO: Marketable U.S. Treasury securities held incustody for foreign and international account
35 Federal Reserve notes outstanding issued to bank36 LESS: Held by bank37 Federal Reserve notes, net
Collateral held against notes net:38 Gold certificate account39 Special drawing rights certificate account40 Other eligible assets41 U.S. Treasury and agency securities
42 Total collateral
11,0635,018
393
3,0210
7,268
00
105,85487,48429,493
222,8310
222,831
233,120
10,654724
6,3537,108
274,433
215,649
38,7943,402
302427
42,925
8,9492,509
270,032
2,1022,047
252
274,433
231,066
258,65743,008
215,649
11,0635,018
0199,568
215,649
11,0635,018
379
3,3180
7,268
00
108,31687,48429,493
225,2930
225,293
235,879
6,910727
6,3537,329
273,(58
216,193
40,6113,170
198302
44,281
6,1422,499
269,115
2,1042,047
392
273,658
228,359
11,0635,018
385
4,3880
7,268
00
109,72087,48429,493
226,6970
226,697
238,353
7,591727
6,3637,478
276,978
216,138
42,2693,787
219363
46,638
6,9672,691
272,434
2,1052,047
392
276,978
11,0635,018
395
2,2970
7,268
00
106,68687,48429,493
223,6630
223,663
233,228
7,133727
6,3647,695
271,623
215,601
37,8844,122
204275
42,485
6,2722,711
267,069
2,1062,047
401
271,623
227,312 231,215 226,364
11,0635,018
380
2,2440
7,268
2,5530
106,03387,48429,493
223,0105,428
228,438
240,503
6,155725
6,4578,222
278,523
216,736
39,9828,216
203359
48,760
5,6332,847
173,97*
2,1102,047
390
278,523
11,0635,018
450
2,59000
7,2792,795
106,38687,68429,293
223,3637,608
230,971
243,635
7,577719
6,4469,071
283,979
210,842
41,72016,186
215360
58,481
7,2062,861
279,390
2,0962,047
446
283,979
229,054
11,0635,018
402
3,30400
7,2680
106,21587,48429,493
223,1920
223,192
233,764
5,354723
6,3497,316
269,989
215,168
38,7582,871
298427
42,354
5,2322,539
265,293
2,1012,047
548
269,989
230,917
Federal Reserve note statement
258,81142,618
216,193
11,0635,018
0200,112
216,1*3
259,57143,433
216,138
11,0635,018
0200,057
216,138
260,14644,545
215,601
11,0635,018
0199,520
215,601
260,13343,397
216,736
11,0635,018
0200,655
216,736
256,80645,964
210,842
11,0635,018
0194,761
210,842
258,66143,493
215,168
11,0635,018
0199,087
215,168
11,0635,018
369
2,4640
7,268
2,2400
105,47387,48429,493
222,4505,186
227,636
239,608
6,604727
6,2267,827
277,442
217,812
35,6819,762
382351
46,176
6,3452,819
273,152
2,1102,039
141
277,442
228,226
260,04942,237
217,812
11,0635,018
0201,731
217,812
1. Some of these data also appear in the Board's H.4.1 (503) release. Foraddress, see inside front cover.
2. Includes securities loaned—fully guaranteed by U.S. Treasury securitiespledged with Federal Reserve Banks—and excludes securities sold and scheduledto be bought back under matched sale-purchase transactions.
3. Valued monthly at market exchange rates.
4. Includes special investment account at the Federal Reserve Bank of Chicagoin Treasury bills maturing within 90 days.
5. Includes exchange-translation account reflecting the monthly revaluation atmarket exchange rates of foreign-exchange commitments.

Federal Reserve Banks Al 1
1.19 FEDERAL RESERVE BANKS Maturity Distribution of Loan and Security Holdings
Millions of dollars
Type and maturity groupings
Wednesday
1988
June I June 8 June IS June 22 June 29
End of month
1988
Apr. 29 May 31 June 30
1 Loans—Total2 Within 15 days3 16 days to 90 days4 91 days to 1 year
5 Acceptances—Total6 Within 15 days7 16 days to 90 days8 91 days to 1 year
9 U.S. Treasury securities—Total..10 Within 15 days'11 16 days to 90 days12 9] days to 1 year13 Over 1 year to 5 years14 Over 5 years to 10 years15 Over 10 years
16 Federal agency obligations—Total17 Within 15 days'18 16 days to 90 days19 91 days to 1 year20 Over 1 year to 5 years21 Over 5 years to 10 years22 Over 10 years
3,0212,855
1660
0000
222,83111,30148,94267,11553,53015,43526,508
7,26825
6612,0283,2301,135
3,3183,164
1540
0000
225,29312,79853,83063,19253,53015,43526,508
7,26825
8671,8223,2301,135
4,3884,219
1690
0000
226,69711,37753,45566,39253,53015,43526,508
7,26828
9191,7903,2071,135
189
2,2972,238
590
0000
223,66311,34150,60766,24253,53015,43526,508
7,268258689
1,7903,2071,135
189
2,2442,184
600
0000
228,43816,31750,35666,29253,53015,43526,508
9,8212,783694
1,8083,2041,143189
2,5902,523
670
0000
230,97115,08255,85666,95051,19615,42226,465
10,0742,936659
1,8373,2921,161189
3,2823,185
970
0000
223,1927,372
53,23267,11553,53015,43526,508
7,268246661
1,7283,3091,135189
2,4642,3361280
0000
227,63610,56950,26970,88453,97115,43526,508
9,5082,470694
1.8083,2041,143189
1. Holdings under repurchase agreements are classified as maturing within 15 days in accordance with maximum maturity of the agreements.

A12 Domestic Financial Statistics D September 1988
1.20 AGGREGATE RESERVES OF DEPOSITORY INSTITUTIONS AND MONETARY BASE1
Billions of dollars, averages of daily figures
ADJUSTED FORCHANGES IN RESERVE REQUIREMENTS3
5 Monetary base*
6 Total reserves3
10 Monetary base . . . .
NOT ADJUSTED FORCHANGES IN RESERVE REQUIREMENTS*
11 Total reserves3
15 Monetary base5
1984Dec.
1985Dec.
1986Dec.
1987Dec.
1987
Nov. Dec.
1988
Ian. Feb. Mar. Apr. May June
Seasonally adjusted
40.96
37.7740.3840.11
200.45
41.84
38.6541.2640.99
203.39
40.70
37.5140.0939.84
204.18
47.26
45.9446.4446.20
218.26
48.27
46.9547.4547.21
221.49
48.14
46.8247.4147.08
223.53
57.46
56.6356.9356.09
240.80
58.70
57.8758.1857.33
244.55
59.56
58.7359.0458.19
247.71
58.72
57.9458.4357.69
257.93
60.02
59.2559.7358.99
262.05
62.12
61.3561.8661.09
266.16
59.05
58.4358.8258.13
256.94
58.72
57.9458.4357.69
257.93
59.46
58.3858.7558.16
260.72
59.57
59.1859.3858.44
262.02
Not seasonally adjusted
59.14
58.5158.9158.21
257.65
61.20
60.5860.7960.28
261.67
60.02
59.2559.7358.99
262.05
62.12
61.3561.8661.09
266.16
61.20
60.1260.4959.90
262.01
62,64
61.5662.1261.34
265.79
58.66
58.2758.4757.53
259.01
60.05
59.6559.8258.91
262.60
59.76
58.0159.4958.83
263.32
58.85
57.1058.5857.92
260.77
60.08
58 3259.5859 15
263.98
60.37
57.3860.0059.51
265.81
60.95
57.9560.5860.09
265.01
62.06
59.0761.8961.21
268.13
60.37'
57.7959.8959.32'
266.92'
59.45
56.8858.9858.41'
265.73'
60.68
58.1060.0859.64'
268.90'
60.64
57.5560.1159.76
268.32
60.68
57.6060.1559.80
269.46
61.99
58.9161.4761.11
272.67
1. Latest monthly and biweekly figures are available from the Board's H.3(502)statistical release. Historical data and estimates of the impact on required reservesof changes in reserve requirements are available from the Monetary and ReservesProjections Section. Division of Monetary Affairs. Board of Governors of theFederal Reserve System, Washington, D.C. 20551.
2. Figures incorporate adjustments for discontinuities associated with theimplementation of the Monetary Control Act and other regulatory changes toreserve requirements. To adjust for discontinuities due to changes in reserverequirements on reservable nondeposit liabilities, the sum of such requiredreserves is subtracted from the actual series. Similarly, in adjusting for disconti-nuities in the monetary base, required clearing balances and adjustments tocompensate for float also are subtracted from the actual series.
3. Total reserves not adjusted for discontinuities consist of reserve balanceswith Federal Reserve Banks, which exclude required clearing balances andadjustments to compensate for float, plus vault cash held during the laggedcomputation period by institutions having required reserve balances at FederalReserve Banks plus the amount of vault cash equal to required reserves during themaintenance period at institutions having no required reserve balances.
4. Extended credit consists of borrowing at the discount window under the
terms and conditions established for the extended credit program to helpdepository institutions deal with sustained liquidity pressures. Because there isnot the same need to repay such borrowing promptly as there is with traditionalshort-term adjustment credit, the money market impact of extended credit issimilar to that of nonborrowed reserves.
5. The monetary base not adjusted for discontinuities consists of total reservesplus required clearing balances and adjustments to compensate for float at FederalReserve Banks and the currency component of the money stock plus, for insti-tutions not having required reserve balances, the excess of current vault cash overthe amount applied to satisfy current reserve requirements. Currency and vaultcash figures are measured over the weekly computation period ending Monday.
The seasonally adjusted monetary base consists of seasonally adjusted totalreserves, which include excess reserves on a not seasonally adjusted basis, plusthe seasonally adjusted currency component of the money stock and the remain-ing items seasonally adjusted as a whole.
6. Reflects actual reserve requirements, including those on nondeposit liabili-ties, with no adjustments to eliminate the effects of discontinuities associated withimplementation of the Monetary Control Act or other regulatory changes toreserve requirements.
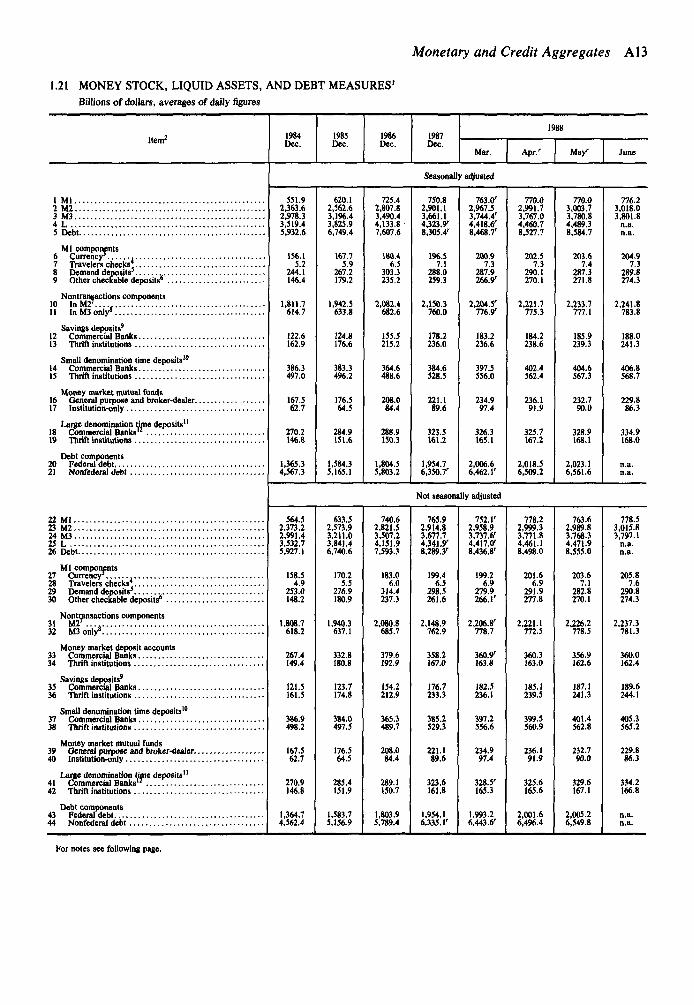
Monetary and Credit Aggregates A13
1.21 MONEY STOCK, LIQUID ASSETS, AND DEBT MEASURES1
Billions of dollars, averages of daily figures
Item2 1984Dec.
1985Dec.
1986Dec.
1987Dec.
1988
Mar. Apr.' May' June
Seasonally adjusted
1 Ml2 M 23 M34 L5 Debt
Ml components6 Currency'7 Travelers checks,8 Demand deposits3
9 Other checkable deposits6
Nontransactions components10 In M2\11 InM3only»
Savings deposits9
12 Commercial Banks13 Thrift institutions
Small denomination time deposits'"14 Commercial Banks15 Thrift institutions
Money market mutual funds16 General purpose and broker-dealer.17 Institution-only
Large denomination time deposits"18 Commercial Banks"19 Thrift institutions
Debt components20 Federal debt21 Nonfederal debt
22 Ml23 M224 M325 L26 Debt
Ml components27 Currency3 ,28 Travelers checks*29 Demand deposits3
30 Other checkable deposits'
Nontransactions components
32 M3 only*!'.'.'.'.'.'.'.'.'.'.'.'.'.'.'.'.'.'.'.'.'.'.'.
Money market deposit accounts33 Commercial Banks34 Thrift institutions
Savings deposits'35 Commercial Banks36 Thrift institutions
Small denomination time deposits10
37 Commercial Banks38 Thrift institutions
Money market mutual funds39 General purpose and broker-dealer.40 Institution-only
Large denomination time deposits"41 Commercial Banks1'42 Thrift institutions
Debt components43 Federaldebt44 Nonfederal debt
551.92,363.62,978.33,519.45,932.6
156.15.2
244.1146.4
1,811.7614.7
122.6162.9
386.3497.0
167.562.7
270.2148
1,365.34,567.3
620.12,562.63,196.43,825.96,749.4
167.75.9
267.2179.2
1,942.5633.8
124.8176.6
383.3496.2
176.564.5
284.9151.6
1,584.35,165.1
725.42,807.83,490.44,133.87,607.6
180.46.5
303.3235.2
2,082.4682.6
155.5215.2
364.6488.6
208.084.4
288.9150.3
1,804.55,803.2
750.82,901.13,661.14,323.9'8,305.4'
196.57.1
288.0259.3
2,150.3760.0
178.2236.0
384.6528.5
221.189.6
323.5161.2
1,954.76,350.7'
763.0'2,967.53,744.4'4,418.6'8,468.7'
200.97.3
287.9266.9'
2,204.5'776y
183.2236.6
397.5556.0
234.997.4
326.3165.1
2,006.66,462.1'
770.02,991.73,767.04,460.78,527.7
202.57.3
290.1270.1
2,221.7775.3
184.2238.6
402.4562.4
236.191.9
325.7167.2
2,018.56,509.2
770.03,003.73,780.84,489.38,584.7
203.67.4
287.3271.8
2,233.7777.1
185.9239.3
404.6567.3
232.790.0
328.9168.1
2,023.16,561.6
776.23,018.03,801.8
n.a.n.a.
204.97.3
289.8274.3
2,241.8783.8
188.0241.3
406.8568.7
229.886.3
334.9168.0
Not seasonally adjusted
564.52,373.22,991.43,532.75,927.1
158.54.9
253.0148.2
1,808.7618.2
267.4149.4
121.5161.5
386.9498.2
167.562.7
270.9146.8
1,364.74,562.4
633.52,573.93,211.03,841.46,740.6
170.25.5
276.9180.9
1,940.3637.1
332.8180.8
123.7174.8
384.0497.5
176.564.5
285.4151.9
1,583.75,156.9
740.62,821.53,507.24,151.97,593.3
183.06.0
314.4237.3
2,080.8685.7
379.6192.9
154.2212.9
365.3489.7
208.084.4
289.1150.7
1,803.95,789.4
765.92,914.83,677.74,341.9"8,289.3'
199.46.5
298.5261.6
2,148.9762.9
358.2167.0
176.7233.3
385.2529.3
221.189.6
323.6161.8
1,954.16,335.1'
752.1'2,958.93,737.6'4,417.0'8,436.8'
199.26.9
279.9266.1'
2,206.8'778.7
3 6 0 ^163.8
182.5236.1
397.2556.6
234.997.4
328.5'165.3
1,993.26,443.6'
778.22,999.33,771.84,461.18,498.0
201.66.9
291.9277.8
2,221.1772.5
360.3163.0
185.1239.5
399.5560.9
236.191.9
325.6165.6
2,001.66,496.4
763.62,989.83,768.34,471.98,555.0
203.67.1
282.8270.1
2,226.2778.5
356.9162.6
187.1241.3
401.4562.8
232.790.0
329.6167.1
2,005.26,549.8
778.53,015.83,797.1
n.a.n.a.
205.87.6
290.8274.3
2,237.3781.3
360.0162.4
189.6244.1
405.3565.2
229.886.3
334.2166.8
n.a.n.a.
For notes see following page.

A14 Domestic Financial Statistics • September 1988
NOTES TO TABLE 1.21
1. Latest monthly and weekly figures are available from the Board's H.6 (508)release. Historical data are available from the Banking Sections, Division ofResearch and Statistics, Board of Governors of the Federal Reserve System,Washington, D C . 20551.
2. Composition of the money stock measures and debt is as follows:Ml: (1) currency outside the Treasury, Federal Reserve Banks, and the vaults
of depository institutions; (2) travelers checks of nonbank issuers; (3) demanddeposits at all commercial banks other than those due to depository institutions,the U.S. government, and foreign banks and official institutions less cash items inthe process of collection and Federal Reserve float; and (4) other checkabledeposits (OCD) consisting of negotiable order of withdrawal (NOW) and auto-matic transfer service (ATS) accounts at depository institutions, credit unionshare draft accounts, and demand deposits at thrift institutions.
M2: Ml plus overnight (and continuing contract) repurchase agreements (RPs)issued by all commercial banks and overnight Eurodollars issued to U.S. residentsby foreign branches of U.S. banks worldwide, MMDAs, savings and small-denomination time deposits (time deposits—including retail RPs—in amounts ofless than $100,000), and balances in both taxable and tax-exempt general purposeand broker-dealer money market mutual funds. Excludes individual retirementaccounts (IRA) and Keogh balances at depository institutions and money marketfunds. Also excludes all balances held by U.S. commercial banks, money marketfunds (general purpose and broker-dealer), foreign governments and commercialbanks, and the U.S. government.
M3: M2 plus large-denomination time deposits and term RP liabilities (inamounts of $100,000 or more) issued by commercial banks and thrift institutions,term Eurodollars held by U.S. residents at foreign branches of U.S. banksworldwide and at all banking offices in the United Kingdom and Canada, andbalances in both taxable and tax-exempt, institution-only money market mutualfunds. Excludes amounts held by depository institutions, the U.S. government,money market funds, and foreign banks and official institutions. Also subtractedis the estimated amount of overnight RPs and Eurodollars held by institution-onlymoney market mutual funds.
L: M3 plus the nonbank public holdings of U.S. savings bonds, short-termTreasury securities, commercial paper and bankers acceptances, net of moneymarket mutual fund holdings of these assets.
Debt: Debt of domestic nonfinancial sectors consists of outstanding creditmarket debt of the U.S. government, state and local governments, and privatenonfinancial sectors. Private debt consists of corporate bonds, mortgages, con-sumer credit (including bank loans), other bank loans, commercial paper, bankersacceptances, and other debt instruments. The source of data on domesticnonfinancial debt is the Federal Reserve Board's Mow of funds accounts. Debtdata are based on monthly averages.
3. Currency outside the U.S. Treasury, Federal Reserve Banks, and vaults ofdepository institutions.
4. Outstanding amount of U.S. dollar-denominated travelers checks of non-bank issuers. Travelers checks issued by depository institutions are included indemand deposits.
5. Demand deposits at commercial banks and foreign-related institutions otherthan those due to depository institutions, the U.S. government, and foreign banksand official institutions less cash items in the process of collection and FederalReserve float.
6. Consists of NOW and ATS balances at all depository institutions, creditunion share draft balances, and demand deposits at thrift institutions.
7. Sum of overnight RPs and overnight Eurodollars, money market fundbalances (general purpose and broker-dealer), MMDAs, and savings and smalltime deposits.
8. Sum of large time deposits, term RPs, and term Eurodollars of U.S.residents, money market fund balances (institution-only), less the estimatedamount of overnight RPs and Eurodollars held by institution-only money marketfunds.
9. Savings deposits exclude MMDAs.10. Small-denomination time deposits—including retail RPs—are those issued
in amounts of less than $100,000. All individual retirement accounts (IRA) andKeogh accounts at commercial banks and thrifts are subtracted from small timedeposits.
11. Large-denomination time deposits are those issued in amounts of $100,000or more, excluding those booked at international banking facilities.
12. Large-denomination time deposits at commercial banks less those held bymoney market mutual funds, depository institutions, and foreign banks andofficial institutions.
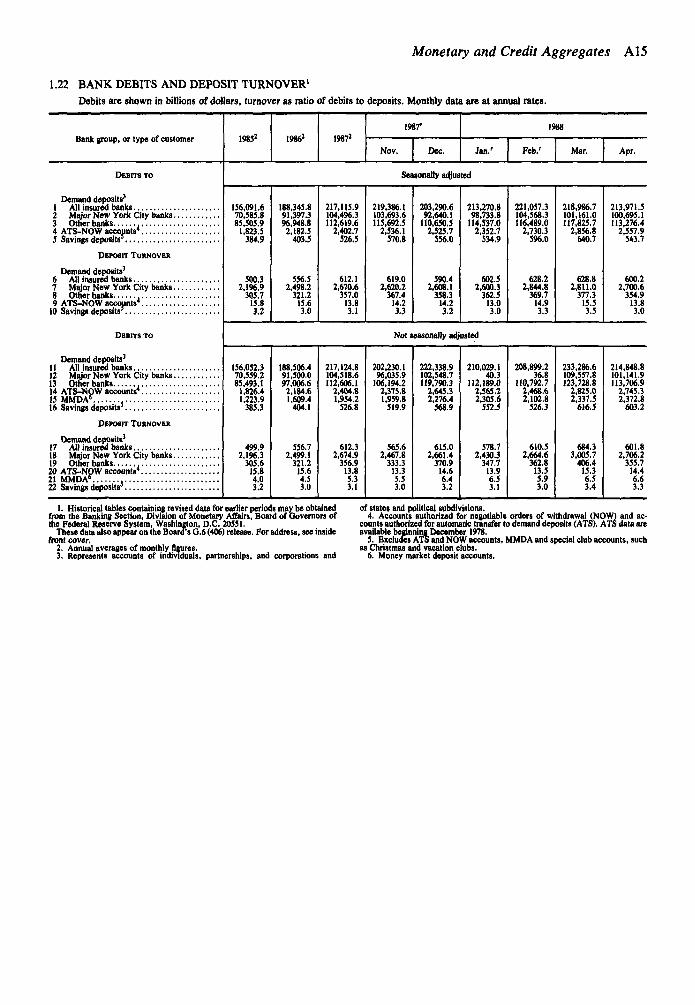
Monetary and Credit Aggregates A15
1.22 BANK DEBITS AND DEPOSIT TURNOVER1
Debits are shown in billions of dollars, turnover as ratio of debits to deposits. Monthly data are at annual rates.
Bank group, or type of customer 19852 I9862 19872
1987'
Nov. Dec.
1988
Jan.' Feb.' Mar. Apr.
DEBITS TO
Demand deposits3
1 All insured banks2 Major New York City banks3 Other banks ,4 ATS-NOW accounts4
5 Savings deposits3
DEPOSIT TURNOVER
Demand deposits'6 All insured banks7 Major New York City banks8 Other banks9 ATS-NOW accounts4
10 Savings deposits3
DEBITS TO
Demand deposits3
11 All insured banks12 Major New York City banks13 Other banks14 ATS-NOW accounts*15 MMDA'. ,16 Savings deposits3
DBPOSIT TURNOVER
Demand deposits1
17 All insured banks18 Major New York City banks19 Other banks20 ATS-NOW accounts4
21 MMDA' ,22 Savings deposits3
156,052.370,559.285,493.1
1,826.41,223.9
385.3
499.92,196.3
305.615.84.03.2
Seasonally adjusted
156,091.670,585.885,505.9
1,823.5384.9
500.32,196.9
305.715.83.2
188,345.891,397.396,948.8
2,182.5403.5
556.52,498.2
321.215.63.0
217,115.9104,496.3112,619.6
2,402.7526.5
612.12,670.6
357.013.83.1
219,386.1103,693.6115,692.5
2,536.1570.8
619.02,620.2
367.414.23.3
203,290.692,640.1
110,650.52,525.7
556.0
590.42,608.1
358.314.23.2
213,270.898,733.8
114,537.02,352.7
S34.9
602.52,600.3
362.513.03.0
221,057.3104,568.3116,489.0
2,730.3596.0
628.22,844.8
369.714.93.3
218,986.7101,161.0117,825.7
2,856.8640.7
628.82,811.0
377.315.53.5
Not seasonally adjusted
213,971.5100,695.1113,276.4
2,557.9543.7
600.22,700.6
354.913.83.0
188,506.491,500.097,006.6
2.1S4.61,609.4
404.1
556.72,499.1
321.215.64.53.0
217,124.8104,518.6112,606.1
2,404.81,954.2
526.8
612.32,674.9
356.913.85.33.1
202,230.196,035.9
106,194.22,375.81,959.8
519.9
565.62,467.8
333.313.35.53.0
222,338.9102,548.7119,790.3
2,645.32,276.4
568.9
615.02,661.4
370.914.66.43.2
210,029.140.3
112,189.02,565.22,305.6
552.5
578.72,430.3
347.713.96.53.1
208,899.236.8
110,792.72,468.62,102.8
526.3
610.52,664.6
362.813.55.93.0
233,286.6109,557.8123,728.8
2,825.02,337.5
616.5
684.33,005.7
406.415.36.53.4
214,848.8101,141.9113,706.9
2,745.32,372.8
603.2
601.82,706.2
355.714.46.63.3
1. Historical tables containing revised data for earlier periods may be obtainedfrom the Banking Section, Division of Monetary Affairs, Board of Governors ofthe Federal Reserve System, Washington, D.C, 20551.
These data also appear on the Board's O.6 (406) release. For address, see insidefront cover.
2. Annual averages of monthly figures.3. Represents accounts of individuals, partnerships, and corporations and
of states and political subdivisions.4. Accounts authorized tor negotiable orders of withdrawal (NOW) and ac-
counts authorized for automatic transfer to demand deposits (ATS). ATS data areavailable beginning December 1978.
5. Excludes ATS and NOW accounts, MMDA and special club accounts, suchas Christmas and vacation clubs.
6. Money market deposit accounts.
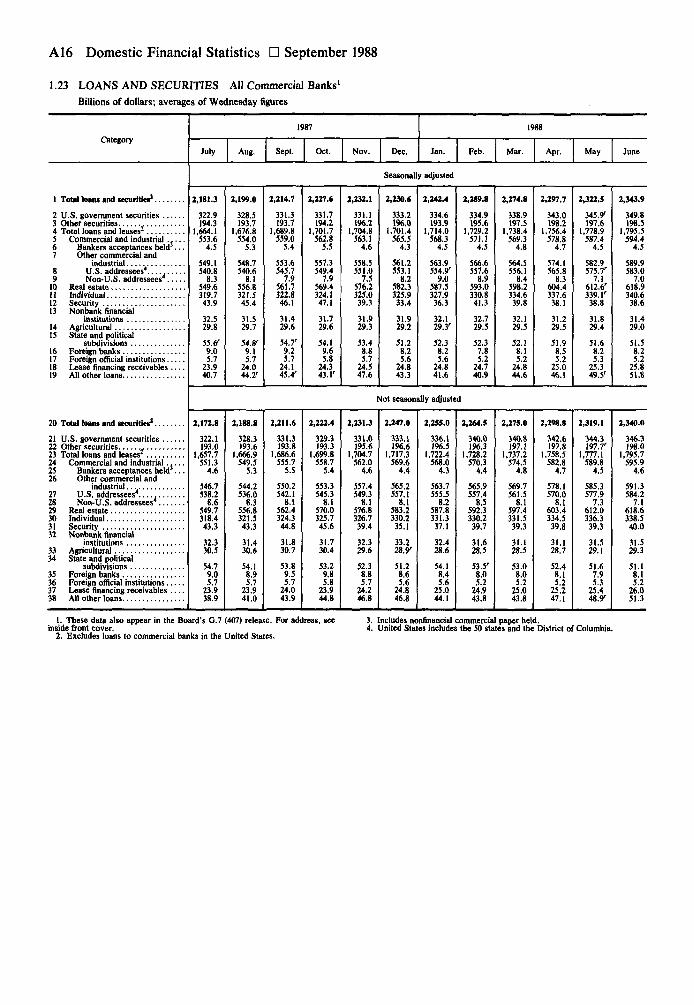
A16 Domestic Financial Statistics • September 1988
1.23 LOANS AND SECURITIES All Commercial Banks'
Billions of dollars; averages of Wednesday figures
Category1987
July Aug. Sept. Oct. Nov. Dec.
1988
Jan. Feb. Mar. Apr. May June
1 Total loans and securities1
2 U.S. government securities3 Other securities4 Total loans and leases5 Commercial and industrial . , . . .6 Bankers acceptances held . . .7 Other commercial and
industrial .,8 U.S. addressees4 . . . . .9 Non-U.S. addressees4
10 Real estate11 Individual12 Security13 Nonbank financial
institutions14 Agricultural15 State and political
subdivisions16 Foreign banks17 Foreign official institutions18 Lease financing receivables . . . .19 All other loans
20 Total loans and securities2
21 U.S. government securities22 Other securities „23 Total loans and leases'24 Commercial and industrial . . . . .25 Bankers acceptances held3 . . .26 Other commercial and
industrial27 U.S. addressees4 . . . . .2S Non-U.S. addressees4
29 Real estate30 Individual31 Security32 Nonbank financial
institutions33 Agricultural34 State and political
subdivisions35 Foreign banks36 Foreign official institutions37 Lease financing receivables38 All other loans
Seasonally adjusted
2,181.3
322.9194.3
1,664.1553.6
4.5
549.1540.8
8.3549.6319.743.9
32.529.8
55.6'9.05.7
23.940.7
2,199.0
328.5193.7
1,676.8554.0
5.3
548.7540.6
8.1556.8321.545.4
31.529.7
54.8'9.15.7
24.044.2'
2,214.7
331.3193.7
1,689.8559.0
5.4
553.6545.7
7.9561.7322.846.1
31.429.6
54.7r
9.25.7
24.145.4'
2,227.6
331.7194.2
1,701.7562.8
5.5
557.3549.4
7.9569.4324.147.1
31.729.6
54.19.65.8
24.343.1'
2,232.1
331.1196.2
1,704.8563.1
4.6
558.5551.0
7.5576.2325.039.3
31.929.3
53.48.85.7
24.547.6
2,230.6
333.2196.0
1,701.4565.5
4.3
561.2553.1
8.2582.3325.933.4
31.929.2
51.28.25.6
24.843.3
2,242.4
334.6193.9
1,714.0568.3
4.5
563.9554.9'
9.0587.5327.936.3
32.129.3'
52.38.25.6
24.841.6
2,259.8
334.9195.6
1,729.2571.1
4.5
566.6557.6
8.9593.0330.841.3
32.729.5
52.37.85.2
24.740.9
2,274.8
338.9197.5
1,738.4569.3
4.8
564.5556.1
8.4598.2334.639.8
32.129.5
52.18.15.2
24.844.6
2,2»7.7
343.0198.2
1,756.4578.8
4.7
574.1565.8
8.3604.4337.638.1
31.229.5
51.98.55.2
25.046.1
2,322.5
345.9'197.6
1,778.9587.4
4.5
582.9575.7'
7.1612.6'339.1'38.8
31.829.4
51.68.25.3
25.349.5'
Not seasonally adjusted
2,343.9
349.8198.5
1,795.5594.4
4.5
589.9583.0
7.0618.9340.638.6
31.429.0
51.58.25.2
25.851.8
2,172.8
322.1193.0
1,657.7551.3
4.6
546.7538.2
8.6549.7318.443.3
32.330.5
54.79.05.7
23.938.9
2,188.8
328.3193.6
1,666.9549.5
5.3
544.2536.0
8.3556.8321.543.3
31.430.6
54.18.95.7
23.941.0
2,211.6
331.3193.8
1,686.6555.7
5.5
550.2542.1
8.1562.4324.344.8
31.830.7
53.89.55.7
24.043.9
2,222.4
329.3193.3
1,699.8558.7
5.4
553.3545.3
8.1570.0325.745.6
31.730.4
53.29.85.8
23.944.8
2,231.3
331.0195.6
1,704.7562.0
4.6
557.4549.3
8.1576.8326.739.4
32.329.6
52.38.85.7
24.246.8
2,247.0
333.1196.6
1,717.3569.6
4.4
565.2557.1
S.I583.2330.235.1
33.2?).¥51.28.65.6
24.846.8
2,255.0
336.1196.5
1,722.4568.0
4.3
563.7555.5
8.2587.8331.337.1
32.428.6
54.18.45.6
25.044.1
2,2*4.5
340.0196.3
1,728.2570.3
4.4
565.9557.4
8.5592.3330.239.7
31.628.5
53.5'8.05.2
24.943.8
2,275.0
340.8197.1
1,737.2574.5
4.8
569.7561.5
8.1597.4331.539.3
31.128.5
53.08.05.2
25.043.8
2,298.8
342.6197.8
1,758.5582.8
4.7
578.1570.0
8.1603.4334.539.8
31.128.7
52.48.15.2
25.247.1
2,319.1
344.3197.7'
1,777.1589.8
4.5
585.3577.9
7.3612.0336.339.3
31.529.1
51.67.95.3
25.44 8 ^
2,340.0
346.3198.0
1,795.7595.9
4.6
591.3584.2
7.1618.6338.540.0
31.529.3
51.18.15.2
26.051.3
1. These data also appear in the Board's G.7 (407) release. For address, seeinside front cover.
2. Excludes loans to commercial banks in the United States.
3. Includes nonfinancial commercial paper held.4. United States includes the 50 states and the District of Columbia.

Commercial Banking Institutions A17
1.24 MAJOR NONDEPOSIT FUNDS OF COMMERCIAL BANKS1
Monthly averages, billions of dollars
Source
Total nondeposit funds1 Seasonally adjusted2 Not seasonally adjusted
Federal funds, RPs, and otherborrowings from nonbanks'
4 Not seasonally adjusted ,5 Net balances due to foreign-related
institutions, not seasonally adjusted
MEMO6 Domestically chartered banks' net positions
with own foreign branches,
9 Foreign-related institutions' net positionswith directly related institutions,not seasonally adjusted3
10 Gross due from balances
Security RP borrowings
13 Not seasonally adjusted .... .^....,U.S. Treasury demand balances7
14 Seasonally adjusted15 Not seasonally adjusted .
Time deposits, $100,000 or more*16 Seasonally adjusted . . .
1987
July
160.4156.8
167.3163.6
-6 .9
-22.266.444.2
15.477.492.8
103.099.4
24.426.6
372.5370.0
Aug.
166.8166.9
167.1167.2
- . 3
-17.764.546.8
17.477.795.0
105.2105.3
28.521.6
372.3371.8
Sept.
177.3177.7
165.0165.4
12.3
-11.863.852.0
24.177.3
101.4
107.4107.8
24.925.5
373.0373.2
Oct.
176.3176.3
164.7164.8
11.6
-14.767.753.0
26.379.7
106.0
107.6107.6
34.230.7
380.5380.4
Nov.
173.8176.1
165.9168.3
7.9
-17.170.453.3
24.983.2
108.2
107.0109.3
35.725.8
387.0387.0
Dec.
177.4'178.2
162.2163.1
15.2'
-H.V69.5'55.5
29.279.8
109.0
106.5107.4
26.122.4
389.2389.3
1988
Jan.
179.2'
169.8170.1
9.1'
-16.5'71.2'54.7
25.685.2
110.8'
108.9109.3
18.624.9
389.1390.1
Feb.
176.7'179.2'
173.6176.1
3.1'
-20 .2 '72.9'52.7
23.387.3
110.6
107.7110.3
22.628.2
394.4394.7
Mar.
174.2'175.1'
177.4178.2
- 3 . 1 '
-25 .3 '76.6'51.3
22.188.6
110.7
108.2109.1
24.922.3
396.1398.2
Apr.
181.5'180.7'
179.5178.7
2.C
-22.2'7 2 ^50.7
24.288.3
112.4
112.0111.2
21.821.7
394.1394.0
May
191.5'191.3'
181.6181.4
9.8'
-16 .4 '69.6'53.3'
26.289.9'
116.0
114.9114.7
24.730.4
396.5397.2
June
190.7187.0
181.7178.1
8.9
-16 .069.453.4
25.093.6
118.5
117.7114.1
22.021.0
400.7400.0
1. Commercial banks are those in the 50 states and the District of Columbiawith national or state charters plus agencies and branches of foreign banks. NewYork investment companies majority owned by foreign banks, and Edge Actcorporations owned by domestically chartered and foreign banks.
These data also appear in the Board's G. 10(411) release. For address, seeinside from cover.
2. Includes seasonally adjusted federal funds, RPs, and other borrowings fromnonbanks and not seasonally adjusted net Eurodollars.
3. Other borrowings are borrowings on any instrument, such as a promissorynote or due bill, given for the purpose of borrowing money for the banking
business. This includes borrowings from Federal Reserve Banks and from foreignbanks, term federal funds, overdrawn due from bank balances, loan RPs, andparticipations in pooled loans.
4. Averages of daily figures for member and nonmember banks.5. Averages of daily data.6. Based on daily average data reported by 122 large banks.7. Includes U.S. Treasury demand deposits and Treasury (ax-and-loan notes at
commercial banks. Averages of daily data.8. Averages of Wednesday figures.
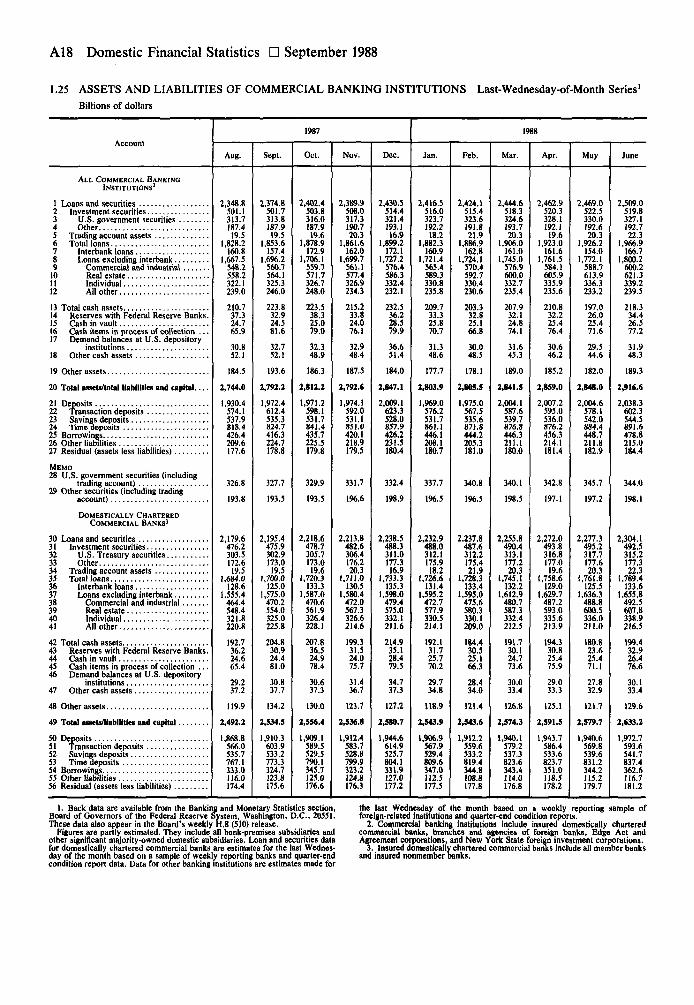
A18 Domestic Financial Statistics • September 1988
1.25 ASSETS AND LIABILITIES OF COMMERCIAL BANKING INSTITUTIONS Last-Wednesday-of-Month Series'
Billions of dollars
Account
ALL COMMERCIAL BANKINGINSTITUTIONS2
4 Other
6 Total loans
9 Commercial and industrial10 Real estate
12 All other
14 Reserves with Federal Reserve Banks.15 Cash in vault .16 Cash items in process of collection . . .17 Demand bajances at U.S. depository
18 Other cash assets
19 Other assets .
20 Total assets/total liabilities and capital....
26 Other liabilities27 Residua] (assets less liabilities)
MEMO28 U.S. government securities (including
29 Other securities (including trading
DOMESTICALLY CHARTEREDCOMMERCIAL BANKS3
30 Loans and securities
32 U.S. Treasury securities33 Other34 Trading account assets
38 Commercial and industrial39 Real estate
41 Allother
42 Total cash assets..43 Reserves with Federal Reserve Banks.44 Cash in vault.45 Cash items in process of collection . . .46 Demand balances at U.S. depository
47 Other cash assets
48 Other assets
49 Total assets/liabilities and capital
50 Deposits
55 Other liabilities
1987
Aug.
2,348.8501.1313.7187.419.5
1,828.2160.8
1,667.5548.2558.2322.1239.0
210.737.324.765.9
30.852.1
184.5
2,744.0
1,930.4574.1537.9818.4426.4209.6177.6
326.8
193.8
2,179.6476.2303.5172.619.5
1,684.0128.6
1,555.4464.4548.4321.8220.8
192.736.224.665.4
29.237.2
119.9
2,492.2
1,868.8566.0535.7767.1333.0116.0174.4
Sept.
2,374.8501.7313.8187.919.5
1,853.6157.4
1,696.2560.7564.1325.3246.0
223.832.924.581.6
32.752.1
193.6
2,792.2
1,972.4612.4535.3824.7416.3224.7178.8
327.7
193.5
2,195.4475.9302.9173.019.5
1,700.0125.0
1,575.0470.2554.0325.0225.8
204.830.924.481.0
30.837.7
134.2
2,534.5
1,910.3603.9533.2773.3324.7123.8175.6
Oct.
2,402.4503.8316.0187.919.6
1,878.9172.9
1,706.1559.7571.7326.7248.0
223.538.325.079.0
32.348.9
186.3
2,812.2
1,971.2598.1531.7841.4435.7225.5179.8
329.9
193.5
2,218.6478.7305.7173.019.6
1,720.3133.3
1,587.0470.6561.9326.4228.1
207.836.524.978.4
30.637.3
130.0
2,556.4
1,909.1589.5529.5790.1345.7125.0176.6
Nov.
2,389.9508.0317.3190.720.3
1,861.6162.0
1,699.7561.1577.4326.9234.3
215.233.824.076.1
32.948.4
187.5
2,792.6
1,974.1592.0531.1851.0420.1218.9179.5
331.7
196.6
2,213.8482.6306.4176.220.3
1,711.0130.5
1.580.4472.0567.3326.6214.6
199.331.524.075.7
31.436.7
123.7
2,534.8
1,912.4583.7528.8799.9323.2124.8176.3
Dec.
2,430.5514.4321.4193.116.9
1,899.2172.1
1,727.2576.4586.3332.4232.1
232.536.228.579.9
36.651.4
184.0
2,847.1
2,009.1623.3528.0857.9426.2231.5180.4
332.4
198.9
2,238.5488.3311.0177.316.9
1,733.3135.3
1,598.0479.4575.0332.1211.6
214.935.128.479.5
34.737.3
127.2
2,580.7
1,944.6614.9525.7804.1331.9127.0177.2
1988
Jan.
2,416.5516.0323.7192.2
18.21,882.3
160.91,721.4
565.4589.3330.8235.8
209.733.325.870.7
31.348.6
177.7
2,803.9
1,969.0576.2531.7861.1446.1208.1180.7
337.7
196.5
2,232.9488.0312.1175.9
18.21,726.6
131.41,595.2
472.7577.9330.5214.1
192.131.725.770.2
29.734.8
118.9
2,543.9
1,906.9567.9529.4809.6347.0112.5177.5
Feb.
2,424.1515.4323.6191.821.9
1,886.9162.8
1,724.1570.4592.7330.4230.6
203.332.825.166.8
30.048.5
178.1
2,805.5
1,975.0567.5535.6871.8444.2205.3181.0
340.8
196.5
2,237.8487.6312.2175.421.9
1,728.3133.4
1,595.0475.6580.3330 1209.0
184.430.525.166.3
28.434.0
121.4
2,543.6
1,912.2559.6533.2819.4344.8108.8177.8
Mar.
2,444.6518.3324.6193.720.3
1,906.0161.0
1,745.0576.9600.0332.7235.4
207.932.124.874.1
31.645.3
189.0
2,841.5
2,004.1587.6539.787S.8446.3211.1180.0
340.1
198.5
2,255.8490.4313.1177.220.3
1,745.1132.2
1,612.9480.7587.3332.4212.5
191.730.124.773.6
30.033.4
126.8
2,574.3
1,940.1579.2537.3823.6343.4114.0176.8
Apr.
2,462.9520.3328.1192.1
19.61,923.0
161.61,761.5
584.1605.9335.9235.6
210.832.225.476.4
30.646.2
185.2
2,859.0
2,007.2595.0536.0876.2456.3214.1181.4
342.8
197.1
2,272.0493.8316.8177.019.6
1,758.6129.0
1,629.7487.2593.0335.6213.9
194.330.825.475.9
29.033.3
125.1
2,591.5
1,943.7586.4533.6823.7351.0118.5178.2
May
2,469.0522.5330.0192.620.3
1,926.2154.0
1,772.1588.7613.9336.3233.2
197.026.025.471.6
29.544.6
182.0
2,848.0
2,004.6578.1542.0884.4448.7211.8182.9
345.7
197.2
2,277.3495.2317.7177.620.3
1,761.8125.5
1,636.3488.8600.5336.0211.0
180.823.625.471.1
27.832.9
121.7
2,579.7
1,940.6569.8539.6831.2344.2115.2179.7
June
2,509.0519.8327.1192.722.3
1,966.9166.7
1,800.2600.2621.3339.2239.5
218.334.426.577.2
31.948.3
189.3
2,916.6
2,038.3602.3544.5891.6478.8215.0184.4
344.0
198.1
2,304.1492.5315.2177.322.3
1,789.4133.6
1,655.8492.5607.8338 9216.5
199.432.926.476.6
30.133.4
129.6
2,633.2
1,972.7593.6541.7837.4362.6116.7181.2
1. Back data are available from the Banking and Monetary Statistics section.Board of Governors of the Federal Reserve System, Washington, D.C., 20551.These data also appear in the Board's weekly H.8 (510) release.
Figures are partly estimated. They include all bank-premises subsidiaries andother significant majority-owned domestic subsidiaries. Loan and securities datafor domestically chartered commercial banks are estimates for the last Wednes-day of the month based on a sample of weekly reporting banks and quarter-endcondition report data. Data for other banking institutions are estimates made for
the last Wednesday of the month based on a weekly reporting sample offoreign-related institutions and quarter-end condition reports.
2. Commercial banking institutions include insured domestically charteredcommercial banks, branches and agencies of foreign banks. Gage Act andAgreement corporations, and New York State foreign investment corporations.
3. Insured domestically chartered commercial banks include all member banksand insured nonmember banks.

Weekly Reporting Commercial Banks A19
1.26 ASSETS AND LIABILITIES OF LARGE WEEKLY REPORTING COMMERCIAL BANKS1
Millions of dollars, Wednesday figures
Account1988
May 4 May 11 May 18 May 25 June 1 June 8 June 15 June 22 June 29
1 Cash and balances due from depository institutions2 Total kniu, leases, and securities, net3 U.S. Treasury and government agency4 Trading account5 Investment account6 Mortgage-backed securities2
All other maturing in7 One year or less8 Over one through five years9 Over five years
10 Other securities11 Trading account12 Investment account13 States and political subdivisions, by maturity14 One year or less15 Over one year16 Other bonds, corporate stocks, and securities17 Other trading account assets18 Federal funds sold3
19 To commercial banks20 To nonbank brokers and dealers in securities21 To others22 Other loans and leases, gross23 Other loans, gross24 Commercial and industrial25 Bankers acceptances and commercial paper26 All other27 U.S. addressees28 Non-U.S. addressees29 Real estate loans30 Revolving, home equity31 All other32 To individuals for personal expenditures33 To depository and financial institutions34 Commercial banks in the United States35 Banks in foreign countries36 Nonbank depository and other financial institutions . . . .37 For purchasing and carrying securities38 To finance agricultural production39 To states and political subdivisions40 To foreign governments and official institutions —41 Allother42 Lease financing receivables43 LESS: Unearned income ,44 Loan and lease reserve45 Other loans and leases, net46 All other assets47 ToUl assets48 Demand deposits49 Individuals, partnerships, and corporations50 States and political subdivisions51 U.S. government52 Depository institutions in the United States53 Banks in foreign countries54 Foreign governments and official institutions55 Certified and officers' checks56 Transaction balances other than demand deposits57 Nontrsnsaction balances58 Individuals, partnerships, and corporations59 States and political subdivisions60 U.S. government61 Depository institutions in the United States62 Foreign governments, official institutions, and banks .63 Liabilities for borrowed money64 Borrowings from Federal Reserve Banks65 Treasury tax-and-loan notes >66 All other liabilities for borrowed money3
67 Other liabilities and subordinated notes and debentures .68 Total liabilities69 Residual (total assets minus total liabilities)6
MEMO70 Total loans and leases (gross) and investments adjusted7 . . .71 Total loans and leases (gross) adjusted7
72 Time deposits in amounts of $100,000 or more73 U.S. Treasury securities maturing in one year or less74 Loans sold outright to affiliates—total"75 Commercial and industrial76 Other77 Nontransaction savings deposits (including MMDAs)
109,0221,130,200130,547r15,299115,248'41,541r
17,764'46,784'9,159'
73,434'2,01571,419'48,8515,915
42,93622,568'3,488
82,68548,02523,29011,370
881,412860,133301,911'2,299'
299,612'296,952
2,661'274,26619,046
255,220162,23249,55223,0603,876
22,61612,2185,575
31,3032,14820,92821,2794,834
36,532840,046128,413
1,367,634238,177183,8377,8365,277
24,9836,425842
8,97672,688
592,396552,584'29,021'
9629,032796
295,0461,825
25,331267,89082,484
1,280,79086,844
1,100,481893,012181,47817,081'1,4941,026468
250,664
103,9761,112,048130,852'16,042114,810'41,625'
17,023'47,041'9,121'
73,290'1,910
71,381'48,8305,92442,90622,551'3,290
66,04137,53919,1439,358
879,984858,699300,851'2,121
298,729'2 % , 123
2,606'275,08419,160
255,925162,16649,50022,9903,975
22,53411,8795,620
31,1282,158'20,31421,2854,85636,553838,575127,693
1,343,717222,603176,6125,6212,853
20,9886,813710
9,00671,172592,832552,432'29,728'
9608,940772
286,6161,550
26,124258,94283,109
1,254,33287,385
1,092,927885,495181,83417,038'1,5021,034468
250,551
101,9011,116,620131,578'16,321115,257'41,668'
16,92847,434'9,226'
72,978'1,58771,W48,7825,905
42,87722,608'2,812
69,83442,44518,9998,390
880,879859,624300,003'2,106'
297,897'295,354'
2,542'276,13019,272
256,858161,785'49,24623,2973,600
22,35013,1985,634
31,1122,136'20,37921,2564,909
36,552839,418128,287
1,346,808224,955176,4415,8894,14222,9706,036854
8,62471,047
594,807553,904'30,197'1,0508,923732
283,9242,502
20,105261,31784,773
1,259,50687,303
1,092,340884,972182,07616,082'1,5251,064460
252,228
91,7011,113,781132,517'15,668
116,849'42,209'
17,422'47,676'9,543'72,946'1,634'
71,311'48,739'5,867'
42,872'22,572'2,96668,10541,38617,4109,309
878,705857,252298,743'2,088
296,655'294,106'
2,548'277,24419,365
257,879161,957'48,93222,8113,77122,35011,7045,66630,9932,051'19,96121,4534,919
36,539837,247122,326
1,327,807215,417170,8515,6292,12121,0355,998623
9.15970,279
595,070554,076'30,377'1,0598,842716
274,3372,40017,846
254,09185,751
1,240,85486,953
1,091,042882,613182,31517,168'1,5341,088447
252,015
133,4431,139,009132,00016,311115,69041,833
17,13647,1839,53873,7721,719
72,05348,5315,661
42,87023,5223,26285,34652,60821,69511,044
886,011864,508299,2722,232
297,040294,4292,611
277,44719,448
257,998162,48950,40223,1644,05523,18413,7375,71531,0062,23522,20621,5034,883
36,500844,628126,489
1,398,940268,245205,9297,3311,536
32,1327,719892
12,70573,306
596,663555,87030,1911,0648,824713
287,7212,55013,599
271,57284,911
1,310,84688,094
1,104,620895,586180,49316,5101,4741,027447
255,212
103.5381,123,319133,97318,859
115,11441,866
16,58847,1319,53073,3201,654
71,66648,2755,633
42,64223,3922,972
71,90442,94318,66910,292
882,488860,702299,934
2,206297,729295,1092,619
277,86819,566
258,302162,56049,67723,2293,829
22,61911,5685,745
30,8971,950
20,50321,7864,896
36,442841,149122,480
1,349,337226,593179,5925,3363,153
21,7646,283732
9,73373,295598,320557,37930,3831,0328,793714
277,6932,9003,066
271,72784,632
1,260,53488,803
1,098,485888,219182,32917,1431,4681,018449
254,595
123,0971,14434
134,74721,246
113,50241,329
16,42646,1869,561
73,4151,929
71,48648,2125,590
42,62123,2743,418
86,83953,73222,45610,651
887,250865,401300,612
2,083298,529295,964
2,565278,928
19,686259,242162,54849,18122,6404,071
22,46913,7725,609
30,8372,080
21,83321,8504,903
36,384845,964127,252
1,394,733263,607198,136
7,02315,72326,0866,225
7779,635
73,605599,690558,81430,374
1,0598,681
762283,733
3,8533,061
276,81885,712
1,306,347
88,386
1,109,298897,717182,66216,4771,403
953450
255,227
100,2361,124,669
131,58418,016
113,56741,904
16,17645,9889,499
72,8571,690
71,16648,1385,541
42,59823,0283,257
70,77042,18419,6108,976
887,516865,604300,399
2,111298,288295,736
2,552279,800
19,838259,962162,46449,83223,3034,198
22,33012,8565,672
30,7931,978
21,81021,9124,939
36,376846,201123,042
1,347,947222,352175,839
6,4632,785
20,9396,988
6878,650
71,019601,289560,65930,046
1,0708,726
789282,480
1,80026,044
254,63682,502
1,259,64288,304
1,100,497892,799184,66915,5341,441
989452
254,349
107,9431,128,637
130,13216,677
113,45541,742
16,71545,3689,630
73,1441,939
71,20448,006
5,34842,65923,1983,459
74,58347,64018,2498,694
888,317866,365300,901
2,158298,743296,212
2,531280,873
19,970260,904162,47048,61122,1083,786
22,71713,7125,614
30,7591,982
21,44321,9524,913
36,086847,318128,183
1,364,763232,704182,577
5,9793,008
22,4337,1701,091
10,44670,702
599,672559,87129,213
1,0808,715
793287,766
1,67525,580
260,51185,491
1,276,33588,428
1,099,888893,153183,50016,2801,5221,068
454253,607
1. Beginning Jan. 6, 1988, the "Large bank" reporting group was revisedsomewhat, eliminating some former reporters with less than $2 billion of assetsand adding some new reporters with assets greater than $3 billion.
2. Includes U.S. government-issued or guaranteed certificates of participationin pools of residential mortgages.
3. Includes securities purchased under agreements to resell.4. Includes allocated transfer risk reserve.5. Includes federal funds purchased and securities sold under agreements to
repurchase; for information on these liabilities at banks with assets of $1 billion ormore on Dec. 31,1977, see table 1.13.
6. This is not a measure of equity capital for use in capital-adequacy analysis orfor other analytic uses.
7. Exclusive of loans and federal funds transactions with domestic commercialbanks.
8. Loans sold are those sold outright to a bank's own foreign branches,nonconsolidated nonbank affiliates of the bank, the bank's holding company (ifnot a bank), and nonconsolidated nonbank subsidiaries of the holding company.

A20 Domestic Financial Statistics • September 1988
1.28 ASSETS AND LIABILITIES OF LARGE WEEKLY REPORTING COMMERCIAL BANKSIN NEW YORK CITY1
Millions of dollars, Wednesday figures
Account
1988
May 4 May 11 May 18 May 25 June 1 June 8 June 15 June 22 June 29
1 Cash balances due from depository institutions
2 Total loans, leases and securities, net2
Securities3 U.S. Treasury and government agency3
4 Trading account3
5 Investment account6 Mortgage-backed securities*
Another maturing in7 One year or less8 Over one through five years9 Over five years
10 Other securities3 ,11 Trading account
Investment accountStates and political subdivisions, by maturity ,
One year or lessOver one year
1213141516 Other bonds, corporate stocks, and securities.17 Other trading account assets'
Loans and leases18 Federal funds sold5
19 To commercial banks20 To nonbank brokers and dealers in securities21 To others22 Other loans and leases, gross23 Other loans, gross
Commercial and industrialBankers acceptances and commercial paperAll other
U.S. addresseesNon-U.S. addressees
Real estate loansRevolving, home equityAllother
To individuals for personal expendituresTo depository and financial institutions
Commercial banks in the United StatesBanks in foreign countriesNonbank depository and other financial institutionsr purchasing and carrying securities
e p y other n cFor purchasing and carrying securitiesTo finance agricultural production
d l i i l bdg poductio
To states and political subdivisionsTo foreign governments and official institutionsAllother
42 Lease financing receivables43 LESS: Unearned income44 Loan and lease reserve45 Other loans and leases, net"46 All other assets7
47 Total assets
Deposits48 Demand deposits49 Individuals, partnerships, and corporations50 States and political subdivisions51 U.S. government52 Depository institutions in the United States53 Banks in foreign countries54 Foreign governments and official institutions55 Certified and officers' checks56 Transaction balances other than demand deposits
(ATS, NOW, Super NOW, telephone transfers) . . .57 Nontransaction balances58 Individuals, partnerships, and corporations59 States and political subdivisions60 U.S. government61 Depository institutions in the United States62 Foreign governments, official institutions, and banks .63 Liabilities for borrowed money64 Borrowings from Federal Reserve Banks65 Treasury tax-and-loan notes66 All other liabilities for borrowed money67 Other liabilities and subordinated notes and debentures .
68 Total liabilities
69 Residual (total assets minus total liabilities)9
MEMO
70 Total loans and leases (gross) and investments adjusted •71 Total loans and leases (gross) adjusted10
72 Time deposits in amounts of $100,000 or more73 U.S. Treasury securities maturing in one year or l e s s . . .
25,427
225,498
00
15,422'5,725'
2,653'4,6412,403'
00
16,702'12,9081,009
11,8993,794'
0
38,18615,47614,5388,173
170,413165,47858,943
53158,41257,968
44546,424
2,88843,53621,33820,82412,0102,3026,5124,351
2716,981
6235,7234,9341,490
13,737155,18657,960
308,884
58,09340,057
9311,0146,4845,190
6983,720
8,716104,81996,784
5,99726
1,744267
80,4260
6,95073,47732,047
284,102
24,783
213,238181,11337,8%
3,852
23,881
215,113
00
14,951'5,722'
2,218'4,6842,326'
00
16,646'12,9511,010
11,9413,695'
0
29,30511,41011,2536,642
169,490164,54758,228
47457,75457,313
44146,339
2,89943,44021,37221,16812,3582,4646,3464,116
2816,918
6255,4984,9431,507
13,772154,21158,133
297,128
52,35436,359
581565
4,7645,503
5664,017
8,566104,55696,401
6,22831
1,629266
75,6400
7,55968,08130,955
272,071
25,057
206,624175,02737,5863,998
21,175
215,645
00
15,4045,819
2,7084,7192,158
00
16,63312,9411,003
11,9383,692
0
29,34912,10111,4935,754
169,569164,63257,270
47256,79856,381
41746,592
2,91043,68221,39720,85412,3362,0996,4195,471
2786,909
6205,2404,9371,527
13,783154,25960,842
297,662
54,11037,350
827823
6,2004,802
6943,413
8,618105,37996,884
6,53735
1,661262
73,1620
6,02867,13431,396
272,665
24,997
206,517174,48037,834
3,579
18,552
214,427
00
15,1615,521
2,7424,7272,172
00
16,58012,942
99611,9463,638
0
29,54413,9028.9896.652
168,466163,50557,214
46356,75256,340
41246,634
2,92743,70721,45420,70011,9722,2426,4864,318
2946,876
5485,4674,9601,542
13,782153,14257,150
290,129
52,17036,355
701394
5,3484,784
4614,128
8,561105,88297,0886,765
381,729
26266,224
05,384
60,84032,516
265,354
24,775
203,876172,13538,1703,982
35,082
226,149
00
14,8565,520
2,4144,7502,171
00
16,80112,9501,002
11,9473,852
0
38,13916,98413,0268,129
171,689166,72057,161
48756,67456,204
47046,666
2,93743,72821,52921,24711,9932,5126,7425,893
2896,904
7336,2974,9691,520
13,817156,35260,885
322,116
72,30047,495
1,109207
10,2776,448
7536,011
8,873106,19597,5326,667
411,695
26176,690
04,098
72,59232,541
296,600
25,516
212,508180,85137,3463,620
25,185
215,179
00
14,8825,513
2,3854,8092,175
00
16,80212,949
99611,9533,853
0
30,35712,09910,4117,846
168,464163,23857,189
45456,73556,302
43346,767
2,95043,81821,52320,67012,2102,2226,2383,935
2916,952
4815,4295,2261,532
13,794153,13758,708
299,072
55,00337,919
579646
5,5205,057
5844,697
8,812105,23296,4906,702
301,751
25872,151
0677
71,47431,988
273,186
25,886
206,1%174,51237,3344,262
33,809
228,243
0o
14,8185,512
2,3254,8392,141
00
16,79812,953
98611,9673,846
0
39,54218,37413,4677,701
172,414167,15958,122
43157,69157,284
40746,6702,966
43,70321,49121,01012,0272,5446,4395,717
3026,886
6566,3065,2551,537
13,793157,08561,415
323,466
70,94847,320
1,2264,6248,0265,049
6254,078
8,952105,894%,922
6,85133
1,816272
78,023725609
76,68933,992
297,810
25,656
213,172181,55537,350
3,700
21,791
218,686
00
14,7475,453
2,3154,8382,141
00
16,67912,937
97911,9583,742
0
30,76613,95110,4856,330
171,832166,55757,548
42257,12656,730
3 %46,%2
2,98043,98221,30222,02712,8%2,7636,3684,556
2986,866
5756,4225,2751,546
13,791156,49456,621
297,099
54,34837,910
631483
5,4395,761
5053,618
8,6%106,29097,125
7,00142
1,817303
72,7180
7,52665,19229,545
271,596
25,502
207,178175,75237,767
3,158
27,325
218,753
00
14,7025,431
2,3114,8112,149
00
16,44412,866
86612,0003,578
0
32,54516,5739,7306,242
170,391165,11057,389
44656,94356,515
42847,041
2,99544,04620,92820,73011,9442,2476,5405,480
2956,836
6075,8045,2811,564
13,765155,06259,094
305,172
59,10540,222
775560
6,0785,934
8584,679
8,644105,347%,600
6,65742
1,740307
73,8500
6,87966,97132,797
279,743
25,430
205,565174,41937,031
3,302
1. These data also appear in the Board's H.4.2 (504) release. For address, seeinside front cover.
2. Excludes trading account securities.3. Not available due to confidentiality.4. Includes U.S. government-issued or guaranteed certificates of participation
in pools of residential mortgages.5. Includes securities purchased under agreements to resell.6. Includes allocated transfer risk reserve.
7. Includes trading account securities.8. Includes federal funds purchased and securities sold under agreements to
repurchase.9. Not a measure of equity capital for use in capital adequacy analysis or for
other analytic uses.10. Exclusive of loans and federal funds transactions with domestic commer-
cial banks.
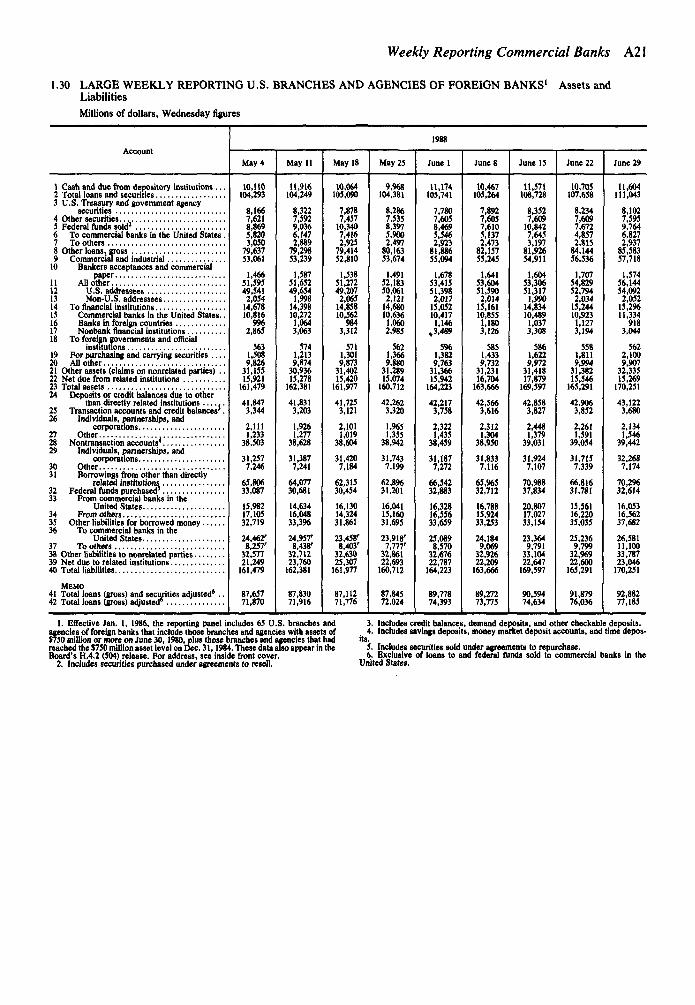
Weekly Reporting Commercial Banks A21
1.30 LARGE WEEKLY REPORTING U.S. BRANCHES AND AGENCIES OF FOREIGN BANKS1 Assets andLiabilities
Millions of dollars, Wednesday figures
Account
May 4 May II May 18 May 25 June 1 June 8 June 13 June 22 June 29
1 Cash and due from depository institutions . .2 Total loans and securities3 U.S. Treasury and government agency
securities4 Other securities.5 Federal funds sold5
6 To commercial banks in the United States7 To others8 Other loans, gross9 Commercial and industrial
10 Bankers acceptances and commercialpaper
11 All other12 U.S. addressees13 Non-U.S. addressees14 To financial institutions15 Commercial banks in the United States.16 Banks in foreign countries17 Nonbank financial institutions18 To foreign governments and official
institutions19 For purchasing and carrying securities. . .20 Allother21 Other assets (claims on nonrelated parties) .22 Net due from related institutions23 Total assets24 Deposits or credit balances due to other
than directly related institutions .25 Transaction accounts and credit balances3
26 Individuals, partnerships, andcorporations
27 Other28 Nontransaction accounts4
29 Individuals, partnerships, andcorporations
30 Other31 Borrowings from other than directly
related institutions32 Federal funds purchased'33 From commercial banks in the
United States34 From others35 Other liabilities for borrowed money36 To commercial banks in the
United States37 To others38 Other liabilities to nonrelated parties39 Net due to related institutions40 Total liabilities
MEMO41 Total loans (gross) and securities adjusted' .42 Total loans (gross) adjusted'
10,110104,293
8,1667,6218,8695,8203,050
79,63753.061
1,46651,59549,541
2,05414,67810,816
9962,865
5631,5089.826
31,15515,921
161,479
41,8473,344
2,1111,233
38,503
31,2577,246
65,80633,087
15,98217,10532,719
24,462'8,257r
32,57721,249
161,479
87,65771,870
11,916104,249
8,3227,5929,0366,1472,889
79,29853,239
1,58751,65249,654
1,99814,39810,2721,0643,063
5741,2139,874
30,93615,278
162,381
41,8313,203
1,9261,277
38,628
31,3877,241
64,07730,681
14,63416,04833,396
24,957'8,438'
32,71223,760
162,381
87,83071,916
10,064105,090
7,8787,457
10,3407,4162,925
79,41452,810
1,53851,27249,207
2,06514,85810,562
9843,312
5711,3019,873
31,40215,420
161,977
41,7253,121
2,1011,019
38,604
31,4207,184
62,31530,454
16,13014,32431,861
23,458'8,403'
32,63025,307
161,977
87,11271,776
9,968104,381
8,2867.5358,3975,9002,497
80,16353,674
1,49152,18350,061
2,12114,68010,636
1,0602,985
5621,3669.880
31,28915,074
160,712
42,2623,320
1,9651,355
38,942
31,7437,199
62,89631,201
16,04115,16031,695
23,918'7,777'
32,86122,693
160,712
87,84572,024
11,174105,741
7,7807,6058,4695,5462,923
55,094
1,67853,41551,398
2,01715,05210,417
1,146»3,489
5961,3829,763
31,36615,942
164,223
42,2173,758
2,3221,435
38,459
31,1877,272
66,54232,883
16,32816,55633,659
25,0898,570
32,67622,787
164,223
89,77874,393
10,467105,264
7,8927,6057,6105,1372,47382,15755,245
1,64153,60451,5902,01415,16110,8551,1803,126
S851,4339,73231,23116,704163,666
42,5663,616
2,3121,304
38,950
31,8337,116
65,96532,712
16,78815,92433,253
24,1849,069
32,92622,209163,666
89,27273,775
11,571108,728
8,3527,609
10,8427,6453,197
81,92654,911
1,60453,30651,317
1,99014,83410,489
1,0373,308
5861,6229,972
31,41817,879
169,597
42,8583,827
2,4481,379
39,031
31,9247,107
70,98837,834
20,80717,02733,154
23,3649,791
33,10422,647
169,597
90,59474,634
10,705107,658
8,2347,6097,6724,8572,815
84,14456,536
1,70754,82952,794
2,03415,24410,9231,1273,194
5581,8119,994
31,38215,546
165,291
42,9063,852
2,2611,591
39,054
31,7157,339
66,81631,781
15,56116,22035,035
25,2369,799
32,96922,600
165,291
91,87976,036
11,604111,043
8,1027,5959,7646,8272,937
85,58357,718
1,57456,14454,092
2,05215,29611,334
9183,044
5622,1009,907
32,33515,269
170,251
43,1223,680
2,1341,546
39,442
32,2687,174
70,29632,614
16,05316,56237,682
26,58111,10033,78723,046
170,251
92,88277,185
1. Effective Jan. 1, 1986, the reporting panel includes 65 U.S. branches andagencies of foreign banks that include those branches and agencies with assets of$750 million or more on June 30,1980,_plus those branches and agencies that hadreached the $750 million asset level on Dec. 31,1984. These data also appear in theBoard's H.4.2 (504) release. For address, see inside front cover.
2. Includes securities purchased under agreements to resell.
3. Includes credit balances, demand deposits, and other checkable deposits.4. Includes savings deposits, money market deposit accounts, and time depos-
its.5. Includes securities sold under agreements to repurchase.6. Exclusive of loans to and federal funds sold to commercial banks in the
United States.
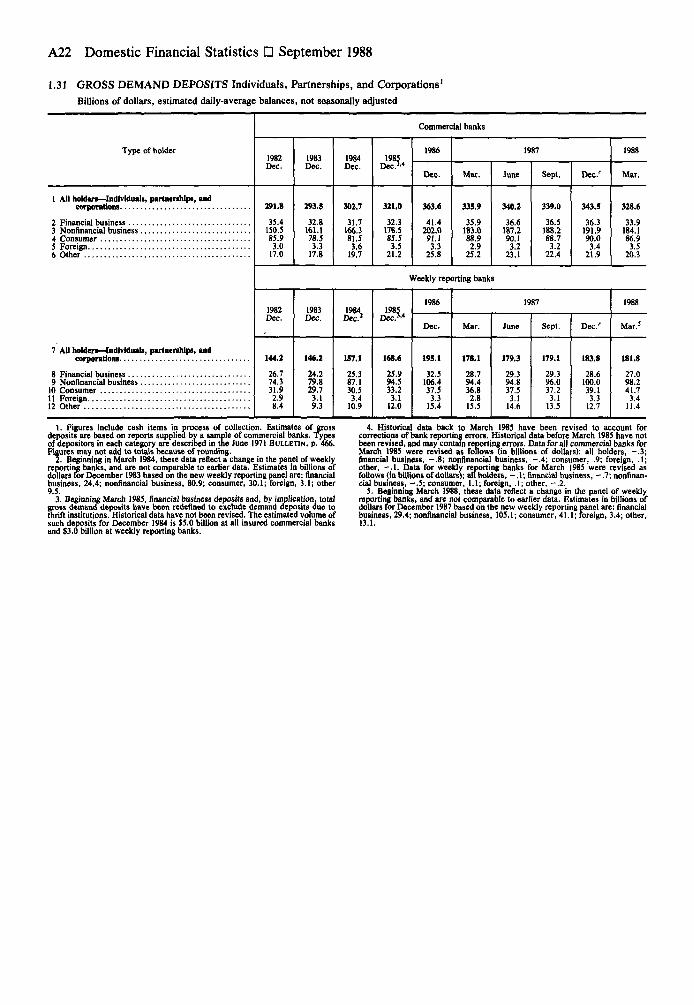
A22 Domestic Financial Statistics • September 1988
1.31 GROSS DEMAND DEPOSITS Individuals, Partnerships, and Corporations'
Billions of dollars, estimated daily-average balances, not seasonally adjusted
Type of holder
1 AU holder*-Individuals, partnerships, and
6 Other
7 All holders—Individuals, partnerships, and
11 Foreign12 Other
Commercial banks
1982Dee.
291.8
35.4150.585.93.0
17.0
1982Dec.
i
144.2
26.774.331.92.98.4
1983Dec.
293.5
32.8161.178.53.3
17.8
1983Dec.
146.2
24.279.829.73.19.3
1984Dec.
302.7
31.7166.381.53.6
19.7
1984Dec.2
1S7.1
25.387 130.53.4
10.9
1985Dec.3'4
321.0
32.3178.585.5
3.521.2
1986
Dec.
363.6
41.4202.091.1
3.325.8
1987
Mar.
335.9
35.9183.088.9
2.925.2
June
340.2
36 6187.290.1
3.223.1
Sept.
339.0
36.5188.288.7
3.222.4
Weekly reporting banks
1985Dec.5'4
168.6
25.994.533.23.1
12.0
1986
Dec.
195.1
32.5106.437.53.3
15.4
Dec/
343.5
36.3191.990.0
3.421.9
1987
Mar.
178.1
28.794.436.82.8
15.5
June
179.3
29.394837.53.1
14.6
Sept.
179.1
29.396.037.23.1
13.5
Dec.'
183.8
28.6100.039.13.3
12.7
1988
Mar.
328.6
33.9184.186.9
3.520.3
1988
Mar.5
181.8
27.098.241.73.4
11.4
1. Figures include cash items in process of collection. Estimates of grossdeposits are based on reports supplied by a sample of commercial banks. Typesof depositors in each category are described in the June 1971 BULLETIN, p. 466.Figures may not add to totals because of rounding.
2. Beginning in March 1984, these data reflect a change in the panel of weeklyreporting banks, and are not comparable to earlier data. Estimates in billions ofdollars for December 1983 based on the new weekly reporting panel arc: financialbusiness, 24.4; nonfinancial business, 80.9; consumer, 30.1; foreign, 3.1; other9.5.
3. Beginning March 1985, financial business deposits and, by implication, totalgross demand deposits have been redefined to exclude demand deposits due tothrift institutions. Historical data have not been revised. The estimated volume ofsuch deposits for December 1984 is $5.0 billion at all insured commercial banksand $3.0 billion at weekly reporting banks.
4. Historical data back to March 1985 have been revised to account forcorrections of bank reporting errors. Historical data before March 1985 have notbeen revised, and may contain reporting errors. Data for all commercial banks forMarch 1985 were revised as follows (in billions of dollars): all holders, - . 3 ;financial business, - . 8 ; nonfinancial business, - . 4 ; consumer, .9; foreign, .1;other, - . 1 . Data for weekly reporting banks for March 1985 were revised asfollows (in billions of dollars); all holders, - . 1 ; financial business, - . 7 ; nonfinan-cial business, - . 5 ; consumer, 1.1; foreign, .1; other, - . 2 .
5. Beginning March 1988, these data reflect a change in the panel of weeklyreporting banks, and are not comparable to earlier data. Estimates in billions ofdollars for December 1987 based on the new weekly reporting panel are: financialbusiness, 29.4; nonfinancial business, 105.1; consumer, 41.1; foreign, 3.4; other,13.1.

Financial Markets A23
1.32 COMMERCIAL PAPER AND BANKERS DOLLAR ACCEPTANCES OUTSTANDING
Millions of dollars, end of period
Instrument 1983Dec.
1984Dec.
1985Dec.
1986Dec.
1987Dec.
1987
Dec.
1988
Jan.1 Feb. Mar. Apr. May
Commercial paper (seasonally adjusted unless noted otherwise)
1 All Issuers
Financial companies2
Dealer-placed paper2 Total3 Bank-related (not seasonally
adjusted)Directly placed paper
4 Total5 Bank-related (not seasonally
adjusted) v6 Nonfinancial companies3
7 Total
Holder8 Accepting banks9 Own bills
10 Bills boughtFederal Reserve Banks
11 Own account12 Foreign correspondents..13 Others
Basis14 Imports into United States.15 Exports from United States16 All other
187,658
44,455
2,441
97,042
35,56646,161
£37,586
56,485
2,035
110,543
42,10570,558
298,779
78,443
1,602
135,320
44,77885,016
329,991
101,072
2,265
151,820
40,86077,099
357,129
101,958
1,428
173,939
43,17381,232
357,129
101,958
1,428
173,939
43,17381,232
380,339
120,930
1,694
175,467
45,42583,942
388,893
125,914
1,724
174,595
43,98788,384
391,305
128,680
1,371
173,316
43,68189,309
406,484
133,946
1,093
180,119
45,70392,419
Bankers dollar acceptances (not seasonally adjusted)6
78,309
9,3558,1251,230
418729
67,807
15,64916,88045,781
78,364
9,8118,6211,191
0671
67,881
17,84516,30544,214
68,413
11,1979,4711,726
0937
56,279
15,14713,20440,062
64,974
13,42311,7071,716
01,317
50,234
14,67012,96037,344
70,565
10,9439,4641,479
0965
58,658
16,48315,22738,855
70,565
10,9439,4641,479
0965
58,658
16,48315,22738,855
62,957'
8,602r
7,759r
843
0831
53,524'
14,468'14,05434,436'
62,419
9,6298,5611,067
0833
51,958
14,35413,89134,173
63,454
10,2438,8251,417
0795
52,417
14,57513,89934,980
64,112
10,2958,9291,366
0803
53,014
14,71514,74634,652
414,312
137,838
1,422
185,876
47,71990,598
63,332
9,3228,498
825
01,050
52,960
13,97414,59034,768
1. Data reflect a break in series resulting from additions to the reportingpanel and from the correction of a misclassification that had understated dealer-placed financial and overstated nonfinancial outstandings.
2. Institutions engaged primarily In activities such as, but not limited to,commercial sayings, and mortgage banking; sales, personal, and mortgage fi-nancing; factoring, finance leasing, and other business lending; insurance under-writing; and other investment activities.
3. Includes all financial company paper sold by dealers in the open market.4. As reported by financial companies that place their paper directly with
investors.
5. Includes public utilities and Arms engaged primarily in such activities ascommunications, construction, manufacturing, mining, wholesale and retail trade,transportation, and services.
6. Beginning January 1988, the number of respondents in the bankers accep-tance survey were reduced from 155 to 111 institutions—those with $100 millionor more in total acceptances. The new reporting group accounts for over 90percent of total acceptances activity.
1.33 PRIME RATE CHARGED BY BANKS on Short-Term Business Loans
Percent per year
Effective date
1985—Jan. 15May 20June 18
1986-Mar. 7Apr. 21July 11Aug. 26
Rate
10.5010.009.50
9.008.508.007.50
Effective Date
1987 Apr. 1^ , 5Sept. 4Oct. 7
22Nov. 5
1988-Feb. 2May 11July 14
Rate
7.758.008.258.759.259.008.75
8.509.009.50
Month
1985—JanFebMar
MayJuneJulyAugSeptOctNovDec
1986—JanFebMarAprMayJuneJulyAugSeptOct
Averagerate
10.6110.5010.5010.5010.319.789.509.509.509.509.509.50
9.509.509.108.838.508.508.167.907.507.50
Month
1986-NovDec
1987-JanFebMarAprMayJuneJulyAugSeptOctNovDec
1988-JanFebMarAprMayJune
Averagerate
7.507.50
7.507.507.507.758.148.258.258.258.709.078.788.75
8.758.518.508.508.849.00
NOTE. These data also appear in the Board's H.15 (519) release. For address,see inside front cover.
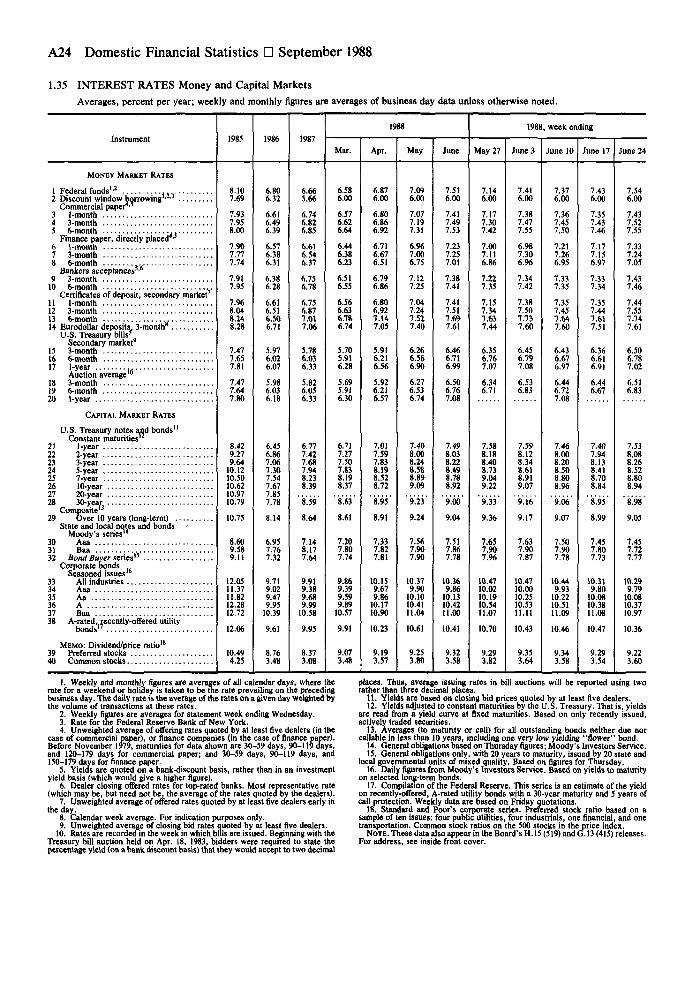
A24 Domestic Financial Statistics • September 1988
1.35 INTEREST RATES Money and Capital Markets
Averages, percent per year; weekly and monthly figures are averages of business day data unless otherwise noted.
Instrument
MONEY MARKET RATES
1 Federal funds1'2
Commercial paper-5
3 1-month
Finance paper, directly placed*'5
Bankers acceptances5'6
9 3-month10 6-month
Certificates of deposit, secondary marker11 1-month
U.S. Treasury bills*Secondary marker
15 3-month
17 1-yearAuction average1"
18 3-month
20 1-year
CAPITAL MARKET RATES
U.S. Treasury notes and bonds11
Constant maturities12
25 7-year26 10-year27 20-year28 30-year
Composite'3
29 Over 10 years (long-term)State and local notes and bonds
Moody's series14
30 Aaa31 Baa
Corporate bondsSeasoned issues16
33 All industries34 Aaa35 Aa36 A37 Baa38 A-rated, recently-offered utility
MEMO: Dividend/price ratio18
39 Preferred stocks
1985
8.107.69
7.937.958.00
7.907.777.74
7.917.95
7.968.048.248.28
7.477.657.81
7.477.647.80
8.429.279.64
10.1210.5010.6210.9710.79
10.75
8.609.589.11
12.0511.3711.8212.2812.72
12.06
10.494.25
1986
6.806.32
6.616 496.39
6.576.386.31
6.386.28
6.616.516.506.71
5.976.026.07
5.986.036.18
6.456.867.067 307.547.677.857.78
8.14
6.957.767.32
9 719.029.479.95
10.39
9.61
8.763.48
1987
6.665.66
6.746 826.85
6.616.546.37
6 756.78
6.756.877.017.06
5.786.036.33
5.826.056.33
6.777.427.687948.238.39
8.59
8.64
7.148.177.64
9.919.389.689.99
10.58
9.95
8.373.08
1988
Mar.
6.586.00
6.576.626.64
6.446.386.23
6.516.55
6.566.636.786.74
5.705.916.28
5.695.916.30
6.717.277.507.838.198.37
8.63
8.61
7.207.807.74
9.869.399.599.89
10.57
9.91
9.073.48
Apr.
6.876.00
6.806.866.92
6.716.676.51
6.796.86
6.806.927.147.05
5.916.216.56
5.926.216.57
7.017.597.838.198.528.72
8.95
8.91
7.337.827.81
10.159.679.86
10.1710.90
10.23
9.193.57
May
7.096.00
7.077.197.31
6.967.006.75
7.127.25
7.047.247.527.40
6.266.566.90
6.276.536.74
7.408.008.248.588.899.09
9.23
9.24
7.567.907.90
10.379.90
10.1010.4111.04
10.61
9.253.80
June
7.516.00
7.417.497.53
7.237.257.01
7.387.41
7.417.517.697.61
6.466.716.99
6.506.767.08
7.498.038.228.498.788.92
9.00
9.04
7.517.867.78
10.369.86
10.1310.4211.00
10.41
9.323.58
May 27
7.146.00
7.177.307.42
7.007.116.86
7.227.35
7.157.347.637.44
6.356.767.07
6.346.71
7.588.188.408.739.049.22
9.33
9.36
7.657.907.96
10.4710.0210.1910.5411.07
10.70
9.293.82
1988
June 3
7.416.00
7.387.477.55
6.987.306.96
7.347.42
7.387.507.737.60
6.456.797.08
6.536.83
7.598.128.348.618.919.07
9.16
9.17
7.637.907.87
10.4710.0010.2510.5311.11
10.43
9.353.64
, week ending
June 10
7.376.00
7.367.457.50
7.217.266.95
7.337.35
7.357.457.647.60
6.436.676.97
6.446.727.08
7.468.008.208.508.808.96
9.06
9.07
7.507.907.78
10.449.93
10.2210.5111.09
10.46
9.343.58
June 17
7.436.00
7.357.437.46
7.177.156.97
7.337.34
7.357.447.617.51
6.366.616.91
6.446.67
7.407.948.138.418.708.84
8.95
8.99
7.457.807.73
10.319.80
10.0810.3811.08
10.47
9.293.54
June 24
7.546.00
7.437.527.55
7.337.247.05
7.437.46
7.447.557.747.61
6.506.787.02
6.516.83
7.538.088.268.528.808.94
8.98
9.05
7.457.727.77
10.299.79
10.0810.3710.97
10.36
9.223.60
1. Weekly and monthly figures are averages of all calendar days, where therate for a weekend or holiday is taken to be the rate prevailing on the precedingbusiness day. The daily rate is the average of the rates on a given day weighted bythe volume of transactions at these rates.
2. Weekly figures are averages for statement week ending Wednesday.3. Rate for the Federal Reserve Bank of New York.4. Unweighted average of offering rates quoted by at least five dealers (in the
case of commercial paper), or finance companies (in the case of finance paper).Before November 1979, maturities for data shown are 30-59 days, 90-119 days,and 120-179 days for commercial paper; and 30-59 days, 90-119 days, and150-179 days for finance paper.
5. Yields are quoted on a bank-discount basis, rather than in an investmentyield basis (which would give a higher figure).
6. Dealer closing offered rates for top-rated banks. Most representative rate(which may be, but need not be, the average of the rates quoted by the dealers).
7. Unweighted average of offered rates quoted by at least five dealers early inthe day.
8. Calendar week average. For indication purposes only.9. Unweighted average of closing bid rates quoted by at least five dealers.
10. Rates are recorded in the week in which bills are issued. Beginning with theTreasury bill auction held on Apr. 18, 1983, bidders were required to state thepercentage yield (on a bank discount basis) that they would accept to two decimal
places. Thus, average issuing rates in bill auctions will be reported using tworather than three decimal places.
11. Yields are based on closing bid prices quoted by at least five dealers.12. Yields adjusted to constant maturities by the U.S. Treasury. That is, yields
are read from a yield curve at fixed maturities. Based on only recently issued,actively traded securities.
13. Averages (to maturity or call) for all outstanding bonds neither due norcallable in less than 10 years, including one very low yielding "flower" bond.
14. General obligations based on Thursday figures; Moody's Investors Service.15. General obligations only, with 20 years to maturity, issued by 20 state and
local governmentaTunits of mixed quality. Based on figures for Thursday.16. Daily figures from Moody's Investors Service. Based on yields to maturity
on selected long-term bonds.17. Compilation of the Federal Reserve. This series is an estimate of the yield
on recently-offered, A-rated utility bonds with a 30-year maturity and 5 years ofcall protection. Weekly data are based on Friday quotations.
18. Standard and Poor's corporate series. Preferred stock ratio based on asample of ten issues: four public utilities, four industrials, one financial, and onetransportation. Common stock ratios on the 500 stocks in the price index.
NOTE. These data also appear in the Board's H. 15 (519) and G. 13 (415) releases.For address, see inside front cover.

Financial Markets A25
1.36 STOCK MARKET Selected Statistics
Indicator 1985 1986 19871987
Oct. Nov. Dec
1988
Jan. Feb. Mar. Apr. May June
Prices and trading (averages of daily figures)
Common stock prices1 New York Stock Exchange
(Dec. 31, 1965 = 50)2 Industrial3 Transportation4 Utility5 Finance6 Standard & Poor's Corporation
(1941-43 = io ) r
7 American Stock Exchange2
(Aug. 31, 1973 = 50)
Volume of trading (thousands of shares)8 New York Stock Exchange9 American Stock Exchange
10 Margin credit at broker-dealerr'
Free credit balances at brokers4
11 Margin-account'12 Cash-account
13 Margin stocks14 Convertible bonds15 Short sales
108.09123.79104.1156.75
114.21
186.84
229.10
09,1918,355
136.00155.85119.8771.36
147.19
236.34
264.38
141,38511,846
161.70195.31140.3974.29
146.48
286.83
316.61
188,64713,832
157.13189.86140.9573.27
137.35
280.16
306.34
277,02618,173
137.21163.42117.5769.86
118.30
245.01
249.42
179,51311,268
134.88162.19115.8567.39
111.47
240.96
248.52
178,51713,422
140.55168.47121.2070.01
119.40
250.48
267.29
174,7559,853
145.13173.44126.0972.89
124.36
258.13
276.54
184,6889,961
149.88181.57135.1571.16
125.27
265.74
295.78
176,18912,442
148.46181.01133.4069.35
121.66
262.61
300.43
162,51810,706
144.99176.02127.6368.66
120.35
256.12
296.30
153,9068,931
152.72184.92136.0272.25129.04
270.68
306.13
195,77211,348
Customer financing (end-of-period balances, in millions of dollars)
28,390
2,71512,840
36,840
4,88019,000
31,990
4,75015,640
38,250
8,41518,455
34,180
6,70015,360
31,990
4,75015,640
31,320
4,67515,270
31,990
4,55514,695
32,660
4,61514,355
33,27«
4,39513,965
33,070
4,38014,150
32,300
4,58014,460
Margin requirements (percent of market value and effective date)6
Mar. 11, 1968 June 8, 1968
705070
806080
May 6, 1970
655065
Dec. 6, 1971 Nov. 24, 1972
555055
655065
Jan. 3, 1974
505050
nnanciai.2. Beginning July 5, 1983, I
effectively cutting previous rea3. Beginning July 1983, un
1. Effective July 1976, includes a new financial group, banks and insurancecompanies. With this change the index includes 400 industrial stocks (formerly425), 20 transportation (formerly 15 rail), 40 public utility (formerly 60), and 40financial.
, the American Stock Exchange rebased its indexvious readings in half.
_ , 1983, under the revised Regulation T, margin credit atbroker-dealers includes credit extended against stocks, convertible bonds, stocksacquired through exercise of subscription rights, corporate bonds, and govern-ment securities. Separate reporting of data for margin stocks, convertible bonds,and subscription issues was discontinued in April 1984.
4. Free credit balances are in accounts with no unfulfilled commitments to thebrokers and are subject to withdrawal by customers on demand.
5. New series beginning June 1984.6. These regulations, adopted by the Board of Governors pursuant to the
Securities Exchange Act of 1934, limit the amount of credit to purchase and carry
"margin securities" (as denned in the regulations) when such credit is collatera-lized by securities. Margin requirements on securities other than options are thedifference between the market value (100 percent) and the maximum loan value ofcollateral as prescribed by the Board. Regulation T was adopted effective Oct. 15,1934; Regulation U, effective May 1,1936; Regulation O, effective Mar. 11, 1968;and Regulation X, effective Nov. 1,1971.
On Jan. 1, 1977, the Board of Governors for the first time established inl i T h i i i l i i d f rii i rii i
pt. 30,1985, the Board changed he required initial margin, a l lo ing it t e thesame as the option maintenance margin required by the appropriate exchange orself-regulatory organization; such maintenance margin rules must be approved bythe Securities and Exchange Commission. Effective Jan. 31, 1986, the SECapproved new maintenance margin rules, permitting margins to be the price of theoption plus 15 percent of the market value of the stock underlying the option.

A26 Domestic Financial Statistics G September 1988
1.37 SELECTED FINANCIAL INSTITUTIONS Selected Assets and LiabilitiesMillions of dollars, end of period
1985 1986
1987
July Aug. Sept. Oct. Nov. Dec.
1988
Jan. Feb.' Mar. Apr.
FSLIC-insured institutions
1 Assets
2 Mortgages3 Mortgage-backed
securities4 Contra-assets to
mortgage assets'5 Commercial loans6 Consumer loans7 Contra-assets to non-
mortgage loam2...8 Cash and investment
securities9 Other1
10 Liabilities and net worth
11 Savings capital12 Borrowed money13 FHLBB14 Other15 Other16 Net worth
1,070,012
690,717
115,525
45,21917,42445,809
2,521
143,538104,739
1,070,012
843,932157,66684,39073,27621,75646,657
1,163,851
697,451
158,193
41,79923,68351,622
3,041
164,844112,898
1,163,851
890,664196,929100,02596,90423,97552,282
1,207,750
701,282
182,067
41,95523,01855,186
3,150
170,788120,514
1,207,750
902,617226,093102,979123,11426,59952,441
1,216,995
704,815
186,101
42,02323,17456,079
3,242
170,071122,020
1,216,995
904,441232,332104,191128,14128,17052,052
1,218,829
708,433
191,829
42,43823,30056,118
3,442
164,034120,995
1,218,829
908,907234,941106,250128,69124,59950,382
1,239,62V
713,483'
196,865'
42,180'23,256'56,548'
3,373
173,114'121,908'
1,239,62c
916,843246,110'109,736136,374'27,094'49,574'
1,246,719'
717,928'
199,777'
41,396'23,29457,465
3,430'
170,702'122,381'
1,246,719'
922,340247,202'111,283liS9&27,399'49,778'
1,250,612'
721,595'
201,557'
42,319'23,171'57,901'
3,467'
169,712'122,462'
1,250,612'
932,612'249,645116,363133,28221,937'46,418'
1,254,585'
722,935'
201,353'
41,210'23,53c58,338'
3,579'
169,932'123,286'
1,254,585'
939,079'245,697'114,053'131,644'23,866'45,943'
1,257,400
723,878
199,677
10,75223,31858,685
3,525
174,075124,073
1,257,400
946,790239,317112,725126,59225,81845,505
1,261,522'
725,556'
197,622'
40,080'24,138'58,403'
3,588'
176,433'124,047'
1,261,522'
958,468'237,440'112,388'125,052'22,484'43,130'
1,274,294
728,820
202,245
38,15224,35059,115
3,491
178,139124,268
1,274,294
962,248244,724113,029131,69524,59842,744
FSLIC-insured federal savings banks
17 Assets
18 Mortgages19 Mortgage-backed
securities20 Contra-assets to
mortgage assets'21 Commercial loans22 Consumer loans23 Contra-assets to non-
131,868
72,355
15,676
8,361
24 Finance leases plusinterest
25 Cash and investment26 Other
27 Liabilities and net worth
28 Savings capital . .29 Borrowed money30 FHLBB31 Other32 Other33 Net worth
11,723
131,868
103,46219,32310,5108,8132,7326,351
210,562
113,638
29,766
13,180
19,034
210,562
157,87237,32919,89717,4324,26311,098
268,779
154,839
42,714
8,7776,27716,089
741
56933,67724,133
268,779
193,89053,65224,98128,6716,138
15,100
272,134
156,048
43,532
8,8536,213
16,549
704
57734,26724,506
272,134
194,85355,66025,54630,1146,45015,172
272,834
156,705
44,421
8,7006,18816,582
702
55233,58924,199
272,834
195,21356,54926,28730,2625,63115,444
276,560
158,507
45,117
8,7876,27516,563
690
55034,90224,122
276,560
197,29857,55127,35030,2016,293
15,416
279,221'
161,014
45,237
8,8096,540
17,343
712
56633,96524,078
279,221'
199,11458,27727,94730,3306,35015,481
284,272'
164,013
45,826'
9,098'6,504'17,696
678'
591'35,347'24,07^
284,272'
203,19660,71629,61731,0995,32415,036'
284,303'
163,918'
46,171'
8,909'6,496'17,649
60434,645'24,428'
284,303'
204,32959,20628,28030,9265,838'14,930'
295,952
171,594
46,687
9,1756,97118,795
737
58435,71825,516
295,952
214,169S9.70429,16930,5356,60215,478
307,738'
178,145'
47,981'
9,436'7,503'19,137'
798'
611'T3S,
26,396'
307,738'
224,168'61,532'30,45631,076'6,075'15,963'
311,400
180,464
49,008
9,3197,66219,610
722
61538,28925,792
311,400
226,46962,53530,07532,4606,45516,098
Savings banks
34 Assets
Loans35 Mortgage36 Other
Securities37 U.S. government . .38 Mortgage-backed
securities39 State and local
government . . .40 Corporate and other41 Cash42 Other assets
43 Liabilities
44 Deposits45 Regular4
46 Ordinary savings47 Time48 Other49 Other liabilities50 General reserve
accounts
216,776
110,44830,876
13,111
19,481
2,32321,199
6,22513,113
216,776
185,972181,92133,018
103,3114,051
17,414
12,823
236,866
118,32335,167
14,209
25,836
2,18520,4596,894
13,793
236,866
192,194186,34537,717
100,8095,849
25,274
18,105
246,833
129,62435,591
13,498
28,252
2,05018,8214,806
14,191
246,833
194,549188,78341,928
102,6035,766
31,655
19,718
249,888
130,72136,793
13,720
28,913
2,03818,5734,823
14,307
249,888
195,895190,33541,767
105,1335,560
32,467
20,471
251,472
133,29836,134
13,122
29,655
2,02318,4314,484
14,325
251,472
196,824191,37641,773
107,0635,448
32,827
20,407
255,989
135,31736,471
13,817
30,202
2,03418,0625,529
14,557
255,989
199,336193,77742,045
109,4865,559
34,226
20,365
260,600
137,04437,189
15,694
31,144
2,04617,5835,063
14,837
260,600
202,030196,72442,493
112,2315,306
36,167
21,133
259,643
138,49433,871
13,510
32,772
2,00318,7725,864
14,357
259,643
201,497196,03741,959
112,4295,460
35,720
20,633
258,628
137,85835,095
12,776
32,241
1,99418,7804,841
15,043
258,628
199,545194,32241,047
112,7815,223
36,836
20,514
259,224
139,10835,752
12,269
32,423
2,05318,2715,002
14,346
259,224
200,391195,33641,234
113,7515,055
35,787
20,894
262,100
140,83536,476
12,225
32,272
2,03318,3364.881
15,042
262,100
203,407198,27341,867
115,5295,134
35,737
21,024
262,269
139,691
37,471
13,203
31,0722,013
18,5495,237
15,033
262,269
203,273197,80141,741
115,8875,472
35,827
21,109
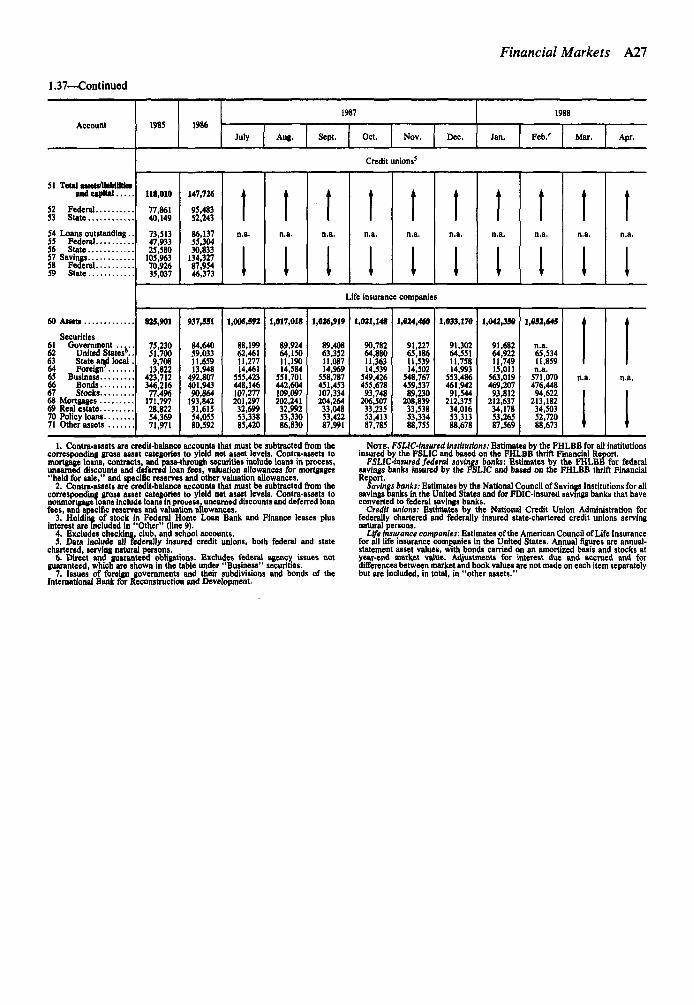
Financial Markets All
1.37—Continued
Account 1985 1986
1987
July Aug. Sept. Oct. Nov. Dec.
1988
Jan. Feb.' Mar. Apr.
Credit unions5
51 Total amtiiiablllUMand capital
52 Federal53 State
54 Loans outstanding..55 Federal56 State57 Savings58 Federal59 State
118,010
77,86140,149
73,51347,93325,580
105,96370,92635,037
147,726
95,48352,243
86,13755,30430,833
134,32787,95446,373
Life insurance companies
60 Assets
Securities61 Government . . . . .62 United States'..63 State and local64 Foreign^65 Business66 Bonds67 Stocks68 Mortgages69 Real estate70 Policy loans71 Other assets
825,901
75,23051,7009,708
13,822423,712346,21677,496
171,79728,82254,36971,971
937,551
84,64059,03311,65913,948
492,807401,94390,864
193,84231,61554,05580,592
1,005,592
88,19962,46111,27714,461
555,423448,146107,277201,29732,69953,33885,420
1,017,018
89,92464,15011,19014,584
551,701442,604109,097202,24132,99253,33086,830
1,026,919
89,40863,35211,08714,969
558,787451,453107,334204,264
33,04853,42287,991
1,021,148
90,78264,88011,36314,539
549,426455,67893,748
206,50733,23553,41387,785
1,024,460
91,22765,18611,53914,502
548,767459,537
89,230208,83933,53853,33488,755
1,033,170
91,30264,55111,75814,993
553,486461,942
91,544212,375
34,01653,31388,678
1,042,350
91,68264,92211,74915,011
563,019469,20793,812
212,63734,17853,26587,569
1,052,645
n.a.65,53411,859n.a.
571,070476,44894,622
213,18234,50352,72088,673
1. Contra-assets are credit-balance accounts that must be subtracted from thecorresponding gross asset categories to yield net asset levels. Contre-assets tomortgage loans, contracts, and pass-through securities include loans in process,unearned discounts and deferred loan fees, valuation allowances for mortgages"held for sale," and specific reserves and other valuation allowances.
2. Contra-assets are credit-balance accounts that must be subtracted from thecorresponding gross asset categories to yield net asset levels. Contra-assets tononmortgage loans include loans in process, unearned discounts and deferred loanfees, and specific reserves and valuation allowances.
3. Holding of stock in Federal Home Loan Bank and Finance leases plusinterest are Included In "Other" (line 9).
4. Excludes checking, club, and school accounts.5. Data include all federallyJly insured credit unions, both federal and state
chartered, serving natural persons.6. Direct and guaranteed obligations. Excludes federal agency issues not
guaranteed, which are shown in the table under "Business" securities.7. Issues of foreign governments and their subdivisions and bonds of the
International Bank for Reconstruction and Development.
NOTE. FSLlC-tnsured institutions: Estimates by the FHLBB for all institutionsinsured by the FSLIC and based on the FHLBB thrift Financial Report.
FSLlC-inmred federal savings banks: Estimates by the FHLBB for federalsavings banks insured by the FSLIC and based on the FHLBB thrift FinancialReport.
Savings banks: Estimates by the National Council of Savings Institutions for allsavings banks in the United States and for FDIC-insured savings banks that haveconverted to federal savings banks.
Credit unions: Estimates by the National Credit Union Administration forfederally chartered and federally insured state-chartered credit unions servingnatural persons.
Life Insurance companies: Estimates of the American Council of Life Insurancefor all life insurance companies in the United States. Annual figures are annual-statement asset values, with bonds carried on an amortized basis and stocks atyear-end market value. Adjustments for interest due and accrued and fordifferences between market and book values are not made on each item separatelybut are included, in total, in "other assets."

A28 Domestic Financial Statistics D September 1988
1.38 FEDERAL FISCAL AND FINANCING OPERATIONS
Millions of dollars
Type of account or operationFiscalyear1986
Fiscalyear19871
Calendar year
1988
Jan. Feb. Mar. Apr. May June
U.S. budget1
1 Receipts, total2 On-budget3 Off-budget4 Outlays, total5 On-budget6 OS-budget7 Surplus, or deficit ( - ) , total8 On-budget9 Off-budget
Source of financing (total)10 Borrowing from the public11 Operating cash (decrease, or increase
12 Othe?Y^Y^'.'.'.'.'.'.'.'.'.'.'.'.'.'.'.'.'.'.'.'.'.'.'.'.'.
MEMO13 Treasury operating balance (level, end of
period)14 Federal Reserve Banks15 Tax and loan accounts
769,091568,862200,228990,258806,760183,498
-221,167-237,898
16,731
236,187
-14,324-696
31,3847,514
23,870
854,143640,741213,402
1,004,586810,754193,832
-150,444-170,014
19,570
150,070
-5,0525,426
36,4369,120
27,316
81,79160,64521,14665,78666,573
-78716,005
-5,92821,933
5,281
-17,555-3,730
39,92410,27629,648
60,35540,61019,74584,26066,50717,753
-23,905-25,897
1,992
20,157
11,002-7,257
28,9222,47326,450
65,73044,95820,77294,87776,85818,020
-29,147-31,899
2,752
17,160
6,0095,979
22,9132,40320,510
109,32381,99327,33094,43379,50815,92513,8902,48511,405
-334
-23,2769,719
46,18916,18630,003
59,71139,76419,94782,17364,56617,607
-22,462-24,802
2,340
7,559
27,223-12,321
18,9662,871
16,095
99,34877,78621,56289,85672,67317,1849,4925,1134,379
11,391
-20,638-244
39,6049,762
29,842
1. FY 1987 total outlays and deficit do not correspond to the monthly databecause the Monthly Treasury Statement has not completed the monthly distri-bution of revisions reflected in the fiscal year total in The Budget of the U.S.Government, Fiscal year 1989.
2. In accordance with the Balanced Budget and Emergency Deficit Control Actof 1985, all former off-budget entries are now presented on-budget. The FederalFinancing Bank (FFB) activities are now shown as separate accounts under theagencies that use the FFB to finance their programs. The act has also moved twosocial security trust funds (Federal old-age survivors insurance and Federal
disability insurance trust funds) off-budget.3. Includes SDKs; reserve position on the U.S. quota in the IMF; loans to
international monetary fund; other cash and monetary assets; accrued interestpayable to the public; allocations of special drawing rights; deposit funds;miscellaneous liability (including checks outstanding) and asset accounts;seigniorage; increment on gold; net gain/loss for U.S. currency valuation adjust-ment; net gain/loss for IMF valuation adjustment; and profit on the sale of gold.
SOURCE. Monthly Treasury Statement of Receipts and Outlays of the U.S.Government and the Budget of the U.S. Government.
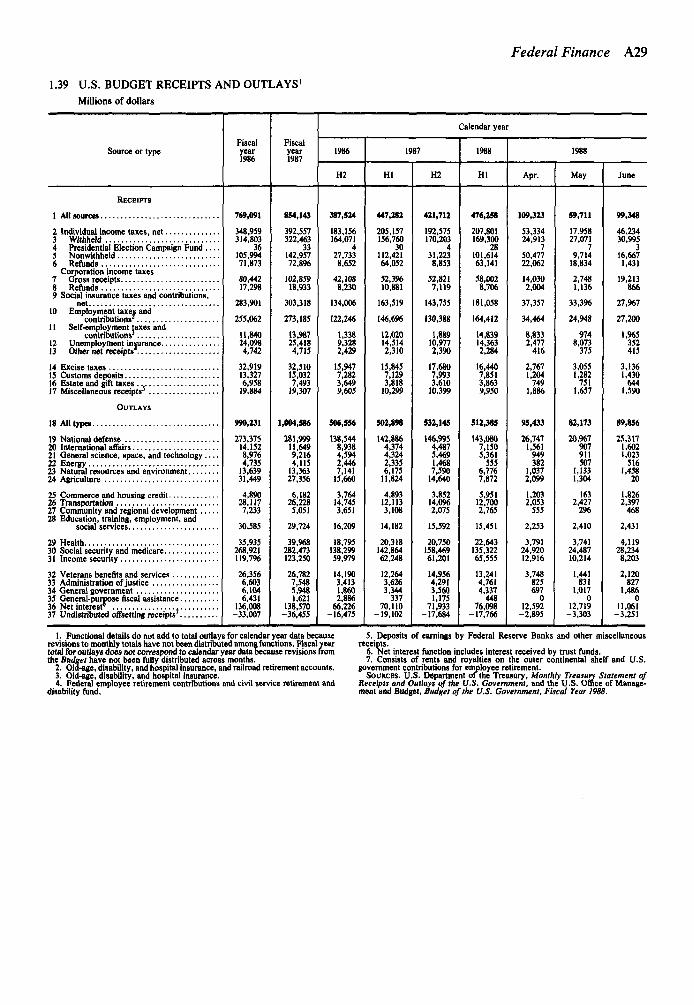
1.39 U.S. BUDGET RECEIPTS AND OUTLAYS1
Millions of dollars
Federal Finance A29
Source or typeFiscalyear1986
Fiscalyear1987
Calendar year
1986
H2
1987
HI H2
1988
HI
1988
Apr. May June
RECEIPTS
1 All sources
2 Individual income taxes, net3 Withheld4 Presidential Election Campaign Fund5 Nonwithheld6 Refunds
Corporation income taxes7 Gross receipts8 Refunds9 Social insurance taxes and contribution:
net10 Employment taxes and
contributions2
11 Self-employment taxes andcontributions3
12 Unemployment insurance13 Other net receipts4
14 Excise taxes15 Customs deposits16 Estate and gift taxes . .17 Miscellaneous receipts3
OUTLAYS
18 All types
19 National defense20 International affairs21 General science, space, and technology22 Energy23 Natural resources and environment24 Agriculture
25 Commerce and housing credit26 Transportation27 Community and regional development .28 Education, training, employment, and
social services
29 Health30 Social security and medicare31 Income security
32 Veterans benefits and services33 Administration of justice34 General government35 General-purpose fiscal assistance36 Net interest'37 Undistributed offsetting receipts'
769,091
348,959314,803
36105,99471,873
80,44217,298
283,901
255,062
11,84024,0984,742
32,91913,3276,95819,884
990,231
273,37514,1528,9764,735
13,63931,449
4,89028,1177,233
30,585
35,935268,921119,796
2«,3566,6036,1046,431
136,008-33,007
854,143
392,557322,463
33142,95772,8%
102,85918,933
303,318
273,185
13,98725,4184,715
32,51015,0327,493
19,307
1,004,586
281,99911,6499,2164,11513,36327,356
6,18226,2285,051
29,724
39,968282,473123,250
26,7827,5485,9481,621
138,570-36,455
387,524
183,156164,071
427,7338,652
42,1088,230
134,006
122,246
1,3389,3282,429
15,9477,2823,6499,605
506,556
138,5448,9384,5942,4467,14115,660
3,76414,7453,651
16,209
18,795138,29959,979
14,1903,4131,8602,886
66,226-16,475
447,282
205,157156,760
30112,42164,052
52,39610,881
163,519
146,696
12,02014,5142,310
15,8457,1293,81810,299
502,898
142,8864,3744,3242,3356,17511,824
4,89312,1133,108
14,182
20,318142,86462,248
12,2643,6263,344337
70,110-19,102
421,712
192,575170,203
431,2238,853
52,8217,119
143,755
130,388
10,9772,390
17,6807,9933,610
10,399
532,145
146,9954,4875,4691,4687,590
14,640
3,85214,0962,075
15,592
20,750158,46961,201
14,9564,2913,5601,175
71,933-17,684
476,258
207,801169,300
28101,61463,141
58,0028,706
181,058
164,412
14,83914,3632,284
16,4407,8513,8639,950
512,385
143,0807,1505,361555
6,7767,872
5,95112,7002,765
15,451
22,643135,32265,555
13,2414,7614,337
44876,098
-17,766
109,323
53,33424,913
750,47722,062
14,0302,004
37,357
34,464
8,8332,477
416
2,7671,204
7491,886
95,433
26,7471,561
949382
1,0372,099
1,2032,053
555
2,253
3,79124,92012,916
3,748S25697
012,592
-2,895
59,711
17,95827,071
79,714
18,834
2,7481,136
33,396
24,948
9748,073
375
3,0551,282
7511,657
82,173
20,967907911507
1,1331,304
1632,427
296
2,410
3,74124,48710,214
1,441831
1,0170
12,719-3,303
99,348
46,23430,995
316,6671,431
19,213866
27,967
27,200
1,965352415
3,1361,430
6441,590
89,856
25,3171,6021,023
5161,458
20
1,8262,397
468
2,431
4,11928,234
8,203
2,120827
1,4860
11.061-3,251
1. Functional details do not add to total outlays for calendar year data becauserevisions to monthly totals have not been distributed among functions. Fiscal yeartotal for outlays does not correspond to calendar year data because revisions fromthe Budget have not been fully distributed across months.
2. Old-age, disability, and hospital insurance, and railroad retirement accounts.3. Old-age, disability, and hospital insurance.4. Federal employee retirement contributions and civil service retirement and
disability fund.
5. Deposits of earnings by Federal Reserve Banks and other miscellaneousreceipts.
6. Net interest function includes interest received by trust funds.7. Consists of rents and royalties on the outer continental shelf and U.S.
government contributions for employee retirement.SOURCES. U.S. Department of the Treasury, Monthly Treasury Statement of
Receipts and Outlays of the U.S. Government, and the U.S. Office of Manage-ment and Budget, Budget of the U.S. Government, Fiscal Year 1988.

A30 Domestic Financial Statistics • September 1988
1.40 FEDERAL DEBT SUBJECT TO STATUTORY LIMITATION
Billions of dollars
Item
1986
Mar. 31 June 30 Sept. 30 Dec. 31
1987
Mar. 31 June 30 Sept. 30 Dec. 31
1988
Mar. 31
1 Federal debt outstanding
2 Public debt securities3 Held by public4 Held by agencies
5 Agency securities6 Held by public7 Held by agencies
8 Debt subject to statutory limit.
9 Public debt securities10 Other debt1
11 MEMO: Statutory debt limit. .
1,991.1
1,986.81,634.3
352.6
4.33.21.1
1,»73.3
1,972.01.3
2,078.7
2,063.6
2,059.31,684.9
374.4
4.33.21.1
2,060.0
2,058.71.3
2,078.7
2,129,5
2,125.31,742.4
382.9
4.23.21.1
2,111.0
2,109.71.3
2,111.0
2,218.9
2,214.81,811.7
403.1
4.03.01.1
2,200.5
2,199.31.3
2,300.0
2,250.7
2,246.71,839.3
407.5
4.02.91.1
2,232.4
2,231.11.3
2,300.0
2,313.1
2,309.31,871.1
438.1
3.82.91.0
2,295.0
2,293.71.3
2,320.0
2,354.3
2,350.31,893.1
457.2
4.03.01.0
2,336.0
2,334.71.3
2,800.0
2,435.2
2,431.71,954.1
477.6
3.52.7
.8
2,417.4
2,416.31.1
2,800.0
2,493.2
2,487.61,996.7
490.8
5.65.1
.6
2,487.0
2,486.7.3
2,800.0
1. Includes guaranteed debt of Treasury and other federal agencies, specifiedparticipation certificates, notes to international lending organizations, and Districtof Columbia stadium bonds.
SOURCES. Treasury Bulletin and Monthly Statement of the Public Debt of theUnited States.
1.41 GROSS PUBLIC DEBT OF U.S. TREASURY Types and Ownership
Billions of dollars, end of period
Type and holder
I Tout gross public debt . . . .
By type2 Interest-bearing debt3 Marketable.4 Bills5 Notes .6 Bonds7 Nonmarketable'
11 Public
14 Non-interest-bearing debt ,
By holder*
16 Federal Reserve Banks
18 Commercial banks
22 State and local Treasurys ,Individuals
23 Savings bonds24 Other securities25 Foreign and international5
1984
1,663.0
1,660.61,247.4
374.4705.1167.9413.244.4
9.19.1.0
73.1286.2
2.3
289.6160.9
1,212.5183.425.976.450.1
173.0
74.569.3
192.9354.7
1985
1,945.9
1,943.41,437.7
399.9812.5211.1505.787.5
7.57.5.0
78.1332.2
2.5
348.9181.3
1,417.2192.225.1
115.459.0
224.0
79.875.0
212.5434.2
1986
2,214.8
2,212.01,619.0
426.7927.5249.8593.1110.5
4.74.7.0
90.6386.9
2.8
403.1211.3
1,602.0232.128.0
135.468.8
260.0
92.370.5
251.6467.1
1987
2.4M.7
2,428.91,724.7
389.51,037.9
282.5704.2139,3
4.04.0.0
99.2461.3
2.8
477.6222.6
1,745.2252.3
14.3n.a.
84.6n.a.
101.1
287.3n.a.
1987
Q2
2,309.3
2,306.71,659.0
391.0984.4268.6647.7125.4
5.15.1.0
95.2421.6
2.6
438.1212.3
1,657.7237. T20.6
140.079.7
n.a.
96.868.6
268.6n.a.
Q3
2,350.3
2,347.71,676.0
378.31,005.1
277.6671.8129.0
4.34.3.0
97.0440.7
2.5
457.2211.9
1,682.6250.5'
15.2143.081.8
n.a.
98.570.4
267.0n.a.
Q4
2,431.7
2,428.91,724.7
389.51,037.9
282.5704.2139.3
4.04.0
.099.2
461.3
2.8
477.6'222.6
1,745.2252.3'
14.3n.a.84.6
n.a.
101.1
287.3n.a.
1988
Ql
2,487.6
2,484.91,758.7
392.61,059.9
291.3726.2142.9
6.16.1.0
102.3474.4
2.6
490.8217.5
1,778.2260.7
14.9n.a.
n.a.
104.0
323.5n.a.
1. Includes (not shown separately): Securities issued to the Rural Electrifica-tion Administration; depository bonds, retirement plan bonds, and individualretirement bonds.
2. Nonmarketable dollar-denominated and foreign currency-denominated se-ries held by foreigners.
3. Held almost entirely by U.S. Treasury agencies and trust funds.4. Data for Federal Reserve Banks and U.S. Treasury agencies and trust funds
are actual holdings; data for other groups are Treasury estimates.
5. Consists of investments of foreign and international accounts. Excludesnon-interest-bearing notes issued to the International Monetary Fund.
6. Includes savings and loan associations, nonprofit institutions, credit unions,mutual savings banks, corporate pension trust funds, dealers and brokers, certainU.S. Treasury deposit accounts, and federally-sponsored agencies.
SOURCES. Data by type of security, U.S. Treasury Department, MonthlyStatement of the Public Debt of the United States; data by holder. TreasuryBulletin.
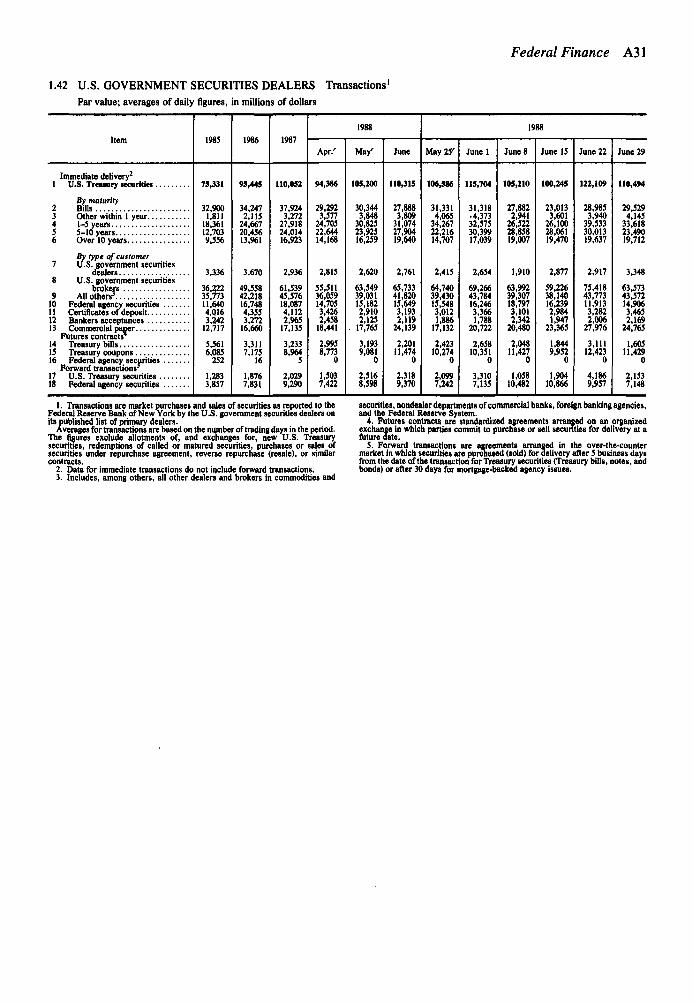
Federal Finance A31
1.42 U.S. GOVERNMENT SECURITIES DEALERS Transactions1
Par value; averages of daily figures, in millions of dollars
Item 1985 1986 1987
1988
Apr/ Mayr June
1988
May 25' June 1 June 8 June 15 June 22 June 29
Immediate delivery2
1 U.S. Treasury securities
By maturity2 Bills3 Other within 1 year4 1-5 years5 5-10 years6 Over 10 years
fly type of customer7 U.S. government securities
dealers8 U.S. government securities
brokers9 All others'
10 Federal agency securities11 Certificates of deposit12 Bankers acceptances13 Commercial paper
Futures contracts'14 Treasury bills15 Treasury coupons16 Federal agency securities
Forward transactions'17 U.S. Treasury securities18 Federal agency securities
75,331
32,9001,81118,36112,7039,356
3,336
36,22235,77311,6404,0163,24212,717
5,5616,085252
1,2833,857
95,445
34,2472,11524,66720,45613.961
3,670
49,55842,21816,7484,3553,27216,660
3,3117,175
16
1,8767,831
110,052
37,9243,272
27,91824,01416,923
2,936
61,53945,57618,0874,1122,965
17,135
3,2338,964
2,0299,290
94,386
29,2923,577
24,70522,64414,168
2,815
55,51136,05914,7053,4262,458
18,441
2,9958,773
0
1,5037,422
105,200
30,3443,848
30,82523,92516,259
2,620
63,54939,03115,1822,9102,125
17,765
3,1939,081
0
2,5168,598
110,315
27,8883,809
31,07427,90419,640
2,761
65,73341,82015,6493,1932,11924,139
2,20111,474
0
2,3189,370
106,586
31,3314,06534,26722,21614,707
2,415
64,74039,43015,5483,0121,88617,132
2,42310,274
0
2,0997,242
115,704
31,318• 4,37332,57530,39917,039
2,654
69,26643,78416,2463,3661,788
20,722
2,65810,351
0
3,3107,135
105,210
27,8822,941
26,52228,85819,007
1,910
63,99239,30718,7973,1012,342
20,480
2,04811,427
0
1,05810,482
100,245
23,0133,601
26,10028,06119,470
2,877
59,22638,14016,2392,9841,947
23,365
1,8449,952
0
1,90410,866
122,109
28,9853,940
39,53330,01319,637
2,917
75,41843,77311,9133,2822,006
27,976
3,11112,423
0
4,1869,957
110,494
29,5294,145
33,61823,49019,712
3,348
63,57343,57214,9063,4652,169
24,765
1,60511,429
0
2,1537,148
1. Transactions are market purchases and sales of securities as reported to theFederal Reserve Bank of New York by the U.S. government securities dealers onits published list of primary dealers.
Averages for transactions are based on the number of trading days in the period.The figures exclude allotments of, and exchanges for, new U.S. Treasurysecurities, redemptions of called or matured securities, purchases or sales ofsecurities under repurchase agreement, reverse repurchase (resale), or similarcontracts.
2. Data for immediate transactions do not include forward transactions.3. Includes, among others, all other dealers and brokers in commodities and
securities, nondealer departments of commercial banks, foreign banking agencies,and the Federal Reserve System.
4. Futures contracts are standardized agreements arranged on an organizedexchange in which parties commit to purchase or sell securities for delivery at afuture date.
5. Forward transactions are agreements arranged in the over-the-countermarket in which securities are purchased (sold) for delivery after 5 business daysfrom the date of the transaction for Treasury securities (Treasury bills, notes, andbonds) or after 30 days for mortgage-backed agency issues.

A32 Domestic Financial Statistics • September 1988
1.43 U.S. GOVERNMENT SECURITIES DEALERS Positions and Financing1
Averages of daily figures, in millions of dollars
Item 1985 1986 19871988
Apr. May' June
1988
June 1 June 8 June 15 June 22 June 29
Positions
Net immediate2
1 U.S. Treasury securities..
2 Bills3 Other within 1 year . . .4 1-5 years5 5-10 years6 Over 10 years
7 Federal agency securities8 Certificates of deposit . . .9 Bankers acceptances
10 Commercial paperFutures positions
11 Treasury bills12 Treasury coupons13 Federal agency securities
Forward positions14 U.S. Treasury securities.15 Federal agency securities
Reverse repurchase agreements4
16 Overnight and continuing17 Term ,
Repurchase agreements3
18 Overnight and continuing . . . .19 Term
7,391
10,0751,0505,154
-6,202-2,686
22,8609,1924,5865,570
-7,3224,465-722
-911-9,420
12,912
12,7613,7069,146
-9,505-3,197
32,98410,4855,526
-18,0593,473-153
-2,144-11,840
-6,216
4,3171,557
649-6,564-6,174
31,9108,1883,6617,496
-3,3735,988
-95
-1,211-18,817
-15,105'
5,536'-970
-3,038'-8,587'-8,046'
26,622'5,6783,0595,591
-3,6815,101
0
LOW-16,528'
-26,408
-2,613-6,785-8,649-8,446
26,7856,0752,3954,519
-2,0274,460
0
2,191-14,977
-25,104
1,797-1,000-7,514
-10,276-8,112
29,3838,0672,6175,561
-2,6954,122
0
1,092-17,813
-32,054
-2,618-2,793-8,217-9,159-9,267
27,4077,0342,2095,212
-3,0675,340
0
3,051-14,820
-27,543
4,390-1,773
-10,968-9,832-9,360
27,1107,4572,5644,828
-3,0034,561
0
1,161-17,337
-25,150
2,219-730
-7,990-10,213-8,435
30,6927,8132,6375,256
-3,9874,118
0
870-18,527
-25,949
685-183
-9,373-9,544-7,535
30,3058,3592,3516,095
-2,2063,651
0
356-17,311
Financing3
68,03580,509
101,41070,076
98,954108,693
141,735102,640
124,791148,033
170,840120,980
128,158173,474
169,194138,097
133,373173,858
169,031139,537
139,006168,069
176,017131,104
148,771162,360
179,127126,721
140,419165,311
171,040128,004
145,354168,917
185,031128,478
128,772176,891
167,758140,894
-19,915
1,198-654
-2,447-11,088-6,924
29,9898,5032,9175,612
-2,0243,748
0
1,743-18,567
141,251163,380
180,348130,217
1. Data for dealer positions and sources of financing are obtained from reportssubmitted to the Federal Reserve Bank of New York by the U.S. Treasurysecurities dealers on its published list of primary dealers.
Data for positions are averages of daily figures, in terms of par value, based onthe number of trading days in the period. Positions are net amounts and are shownon a commitment basis. Data for financing are in terms of actual amountsborrowed or lent and are based on Wednesday figures.
2. Immediate positions are net amounts (in terms of par values) of securitiesowned by nonbank dealer firms and dealer departments of commercial banks ona commitment, that is, trade-date basis, including any such securities that havebeen sold under agreements to repurchase (RPs). The maturities of somerepurchase agreements are sufficiently long, however, to suggest that the securi-ties involved are not available for trading purposes. Immediate positions include
reverses to maturity, which are securities that were sold after having beenobtained under reverse repurchase agreements that mature on the same day as thesecurities. Data for immediate positions do not include forward positions.
3. Figures cover financing involving U.S. Treasury and federal agency securi-ties, negotiable CDs, bankers acceptances, and commercial paper.
4. Includes all reverse repurchase agreements, including those that have beenarranged to make delivery on short sales and those for which the securitiesobtained have been used as collateral on borrowings, that is, matched agreements.
5. Includes both repurchase agreements undertaken to finance positions and"matched book" repurchase agreements.
NOTE. Data on positions for the period May 1 to Sept. 30, 1986, are partiallyestimated.

Federal Finance A33
1.44 FEDERAL AND FEDERALLY SPONSORED CREDIT AGENCIES Debt Outstanding
Millions of dollars, end of period
Agency 1984 1985 19861987
Dec.
1988
Jan. Feb. Mar. Apr. May
1 Federal and federally sponsored agencies
2 Federal agencies ,3 Defense Department',4 Export-Import Bank2-3
5 Federal Housing Administration4
6 Government National Mortgage Association participation
7 Postal Service'8 Tennessee Valley Authority9 United States Railway Association'
10 Federally sponsored agencies7
11 Federal Home Loan Banks12 Federal Home Loan Mortgage Corporation13 Federal National Mortgage Association14 Farm Credit Banks13 Student Loan Marketing Association"16 Financing Corporation*^
MEMO17 Federal Financing Bank debt"
Lending to federal and federally sponsored agencies18 Export-Import Bank3
19 Postal Service6
20 Student Loan Marketing Association21 Tennessee Valley Authority22 United States Railway Association'
Other Lending"23 Farmers Home Administration24 Rural Electrification Administration25 Other
271,220
35,145142
15,882133
2,1651,337
.5.435
237,01265,08510,27083,72072,192
5,745n.a.
145,217
15,8521,0875,00013,710
51
58,97120,69329,853
293,905
36,39071
15,678115
2,1651,940
16,34774
257,51574,44711,92693,89668,8518,395
153,373
15,6701,6905,00014,622
74
64,23420,65431,429
307,361
36,958
2,1653,10417,222
85
270,55388,75213,58993,56362,47812,171
157,510
14,2052,8544,97015,797
85
65,37421,68032,545
341,386
37,98113
11,978183
1,6156,10318,089
0
303,405115,72517,64597,05735,27516,5031,200
152,417
11,9725,8534,94016.709
0
59,67421,19132,078
338,483
37,63713
11,978
1,6156,103
17,8300
300,846116,37415,58197,19554,07216,4241,200
152,099
11,9725,8534,94016,450
0
59,67421,18732,023
346,901
37,28612
11,978101
1,1656,10317,927
0
309,615117,56919,40598,59355,27516,9231,850
150,178
11,9725,8534,940
16,5470
59,67419,19331,999
351.35C
36,84412
11,494100
1,1656,10317,970
0
314,512118,25020,14399,85356,14518,2711,850
149,721
11,4885,8534,94016,590
59,67419,18431,992
348,273
36,67211
11,494103
8306,10318,131
0
311,601118,15317,199100,91154,31118,8772,150
150,044
11,4885,8334,94016,751
0
59,67419,20332,135
n.a,
36,43011
11,494105
8305,84218,148
0
n.a.117,864n.a.
102,51554,57818,4342,900
149,986
11,4885,5924,94016,768
0
59,67419,21832,306
1. Consists of mortgages assumed by the Defense Department between 1957and 1963 under family housing and homeowners assistance programs.
2. Includes participation certificates reclassified as debt beginning Oct. 1,1976.3. Off-budget Aug. 17, 1974, through Sept. 30, 1976; on-budget thereafter.4. Consists of debentures issued in payment of Federal Housing Administration
insurance claims. Once issued, these securities may be sold privately on thesecurities market.
5. Certificates of participation issued before fiscal 1969 by the GovernmentNational Mortgage Association acting as trustee for the Fanners Home Admin-istration; Department of Health, Education, and Welfare; Department of Housingand Urban Development; Small Business Administration; and the VeteransAdministration.
6. Off-budget.7. Includes outstanding noncontingent liabilities: notes, bonds, and deben-
tures. Some data are estimated.
8. Before late 1981, the Association obtained financing through the FederalFinancing Bank (FFB).
9. The Financing Corporation, established in August 1987 to recapitalize theFederal Savings and Loan Insurance Corporation, undertook its first borrowing inOctober 1987.
10. The FFB, which began operations in 1974, is authorized to purchase or sellobligations issued, sold, or guaranteed by other federal agencies. Since FFBincurs debt solely for the purpose of lending to other agencies, its debt is notincluded in the main portion of the table in order to avoid double counting.
11. Includes FFB purchases of agency assets and guaranteed loans; the lattercontain loans guaranteed by numerous agencies with the guarantees of anyparticular agency being generally small. The Farmers Home Administration itemconsists exclusively of agency assets, while the Rural Electrification Administra-tion entry contains both agency assets and guaranteed loans.

A34 Domestic Financial Statistics D September 1988
1.45 NEW SECURITY ISSUES Tax-Exempt State and Local Governments
Millions of dollars
Type of issue or issuer,or use 1985 1986 1987
1987
Nov. Dec.
1988
Jan. Feb. Mar. Apr. May' June
1 All issues, new and refunding1
Type of issue2 General obligation3 Revenue
Type of issuer4 State ,5 Special district and statutory authority'6 Municipalities, counties, and townships
7 Issues for new capital, total
Use of proceeds8 Education9 Transportation
10 Utilities and conservation11 Social welfare12 Industrial aid13 Other purposes
214,189
52,622161,567
13,004134,36366,822
156,050
16,65812,07026,85263,18112,89224,398
147,011
46,346100,664
14,47489,99742,541
83,490
16,94811,66635,38317,3325,594
47,433
102,407
30,58971,818
10,10265,46026,845
56,789
9,5253,6777,912
11,1076,551
18,020
8,320
2,4725,848
4315,0762,813
6,626
1,002351
1,0941,664
3302,185
8,385
1,9956,390
5505,4472,388
5,»13
931455377
1,2781,2971,575
5,412
1,2594,153
4233,2201,769
2,M2
841189326740153613
8,585
2,8805,705
1,1975,1542,234
5,773
754826655650
2,473415
9,821
2,7767,045
739'6,31c2,772'
6,044
933559
1,0161,218
1052,213
5,847
1,7074,140
4414,0781,328
3,948
911215429
1,099298996
7,846
3,0854,761
9134,6252,308
5,190
1,316452580694248
1,900
12,665
4,0448,621
1,2808,0253,360
8,659
1,289748627
2,026428
3,541
1. Par amounts of long-term issues based on date of sale.2. Includes school districts beginning 1986.
SOURCES. Securities Data/Bond Buyer Municipal Data Base beginning 1986.Public Securities Association for earlier data.
1.46 NEW SECURITY ISSUES U.S. Corporations
Millions of dollars
Type of issue or issuer,or use 1985 1986 1987
1987
Oct. Nov. Dec. Jan. Feb. Mar. Apr.' May
1 AH issues1.
2 Bonds3 . . .
type of offering3 Public,domestic4 Private placement, domestic3 .5. Sold abroad
Industry group6 Manufacturing7 Commercial and miscellaneous8 Transportation9 Public utility
10 Communication11 Real estate and financial
12 Stocks3 .
Type13 Preferred14 Common15 Private placement3.
Industry group16 Manufacturing17 Commercial and miscellaneous18 Transportation19 Public utility20 Communication21 Real estate and financial
239,015
203,500
119,55946,20037,781
63,97317,0666,020
13,64910,83291,958
35,515
6,50529,010
5,7009,1491,5441,966
97816,178
423,726
355,293
231,93680,76042,596
91,54840,124
9,97131,42616,659
165,564
68,433
11,51450,3166,603
15,02710,6172,4274,0201,825
34,517
392,156
325,648
209,27992,07024,299
61,66649,32711,97423,0047,340
172,343
66,508
10,12343,228n.a.
13,88012,8882,4394,3221,458
31,521
20,710
17,631
16,135n.a.1,4%
2,7841,165
2631,0251,384
11,011
3,079
2362,843n.a.
7036564075
1071,498
14,322
13,624
12,891n.a.
733
1.280483
0895290
10,676
698
162533
n.a.
23786
14925
200
11,872
11,098
10,763n.a.
335
9282,577
2261,570
5105,287
774
61713
7614
011
672
22,175
19,485
18,246n.a.1,239
3,0532,084
01,142
20613,000
2,690
1,3881,302n.a.
268360
10060
1,901
22,394
18,504
16,713n.a.1,791
3,1511,396
2001,718
10111,937
3,890
3763,534n.a.
29644
474142
02,933
25,902
20,815
19,827n.a.
918
3,4821,0071,0172,259
11512,935
5,087'
6254,490n.a.
25699329363
4,544
21,084
18,372
16,177n.a.2,195
4,495771890
1,170411
10,636
2,712
2412,471n.a.
318276150238109
1,621
22,913
18,999
17,200n.a,1,799
4,1211,367
1841,909
6911,348
3,914
2853,629
1,080143
55678
2,542
1. Figures which represent gross proceeds of issues maturing in more than oneyear, are principal amount or number of units multiplied By offering price.Excludes secondary offerings, employee stock plans, investment companies otherthan closed-end, intracorporate transactions, equities sold abroad, and Yankeebonds. Stock data include ownership securities issued by limited partnerships.
2. Monthly data include only public offerings.3. Data are not available on a monthly basis. Before 1987, annual totals include
underwritten issues only.SOURCES. IDD Information Services, Inc., U.S. Securities and Exchange
Commission and the Board of Governors of the Federal Reserve System.

Securities Market and Corporate Finance A35
1.47 OPEN-END INVESTMENT COMPANIES Net Sales and Asset Position
Millions of dollars
Item 1986
19871987
Oct. Nov. Dec.
1988
Jan. Feb. Mar. Apr/ May
INVESTMENT COMPANIES'
Sales of own shant1
2 Redemptions of own shares3.3 Net sales
3 Cash position9.6 Other
411,751
239,394172,357
424,156
30,716393,440
381,2*0
314,25267,008
453,842
38,006415,836
25,990
34,597-8,607
454,422
40,929415,493
21,927
20,4001,507
446,479
41,432405,047
26,494
28,099-1,605
453,842
38,006415,836
30,343
22,3248,019
468,998
40,157428,841
23,265
20,9142,351
481,232
41,232439,995
24,589
23,968620
473,206
43,561426,645
23,162
25,000-1,828
473,321
45,307428,014
19,579
21,412-1,833
468,738
45,323423,415
1. Excluding money market funds.2. Includes reinvestment of investment income dividends. Excludes reinvest-
ment of capital gains distributions and share issue of conversions from one fundto another in the same group.
3. Excludes share redemption resulting from conversions from one fund toanother in the same group.
4. Market value at end of period, less current liabilities.
5. Also includes all U.S. government securities and other short-term debtsecurities.
NOTE. Investment Company Institute data based on reports of members, whichcomprise substantially all open-end investment companies registered with theSecurities and Exchange Commission. Data reflect newly formed companies aftertheir initial offering of securities.
1.48 CORPORATE PROFITS AND THEIR DISTRIBUTION
Billions of dollars; quarterly data are at seasonally adjusted annual rates.
Account
1 Corporate profits with inventory valuation and
2 Profits before tax3 Profits tax liability4 Profits after tax5 Dividends6 Undistributed profits
1985'
282.3224.296.4
127.883.244.6
-1 .759.7
1986'
298.8236.3106.6129.888.241.6
8.354.2
1987'
310.4276.7133.8142.995.547.4
-18.051.7
1986'
Q2
297.1230.3104.9125.488.037.4
11.855.0
Q3
301.2240.5107.9132.688.943.7
8.752.0
Q4
293.9252.1114.3137.989.848.1
-8.149.8
1987'
Ql
298.3261.8126.3135.591.743.8
-14.450.8
Q2
305.2273.7132.6141.194.047.0
-20.051.5
Q3
322.0289.4140.0149.597.052.4
-19.552.1
Q4
316.1281.9136.2145.799.346.4
-18 .252.4
1988
Ql'
316.2286.2136.9149.4101.348.1
-19 .449.4
SOURCE. Survey of Current Business (Department of Commerce).
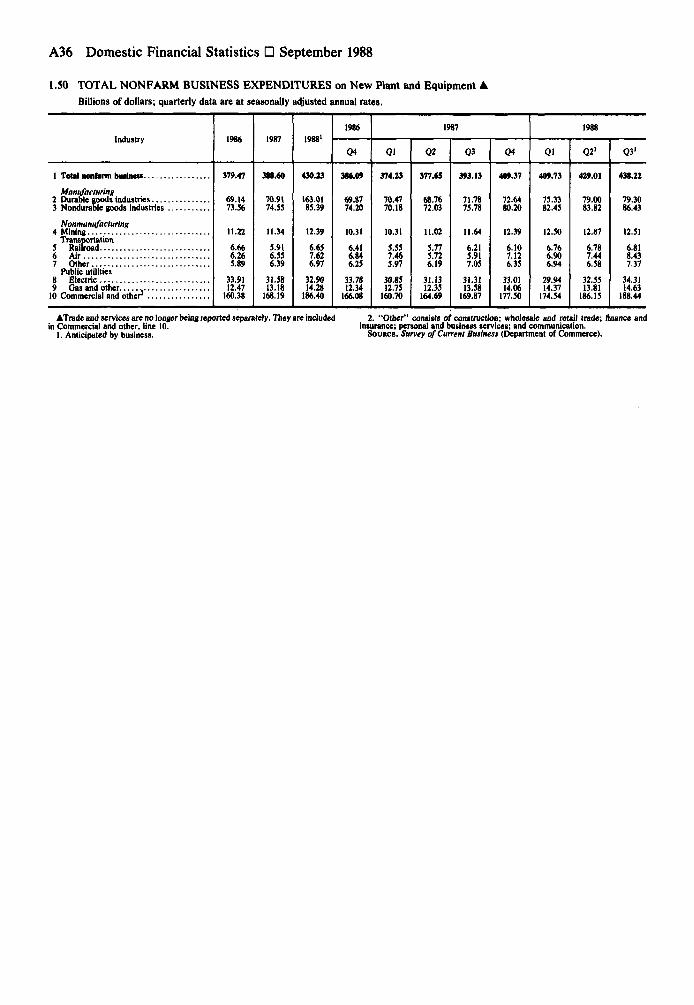
A36 Domestic Financial Statistics • September 1988
1.50 TOTAL NONFARM BUSINESS EXPENDITURES on New Plant and Equipment •
Billions of dollars; quarterly data are at seasonally adjusted annual rates.
Industry
Manufacturing
3 Nondurable goods industries
Nonmanufacturing
Transportation5 Railroad... . .6 Air7 other
Public utilities8 Electric9 Gas and other . v . . . . . . . . .
1986
379.47
69.1473.56
11.22
6.666.265.89
33.9112.47
160.38
1987
388.60
70.9174.55
11.34
5.916.556.39
31.5813.18
168.19
19881
430.23
163.0185.39
12.39
6.657.626.97
32.9014.28
186.40
1986
Q4
384.09
69.8774.20
10.31
6.416.846.25
33.7812.34
166.08
1987
Ql
374.23
70.4770.18
10.31
5.557.465.97
30.8512.75
160.70
Q2
377.65
68 7672.03
11.02
5.775.726.19
31.1312.35
164.69
Q3
393.13
71.7875.78
11.64
6.215.917.05
31.3113.58
169.87
04
409.37
72.6480.20
12.39
6.107.126.35
33.0114.06
177.50
1988
Ql
409.73
75.3382.45
12.50
6.766.906.94
29.9414.37
174.54
Q2'
429.01
79.0083.82
12.87
6.787.446.58
32.5513.81
186.15
Q3'
438.22
79.3086.43
12.51
6.818.437.37
34.3114.63
188.44
•Trade and services are no longer being reported separately. They are includedin Commercial and other, line 10.
1. Anticipated by business.
2. "Other" consists of construction; wholesale and retail trade; finance andinsurance; personal and business services; and communication.
SOURCE. Survey of Current Business (Department of Commerce).

Securities Markets and Corporate Finance A37
1.51 DOMESTIC FINANCE COMPANIES Assets and Liabilities1
Billions of dollars, end of period
Account
ASSETS
Accounts receivable, gross
3 Real estate .4 Total
Leu:
8 All other
9 Total assets
LIABILITIES
10 Bank loans
Debt12 Other short-term
M AH other liabilities
16 Total llabUItlu and canital
1983
83.3113.420.5
217.3
30.33.7
183.234.4
217.6
18.360.5
11.167.731.228.9
217.6
1984
89.9137.823.8
251.5
33.84.2
213.535.7
249.2
20.073.1
12.977.234.531.5
249.2
1985
111.9157.528.0
297.4
39.24.9
253.345.3
298.6
18.099.2
12.794.441.532.8
298.6
1986
Q2
123.4166.829.8
320.0
40.75.1
274.249.5
323.7
16.3108.4
15.8106.940.935.4
323.7
Q3
135.3159.731.0
326.0
42.45.4
278.260.0
338.2
16.8112.8
16.4111.745.035.6
338.2
Q4
134.7173.432.6
340.6
41.55.8
293.358.6
351.9
18.6117.8
17.5117.544.136.4
351.9
1987
Ql
131.1181.434.7
347.2
40.45.9
300.959.0
359.9
17.2119.1
21.8118.746.536.6
359.9
Q2
134.7188 136.5
359 3
41.26.2
311.957.7
369.6
17.3120.4
24.8121.849.136.3
369.6
Q3
141.6188 338.0
367 9
42.56.5
318.964.5
383.4
15.9124.2
26.9128.248.639.5
383.4
Q4
141 1207 639 5
388 2
45.36.8
336 158 2
394.3
16.4128.4
28 0137.152.831.5
394.3
1. NOTE. Components may not add to totals because of rounding.
1.52 DOMESTIC FINANCE COMPANIES Business Credit Outstanding and Net Change1
Millions of dollars, seasonally adjusted
Type 1985 19861987
Nov. Dec
1988
Jan. Feb Mar. Apr. May
1 Total
Retail financing of installment sales2 Automotive (commercial vehicles)3 Business, industrial, and farm equipment
Wholesale financing4 Automotive5 Equipment6 All other
Leasing7 Automotive8 Equipment9 Loans on commercial accounts receivable and factored
commercial accounts receivable10 All other business credit
11 Total
Retail financing of installment sales12 Automotive (commercial vehicles)13 Business, industrial, and farm equipment
Wholesale financing14 Automotive15 Equipment16 All other
Leasing17 Automotive18 Equipment19 Loans on commercial accounts receivable and factored
commercial accounts receivable20 All other business credit
156,297
20,66022,483
23,9884,5686,809
16,27534,768
15,76510,981
19,607
5,067-363
5,423-8671,069
3,8962,685
2,161536
171,966
25,95222,950
23,4195,4237,079
19,78337,833
15,95913,568
202,829
34,45424,764
30,9015,7948,151
22,01341,964
18,50116,287
205,869
35,67424,987
31,0595,6938,408
21,94343,002
18,02417,079
206,755
36,41925,474
30,1155,3088,454
22,94343,245
18,50616,291
213,337
36,31826,976
28,6545,3238,331
23,10048,175
17,86217,062
216,007
36,91427,081
27,3295,2518,347
23,49350,411
17,89519,287
218,914
37,61927,263
27,3615,4298,311
23,45851,092
18,78919,592
Net change (during period)
15,669
5,292467
-569855270
3,5083,065
1942,587
1,700
589
5056577
13053
139141
3,040
1,220223
158-101
257
-701,038
-477792
886
745487
-944-385
46
1,000243
482-788
549
-101-232
-1,46114
-123
157632
-643770
2,670
596105
-1,325-72
16
3932,236
-643689
2,907
705182
32178
-36
-34681
894305
220,304
37,21927,081
28,2605,2378,414
23,69052,126
18,70019,578
1,390
-400-181
899-192
103
2311,034
-14
1. These data also appear in the Board's G.20 (422) release. For address, seeinside front cover.
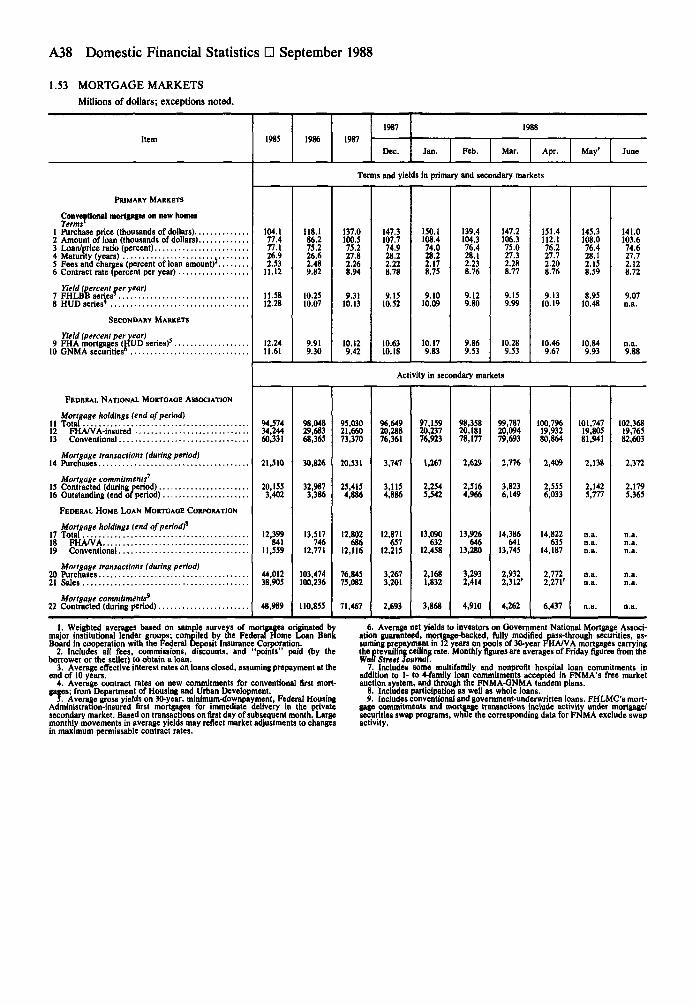
A38 Domestic Financial Statistics • September 1988
1.53 MORTGAGE MARKETS
Millions of dollars; exceptions noted.
Item 1985 1986 1987
1987
Dec.
1988
Jan. Feb. Mar. Apr. May' June
Terms and yields in primary and secondary markets
PRIMARY MARKETS
Conventional mortgages on new hornetTerms'
1 Purchase price (thousands of dollars)2 Amount of loan (thousands of dollars)3 Loan/price ratio (percent)4 Maturity (years)5 Fees and charges (percent of loan amount)2
6 Contract rate (percent per year)
Yield (percent per year)7 FHLBB series'8 HUD series'
SECONDARY MARKETS
Yield (percent per year)9 FHA mortgages (HUD series)3.
10 GNMA securities8
104.177.477.126.92.53
11.12
11.3812.28
12.2411.61
118.186.275.226.62.489.82
10.2510.07
9.919.30
137.0100.575.227.82.268.94
9.3110.13
10.129.42
147.3107.774.928.22.228.78
9.1510.52
10.6310.18
150.1108.474.028.22.178.75
9.1010.09
10.179.83
139.4104.376.428.12.238.76
9.129.80
9.869.53
147.2106.375.027.32.288.77
9.159.99
10.289.53
151.4112.176.227.72.208.76
9.1310.19
10.469.67
145.3108.076.428.12.158.59
8.9510.48
10.849.93
141.0103.674.627.72.128.72
9.07n.a.
n.a.9.88
Activity in secondary markets
FEDERAL NATIONAL MORTOAOE ASSOCIATION
Mortgage holdings (end of period)11 Total12 FHA/VA-insured13 Conventional
Mortgage transactions (during period)14 Purchases
Mortgage commitments'15 Contracted (during period)16 Outstanding (end or period)
FEDERAL HOME LOAN MORTOAOE CORPORATION
Mortgage holdings (end of period)*17 Total18 FHA/VA19 Conventional
Mortgage transactions (during period)20 Purchases21 Sales
Mortgage commitments9
22 Contracted (during period)
94,57434,24460,331
21,510
20,1553,402
12,399841
11,559
44,01238,905
48,989
98,04829,68368,365
30,826
32,9873,386
13,517746
12,771
103,474100,236
110,855
95,03021,66073,370
20,531
25,4154,886
12,802686
12,116
76,84575,082
71,467
96,64920,28876,361
3,747
3,1154,886
12,871657
12,215
3,2673,201
2,693
97,15920,23776,923
1,267
2,2545,542
13,090632
12,458
2,1681,832
3,868
98,35820,18178,177
2,629
2,5164,966
13,926646
13,280
3,2932,414
4,910
99,78720,09479,693
2,776
3,8236,149
14,386641
13,745
2,9322,312'
4,262
100,79619,93280,864
2,409
2,5556,033
14,822635
14,187
2,7722,271'
6,437
101,74719,80581,941
2,138
2,1425,777
n.a.n.a.n.a.
n.a.n.a.
102.36819,76582,603
2,372
2,1795,365
n.a.n.a.n.a.
n.a.n.a.
1. Weighted averages based on sample surveys of mortgages originated bymajor institutional lender groups; compiled by the Federal Home Loan BankBoard in cooperation with the Federal Deposit Insurance Corporation.
2. Includes all fees, commissions, discounts, and "points" paid (by theborrower or the seller) to obtain a loan.
3. Average effective interest rates on loans closed, assuming prepayment at theend of 10 years.
4. Average contract rates on new commitments for conventional first mort-gages; from Department of Housing and Urban Development.
5. Average gross yields on 30-year, minimum-downpayment, Federal HousingAdministration-insured first mortgages for immediate delivery in the privatesecondary market. Based on transactions on first day of subsequent month. Largemonthly movements in average yields may reflect market adjustments to changesin maximum permissable contract rates.
6. Average net yields to investors on Government National Mortgage Associ-ation guaranteed, mortgage-backed, fully modified pass-through securities, as-suming prepayment in 12 years on pools of 30-year FHA/VA mortgages carryingthe prevailing ceiling rate. Monthly figures are averages of Friday figures from theWaft Street Journal.
7. Includes some multifamily and nonprofit hospital loan commitments inaddition to 1- to 4-family loan commitments accepted in FNMA's free marketauction system, and through the FNMA-ONMA tandem plans.
8. Includes participation as well as whole loans.9. Includes conventional and government-underwritten loans. FHLMC's mort-
gage commitments and mortgage transactions include activity under mortgage/securities swap programs, while the corresponding data for FNMA exclude swapactivity.

Real Estate A39
1.54 MORTGAGE DEBT OUTSTANDING1
Millions of dollars, end of period
Type of holder, and type of property 1985 1986 1987
1987
Ql Q2 Q3 Q4 Ql
1 All holder.
2 1- to 4-family3 Multifamily4 Commercial •5 Farm
6 Selected financial institutions7 Commercial banks2
8 1- to 4-family9 Multifamily
10 Commercial11 Farm
12 Savings institutions3
13 1- to 4-family14 Multifamily15 Commercial16 Farm17 Life insurance companies18 1- to 4-family19 Multifamily20 Commercial21 Farm22 Finance companies4
23 Federal and related agencies24 Government National Mortgage Association..25 1- to 4-family26 Multifamily27 Farmers Home Administration'28 1- to 4-family29 Multifamily30 Commercial31 Farm
32 Federal Housing and Veterans Administration33 1- to 4-family34 Multifamily35 Federal National Mortgage Association36 1- to 4-family37 Multifamily38 Federal Land Banks39 1- to 4-family40 Farm41 Federal Home Loan Mortgage Corporation . .42 1- to 4-family43 Multifamily
44 Mortgage pools or trusts6
45 Government National Mortgage Association.,46 l- to 4-family47 Multifamily48 Federal Home Loan Mortgage Corporation . .49 1- to 4-family50 Multifamily51 Federal National Mortgage Association52 1- to 4-family53 Multifamily54 Farmers Home Administration^55 1- to 4-family56 Multifamily57 Commercial58 Farm
59 Individuals and others7
60 1- to 4-family61 Multifamily62 Commercial63 Farm
2,2*9,173
1,467,409214,045482,029105,690
1,390,394429,1%213,434
23,373181,03211,357
760,499554,30189,739
115,771688
171,79712,38119,894127,67011,85228,902
166,9281,473539934733183113159278
4,9202,2542,66698,28291,9666,31647,4982,79844,70014,02211,8812,141
415,042212,145207,1984,947
100,38799,515
87254,98754,036
95147,52322,1866,6758,19010,472
296,809165,83555,42449,20726,343
2,568,562
1,668,209247,024556,56996,760
1,507,289502,534235,81431,173222,79912,748
777,312558,41297,059121,236
605193,84212,82720,952149,11110,95233,601
203,80088947842
48,42121,6257,6088,44610,742
5,0472,3862,661
97,89590,7187,17739,9842,35337,63111,56410,0101,554
531,591262,697256,9205,777
171,372166,6674,705
97,17495,7911,383348142
13274
325,882180,89666,13354,84524,008
2,908,072
1,888,158273,740656,20389,971
1,699,922590,829275,16633,493
267,67914,491
856,369598,441106,346150,825
13,22622,524166,7229,90340,349
192,72144425
41943,05118,1698,0446,60310,235
5,5742,5573,017
96,64989,6666,98334,1312,00832,12312,87211,4301,442
670,394317,555309,8067,749
212,634205,9776,657
139,960137,9881,972245121
2,665,33*
1,712,737257,859601,20793,536
1,559,681519,606242,04229,759234,61913,186
809,245555,693104,035148,712
805195,74312,90320,934151,42010,48635,087
199,50968746
64148,20321,3907,7108,46310,640
5,1772,4472,730
95,14088,1067,03437,3622,19835,16412,94011,7741,166
575,435281,116274,7106,406
186,295180,6025,693
107,673106,0681,605351154
2,756,383
1,780,438263,564620,25992,122
1,606,881544,640252,58930,547247,67613,828
824,961572,075102,933149,183
200,38212,74521,663155,61110,36336,898
196.51466745
62248,08521,1577,8088,55310,567
5,2682,5312,737
94,06487,0137,05135,8332,10833,72512,59711,1721,425
615,142293,246286,091
7,155200,284194,2386,046
121,270119,6171,653342149
2,832,137
1,835,799268,019637,41290,907
1,647,928566,600262,35231,614
258,49614,138
838,737583,432104,609149,938
2,908,072
1,888,158273,740656,20389,971
1,699,922590,829275,16633,493267,67914,491
856,369598,441106,346150,825
204,26312,74221,968159,46410,08938,328
191,52045825
43342,97818,1117,9036,59210,372
5,3302,4522,878
94,88487,9016,98334,9302,055
32,87512,94011,5701,370
648,084308,339300,8157,524
208,872202,3086,564
130,540128,7701,770333144
212,37513,22622,524166,7229,903
40,349
192,72144425
41943,05118,1698,0446,60310,235
5,5742,5573,017
96,64989,6666,98334,1312,008
32,12312,87211,4301,442
670,394317,555309,8067,749
212,634205,9776,657
139,960137,9881.972245121
6361
345,035183,22975,09464,31122,401
12770
330,714179,51770,14657,86623,185
12667
337,846182,01073,92459,11022,802
12465
344,605184,79474,40362,79822,610
6361
345,035183,22975,09464,31122,401
2,949,929'
1,919,240'275,244'666,199'89,246'
1,723,399605,491282,58333,907274,34814,653
861,824604,343105,945150,781
214,67513,22622,524169,1229,803
41,409
196,638'43024
40643,076'18,185'8,115'6,64c10,136'
5,6792,6123,067
99,78792.8286,95933,5661,975
31,59114,10012,5001,600
682.969'322,555314,684
7,871215,000208,4006,600
145,242142,3302.912
172'65'
58'49'
346,923184,07675,33865,25022,259
1. Based on data from various institutional and governmental sources, withsome quarters estimated in part by the Federal Reserve. Multifamily debt refersto loans on structures of five or more units.
2. Includes loans held by nondeposit trust companies but not bank trustdepartments.
3. Includes savings banks and savings and loan associations. Beginning 1987:1,data reported by FSLIC-insured institutions include loans in process and othercontra assets (credit balance accounts that must be subtracted from the corre-sponding gross asset categories to yield net asset levels).
4. Assumed to be entirely 1- to 4-family loans.5. FmHA-guaranteed securities sold to the Federal Financing Bank were
reallocated from FmHA mortgage pools to FmHA mortgage holdings in 1986:4,because of accounting changes by the Farmers Home Administration.
6. Outstanding principal balances of mortgage pools backing securities insuredor guaranteed by the agency indicated.
7. Other holders include mortgage companies, real estate investment trusts,state and local credit agencies, state and local retirement funds, noninsuredpension funds, credit unions, and other U.S. agencies.

A40 Domestic Financial Statistics • September 1988
1.55 CONSUMER INSTALLMENT CREDIT1 Total Outstanding, and Net Change, seasonally adjusted
Millions of dollars
Holder, and type of credit 1986 1987
1987
Sept. Oct. Nov. Dec
1988
Jan. Feb. Mar. Apr/ May
Amounts outstanding (end of period)
1 Total
By major holder2 Commercial banks . . . .3 Finance companies'. . .4 Credit unions5 Retailers1
6 Savings institutions . . .7 Gasoline companies. . .
By major type of credit8 Automobile9 Commercial banks . .
10 Credit unions11 Finance companies..12 Savings institutions .
13 Revolving14 Commercial banks. .15 Retailers16 Gasoline companies.17 Savings institutions .18 Credit unions
19 Mobile home20 Commercial banks . .21 Finance companies..22 Savings institutions .
23 Other24 Commercial banks . .25 Finance companies..26 Credit unions27 Retailers28 Savings institutions .
29 Total
By major holder30 Commercial banks . . . .31 Finance companies2 . . .32 Credit unions33 Retailers'34 Savings institutions . . .35 Gasoline companies. . .
By major type of credit36 Automobile37 Commercial banks . .38 Credit unions39 Finance companies..40 Savings institutions .
41 Revolving42 Commercial banks . .43 Retailers44 Gasoline companies.45 Savings institutions .46 Credit unions
47 Mobile home48 Commercial banks . .49 Finance companies..50 Savings institutions .
51 Other52 Commercial banks . .53 Finance companies..54 Credit unions55 Retailers56 Savings institutions .
571,833
262,139133,69876,19139,66056,8813,264
246,109100,90738,41392,35014,439
136,38186,75734,3203,2648,3663,674
26,8838,9268,8229,135
162,46065,54932,52634,1045,34024,941
613,022
281,564140,07281,06542,78263,9493,590
267,180108,43843,47498,02617,242
159,30798,80836,9593,59013,2796,671
25,9579,1017,7719,085
160,57865,21734,27530,9205,82324,343
602,977
276,805138,39580,35141,63262,0983,6%
261,902106,68542.11896,80916,290
152,55396,08335,9413,69611,3335,500
26,8459,1578,2359,453
161,67764,88033,35132,7335,69125,022
60«,926
278,855139,23680,67242,01262,4573,694
263.823107.41442,61297,26116,536
155,19697,41636,2703,69411,9225,894
9,1748,2289,296
161,20964,85133,74732,1665,74224,703
608,728
279,550138,92880,92342,29163,4123,624
264,474107,72743,07196,73316.943
156,42597,37836,5013,62412,6366,286
26,6049,1698,2119,224
161,22565,27633,98431,5665,79024,609
613,022
281,564140,07281,06542,78263,9493,590
267,180108,43843,47498,02617,242
159,30798,80836,9593,59013,2796,671
25,9579,1017,7719,085
160,57865,21734,27530,9205,82324,343
619,258
284,753141,69581,66242,92664,6333,590
269,883109,29843,95999,14717,479
162,065100,87937,0873,59013,6016,908
25,9269,0647,7539,109
161,38465,51234,79530,7955,83924,444
624,294
287,344142,94681,89743,08065,3963,631
273,133111,02144,251100,12317,738
163,462101,53737,2313,631
13,9457,117
25,8579,0357,6799,143
161,84265,75035,14430,5295,849
24,570
629,485
290,831144,05382,59543,27165,0783,657
276,762113,59344,795100,66917,705
165,643103,15237,4083,65714,0597,368
25,7328,9937,6409,099
161,34865,09435,74430,4325,86324,216
633,336
293,166144,51683,20443,29565,387
3,769
278,567114,86845,293
100,56417,841
167,356104,25037,414
3,76914,3097,614
25,7649,0477,5759,142
161,64965,00136,37630,2975,880
24,095
Net change (during period)
635,757
295,316144,45483,48843,16265,495
3,842
279,164115,91645,61799,70817,924
169,044105,59537,2593,842
14,5157,833
25,7048,9697,5789,157
161,84564,83637,16830,039
5,90323,899
54,078
20,49522,6704,268466
7,223-1,044
36,4738,1782,38822,8233,084
14,36811,150
47-1,0442,0782,137
49-627-4721,148
3,1881,794319
-257419913
41,189
19,4256,3744,8743,1227,068326
21,0717,5315,0615,6762,803
22,92612,0512,639326
4,9132,997
-926175
-1,051-50
-1,882-3321,749
-3,184483
-598
4,787
2,92673253525130043
2,3441,024603522195
2,7381,94121043139405
-341
-4611
-261-40256
-47341
-45
3,949
2,050841321380359-2
1,921729494452246
2,6431,333329-2589394
-14717-7
-157
-468-293%
-56751
-319
1,802
695-308251279955-70
651313459
-528407
1,229-38231-70714392
-94-5-17-72
16425237
-60048-94
4,294
2,0141,144142491537-34
2,706711403
1,293299
2,8821,430458-34643385
-647-68-440-139
-647-59291
-64633
-266
6,236
3,1891,6235971446840
2,703860485
1,121237
2,7582,0711280
322237
-31-37-1824
806295520
-12516101
5,036
2,5911,25123515476341
3,2501,723292976259
1,39765814441344209
-69-29-7434
458238349
-26610126
5,191
3,4871,107698191
-31826
3,6292,572544546-33
2,1811,61517726114251
-125-42-39-44
-494-656600-9714
-354
3,851
2,33546360924309112
1,8051,275498
-105136
1,7131,098
6112250246
3254
-6543
301-93632
-13517
-121
2,421
2,150- 6 2284
-13310873
5971,048
324
83
1,6881,345-155
73206219
- 6 0- 7 8
15
196-165
792-258
23-196
1. The Board's series cover most short- and intermediate-term credit extendedto individuals that is scheduled to be repaid (or has the option of repayment) intwo or more installments.
These data also appear in the Board's G.19 (421) release. For address, seeinside front cover.
2. More detail for finance companies is available in the G. 20 statistical release.3. Excludes 30-day charge credit held by travel and entertainment companies.

Consumer Installment Credit A41
1.56 TERMS OF CONSUMER INSTALLMENT CREDIT1
Percent unless noted otherwise
Item
INTEREST RATES
Commercial banks2
3 120-month mobile home'4 Credit card
Auto finance companies
6 Used car . . .
OTHER TERMS4
Maturity (months)
8 Used carLoan-to-value ratio
9 New car10 Used car
Amount financed (dollars)11 New car12 Used car
1985
12.9115.9414.9618.69
11.9817.59
JI.541.4
9194
9,9156,089
1986
11.3314.8213.9918.26
9.4415.95
50.042.6
9197
10,6656,555
1987
10.4514.2213.3817.92
10.7314.60
53.545.2
9398
11,2037,420
1987
Nov.
10.8614.5813.6217.82
12,2414.90
55.445.3
9499
11,6307,646
Dec.
n.a.n.a.n.a.n.a.
12.2314.97
55.545.3
9399
11,6457,718
1988
Jan.
n.a.n.a.n.a.n.a.
12.1914.56
55.547.2
9398
11,5347,612
Feb.
10.7214.4613.4517.80
12.2614.75
55.946.8
9499
11,4477,619
Mar.
n.a.n.a.n.a.n.a.
12.2414.77
56.046.9
9498
11,4937,587
Apr.
n.a.n.a.n.a.n.a.
12.2914.82
56.246.9
9498
11,5537,662
May
10.5514.4013.4917.78
12.2914.81
56.246.9
9499
11,6247,778
1. These data also appear in the Board's 0.19 (421) release. For address, seeinside front cover.
2. Data for midmonth of quarter only.
3. Before 1983 the maturity for new car loans was 36 months, and for mobilehome loans was 84 months.
4. At auto finance companies.

A42 Domestic Financial Statistics • September 1988
1.57 FUNDS RAISED IN U.S. CREDIT MARKETS
Billions of dollars; half-yearly data are at seasonally adjusted annual rates.
Transaction category, sector
1 Total net borrowing by domestic nonflnandal sectors
By sector and instrument
8 Corporate bonds
11 Multifamily residential12 Commercial13 Farm
15 Consumer credit
17 Open market paper18 Other
21 Households . . .22 Farm
25 Foreign net borrowing in United States26 Bonds
30 Total domestic plus foreign
31 Total net borrowing by financial sectors
By instrument
33 Sponsored credit agency securities
37 Corporate bonds38 Mortgages39 Bank'loans n.e.c
fly sector
44 Private "financial sectors45 Commercial banks46 Bank affiliates47 Savings and loan associations48 Finance companies49 RElTs50 CMO Issuers
51 Total net borrowing
53 State and local obligations
55 Mortgages
59 Other loans
60 Total new shire issues
61 Mutual funds62 All other
1983 1984 1985 1986 1987
1984
H2
1985
HI H2
1986
HI H2
1987
HI H2
Nonflnancial sectors
550.2
186.6186.7
- . 1
363.6253.4
53.716.0
183.6117.514.249.32.6
110.256.623.2-.831.3
363.634.0
188.24.1
77.060.3
17.33.13.66.54.1
567.5
99.3
67.81.4
66.4
31.517.4*
- . 121.3-7 .0
1.466.431.55.0
12.1-2 .112.9
3.7
666.8
254.453.736.5
183.656.626.726.928.4
61.8
27.234.628.32.63.7
753.9
198.8199.0
- . 2
555.1313.6
50.446.1
217.1129.725.163.2-.9
241.590.467.121.762.2
555.127.4
234.6- . 1
97.0196.0
8.33.8
-6 .66.25.0
762.2
151.9
74.930.444.4
77.036.2
.4
24.115.7
30.444.477.07.3
15.622.718.9
12.4
914.1
273.850.486.1
217.490.461.152.082.9
-36.4
29.3-65.7-74.5
7.8.9
854.8
223.6223.7
- . 1
631.1447.8136.473.8
237.7151.929.262.5-6 .0
183.394.638.614.635.5
631.191.8
293.4-13.9
93.1166.7
1.23.8
-2 .86.2
-6 .0
856.0
199.0
101.520.679.9
1.197.448.6
2̂ 632.014.2
21.779.997.4-4 .914.522.353.9
12.2
1,054.9
324.2136.4126.1237.794.638.352.844.8
831.7
215.0214.7
.4
616.7452.7
30.8121.3300.6201.2
33.174.6-8 .4
164.065.866.5-9 .341.0
616.744.3
281.1-15.1116.2190.2
9.02.6
-1 .011.5
- 4 . 0
840.7
295.3
178.115.2
163.3- . 4
117.269.0
4!o24.219.8
14.9163.3117.2-3 .6
4.6791149.7
37.1
1,136.0
393.530.8
192.9300.765.869.526.456.5
672.2
143.8142.3
1.5
528.4435.6
34.399.4
301.7211.425.071.5-6 .3
92.841.89.32.3
39.4
528.433.9
248.9-11.7103.3153.9
3.86.3
-3 .62.1
-1 .0
676.0
284.2
168.330.2
138.8- . 8
116.065.8
28.824.4
29.5138.8116.0
7.13.0
35.730.8
1.438.0
960.2
312.934.5
171.5301.941.82.4
33.262.1
790.4
207.2207.3
- . 1
583.3342.567.069.8
205.7119.922.463.8-.4
240.886.263.016.874.7
583.338.6
234.2
92.2217.8
-19.46.3
-11.9-4 .3-9 .6
771.0
722.7
204.8204.9
-.1
518.0350.4
67.062.2
221.2139.225.059.5-2 .5
167.595.321.014.436.8
518.056.3
259.8- 7 . 085.7
123.2
-5 .85.5
-5 .82.8
- 8 . 2
716.9
Financial sectors
150.7
77.331.545.8
73.541.5
.4
.716.014.9
31.545.873.5-5 .310.823.329.6
15.0
175.1
96.826.670.3
78.348.9
2.314.612.5
26.670.378.3-4 .710.214.249.7- . 69.5
All sectors
921.8
284.567.0
117.6206.0
86.251.828.680.0
892.1
301.767.0
116.6221.295.317.531.841.1
986.8
242.5242.5
- . 1
744.3545.2205.885.3
254.2164.733.465.5-9 .5
199.193.956.214.834.2
744.3127.2327.1
-20.8100.5210.3
8.22.1
.19.6
-3 .7
995.0
222.8
106.314.689.52.2
116.548.3
.12.9
49.415.9
16.889.5
116.5-5 .018.930.458.1
14.9
1,217.8
346.6205.8135.7254.293.959.273.748.6
679.1
207.2207.4
- . 1
471.8365.6-15 .6135.3245.9163.931.359.7- 9 . 0
106.371.012.2
-13.136.2
471.84.3
233.0-16.9
96.7154.7
21.56.2
19.1-5 .3
700.5
242.3
136.18.7
126.5.8
106.272.1
.64.0
15.114.4
9.5126.5106.2-2 .7-1 .725.553.1
31.4
942.8
342.5-15 6213.6246.571.017.721.046.1
984.4
222.8222.0
.9
761.6539.8
77.2107.3355.4238.6
34.989.6-7 .7
221.760.6
120.8-5 .545.8
761.684.3
329.3-13.3135.6225.8
-3 .5-1 .1-3 .5
3.9-2 .7
980.9
348.2
220.121.7
200.0-1 .5128.166.0- . 54.0
33.425.2
20.2200.0128.1-4 .610.934.046.3
42.8
1,329.1
444.577.2
172.1354.960.6
121.331.766.8
External corporate equity funds raised in United States
19.9
85.7-65.8-81.5
12.03.7
91.6
163.3-71.7-80.8
8.3
1.6
75.4-73.8-76.5
5.4-2 .7
-24.9
32.2-57.1-69.4
8.83.5
3.0
64.2-61.2-75.5
11.23.1
3«.7
107.1-70.4-87.5
12.84.3
100.8
155.5-54.7-68.7
7.56.6
82.3
171.1-88.7-92.7
9.1-5 .1
623.1
152.8151.7
1.0
470.3443.6
34.997.3
311.4221.0
30.069.8-9 .3
26.728.3
-32.64.5
26.6
470.333.2
231.1-17.8104.5119.4
-7 .4-1 .7- 3 . 2-5 .3
2.7
615.7
319.3
180.58.1
174.0-1 .5138.780.2
- 4 J49.413.6
6.6174.0138.714.111.527.732.9
52.6
935.0
334.834 9
175.8311.6
28.3-40.5
48.641.5
84.5
147.2-62.7-70.0
5.41.9
721.4
134.9132.9
2.0
586.4427.7
34.1101.6291.9201.9
20.173.1- 3 . 2
158.855.251.2
.152.2
586.434.7
266.8- 5 . 6102.1188.5
15.014.3
-4 .19.5
-4 .7
736.3
249.7
156.552.3
104.1
93.251.4
-1.98.2
35.2
52.3104.193.2
- 5 . 643.828.7
23.3
986.0
291.434.1
167.3292.2
55.245.317.882.7
-81 .3
3.6-84.9-83 .0
5.3- 7 . 2

Flow of Funds A43
1.58 DIRECT AND INDIRECT SOURCES OF FUNDS TO CREDIT MARKETS
Billions of dollars, except as noted; half-yearly data are at seasonally adjusted annual rates.
Transaction category, or sector 1983 1984 1985 1986 1987
1984
H2
198S
HI H2
1986
HI H2
1987
HI H2
1 Total rands advanced In credit markets to domesticnomraandal lectors
By public agencies and foreign2 Total net advances3 U.S. government securities4 Residential mortgages5 FHLB advances to savings and loans6 Other loans and securities
Total advanced, by sector7 U.S. government8 Sponsored credit agencies9 Monetary authorities
10 Foreign
Agency and foreign borrowing not in line 111 Sponsored credit agencies and mortgage pools12 Foreign
Private domestic funds advanced13 Total net advances14 U.S. government securities15 State and local obligations16 Corporate and foreign bonds17 Residential mortgages18 Other mortgages and loans19 LESS: Federal Home Loan Bank advances
Private financial intermediation20 Credit market funds advanced by private financial
institutions21 Commercial banking22 Savings institutions23 Insurance and pension funds24 Other finance
25 Sources of funds26 Private domestic deposits and RPs27 Credit market borrowing
28 Other sources29 Foreign funds30 Treasury balances31 Insurance and pension reserves32 Other, net
Private domestic nonftnancial investors33 Direct lending in credit markets34 U.S. government securities35 State and local obligations36 Corporate and foreign bonds37 Open market paper38 Other
39 Deposits and currency40 Currency41 Checkable deposits42 Small time and savings accounts43 Money market fund snares44 Large time deposits45 Security RPs46 Deposits in foreign countries
47 Total of credit market Instruments, deposits, andcurrency
48 Public holdings as percent of total49 Private financial intermediation (in percent)50 Total foreign funds
MEMO: Corporate equities not included above51 Total net bwies52 Mutual fund shares53 Other equities54 Acquisitions by financial institutions55 Other net purchases
550.2
114.026.376.1- 7 . 018.6
9.769.810.923.7
67.817.3
521.3228.153.714.555.0
162.4- 7 . 0
395.8144.3135.6100.1
15.8
395.8215.4
31.5
148.914.6
- 5 . 3109.730.0
157.099.340.3
-11.612.017.0
232.814.328.8
215.4-39.0-8.318.53.1
389.9
20.175.938.2
61.827.234.651.110.7
753.9
157.639.356.515.746.2
17.174.38.4
57.9
74.98.3
679.5234.5
50.435.198.2
276.915.7
559.8168.9150.2121.8118.9
559.8316.977.0
165.98.84.0
118.634.5
196.7123.630.45.29.3
28.1
320.48.6
28.0150.749.084.35.0
-5 .1
517.1
20.782.466.7
-36 .429.3
-65.719.7
-56.1
854.8
202.347.194.614.246.3
16.8101.521.662.3
101.51.2
755.2277.0136.440.886.4
228.814.2
579.5186.383.0
156.0154.2
579.5213.2
97.4
268.919.710.3
141.098.1
273.2145.347.611.843.924.6
223.512.441.5
138.68.97.6
16.6-2.1
496.7
23.676.782.0
19.985.7
-65.843.4
-22.9
831.7
319.784.8
160.319.854.7
9.5177.330.2
102.6
178.19.0
699.2308.7
30.883.474.0
222.119.8
726.9194.7105.5176.7249.9
726.9271.4117.2
338.312.91.7
152.8170.9
89.447.1- 5 . 434.7-4 .817.9
291.814.4
100.1120.843.8
-11.618.35.9
381.2
38.0104.0115.5
91.6163.3
-71.750.641.0
672.2
231.658.2
135.624.413.4
-13.7166.2
10.069.2
168.33.8
612.6254.7
34.585.5
100.8161.624.4
558.7136.6135.8177.2109.4
558.7163.8116.0
279.044.0-5 .8147.893.0
169.969.458.723.06.8
12.1
180.619.0- . 2
78.827.231.026.9- 2 . 2
350.5
34.391.2
113.2
1.675.4
-73.843.0
-41.4
790.4
182.551.057.414.959.2
26.675.2
4.875.9
77.3-19.4
665.7233.5
67.053.084.8
242.314.9
532.1145.5133.595.3
157.8
532.1353.573.5
105.11.7
10.874.618.0
207.184.350.436.93.0
32.5
354.03.6
29.9169.973.479.1
1.2-3 .1
561.1
23.779.977.6
-24 .932.2
-57.139.7
-64.6
722.7
195.850.388.612.544.4
25.196.427.546.8
96.8-5 .8
618.0251.3
67.039.775.5
197.012.5
483.8143.354.5
139.4146.5
483.8191.478.3
214.110.813.9
118.671.4
212.5156.214.815.43.5
22.6
198.315.913.8
162.110.6
-7.312.2
- 9 . 0
410.7
27.378.357.7
3.064.2
-61.259.5
-55.8
986.8
208.743.9
100.715.948.2
8.4106.7
15.877.8
106.38.2
892.5302.7205.842.097.4
260.615.9
675.2229.4111.4172.5161.9
675.2235.0116.5
323.628.66.6
163.4124.7
333.9134.580.48.2
84.226.6
248.78.8
69.2115.1
7.122.521.14.9
582.6
21.075.6
106.4
36.7107.1
-70.427.3
9.5
679.1
264.774.0
123.714.452.6
10.8128.213.2
112.5
136.121.5
571.9268.6-15.6100.271.5
161.714.4
638.5117.294.5
169.0257.9
638.5252.2106.2
280.111.9
- 4 . 2136.6135.8
39.742.2
-67.668.8
-17.313.6
261.910.782.5
112.646.9
.210.0- . 9
301.6
37.8111.6124.4
100.8155.5
-54.746.554.3
984.4
374.695.6
196.925.256.9
8.2226.5
47.292.7
220.1-3 .5
826.4348.977.266.676.5
282.425.2
815.3272.3116.6184.4241.9
815.3290.6128.1
396.514.07.6
168.9206.1
139.251.956.8
1.122.1
321.618.2
117.8129.040.6
-23.326.512.8
460.9
38.298.7
106.7
82.3171.1
-88.754.627.7
623.1
237.045.4
166.813.611.1
-16.6168.1
10.874.6
180.5-7 .4
559.3289.5
34.970.384.194.113.6
578.599.1
106.4210.2162.8
578.560.0
138.7
379.824.54.3
175.2175.7
119.572.925.6-8 .019.09.9
45.19.6
-21.651.7
3.14.0
22.7-24.5
164.6
38.5103.499.2
84.5147.2
-62.767.417.1
721.4
226.371.0
104.635.215.4
-11.2164.7
9.163.8
156.515.0
666.5220.4
34.1100.7117.3229.2
35.2
538.9173.6165.1144.256.0
538.9265.4
93.2
180.363.5
-16.0120.3
12.5
220.866.391.853.9-5 .514.3
313.928.421.3
105.951.355.931.020.1
534.7
30.780.8
127.2
-81 .33.6
-84.918.5
-99.9
NOTES BY LINE NUMBER.1. Line 1 of table 1.57.2. Sum of lines 3-6 or 7-10.6. Includes farm and commercial mortgages.
11. Credit market funds raised by federally sponsored credit agencies, and netissues of federally related mortgage pool securities.
13. Line 1 less line 2 plus line 11 and 12. Also line 20 less line 27 plus line 33.Also sum of lines 28 and 47 less lines 40 and 46.
18. Includes farm and commercial mortgages.26. Line 39 less lines 40 and 46.27. Excludes equity issues and investment company shares. Includes line 19.29. Foreign deposits at commercial banks, bank borrowings from foreign
branches, and liabilities of foreign banking agencies to foreign affiliates, lessclaims on foreign affiliates and deposits by banking in foreign banks.
30. Demand deposits and note balances at commercial banks.
31. Excludes net investment of these reserves in corporate equities.32. Mainly retained earnings and net miscellaneous liabilities.33. Line 13 less line 20 plus line 27.34-38. Lines 14-18 less amounts acquired by private finance plus amounts
borrowed by private finance. Line 38 includes mortgages.40. Mainly an offset to line 9.47. Lines 33 plus 39, or line 13 less line 28 plus 40 and 46.48. Line 2/line 1.49. Line 20/line 13.50. Sum of Unes 10 and 29.51. 53. Includes issues by financial institutions.NOTE. Full statements for sectors and transaction types in flows and in amounts
outstanding may be obtained from Flow of Funds Section, Division of Researchand Statistics, Board of Governors of the Federal Reserve System, Washington,D.C. 20551.
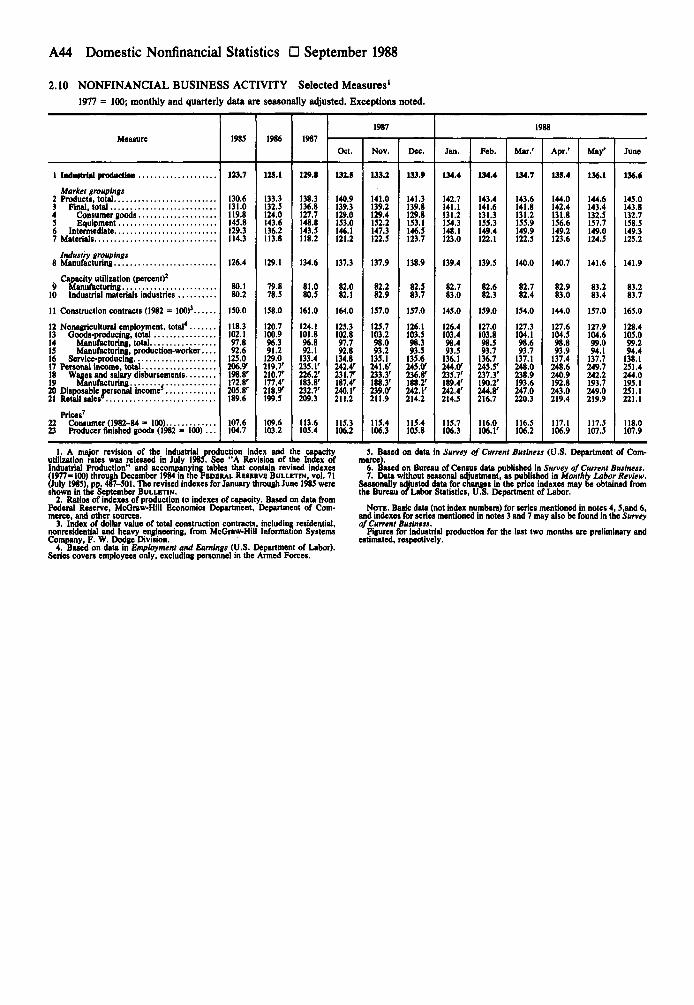
A44 Domestic Nonfinancial Statistics D September 1988
2.10 NONFINANCIAL BUSINESS ACTIVITY Selected Measures'
1977 = 100; monthly and quarterly data are seasonally adjusted. Exceptions noted.
Measure 198S 1986 1987
1987
Oct. Nov. Dec
1988
Jan. Feb. Mar/ Apr/ May' June
1 Industrial production
Market groupings2 Products, total3 Final, total4 Consumer goods5 Equipment6 Intermediate7 Materials
Industry groupings8 Manufacturing
Capacity utilization (percent)2
9 Manufacturing10 Industrial materials industries
11 Construction contracts (1982 - 100)3
12 Nonagricultural employment, total4
13 Goods-producing, total14 Manufacturing, total15 Manufacturing, production-worker....16 Service-producing17 Personal income, total18 Wages and salary disbursements19 Manufacturing ,20 Disposable personal income3
21 Retail sales*.
Prices7
22 Consumer (1982-84 - 100)23 Producer finished goods (1982 - 1 0 0 ) . . .
123.7
130.6131.0119.8145.8129.3114.3
126.4
80.180.2
150.0
118.3102.197.892.6
125.0206.9'198.8'172.8'205.8'189.6
107.6104.7
125.1
133.3132.5124.0143.6136.2113.8
129.1
79.878.5
158.0
120.7100.996.391.2
129.0219.7'210.7'177.4'218.9'199.5
109.6103.2
129.8
138.3136.8127.7148.8143.5118.2
134.6
81.080.5
161.0
124.1101.896.892.1
133.4235.1'226.2'183.8'232.7'209.3
113.6105.4
132.S
140.9139.3129.0153.0146.1121.2
137.3
82.082.1
164.0
125.3102.897.792.8
134.8242.4'231.7'187.4'240.1'211.2
115.3106.2
133.2
141.0139.2129.4152.2147.3122.5
137.9
82.282.9
157.0
125.7103.298.093.2
135.1241.6'233.3'188.3'239.0'211.9
115.4106.3
133.9
141.3139.8129.8153.1146.5123.7
138.9
82.583.7
157.0
126.1103.598.393.5
135.6245.0'2 3 6 ^188.2'242.1'214.2
115.4105.8
134.4
142.7141.1131.2154.3148.1123.0
139.4
82.783.0
145.0
126.4103.498.493.5
136.1244.0'235.7'189.4'242.4'214.5
115.7106.3
134.4
143.4141.6131.3155.3149.4122.1
139.5
82.682.3
159.0
127.0103.898.593.7
136.7245.5'237.3'190.2'244.8'216.7
116.0106.1'
134.7
143.6141.8131.2155.9149.9122.5
140.0
82.782.4
154.0
127.3104.198.693.7
137.1248.0238.9193.6247.0220.3
116.5106.2
135.4
144.0142.4131.8156.6149.2123.6
140.7
82.983.0
144.0
127.6104.598.893.9
137.4248.6240.9192.8243.0219.4
117.1106.9
136.1
144.6143.4132.5157.7149.0124.5
141.6
83.283.4
157.0
127.9104.699.094.1
137.7249.7242.2193.7249.0219.9
117.5107.5
136.6
145.0143.8132.7158.5149.3125.2
141.9
83.283.7
165.0
128.4105.099.294.4
138.1251.4244.0195.1251.1221.1
118.0107.9
1. A major revision of the industrial production index and the capacityutilization rates was released in July 1985. See "A Revision of the Index ofIndustrial Production" and accompanying tables that contain revised indexes(1977-100) through December 1984 in the FEDERAL RESERVE BULLETIN, vol. 71(July 1985), pp. 487-501. The revised indexes for January through June 1985 wereshown in the September BULLETIN.
2. Ratios of indexes of production to indexes of capacity. Based on data fromFederal Reserve, McGraw-Hill Economics Department, Department of Com-merce, and other sources.
3. Index of dollar value of total construction contracts, including residential,nonresidential and heavy engineering, from McGraw-Hill Information SystemsCompany, F. W. Dodge Division.
4. Based on data in Employment and Earnings (U.S. Department of Labor).Series covers employees only, excluding personnel in the Armed Forces.
5. Based on data in Survey of Current Business (U.S. Department of Com-merce).
6. Based on Bureau of Census data published in Survey of Current Business.7. Data without seasonal adjustment, as published in Monthly Labor Review.
Seasonally adjusted data for changes in the price indexes may be obtained fromthe Bureau o f Labor Statistics, U.S. Department of Labor.
NOTE. Basic data (not index numbers) for series mentioned in notes 4,5,and 6,and indexes for series mentioned in notes 3 and 7 may also be found in the Surveyof Current Business.
Figures for industrial production for the last two months are preliminary andestimated, respectively.

Selected Measures A45
2.11 LABOR FORCE, EMPLOYMENT, AND UNEMPLOYMENT
Thousands of persons; monthly data are seasonally adjusted. Exceptions noted.
Category 1985 1986 19871987
Nov. Dec.
1988
Jan. Feb. Mar. Apr.' May June
HOUSEHOLD SURVEY DATA
1 Nooliwtltuaonitf population1
2 Labor force (Including Armed Forces)1
3 Civilian labor forceEmployment
4 NonagricuHural industries2
5 AgricultureUnemployment
6 Number7 Rate (percent of civilian labor force ) . . . .8 Not in labor force
ESTABLISHMENT SURVEY DATA
9 NonagricuKural payroll employment3
10 Manufacturing11 Mining12 Contract construction13 Transportation and public utilities14 Trade15 Finance16 Service17 Government
110,440
117,695115,461
103,9713,179
8,3127.2
62,745
97,519
19,260927
4,6735,238
23,0735,955
22,00016,394
182,822
120,078117,834
106,4343,163
8,2377.0
62,744
99.52S
18,965777
4,8165,255
23,6836,283
23,05316,693
185,010
122,122119,865
109,2323,208
7,4256.2
62,888
102,310
19,065721
4,9985,385
24,3816,549
24,19617,015
185,737
122,861120,594
110,3323,172
7,0905.9
62,876
103,678
19,297736
5,0905,466
24,7196,608
24,60417,158
185,882
122,984120,722
110,5293,215
6,9785.8
62,898
104,001
19,348735
5,1185,481
24,7686,619
24,72517,207
186,083
123.436121,175
110,8363,293
7,0465.8
62,647
104,2<2
19,369728
5,0835,499
24,9376,633
24,79517,218
186,219
123,598121,348
111,1823,228
6.938
62,621
104,729
19,390731
5,1505,513
25,0806,636
24,97517,254
1(6,361
123,153120,903
110,8993,204
6,8015.6
63,208
105,020
19,405733
5,1925,530
25,1116,651
25,07817,320
186,478
123,569121,323
111,4853,228
6,6105.4
62,909
105,281
19,460737
5,2385,543
25,1826,650
25,16317,308
186,600
123,204120,978
111,1603,035
6,7835.6
63,396
105,502r
19,489'737
5,238'5,558'
25,240"6,650'
25,232'17,358'
186,755
123,665121,472
111,9333,085
1 363,090
105,848
19,534741
5,2945,581
25,3426,665
25,39017,301
1. Persons 16 years of age and over. Monthly figures, which are based onsample data, relate to the calendar week that contains the 12th day; annual dataare averages of monthly figures. By definition, seasonality does not exist inpopulation figures. Based on data from Employment and Earnings (U.S. Depart-ment of Labor).
2. Includes self-employed, unpaid family, and domestic service workers.
3. Data include all full- and part-time employees who worked during, orreceived pay for, the pay period that includes the 12th day of the month, andexclude proprietors, self-employed persons, domestic servants, unpaid familyworkers, and members of the Armed Forces. Data are adjusted to the March 1984benchmark and only seasonally adjusted data are available at this time. Based ondata from Employment and Earnings (U.S. Department of Labor).

A46 Domestic Nonfinancial Statistics • September 1988
2.12 OUTPUT, CAPACITY, AND CAPACITY UTILIZATION1
Seasonally adjusted
Series1987
Q3
1988
Ql Q2
1987
Q3 Q4
1988
Ql Q2
1987
Q3 Q4
1988
Ql Q2
Output (1977 = 100) Capacity (percent of 1977 output) Utilization rate (percent)
1 Total industry
2 Mining3 Utilities4 Manufacturing.
6 Advanced processing.
7 Materials
8 Durable goods9 Metal materials
10 Nondurable goods11 Textile, paper, and chemical.12 Paper13 Chemical
14 Energy materials.
130.9
100.6111.6
135.7
119.2145.8
U9.1
125.583.6
128.2130.5144.5130.7
100.0
15 Total Industry
16 Mining
17 Utilities
18 Manufacturing
19 Primary processing...20 Advanced processing.21 Materials22 Durable goods
23 Metal materials
24 Nondurable goods
25 Textile, paper, andchemical
26 Paper27 Chemical28 Energy materials...
133.0
103.2112.5
137.9
122.1147.5
121.9
129.691.1
129.3132.3
101.8
Previous cycle2 Latest cycle3
134.5
102.5115.1
139.6
122.7149.6
122.6
131.386.6
130.3133.1
100.9
1987
136.0
104.1112.4
141.4
124.0151.8
124.4
134.1
131.7133.9
161.3
127.0138.8
166.7
139.8182.9
147.2
163.9109.4144.7144.4145.1
101.2
1J0.9
120.1
162.2
128.4139.4
167.7
140.6184.1
147.8
164.7108.8145.6145.4
119.9
163.1
127.7139.8
168.9
141.6185.6
148.5
165.7108.8146.8146.7
119.7
1987
High Low High Low June Oct. Nov. Dec, Jan. Feb. Mar. Apr.
164.2
127.0140.1
170.2
142.7186.7
149.3
166.8109.1148.3148.5
119.4
81.2
78.080.5
81.4
85.379.7
81.0
76.776.588.690.499.686.3
83.3
82.1
81.280.6
82.3
86.980.1
82.9
79.184.089.391.599.289.1
85.2
1988
Capacity utilization rate (percent)
88.6
92.895.6
87.7
91.986.0
92.0
91.899.2
91.1
92.898.492.5
94.6
72.1
87.882.9
69.9
68.371.1
70,5
64.467.1
66.7
64.870.664.4
86.9
86.9
95.288.5
M.5
85.1
89.1
89.893.6
88.1
89.497.387.9
94.0
69.5
76.978.0
68.0
65.169.5
68.5
60.945.770.7
68.879.963.5
82.3
80.3
76.679.0
80.8
84.079.2
79.8
75.971.5
86.1
87.196.383.1
82.8
81.9
80.680.5
82.0
86.280.1
82.1
78.382.4
88.2
90.497.4
84.9
82.1
81.581.2
82.2
87.080.0
82.9
79.083.3
89.0
91.098.788.6
85.7
82.4
81.580.4
82.5
87.880.1
83.7
80.287.6
90.5
92.7101.690.8
85.1
82.5
80.782.4
82.7
87.180.7
83.0
79.780.1
90.8100.687.8
84.7
82.4
79.578.3
82.6
86.680.7
82.3
79.379.3
87.3
88.597.885,7
84.1
82.4
80.180.5
82.7
86.880.8
82.3
79.178.2
88.3
89.998.087.4
83.8
82,7
81.880.6
82.9
87.081.1
83.1
79.979.2
88.6
90.098.187.4
84.8
82.4
80.282.1
82.7
86.980.7
82.5
79.479.288.189.698.887.0
84.2
May
82.9
81.382.1
83.1
87.181.3
83.4
80.681.1
88.7
90.098.7'88.3'
84.6
82.9
82.080.2
83.1
86.981.4
83.4
80.481.1
90.2
84.7
June
85.1
82.181.8
83.2
86.881.6
83.7
80.882.0
88.7
89.9
85.7
1. These data also appear in the Board's O.3 (402) release. For address, seeinside front cover.
2. Monthly high 1973; monthly low 1975.3. Monthly highs 1978 through 1980; monthly lows 1982.
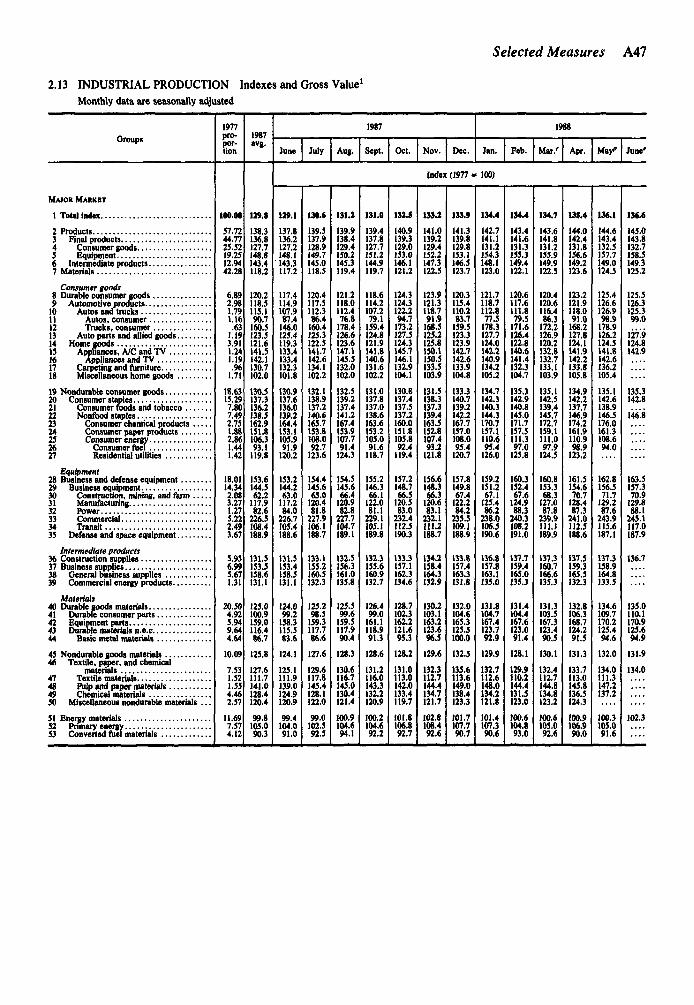
Selected Measures A47
2.13 INDUSTRIAL PRODUCTION Indexes and Gross Value1
Monthly data are seasonally adjusted
Groups
MAJOR MARKET
1 Total index
2 Products3 Final oroducts..
5 Equipment
7 Materials
Consumer goods
13 Auto parts and allied goods14 Home goods15 Appliances, A/C and TV16 Appliances and TV
18 Miscellaneous home goods
20 Consumer staples
22 Nonfood staples • • •23 Consumer chemical products . . . . .
26 Consumer fuel27 Residential utilities
Equipment
30 Construction, mining, and farm
32 Power
34 Transit
Intermediate products36 Construction supplies
38 General business supplies
Materials
42 Equipment parts43 Durable materials n.e.c.,44 Basic metal materials
46 Textile, paper, and chemicalmaterials
47 Textile materials ,
49 Chemical materials50 Miscellaneous nondurable materials . . .
1977pro-por-tion
100.00
57.7244.7725.5219.2512.9442.28
6.892.981.791.16
631.193.911.241.19.96
1.71
18.6315.297.807.492.751.882.861.441.42
18.0114.342.083.271.275.222.493.67
5.956.995.671.31
20.504.925.949,644.64
10.09
7.531.521.554.462.57
11.697.574.12
1987avg.
129.8
138.3136.8127.7148.8143.4118.2
120 2118.5113.190.7
1605123.5121.6141.5142.1130.7102.0
130 5137.3136.2138.5162.9151.8106.393.1
119.8
153.6144 562.2
117.982.6
2265108.4188.9
131.5153.5158.6131.1
125.0100.9159.0116.486.7
125.8
127.6111.7141.0128.4120.4
99.8105.090.3
1987
June
129.1
137.8136.2127.2148.1143.3117.2
117.4114.9107.987.4
146 0125.4119.3133.4133.4132.3101.8
130.9137.6136.0139.2164.4153,1105.991.9
120.2
153.2144.263.0
117.284.0
226 7105.4188.6
131.5153.4158.5131.1
124.099.2
158.3115.583.6
124.1
125.1111.9139.0124.9120.9
99.4104.091.0
July
130.6
139.5137.9128.9149.7145.0118.5
120.4117.5112.386.4
160.4125.3122.5141.7142.6134.1102.2
132.1138.9137.2140.6165.7153.8108.092.7
123.6
154.4145.665.0
120.481.8
227.9106.1188.7
133.1155.2160.5132.3
125.298.5
159.3117.786.6
127.6
129.6117.8145.4128.1122.0
99.0102.592.5
Aug.
131.2
139.9138.4129.4150.2145.3119.4
121.2118.0112.476.8
178.4126.6123.6147.1145.5132.0102.0
132.5139.2137.4141.2167.4153.9107.791.4
124.3
154.5145.666.4
120.982.8
227.7104.7189.1
132.5156.3161.0135.8
125.599.6
159.5117.990.4
128.3
130.6116.714J.0130.4121.4
100.9104.694.1
Sept.
131.0
139.4137.8127.7151.2144.9119.7
118.6114.2107.279.1
159.4124.8121.9141.8140.6131.6102.2
131.0137.8137.0138.6163.6153.2105.091.6
118.7
155.2146.366.1
122.081.1
229.1105.1189.8
132.3155.6160.9132.7
126.499.0
161.1118.991.3
128.6
131.2116.0143.3132.2120.9
100.2104.692.2
Oct.
132.5
140.9139.3129.0153.0146.1121.2
124.3124.3122.294.7
173.2127.5124.3145.7146.1132.9104.1
130.8137.4137,5137.2160.0151.8105.892.4
119.4
157.2148.766.5
120.583.0
232.4112.5190.3
133.3157.1162.3134.6
128.7102.3162.2121.695.3
128.2
131.0113.0142.0133.4119.7
101.8106.892.7
Nov. Dec.
Index (1977 •
133.2
141.0139.2129.4152.2147.3122.3
123.9121.3118.791.9
168.5125.2125.8190.1150.5133.5103.9
131.5138.3137.3139.4163.5152.8107.493.2
121.8
156.6148.366.3
120.683.1
232.1111.2188.7
134.2158.4164.3132.9
130.2103.1163.2123.696.5
129.6
132.3112.7144.4134.7121.7
102.8108.492.6
1J3.9
141.3139.8129.8153.1146.5123.7
120.3115.4110.283.7
159.5123.3123.9142.7142.6133.9104.8
133.3140.7139.2142.2167.7157.0108.095.4
120.7
157.8149.867.4
122.284.2
235.5109.1188.9
133.8157.4163.3131.8
132.0104.6165.3125.3100.0
132.5
135.6113.6149.0138.4123.3
101.7107.790.7
1988
Jan,
100)
134.4
142.7141.1131.2154.3148.1123.0
121.7118.7112.877.5
178.3127.7124.0142.2140.9134.2105.2
134.7142.3140.3144.3170.7157.1110.695.4
126.0
159.2151.267.1
125.486.2
238.0106.5190.6
136.8137.8163.1135.0
131.8104.7167.4123.792.9
129.9
132.7112.6148.0134.2121.8
101.4107.390.6
Feb.
134.4
143.4141.6131.3155.3149.4122.1
120.6117.6111.879.5
171.6126.4122.8140.6141.4132.3104.7
135.3142.9140.8145.0171.7157,5111,397.0
125.8
160.3152.467.6
124.988.3
240.3108.2191.0
137.7159.4165.0135.3
131.4104.4167.6123.091.4
128.1
129,9110.2144.4131.5123.0
100.6104.893.0
Mar/
134.7
143.6141.8131.2153.9149.9122.3
120.4120.6116.486.3
172.2126.9120.2132.8132.7133.1103.9
135.1142.5139.4145.7172.7159.1111.097.9
124.5
160.8153.368.3
127.087.8
239.9111.1189.9
137.3160.7166.6135.3
131.3103.5167.3123.490.5
130.1
132.4112.7144.8134.8123.2
100.6105.092.6
Apr.
13S.4
144.0142.4131,8156.6149.2123.6
123.2121.9118.091.0
168.2127.8124.1141.9142.2133.8105.8
134.9142.2137.7146.9174.2161.9110.998.9
123.2
161.5154.670.7
128.487.3
241.0112.5188.6
137.5159.3165.5132.3
132.8106,3168.7124.291.5
131.3
133.7113.0145.8136.5124.3
100.9106.990.0
May"
136.1
144.6143.4132.5157.7149.0124.5
125.4126.6126.998.9
178.9126.2124.5141.8142.6136.2105.4
135.1142.6138.9146.5176.0161.3108.694.0
162.8156.571.7
129.287.6
243.9115.6187.1
137.3158.9164.8133.5
134.6109.7170.2125.494.6
132.0
134.0111.3147.2137.2
100.3105.091.6
June'
136.6
145.0143.8132,7158.5149,3123.2
125.5126.3125.399.0
127.9124.8142.9
135.3142.8
146.8
163.5157.370.9
129.888.1
245.1117.0187.9
136.7
135.0110.1170.9125.694.9
131.9
134.0
102.3

A48 Domestic Nonfinancial Statistics D September 1988
2.13 INDUSTRIAL PRODUCTION Indexes and Gross Value1—Continued
Groups
MAJOR INDUSTRY
1 Mining and utilities2 Mining3 Utilities4 Manufacturing
6 Durable
Mining7 Metalg Coal
Nondurable manufactures11 Foods
13 Textile mill products...
17 Chemicals and products
19 Rubber ana plastic products
Durable manufactures
25 Iron and steel
27 Nonelectrical machinery28 Electrical machinery . •.
30 Motor vehicles and parts31 Aerospace and miscellaneous
transportation equipment ..
33 Miscellaneous manufactures
Utilities34 Electric
MAJOR MARKET
35 Products, total
36 Final
38 Equipment
SICcode
1011.12
1314
2021222326
2728293031
242532
33331.2
343536
37371
372-6.93839
1977propor-
tion
15.799.835.96
84.2135.1149.10
.501.607.07
.66
7.9662
2.292.793.15
4.548.052.402.80
.53
2.301 272.72
5.333.496.469.547.15
9.135.25
3.872.661.46
4.17
517.5
405.7272.7133.0111.9
1987avg.
104.3100.7110.3134.6136.7133.1
77.5131.892.7
128.2
137.7103 4115.8107.4144.4
172.0140.193.5
163.660.0
130.3152 8119.1
81.570.8
111.0152.7172.3
129.2111.8
152.8143.9102.6
126.6
1,735.8
1,333.8866.0467.8402.0
1987
June
103.099.2
109.4134.0136.9132.0
70.7128.891.8
128.5
137.7107 01172107.7142.6
174 1139.3923
165.460.8
131.1153 9117.9
78.868.3
111 1151.8170.5
126 5107.4
152.4144.5101.2
128.8
1,720.4
1,320.1855.1465.0400.3
July
103.799.2
111.2135.6138.5133.5
71.4127.991.8
130.7
138.5106.8118.3109.7148.8
174.0140.894.1
167.259.2
132.8156.2118.8
81.470.9
111.1155.3172.5
127.6109.4
152.3143.8100.5
131.0
Aug.
105.4100.9112.9135.9138.8133.8
79.3130.593.0
130.3
138.8110.4119.8108.4148.9
174.7142.392.9
164.861.3
131.1155 2116.5
85.176.0
110.1154.3174.3
128.1109.1
153.9146.3102.2
132.0
Sept.
105.4101.9111.2135.7138.6133.7
86.5133.393.3
130.0
139.5101.7118.2107.6147.4
174.9142.493.5
165.260.7
126.9155.9118.6
84.574.6
111.1156.6173.4
125.5105.6
152.5145.6102.1
127.5
Oct.
106.8103.6112.1137.3138.1136.8
85.6140.394.1
131.0
138.0103.7116.8108.0146.0
175.2141.594.6
166.759.6
129.8156.0118.9
90.682.0
113.5158.0175.5
132.0116.0
153.7146.7104.6
126.8
Nov. Dec.
Index (1977 •
107.9104.6113.2137.9139.6136.7
90.4142.994.2
134.1
138.9106 5117.3109.4148.3
175.7144.493.3
169.960.7
134.0158 5120.5
90.279.7
113.6157.2175.6
130.4114.0
152.7147.8104.5
127.5
107.3104.6111.7138.9141.3137.3
96.5140.694.1
135.6
140.1110 5118.2107.8150.6
176.9147.996.1
170.657.5
133.6159.4120.1
90.681.9
115.8161.0175.9
128.1110.2
152.4145.5105.6
125.6
1988
Jan.
= 100)
107.8103.3115.2139.4141.4137.9
91.5140.293.1
132.1
141.2105 8116.2108.7149.9
177.5147.996.3
170.558.3
136.3158 0120.4
86.577.8
117.1162.9177.4
128.6109.7
154.2148.2105.0
130.3
Gross value (billions of 1982 dollars, annual rates
1,732.5
1,326.6863.2463.5405.9
1,741.7
1,334.9866.4468.5406.8
1,735.9
1,330.3856.9473.4405.6
1,774.1
1,360.9876.6484.4413.2
1,772.4
1,359.9879.8480.1412.5
1,778.8
1,359.4881.2478.2419.4
1,790.6
1,375.5893.6481.9415.1
Feb.
106.8101.5115.6139.5141.1138.4
83.9133.792.4
134.3
141.9107.0115.3108.5148.0
178.7145.495.9
172.359.7
139.0158.3121.6
86.477.4
117.6163.6177.8
128.4109.3
154.5149.2104.4
130.7
)
1,7*7.5
1,381.1893.7487.3416.5
Mar.'
106.7102.7113.3140.0141.7138.8
84.9129.194.8
136.9
141.1107 2117.0108.7149.1
180.4146.498.4
172.259.5
137.8159 4122.5
85.174.2
118.8164.6176.6
130.0113.0
153.0149.7105.1
129.0
1,807.5
1,385.9893.2492.7421.6
Apr.
107.1104.8110.8140.7142.1139.7
85.1136.095.8
141.0
139.6107 6117.9109.2149.2
181.5148.698.4
172.658.0
137.8159 7121.4
85.374.5
118.9166.3178.9
130.4114.8
151.6151.6105.8
127.4
1,810.4
1,393.2897.8495.3417.2
May"
106.6103.4111.8141.6142.1141.2
130.295.1
140.9
140.4
117.0
149.8
180.9149.395.2
171.857.0
137.7160 2121.7
89.178.7
119.7168.7179.2
133.2119.6
151.6151.0106.1
128.8
1,815.5
1,397.5898.1499.4417.9
June'
108.1104.0114.7141.9142.2141.7
132.095.4
181.5
94.2
89.0
120.4169.5180.4
133.2119.2
152.2151.5
1,811.0
1,395.2892.4502.8415.8
1. These data also appear in the Board's G. 12.3 (414) release. For address, seeinside front cover.
A major revision of the industrial production index and the capacityutilization rates was released in July 1985. See "A Revision of the Index of
Industrial Production" and accompanying tables that contain revised indexes(1977-100) through December 1984 in the FEDERAL RESERVE BULLETIN, vol. 71(July 1985), pp. 487-501. The revised indexes for January through June 1985 wereshown in the September BULLETIN.

Selected Measures A49
2.14 HOUSING AND CONSTRUCTION
Monthly figures are at seasonally adjusted annual rates except as noted.
Item 1985 1986 1987
1987
Aug. Sept. Oct. Nov. Dec.
1988
Jan. Feb.' Mar/ Apr/ May
Private residential real estate activity (thousands of units)
NEW UNITS
1 Permits authorized2 l-famlly3 2-or-more-family
4Started5 1-famUy6 2-or-more-family
7 Under construction, end of period1
8 1-family9 2-or-more-family
10 Completed11 1-family12 2-or-more-family
13 Mobile homes shipped
Merchant builder activity in1-famify units
14 Number sofa15 Number for sale, end of period1...
Price (thousands of dollars)1
Median16 Units sold
Average17 Units sold
EXISTING UNITS (1-family)
18 Number sold
Price of units sold(thousands of dollars)1
19 Median20 Average
CONSTRUCTION
21 Total put In pbce
22 Private23 Residential24 Nonresidentlal, total
Buildings25 Industrial26 Commercial27 Other28 Public utilities and other
29 Public30 Military31 Highway32 Conservation and development...33 Other
350
84.3
101.0
3,217
75.490.6
1,7501,071
679
1,8051,179
626
1,074583490
1,7561,120
637
244
748361
92.2
112.2
3,566
80.398.3
1,5351,024
511
1,6211,146
474
987591397
1,6691,123
546
233
672370
104.7
127.9
3,530
85.6106.2
1,5141,014
500
1,5831,109
474
1,044621423
1,6331.069
564
234
673361
106.8
128.5
3,410
86.5107.0
1,501983518
1,6791.211
468
1,046627419
1,5911,100
491
240
644361
106.5
133.5
3,430
85.5106.9
1,453962491
1,5381,105
433
1,044627417
1,5651,114
451
234
653360
106.5
125.8
3,470
84.6106.1
1,459971488
1.6611,129
532
1,042625417
1,5711.088
483
222
625362
117.0
139.2
3,370
85.0106.6
1,372957415
1,3991,035
364
1,016618398
1,6241,104
520
227
586365
111.8
136.2
3,330
85.4107.1
1,248918330
1,3821,016
366
1,008614394
1,5501,098
452
200
579368
119.0
144.4
3,170
87.4108.7
1,4291,003
426
1,5191,102
417
983596387
1,4521,043
409
648359
110.9
137.6
3,250
88.1110.4
1,4761,030
446
1,5291,172
357
999617382
1,5981,094
504
212
653374
107.0
131.6
3,330
87.9110.7
1,449960489
1,5841,093
491
1,001623378
1,6351,054
581
213
660371
111.0
135.6
3,520
87.3108.7
1.436982454
1.384996388
990612378
1,4581,086
372
216
658375
110.0
135.9
3,590
88.8111.9
Value of new construction3 (millions of dollars)
3S5V735'
291,665158/75133,190
15,76959,62912,61945,173
64.07C3235'1 W1 , W4^77'
34j518'
386,093'
314,651'187,147127,504'
13,74756,76213,21643,779'
71,437'3,868'
22,681'4,646'
40,242'
398.84T
323,819'194,772'129,047'
13,707'55,448'15,464'44,428'
75,028'4,327'
22,758'5.16T
42,781'
398,26T
325,664'193,117'132,547'
u,ur57,839'15,227'45,169'
72.603'4,158'
21,783'5,137'
41,525'
4OS,375'
327,131'194,801'132,33c
15,332'56,531'15,497'44,970'
78,244'6,048'
23,145'5,023'
44,028'
400,8ir
325,915'194,547'131,368'
13,968'56,890'16,018'44,492'
74,903'4,010'
24.374'5,144'
41,375'
407,0*6'
331,497'19SJ9V135,898'
14,512'59474'16,692'45,320'
75,569'5,080'
23,439'4,871'
42,179'
410,870'
331,641'195,822'135,819'
14,13c55,831'17,708'48.15C
79,228'4,879'
25,274'5,759'
43,316'
3M.244'
321.55C195,168'126,382'
13,480'53,555'16,954'42,393'
73,715'4,172'
24,808'4,038'
40.69T
392,456
317,754192,097125,657
13,48953,57117,10141,496
74,7023,280
25,3484,535
41,539
403,555
324,257195,554128,703
14,54654,84317,30142,013
79,2984,216
26,9634,899
43,220
402,678
323,624195,279128,345
15,48056,08116,39640,388
79,0544,384
27,0564,443
43,171
407,080
328,180193,432134,748
16,68558,37016,92242,771
78,9004,277
25,0964.671
44,856
1. Not at annual rates.2. Not seasonally adjusted.3. Value o r new construction data in recent periods may not be strictly
comparable with data in prior periods because of changes by the Bureau of theCensus in its estimating techniques. For a description or these changes seeConstruction Reports (C-30-76-5), issued by the Bureau in July 1976.
NOTE. Census Bureau estimates for all series except (1) mobile homes, whichare private, domestic shipments as reported by the Manufactured HousingInstitute and seasonally adjusted by the Census Bureau, and (2) sales and pricesof existing units, which are published by the National Association of Realtors. Allback and current figures are available from the originating agency. Permitauthorizations are those reported to the Census Bureau from 16,000 jurisdictionsbeginning with 1978.

A50 Domestic Nonfinancial Statistics D September 1988
2.15 CONSUMER AND PRODUCER PRICES
Percentage changes based on seasonally adjusted data, except as noted
Item
Change from 12months earlier
1987June June
Change from 3 months earlier(at annual rale)
1987
Sept. Dec,
1988
Mar. June
Change from 1 month earlier
1988
Feb.' Mar.' Apr. May June
IndexlevelJune1988
(1982- 100)'
CONSUMER PRICES2
1 AH Items
2 Food3 Energy items4 All items less food and energy.5 Commodities6 Services
PRODUCER PRICES
7 Finished goods8 Consumer foods9 Consumer energy
10 Other consumer goods.11 Capital equipment
12 Intermediate materials3
13 Excluding energy
Crude materials14 Foods15 Energy16 Other
3.7
5.3.0
4.13.14.6
2.34.2
-4 .12.61.6
2.62.7
8.77.48.1
4.0
3.3
4i53.64.9
2.31.7
-2.73.72.5
5.46.9
8.7-6.515.4
3.9
2.16.03.82.94.3
3.8-1 .816.54.64.0
5.65.3
-4.85.9
39.4
3.2
2.8-3.9
4.42.55.0
-1.9-5.7-9.6
1.7- .7
4.37.2
-4.8-15.2
18.0
4.2
1.4-4.9
5.44.75.9
2.35.6
-19.65.33.2
3.97.8
16.7-23.6
13.8
4.5
7.14.24.33.94.5
5.09.86.22.83.6
7.B7.3
31.511.5
-5.3
- .3- .6
.2
.1
.4
- .2-1.1-1.0
.3
,2.2
2.2- . 61.2
.6-2.3
.6
.7
.8
.4
.6
.4
.43.1
.0
.2
.42.5
.2
2.41.3
-1.7
.6- . 2
.4
.2
.5
.41.1
-1.6.3.4
.6
4.2-1.0
111.0
117.691.0
123.0115.4127.4
107.9112.560.8
117.9114.2
107.1114.9
108.470.7
131.0
1. Not seasonally adjusted.2. Figures for consumer prices are those for all urban consumers and reflect a
rental equivalence measure of homeownership after 1982.
3. Excludes intermediate materialt for food manufacturing and manufacturedanimal feeds.
SOURCE. Bureau of Labor Statistics.

Selected Measures A51
2.16 GROSS NATIONAL PRODUCT AND INCOME
Billions of current dollars except as noted; quarterly data are at seasonally adjusted annual rates.
Account 1985r 1986' 1987'
1987'
Q2 Q3 Q4
1988
Ql'
GROSS NATIONAL PRODUCT
1 Total
fly source2 Personal consumption expenditures3 Durable goods .V.4 Nondurable goods5 Services
6 Gross private domestic investment7 Fixed investment8 Nonresldential9 Structures
10 Producers' durable equipment11 Residential structures
12 Change in business inventories13 Nonfarm
14 Net exports of goods and services15 Exports16 Imports
17 Government purchases of goods and services . .18 Federal19 State and local
fly major type of product20 Final sales, total21 Goods22 Durable23 Nondurable24 Services23 Structures
26 Change in business inventories27 Durable goods28 Nondurable goods
29 MEMO
Total GNP In 1982 dollars
NATIONAL INCOME
30 Total
31 Compensation of employees32 Wages and salaries33 Government and government enterprises . .34 Other "33 Supplement to wages and salaries36 Employer contributions for social insurance37 Other labor income38 Proprietors' income1
39 Business and professional1
40 Farm'
41 Rental income of persons2
42 Corporate profits1 „43 Profits before tax*44 Inventory valuation adjustment45 Capital consumption adjustment
46 Net interest
4,014.9
2,629.0372.2911.2
1,345.6
643.1631.8442.9153.2289.7188.8
11.314.6
-78.0370.9448.9
820.8355.2465.6
4,003.61,641.2
706.5934.6
1,968.3405.4
11.36.44.9
3,618.7
3,234.0
2,367.51,975.2
372.01,603.4
392.4204.8187.6
255.9225.6
30.2
9.2
282.3224.3-1 .759.7
319.0
4,140.3
2,807.5406.5943.6
1,457.3
665.9650.4433.9138.5295.4216.6
15.517.4
-104.4378.4482.8
871.2366.2505.0
4,224.71,697.9
725.3»72.6
2,118.3424.0
15.54.2
11.3
3,721.7
3,437.1
2,507.12,094.0
393.71,700.3
413.1217.0196.1
286.7250.3
36.4
12.4
298.9236.4
8.354.2
331.9
4,516.7
3,012.1421.9997.9
1,592.3
712.9673.7446.8139.5307.3226.9
39.240.7
-123.0428.0551.1
924.7382.0542.8
4,487.51,792.5
776.31,016.32,295.7
438.4
39.226.612.6
3,847.0
3,678.7
2,683.42,248.4
420.11,828.3
435.0227.1207.9
312.9270.043.0
18.4
310.4276.7-18 .0
51.7
353.6
4,484.2
2,992.2420.5995.3
1,576.4
698.5665.8438.2134.4303.8227.6
32.731.4
-122.2416.8539.0
915.7377.5538.2
4,451.51,774.6
767.11,007.52,276.2
433.4
32.724.38.4
3,(23.0
3,631.8
2,652.02,220.6
416.91,803.7
431.3225.0206.4
3089265.9
43.0
17.8
305.2273.7-20.0
51.5
348.1
4,568.0
3,058.2441.4
1,006.61,610.2
702.8688.3462.1143.0319.1226.2
14.517.8
-125.2440.4565.6
932.2386.3546.0
4,553.51,812.9
792.21,020.72,314.4
440.6
14.52.9
11.6
3,8*5.3
3,708.0
2,702.82,265.3
423.21,842.1
437.5228.2209.3
306.8271.5
35.2
18.1
322.0289.4-19.5
52.1
358.3
4,662.8
3,076.3422.0
1,012.41,641.9
764.9692.9464.1147.7316.3228.8
72.072.8
-125.7459.7585.4
947.3391.4555.9
4,590.71,849.4
808.71,040.72,363.9
449.5
72.050.521.6
3,923.0
3,802.0
2,769.92,324.8
429.21,895.6
445.1232.7212.4
326.0279.0
47.0
20.5
316.1281.9-18.2
52.4
369.5
4,724.5
3,128.1437.8
1,016.21,674.1
763.4698.1471.5140.1331.3226.6
65.349.4
-112.1487.8599.9
945.2377.7567.5
4,659.21,879.4
819.31,060.12,405.2
439.9
65.326.638.6
3,850.8
2,816.42,358.7
437.11,921.6
457.7243.1214.6
323.9279.244.7
20.5
316.2286.2-19.4
49.4
373.9
4,806.9
3,186.8446.9
1,030.31,709.6
756.5713.5485.4145.3340.1228.1
43.035.5
-90 .6501.1591.7
954.2375.2579.0
4,763.91,912.7
851.41,061.32,446.7
447.5
43.026.416.5
3,986.3
n.a.
2,872.62,408.7
443.01,965.7
463.9247.4216.5
322.6284.638.0
17.9
n.a.n.a.-29.8
47.9
382.1
1. With inventory valuation and capital consumption adjustments.2. With capital consumption adjustment.
3. For after-tax profits, dividends, and the like, see table 1.48.SOURCE. Survey of Current Business (Department of Commerce).
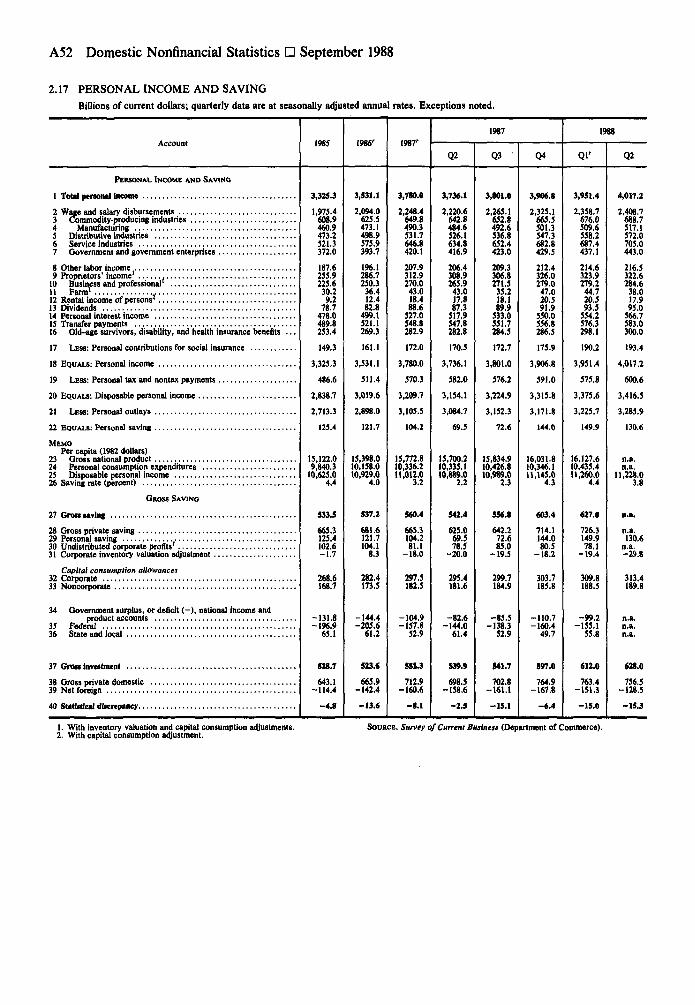
A52 Domestic Nonflnancial Statistics • September 1988
2.17 PERSONAL INCOME AND SAVING
Billions of current dollars; quarterly data are at seasonally adjusted annual rates. Exceptions noted.
Account 1985 1986' 1987'
1987
Q2 Q3 Q4
1988
Ql' Q2
PERSONAL INCOME AND SAVING
1 Total personal Income
2 Wage and salary disbursements3 Commodity-producing industries4 Manufacturing5 Distributive industries6 Service industries7 Government and government enterprises
8 Other labor income9 Proprietors' income1
10 Business and professional1
11 Farm' ,.12 Rental income of persons2
13 Dividends14 Personal interest income15 Transfer payments16 Old-age survivors, disability, and health insurance benefits
17 LESS: Personal contributions for social insurance
18 EQUALS: Personal income
19 LESS: Personal tax and nontax payments
20 EQUALS: Disposable personal income
21 LESS: Personal outlays
22 EQUALS: Personal saving
MEMO
Per capita (1982 dollars)23 Oross national product24 Personal consumption expenditures25 Disposable personal income26 Saving rate (percent)
GROSS SAVING
27 Groat saving
28 Gross private saving29 Personal saving30 Undistributed corporate profits'31 Corporate inventory valuation adjustment
Capital consumption allowances32 Corporate33 Noncorporate
34 Government surplus, or deficit ( - ) , national income andproduct accounts
35 Federal36 State and local
37 Gran Investment
38 Gross private domestic39 Net foreign
40 SMtbtfcal dUcrepancy
3,325.3
1,975.4608.9460.9473.2521.3372.0
187.6255.9225.6
30.29.2
78.7478.0489.8253.4
149.3
3,325.3
486.6
2,838,7
2,713.3
125.4
15,122.09,840.3
10,625.04.4
533.5
665.3125.4102.6-1 .7
268.6168.7
-131.8-196.9
65.1
S28.T
643.1-114.4
- 4 . g
3,531.1
2,094.0625.5473.1498.9575.9393.7
196.1286.7250.3
36.412.482.8
499.1521.1
269.3
161.1
3,531.1
511.4
3,019.6
2,898.0
121.7
15,398.010,158.010,929.0
4.0
537.2
681.6121.7104.1
8.3
282.4173.5
-144.4-205.6
61.2
S23.<
665.9-142.4
3,780.0
2,248.4649.8490.3531.7646.8420.1
207.9312.9270.0
43.018.488.6
527.0548.8
282.9
172.0
3,780.0
570.3
3,209.7
3,105.5
104.2
15,772.810,336.211,012.0
560.4
665.3104.281.1
-18.0
297.5182.5
-104.9-157.8
52.9
551.3
712.9-160.6
-S . I
3,736.1
2,220.6642.8484.6526.1634.8416.9
206.4308.9265.9
43.017.887.3
517.9547.8
282.8
170.5
3,736.1
582.0
3,154.1
3,084.7
69.5
15,700.210,335.110,889.0
542.4
625.069.578.5
-20.0
295.4181.6
-82.6-144.0
61.4
539.9
698.5-158.6
- 2 . 5
3,801.0
2,265.1652.8492.6536.8652.4423.0
209.3306.8271.5
35.218.189.9
533.0551.7
284.5
172.7
3,801.0
576.2
3,224.9
3,152.3
72.6
15,834.910,426.810,989.0
2.3
554.8
642.272.685.0
-19.5
299.7184.9
-85.5-138.3
52.9
S41.7
702.8-161.1
-15.1
3,906.8
2,325.1665.5501.3547.3682.8429.5
212.4326.0279.0
47.020.591.9
550.0556.8
286.5
175.9
3,906.8
591.0
3,315.8
3,171.8
144.0
16,031.810,346.111,145.0
4.3
603.4
714.1144.080.5
-18 .2
303.7185.8
-110.7-160.4
49.7
597.0
764.9-167.8
-6.4
3,951.4
2,358.7676.0509.6558.2687.4437.1
214.6323.9279.2
44.720.593.5
554.2576.3298.1
190.2
3,951.4
575.8
3,375.6
3,225.7
149.9
16,127.610,435.411,260.0
4.4
627.0
726.3149.978.1
-19.4
309.8188.5
-99.2-155.1
55.8
612.0
763.4-151.3
-J5 .0
4,017.2
2,408.7688.7517.1572.0705.0443.0
216.5322.6284.6
38.017.995.0
566.7583.0
300.0
193.4
4,017.2
600.6
3,416.5
3,285.9
130.6
n.a.n.a.
11,228.03.8
n.a.
n.a.130.6
n.a.-29.8
313.4189.8
n.a.n.a.n.a.
628.0
756.5-128.5
-15.3
1. With inventory valuation and capital consumption adjustments.2. With capital consumption adjustment.
SOURCE. Survey of Current Business (Department of Commerce).

Summary Statistics A53
3.10 U.S. INTERNATIONAL TRANSACTIONS Summary
Millions of dollars; quarterly data are seasonally adjusted except as noted.1
Item credits or debits 1985 1986 19871987
Ql Q3
1988
Ql'
1 Balance on current account2 Not seasonally adjusted . M3 Merchandise trade balance2
4 Merchandise exports5 Merchandise Imports6 Military transactions, net7 Investment income, net3
8 Other service transactions, net9 Remittances, pensions, and other transfers
10 U.S. government grants (excluding military)
11 Change in U.S. government asaets, other than officialreserve assets, net (increase, - )
-115,102 -138,827 -153,964
12 Change in U.S. official reserve assets (increase, - ) .13 Gold14 Special drawing rights (SDKs)15 Reserve position in International Monetary Fund.16 Foreign currencies
17 Change in U.S. private assets abroad (increase, - ) 3 .18 Bank-reported claims19 Nonbank-reported claims20 U.S. purchase of foreign securities, jiet21 U.S. direct investments abroad, net9
22 Change in foreign official assets in the United States(increase, +)
23 U.S. Treasury securities24 Other U.S. government obligations25 Other U.S. government liabilities4
26 Other U.S. liabilities reported by U.S. banks27 Other foreign official assets'
I private assets in the United States
2930313233
U.S. bank-reported liabilitiesU.S. nonbank-reported liabilitiesForeign private purchases of U.S. Treasury securities, netForeign purchases of other U.S. securities, net.Foreign direct investments in the United States, net9
34 Allocation of SDRs35 Discrepancy36 Owing to seasonal adjustments37 Statistical discrepancy in recorded data before seasonal
adjustment >
-122,148215,935
-338,083-3,43125,936
-449-3,786
-11,223
-2,829
-3,8580
-897908
-3.869
-25,949-1,323
923-7,481
-18,068
-1,196-838-301
767645
-1,469
131,09641,045
-36620,43350,96219,022
017,839
-144,547223,969
-368,516-4,37223,143
2,257-3,571
-11,738
-2,000
3120
-2461,500-942
-96,303-59,975
-4,220-4,297
-27,811
35,50734,364-1,214
2,0541,187-884
185,74679,783-2,906,
3,80970,96934,091
015,566
-160,280249,570
-409,850-2,36920,374
1,755-3,434
-10,011
1,162
9,1490
-5092,0707,588
-86,298-40,531
3,145-4,456
-44,456
44,96843,361
1,570-2,824
3,901-1,040
166,52187.7782,150
-7,59642,21341,976
018,461
MEMOChanges in official assets
38 U.S. official reserve assets (increase, - )39 Foreign official assets in the United States (increase, +)
excluding line 2540 Change in Organization of Petroleum Exporting Countries
official assets in the United States (part ofline 22above)
41 Transfers under military grant programs (excluded fromlines 4 , 6 , and 10 above)
17,839
-3,858
-1,963
-6,709
46
15,566
312
33,453
-9,327
101
18,461
9,149
47,792
-9,956
58
-37,624-33,032-39,871
56,791-96,662
-785,076-143-867
-2,100
67
..956
76606
1,274
9,04921,870
-491-1,639
-10,691
13,97712,193
- 6 2-1,337
3,543-360
19,122-6,100
1,696-2,82618,3737,979
0-6,547
4,141
-10,688
1,956
15,314
-2,801
8
-40,852-41.799-39,552
59,864-99,416
-1791,692
13-884
-2,241
-170
3,4190
-171335
3,255
-26,127-22,422
2 * 88-6,220
10,33211,083
256-1,309
615-313
40,32717,9611,570
-2,43115,9987,229
013,071
-2,615
15,686
3,419
11,641
-2,681
26
-41,967-47\330-39,665
64,902-104,567
-8511,067
87-855
-2,125
252
320
-210407
-165
-25,576-16,519
-215-972
-7,870
611842714
-287- 3 4
-624
71,04746,153
-116-2,83512,81915,026
0-4,399-4,658
259
32
898
-1,723
13
-33,523-31,803-41,192
68,013-109,205
-1,26112,539
479-828
-3,545
1,012
3,7410
-205722
3,225
-43,645-23,460
1,248-1,757
-19,676
20,04719,243
662108
-223257
36,02529,764
-1,000496
-4,97711,742
016,3423,138
13,204
3,741
19,939
-2,750
12
-39,751-34,937-35,945
74,672-110,617
-899-595
735-868
-2,283
-780
1,5030
155446901
8,16917,402
' -4,318-4,845
24,37227,568
-116-251
-1,996-833
3,504-15,994
7,0012,328
10.169
02,9843,925
-941
1,503
24,623
-1,331
15
1. Seasonal factors are not calculated for lines 6,10,12-16,18-20,22-34, and38-41.
2. Data are on an international accounts (IA) basis. Differs from the Censusbasis data, shown in table 3.11, for reasons of coverage and timing. Militaryexports are excluded from merchandise data and are included In line 6.
3. Includes reinvested earnings.
4. Primarily associated with military sales contracts and other transactionsarranged with or through foreign official agencies.
5. Consists of investments in U.S. corporate stocks and in debt securities ofprivate corporations and state and local governments.
NOTE. Data are from Bureau of Economic Analysis, Survey of Current Business(Department of Commerce).

A54 International Statistics D September 1988
3.11 U.S. FOREIGN TRADE1
Millions of dollars; monthly data are not seasonally adjusted.
Item
1 EXPORTS of domestic and foreignmerchandise excluding grant-aidshipments, f.a.s. value
2 GENERAL IMPORTS includingmerchandise for immediateconsumption plus entries intobonded warehouses, c.i.f. value . . . .
3 Tradebalanee
1985
218,815
352,463
-133,648
1986
227,159
382,295
-155,137
1987
254,122
424,442
-170,320
1987
Nov.
23,279
36,739
-13,4*0
Dec.
24,314
37,340
-13,026
1988
Jan.
22,990
34,523
-11,533
Feb.
24,139
37,133
-12,994
Mar.
29,106
38,633
-9,528
Apr/
26,335
36,528
-10,193
May
27,268
37,972
-10,703
1. The Census basis data differ from merchandise trade data shown in table3.10, U.S. International Transactions Summary, for reasons of coverage andtiming. On the export side, the largest adjustment is the exclusion of military sales(which are combined with other military transactions and reported separately inthe "service account" in table 3.10, line 6). On the Import side, additions are madefor gold, ship purchases, imports of electricity from Canada, and other transac-
tions; military payments are excluded and shown separately as indicated above.As of Jan. I, 1987 census data are released 45 days after the end of the month.Total exports and the trade balance reflect adjustments for undocumented exportsto Canada.
SOURCE. FT900 "Summary of U.S. Export and Import Merchandise Trade"(Department of Commerce, Bureau of the Census).
3.12 U.S. RESERVE ASSETS
Millions of dollars, end of period
Type 1984 1985 1986
1987
Dec.
1988
Jan. Feb. Mar. Apr. May June"
Total.
2 Oold stock, including ExchangeStabilization Fund1
3 Special drawing rights2'3
4 Reserve position in InternationalMonetary Fund2
5 Foreign currencies4
34,934
11,096
5,641
11,541
6,656
43,18*
11,090
7,293
11,947
12,856
48,511
11,064
8,395
11,730
17,322
45,798
11,078
10,283
11,349
13,088
42,955
11,068
9,765
10,804
11,318
43,064
11,063
9,761
10,445
11,795
43,186
11,063
9,899
10,645
11,579
42,730
11,063
9,589
10,803
11,275
41,949
11,063
9,543
10,431
10,912
41,028
11,063
9,180
9,992
10,793
1. Oold held under earmark at Federal Reserve Banks for foreign and interna-tional accounts is not included in the gold stock of the United States; see table3.13. Oold stock is valued at $42.22 per fine troy ounce.
2. Beginning July 1974, the IMF adopted a technique for valuing the SDR basedon a weighted average of exchange rates for the currencies of member countries.From July 1974 through December 1980,16 currencies were used; from January1981,5 currencies have been used. The U.S. SDR holdings and reserve position
in the IMF also are valued on this basis beginning July 1974.3. Includes allocations by the International Monetary Fund of SDRs as follows:
$867 million on Jan. 1,1970; $717 million on Jan. 1,1971; $710 million on Jan. 1,1972; $1,139 million on Jan. I, 1979; $1,152 million on Jan. 1, 1980; and $1,093million on Jan. 1,1981; plus transactions in SDRs.
4. Valued at current market exchange rates.
3.13 FOREIGN OFFICIAL ASSETS HELD AT FEDERAL RESERVE BANKS'
Millions of dollars, end of period
Assets
1 Deposits
Assets held In custody 22 U.S. Treasury securities3 Earmarked gold3
1984
267
118,00014,242
1985
480
121,00414,245
1986
287
155,83514,048
1987
Dec.
244
195,12613,919
1988
Jan.
355
206,67513,882
Feb.
343
215,30813,824
Mar.
534
222,40713,773
Apr.
215
224,72513,719
May
297
226,34113,654
June
381
223,12713,662
1. Excludes deposits and U.S. Treasury securities held for international andregional organizations.
2. Marketable U.S. Treasury bills, notes, and bonds; and nonmarketabJe U.S.Treasury securities payable in dollars and in foreign currencies.
3. Earmarked gold and the gold stock are valued at $42.22 per One troy ounce.Earmarked gold is gold held for foreign and international accounts and is notincluded in the (old stock of the United States.

Summary Statistics A55
3.14 FOREIGN BRANCHES OF U.S. BANKS Balance Sheet Data1
Millions of dollars, end of period
Asset account 1984 1985 19861987
Nov. Dec. Jan. Feb. Mar. Apr.
45 Total, all currendo . .
46 Claims on United States47 Parent bank48 Other banks in United States .49 Nonbanks50 Claims on foreigners51 Other branches of parent bank52 Banks53 Public borrowers54 Nonbank foreigners
55 Other assets
56 Total payable In U.S. dollar!.
AH foreign countries
1 Total, all currencies
2 Claims on United States3 Parent bank4 Other banks in United States5 Nonbanks6 Claims on foreigners7 Other branches of parent bank8 Banks .7 .9 Public borrowers
to Nonbank foreigners
11 Other assets
12 Total payable in U.S. dollars
13 Claims on United States14 Parent bank15 Other banks in United States16 Nonbanks17 Claims on foreigners18 Other branches of parent bank19 Banks20 Public borrowers21 Nonbank foreigners
22 Other assets
23 Total, aU currencies
24 Claims on United States25 Parent bank26 Other banks in United States27 Nonbanks28 Claims on foreigners29 Other branches of parent bank30 Banks31 Public borrowers32 Nonbank foreigners
33 Other assets
34 Total payable In U.S. dollars
35 Claims on United States36 Parent bank37 Other banks in United States38 Nonbanks39 Claims on foreigners40 Other branches of parent bank41 Banks42 Public borrowers43 Nonbank foreigners
44 Other assets
453,656
113,39378,10913,66421,620320,16295,184100,39723,343101,238
20,101
350,636
111,42677,22913,50020,697
228,60078,74676,94017,62655,288
10,610
144,315
27,67521,862
1,4294,384
111,82837,95337,4435,334
31,098
4,882
112,80926,86821,495
1,3634,010
82,94533,60726,8054,030
18,503
2,996
146,811
77,29649,44911,54416,30365,59817,66130,2466,089
11,602
3,917
141,542
458,012
119,70687,20113,05719,448
315,67691,399
102,96023,47897,839
22,630
336,520
116,63885,97112,45418,213
210,12972,72771,86817,26048,274
9,753
456,628
114,56383,49213,68517,386
312,95596281105,23723,70687,731
29,110
317,487
110,62082,08212,83015,708
195,06372,19766,42116,70839,737
11,804
525,894
140,425102,81416,70120,910346,819116,509115,59122,38592,334
38,650
353,973
133,731100,12314,63218,976
203,963«5,54865,77114,95237,692
15,379
518,604
138,034105,84516,41615,773
342,506122,155108,85621,828
89,667
38,064
3*0,106132,023103,25114,65714,115
202,42788,28463,70614,73035,707
15,656
503,254
131,37695,48214,91020,984334,074115,275108,16121,329
89,309
37,804
335,313124,89392,46613,43918,988
196,15484,46861,35914,72035,607
14,266
495,003
131,01294,34815,008'21,656'326,653111,671105,60421,33188,047
37,338
330,726
124,78691,27113,88619,629
190,92283,06358,18114,64535,033
15,018
502,398
135,33999,04114,50721,791328,328'108,972106,93621,748'90,672
38,731'
333,874
128,77095,77613,19019,804
190,75881,69258,27414,85335,939
14,346
488,939
139,186102,95713,34222,887314,338103,090101,22620,82789,195
35,415
327,736
133,299100,32012,32820,651179,71275,65454,57814,40735,073
14,725
United Kingdom
148,599
33,15726,970
1,1065,081
110,21731,57639,2505,644
33.747
5,225
108,624
32,09226,568
1,0054,519
73,47526,01126,1393,999
17,3263,059
140,917
24,59919,0851,6123,902
109,50833,42239,4684,990
31,628
6.810
95,028
23,19318,5261,4753,192
68,13826,36123,2513,677
14,8493,697
167,726
35,39229,553
1,6944,145
121,48739,13841,6495,272
35,428
10,847
107,289
33,40928,685
1,4083,316
68,86429,16621,8333,472
14,3935,016
158,695
32,51827,350
1,2593,909
115,70039,90336,7354,752
34,310
10,477
109,574
30,43926,304
1,0443,091
64,56028,63519,1883,313
13,4245,575
160,144
32,46426,923
1,5583,983
118,40739,70239,6974,639
34,369
9,373
102,148
30,15625,854
1,1323,170
67,45829,33620,8143,313
13,9954,534
157,634
32,86927,484
1,5273,858
115,48938,07738,6544,613
34,145
9,276
101,642
30,97126,565
1,2733,133
66,31329,81319,5163,347
13,6374,358
155,657
29,40624,512
1,1113,783
117,15034,27840,4225,312
37,138
9,101
95,97227,21323,217
9453,051
64,42226,81219,8313,864
13,915
4,337
152,592
31,61826,155
1,0134,450
112,26133,01938,7904,914
35,538
8,713
93,21429,55525,137
7813,637
59,43424,86718,0653,412
13,090
4,225
Bahamas and Caymans
142,055
74,86450,55311.20413,10763,88219,04228.1926,45810,190
3,309
136,794
142,592
78,04854,57511,15612,31760,00517,29627,4767,051
8,182
4,539
136,813
155,100
82,36652,75913,98015,62767,65818,90533,4797,196
8,078
5,076
144,525
160,321
85,31860,04814,27710,99370,16221,27733,7517,428
7,706
4,841
151,434
148,718
79,89351,24912,47216,17263,46919,80229,3407,257
7,070
5,356
141,135
143,630
78,01548,40212,662'16,951'60,11118,48627,6877,063
6,875
5,504
135,916
153,254
85,84756,33012,40017,11761,95219,36828,6376,891
7,056
5,455
145,050
152,930
88,29359,24011,48017,57358,80817.79026,6906,8497,479
5,829
145,398
492,844
141,789104,29914,62422,866315,493102,931103,42921,18187,952
35,562
334,112
136,077101,57813,59920,900182,98176,13657,10214,34235,401
15,054
156,184
32,83227,5061,3603.966
114,64233,84939,8835177
35,733
8,710
97,188
30,73626,6081,0683,060
62,01825,44819,5553|25213,7634,434
156,353
90,89660,41912,48917,98859,37418,46327,0196,9556,937
6.083
148,545
1. Beginning with June 1984 data, reported claims held by foreign brancheshave been reduced by an increase in the reporting threshold for "shell" branches
from $50 million to $150 million equivalent in total assets, the threshold nowapplicable to all reporting branches.
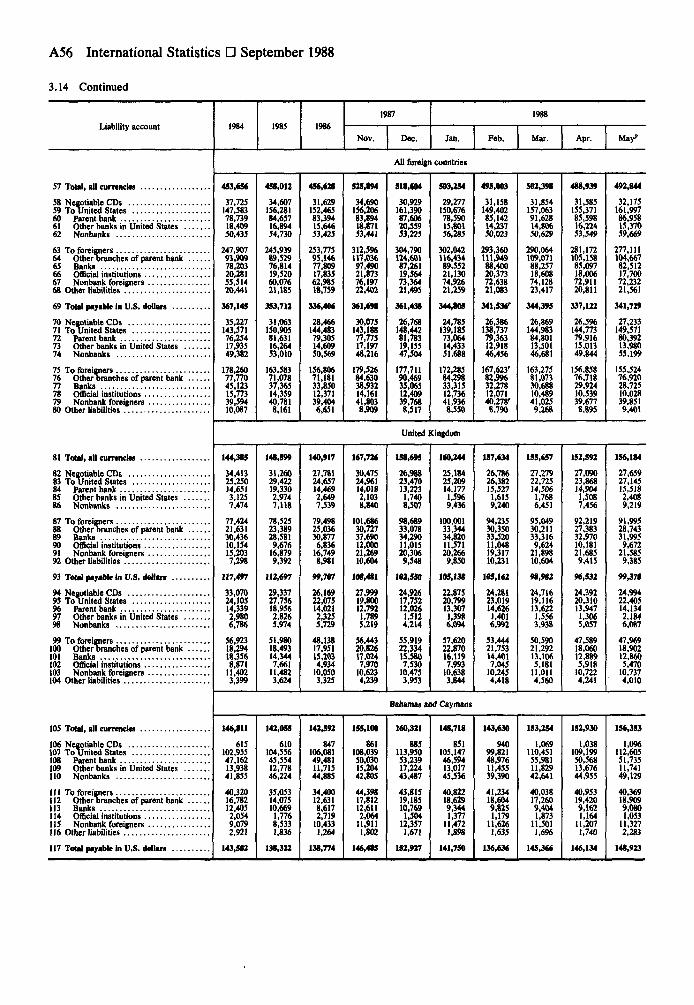
A56 International Statistics D September 1988
3.14 Continued
Liability account 1984 1985 19861987
Nov. Dec.
1988
Jan. Feb. Mar. Apr. M a /
All foreign countries
57 Total, all currencies
58 Negotiable CDs59 To United States60 Parent bank61 Other banks in United States62 Nonbanks
63 To foreigners64 Other Drenches of parent bank65 Banks66 Official institutions67 Nonbank foreigners68 Other liabilities
69 Total payable in U.S. dollars
TO Negotiable CDs71 To United States72 Parent bank73 Other banks in United States74 Nonbanks
75 To foreigners76 Other Drenches of parent bank77 Banks78 Official institutions79 Nonbank foreigners80 Other liabilities
81 Total, all currencies
82 Negotiable CDs83 To United States84 Parent bank85 Other banks in United States86 Nonbanks
87 To foreigners88 Other branches of parent bank89 Banks90 Official institutions91 Nonbank foreigners92 Other liabilities
93 Total payable In U.S. doflars . . .
94 Negotiable CDs95 To United States96 Parent bank97 Other banks in United States98 Nonbanks
99 To foreigners100 Other branches of parent bank101 Banks102 Official institutions103 Nonbank foreigners104 Other liabilities
105 Total, all currenda
106 Negotiable CDs107 To United States108 Parent bank109 Other banks in United States110 Nonbanks
111 To foreigners112 Other branches of parent bank113 Banks114 Official institutions115 Nonbank foreigners116 Other liabilities
117 Total payable In U.S. dollar, . . .
453,656
37,725147,58378,73918,40950,435
247,90793,90978,20320,28155,51420,441
367,145
35,227143,57176,25417,93549,382
178,26077,77045,12315,77339,59410,087
144,385
34,41325,25014,6513,1257,474
77,42421,63130,43610,15415,2037,298
117,4*7
33,07024,10514,3392,9806,786
56,92318,29418,3568,87111,4023,399
146,811
615102,95547,16213,93841,855
40,32016,78212,4052,0549,0792,921
143,581
451,012
34,607156,28184,65716,89454,730
245,93989,52976,81419,52060,07621,185
353,712
31,063150,90581,63116,26453,010
163,58371,07837,36514,35940,7818,161
456,<28
31,629152,46583,39415,64653,425
253,77595,14677,80917,83562,98518,759
336,406
28,466144,48379,30514,60950,569
156,80671,18133,85012,37139,4046,651
515,894
34,690156,20683,8941847153,441
312,596117,03697,49021,87376,19722,402
3*1,698
30,075143,18877,77517,19748,216
179,52684,63038,93214,16141,8038,909
518,(04
30,929161,39087,60620,55953,225
304,790124,60187,26119,56473,36421,495
361,438
26,768148,44281,78319,15547,504
177,71190,46935,06512,40939,7688,517
503,254
29,277150,67678,59015,80156,285
302,042116,43489,55221,13074,92621,259
344,805
24,785139,18573,06414,43351,688
172,28584,29833,31512,73641,9368,550
495,003
31,158149,40285,14214,23750,023
293,360111,94988,40020,37372,63821,083
341,536'
26,386138,73779,36312,91846,456
167,623'82,99632,27812,07140,278'8,790
502,398
31,854157,06391,62814,80650,629
290,064109,07188,25718,60874,12823,417
344,395
26,869144,98384,80113,50146,681
163,27581,07330,68810,48941,0259,268
488,939
31,585155,37185,59816,22453,549
281,172105,15885,09718,00672,91120,811
337,122
26,596144,77379,91615,01349,844
156,85876,71829,92410,53939,6778,895
United Kingdom
148,599
31,26029,42219,3302,9747,118
78,52523,38928,5819,676
16,8799,392
112,697
29,33727,75618,9562,8265,974
51,98018,49314,3447,661
11,4823,624
140,917
27,78124,65714,4692,6497,539
79,49825,03630,8776,836
16,7498,981
99,707
26,16922,07514,0212,3255,729
48,13817,95115,2034,934
10,0503,325
167,726
30,47524,96114,0182,1038,840
101,68630,72737,69012,00021,26910,604
MMU
27,99919,80012,7921,7895,219
56,44320,82617,0247,970
10,6234,239
158,695
26,98823,47013,2231,7408,507
98,68933,07834,29011,01520,3069.548
102,558
24,92617,75212,0261,5124,214
55,91922,33415,5807,53010,4753,953
160,244
25,18425,20914,1771,5969,436
100,00133,34434,82011,57120,2669,850
105,138
22,87520,79913,3071,3986,094
57,62022,87016,1197,993
10,6383,844
157,634
26,78626,38215,5271,6159,240
94,23530,35033,52011,04819,31710,231
105,162
24,28123,01914,6261,4016,992
53,44421,75314,4017,045
10,2454,418
155,657
27,27922,72514,5061,7686,451
95,04930,21133,3169,624
21,89810,604
n,m24,71619,11613,6221,5563,938
50,59021,29213,1065,181
11,0114,560
152,592
27,09023,86814,9041.5087,456
92,21927,38332,97010,18121,6859,415
96,532
24,39220,31013,9471,3065,057
47,58918,06012,8895,918
10,7224,241
Bahamas and Caymans
142,055
610104,55645,55412,77846,224
35,05314,07510,669
1,7768,5331,836
138,322
142,592
847106,08149,48111,71544,885
34,40012,6318,6172,719
10,4331,264
138,774
155,100
861108,03950,03015,20442,805
44,39817,81212,6112,064
11,9111.802
146,485
160,321
885113,95053,23917,22443,487
43,81519,18510,769
1,50412,3571,671
152,917
148,718
851105,14746,59413,01745,536
40,82218,6299,3441,377
11,4721,898
141,750
143,630
94099,82148,97611,45539,390
41,23418,6049,8251,179
11,6261,635
136,636
153,254
1,069110,45155,98111,82942,641
40,03817,2609,4041,873
11,5011.696
145,366
152,930
1,038109,19950,56813,67644,955
40,95319,4209,1621,164
11,2071,740
146,134
492,844
32,175161,99786,95815,37059,669
277,111104,66782,51217,70072,23221,561
341,729
27,233149,57180,39213,98055,199
155,52476,92028,72510,02839,8519,401
156,184
27,65927,14515,5182,4089,219
91,99528,74331,9959,672
21,5859,385
99,37*
24,99422,40514,1342,1846,087
47,96918,90212,8605,47010,7374,010
156,353
1,0%112,60551,73511,74149,129
40,36918,9099,0801,053
11,3272,283
148,923

Summary Statistics A57
3.15 SELECTED U.S. LIABILITIES TO FOREIGN OFFICIAL INSTITUTIONSMillions of dollars, end of period
Item 1985 1986
1987r
NOV. Dec,
1988'
Jan. Feb. Mar. Apr. May'
1 Total1
By type ,2 Liabilities reported by banks in the, United States 2 . .3 U.S. Treasury bills and certificates3
U.S. Treasury bonds and notes4 Marketable5 Nonmarketable4
6 V.S. securities other than U.S. Treasury securities9.
By area7 Western Europe1
8 Canada9 Latin America and Caribbean
10 Asia11 Africa ,12 Other countries6 . . . . . ,
178,380
26,73453,252
77,1543,550
17,690
74,4471,315
11,14886,448
1,8243,199
211,(34
27,92075,650
91,3681,300
15,596
88,6292,0048,417
105,8681,5035,412
2M,O8»
34,26882,542
120,762300
16,217
117,6284,8848,924
116,4261,5624,665
259,517
31,83388,829
122,432300
16,123
124,6204,9618,328
116,0601,4024,147
M6.9Z5
32,52890,635
127,550300
15,912
127,7536,1827,950
119,1391,4584,442
276,233
32,12193,407
134,719300
15,686
127,6146,8398,296
127,3041,4954,682
284,330
29,87995,624
142,865792
15,170
129,3767,9548,734
131,4231,5124,839
286,460
29,59694,974
145,940795
15,155
129,7048,3148.520
132,0161,4175,993
294,145
30,98896,604
150,870499
15,184
131,0449,0769,145
135,0801,4187,883
1. Includes the Bank for International Settlements.2. Principally demand deposits, time deposits, bankers acceptances, commer-
cial paper, negotiable time certificates of deposit, and borrowings under repur-chase agreements.
3. Includes nonmarketable certificates of indebtedness (including those payablein foreign currencies through 1974) and Treasury bills issued to official institutionsof foreign countries.
4. Excludes notes issued to foreign official nonreserve agencies. Includes
bonds and notes payable in foreign currencies.5. Debt securities of U.S. government corporations and federally sponsored
agencies, and U.S. corporate stocks and bonds.6. Includes countries in Oceania and Eastern Europe.NOTE. Based on Treasury Department data ana on data reported to the
Treasury Department by banks (including Federal Reserve Banks) and securitiesdealers in the United States.
3.16 LIABILITIES TO AND CLAIMS ON FOREIGNERS Reported by Banks in the United StatesPayable in Foreign Currencies1
Millions of dollars, end of period
Item 1984 1985 1986
1987'
June Sept. Dec.
1988
Mar.'
1 Banks' own liabilities2 Banks' own claims3 Deposits4 Other claims5 Claims of banks' domestic customers'
8,58611,9844,9986.986
569
15,36816,2948,4377,857
580
29.70226,18014,12912,0522,507
39,48734,20912,04322,166
923
46,80041,23914,53526,704
1,067
55,68850,48618,10932,377
551
55,87151,55617,70233,854
810
1. Data on claims exclude foreign currencies held by U.S. monetary author-ities.
2. Assets owned by customers of the reporting bank located in the United
StateB that represent claims on foreigners held by reporting banks for the accountsof the domestic customers.
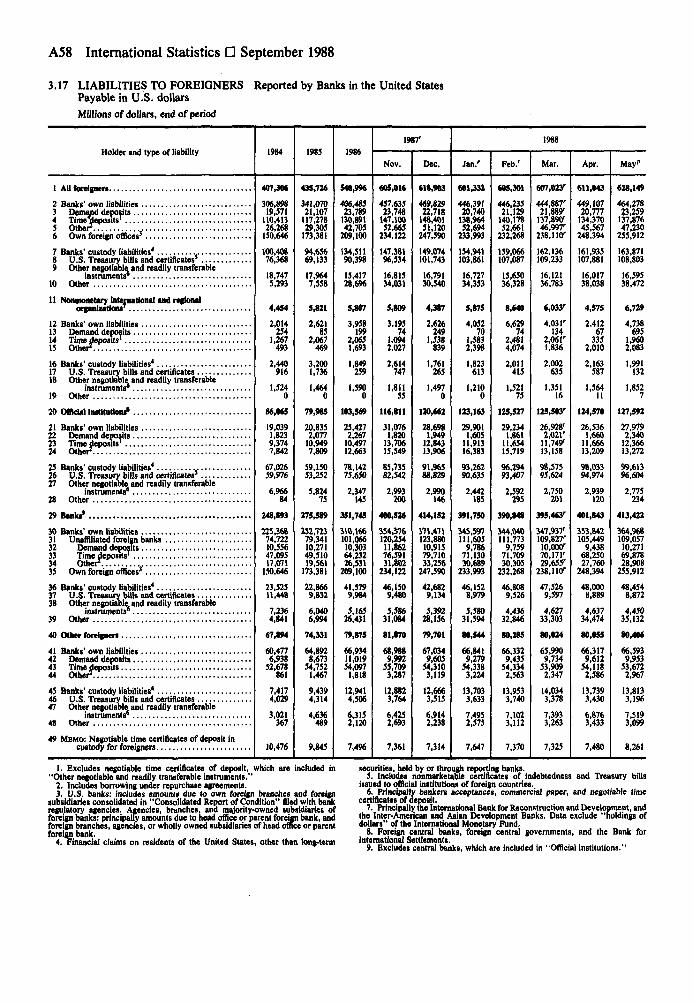
A58 International Statistics D September 1988
3.17 LIABILITIES TO FOREIGNERSPayable in U.S. dollars
Millions of dollars, end of period
Reported by Banks in the United States
Holder and type of liability 1984 1985 1986
1987'
Nov. Dec.
1988
Jan.' Feb.' Mar. Apr. May'
1 AU foreigners
2 Banks' own liabilities3 Demand deposits4 TiraeTJeposits'5 Other*.6 Own foreign offices9
7 Banks' custody liabilities4
8 U.S. Treasury bills and certificates'9 Other negotiable and readily transferable
instruments'10 Other
11 NuuiNMetary international and regional
12 Banks' own liabilities13 Demand deposits14 Time deposits'
16 Banks' custody liabilities4
17 U.S. Treasury bills and certificates18 Other negotiable and readily transferable
instruments'19 Other
20 Offidid Institutions*
21 Banks' own liabilities22 Demand deposits23 Time deposits1
24 Other1.
25 Banks' custody liabilities4
26 U.S. Treasury bills and certificates'27 Other negotiable and readily transferable
instruments'28 Other
29 Banks*
30 Banks' own liabilities31 Unafflliated foreign banks32 Demand deposits33 Time deposits'34 Other1.35 Own foreign offices3
36 Banks' custody liabilities4
37 U.S. Treasury bills and certificates38 Other negotiable and readily transferable
instruments'39 Other
40 Other foreigners
41 Banks' own liabilities42 Demand deposits43 Time deposits44 Other1.
45 Banks' custody liabilities'46 U.S. Treasury bills and certificates47 Other negotiable and readily transferable
instruments'48 Other
49 MEMO: Negotiable time certificates of deposit incustody for foreigners
407,306
306,89819,571110,41326,268150,646
100,40876,368
18,7475,293
4,454
2,014254
1,267493
2,440916
1,5240
86,065
19,0391,8239,3747,842
67,02659,976
6,96684
248,893
225,36874,72210,55647,09517,071
150,646
23,52511,448
7,2364,841
67,894
60,4776,93852,678
861
7,4174,029
3,021367
10,476
435,716
341,07021,107117,27829,305173,381
94,65669,133
17,9647,558
5,821
2,62185
2,067469
3,2001,736
1,4640
79,9(5
20,8352,07710,9497,809
59,15053.252
5,82475
275,589
252,72379,34110,27149,51019,561
173,381
22,8669,832
6,0406,994
74,331
64,8928,673
54,7521,467
9,4394,314
4,636489
9,845
540,996
406,48523,789130,89142,705209,100
134,51190,398
15,41728,696
5,8*7
3,958199
2,0651,693
1,849259
1,5900
103,569
25,4272,26710,49712,663
78,14275,650
2,347145
351,745
310,166101,06610,30364,23226,531209,100
41,5799,9(4
5,16526,431
79,875
66,93411,01954,0971,818
12,9414,506
6.3152,120
7,496
605,014
457,63523,748147,10052,665
234,122
147,38196,534
16,81534,031
5,809
3,19574
1,0942,027
2,614747
1,81155
116,811
31,0761,820
13,70615,549
85,73582,542
2,993200
400,526
354,376120,25411,86276,59131,802
234,122
46,1509,480
5,58631,084
81,870
68,9889,992
55,7093,287
12,8823,764
6,4252,693
7,361
6M.903
46»,82922,718
148,40151,120
247,590
149,074101,743
16,79130,540
4,3(7
2,626249
1,538839
1,761265
1,4970
120,662
28,6981,94912,84313,906
91,96588,829
2,990146
414,152
371,471123,88010,91579,71033,256
247,590
42.6829,134
5,39228,156
79,701
67,0349,60554,3103,119
12,6663,515
6,9142,238
7,314
601,332
446,39120,740138,96452,694233,993
154,941103,861
16,72734,333
5,(75
4,05270
1,5832,398
1,823613
1,2100
123,163
29,9011,60511,91316,383
93,26290,635
2,442185
391,750
345,597111,6059,786
71,13030,6(9
233,993
46,1528,979
5,58031,594
80,544
66,8419,279
54,3383,224
13,7033,633
7,4952,575
7,647
605,301
446,23521,129140,17852,661232,268
159,066107,087
15,65036,328
8,640
82,4814,0742,011415
1.52.
125,527
29,2341,861
11,65415,719
96,29493,407
2,592295
344,040111,7739,759
71,70930,305
232,268
46,8089,526
4,43632,846
80,285
66,3329,43554,3342,563
13,9533,740
7,1023,112
7,370
607,023'
444,887'21,889'137,890'46,997'238,110'
162,136109,233
16,12136,783
6,033'
4,031'134
2,061'1,836
2,002635
1,35116
125,503'
26,928'2,021'11,749'13,158
98,57595,624
2,750201
395,463'
347,937'109,827'10,000'70,171'29,655'
238,110'
47,5269,597
4,62733,303
(0,024
65,9909,73453,9092,347
14,0343,378
7,3933,263
7,325
611,043
449,10720,777134,37045,567248,394
161,935107,881
16,01738,038
4,575
2,41267
3352,010
2,163587
1,56411
124,570
26,5361,66011,66613,209
98,03394,974
2,939120
401,843
353,842105,4499,438
68,25027,760
248,394
48,000
4,63734,474
(0,055
66,3179,612
54,1182,586
13,7393,430
6,8763,433
7,480
628,149
464,27823,259137,87647,230255,912
163,871108,803
16,59538,472
6,729
4,738695
1,9602,083
1,991132
1,8527
127,592
27,9792,340
12,36613,272
99,61396,604
2,775234
413,422
364,968109,05710,27169,87828,908
255,912
48,4548,872
4,45035,132
80,406
66,5939,953
53,6722,967
13,8133,196
7,5193,099
8,261
1. Excludes negotiable time certificates of deposit, which are included in"Other negotiable and readily transferable instruments."
2. Includes borrowing under repurchase agreements.3. U.S. banks: includes amounts due to own foreign branches and foreign
subsidiaries consolidated in "Consolidated Report of Condition" filed with bankregulatory agencies. Agencies, branches, and majority-owned subsidiaries offoreign banks: principally amounts due to head office or parent foreign bank, andforeign branches, agencies, or wholly owned subsidiaries of head office or parentforeign bank.
4. Financial claims on residents of the United States, other than long-term
securities, held by or through reporting banks.5. Includes nonmarketable certificates of indebtedness and Treasury bills
issued to official institutions of foreign countries.6. Principally bankers acceptances, commercial paper, and negotiable time
certificates of deposit.7. Principally the International Bank for Reconstruction and Development, and
the Inter-American and Asian Development Banks. Data exclude "holdings ofdollars" of the International Monetary Fund.
8. Foreign central banks, foreign central governments, and the Bank forInternational Settlements.
9. Excludes central banks, which are included in "Official institutions."

Bank-Reported Data A59
3.17—Continued
Area and country 1984 1983 1986
1987
Nov. Dec.'
1988
Jan. Feb. Mar. Apr. May'
1 Total
2 Foreign countries
3 Europe4 Austria3 Belgium-Luxembourg6 Denmark7 Finland8 France9 Germany
10 Greece11 Italy12 Netherlands13 Norway14 Portugal13 Spain16 Sweden17 Switzerland18 Turke19 UniLl __..„20 Yugoslavia21 Other Western Europe1
22 U.S.S.R23 Other Eastern Europe2
24 Canada
23 Latin America and Caribbean26 Argentina27 Bahamas28 Bermuda29 Brazil30 British West Indies31 Chile32 Colombia33 Cuba34 Ecuador33 Guatemala36 Jamaica37 Mexico38 Netherlands Antilles39 Panama40 Peru41 Uruguay42 Venezuela43 Other
44 AsiaChina
43 Mainland46 Taiwan47 Hong Kong48 India49 Indonesia50 Israel51 Japan52 Korea53 Philippines54 Thailand , .55 Middle-East oil-exporting countries3.56 Other
57 Africa58 Egypt
60 S^hMtim'.'.'.'.'.'.'.','.'.'.'.'.'.'.'.'.'.'.'.'.'.61 Zaire62 Oil-exporting countries*63 Other
64 Other countries65 Australia66 AUother
67 Nonmonetary international and regionalorganizations
68 International1
69 Latin American regional70 Other regional6
407,306
401,852
153,145615
4,114438418
12,7013,358
69910,7624,7311,548
5972,0821,676
31,740584
68,671602
7,19279
537
16,059
153,3814,394
56,8972,3705,275
36,7732,0012,514
101,092
896183
12,3034,2206,9511,2661,394
10,5454,297
71,187
1,1534,9906,581
5071,0331,268
21,6401,7301,3831,257
16,80412,841
3,396647118328153
1,189961
5,6845,300
384
4,4543,747
587120
435,726
429,905
164,114693
5,243513496
15,5414,835
6669,6674,212
948652
2,1141,422
29,020429
76,728673
9,635105523
17,427
167,8566,032
57,6572,7655,373
42,6742,0493,104
111,2391,071
12214,0604,8757,5141,1671,552
11,9224,668
72,280
1,6077,7868,067
7121,4661,601
23,0771,6651,1401,358
14,5239,276
4,8831,363
163388163
1,4941,312
3,3472,779
568
5,8214,806
894121
540,996
535,189
180,5561,1816,729
482580
22,8625,762
70010,8755,600
735699
2,407884
30,534454
85,334630
3,32680
702
26,345
210,3184,757
73,6192,9224,325
72,2632,0544,285
1,2361,123
13613,7454,9706,8861,1631,537
10,1715,119
108,831
1,47618,9029,393
6741,5471,892
47,4101,1411,8661,119
12,35211,058
4,02170692
27074
1,5191,360
5,1184,196
922
5,8074,6201,033
154
605,016"
599,207'
228,947"1,254
10,959"632'461
27,523'8,549"
71510,0166,4901,074
8582,616"2,882
30,167433
115,023'484'
8,184
591'
28,681214,299'
5,275'70,947'
2,2314,139"
78,233"2,219"4,308'
91,088'1,033'
15014,453'5,228'7,514'1,208'1,5269,088'5,650"
118,843'
1,43521,574'10,541
7011,6771,220"
52,7351,6061,2591,483
13,37911,232
4,0651,169
7524682
1,107'1,386
4,3723,711
661
5,8093,7241,478
608
618,903
614,516
234,651920
9,347760377
29,9547,047
68912,0735,0141,362
8012,6211,379
33,765703
116,717710
9,79831
582
30,084
220,3635,006
74,5902,3354,003
81,6752,210
1,0821,082
16014,4804,9727,41412751,5809,0485,234
121,401
1,16221,50310,196
5821,3991,292
54,4181,6371,0831,345
13,99412,788
3,9451,151
19420267
1,0141,316
4,0703,327
744
4,3872,7541,272
362
601,332'
595,457"
225,552'992
9,433'551'401
28,1987,701'
63811,2595,2721,196
7252,3591,393
31,932'674
111,845'541
9,68337
721
28,691
212,097'4902'
69,205'2,187'3,937'
78,5032,1223,947
81,1151,098
15015,0244,9877,3291,2351,6709,1745,502
121,245'
1,33622,878'
9,579571
1,4741,270
55,2211,7091,0351,433
12,50312,237'
3,758'1,142
7121489
9811,261
4,1143,319
795
5,8754,3011,181
393
605,301'
596,660'
226,517'964
9,832659369
28,8688,872
63911,0015,302
828780
2,4331,719
32,006'541'
112,207557
8,34049
549
25,967
212,731'5,092'
64,9642,0213,747'
82,6252,3613,897
91,1331,098
14815,1865,2316,9831,3281,7539,7295,426
122,973'
1,35223,88410,010'
8791,5831,333
56,3461,5021,0091,334
12,40811,311'
3,756'1,119"
6919486
1,047ll241
4,7173,814
903
8,6406,6001,505
536
607,023"
600,990"
213,023'958'
8,804930405
28,4496,594'
65610,0765,399
917877
2,6181,836
31,815616
101,590"550
9,244'66
623
27,330"
222,136'5,101
70,266'2,214'4,074
88,344'2,3143,833
1,1691,182
20815,7835,207'4,3061,3641,7639,4115,591
129,265'
1,56224,00510,011
659"1,5471,400
60,3341,5931,0951,189
12,73513,135
4,0341,099
7538781
1,0621,330
5,2034,1541,048
6,033'4,330'1,305
397
611,043
218,4971,1779,6241,034
50427,040
6,857656
10,0405,1341,101
9172,4451,712
30,690518
109,447566
8,30644
686
27,030
225,7495,307
69,9202,4023,992
92,6312 2513,843
131,1741,209
20915,3473,3454,0391,4241,7439,5645,315
125,624
1,78923,9829,631
6751,0651,292
58,5671,5741,0151,181
12,64612,208
3,8781,218
6819582
1,0081,307
5,6894,885
804
4,5752,6911,528
356
628,149
621,420
228,0021,0909,8931,164
47828,219
6,247731
9,2855,7571,239
9102,8392,280
32,505628
115,439586
7,968136608
27,580
229,3775,219
74,0052,9274,762
90,3212^564,395
91,2061,191
15215,8665,3484,0061,4221,7159,2555,221
125,544
1,92123,87410,209
6191,0161,190
57,3892,057
9751,448
12,42012,426
4,0541,196
6526663
1,0441,419
6,8625,943
919
6,7294,7951,727
207
1. Includes the Bank for International Settlements and Eastern Europeancountries that are not listed in line 23.
2. Comprises Bulgaria, Czechoslovakia, the German Democratic Republic,Hungary, Poland, and Romania.
3. Comprises Bahrain, Iran, Iraq, Kuwait, Oman, Qatar, Saudi Arabia, andUnited Arab Emirates (Trucial Sutes).
4. Comprises Algeria, Gabon, Libya, and Nigeria.3. Excludes "holdings of dollars" of the International Monetary Fund.6. Asian, African, Middle Eastern, and European regional organizations,
except the Bank for International Settlements, which is included in "OtherWestern Europe."

A60 Interaational Statistics D September 1988
3.18 BANKS' OWN CLAIMS ON FOREIGNERS Reported by Banks in the United StatesPayable in U.S. Dollars
Millions of dollars, end of period
Area and country 1984 1983 19861987
Nov. Dec.
1988
Jan. Feb. Mar.' Apr. May"
1 Total
2 Foreign countries
3 Europe4 Austria5 Belgium-Luxembourg6 Denmark7 Finland8 France9 Germany
10 Greece11 Italy12 Netherlands13 Norway14 Portugal15 Spain16 Sweden17 Switzerland18 Turkey19 United Kingdom20 Yugoslavia ,21 Other Western Europe1
22 U.S.S.R ,23 Other Eastern Europe2
24 Canada
25 Latin America and Caribbean26 Argentina27 Bahamas28 Bermuda2» Brazil30 British West Indies31 Chile32 Colombia33 Cuba34 Ecuador .,.35 Guatemala3
36 Jamaica'37 Mexico38 Netherlands Antilles39 Panama40 Peru41 Uruguay42 Venezuela43 Other Latin America and Caribbean
44 AsiaChina
45 Mainland46 Taiwan47 Hong Kong48 India49 Indonesia50 Israel51 Japan52 Korea53 Philippines54 Thailand55 Middle East oil-exporting countries4
56 OtherAsia
57 Africa58 Egypt59 Morocco60 South Africa61 Zaire „62 Oil-exporting countries9
63 Other
64 Other countries65 Australia66 All other
67 Nonmonetary i:organization:
400,162
399,3*3
99,014433
4,794648898
9,1571,306
8179,1191,356
6751.2432,8842.2302,1231,130
56,1851,886
596142
1,389
16,109
207,86211,05058,009
59226,31538,2056,8393,499
02,420
158252
34,8851,3507,7072,3841,088
11,0172,091
66,316
7101,8497,293
425724
2,08829,0669,2852,5551,1255,0446,152
6,615728583
2,79518
8421,649
3,4472,769
678
800
401,608
400,377
106,413598
5,772706823
9,1241,267
9918,8481258
7061,0581,9082,2193,1711,200
62,5661,964
998130
1,107
16,482
202,67411,46258,238
49925,28338,8816,6033,249
02,390
194224
31,7991,3406,6451,947
96010,8712,067
66,212
6391,5356,797
430698
1,99131,2499,2262,224
8454,2986,260
5,407721575
1,94220
6301,520
3,3902,413
978
1,030
444,745
441,724
107,823728
7,498688987
11,3561,816
6489,0433,296
672739
1,4921,9643,3521,543
58,3351,835
539345948
21,006
208,82512,09159,342
41825,71646,2846,5582,821
02,439
140198
30,6981,0415,4361,661
94011,1081,936
96,126
7872,6818,307
321723
1,63459,6747,1822,217
5784,1227.901
4,650567598J8694
1,213
3,2941,9491,345
3,021
461,787'
454,617'
107,961'927
9,551881
1,03013,5121,557
4527,296'3,813
938545
2,0322,6402,8801,566
54,65?1,697
662437892
23,376'
213,144'12,070'61,561'
33126,011'50,289*6,4292,730
02,334
145184
30,1011,1134,6851,459
975
1,785'
100,267'
8704,7847,318'
502601
1,28^64,7674,9822.040
4395,1577,524
4,668526585
IS903
1,123
3,2012,0931,109
7,170
460,261'
456.85T
102,324'793
9,382'717'
1,01013,475'2,061'
461'7,4672,619
934477
1.8492,2692,689'1.681'
50,839'1,700
66C389852
25,284'
214,807'11.990'64,744'
474'25,879'49,944'6,305'2,74c
2,286144188
29,534'980
4,7391,323
96810,834'1,735'
106,472'
9684,5778,216'
510580
1,36369,113'5,094'2,069
8,633'
4,742521542
1.507
1,0031,153
3,2282,1891,039
3,404'
443,89T
441,191'
97,437'762
9,626'852876
11,680-2,195'
576-6,5082,902
842471
1,6282,1062i&2,i&1,637
48,753'1,694
578386795
23,457'
208,046'12,03760,879'
375'25,932'
2,7090
2,339134202
29,1391,0094,3041,316
96110,753'1,753
105,025'
8863,8777,593'
495566'
1,282'71,229'4,943'1,961
520-3,5678,106'
4,807513491
2,419'1428
991
2,700'
442,204'
439,980'
100,441'800
9,793'746835
12,268'1,927'
711'6,164'2,879
746'499
1,965'2,2743,0861,660
50,493'1,702
725380790
21,930'
203,500'11,977'57,415'
31125,905'47,34Or
6,2602,668
02,238
140191
29,2171,1463,8181,336
95510,872'1,710
106,870'
8873,8137,948'
348632
1,21173,215'4,7771,966
521'3,454'7,897'
4,865469490
1,46182
1,0861,276
2,375'1,430
945'
2,224
442,486
440,360
94,574846
8,254874729
12,2261,881
6966,4532,780
627425
1,7612,2292,2371,593
47,4301,658
747328802
21,155
209,10312,22658,264
1,47125,99352,5296,0992,652
02,239
149201
27,9741,1593,1081,277
92911,0051,831
108,148
1,0963,5548,473
363645
1,23872,7975,0112,074
5413,5388,616
4,881483487
1,45846
1,1421,265
2,4991,4811,019
2,126
431,300
430,338
448,506
447,450
93,432895
8,787614993
10,7911,790
5136,2112,868
650439
1,7652,3492,4521,733
47,1351,619
573377876
22,047
199,45012,29154,620
66926,11647,4486,1352,717
2,881141212
27,2201,3042,7491,283
91310,9441,805
108,326
1,1403,8076,336
342643
1,28475,2724,7691,958
5163,9238,136
4,865473493
1,43847
1,1371,276
2,2181,363
855
100,247867
8,726632
1,10612,0631,894
5586,5992,766
886400
1,9112,4803,0931,543
51,2461,586
593339961
23,670
202,39812,33358,129
1,23526,10447,5755,9983,082
r2,197
149177
26,6871,4342,5861,277
88010,8331,720
113,630
8413,8058,306
307631
1,25978,3305,0412,012
5963,5418,760
5,092503483
1,49642
1,2441,324
2,4131,4051,008
962 1,056
1. Includes the Bank for International SetUements. Beginning April 1978, alsoincludes Eastern European countries not listed in line 23.
2. Beginning April 1978 comprises Bulgaria, Czechoslovakia, the GermanDemocratic Republic, Hungary, Poland, and Romania.
3. Included In "Other Latin America and Caribbean" through March 1978.
4. Comprises Bahrein, Iran, Iraq, Kuwait, Oman, Qatar, Saudi Arabia, andUnited Arab Emirates (Trucial States).
5. Comprises Algeria, Gabon, Libya, and Nigeria.6. Excludes the Bank for International Settlements, which is included in
"Other Western Europe."

Bank-Reported Data A61
3.19 BANKS' OWN AND DOMESTIC CUSTOMERS1 CLAIMS ON FOREIGNERS Reported by Banks in theUnited States'Payable in U.S. Dollars
Millions of dollars, end of period
Type of claim
1 Total
2 Banks' own claims on foreigners3 Foreign public borrowers4 Own foreign offices5 UnafHliated foreign banks6 Deposits7 Other . . .8 All other foreigners
9 Claims of banks' domestic customers3 . . .10 Deposits11 Negotiable and readily transferable
instruments
12 Outstanding collections and other
13 MEMO: Customer liability onacceptances
Dollar deposits in banks abroad,reported by nonbanking businessenterprises in the United States3
1984
433,078
400,16262,237
156,216124.93249,22675,70656,777
32,9163,380
23,805
5,732
37,103
40,714
1985
430,489
401,60860,507
174,261116,65448,37268,28250,185
28,8813,335
19,332
6,214
28,487
38,102
1986
478,650
444,74564,095
211,533122,94657,48465,46246,171
33,9054,413
24,044
5,448
25,706
41,396
198T
Nov.
461,78769,931
221,146127,34359,00768,33643,367
38,005
Dec.
497,977
460,26164,660
224,934127,71360,61867,09542,955
37,7163,650
26,696
7,370
23,828
38,090
1988'
Jan.
443,89063,766
217,579120,46755,43765,03042,079
34,258
Feb.
442,20462,687
218,758118,91855,80163,11741,842
39,504
Mar.
480.47S
442,48661,822
220,882118,28255,92762,35541,500
37,9895,011
24,499
8,479
18,769
37,561
Apr.
431,30060,717
210,880117,18455,80661,37842,519
43,115
May'
448,50661,238
223,962122,04855,96166,08741,258
n.a.
1. Data for banks' own claims are given on a monthly basis, but the data forclaims of banks' own domestic customers are available on a quarterly basis only.
2. U.S. banks: includes amounts due from own foreign branches and foreignsubsidiaries consolidated in "Consolidated Report of Condition" filed with bankregulatory agencies. Agencies, branches, and majority-owned subsidiaries offoreign banks: principally amounts due from head office or parent foreign bank,and foreign branches, agencies, or wholly owned subsidiaries of head office orparent foreign bank.
3. Assets owned by customers of the reporting bank located in the UnitedStates that represent claims on foreigners held by reporting banks for the accountof their domestic customers.
4. Principally negotiable time certificates of deposit and bankers acceptances.5. Includes demand and time deposits and negotiable and nonnegotiable
certificates of deposit denominated in U.S. dollars issued by banks abroad. Fordescription of changes in data reported by nonbanks, see July 1979 BULLETIN,p. 550.
3.20 BANKS' OWN CLAIMS ON UNAFFILIATED FOREIGNERS Reported by Banks in the United StatesPayable in U.S. Dollars
Millions of dollars, end of period
Maturity; by borrower and area 1984 1985 1986
1987'
June Sept. Dec.
1988
Mar.
1 Total
By borrower2 Maturity of 1 year or less1
3 Foreign public borrowers —4 All other foreigners5 Maturity over 1 year1
6 Foreign public borrowers —7 All other foreigners
By areaMaturity of 1 year or less'
8 Europe9 Canada
10 Latin America and Caribbean11 Asia12 Africa . . .13 AU other2 ,
Maturity of over I year1
14 Europe15 Canada16 Latin America and Caribbean17 Asia18 Afr ica . . .19 AU other2
243,952
167,85823,912
143,94776,09438,69537,399
58,4986,028
62,79133,5044,4422,593
9,6051,882
56,1445,3232,0331,107
227,903
160,82426,302
134,52267,07834,51232,567
56,5856,401
63,32827,9663,7532,791
7,6341,805
50,6744,5021,538
926
232,295
160,55524,842
135,71471,74039,10332,637
61,7845,895
56,27129,4572,8824,267
6,7371,925
56,7194,0431,539
777
237,608
168,23823,702
144,53769,37039,37229,997
69,1385,773
55,69131,1842,9893,463
6,4791,664
55,6093,4951,512
611
237,521
167,18726,914
140,27370,33439,47630,858
62,9415,890
58,38732,1612,8714,937
6,7531,579
55,0893,4971,6221,794
235,447
164,39625,986138,41071,05138,62632,425
59,1235,71256,41036,4362,8243,891
6,8312,661
53,7883,6491,7462,375
219,285
152,62724,273128,35466,65835,58131,076
51,5234,93855,68135,8222,6002,062
5,9712,242
51,5143,7132,1581,060
1. Remaining time to maturity. 2. Includes nonmonetary international and regional organizations.

A62 International Statistics • September 1988
3.21 CLAIMS ON FOREIGN COUNTRIES Held by U.S. Offices and Foreign Branches of U.S.-Chartered Banks12
Billions of dollars, end of period
Area or country
1 Total
4 France
6 Italy.7 Netherlands
9 Switzerland10 United Kingdom11 Canada12 Japan
14 Austria
16 Finland17 Greece
19 Portugal20 Spain21 Turkey22 Other Western Europe23 South Africa24 Australia
25 OPEC countries3
28 Indonesia
Latin America32 Argentina33 Brazil34 Chile35 Colombia36 Mexico37 Peru38 Other Latin America
AsiaChina
39 Mainland ,40 Taiwan41 India42 Israel43 Korea (South)44 Malaysia
46 Thailand .. .47 Other Asia
Africa
49 Iviforocco50 Zaire.51 Other Africa4
53 U.S.S.R54 Yugoslavia55 Other
57 Bahamas58 Bermuda
60 Netherlands Antilles . •. .61 Panama
65 Others*
1984
405.7
148.18.7
14.19.0
10.13.93.23.9
60.37.9
27.1
33.61.62.21.92.93.01.46.51.91.74.56.0
24.92.29.33.37.92.3
111.8
8.726.37.02.9
25.72.23.9
.75.1.9
1.810.62.76.01.81.1
1.2.8.1
4.4.1
2.32.0
65.621.5
.911.83.46.7
.111.49.8
.0
17.3
1985
385.3
146.09.2
12.110.59.63.72.74.4
63.06.8
23.9
29.91.52.31.62.62.91.25.81.82.03.25.0
21.32.18.93.05.32.0
104.2
8.825.46.92.6
23.91.83.4
54,51.21.69,22.45,7141.0
1.0.91
1.9
4.1
2.21.8
62.921.2
.711.62.26.0
1L49.8
.0
16.9
1986
Mar.
3(5.6
152.88.2
13.611.28.33.52.85.3
67.46.0
26.5
31.11.52.51.92.52.71.06.42.12.43.14.9
20.42.28.73.34.51.8
102.9
8.825.67.02.3
23.91.73.3
64.31.21.39.22.25.6
.9
.9
.91
1.9
4.0
2.01.7
57.521.2
.79.22.24.3
.111.48.4
.0
16.8
June
389.7
160.39.0
15.111.59.33.42.95.6
69.27.0
27.2
30.71.72.41.62.63.01.16.42.5
3.14.2
20.62.18.83.05.01.7
102.0
9.225.57.12.2
24.01.63.3
63.7
1.68.72.05.71 1.8
.9
.9t
1.7
4.0
2.01.7
55.417.1
.412.22.44.2
sis9.3
.0
16.8
Sept.
3S9.5
159.08.5
14.712.58.13.92.74.8
70.36.2
27.4
29.51.72.31.72.32.71.06.72.11.63.14.1
20.02.28.72.84.61.7
100.0
9.325,47.22.0
24.01.53.3
.64.31.31.47.32.15.41.0.7
.7
.9,1
1.6
3.4.1
1.91.4
60.519.9
.412.81.95.1
10.59.7
.0
17.2
Dec.
389.6
158.08.4
13.811.79.04.62.45.8
71.95.4
25.0
26.21.71.71.42.32.4.8
5.82.01.43.13.5
19.62.28.62.54.51.7
99.7
9.525.37.12.1
24.01.53.1
44.91.21.56.72.15.4
9.7
.7
.91
1.6
3.2
1.71.4
63.222.3
.713.61.84.1
11.29.4
.0
19.8
1987
Mar.
394.8'
162.7'9.1'
13.312.78.64.43.05.8
73.6'5.3'
26.9
25.71.91.71.42.12.2
.86.31.71.43.03.2
20.C
8.5'2.45.41.6
99.8'
9.526.C7.22.0
23.91.43.0
95.51.71.46.21.95.4
9.6
.6
.91
.9
3.01
1.61.3
63.5'24.0
.811.4'1.75.4
.111.48.6
.0
20.1'
June
384.8'
m.v8.312.5
11.27.57.32.45.7
71.9'4.8'
26.3
25.21.81.51.42.02.1.8
6.11.71.53.03.1
18.8'2.18.4'2.24.41.7
100.1'
9.525.C7.21.9
25.31.31.9
66.61.71.35.61.75.4
8.7
.6
.91
1.1
3.33
1.71.3
61.2'20.3'
.613.0'1.35.2
.112.58.2'
.0
18.1'
Sept.
386.r
155.6'8.2
13.710.56.64.82.65.4
72.1'4.7'
27.0
25.91.91.61.41.92.0
.87.41.51.62.92.9
w.y2.08.2'2.04.91.7
97.2'
9.325.1'7.01.9
24.71.22.8
35.91.91.34.91.65.4
7.7
.6
.81
1.0
3.35
1.71.2
63.8'25.7'
.611.3'1.24.5
.112.38.1
.0
21.9'
Dec.
382.8'
161.3'10.113.812.67.34.12.15.6'
70.1'5.6
30.1
26.21.91.71.32.02.3
.58.01.61.5'2.92.5
17.1'1.98.<r1.93.61.7
97.4'
9.424.7'6.92.0
23.61.12.7'
38.21.91.05.0*1.55.1
7.7'
.5
.90
1.1
3.04
1.61.1
54.5'17.3
.612.4'1.24.5
\l'.¥7.0
.0
23.2'
1988
Mar.
371.0'
157.3'9.4
11.511.87.43.32.1
71.4'
30.3
26.1'1.61.41.02.32.0
.49.01.61.92.82.0
17.1'1.98.C1.93.71.7
94.4'
9.5'23.9'6.6'1.9
22.5'
2.8
,46.62.11.15.31.55.11.0.7
.5
.9
.11.0
2.9.3
1.7l.C
51.6'15.9
1.810.6'1.33.2
.111.37.4
.0
21.6'
1. The banking offices covered by these data are the U.S. offices and foreignbranches of U.S.-owned banks and of U.S. subsidiaries of foreign-owned banks.Offices not covered include (I) U.S. agencies and branches of foreign banks, and(2) foreign subsidiaries of U.S. banks. To minimize duplication, the data areadjusted to exclude the claims on foreign branches held by a U.S. office or anotherforeign branch of the same banking institution. The data in this table combineforeign branch claims in table 3.14 (the sum of lines 7 through 10) with the claimsof U.S. offices in table 3.18 (excluding those held by agencies and branches offoreign banks and those constituting claims on own foreign branches).
2. Beginning with June 1984 data, reported claims held by foreign brancheshave been reduced by an increase in the reporting threshold for "shell" branches
from $50 million to $150 million equivalent in total assets, the threshold nowapplicable to all reporting branches.
3. This group comprises the Organization of Petroleum Exporting Countriesshown individually, other members of OPEC (Algeria, Gabon, Iran, Iraq, Kuwait,Libya, Nigeria, Qatar, Saudi Arabia, and United Arab Emirates), and Bahrain andOman (not formally members of OPEC).
4. Excludes Liberia.5. Includes Canal Zone beginning December 1979.6. Foreign branch claims only.7. Includes New Zealand, Liberia, and international and regional organiza-
tions.
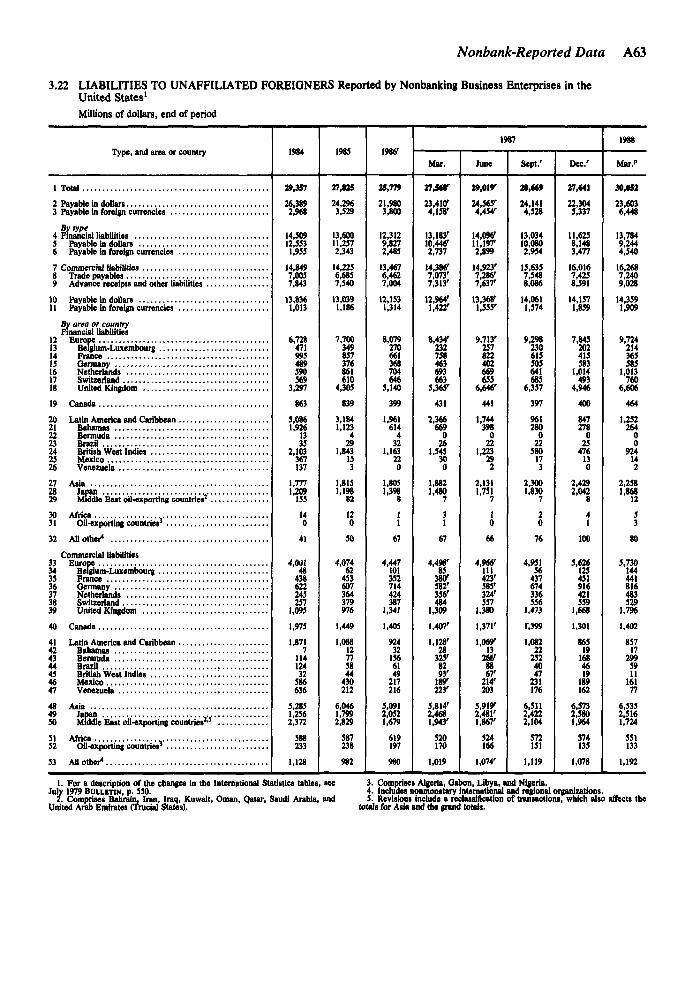
Nonbank-Reported Data A63
3.22 LIABILITIES TO UNAFFILIATED FOREIGNERS Reported by Nonbanking Business Enterprises in theUnited States1
Millions of dollars, end of period
Type, and area or country 1984 1985
19871986'
Mar. June Sept/ Dec.'
1988
Mar."
1 Total
2 Payable in dollars3 Payable in foreign currencies
4 Financial liabilities5 Payable in dollars6 Payable in foreign currencies
7 Commercial liabilities8 Trade payables9 Advance receipts and other liabilities . .
10 Payable in dollars11 Payable in foreign currencies
By area or countryFinancial liabilities
12 Europe13 Belgium-Luxembourg14 France15 Germany16 Netherlands17 Switzerland18 United Kingdom
19 Canada
20 Latin America and Caribbean21 Bahamas22 Bermuda23 Brazil24 British West Indies25 Mexico26 Venezuela
27 Asia28 Japan29 Middle Bast oil-exporting countries' .
30 Africa s
31 Oil-exporting countries3
32 Allother4
Commercial liabilities33 Europe34 Belgium-Luxembourg35 France36 Germany37 Netherlands38 Switzerland39 United Kingdom40 Canada
41 Latin America and Caribbean42 Bahamas43 Bermuda44 Brazil45 British West Indies46 Mexico47 Venezuela
48 Asia
50 Middle East oil-exporting countries2''
51 Africa ,,52 Oil-exporting countries3
53 All other4
19,357
26,3892,968
14,50912,5531,955
14,8497,0057,843
13,8361,013
6,728471995489590569
3,297
863
5,0861,926
1335
2,103367137
1,7771,209155
140
41
4,00148438622245257
1,095
1,975
1,8717
11412432
586636
5,2851,2562,372
233
1,128
27,825
24,2963,529
13,60011,2572,343
14,2256,6857,540
13,0391,186
7,700349857376861610
4,305
839
3,1841,123
291,843
153
1,8151,198
82
120
50
1,449
1,08812775844430212
6,0461,7992,829
587238
982
25,779
21,9803,800
12,3129,8272,485
13,4676,4627,004
12,1531,314
8,079270661368704646
5,140
399
1,961614432
1,163220
1,8051,398
67
4,07462453607364379976
4,447101352714424387
1,341
1,405
924321566149217216
5,0912,0521,679
619197980
27,3«r
23,410'4,158'
13,183'10,446'2,737
14,386'7,073'7,313'
12,964'1,422'
8,434'232758463693663
5,365'
431
2,366669026
1,545300
1,8821,480
31
67
If9356^484
1,3091,407'
'•'if325r8293'189'223'
5,814'2,4681,943'
520170
1,019
29,019'
24,565'4,454'
14,096'11,197'2,899
14,923'7,286'7,637'
13,368'1,555'
9,713'257822402669655
6,646'
441
1,744398022
1,223292
2,1311J51
7
0
66
4,966'111423'585'324'557
1,380
1,371'
1,069'
2&8867'
214'203
smv2,481'l!867'524166
1,074'
2S,<69
24,1414,528
13,03410,0802,954
15,6357,548
14,0611,574
9,298230615505641685
6,357
397
96128002258017
2.3001,830
7
0
76
r,399
1,082222524047231176
6,5112,4222,104
372151
1,119
27,«41
22,3045,337
11,6258,1483,477
16,0167,4258,591
14,1571,859
7,845202415583
1,014493
4,946
400
847278025476130
2,4292,042
100
4,95156437674336556
1,473
5,626125431916421559
1,668
1,301
865191684619189162
6,5732,5801,964
574135
1,078
30,052
23,6036,448
13,7849,2444,540
16,2687,2409,028
14,3591,909
9,724214365585
1,013760
6,606
464
1,25226400
92414
2,258>.Ǥ
53
80
5,730144441816483529
1,796
1,402
85717
299591116177
6,5352,5161,724
551133
1,192
1. For a description of the changes in the International Statistics tables, seeJuly 1979 BULLETIN, p. 550.
2. Comprises Bahrain, Iran, Iraq, Kuwait, Oman, Qatar, Saudi Arabia, andUnited Arab Emirates (Trucial States).
3. Comprises Algeria, Gabon, Libya, and Nigeria.4. Includes nonmonetary international and regional organizations.5. Revisions include a reclassiflcation of transactions, which also affects the
totals for Asia and the grand totals.

A64 International Statistics D September 1988
3.23 CLAIMS ON UN AFFILIATED FOREIGNERSUnited States'
Millions of dollars, end of period
Reported by Nonbanking Business Enterprises in the
Type, and area or country
1 Total
2 Payable in dollars3 Payable in foreign currencies
By type
5 Deposits
7 Payable in foreign currencies8 Other financial claims . . . .9 Payable in dollars
10 Payable in foreign currencies
11 Commercial claims12 Trade receivables
14 Payable in dollars15 Payable in foreign currencies
By area or countryFinancial claims
17 Belgium-Luxembourg18 France19 Germany .20 Netherlands21 Switzerland .22 United Kingdom
23 Canada
24 Latin America and Caribbean
26 Bermuda27 Brazil28 British West Indies29 Mexico30 Venezuela
31 Asia
34 Africa
36 All other*
Commercial claims37 Europe38 Belgium-Luxembourg39 France . . . . .40 Germany41 Netherlands42 Switzerland43 United Kingdom
44 Canada
46 Bahamas
48 Brazil49 British West Indies50 Mexico51 Venezuela ,
52 Asia53 Japan54 Middle East oil-exporting countries2
55 Africa56 Oil-exporting countries
57 All other4
1984
29,901
27,3042,597
19,25414,62114,202
4204,6333,1901,442
10,6469,1771,470
9,912735
5,76215
1262246666
4,864
3,988
8,2163,306
6100
4,043215125
961353
13
21085
117
3,801165440374335271
1,063
1,021
2,0528
115214
7583206
3,0731,191
668
470134
229
1985
28,876
26,5742,302
18,89115,52614,911
6153,3642,3301,035
9,9868,6961,290
9,333652
6,92910
18422316174
6,007
3,260
7,8462,698' 6
784,571
18048
731475
10329
21
3,533175426346284284S98
1,023
1,7531393
2066
510157
2,9821,016
638
437130
257
1986
33,3»»r
31,031'2,367
23,42417,28316,726
5576,1414,7921,349
9,975'8,783'1,192
9,513'462'
8,82741
138111151185
7,957
3,965
9,2092,628
673
6,07817421
1,316999
8528
22
3,708'133414'444'164'217999'
934'
1,857'28
193'234'
39'412'237'
2,755'881563'
soy139'
222
1987'
Mar.
34,094
31,4462,649
24,23516,95516,112
8427,2805,9371,343
9,8598,8031,056
9,397463
9,42115
18116313277
8,500
3,828
9,5743,968
715,157
16420
1,188931
8419
140
3,690145419447154196
1,072
977
1,81811
18021625
451173
2,703927525
432141
240
June
31,628
28,6862,941
21,73614,68713,4821,2057,0485,7731,275
9,8928,8491,043
9,431461
9,9756
16992
14098
9,271
3,344
7,5542,589
6103
4,42516720
789452
6
589
16
3,845137439526172187
1,074
1,046
1,72814
169202
12346203
2,642952455
378123
255
Sept.
31,405
28,8802,525
21,06815,7%14,919
8775,2714,1511,120
10,3389,385
953
9,810528
9,47526
17199
15744
8,783
2,895
7,5023,328
2102
3,68717318
1,105737
10
7114
20
4,115169416545190206
1,227
1,049
1,70912
14323020
368192
2,7961,026
434
407124
262
Dec.
30,055
26,9653,089
19,57113,67312,2461,4265,8994,7901,109
10,4839,4761,007
9,929554
9,0666
35969
28276
8,040
2,796
6,7571,865
534,378
17219
830550
10
65
58
4,116177593555132185
1,086
927
1,90719
15922625
363297
2,8921,150
450
400144
240
1988
Mar."
30,351
28,3761,975
19,60912,25111,700
5517,3586,3061,051
10,7439,6941,049
10,370373
9,47115
32780
33453
8,416
2,840
6,3832,260
4386
3,46115335
841672
8
53
21
4,132193484598149173
1,086
1,159
1,94014
152215
16372319
2,8671,105
402
418154
227
1. For a description of the changes in the International Statistics tables, seeJuly 1979 BULLETIN, p. 550.
2. Comprises Bahrain, Iran, Iraq, Kuwait, Oman, Qatar, Saudi Arabia, andUnited Arab Emirates (Trucial States).
3. Comprises Algeria, Gabon, Libya, and Nigeria.4. Includes nonmonetary international and regional organizations.

Securities Holdings and Transactions A65
3.24 FOREIGN TRANSACTIONS IN SECURITIES
Millions of dollars
Transactions, and area or country 1986 1987r
1988
Jan.-May
1987
Nov. Dec. Jan.
1988
Feb. Mar. Apr. May'
U.S. corporate securities
STOCKS
1 Foreign purchases
2 Foreign sales
3 Net purchase., or sales ( - ) . .
4 Far*t(n countries
5 Europe6 France7 Germany8 Netherlands9 Switzerland
10 United Kingdom11 Canada12 Latin America and Caribbean13 Middle East"14 Other Asia15 Africa16 Other countries17 NoHinomtarv international and
region*! organization
BONDS 2
18 Foreign purchases
19 Foreign sales
20 Net purchases, or sales ( - )
21 Foreign countries
22 Europe23 France24 Germany23 Netherlands26 Switzerland27 United Kingdom28 Canada29 Latin America and Caribbean .30 Middle East'31 Other Asia32 Africa33 Other countries34 Nonmonetery international and
35 Stocks, net purchases, or sales ( - )36 Foreign purchases37 Foreign sales
38 Bonds, net purchases, or sales ( - )39 Foreign purchases40 Foreign sales
41 Net purchases, or sales ( - ) , of stocks and bonds
42 Foreign countries
43 Europe44 Canada45 Latin America and Caribbean46 Asia47 Africa48 Other countries
49 NonmoneMry International andregional organizations
148,114129,395
18,719
18,927
9,559459341936
1,5604,826816
3,031976
3,876297373
-208
123,16972,520
50,M8
49,101
39,313389
-251387
4,52933,900
5481,476
-2,96111,270
16139
(47
249,113232,849
16,264
16,313
1,928905-74892
-1,123630
1,0481,314
-1,36012,896
123365
-48
105,856.78,312
27,544
26,804
21,98919433269
1,58719,7701,2962,473-5481,638
16-61
740
76,00877,633
-1,625
-1,516
-2,233-308128
-440-674
-1,336-172358
-8601,276
3679
-109
32,80424,934
7,850
8,561
4,905110789253125
3,478282715
-1462,823-18
-712
13,62620,325
-6,699
-6,651
-5,948-541-183-169
-1,534'-3,356'
169-561-83-2811
-211
-48
5,7165,387'
32T
71'
408'-34-26-16-39
68-15-92-254-10-33
257
13,62716,630
-3,004
-2,943
-2,329-393-149
34'-743-959
HI-50-448-160-6-61
-61
6,807'5,432'
W7S'
97r
576'-1387'
-208'713'114292-16'-7'30
400
12,923'12,891
32'
64'
-222'-9667-72-110'-136147
-143104159'712
-32
5,0245,193
-169
458
2725161
-13-5633329
-22-1643470
-4
-627
16,344'16,720
-37«>-
-344'
-323'-29-3759
-252'-130-167261
-25170
-1885
-33
6,4536,039
414
532
26313118-16049
-29316-7688-22-8
-119
18,068'18,482'
-414'
-444'
-360'-7171
-223-32-331'-61'98'
-788'577584
31
7,799'5,594'
2,2O6r
2,201r
1,462'5726030
-14976'872451442703
-11'
5
15,02013,704
1,315
1,298
481— J104
-145-174292412282437219
-67
17
5,6184,433
1,185
1,186
6587
34758-15228104100-6137745
-1
-1,85349,14951,002
-3,685166,992170,677
-5,538
-6,493
-18,026-8763,476
10,85852
-1,977
Foreign securities
1,14995,26394,114
-7,830199,010206,840
-6,682
-6,713
-12,083-4,065
8289,338
89-820
31
37929,18028,801
-4,23774,90479,141
-3,858
-4,295
-3,365-2,299
1,059
73244
437
706'7,595'6,889
-1,92917,75319,682
-1,582-498
329424'
201
-101
840'4,8974,057'
-1,490'12,322'13,812
-650 '
-336 '
-493'107
15910
-121
-314
511'4,9894,478'
-1,326'12,81214,137'
-879 '
-326 '-654
126-197
9163
65
-6785,7176,3%'
-1,43315,85817,291
-2,111
-2,131
-1,627'-648
- 6 437
169
-724 '6,6937,417'
-1,17916,561
17,740
-1,903'
-1,944'
-1,541-366
138-154 '
48- 7 0
3725,7975,425
-13715,59315,730
235
179
483-406
538-407
14- 4 3
56
13,65415.836
-2,182
-2,089
-1,810-175-177
- 5 9-263
-1,168-332- 8 6
519923
- 3 5
-92
7,9093,695
4,215
4,184
2,249- 1 8
2180151
1.892927710
1,741
17
31
5,9835,085
-16214,08114,243
736
480
-354-225
322712
25
256
1. Comprises oil-exporting countries as follows: Bahrain, Iran, Iraq, Kuwait,Oman, Qatar, Saudi Arabia, and United Arab Emirates (Tniciai States).
2. Includes state and local government securities, and securities of U.S.government agencies and corporations. Also includes issues of new debt securi-
ties sold abroad by U.S. corporations organized to finance direct investmentsabroad.

A66 International Statistics D September 1988
3.25 MARKETABLE U.S. TREASURY BONDS AND NOTES Foreign Transactions
Millions of dollars
Country or area 1986 1987'
1988
Jan.-May
1987
Nov. Dec.'
1988
Jan. Feb. Mar. Apr. May'
1 Estimated total2
2 Foreign countries2
3 Europe2
4 Belgium-Luxembourg5 Germany2
6 Netherlands7 Sweden8 Switzerland2
9 United Kingdom10 Other Western Europe11 Eastern Europe12 Canada
13 Latin America and Caribbean14 Venezuela13 Other Latin America and Caribbean16 Netherlands Antilles17 Asia18 Japan19 Africa20 All other
21 Nonmonetary international and regional organizations22 International23 Latin American regional
Memo24 Foreign countries2
23 Official institutions26 Other foreign3
Oil-27 Middle. East-28 Africa7
19,388
20,491
16,326-2437,6701,283
132329
4,3462,613
0
926- 9 6
1,130-1081,343-22- 5 4
1,067
-1,104-1,430
157
20,49114,2146,283
-1,5295
Transactions, net purchases or sales ( - ) during period1
25,587
30,889
23,716633
13,330-913
2101,9173,9754,563
- 1 94,526
-2,192150
-1,142-1,200
4,488868- 5 6407
-5,300-4,387
3
30,88931,064
-181
-3,14216
39,050
39,136
18,0001,3346,901
469-269-3934,8175,078
422,812
1,09034
713343
16,71915,590
- 2 2537
- 8 4-114
39,13628,43810,697
-973I
7,676
6,340
1,820314182
-2973,1631,158
3679
47235
36769
1,4761,757- 2 9
-1,260
-1,296-1,492
0
7,6761,8545,822
-1
2,507
4,121
1,387-1031,157- 7 8
28-5301,220-307
711
-1881
120-3092,210
- 4 8
-1,614-1,620
0
4,1211,6702,451
338
4,645
5,740
4,321469
3,045-337-61118
-1011,179
9356
2190
18436
7722,979
- 3 8110
-1,095-1,023
5,7405,118
622
-8090
12,083
12,832
5,878242
1,39733426
-1,1884,373
67816
359
630
320311
5,9214,996
25-182
-748-879
- 2
12,8327,1695,663
-296
9,98c
9,017'
3,471454919378
-245643
-2441,570
- 3372
198'20
16910
5,463'4330
-492'
963'968'
9,017'8,146'
871'
5780
3,433
3,728
2,33247
1,576117
- 9 334497
238
5140
8,909
7,819
1,997143
-37-22104
-309692
1,41314
1,391
751597-367136870
475
-295-334
0
3,7283,075653
-330
-5623
3,8512,599-13626
1,0911,155
7
7,8194,9302,888
-9590
1. Estimated official and private transactions in marketable U.S. Treasurysecurities with an original maturity of more than 1 year. Data are based onmonthly transactions reports. Excludes nonmarketable U.S. Treasury bonds andnotes held by official institutions of foreign countries.
2. Includes U.S. Treasury notes publicly issued to private foreign residentsdenominated in foreign currencies.
3. Comprises Bahrain, Iran, Iraq, Kuwait, Oman, Qatar, Saudi Arabia, andUnited Arab Emirates (Trucial States).
4. Comprises Algeria, Gabon, Libya, and Nigeria.

Interest and Exchange Rates A67
3.26 DISCOUNT RATES OF FOREIGN CENTRAL BANKS
Percent per year
Country
Rate on July 31, 1988
Percent Montheffective
Country
Rate on July 31, 1988
Percent Montheffective
Country
Rate on July 31, 1988
Percent Montheffective
Austria..Belgium .Brazi l . . .Canada..Denmark
3.56.75
49.09.537.0
July 1988July 1988Mar. 1981July 1988Oct. 1983
France1
Germany, Fed. Rep. ofItalyJapanNetherlands
6.753.012.02.53.75
July 1988July 1988Aug. 1987Feb. 1987July 1988
NorwaySwitzerlandUnited Kingdom2
Venezuela
8.02.5
June 1983Dec. 1987
8.0 Oct. 1985
1. As of the end of February 1981, the rate is that at which the Bank of Francediscounts Treasury bills for 7 to 10 days.
2. Minimum lending rate suspended as of Aug. 20, 1981.NOTE. Rates shown are mainly those at which the central bank either discounts
or makes advances against eligible commercial paper and/or government com-mercial banks or brokers. For countries with more than one rate applicable tosuch discounts or advances, the rate shown is the one at which it is understood thecentral bank transacts the largest proportion of its credit operations.
3.27 FOREIGN SHORT-TERM INTEREST RATES
Percent per year, averages of daily figures
Country, or type
2 United Kingdom
5 S w i t z e r l a n d ...
6 Netherlands • •.
3 Italy . , . ,
1985
8.2712.169.645.404.92
6.299.91
14.869.606.47
1986
6.7010.879.184.S84.19
5.567.68
12.608.044.96
1987
7.079.658.383.973.67
5.248.14
11.157.013.87
1988
Jan.
7.118.848.753.402.09
4.248.19
10.476.493.88
Feb.
6.739.188.583.291.48
3.987.54
10.806.193.82
Mar.
6.748.838.633.381.61
3.977.89
11.116.093.82
Apr.
7.058.258.903.371.83
3.987.99
10.546.083.80
May
7.408.009.073.512.23
4.077.81
10.576.053.80
June
7.618.919.443.882.82
4.107.27
10.906.043.82
July
8.0910.459.424.883.67
4.857.32
11.026.843.84
NOTE. Rates are for 3-month interbank loans except for Canada, finance company paper; Belgium, 3-month Treasury bills', and Japan, Gensaki rate.

A68 International Statistics • September 1988
3.28 FOREIGN EXCHANGE RATES1
Currency units per dollar
Country/currency 1985 1986 1987
1988
Feb. Mar. Apr. May June July
1 Australia/dollar3
2 Austria/schilling3 Belgium/franc4 Canada/dollar5 China, P.R./yuan6 Denmark/krone
7 Finland/markka8 France/franc9 Germany/deuische mark
10 Greece/drachma11 Hong Kong/dollar12 India/rupee.,.13 Ireland/punt2
14 Italy/lira15 Japan/yen16 Malaysia/ringgit17 Netherlands/guilder,....18 New Zealand/dollar2 . . .19 Norway/krone20 Portugal/escudo
21 Singapore/dollar22 South Africa/rand23 South Korea/won24 Spain/peseta25 Sri Lanka/rupee26 Sweden/krona27 Switzerland/franc28 Taiwan/dollar29 Thailand/baht 430 United Kingdom/pound2
MEMO31 United States/dollar3 . . .
70.02620.67659.336
1.36582.9434
10.598
6.19718.97992.9419
138.407.7911
12.332106.62
1908.90238.47
2.48063.3184
49.7528.5933
172.07
2.20082.2343
861.89169.9827.1878.60312.455139.88927.193129.74
143.01
67.09315.26044.6621.38963.46158.0954
5.07216.92562.1704
139.937.803712.597
134.14
1491.16168.35
2.58302.4484
52.4567.3984
149.80
2.17822.2918
884.61140.0427.9337.12721.7979
37.83726.314
146.77
112.22
70.13612.64937.357
1.32593.73146.8477
4.40366.01211.7981
135.477.7985
12.943148.79
1297.03144.60
2.51852.0263
59.3276.7408
141.20
2.10592.0385
825.93123.5429.4716.34681.4918
31.75625.774
163.98
96.94
71.4011.92035.473
1.26823.73146.4918
4.11595.73231.6963
135.567.7978
13.065156.87
1249.62129.172.58121.9051
66.3866.4167
138.84
2.01852.0529
776.85114.3630.8596.05241.3916
28.66525.324175.82
91.08
73.2911.76735.1261.24923.7314
6261
4.04835.68931.6770
134.607.802812.979
159.33
1240.67127.112.56891.8837
66.2396.3337
137.48
2.01332.1330
757.37112.3830.8925.94971.3863
28.68725.232183.30
89.73
74.8011.74434.9621.23533.73146.4207
4.00645.67041.6710
133.867.816613.158
159.81
1240.99124.902.57431.8749
66.1436.2140
136.77
2.00442.1428
745.31110.8030.9395.88921.3823
28.69525.171187.82
88.95
77.7411.91235.3811.23733.73146.4938
4.02975.73481.6935
135.757.815613.315
157.78
1258.81124.792.58471.8987
68.8896.1875
138.44
2.01092.2114
739.44112.0430.9935.90911.4111
28.66625.170186.95
89.74
80.7612.38036.7861.21763.73146.6893
4.17615.93101.7579
140.697.807313.785
152.65
1305.56127.472.58601.9767
69.9966.3951
143.54
2.02852.2716
732.88116.2531.1336.10741.4629
28.72325.280177.68
92.58
80.0012.99138.6491.20753.73147.0266
4.38966.22411.8466
147.857.813514.079
145.49
1367.26133.022.62672.0827
66.8326.7207
150.42
2.04592.3985
728.67122.2731.7826.35421.5343
28.72625.523170.51
96.53
1. Averages of certified noon buying rates in New York for cable transfers.Data in this table also appear in the Board's G.5 (405) release. For address, see
inside front cover.2. Value in U.S. cents.3. Index of weighted-average exchange value of U.S. dollar against the
currencies of 10 industrial countries. The weight for each of the 10 countries is the1972-76 average world trade of that country divided by the average world trade ofall 10 countries combined. Series revised as of August 1978 (see FEDERALRESERVE BULLETIN, vol. 64, August 1978, p. 700).

A69
Guide to Tabular Presentation,Statistical Releases, and Special Tables
GUIDE TO TABULAR PRESENTATION
Symbols and Abbreviations
c Corrected 0e Estimated n.a.p Preliminary n.e.c.r Revised (Notation appears on column heading when IPCs
about half of the figures in that column are changed.) REITs* Amounts insignificant in terms of the last decimal place RPs
shown in the table (for example, less than 500,000 SMSAswhen the smallest unit given is millions) . . . .
Calculated to be zeroNot availableNot elsewhere classifiedIndividuals, partnerships, and corporationsReal estate investment trustsRepurchase agreementsStandard metropolitan statistical areasCell not applicable
General Information
Minus signs are used to indicate (1) a decrease, (2) a negativefigure, or (3) an outflow.
"U.S. government securities" may include guaranteedissues of U.S. government agencies (the flow of funds figuresalso include not fully guaranteed issues) as well as direct
obligations of the Treasury. "State and local government"also includes municipalities, special districts, and other politi-cal subdivisions.
In some of the tables, details do not add to totals because ofrounding.
STATISTICAL RELEASES
List Published Semiannually, with Latest Bulletin Reference
Anticipated schedule of release dates for periodic releasesIssue
July 1988PageA87
SPECIAL TABLES
Published Irregularly, with Latest Bulletin Reference
Assets and liabilities of commercial banks, March 31, 1987 October 1987 A70Assets and liabilities of commercial, banks, June 30, 1987 February 1988 A70Assets and liabilities of commercial banks, September 30, 1987 April 1988 A70Assets and liabilities of commercial banks, December 31, 1987 June 1988 A70Assets and liabilities of U.S. branches and agencies of foreign banks, June 30, 1987 November 1987 A70Assets and liabilities of U.S. branches and agencies of foreign banks, September 30, 1987 February 1988 A76Assets and liabilities of U.S. branches and agencies of foreign banks, December 31, 1987 June 1988 A76Assets and liabilities of U. S. branches and agencies of foreign banks, March 31,1988 September 1988 A82Terms of lending at commercial banks, August 1987 January 1988 A70Terms of lending at commercial banks, November 1987 September 1988 A76Terms of lending at commercial banks, February 1988 May 1988 A70Terms of lending at commercial banks, May 1988 September 1988 A70Pro forma balance sheet and income statements for priced service operations, June 30, 1987 November 1987 A74Pro forma balance sheet and income statements for priced service operations, September 30,1987 . February 1988 A80Pro forma balance sheet and income statments for priced service operations, March 31, 1987 August 1988 A70
Special Tables begin on next page.
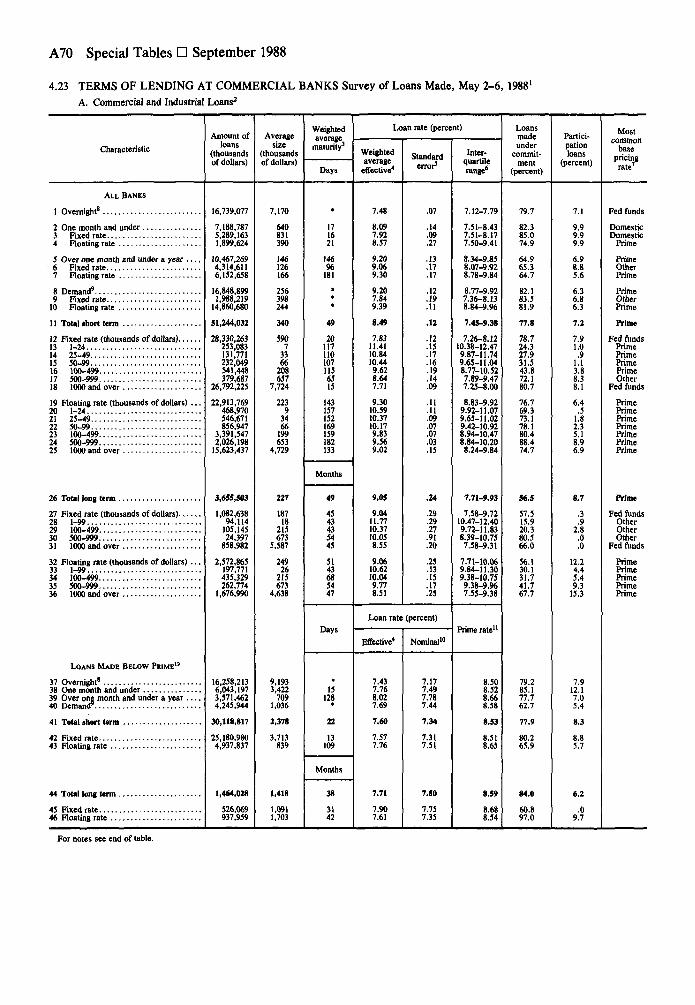
A70 Special Tables • September 1988
4.23 TERMS OF LENDING AT COMMERCIAL BANKS Survey of Loans Made, May 2-6, 19881
A. Commercial and Industrial Loans2
Characteristic
ALL BANKS
1 Overnight8
S Over one month and under a year . . . .6 Fixed rate
8 Demand9
10 Floating rate
11 Total short term . . . . . . .
12 Fixed rate (thousands of dollars)13 1-2414 25-4915 50-9916 100-49917 500-999
19 Floating rate (thousands of dollars) . . .20 1-2421 25-4922 50-9923 100-49924 500-99925 1000 and over
26 Total long term
27 Fixed rate (thousands of dollars)28 1 9929 100-49930 500-99931 1000 and over . . . . . . .
32 Floating rate (thousands of dollars) . . .33 1-9934 100-49935 500-99936 1000 and over
LOANS MADE BELOW PRIME"
37 Overnight8
39 Over one month and under a year —40 Demand'
41 Total short term
43 Floating rate
44 Total long term . . . . . .
45 Fixed rate
Amount ofloans
(thousandsof dollars)
16,739,077
7,188,7875,289,1631,899,624
10,467,2694,314,6116,152,658
16,848,8991,988,219
14,860,680
51,244,032
28,330,263253,083131,771232,049541,448379,687
26,792,225
22,913,769468,970546,671856,947
3,391,5472,026,198
15,623,437
3,655,503
1,082,63894,114
105,14524,397
858,982
2,572,865197,771435,329262,774
1,676,990
16,258,2136,043,1973,571,4624,245,944
30,118,817
25,180,9804,937,837
1,464,028
526,069937,959
Averagesize
(thousandsof dollars)
7,170
640831390
146126166
256398244
340
590733
66208657
7,724
2239
3466
199653
4,729
227
18718
215673
5,587
24926
215673
4,638
9,1933,422
7091,036
2,378
3,713839
1,418
1,0911,703
Weighted
maturity3
Days
171621
14696
181
**•
4920
1171101071156515
143157152169159182133
Months
49
4543435445
5143685447
Days
*15
128
22
13109
Months
38
3142
Loan rate (percent)
Weightedaverage
effective4
7.48
8.097.928.57
9.209.069.30
9.207.849.39
8.49
7.8311.4110.8410.449.628.647.71
9.3010.5910.3710.179.839.569.02
9.05
9.0411.7710.3710.058.55
9.0610.6210.049.778.51
Standarderror3
.07
.14
.09
.27
.13
.17
.17
.12
.19
.11
.12
.12
.15
.17
.16.19.14.09
.11
.11
.09
.07
.07
.03
.15
.24
.29
.29
.27
.91
.20
.25
.13.15.17.25
Loan rate (percent)
Effective4
7.437.768.027.69
7.60
7.577.76
7.71
7.907.61
Nominal10
7.177.497.787.44
7.34
7.317.51
7.50
7.757.35
Inter-quartilerange6
7.12-7.79
7.51-8.437.51-8.177.50-9.41
8.34-9.858.07-9.928.78-9.84
8.77-9.927.36-8.138.84-9.96
7.45-9.38
7.26-8.1210.38-12.479.87-11.749.65-11.048.77-10.527.89-9.477.25-8.00
8.83-9.929.92-11.079.65-11.029.42-10.928.94-10.478.84-10.208.24-9.84
7.71-9.93
7.58-9.7210.47-12.409.72-11.838.39-10.757.58-9.31
7.71-10.069.84-11.309.38-10.759.38-9.%7.55-9.38
Prime rate"
8.508.528.668.58
8.53
8.518.65
8.59
8.688.54
Loansmadeunder
commit-ment
(percent)
79.7
82.385.074.9
64.965.364.7
82.183.581.9
77.8
78.724.327.931.543.872.180.7
76.769.373.178.180.488.474.7
56.5
57.515.920.380.566.0
56.130.131.741.767.7
79.285.177.762.7
77.9
80265.9
84.0
60.897.0
Partici-pationloans
(percent)
7.1
9.9999.9
6.98.85.6
6.36.86.3
7.2
7.91.0.9
1.13.88.38.1
6.4.5
1.82.35.18.96.9
8.7
.3
.92.8
.0
.0
12.24.45.49.3
15.3
7.912 17.05.4
8.3
8 85.7
6.2
.09.7
Most
basepricingrate7
Fed funds
Domestic
Prime
PrimeOtherPrime
PrimeOtherPrime
Prime
Fed fundsPrimePrimePrimePrimeOther
Fed funds
PrimePrimePrimePrimePrimePrimePrime
Prime
Fed fundsOtherOtherOther
Fed funds
Prime
Prime
Prime
For notes see end of table.

Financial Markets A71
4.23—ContinuedA. Commercial and Industrial Loans—Continued
Characteristic
Amount ofloans
(thousandsof dollars)
Averagesize
(thousandsof dollars)
Weightedaverage
maturity3
Days
Loan rate (percent)
Weightedaverage
effective4
Standarderror3
Inter-quartilerange"
Loansmadeunder
commit-ment
(percent)
Partici-pationloans
(percent)
Mostcommon
basepricingrate7
LARGE BANKS
1 Overnight8
2 One month and under3 Fixed rate4 Floating rate
5 Over one month and under a year6 Fixed rate7 Floating rate
8 Demand9
9 Fixed rate10 Floating rate
11 Total short term
12 Fixed rate (thousands of dollars)13 1-2414 25-4915 50-9916 100-499 ".17 500-99918 1000 and over
19 Floating rate (thousands of dollars) . . .20 1-2421 25-4922 50-9923 100-49924 500-99925 1000 and over
26 Total long term
27 Fixed rate (thousands of dollars)...28 1-9929 100-49930 500-99931 1000 and over
32 Floating rate (thousands of dollars)33 1-9934 100-49935 500-99936 1000 and over
LOANS MADE BELOW PRIME12
37 Overnight8
38 One month and under39 Over one month and under a year40 Demand'
41 Total short term
42 Fixed rate43 Floating rate
44 Total long term
45 Fixed rate46 Floating rate . .
12,554,893
5,093,4733,888,3971,205,076
6,209,8942,618,9313*590,963
10,081,5131,174,9748,906,539
33,939,773
20,237,19510,74711,52527,590
130,691162,000
19,894,643
13,702,57887,752
117,921220,461
1,226,625760,919
11,288,901
2,025,128
659,4298,001
17,77810,958
622,693
1,365,69923,81776,66865,457
1,199,757
12j097,7874,375,5432,339,8802,873,816
21,687,026
18,378,0153,309,011
1,125,739
323,917801,821
9,907
2,7163,9421,356
6821,198519
6382,511581
1,210
4,124103264220655
8,905
592113467211659
6,511
1,052
1,28224229659
6,955
96829220684
7,781
11,1885,9814,4014,746
7,351
8,0305,002
6,102
4,0637,653
171622
13488168
39
16857478564715
131173177169163137127
Months
47
4946545549
4635395846
Days
15121
19
1397
Months
39
3640
7.52
8.067.898.61
8.958.749.11
9.067.669.25
8.32
7.7610.5910.219.949.228.897.73
9.1610.2510.1910.029.689.509.04
8.54
8.6711.6510.0511.148.55
8.4810.649.989.758.27
.09
.25
.07
.41
.15
.07
.22
.16
.22
.15
.16
.07
.20
.21
.23
.22
.18
.17
.17
.17
.11
.07
.03
.21
.17
.27
.46
.401.61.25
.45
.25
.24
.27
.42
7.12-7.82
7.57-8.417.57-8.137.61-9.93
8.18-9.738.03-9.478.71-9.73
8.06-9.927.28-7.998.77-9.92
7.38-9.04
7.25-8.069.85-11.059.65-10.929.38-10.398.44-9.938.11-9.857.25-8.06
8.77-9.919.38-11.029.38-11.029.38-10.478.84-10.248.84-9.968.17-9.84
7.44-9.31
7.40-9.3110.47-12.689.38-11.249.92-10.757.40-9.31
7.44-9.389.65-11.579.11-10.479.11-10.387.41-8.84
Loan rate (percent)
Effective4 Nominal10
7.467.797.947.56
7.59
7.597.63
7.57
7.687.53
Prime rate"
7.207.517.717.32
7.33
7.327.39
7.37
7.627.27
8.508.508.508.50
8.50
8.508.50
8.50
8.508.50
75.9
85.384.886.6
68.273.964.0
76.575.576.6
76.1
77.431.824.037.761.877.077.6
74.285.784.184.788.186.771.5
71.4
61.632.851.393.461.7
76.261.268.170.577.3
75.287.176.150.5
74.4
76.463.4
84.3
47.599.1
8.6
8.97.6
13.2
4.88.71.9
6.74.17.1
7.4
8.14.12.0
.83.44.68.2
6.3.1.1.7
3.23.57.0
5.9
.03.2.0.0.0
.54.3
.09.7
8.97.83.73.4
7.4
8.04.1
.1
.0
Fed funds
DomesticDomestic
Prime
PrimeForeignPrime
PrimeOtherPrime
Fed hinds
Fed fundsPrimePrimePrimePrimeNone
Fed funds
PrimePrimePrimePrimePrimePrimePrime
Domestic
Fed fundsOtherOtherOther
Fed funds
DomesticPrimePrimePrime
Domestic
For notes see end of table.

A72 Special Tables D September 1988
4.23 TERMS OF LENDING AT COMMERCIAL BANKS Survey of Loans Made, May 2-6, 19881—Continued
A. Commercial and Industrial Loans—Continued2
Characteristic
OTHER BANKS
3 Fixed rate
S Over one month and under a year6 Fixed rate
8 Demand9
9 Fixed rate
U Total short term
12 Fixed rate (thousands of dollars)13 i_2414 25-4915 50 9916 100-49917 500-999
19 Floating rate (thousands of dollars) . . .20 1-2421 25-4922 50 9923 100-49924 500-99925 1000 and over
27 Fixed rate (thousands of dollars)28 1-9929 100-49930 500-999
32 Floating rate (thousands of dollars) . . .33 1-9934 100-49935 500-99936 1000 and over
LOANS MADE BELOW PRIME12
37 Overnight8
39 Over one month and under a year
42 Fixed rate43 Floating rate
44 Total long lerm
45 Fixed rate
Amount ofloans
(thousandsof dollars)
4,184,184
2,095,3141,400,765
694,549
4,257,3741,695,6802,561,695
6,767,386813,245
5,954,141
17,304,259
8,093,067242,336120,247204,459410,757217,687
6,897,582
9,211,191381,218428,750636,486
2,164,9221,265,2794,334,536
1,630,375
423,20986,11387,36713,440
236,290
1,207,166173,955358,661197,317477,232
4,160,4261,667,6541,231,5821,372,128
8,431,791
6,802,9641,628,826
338,290
202,152136,138
Averagesize
(thousandsof dollars)
3,920
224261175
685385
135180131
141
1887
3367
205659
5,587 •
1169
3466
193649
2,761
115
8018
212685
3,680
13526
214670
2,301
6,0541,612
274393
868
1,514312
399
503305
Weighted
maturity1
Days
171619
163109199
*
*
70
291191131111348015
161154145169157198151
Months
52
3842415334
5744745250
Days
*15
140*
29
14127
Months
35
2255
Loan rate (percent)
Weighted
effective4
7.36
8.178.008.50
9.569.559.57
9.428.119.59
8.80
8.0111.4510.9010.519.758.457.64
9.5010.6710.4110.239.919.598.98
9.69
9.6211.7910.449.178.56
9.7110.6210.059.789.09
Standarderror5
.10
.16
.16
.38
.05
.20
.19
.19
.24
.17
.14
.20.16.20,23.24.22.18
.13
.05
.05
.06
.11
.05
.24
.12
.47
.37
.33
.67
.37
.12
.12
.19
.24
.29
Loan rate (percent)
Effective4
7.357.708.177.95
7.63
7.548.03
8.17
8.258.07
Nominal10
7.097.427.917.69
7.37
7.287.76
7.90
7.977.80
Inter-
range6
6.98-7.59
7.43-8.447.43-8.337.50-9.40
8.77-10.478.21-10.928.84-9.96
8.84-9.967.60-8.52
8.84-10.20
7.52-9.92
7.28-8.2610.38-12.47
9.92-11.919.84-11.048.78-11.027.73-9.117.22-7.92
8.84-10.099.92-11.079.84-11.029.65-11.029.11-10.478.87-10.208.50-9.69
8.84-10.47
7.58-11.0210.47-12.409.92-11.838.39-10.757.58-9.40
8.87-10.479.84-11.309.38-10.759.38-9.938.84-9.84
Prime rate"
8.508.568.968.74
8.62
8.548.94
8.90
8.988.78
Loansmadeunder
commit-ment
(percent)
90.9
75.285.454.6
60.252.065.6
90.595 189.9
81.3
82.223.928.230.738.168.589.8
80.565.670.075.976.089.483.1
37.9
51.214.314.070.077.4
33.325.823.932.143.5
90.979.780.888.2
86.8
90.670.9
83.1
82.284.4
Partici-pationloans
(percent)
2.5
12.316.44.1
10.19.0
10.8
5.710.75.1
6.8
7.1.8.8
1.24.0
11.17.7
6.6.6
2.22.96.2
12.16.7
12.1
.8
.73.3.0.0
16.04.95.7
12.429.4
5.123.113.39.6
10.6
11.09.0
26.6
.066.2
Most
basepricing
rate'
Fed funds
Fed fundsFed funds
Prime
PrimeFed funds
Prime
Fed fundsPrime
Prime
Fed fundsPrimePrimePrime
OtherFed funds
PrimePrimePrime
PrimePrimePrime
Prime
DomesticOtherOther
Fed fundsDomestic
PrimePrimePrimePrimePrime
For notes see end of table.

4.23—ContinuedB. Construction and Land Development Loans'
Financial Markets A73
Characteristic
Amount ofloans
(thousandsof dollars)
Averagesize
(thousandsof dollars)
Weightedaveragematurity
(months)
Loan rate (percent)
Weightedaverage
effective4
Standarderror3
Inter-quartilerange'
Loans madeunder
commitment(percent)
Partici-pationloans
(percent)
A L L BANKS
1 Total
2 Fixed rate (thousands of dollars)...3 1-244 25-495 50-996 100-4997 500 and over
8 Floating rate (thousands of dollars)9 1-24
10 25-4911 50-9912 100-49913 500 and over
fly type of construction14 Single family15 Muftifamily16 Nonresidential
LARGE BANKS13
1 Total
2 Fixed rate (thousands of dollars)...3 1-244 25-495 50-996 100-4997 500 and over
8 Floating rate (thousands of dollars)9 1-24
10 25-4911 50-9912 100-49913 500 and over
By type of construction14 Single family15 MuTtifamily16 Nonresidential
OTHER BANKS"
1 Total
2 Fixed rate (thousands of dollars)...3 1-244 25-495 50-996 100-4997 500 and over
8 Floating rate (thousands of dollars)9 1-24
10 25-4911 50-9912 100-49913 500 and over
By type of construction14 Single family15 Muhifamily16 Nonresidential
4,023,264 2S7
1,350,17521,10220,75621,94498,581
1,187,793
2,673,08956,90069,21193,560515,670
1,937,747
375113863147
9,437
222103567222
3,954
507,335187,055
3,328,873
2,891,114
1,123,599815914
1,1994,771
1,115,900
1,767,5156,4098,58514,55886,608
1,651,356
92,235114,789
2,684,090
1,132,150
226,57620,28719,84220,74593,810
905,57450,49160,62679,003
429,062286,392
415,10172,266644,783
64242476
1,421
4,61393464
23612,369
987103570229
5,458
227324
2,106
83
67II3863145
103567220
1,527
55173113
32098202
18109111023
101212
11023229
241215181625
51012
13209720
119810916
111412
9.29
8.6911.6611.6211.8110.828.35
9.5910.7510.6010.4610.719.18
10.389.359.12
8.83
8.2910.7210.259.489.088.28
9.1810.2210.119.969.989,12
9.169.008.81
10.44
10.6511.7011.6911.9510.91
10.3910.8110.6710.5510.869.51
10.659.91
10.37
.22
.52
.21
.27
.37
.29
.18
.12
.14
.14
.19
.16
.24
.18
.24
.26
.75
.21
.44
.30
.441.03
.20
.15
.11
.17
.20
.25
.36
.30
.29
.20
.40
.28
.25
.28
.26
.19
.15
.22
.19
.19
.19
.21
.18
.28
8.84-9.92
7.37-9.2811.02-12.1311.02-12.1311.57-13.3110.38-11.57
7.37-9.08
8.84-10.249.93-11.029.92-11.029.92-11.029.96-11.028.84-9.42
9.92-11.079.22-9.928.36-9.69
8.36-9.38
7.37-9.0810.20-11.029.42-10.758.84-9.%8.50-9.297.37-9.08
8.84-9.429.65-10.759.79-10.479.38-10.249.42-10.478.84-9.42
8.85-10.207.37-9.658.33-9.17
9.69-11.02
9.22-11.6311.02-12.1311.35-12.1311.57-13.3110.38-11.57
9.69-11.0210.20-11.029.92-11.079.92-11.02
10.47-11.079.11-9.92
9.96-11.489.22-10.479.38-11.02
88.3
95.554.448.645.679.999.3
84.787.479.679.262.091.1
82.489.289.2
99.4
99.872.880.875.870.4
100.0
99.193.794.795.095.199.4
97.197.299.5
60.2
74.153.747.143.980.4
56.786.677.576.355.443.6
79.176.446.1
16.6
20.9.0.4.9
4.623.4
14.42.02.97.55.6
17.5
8.96.2
18.4
20.8
24.9.0
9.217.424.)24.9
18.29.86.39.6
12.418.7
45.44.2
20.7
6.0
1.5.0.0.0
3.6
7.11.02.44.86.6
10.5
.89.58.9
For notes see end of table.
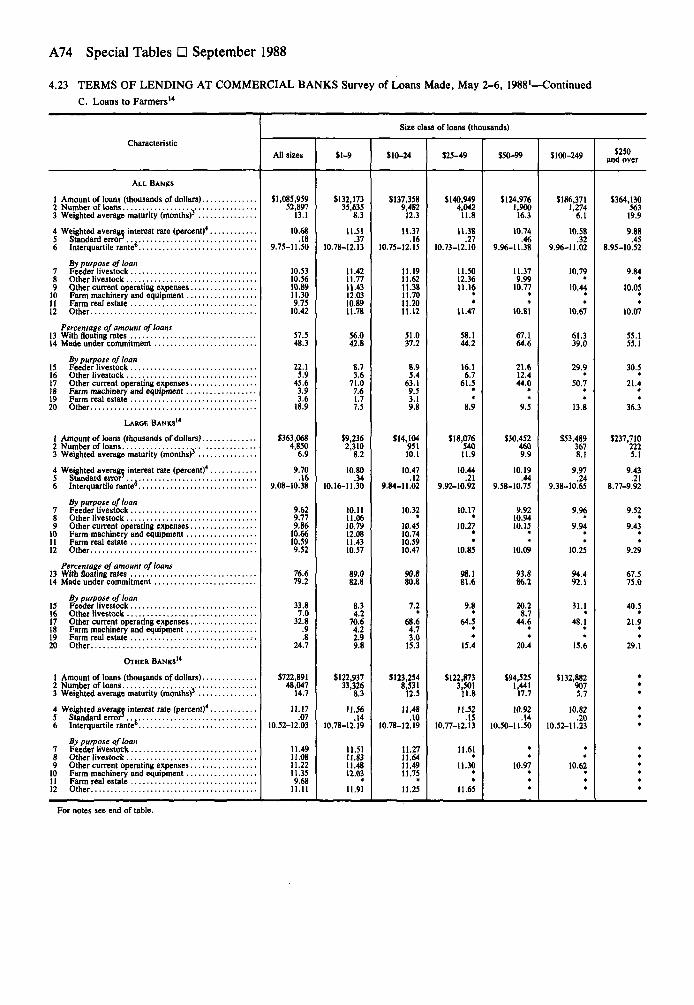
A74 Special Tables • September 1988
4.23 TERMS OF LENDING AT COMMERCIAL BANKS Survey of Loans Made, May 2-6, 1988'—Continued
C. Loans to Farmers14
Characteristic
Size class of loans (thousands)
All sizes $1-9 $10-24 $25-49 $50-99 $100-249 $250and over
ALL BANKS
1 Amount of loans (thousands of dollars)..2 Number of loans3 Weighted average maturity (months)' . . .
4 Weighted average interest rate (percent)4
5 Standard error . . ,6 Interquartile rente6
By purpose of loan7 Feeder livestock8 Other livestock9 Other current operating expenses
10 Farm machinery and equipment11 Farm real estate12 Other
Percentage of amount of loans13 With floating rates14 Made under commitment
By purpose of loan15 Feeder livestock16 Other livestock17 Other current operating expenses18 Farm machinery and equipment19 Farm real estate20 Other
LAROE BANKS1 4
1 Amount of loans (thousands of dollars)..2 Number of loans3 Weighted average maturity (months)3 . . .
4 Weighted average interest rate (percent)4
5 Standard error6 Interquartile rante'
By purpose of loan7 Feeder livestock8 Other livestock9 Other current operating expenses
10 Farm machinery and equipment11 Farm real estate12 Other
Percentage of amount of loans13 With floating rates14 Made under commitment
By purpose of loan15 Feeder livestock16 Other livestock17 Other current operating expenses18 Farm machinery and equipment19 Farm real estate20 Other
OTHER BANKS1 4
1 Amount of loans (thousands of dollars)..2 Number of loans3 Weighted average maturity (months)3 . . .
4 Weighted average interest rate (percent)4
5 Standard error . . ,6 Interquartile rante
By purpose of loan7 Feeder livestock8 Other livestock9 Other current operating expenses
10 Farm machinery and equipment11 Farm real estate12 Other
$1,085,95952,897
13.1
10.68.18
9.75-11.50
10.5310.5610.8911.309.75
10.42
57.548.3
22.15.9
45.63.93.6
18.9
$363,0684,850
6.9
9.70.16
9.08-10.38
9.629.779.86
10.6610.599.52
76.679.2
33.87.0
32.8.9.8
24.7
$722,89148,047
14.7
11.17.07
10.52-12.03
11.4911.0811.2211.359.68
11.11
$132,17335,635
8.3
11.51.37
10.78-12.13
11.4211.7711.4312.0310.8911.78
56.042.8
8.73.6
71.07.61.77.5
$9,2362,310
8.2
10.80.34
10.16-11.30
10.1111.0610.7912.0811.4310.57
89.082.8
8.34.2
70.64.22.99.8
$122,93733,326
8.3
11.56.14
10.78-12.19
11.5111.8311.4812.03
*11.91
$137,3589,482
12.3
11.37.16
10.75-12.15
11.1911.6211.3811.7011.20U.12
51.037.2
8.95.4
63.19.53.19.8
$14,10495110.1
10.47.12
9.84-11.02
10.32
10.4510.7410.5910.47
90.8
7.2*
68.64.73.0
15.3
$123,2548,531
12.5
11.48.10
10.78-12.19
11.2711.6411.4911.75
*11.25
$140,9494,04211.8
11.38.27
10.73-12.10
11.5012.3611.16
11.47
58.144.2
16.16.7
61.5
8.9
$18,07654011.9
10.44.21
9.92-10.92
10.17
10.27
10.85
98.181.6
9.8*
64.5**
15.4
$122,8733,50111.8
11.52.15
10.77-12.13
11.61*
11.30
11.65
$124,9761,90016.3
10.74.46
9.96-11.38
11.379.9910.77
10.81
67.164.6
21.612.444.0
9.5
$30,4524609.9
10.19.44
9.58-10.75
9.9210.9410.15
10.09
93.886.2
20.28.7
44.6
20.4
$94,5251,44117.7
10.92.14
10.50-11.50
10.97
$186,3711,2746.1
10.58.32
9.96-11.02
10.79*
10.44
*
10.67
61.339.0
29.9*
50.7
13.8
$53,4893678.1
9.97.24
9.38-10.65
9.96*
9.94**
10.25
94.492.1
31.1*
48.1
•
15.6
$132,8829075.7
10.82.20
10.52-11.23
10.62
$364,13056319.9
9.88.45
8.95-10.52
9.84
10.05
*
10.07
55.155.1
30.5*
21.4*
36.3
$237,7102225.1
9.43.21
8.77-9.92
9.52*
9.43**
9.29
67.575.0
40.5•
21.9
29.1
For notes see end of table.

4.23—ContinuedC. Loans to Farmers14—Continued
Financial Markets A75
Characteristic
Size class of loans (thousands)
All sizes $1-9 $10-24 $25-49 $50-99 $100-249 $250and over
Percentage of amount of loans13 With floating rates14 Made under commitment
By purpose of loan15 Feeder livestock16 Other livestock17 Other current operating expenses18 Farm machinery and equipment.19 Farm real estate20 Other
48.032.7
16.35.3
51.95.55.0
16.1
53.539.8
8.73.6
71.07.9*7.3
46.432.2
9.15.9
62.510.1*9.2
52.238.7
17.0*
61.0*
7.9
58.557.6
43.8
48.017.6
51.8
•Fewer than 10 sample loans.1. The survey of terms of bank lending to business collects data on gross loan
extensions made during the first full business week in the mid-month of eachquarter by a sample of 340 commercial banks of all sizes. A subsample of 250banks also report loans to fanners. The sample data are blown up to estimate thelending terms at all insured commercial banks during that week. The estimatedterms of bank lending are not intended for use in collecting the terms of loansextended over the entire quarter or residing in the portfolios of those banks.Construction and land development loans include both unsecured loans and loanssecured by real estate. Thus, some of the construction and land developmentloans would be reported on the statement of condition as real estate loans and theremainder as business loans. Mortgage loans, purchased loans, foreign loans, andloans of less than $1,000 are excluded from (lie survey.
As of Dec. 31,1987, assets of most of the large banks were at least $6.0 billion.For all insured banks total assets averaged $220 million.
2. Beginning with the August 1986 survey respondent banks provide informa-tion on the type of base rate used to price each commercial and industrial loanmade during the survey week. This reporting change is reflected in the newcolumn on the most common base pricing rate in table A and footnote 13 fromtable B.
3. Average maturities are weighted by loan size and exclude demand loans.4. Effective (compounded) annual interest rates are calculated from the stated
rate and other terms of the loan and weighted by loan size.5. The chances are about two out of three that the average rate shown would
differ by less than this amount from the average rate that would be found by acomplete survey of lending at all banks.
6. The interquartile range shows the interest rate range that encompasses themiddle 50 percent of the total dollar amount of loans made.
7. The most common base rate is that rate used to price the largest dollarvolume of loans. Base pricing rates include the prime rate (sometimes referred toas a bank's "basic" or "reference" rate); the federal funds rate; domestic moneymarket rates other than the federal funds rate; foreign money market rates; andother base rates not included in the foregoing classifications.
8. Overnight loans are loans that mature on the following business day.9. Demand loans have no stated date of maturity.10. Nominal (not compounded) annual interest rates arc calculated from survey
data on the stated rate and other terms of the loan and weighted by loan size.11. The prime rate reported by each bank is weighted by the volume of loans
extended and then averaged.12. The proportion of loans made at rates below prime may vary substantially
from the proportion of such loans outstanding in banks' portfolios.13. 56.5 percent of construction and land development loans w^n priced
relative to the prime rate.14. Among banks reporting loans to farmers (Table C), most "large banks"
(survey strata 1 to 3) had over $600 million in total assets, and most "other banks"(survey strata 4 to 6) had total assets below $600 million.
The survey of terms of bank lending to fanners now includes loans secured byfarm real estate. In addition, the categories describing the purpose of farm loanshave now been expanded to include purchase or improve farm real estate." Inprevious surveys, the purpose of such loans was reported as "other."
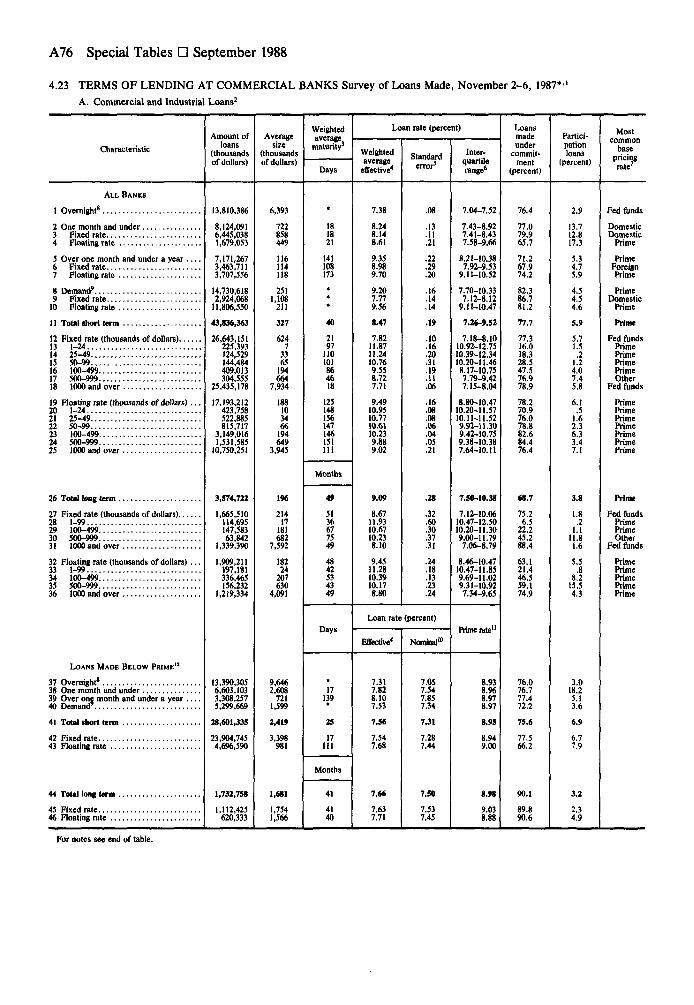
A76 Special Tables D September 1988
4.23 TERMS OF LENDING AT COMMERCIAL BANKS Survey of Loans Made, November 2-6, 1987*1
A. Commercial and Industrial Loans2
Characteristic
Amount ofloans
(thousandsof dollars)
Averagesize
(thousandsof dollars)
Weightedaverage
maturity3
Days
Loan rate (percent)
Weightedaverage
effective4
Standarderror3
Inter-quartilerange'
Loansmadeunder
commit-ment
(percent)
Partici-pationloans
(percent)
Mostcommon
basepricingrate7
ALL BANKS
1 Overnight8
2 One month and under3 Fixed rate4 Floating rate
5 Over one month and under a year .6 Fixed rate7 Floating rate
8 Demand'9 Fixed rate
10 Floating rate
11 Total short term
12 Fixed rate (thousands of dollars)...13 1-2414 25-4915 50-9916 100-49917 500-99918 1000 and over
19 Floating rate (thousands of dollars)20 1-2421 25-4922 50-9923 100-49924 500-99925 1000 and over
26 Total long term
27 Fixed rate (thousands of dollars)...28 1-9929 100-49930 500-99931 1000 and over
32 Floating rate (thousands of dollars)33 1-9934 100-49935 500-99936 1000 and over
LOANS MADE BELOW PRIME11
37 Overnight8
38 One month and under39 Over one month and under a year40 Demand'
41 Total short term
42 Fixed rate43 Floating rate
44 Total long term
45 Fixed rate46 Floating rate . .
13,810,386
8,124,0916,445,0381,679,053
7,171,2673,463,7113,707,556
14,730,6182,924,068
11,806,550
43,836,363
26,643,151225,393124,529144,484409,013304,555
25,435,178
17,193,212423,758522,885815,717
3,149,0161,531,58510,750,251
3,574,722
1,665,510114,695147,58363,842
1,339,390
1,909,211197,181336,465156,232
1,219,334
13,390,3056,603,1033,308,2575,299,669
28,601,335
23,904,7454,696,590
1,732,758
1,112,425620,333
6,393
722858449
116114118
2511,108211
327
6247
3365194664
7,934
188103466194649
3,945
196
21417181682
7,592
18224207630
4,091
9,6462,608721
1,599
2,419
3,398981
1,681
1,7541,566
181821
141108173
40
2197110101864618
125148156147146151111
Months
5136677549
4842534349
Days
17139
25
17111
Months
41
4140
7.38
8.248.148.61
9.358.989.70
9.207.779.56
8.47
7.8211.8711.2410.769.558.727.71
9.4910.9510.7710.6110.239.889.02
9.09
8.6711.9310.6710.238.10
9.4511.2810.3910.17
.13
.11
.21
.22
.29
.20
.16
.14.14
.19
.10
.16
.20
.31
.19
.11
.06
.06
.04
.05
.21
.28
.32
.60
.30
.37
.31
.24
.18
.13
.23
.24
7.04-7.52
7.43-8.927.41-8.437.58-9.66
8.21-10.387.92-9.53
9.11-10.52
7.70-10.337.12-8.12
9.11-10.47
7.26-9.52
7.18-8.1010.92-12.7510.39-12.3410.20-11.468.17-10.757.79-9.427.15-8.04
8.80-10.4710.20-11.5710.11-11.529.92-11.309.42-10.759.38-10.387.64-10.11
7.50-10.38
7.12-10.0610.47-12.5010.20-11.309.00-11.797.06-8.79
8.46-10.4710.47-11.859.69-11.029.31-10.927.34-9.65
Loan rate (percent)
Effective4 Nominal"1
7.317.828.107.53
7.56
7.547.68
7.66
7.637.71
Prime rate"
7.057.547.857.34
7.31
7.287.44
7.50
7.537.45
8.938.%8.978.97
8.95
8.949.00
8.98
9.038.88
76.4
77.079.965.7
71.267.974.2
82.386.781.2
77.7
77.316.018.328.547.576.978.9
78.270.976.078.882.684.476.4
68.7
75.26.5
22.245.2
63.121.446.559.174.9
76.076.777.472.2
75.6
77.566.2
90.1
89.890.6
2.9
13.712.817.3
5.34.75.9
4.54.54.6
5.9
5.71.5.2
1.24.07.45.8
6.1.5
1.62.36.33.47.1
3.8
1.8.2
1.111.81.6
5.5.8
8.215.54.3
3.018.25.13.6
6.9
6.77.9
3.2
2.34.9
Fed funds
DomesticDomestic
Prime
PrimeForeignPrime
PrimeDomestic
Prime
Prime
Fed fundsPrimePrimePrimePrimeOther
Fed funds
PrimePrimePrimePrimePrimePrimePrime
Prime
Fed fundsPrimePrimeOther
Fed funds
PrimePrimePrimePrimePrime
For notes see end of table.

Financial Markets A77
4.23—ContinuedA. Commercial and Industrial Loans2—Continued
Characteristic
Amount ofloans
(thousandsof dollars)
Averagesize
(thousandsof dollars)
Weightedaverage
maturity3
Days
Loan rate (percent)
Weightedaverage
effective4
Standarderror5
Inter-quartile
Loansmadeunder
commit-ment
(percent)
Partici-pationloans
(percent)
Mostcommon
basepricingrate r
LARGE BANKS
1 Overnight8
2 One month and under3 Fixed rate4 Floating rate
5 Over one month and under a year6 Fixed rate7 Floating rate
8 Demand9
9 Fixed rate10 Floating rate
11 Total abort term
12 Fixed rate (thousands of dollars)13 1-2414 25-4915 50-8916 100-49917 500-99918 1000 and over
19 Floating rate (thousands of dol lars) . . .20 1-2421 25-4922 50-9923 100-49924 500-99925 1009 and over
26 Total long term
27 Fixed rate (thousands of dollars)...28 1-9929 100-49930 500-99931 1000 and over
32 Floating rate (thousands of dollars)33 1-99*34 100-49935 500-99936 1000 and over
LOANS MADE BELOW PRIME11
37 Overnight8
38 One month and under39 Over one month and under a year40 Demand'
41 Total short term
42 Fixed rate43 Floating rate ,
44 Total long term
45 Fixed rate46 Floating rate . .
10,997,573
6,697,9745,349,3021,348,672
4,020,9812,458,60$1,562,372
8,213,6091,954,6356,258,974
29,930,137
20,760,06713,13613,15925,229
125,320162,214
20,421,008
9,170,07078,850
111,763210,836
1,101,907663,034
7,003,680
2,O5S,8*2
1,055,6595,259
13,79115,286
1,021,324
1,000,22323,662
107,40360,311
808,847
10,691,2875,581,8282,565,2673,373,412
22,211,793
18,872,6053,339,188
1,359,008
837,468521,540
9,416
3,3924,8291,555
6311,179364
4922,354394
1,141
4,000103363215669
9,103
436113467209657
4,988
1,125
2,86026
223701
12,578
31239641
5,579
10,8566,0835,2523,885
6,815
7,7734,018
6,988
10,5894,520
191821
134108174
877981644119
10313512611711813499
Months
4953798148
4736424848
Days
17144
25
18105
Months
7.40
8.208.168.33
8.738.92
9.007.759.39
8.20
7.7911.0510.6310.499.618.807.76
9.1510.7110.6210.4810.129.878.85
8.40
8.0512.9710.809.357.96
8.7810.8910.209.988.43
.11
.13.29
.25
.27
.33
.23
.11
.22
.12
.06
.20
.23
.53.23.15.06
.26
.13
.13
.11
.06
.07
.28
.45
.521.17.52.63.50
.35
.25
.19
.39
.37
7.04-7.55
7.41-8.597.43-8.437.11-9.53
7.66-9.517.85-9.427.48-9.92
7.60-10.127.12-8.12
8.43-10.38
7.B-9.W
7.20-8.1010.38-11.579.96-11.309.93-11.028.86-10.397.90-9.487.19-8.10
7.91-10.209.92-11.359.92-11.309.69-11.029.38-10.759.38-10.477.58-9.84
7.20-9.38
7.06-8.7910.75-12.6810.47-11.248.43-10.757.06-8.25
7.34-9.929.92-11.579.38-10.799.31-10.757.25-9.31
Loan rate (percent)
Effective4 Nominal10
4238
7.347.858.047.52
7.58
7.577.62
7.55
7.517.61
Prime rate11
7.087.577.807.31
7.32
7.317.38
7.41
7.467.35
8.948.958.908.94
8.94
8.948.92
8.94
9.008.84
72.5
77.979.969.8
80.277.185.0
76.385.973.2
75.8
76.229.719.628.757.478.276.5
74.784.882.082.985.087.171.5
8».S
98.427.860.057.899.9
80.151.672.485.681.5
72.075.380.060.4
72.0
74.855.9
97.3
99.593.8
1.5
15.414.519.0
3.74.82.0
4.72.85.4
5.8
5.42.61.41.23.59.35.4
6.8.2.7
1.02.3
8.3
1.7
.5
.0
.033.9
.0
2.9
II.*9.61.2
1.618.24.12.7
6.2
5.79.2
.51.2
Fed funds
DomesticDomesticDomestic
ForeignForeignPrime
PrimeDomestic
Prime
Domestic
Fed fundsPrimePrimePrimePrimeNone
Fed funds
PrimePrimePrimePrimePrimePrimePrime
Domestic
Fed fundsPrimePrime
ForeignFed funds
DomesticPrimePrimePrime
Domestic
For notes see end of table.

A78 Special Tables • September 1988
4.23 TERMS OF LENDING AT COMMERCIAL BANKS Survey of Loans Made, November 2-6, 1987*1—Continued
A. Commercial and Industrial Loans2—Continued
Characteristic
OTHER BANKS
1 Overnight8
3 Fixed rate4 Floating rate . . . . .
5 Over one month and under a year6 Fixed rate7 Floating rate
8 Demand9
9 Fixed r a t e . . . .10 Floating rate
11 Total short term
12 Fixed rate (thousands of dollars)13 1-2414 25-4915 50-9916 100-49917 500-99918 1000 and over
19 Floating rate (thousands of dollars) . . .20 1-2421 25 4922 50 9923 100-49924 500-999. .25 1000 and over
26 Total long term .
27 Fixed rate (thousands of dollars)28 1-9929 100-49930 500-99931 1000 and over
32 Floating rate (thousands of dollars) . . .33 1-99°34 100-49935 500-99936 1000 and over
LOANS M A D E BELOW PRIME 1 2
37 Overnight*
39 Over one month and under a year40 Demand'
41 Total short term . .
42 Fixed rate43 Floating rate
44 Total long term . .
45 Fixed rate46 Floating rate
Amount ofloans
(thousandsof dollars)
2,812,813
1,426,1171,095,736
330,382
3,150,2871,005,1032,145,184
6,517,009969,433
5,547,576
13,906,22!
5,883,084212,257111,369119,254283,692142,341
5,014,170
8,023,142344,909411 122604,881
2,047,109868,551
3,746,571
1,518,840
609,851109,436133,79248,556
318,067
908,988173,519229,06295,921
410,487
2,699,0181,021,276
742,9901,926,258
6,389,542
5,032,1401,357,403
373,750
274,95798,793
Averagesize
(thousandsof dollars)
2,835
154171115
573679
155536138
129
1577
3466
186658
5,210
114103466
187642
2,836
n8217
177676
3,340
10123
195624
2,682
6,692633181788
746
1,093343
447
495352
Weighted
maturity'
Days
*
171620
151107172
***
68
2697
114105965414
151150161153155160144
Months
51
5435667352
4943593950
Days
*15
119*
24
15141
Months
43
4151
Loan rate (percent)
Weightedaverage
effective4
7.30
8.458.069.74
10.059.58
10.27
9.467.829.75
9.05
7.9211.9211.3210.829.528.637.50
9.8811.0010 8110.6510.299.899.33
10.01
9.7511.8810.6610.518.52
10.1911 3310.4810.299.52
Standarderror5
.14
.22
.19
.22
.18
.35.07
.23
.20
.19
.25
.18
.14
.24
.29
.33
.17
.10
.16
.06
.08
.05
.06
.09
.32
.22
.34
.30
.35
.43
.43
.23
.22
.17
.29
.29
Loan rate (percent)
Effective4
7.187.668.307.57
7.50
7.417.84
8.08
8.008.28
Nominal10
6.937.398.027.37
7.26
7.177.60
7.83
7.777.98
Inter-quartilerange'
6.98-7.51
7.44-9.477.25-8.35
9.14-10.21
9.31-10.927.92-10.929.38-10.79
8.37-10.477.12-8.15
9.31-10.65
7.43-10.38
7.05-8.0510 93-12.7510.65-12.5710.20-11.468.17-10.757.64^9.257.05-7.69
9.38-10.7510.20-11.5710 20 11.579.92-11.309.65-10.759.38-10.348.07-10.38
9.14-10.93
8.00-11.0210.47-12.5010.20-11.309.38-12.13
7.39-9.50
9.42-10.9310.47-11.859.92-11.029.31-11.35
9.31-9.96
Prime rate11
8.909.039.239.01
8.99
8.949.19
9.11
9.139.06
Loansmadeunder
commit-ment
(percent)
91.8
72.579.749.0
59.845.566.4
90.088.390.3
81.7
81.115.218.128.443.175.488.8
82.267.774.477.481.382.385.6
40.7
35.25.5
18.341.351.5
44.417.334.442.461.9
92.184.368.592.9
88.3
87.591.5
63.8
60.373.4
Partici-pationloans
(percent)
8.5
5.64.2
10.4
7.44.58.8
4.37.83.6
6.0
6.91.4.1
1.14.25.37.6
5.3.6
1.82.88.44.45.0
6.7
4.1.2
1.24.96.6
8.5.8
6.219.210.5
8.818.68.55.2
9.2
10.44.9
12.3
7.924.5
Most
basepricingrate r
Fed funds
Fed fundsFed funds
Prime
PrimePrimePrime
PrimeFed funds
Prime
Prime
Fed fundsOtherPrimePrimePrimeOther
Fed funds
PrimePrime
PrimePrimePrimePrime
Prime
PrimePrimePrimeOther
Domestic
PrimePrimePrime
Prime
For notes see end of table.
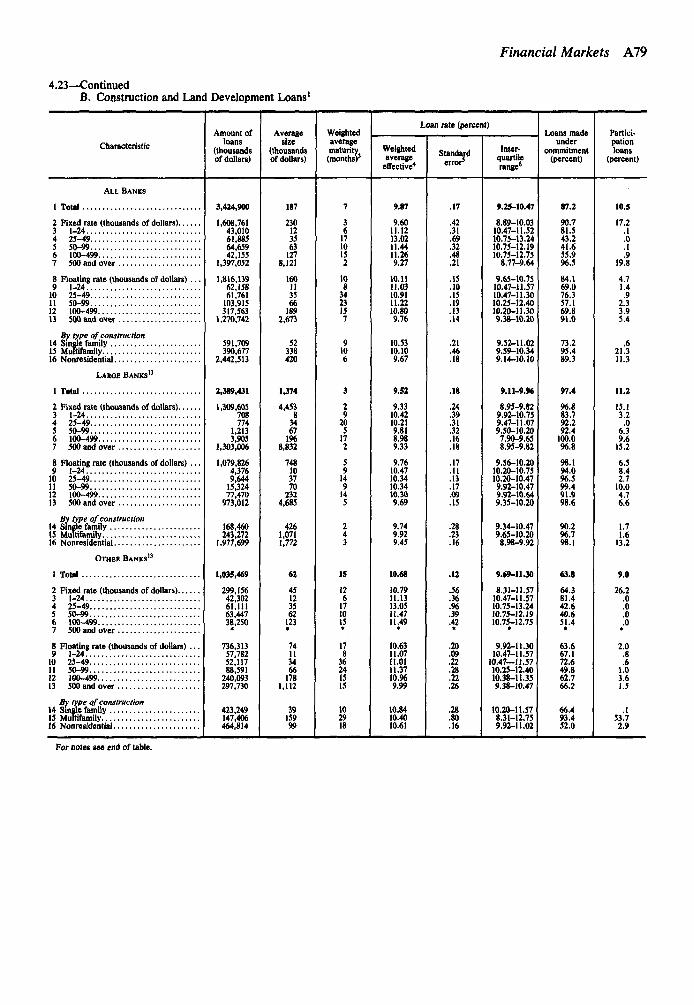
4.23—ContinuedB. Construction and Land Development Loans1
Financial Markets A79
Characteristic
Amount ofloans
(thousandsof dollars)
Averagesize
(thousandsof dollars)
Weightedaveragematurity(months)'
Loan rate (percent)
Weightedaverage
effective4
Standarderror5
Inter-quartilerange6
Loans madeunder
commitment(percent)
Partici-pationloans
(percent)
ALL BANKS
1 Total
2 Fixed rate (thousands of dollars)...3 1-244 25-495 50-996 100-4997 500 and over
8 Floating rate (thousands of dollars)9 1-24
10 25-4911 50-9912 100-49913 500 and over
By type of construction14 Single family15 Mufiifamily16 Nonresidential
LARGE BANKS' 3
1 Total
2 Fixed rate (thousands of dollars)...3 1-244 25-495 50-996 100-4997 500 and over
8 Floating rate (thousands of dollars)9 1-2410 25-4911 50-9912 100-49913 500 and over
By type of construction14 Single family15 MuUifamily16 Nonresidential
OTHER BANKS'3
1 Total
2 Fixed rate (thousands of dollars)...3 1-244 25-495 50-996 100-4997 500 and over
8 Floating rate (thousands of dollars)9 1-24
10 25-4911 50-9912 100-49913 500 and over
By type of construction14 Single family15 MuUifamily16 Nonresidential
3,424,900
1,608,76143,01061,88564,65942,155
1,397,052
1,816,13962,15861,761
103,915317,563
1,270,742
591,709390,677
2,442,513
2,389,431
1,309,605708774
1,2133,905
1,303,006
1,079,8264,3769,644
15,32477,470
973,012
168,460243,272
1,977,699
1,035,469
299,15642,30261,11163,44738,250
736,31357,78252,11788,591
240,093297,730
423,249147,406464,814
187
230123563127
8,121
160113566189
2,673
52338420
1,374
4,45383467196
8,832
748103770232
4,685
4261,0711,772
62
45123562123
74113466178
1,112
3915999
361710152
1083423157
9106
29205172
59149145
126171015
36241515
102918
9.87
9.6011.1213.0211.4411.269.27
10.1111.0310.9111.2210.809.76
10.5310.109.67
9.52
9.3310.4210.219.818.989.33
9.7610.4710.3410.3410.309.69
9.749.929.45
10.68
10.7911.1313.0511.4711.49
10.6311.0711.0111.3710.%9.99
10.8410.4010.61
.42
.31
.69
.32
.48
.21
.15
.10
.15
.19
.13
.14
.21
.46
.18
.24.39.31.32.16.18
.17
.11
.13
.17
.09
.15
.28
.23
.16
.12
.56
.36
.96
.39
.42
.20
.09
.22
.28
.22
.26
.28
.80
.16
9.25-10.47
8.89-10.0310.47-11.5210.75-13.2410.75-12.1910.75-12.75
8.77-9.64
9.65-10.7510.47-11.5710.47-11.3010.25-12.4010.20-11.309.38-10.20
9.52-11.029.59-10.349.14-10.10
9.11-9.96
8.95-9.829.92-10.759.47-11.079.50-10.207.90-9.658.95-9.82
9.56-10.2010.20-10.7510.20-10.479.92-10.479.92-10.649.35-10.20
9.34-10.479.65-10.20
8.98-9.92
9.69-11.30
8.31-11.5710.47-11.5710.75-13.2410.75-12.1910.75-12.75
9.92-11.3010.47-11.57
10.47—11.5710.25-12.4010.38-11.359.38-10.47
10.20-11.578.31-12.759.92-11.02
87.2
90.781.543.241.655.9%.5
84.169.076.357.169.891.0
73.295.489.3
97.4
96.883.792.292.4
100.096.8
94.096.599.491.998.6
90.296.798.1
63.8
64.381.442.640.651.4
63.667.172.649.862.766.2
66.493.452.0
10.5
17.2.1.0
.919.8
4.71.4.9
2.33.95.4
.621.311.3
11.2
15.13.2
.06.39.6
15.2
6.58.42.7
10.04.76.6
1.71.6
13.2
9.0
26.2.0.0.0.0
2.0.8.6
1.03.61.5
53'.72.9
For notes see end of table.

A80 Special Tables • September 1988
4.23 TERMS OF LENDING AT COMMERCIAL BANKS Survey of Loans Made, November 2-6, 1987*1—Continued
C. Loans to Farmers14
Characteristic
Size class of loans (thousands)
All sizes $1-9 $10-24 $25-49 $50-99 $100-249 $250and over
ALL BANKS
1 Amount of loans (thousands of dollars)..2 Number of loans .3 Weighted average maturity (months)3 . . .
4 Weighted average interest rate (percent)'5 Standard e r r o r . . ,6 Interquartile rante6
By purpose of loan7 Feeder livestock8 Other livestock9 Other current operating expenses
10 Farm machinery and equipment11 Farm real estate12 Other
Percentage of amount of loans13 With floating rates14 Made under commitment
By purpose of loan15 Feeder livestock16 Other livestock17 Other current operating expenses18 Farm machinery and equipment19 Farm real estate20 Other
LAROE BANKS'*
1 Amount of loans (thousands of dollars)..2 Number of loans3 Weighted average maturity (months)3 . . .
4 Weighted average interest rate (percent)4
5 Standard error5 . . ,6 Interquartile rante6
By purpose of loan7 Feeder livestock8 Other livestock9 Other current operating expenses
10 Farm machinery and equipment11 Farm real estate12 Other
Percentage of amount of loans13 With floating rates14 Made under commitment
By purpose of loan15 Feeder livestock16 Other livestock17 Other current operating expenses18 Farm machinery and equipment19 Farm real estate20 Other
OTHER BANKS'4
1 Amount of loans (thousands of dollars)..2 Number of loans3 Weighted average maturity (months)9 • •.
4 Weighted average interest rate (percent)4
5 Standard error 5 . . ,6 Interquartile rante'
By purpose of loan7 Feeder livestock8 Other livestock9 Other current operating expenses
10 Farm machinery and equipment11 Farm real estate
12 Other
$1,125,17246,536
11.9
11.02.70
9.96-12.19
11.4210.6411.3112.0612.049.14
56.156.4
34.87.4
31.47.32.8
16.2
$365,6384,238
4.4
9.68.68
8.05-10.65
10.2710.6110.4111.2210.358.72
67.795.4
23.64.2
27.31.21.5
42.1
$759,53342,298
14.6
11.67.15
11.29-12.36
11.7510.6411.6612.1112.40
11.41
$101,97628,240
6.9
12.00.35
11.36-12.41
11.8012.2411.9213.1411.9311.99
51.041.4
20.66.2
60.36.41.55.0
$7,3051,698
6.8
11.23.27
10.75-11.63
11.0511.6511.2411.1712.2811.01
86.878.3
19.24.1
58.23.23.3
12.0
$94,67126,541
6.9
12.06.22
11.50-12.45
11.8612.2711.9713.22
12.19
$145,2229,868
8.2
11.65.49
10.94-12.25
11.4611.5211.8711.2012.3311.18
41.140.3
22.95.1
54.39.81.46.5
$14,3479148.0
10.94.47
10.38-11.46
10.80
10.97**
10.82
93.984.4
17.6
58.0
15.1
$130,8758,954
8.3
11.73.11
10.95-12.31
11.51
11.9811.19
11.29
$137,3644,006
8.0
11.37.37
10.65-12.10
11.3211.3611.53
11.04
46.236.8
45.57.3
29.4
7.2
$20,0785937.4
10.70.31
10.00-11.35
10.7410.7410.68
10.73
93.587.8
21.47.3
47.6
19.2
$117,2873,413
8.1
11.48.19
11.30-12.19
^11.36
11.79
$167,7302.488
7.0
11.47.34
11.01-12.19
11.73
11.35
*
11.24
53.851.0
48.2
30.0
6.9
$25,6073818.0
10.70.18
10.43-11.04
10.80*
10.63*
10.73
97.792.1
19.7
55.7
16.2
$142,1222,107
6.9
11.61.28
11.29-12.19
11.79*
11.64
$222,0131,45435.5
11.51.57
10.78-12.22
11.5110.6111.29
10.67
63.851.6
46.45.623.0
6.0
$60,1523889.1
10.46.50
9.88-10.92
10.49*
10.44
10.6494.889.3
34.5
36.7
16.3
$161,8611,06641.8
11.90.27
11.41-12.75
11.76
$350,8674814.8
9.821.09
8.05-10.65
11.03
9.99
*
8.40
63.980.8
26.1
19.9**37.8
$238,1502632.6
9.17.70
8.05-9.98
10.04*10.06*8.40
53.399.2
17.4*
55.8
For notes see end of table.

Financial Markets A81
4.23—ContinuedC. Loans to Farmers14—Continued
Characteristic
Percentage of amount of loans13 With floating rates . . . . .
16 Other livestock
20 Other
Size class of loans (thousands)
All sizes
50.537.6
40.28.9
33.410.23.4
3.7
$1-9
48.238.6
20.76.3
60.56.7
4.4
$10-24
35.335.5
23.4#
53.910.6
*
5.5
$25-49
38.128.1
49.7*
26.2
*
*
$50-99
45.943.6
53.3*
25.3**
*
$100-249
52.337,6
50.8****
*
$250and over
* Data for November 2-6,1987 should have appeared in the May 1988 issue butmore current data were published in that issue.
Fewer than 10 sample loans.1. The survey of terms of bank lending to business collects data on gross loan
extensions made during the first full business week in the mid-month of eachquarter by a sample o f 340 commercial banks of all sizes. A subsample of 250banks also report loans to farmers. The sample data are blown up to estimate thelending terms at all insured commercial banks during that week. The estimatedterms of bank lending are not intended for use in collecting the terms of loansextended over the entire quarter or residing in the portfolios of those banks.Construction and land development loans include both unsecured loans and loanssecured by real estate. Thus, some of the construction and land developmentloans would be reported on the statement of condition as real estate loans and theremainder as business loans. Mortgage loans, purchased loans, foreign loans, andloans of less than $1,000 are excluded from the survey.
As of Dec. 31,1987, assets of most of the large banks were at least $6.0 billion.For all insured banks total assets averaged $220 million.
2. Beginning with the August 1986 survey respondent banks provide informa-tion on the type of base rate used to price each commercial and industrial loanmade during the survey week. This reporting change is reflected in the newcolumn on the most common base pricing rate in table A and footnote 13 fromtable B.
3. Average maturities are weighted by loan size and exclude demand loans.4. Effective (compounded) annual interest rates are calculated from the stated
rate and other terms of the loan and weighted by loan size.5. The chances are about two out of three that the average rate shown would
differ by less than this amount from the average rate that would be found byacomplete survey of lending at all banks.
6. The interquartile range shows the interest rate range that encompasses themiddle 50 percent of the total dollar amount of loans made.
7. The most common base rate is that rate used to price the largest dollarvolume of loans. Base pricing rates include the prime rate (sometimes referred toas a bank's "basic" or "reference" rate); the federal funds rate; domestic moneymarket rates other than the federal funds rate; foreign money market rates', andother base rates not included in the foregoing classifications.
8. Overnight loans are loans that mature on the following business day.9. Demand loans have no stated date of maturity.10. Nominal (not compounded) annual interest rates are calculated from survey
data on the stated rate and other terms of the loan and weighted by loan size.11. The prime rate reported by each bank is weighted by the volume of loans
extended and then averaged.12. The proportion of loans made at rates below prime may vary substantially
from the proportion of such loans outstanding in banks' portfolios.13. 58.5 percent of construction and land development loans were priced
relative to the prime rate.14. Among banks reporting loans to farmers (Table C), most "large banks"
(survey strata 1 to 3) had over $600 million in total assets, and most "other banks"(survey strata 4 to 6) had total assets below $600 million.
The survey of terms of bank lending to fanners now includes loans secured byfarm real estate. In addition, the categories describing the purpose of farm loanshave now been expanded to include purchase or improve farm real estate." (nprevious surveys, the purpose of such loans was reported as "other."

A82 Special Tables • September 1988
4.30 ASSETS AND LIABILITIES of U.S. Branches and Agencies of Foreign Banks, March 31, 1988Millions of dollars
All states2
Totalincluding
IBFsIBFsonly5
New York
Totalincluding
IBFsIBFsonly3
California
Totalincluding
IBFsIBFsonly3
Illinois
Totalincluding
IBFsIBFsonly3
1 Total assets*
2 Claims on nonrelated parties3 Cash and balances due from depository institutions4 Cash items in process of collection and unposted
debits5 Currency and coin (U.S. and foreign)6 Balances with depository institutions in United States7 U.S. branches and agencies of other foreign banks
(including their IBFs)8 Other depository institutions in United States
(including their IBFs)9 Balances with banks in foreign countries and with
foreign central banks10 Foreign branches of U.S. banks11 Other banks in foreign countries and foreign central
banks12 Balances with Federal Reserve Banks
13 Total securities and loans
14 Total securities, book value15 U.S. Treasury16 Obligations of U.S. government agencies and
corporations17 Other bonds, notes, debentures and corporate stock
(including state and local securities)
18 Federal funds sold and securities purchased underagreements to resell
19 U.S branches and agencies of other foreign banks . . . .20 Commercial banks in United States21 Other
22 Total loans, gross23 Less: Unearned income on loans24 Equals: Loans, net
Total loans, gross, Ay category25 Real estate loans26 Loans to depository institutions27 Commercial banks in United States (including IBFs) .28 U.S. branches and agencies of other foreign banks .29 Other commercial banks in United States30 Other depository institutions in United States
(including IBFs)31 Banks in foreign countries32 Foreign branches of U.S. banks33 Other banks in foreign countries34 Other financial institutions
35 Commercial and industrial loans36 U.S. addressees (domicile)37 Non-U.S. addressees (domicile)38 Acceptances of other banks39 U.S. banks40 Foreign banks41 Loans to foreign governments and official institutions
(including foreign central banks)42 Loans for purchasing or carrying securities
(secured and unsecured)43 All other loans
44 All other assets45 Customers' liability on acceptances outstanding46 U.S. addressees (domicile)47 Son-V.S. addressees (domicile)48 Other assets including other claims on nonrelated
parties49 Net due from related depository institutions3
50 Net due from head office ana other related depositoryinstitutions'
51 Net due from establishing entity, head offices,and other related depository institutions5
52 Total liabilities4
53 Liabilities to nonrelated parties
460,746
419,609106,193
73125
57,318
50,374
6,94446,163
1,743
44,4201,956
254,595
34,4046,632
3,763
24,008
14,7299,3001,8953,534
220,430238
220,191
15,02664,82133,33027,5725,758
7531,416
77530,6415,898
110,69288,63822,054
914278636
18,016
2,8132,250
44,09227,77517,21310,563
16,31641,137
41,137
n.a.
460,746
402,754
222,471
187,73688,066
0n.a.
42,886
40,234
2,652
45,1801,664
43,516n.a.
90,892
9,804n.a.
n.a.
9,804
2,3101,527550232
81,195107
81,088
17044,73315,61814,622
996
1629,099
65828,4411,025
18,8511,65917,192
10010
16,151
30226
6,467n.a.n.a.n.a.
6,46734,735
n.a.
34,735
222,471
198,831
335,779
308,73186,773
1945,530
39,920
5,610
38,7751,469
37,3061,762
175,892
27,6036,254
3,724
17,624
13,1767,9761,7773,424
148,414125
148,289
7,66646,97822,97317,7605,212
1123,994
67423,3203,897
69,30451,45217,852
733217517
15,855
2,2641,717
32,88919,71610,0829,634
13,17327,048
27,048
n.a.
335,779
306,753
173,744
148,44371,581
0n.a.
33,661
31,254
2,407
37,9201,404
36.516n.a.
70,124
7,436n.a.
n.a.
7,436
1,676948550178
62,73244
62,688
13531,0459,0368,297739
722,002
55821,445
932
16,0761,61214,464
505
14,362
27151
5,061n.a.n.a.n.a.
5,06125,301
n.a.
25,301
173,744
157,376
71,539
62,58210,415
22
6,390
5,898
492
3,952107
3,84549
42,213
4,391179
38
4,174
1,0179602334
37,923102
37,822
3,21812,8967,9607,560400
154,920
464,874841
19,09716,4042,69414941108
1,074
513135
8,9386,8776,199678
2,0618,957
8,957
n.a.
71,539
64,509
32,643
26,4469,716
0n.a.5,774
5,647
127
3,943106
3,837n.a.
15,222
1,997n.a.
n.a.
1,997
44944900
13,28763
13,225
2910,0755,3045,133172
04,771
464,726
47
2,05445
2,00900
1,027
055
1,058n.a.n.a.n.a.
1,0586,197
n.a.
6,197
32,643
28,940
30,208
30,2086,713
42
4,274
3,682
5912,378112
2,26755
21,768
1,294129
0
1,166
81451620
20,4806
20,473
2,0043,4502,1552,047109
251,270
551,215751
13,80313,337
466505
228
0238
1,64687484133
7720
n.a.
30,208
17,538
9,316
8,9185,269
0n.a.2,914
2,829
85
2,355107
2,248n.a.
3,322
261n.a.
n.a.
261
23220
3,0610
3,061
2,4271,1831,098
85
01,244
551,189
28
3910
391505
210
00
304n.a.n.a.n.a.
304398
n.a.
398
9,316
6,253

U.S. Branches and Agencies A83
4.30—ContinuedMillions of dollars
Item
All states2
Totalexcluding
IBFs
IBFsonly'
New York
Totalexcluding
IBFsIBFsonly3
California
Totalexcluding
IBFs
IBFsonly3
Illinois
Totalexcluding
IBFs
IBFsonly3
54 Total deposits and credit balances55 Individuals, partnerships, and corporations56 U.S. addressees (domicile)57 Non-U.S. addressees (domicile)58 Commercial banks in United States (including IBFs)59 U.S. branches and agencies of other foreign banks60 Other commercial banks in United States61 Banks in foreign countries62 Foreign branches of U.S. banks63 Other banks in foreign countries64 Foreign governments and official institutions
(including foreign central banks)65 All other deposits and credit balances66 Certified and official checks
67 Transaction accounts and credit balances(excluding IBFs)
68 Individuals, partnerships, and corporations69 U.S. addressees (domicile)70 Non-U.S. addressees (domicile)71 Commercial banks in United States (including IBFs)72 U.S. branches and agencies of other foreign banks73 Other commercial banks in United States74 Banks in foreign countries75 Foreign branches of U.S. banks76 Other banks in foreign countries77 Foreign governments and official institutions
(including foreign central banks)78 All other deposits and credit balances79 Certified and official checks
80 Demand deposits (included in transaction accountsand credit balances)
81 Individuals, partnerships, and corporations82 U.S. addressees (domicile)83 Non-U.S. addressees (domicile)84 Commercial banks in United States (including IBFs)85 U.S. branches and agencies of other foreign banks86 Other commercial banks in United States87 Banks in foreign countries88 Foreign branches of U.S. banks89 Other banks in foreign countries . . . '90 Foreign governments and official institutions
(including foreign central banks)91 All other deposits and credit balances92 Certified and official checks
93 Non-transaction accounts (including MMDAs,excluding IBFs)
94 Individuals, partnerships, and corporations95 U.S. addressees (domicile)% Non-U.S. addressees (domicile)97 Commercial banks in United States (including IBFs)98 U.S. branches and agencies of other foreign banks99 Other commercial banks in United States
100 Banks in foreign countries101 Foreign branches of U.S. banks102 Other banks in foreign countries103 Foreign governments and official institutions
(including foreign central banks)104 All other deposits and credit balances
105 IBF deposit liabilities106 Individuals, partnerships, and corporations107 U.S. addressees (domicile)108 Non-U.S. addressees (domicile)109 Commercial banks in United Stales (including IBFs)110 U.S. branches and agencies of other foreign banks111 Other commercial banks in United States112 Banks in foreign countries113 Foreign branches of U.S. banks114 Other banks in foreign countries115 Foreign governments and official institutions
(including foreign central banks)116 All other deposits and credit balances
60,68746,95936,23010,7298,7403,0455,6952,078299
1,779
1,103909899
6,3603,7662,2791,48721663152990106885
362127
5,4373,1921,9451,24711610
10582980749
31487899
54,32743,19333,9519,2418,5242,9825,5421,088193894
741782
152,48212,984
9312,89251,48342,7458,73977,9247,65570,269
10,02961
n.a.
152,48212,984
9312,89251,48342,7458,73977,9247,65570,269
10,02961
50,34937,52330,5386,9848,1702,5705,5991,985299
1,686
990846836
5,2092,8481,7591,08920363140923106818
284115836
4,5962,5741,589985105109576480684
23680836
45,14034,67528,7795,8967,9672,5085,4601,061193
706731
135,7888,673
738,60045,19637,2027,99472,1706,73665,434
9,68961
n.a.
135,7888,673
738,60045,19637,2027,99472,1706,73665,434
9,68961
2,1362,028550
1,47821
19019
174723
26322917258100909
23
1781451024300080
1,8731,799378
1,42021110010
15
47
8,5304520
4524,3283,847481
3,664551
3,113
860
8,5304520
4524,3283,847481
3,664551
3,113
860
2,9312,3722,16920353947366101
2215
2171971934000101
2115
202182179400010I
2115
2,7152,1751,97620053947366000
01
3,144461828
1,5151,301215
1,552281
1,271
300
n.a.
3,144461828
1,5151,301215
1,552281
1,271
300
For notes see end of table.

A84 Special Tables D September 1988
4.30 ASSETS AND LIABILITIES of U.S. Branches and Agencies of Foreign Banks, March 31, 19881—ContinuedMillions of dollars
Item
All states2
Totalincluding
IBFs
IBFsonly3
New York
Totalincluding
IBPs
IBFsonly3
California
Totalincluding
IBFs
IBFsonly3
Illinois
Totalincluding
IBFs
IBFsonly3
117 Federal funds purchased and securities sold underagreements to repurchase
118 U.S. branches and agencies of other foreign banks . . .119 Other commercial banks in United States120 Other121 Other borrowed money122 Owed to nonrelated commercial banks in United States
(including IBFs)123 Owed to U.S. offices of nonrelated U.S. banks124 Owed to U.S. branches and agencies of
nonrelated foreign banks123 Owed to nonrelated banks in foreign countries126 Owed to foreign branches of nonrelated U.S. banks . .127 Owed to foreign offices of nonrelated foreign banks.. .128 Owed to others
129 All other liabilities130 Branch or agency liability on acceptances executed
and outstanding131 Other liabilities to nonrelated parties
132 Net due to related depository institutions3
133 Net due to head office and other relateddepository institutions3
134 Net due to establishing entity, head office, and otherrelated depository institutions3
MEMO133 Non-interest bearing balances with commercial banks
in United States136 Holding of commercial paper included in total loans . . . .137 Holding of own acceptances included in commercial
and industrial loans138 Commercial and industrial loans with remaining maturity
of one year or less139 Predetermined interest rates140 Floating interest rates141 Commercial and industrial loans with remaining maturity
of more than one year142 Predetermined interest rates143 Floating interest rates
46,9449,781
20,39416,76998,204
64,27327,105
37,16820,5422,767
17,77513,389
44,438
31,69512,743
57,992
57,992
1,490628
3,033
61,34938,96122,388
49,34316,14233,201
2,393893386
1,11438,421
16,6012,534
14,06719,8172,686
17,1312,003
5,535
n.a.
5,535
23,640
n.a.
23,640
23
34,8907,060
12,89914,93153,263
33,13616,623
16,51310,2241,0449,1809,904
32,463
21,75410,708
29,026
29,026
1,241
437
1,876
35,48621,40814,078
33,81810,15023,668
1,516355345816
15,573
4,094719
3,3759,611967
8,6441,868
4,499
n.a.4,499
16,368
n.a.
16,368
8,6742,2165,1201,337
35,199
24,7177,592
17,1267,8921,4296,4642,590
9,969
8,6451,324
7,030
7,030
140113
850
11,4578,0283,429
7,6403,550
68846141186
18,953
11,0101,419
9,5917,8631,4296,434
80
769
n.a.769
3,704
n.a.
3,704
2,827352
2,107367
7,232
4,5162,061
2,4551,951248
1,703765
1,403
893510
12,670
12,670
5170
138
9,1086,2772,831
4,6951,8062,889
6500
652,829
860106
7541,923248
1,67545
216
n.a.216
3,063
n.a.
3,063

U.S. Branches and Agencies A85
4.30—ContinuedMillions of dollars
Item
144 Components of total nontransaction accounts,included in total deposits and credit balances ofnontransactional accounts, including IBFs
145 Time CDs in denominations of $100,000 or more146 Other time deposits in denominations of $100,000
or more147 Time CDs in denominations of $100,000 or more
with remaining maturity of more than
148 Market value of securities held149 Immediately available ftinds with a maturity greater than
one day included in other borrowed money
150 Number of reports filed*
All states1
Totalexcluding
IBFs
70,84140,316
9,890
20,636
IBFsonly'
iAll states2
Totalincluding
IBFs
32,809
59,437
510
IBFsonly3
9,388
n.a.
New York
Totalexcluding
IBFs
61,96233,703
8,838
19,422
IBFsonly'
INew York
Totalincluding
IBFs
26,473
30,748
231
IBFsonly3
7,221
n.a.
California
Totalexcluding
IBFs
1,6581,077
518
64
IBFsonly3
}California
Totalincluding
IBFs
4,012
24,608
124
IBFsonly3
1,829
n.a.
Illinois
Totalexcluding
IBFs
2,9352,073
393
470
IBFsonly'
1Illinois
Totalincluding
IBFs
1,229
2,775
51
IBFsonly3
228
n.a.
_ . . . d o n the quarterly form FFIEC 002,"Report of Assets and Liabilities of U.S. Branches and Agencies of ForeignBanks." Details may not add to totals because of rounding. This form was firstused for reporting data as of June 30,1980, and was revised as of December 31,1985. From November 1972 through May 1980, U.S. branches and agencies offoreign banks had filed a monthly FR 886a report. Aggregate data from that reportwere available through the Federal Reserve statistical release G. 11, last issued onJuly 10,1980. Data in this table and in the 0.11 tables are not strictly comparablebecause of differences in reporting panels and in deflnitions of balance sheetitems.
2. Includes the District of Columbia.3. Effective December 1981, the Federal Reserve Board amended Regulations
D and Q to permit banking offices located in the United States to operateInternational Banking Facilities (IBPs). As of December 31, 1985, data for IBFsare reported in a separate column. These data are either included in or excludedfrom the total columns as indicated in the headings. The notation "n.a." indicates
that no IBF data are reported for that item, either because the item is not aneligible IBF asset or liability or because that level of detail is not reported forIBFs. From December 1981 through September 1985, IBF data were included inall applicable items reported.
4. Total assets and total liabilities include net balances, if any, due from or dueto related banking institutions in the United States and in foreign countries (seefootnote 5). On the former monthly branch and agency report, available throughthe O.I 1 statistical release, gross balances were included in total assets and totalliabilities. Therefore, total asset and total liability figures in this table are notcomparable to those in the O.ll tables.
5. "Related banking institutions" includes the foreign head office and otherU.S. and foreign branches and agencies of the bank, the bank's parent holdingcompany, and majority-owned banking subsidiaries of the bank and of its parentholding company (including subsidiaries owned both directly and indirectly).
6. In some cases two or more offices of a foreign bank within the samemetropolitan area Ale a consolidated report.
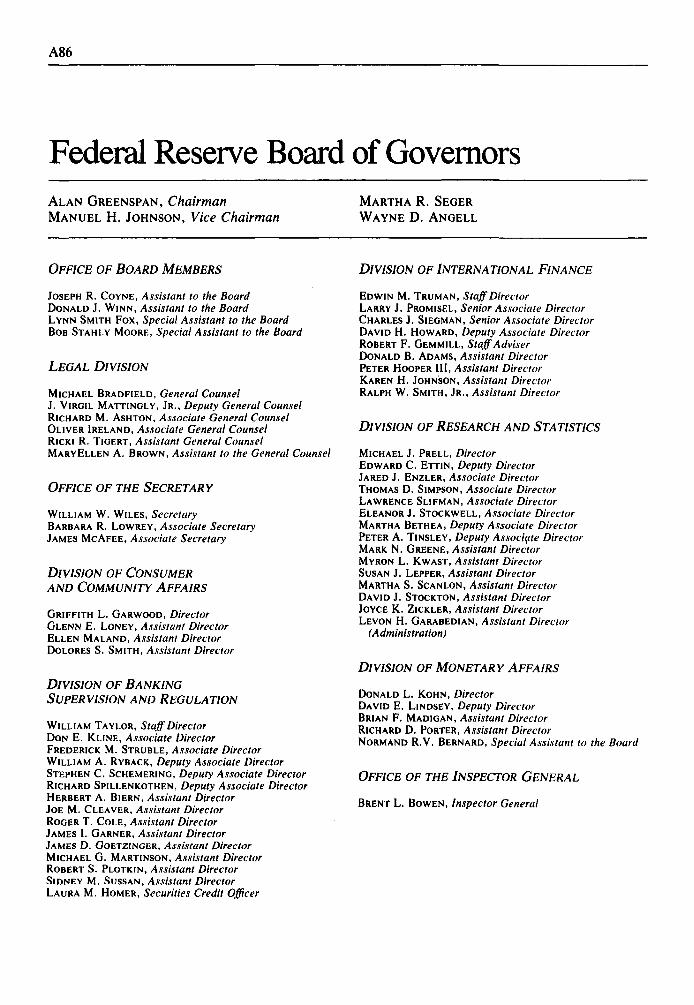
A86
Federal Reserve Board of GovernorsALAN GREENSPAN, ChairmanMANUEL H. JOHNSON, Vice Chairman
MARTHA R. SEGERWAYNE D. ANGELL
OFFICE OF BOARD MEMBERS
JOSEPH R. COYNE, Assistant to the BoardDONALD J. WINN, Assistant to the BoardLYNN SMITH FOX, Special Assistant to the BoardBOB STAHLY MOORE, Special Assistant to the Board
LEGAL DIVISION
MICHAEL BRADFIELD, General CounselJ. VIRGIL MATTINOLY, JR., Deputy General CounselRICHARD M. ASHTON, Associate General CounselOLIVER IRELAND, Associate General CounselRlCKl R. TIOERT, Assistant General CounselMARYELLEN A. BROWN, Assistant to the General Counsel
OFFICE OF THE SECRETARY
WILLIAM W. WILES, SecretaryBARBARA R. LOWREY, Associate SecretaryJAMES MCAFEE, Associate Secretary
DIVISION OF CONSUMERAND COMMUNITY AFFAIRS
GRIFFITH L. GARWOOD, DirectorGLENN E. LONEY, Assistant DirectorELLEN MALAND, Assistant DirectorDOLORES S. SMITH, Assistant Director
DIVISION OF BANKINGSUPERVISION AND REGULATION
WILLIAM TAYLOR, Staff DirectorDON E. KLINE, Associate DirectorFREDERICK M. STRUBLE, Associate DirectorWILLIAM A. RYBACK, Deputy Associate DirectorSTEPHEN C. SCHEMERINO, Deputy Associate DirectorRICHARD SPILLENKOTHEN, Deputy Associate DirectorHERBERT A. BIERN, Assistant DirectorJOE M. CLEAVER, Assistant DirectorROGER T. COLE, Assistant DirectorJAMES I. GARNER, Assistant DirectorJAMES D. GOETZINGER, Assistant DirectorMICHAEL G. MARTINSON, Assistant DirectorROBERT S. PLOTKIN, Assistant DirectorSIDNEY M. SUSSAN, Assistant DirectorLAURA M. HOMER, Securities Credit Officer
DIVISION OF INTERNATIONAL FINANCE
EDWIN M. TRUMAN, Staff DirectorLARRY J. PROMISEL, Senior Associate DirectorCHARLES J. SIEGMAN, Senior Associate DirectorDAVID H. HOWARD, Deputy Associate DirectorROBERT F. GEMMILL, Staff AdviserDONALD B. ADAMS, Assistant DirectorPETER HOOPER III, Assistant DirectorKAREN H. JOHNSON, Assistant DirectorRALPH W. SMITH, JR., Assistant Director
DIVISION OF RESEARCH AND STATISTICS
MICHAEL J. PRELL, DirectorEDWARD C. ETTIN, Deputy DirectorJARED J. ENZLER, Associate DirectorTHOMAS D. SIMPSON, Associate DirectorLAWRENCE SLIFMAN, Associate DirectorELEANOR J. STOCKWELL, Associate DirectorMARTHA BETHEA, Deputy Associate DirectorPETER A. TINSLEY, Deputy Associate DirectorMARK N. GREENE, Assistant DirectorMYRON L. KWAST, Assistant DirectorSUSAN J. LEPPER, Assistant DirectorMARTHA S. SCANLON, Assistant DirectorDAVID J. STOCKTON, Assistant DirectorJOYCE K. ZICKLER, Assistant DirectorLEVON H. GARABEDIAN, Assistant Director
(Administration)
DIVISION OF MONETARY AFFAIRS
DONALD L. KOHN, DirectorDAVID E. LINDSEY, Deputy DirectorBRIAN F. MADIGAN, Assistant DirectorRICHARD D. PORTER, Assistant DirectorNORMAND R.V. BERNARD, Special Assistant to the Board
OFFICE OF THE INSPECTOR GENERAL
BRENT L. BOWEN, Inspector General

and Official Staff
A87
H. ROBERT HELLEREDWARD W. KELLEY, JR.
JOHN P. LA WARE
OFFICE OFSTAFF DIRECTOR FOR MANAGEMENT
S. DAVID FROST, Staff DirectorEDWARD T. MULRENIN, Assistant Staff DirectorPORTIA W. THOMPSON, Equal Employment Opportunity
Programs Officer
DIVISION OF HUMAN RESOURCESMANAGEMENT
DAVID L. SHANNON, DirectorJOHN R. WEIS, Associate DirectorANTHONY V. DtGioiA, Assistant DirectorJOSEPH H. HAYES, JR., Assistant DirectorFRED HOROWITZ, Assistant Director
OFFICE OF THE CONTROLLER
GEORGE E. LIVINGSTON, ControllerSTEPHEN J. CLARK, Assistant Controller (Programs and
Budgets)DARRELL R. PAULEY, Assistant Controller (Finance)
DIVISION OF SUPPORT SERVICES
ROBERT E. FRAZIER, DirectorGEORGE M. LOPEZ, Assistant DirectorDAVID L. WILLIAMS, Assistant Director
OFFICE OF THE EXECUTIVE DIRECTOR FORINFORMATION RESOURCES MANAGEMENT
ALLEN E. BEUTEL, Executive DirectorSTEPHEN R. MALPHRUS, Associate Director
DIVISION OF HARDWARE AND SOFTWARESYSTEMS
BRUCE M. BEARDSLEY, DirectorTHOMAS C. JUDD, Assistant DirectorELIZABETH B. RIGGS, Assistant DirectorROBERT J. ZEMEL, Assistant Director
DIVISION OF APPLICATIONS DEVELOPMENT ANDSTATISTICAL SERVICES
OFFICE OF STAFF DIRECTOR FORFEDERAL RESERVE BANK ACTIVITIES
THEODORE E. ALLISON, Staff Director
DIVISION OF FEDERAL RESERVEBANK OPERATIONS
CLYDE H. FARNSWORTH, JR., DirectorELLIOTT C. MCENTEE, Associate DirectorDAVID L. ROBINSON, Associate DirectorC. WILLIAM SCHLEICHER, JR., Associate DirectorCHARLES W. BENNETT, Assistant DirectorJACK DENNIS, JR., Assistant DirectorEARL G. HAMILTON, Assistant DirectorJOHN H. PARRISH, Assistant DirectorLOUISE L. ROSEMAN, Assistant DirectorFLORENCE M. YOUNG, Adviser
WILLIAM R. JONES, DirectorDAY W. RADEBAUGH, Assistant DirectorRICHARD C. STEVENS, Assistant DirectorPATRICIA A. WELCH, Assistant Director

A88 Federal Reserve Bulletin D September 1988
Federal Open Market CommitteeFEDERAL OPEN MARKET COMMITTEE
MEMBERS
ALAN GREENSPAN, Chairman
WAYNE D. ANGELLROBERT P. BLACKROBERT P. FORRESTAL
H. ROBERT HELLERW. LEE HOSKINSMANUEL H. JOHNSON
E. GERALD CORRIOAN, Vice Chairman
EDWARD W. KELLEY, JR.ROBERT T. PARRYMARTHA R. SEOER
ROGER GUFFEYSILAS KEEHN
ALTERNATE MEMBERS
THOMAS C. MELZERFRANK E. MORRIS
JAMES H. OLTMAN
STAFF
DONALD L. KOHN, Secretary and EconomistNORMAND R.V. BERNARD, Assistant SecretaryMICHAEL BRADFIELD, General CounselERNEST T. PATRIKIS, Deputy General CounselMICHAEL J. PRELL, EconomistEDWIN M. TRUMAN, EconomistJOHN H. BEEBE, Associate EconomistJ. ALFRED BROADDUS, JR., Associate Economist
JOHN M. DAVIS, Associate EconomistRICHARD G. DAVIS, Associate EconomistDAVID E. LINDSEY, Associate EconomistCHARLES J. SIEGMAN, Associate EconomistTHOMAS D. SIMPSON, Associate EconomistLAWRENCE SLIFMAN, Associate EconomistSHEILA L. TSCHINKEL, Associate Economist
PETER D. STERNLIGHT, Manager for Domestic Operations, System Open Market AccountSAM Y. CROSS, Manager for Foreign Operations, System Open Market Account
FEDERAL ADVISORY COUNCIL
CHARLES T. FISHER, HI, President
BENNETT A. BROWN, Vice President
J. TERRENCE MURRAY, First DistrictWILLARD C. BUTCHER, Second DistrictSAMUEL A. MCCULLOUGH, Third DistrictTHOMAS H. O'BRIEN, Fourth DistrictFREDERICK DEANE, JR., Fifth DistrictBENNETT A. BROWN, Sixth District
CHARLES T. FISHER, III, Seventh DistrictDONALD N. BRANDIN, Eighth DistrictDEWALT H. ANKENY, Jr., Ninth DistrictF. PHILLIPS GILTNER, Tenth DistrictT. C. FROST, Eleventh DistrictPAUL HAZEN, Twelfth District
HERBERT V. PROCHNOW, Secretary
WILLIAM J. KORSVIK, Associate Secretary

A89
and Advisory CouncilsCONSUMER ADVISORY COUNCIL
STEVEN W. HAMM, Columbia, South Carolina, ChairmanEDWARD J. WILLIAMS, Chicago, Illinois, Vice Chairman
NAOMI G. ALBANESE, Greensboro, North CarolinaSTEPHEN BROBECK, Washington, D.C.EDWIN B. BROOKS, JR., Richmond, VirginiaJUDITH N. BROWN, Edina, MinnesotaMICHAEL S. CASSIDY, New York, New YorkBETTY TOM CHU, Arcadia, CaliforniaJERRY D. CRAFT, Atlanta, GeorgiaDONALD C. DAY, Boston, MassachusettsRICHARD B. DOBY, Denver, ColoradoRICHARD H. FINK, Washington, D.C.NEIL J. FOGARTY, Jersey City, New JerseySTEPHEN GARDNER, Dallas, TexasKENNETH A. HALL, Picayune, MississippiELENA G. HANOGI, Little Rock, Arkansas
ROBERT A. HESS, Washington, D.C.ROBERT J. HOBBS, Boston, MassachusettsRAMON E. JOHNSON, Salt Lake City, UtahROBERT W. JOHNSON, West Lafayette, IndianaA. J. (JACK) KING, Kalispell, MontanaJOHN M. KOLESAR, Cleveland, OhioALAN B. LERNER, Dallas, TexasRICHARD L. D. MORSE, Manhattan, KansasWILLIAM E. ODOM, Dearborn, MichiganSANDRA R. PARKER, Richmond, VirginiaSANDRA PHILLIPS, Pittsburgh, PennsylvaniaJANE SHULL, Philadelphia, PennsylvaniaRALPH E. SPURGIN, Columbus, OhioLAWRENCE WINTHROP, Portland, Oregon
THRIFT INSTITUTIONS ADVISORY COUNCIL
JAMIE J. JACKSON, Houston, Texas, PresidentGERALD M. CZARNECKI, Honolulu, Hawaii, Vice President
ROBERT S. DUNCAN, Hattiesburg, MississippiBETTY GREGG, Phoenix, ArizonaTHOMAS A. KINST, Hoffman Estates, IllinoisRAY MARTIN, LOS Angeles, CaliforniaJOE C. MORRIS, Emporia, Kansas
JOSEPH W. MOSMILLER, Baltimore, MarylandJANET M. PAVLISKA, Arlington, MassachusettsLouis H. PEPPER, Seattle, WashingtonWILLIAM G. SCHUETT, Milwaukee, WisconsinDONALD B. SHACKELFORD, Columbus, Ohio

A90
Federal Reserve Board Publications
Copies are available from PUBLICATIONS SERVICES,Mail Stop 138, Board of Governors of the Federal ReserveSystem, Washington, D.C. 20551. When a charge is indi-cated, payment should accompany request and be madepayable to the Board of Governors of the Federal ReserveSystem, P.O. Box 27531, Richmond, VA 23261-7531. Pay-ment from foreign residents should be drawn on a U.S. bank.Stamps and coupons are not accepted.
THE FEDERAL RESERVE SYSTEM—PURPOSES AND FUNC-TIONS. 1984. 120 pp.
ANNUAL REPORT.ANNUAL REPORT: BUDGET REVIEW, 1986-87.FEDERAL RESERVE BULLETIN. Monthly. $20.00 per year or
$2.00 each in the United States, its possessions, Canada,and Mexico; 10 or more of same issue to one address,$18.00 per year or $1.75 each. Elsewhere, $24.00 peryear or $2.50 each.
BANKING AND MONETARY STATISTICS. 1914-1941. (Reprintof Part I only) 1976. 682 pp. $5.00.
ANNUAL STATISTICAL DIGEST1974-78. 1980. 305 pp. $10.00 per copy.1981. 1982. 239 pp. $ 6.50 per copy.1982. 1983. 266 pp. $ 7.50 per copy.1983. 1984. 264 pp. $11.50 per copy.1984. 1985. 254 pp. $12.50 per copy.1985. 1986. 231 pp. $15.00 per copy.1986. 1987. 288 pp. $15.00 per copy.
HISTORICAL CHART BOOK. Issued annually in Sept. $1.25each in the United States, its possessions, Canada, andMexico; 10 or more to one address, $1.00 each. Else-where, $1.50 each.
SELECTED INTEREST AND EXCHANGE RATES—WEEKLY SE-RIES OF CHARTS. Weekly. $24.00 per year or $.60 each inthe United States, its possessions, Canada, and Mexico;10 or more of same issue to one address, $22.50 per yearor $.55 each. Elsewhere, $30.00 per year or $.70 each.
THE FEDERAL RESERVE ACT, and other statutory provisionsaffecting the Federal Reserve System, as amendedthrough April 20, 1983, with Supplements coveringamendments through August 1987. 576 pp. $7.00.
REGULATIONS OF THE BOARD OF GOVERNORS OF THE FED-ERAL RESERVE SYSTEM.
ANNUAL PERCENTAGE RATE TABLES (Truth in Lending—Regulation Z) Vol. I (Regular Transactions). 1969. 100pp. Vol. II (Irregular Transactions). 1969. 116 pp. Eachvolume $2.25; 10 or more of same volume to oneaddress, $2.00 each.
FEDERAL RESERVE MEASURES OF CAPACITY AND CAPACITYUTILIZATION. 1978. 40 pp. $1.75 each; 10 or more to oneaddress, $1.50 each.
THE BANK HOLDING COMPANY MOVEMENT TO 1978: ACOMPENDIUM. 1978. 289 pp. $2.50 each; 10 or more toone address, $2.25 each.
INTRODUCTION TO FLOW OF FUNDS. 1980.68 pp. $1.50 each;
10 or more to one address, $1.25 each.PUBLIC POLICY AND CAPITAL FORMATION. 1981. 326 pp.
$13.50 each.FEDERAL RESERVE REGULATORY SERVICE. Looseleaf; up-
dated at least monthly. (Requests must be prepaid.)Consumer and Community Affairs Handbook. $75.00 per
year.Monetary Policy and Reserve Requirements Handbook.
$75.00 per year.Securities Credit Transactions Handbook. $75.00 per year.The Payment System Handbook. $75.00 per year.Federal Reserve Regulatory Service. 3 vols. (Contains all
three Handbooks plus substantial additional material.)$200.00 per year.
Rates for subscribers outside the United States are asfollows and include additional air mail costs:
Federal Reserve Regulatory Service, $250.00 per year.Each Handbook, $90.00 per year.
THE U.S. ECONOMY IN AN INTERDEPENDENT WORLD: AMULTICOUNTRY MODEL, May 1984. 590 pp. $14.50 each.
WELCOME TO THE FEDERAL RESERVE.PROCESSING AN APPLICATION THROUGH THE FEDERAL RE-
SERVE SYSTEM. August 1985. 30 pp.INDUSTRIAL PRODUCTION—1986 EDITION. December 1986.
440 pp. $9.00 each.FINANCIAL FUTURES AND OPTIONS IN THE U.S. ECONOMY.
December 1986. 264 pp. $10.00 each.
CONSUMER EDUCATION PAMPHLETSShort pamphlets suitable for classroom use. Multiple copiesare available without charge.
Consumer Handbook on Adjustable Rate MortgagesConsumer Handbook to Credit Protection LawsFair Credit BillingFederal Reserve GlossaryA Guide to Business Credit and the Equal Credit Opportunity
ActGuide to Federal Reserve RegulationsHow to File A Consumer Credit ComplaintIf You Borrow To Buy StockIf You Use A Credit CardSeries on the Structure of the Federal Reserve System
The Board of Governors of the Federal Reserve SystemThe Federal Open Market CommitteeFederal Reserve Bank Board of DirectorsFederal Reserve BanksOrganization and Advisory Committees
A Consumer's Guide to Mortgage Lock-InsA Consumer's Guide to Mortgage ClosingsA Consumer's Guide to Mortgage Refinancing
A91
PAMPHLETS FOR FINANCIAL INSTITUTIONSShort pamphlets on regulatory compliance, primarily suit-able for banks, bank holding companies and creditors.
Limit of 50 copies
The Board of Directors' Opportunities in Community Rein-vestment
The Board of Directors' Role in Consumer Law ComplianceCombined Construction/Permanent Loan Disclosure and
Regulation ZCommunity Development Corporations and the Federal Re-
serveConstruction Loan Disclosures and Regulation ZFinance Charges Under Regulation ZHow to Determine the Credit Needs of Your CommunityRegulation Z: The Right of RescissionThe Right to Financial Privacy ActSignature Rules in Community Property States: Regulation BSignature Rules: Regulation BTiming Requirements for Adverse Action Notices: Regula-
tion BWhat An Adverse Action Notice Must Contain: Regulation BUnderstanding Prepaid Finance Charges: Regulation Z
STAFF STUDIES: Summaries Only Printed in theBulletin
Studies and papers on economic and financial subjects thatare of general interest. Requests to obtain single copies ofthe full text or to be added to the mailing list for the seriesmay be sent to Publications Services.
Staff Studies 115-125 are out of print.
114. MULTIBANK HOLDING COMPANIES: RECENT EVIDENCEON COMPETITION AND PERFORMANCE IN BANKINGMARKETS, by Timothy J. Curry and John T. Rose. Jan.1982. 9 pp.
126. DEFINITION AND MEASUREMENT OF EXCHANGE MAR-KET INTERVENTION, by Donald B. Adams and Dale W.Henderson. August 1983. 5 pp. Out of print.
127. U.S. EXPERIENCE WITH EXCHANGE MARKET INTER-VENTION: JANUARY-MARCH 1975, by Margaret L.Greene. August 1984. 16 pp. Out of print.
128. U.S. EXPERIENCE WITH EXCHANGE MARKET INTER-VENTION: SEPTEMBER 1977-DECEMBER 1979, by Mar-garet L. Greene. October 1984. 40 pp. Out of print.
129. U.S. EXPERIENCE WITH EXCHANGE MARKET INTER-VENTION: OCTOBER 1980-OcTOBER 1981, by MargaretL. Greene. August 1984. 36 pp.
130. EFFECTS OF EXCHANGE RATE VARIABILITY ON INTER-NATIONAL TRADE AND OTHER ECONOMIC VARIABLES:A REVIEW OF THE LITERATURE, by Victoria S. Farrellwith Dean A. DeRosa and T. Ashby McCown. January1984. Out of print.
131. CALCULATIONS OF PROFITABILITY FOR U.S. DOLLAR-DEUTSCHE MARK INTERVENTION, by Laurence R. Ja-cobson. October 1983. 8 pp.
132. TIME-SERIES STUDIES OF THE RELATIONSHIP BETWEENEXCHANGE RATES AND INTERVENTION: A REVIEW OFTHE TECHNIQUES AND LITERATURE, by Kenneth Ro-goff. October 1983. 15 pp.
133. RELATIONSHIPS AMONG EXCHANGE RATES, INTERVEN-TION, AND INTEREST RATES: A N EMPIRICAL INVESTI-
GATION, by Bonnie E. Loopesko. November 1983. Outof print.
134. SMALL EMPIRICAL MODELS OF EXCHANGE MARKETINTERVENTION: A REVIEW OF THE LITERATURE, byRalph W. Tryon. October 1983. 14 pp. Out of print.
135. SMALL EMPIRICAL MODELS OF EXCHANGE MARKETINTERVENTION: APPLICATIONS TO CANADA, GERMANY,AND JAPAN, by Deborah J. Danker, Richard A. Haas,Dale W. Henderson, Steven A. Symansky, and RalphW. Tryon. April 1985. 27 pp. Out of print.
136. THE EFFECTS OF FISCAL POLICY ON THE U.S. ECON-OMY, by Darrell Cohen and Peter B. Clark. January1984. 16 pp. Out of print.
137. THE IMPLICATIONS FOR BANK MERGER POLICY OFFINANCIAL DEREGULATION, INTERSTATE BANKING,AND FINANCIAL SUPERMARKETS, by Stephen A.Rhoades. February 1984. Out of print.
138. ANTITRUST LAWS, JUSTICE DEPARTMENT GUIDELINES,AND THE LIMITS OF CONCENTRATION IN LOCAL BANK-ING MARKETS, by James Burke. June 1984. 14 pp. Outof print.
139. SOME IMPLICATIONS OF FINANCIAL INNOVATIONS INTHE UNITED STATES, by Thomas D. Simpson andPatrick M. Parkinson. August 1984. 20 pp.
140. GEOGRAPHIC MARKET DELINEATION: A REVIEW OFTHE LITERATURE, by John D. Wolken. November 1984.38 pp. Out of print.
141. A COMPARISON OF DIRECT DEPOSIT AND CHECK PAY-MENT COSTS, by William Dudley. November 1984.15 pp. Out of print.
142. MERGERS AND ACQUISITIONS BY COMMERCIAL BANKS,1960-83, by Stephen A. Rhoades. December 1984. 30pp. Out of print.
143. COMPLIANCE COSTS AND CONSUMER BENEFITS OF THEELECTRONIC F U N D TRANSFER ACT: RECENT SURVEYEVIDENCE, by Frederick J. Schroeder. April 1985. 23pp. Out of print.
144. SCALE ECONOMIES IN COMPLIANCE COSTS FOR CON-SUMER CREDIT REGULATIONS: THE TRUTH IN LENDINGAND EQUAL CREDIT OPPORTUNITY LAWS, by GregoryE. Elliehausen and Robert D. Kurtz. May 1985. 10 pp.
145. SERVICE CHARGES AS A SOURCE OF BANK INCOME ANDTHEIR IMPACT ON CONSUMERS, by Glenn B. Canner andRobert D. Kurtz. August 1985. 31 pp. Out of print.
146. THE ROLE OF THE PRIME RATE IN THE PRICING OFBUSINESS LOANS BY COMMERCIAL BANKS, 1977-84, byThomas F. Brady. November 1985. 25 pp.
147. REVISIONS IN THE MONETARY SERVICES (DIVISIA) IN-DEXES OF THE MONETARY AGGREGATES, by Helen T.Fair and Deborah Johnson. December 1985. 42 pp.
148. THE MACROECONOMIC AND SECTORAL EFFECTS OF THEECONOMIC RECOVERY TAX ACT: SOME SIMULATIONRESULTS, by Flint Brayton and Peter B. Clark. Decem-ber 1985. 17 pp.
149. THE OPERATING PERFORMANCE OF ACQUIRED FIRMS INBANKING BEFORE AND AFTER ACQUISITION, by StephenA. Rhoades. April 1986. 32 pp.
150. STATISTICAL COST ACCOUNTING MODELS IN BANKING:A REEXAMINATION AND AN APPLICATION, by John T.Rose and John D. Wolken. May 1986. 13 pp.
151. RESPONSES TO DEREGULATION: RETAIL DEPOSIT PRIC-ING FROM 1983 THROUGH 1985, by Patrick I. Mahoney,Alice P. White, Paul F. O'Brien, and Mary M.McLaughlin. January 1987. 30 pp.
152. DETERMINANTS OF CORPORATE MERGER ACTIVITY: A
A92
REVIEW OF THE LITERATURE, by Mark J. Warshawsky.April 1987. 18 pp.
153. STOCK MARKET VOLATILITY, by Carolyn D. Davis andAlice P. White. September 1987. 14 pp.
154. THE EFFECTS ON CONSUMERS AND CREDITORS OF PRO-POSED CEILINGS ON CREDIT CARD INTEREST RATES, byGlenn B. Canner and James T. Fergus. October 1987. 26pp.
155. THE FUNDING OF PRIVATE PENSION PLANS, by Mark J.Warshawsky. November 1987. 25 pp.
156. INTERNATIONAL TRENDS FOR U.S. BANKS AND BANK-ING MARKETS, by James V. Houpt. May 1988. 47 pages.
REPRINTS OF BULLETIN ARTICLES
Most of the articles reprinted do not exceed 12 pages.
Limit of 10 copiesForeign Experience with Targets for Money Growth. 10/83.
Intervention in Foreign Exchange Markets: A Summary ofTen Staff Studies. 11/83.
A Financial Perspective on Agriculture. 1/84.Survey of Consumer Finances, 1983. 9/84.
Bank Lending to Developing Countries. 10/84.Survey of Consumer Finances, 1983: A Second Report.
12/84.Union Settlements and Aggregate Wage Behavior in the
1980s. 12/84.The Thrift Industry in Transition. 3/85.A Revision of the Index of Industrial Production. 7/85.Financial Innovation and Deregulation in Foreign Industrial
Countries. 10/85.Recent Developments in the Bankers Acceptance Market.
1/86.The Use of Cash and Transaction Accounts by American
Families. 2/86.Financial Characteristics of High-Income Families. 3/86.Prices, Profit Margins, and Exchange Rates. 6/86.Agricultural Banks under Stress. 7/86.Foreign Lending by Banks: A Guide to International and
U.S. Statistics. 10/86.Recent Developments in Corporate Finance. 11/86.Measuring the Foreign-Exchange Value of the Dollar. 6/87.Changes in Consumer Installment Debt: Evidence from the
1983 and 1986 Surveys of Consumer Finances. 10/87.U.S. International Transactions in 1987. 5/88.Home Equity Lines of Credit. 6/88.

A93
Index to Statistical TablesReferences are to pages A3-A85 although the prefix "A" is omitted in this index
ACCEPTANCES, bankers (See Bankers acceptances)Agricultural loans, commercial banks, 19, 20,74, 80Assets and liabilities (See also Foreigners)
Banks, by classes, 18-20Domestic finance companies, 37Federal Reserve Banks, 10Financial institutions, 26Foreign banks, U.S. branches and agencies, 21, 82-85Nonfinancial corporations, 36
AutomobilesConsumer installment credit, 40,41Production, 47, 48
BANKERS acceptances, 9, 23, 24Bankers balances, 18-20. (See also Foreigners)Bonds (See also U.S. government securities)
New issues, 34Rates, 24
Branch banks, 21, 55, 82-89Business activity, nonfinancial, 44Business expenditures on new plant and equipment, 36Business loans (See Commercial and industrial loans)
CAPACITY utilization, 46Capital accounts
Banks, by classes, 18Federal Reserve Banks, 10
Central banks, discount rates, 67Certificates of deposit, 24Commercial and industrial loans
Commercial banks, 16, 19, 70-72, 76-78, 82Weekly reporting banks, 19-21
Commercial banksAssets and liabilities, 18-20Commercial and industrial loans, 16, 18, 19,20, 21,
70-72, 76-78Consumer loans held, by type, and terms, 40, 41Loans sold outright, 19Nondeposit funds, 17Real estate mortgages held, by holder and property, 39Terms of lending, 70-75,76-81Time and savings deposits, 3
Commercial paper, 23, 24, 37Condition statements (See Assets and liabilities)Construction, 44, 49, 73, 79Consumer installment credit, 40,41Consumer prices, 44, 50Consumption expenditures, 51, 52Corporations
Nonfinancial, assets and liabilities, 36Profits and their distribution, 35Security issues, 34, 65
Cost of living (See Consumer prices)Credit unions, 26, 40. (See also Thrift institutions)Currency and coin, 18Currency in circulation, 4, 13Customer credit, stock market, 25
DEBITS to deposit accounts, 15Debt (See specific types of debt or securities)Demand deposits
Banks, by classes, 18-21
Demand deposits—ContinuedOwnership by individuals, partnerships, and
corporations, 22Turnover, 15
Depository institutionsReserve requirements, 8Reserves and related items, 3,4, 5,12
Deposits (See also specific types)Banks, by classes, 3, 18-20, 21Federal Reserve Banks, 4, 10Turnover, 15
Discount rates at Reserve Banks and at foreign centralbanks and foreign countries (See Interest rates)
Discounts and advances by Reserve Banks {See Loans)Dividends, corporate, 35
EMPLOYMENT, 45Eurodollars, 24
FARM mortgage loans, 39Federal agency obligations, 4, 9,10, 11, 31, 32Federal credit agencies, 33Federal finance
Debt subject to statutory limitation, and types andownership of gross debt, 30
Receipts and outlays, 28, 29Treasury financing of surplus, or deficit, 28Treasury operating balance, 28
Federal Financing Bank, 28, 33Federal funds, 6,17,19, 20, 21, 24, 28Federal Home Loan Banks, 33Federal Home Loan Mortgage Corporation, 33, 38, 39Federal Housing Administration, 33, 38, 39Federal Land Banks, 39Federal National Mortgage Association, 33, 38, 39Federal Reserve Banks
Condition statement, 10Discount rates (See Interest rates)U.S. government securities held, 4, 10,11, 30
Federal Reserve credit, 4, 5, 10, 11Federal Reserve notes, 10Federal Savings and Loan Insurance Corporation insured
institutions, 26Federally sponsored credit agencies, 33Finance companies
Assets ana liabilities, 37Business credit, 37Loans, 40, 41Paper, 23,24
Financial institutionsLoans to, 19, 20, 21Selected assets and liabilities, 26
Float, 4Flow of funds, 42, 43Foreign banks, assets and liabilities of U.S. branches and
agencies, 21, 76-79Foreign currency operations, 10Foreign deposits in U.S. banks, 4, 10, 19, 20Foreign exchange rates, 68Foreign trade, 54Foreigners
Claims on, 55, 57, 60, 61, 62, 64Liabilities to, 20, 54, 55, 57, 58, 63, 65, 66
A94
GOLDCertificate account, 10Stock, 4, 54
Government National Mortgage Association, 33, 38, 39Gross national product, 51
HOUSING, new and existing units, 49
INCOME, personal and national, 44, 51, 52Industrial production, 44, 47Installment loans, 40, 41Insurance companies, 26, 30, 39Interest rates
Bonds, 24Commercial banks, 70-75, 76-81Consumer installment credit, 41Federal Reserve Banks, 7Foreign central banks and foreign countries, 67Money and capital markets, 24Mortgages, 38Prime rate, 23
International capital transactions of United States, 53-67International organizations, 57, 58, 60, 63, 64Inventories, 51Investment companies, issues and assets, 35Investments (See also specific types)
Banks, by classes, 18, 19, 20, 21, 26Commercial banks, 3, 16, 18-20, 39Federal Reserve Banks, 10, 11Financial institutions, 26, 39
LABOR force, 45Life insurance companies (See Insurance companies)Loans (See also specific types)
Banks, by classes, 18—20Commercial banks, 3, 16, 18-20, 70-75, 76-81FederaJ Reserve Banks, 4, 5, 7, 10, 11Financial institutions, 26, 39Insured or guaranteed by United States, 38, 39
MANUFACTURINGCapacity utilization, 46Production, 46, 48
Margin requirements, 25Member banks (See also Depository institutions)
Federal funds and repurchase agreements, 6Reserve requirements, 8
Mining production, 48Mobile homes shipped, 49Monetary and credit aggregates, 3, 12Money and capital market rates, 24Money stock measures and components, 3, 13Mortgages (See Real estate loans)Mutual funds, 35Mutual savings banks (See Thrift institutions)
NATIONAL defense outlays, 29National income, 51
OPEN market transactions, 9
PERSONAL income, 52Prices
Consumer and producer, 44, 50Stock market, 25
Prime rate, 23Producer prices, 44, 50Production, 44, 47Profits, corporate, 35
REAL estate loansBanks, by classes, 16, 19, 20, 39
Real estate loans—ContinuedFinancial institutions, 26Terms, yields, and activity, 38Type of holder and property mortgaged, 39
Repurchase agreements, 6, 17, 19, 20, 21Reserve requirements, 8Reserves
Commercial banks, 18Depository institutions, 3, 4, 5, 12Federal Reserve Banks, 10U.S. reserve assets, 54
Residential mortgage loans, 38Retail credit and retail sales, 40, 41, 44
SAVINGFlow of funds, 42, 43National income accounts, 51
Savings and loan associations, 26, 39, 40, 42. (See alsoThrift institutions)
Savings banks, 26, 39, 40Savings deposits (See Time and savings deposits)Secunties (See also specific types)
Federal and federally sponsored credit agencies, 33Foreign transactions, 65New issues, 34Prices, 25
Special drawing rights, 4 ,10, 53, 54State and local governments
Deposits, 19,20Holdings of U.S. government securities, 30New security issues, 34Ownership of securities issued by, 19, 20, 26Rates on securities, 24
Stock market, selected statistics, 25Stocks (See also Securities)
New issues, 34Prices, 25
Student Loan Marketing Association, 33
TAX receipts, federal, 29Thrift institutions, 3. (See also Credit unions and Savings
and loan associations)Time and savings deposits, 3, 13, 17, 18, 19, 20, 21Trade, foreign, 54Treasury cash, Treasury currency, 4Treasury deposits, 4, 10, 28Treasury operating balance, 28
UNEMPLOYMENT, 45U.S. government balances
Commercial bank holdings, 18, 19, 20Treasury deposits at Reserve Banks, 4, 10, 28
U.S. government securitiesBank holdings, 18-20, 21, 30Dealer transactions, positions, and financing, 32Federal Reserve Bank holdings, 4, 10, 11, 30Foreign and international holdings and transactions, 10,
30,66Open market transactions, 9Outstanding, by type and holder, 26, 30Rates, 24
U.S. international transactions, 53-67Utilities, production, 48
VETERANS Administration, 38, 39
WEEKLY reporting banks, 19-21Wholesale (producer) prices, 44, 50
YIELDS (See Interest rates)
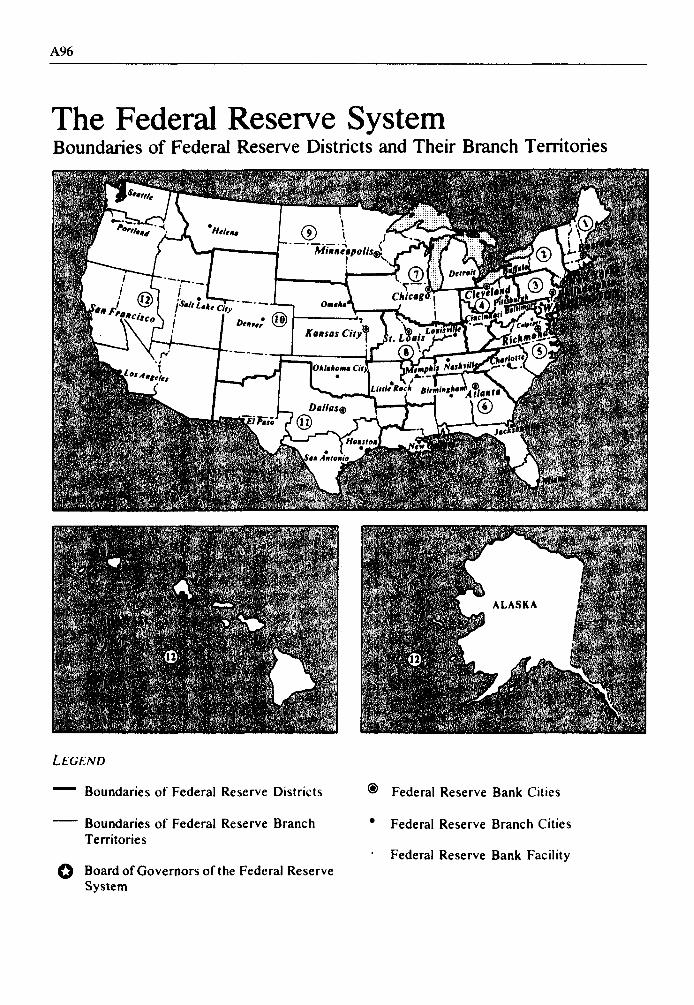
A96
The Federal Reserve SystemBoundaries of Federal Reserve Districts and Their Branch Territories
LEGEND
^~" Boundaries of Federal Reserve Districts
Boundaries of Federal Reserve BranchTerritories
Board of Governors of the Federal ReserveSystem
Federal Reserve Bank Cities
Federal Reserve Branch Cities
Federal Reserve Bank Facility
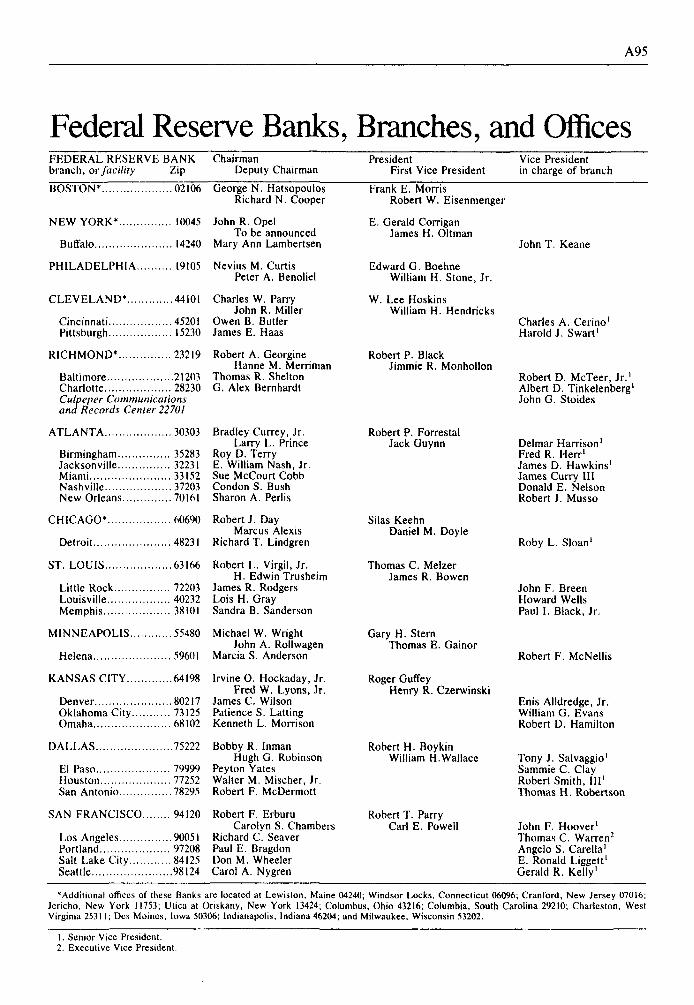
A95
Federal Reserve Banks, Branches, and OfficesFEDERAL RESERVE BANK Chairman President Vice Presidentbranch, or facility Zip Deputy Chairman First Vice President in charge of branchBOSTON* 02106 George N. Hatsopoulos Frank E. Morris
Richard N. Cooper Robert W. Eisenmenger
NEW YORK* 10045 John R. Opel E. Gerald CorriganTo be announced James H. Oltman
Buffalo 14240 Mary Ann Lambertsen John T. Keane
PHILADELPHIA 19105 Nevius M. Curtis Edward G. BoehnePeter A. Benoliel William H. Stone, Jr.
CLEVELAND* 44101 Charles W. Parry W. Lee HoskinsJohn R. Miller William H. Hendricks
Cincinnati 45201 Owen B. Butler Charles A. Cerino1
Pittsburgh 15230 James E. Haas Harold J. Swart1
RICHMOND* 23219 Robert A. Georgine Robert P. BlackHanne M. Merriman Jimmie R. Monhollon
Baltimore 21203 Thomas R. Shelton Robert D. McTeer, Jr.1Charlotte 28230 G. Alex Bernhardt Albert D. Tinkelenberg'Culpeper Communications John G. Stoidesand Records Center 22701
ATLANTA 30303 Bradley Currey, Jr. Robert P. ForrestalLarry L. Prince Jack Guynn Delmar Harrison'
Birmingham 35283 Roy D. Terry Fred R. Herr1
Jacksonville 32231 E. William Nash, Jr. James D. Hawkins1
Miami 33152 Sue McCourt Cobb James Curry IIINashville 37203 Condon S. Bush Donald E. NelsonNew Orleans 70161 Sharon A. Perlis Robert J. Musso
CHICAGO* 60690 Robert J. Day Silas KeehnMarcus Alexis Daniel M. Doyle
Detroit 48231 Richard T. Lindgren Roby L. Sloan1
ST. LOUIS 63166 Robert L. Virgil, Jr. Thomas C. MelzerH. Edwin Trusheim James R. Bowen
Little Rock 72203 James R. Rodgers John F. BreenLouisville 40232 Lois H. Gray Howard WellsMemphis 38101 Sandra B. Sanderson Paul I. Black, Jr.
MINNEAPOLIS 55480 Michael W. Wright Gary H. SternJohn A. Rollwagen Thomas E. Gainor
Helena 59601 Marcia S. Anderson Robert F. McNellis
KANSAS CITY 64198 Irvine O. Hockaday, Jr. Roger GuffeyFred W. Lyons, Jr. Henry R. Czerwinski
Denver 80217 James C. Wilson Enis Alldredge, Jr.Oklahoma City 73125 Patience S. Latting William G. EvansOmaha 68102 Kenneth L. Morrison Robert D. Hamilton
DALLAS 75222 Bobby R. Inman Robert H. BoykinHugh G. Robinson William H.Wallace Tony J. Salvaggio1
El Paso 79999 Peyton Yates Sammie C. ClayHouston 77252 Walter M. Mischer, Jr. Robert Smith, III1
San Antonio 78295 Robert F. McDermott Thomas H. Robertson
SAN FRANCISCO 94120 Robert F. Erburu Robert T. ParryCarolyn S. Chambers Carl E. Powell John F. Hoover1
Los Angeles 90051 Richard C. Seaver Thomas C. Warren2
Portland 97208 Paul E. Bragdon Angelo S. Carella1
Salt Lake City 84125 Don M. Wheeler E. Ronald Liggett'Seattle 98124 Carol A. Nygren Gerald R. Kelly1
•Additional offices of these Banks are located at Lewiston, Maine 04240; Windsor Locks, Connecticut 06096; Cranford, New Jersey 07016;Jericho, New York 11753; Utica at Oriskany, New York 13424; Columbus, Ohio 43216; Columbia, South Carolina 29210; Charleston, WestVirginia 25311; Des Moines, Iowa 50306; Indianapolis, Indiana 46204; and Milwaukee, Wisconsin 53202.
1. Senior Vice President.2. Executive Vice President.