Built Environment Journal - bej.uitm.edu.my · various stages of activities namely: planning and...
66
Built Environment Journal Faculty of Architecture, Planning and Surveying Volume 16 No. 1 Jan 2019 ISSN 1675-5022 The Impact of Firm Type, Size and Experience on Professional Services of Architectural Firms in Nigeria Aluko Olusola Raphael Omoniyi Sunday Samuel Dipeolu Adedotun Ayodele The Implementation of Corporate Social Responsibilities (CSR) Among G7 Contractors in Malaysia Hamimah Adnan Mas Elida Mohd Zahir Wan Norizan Wan Ismail Muhammad Redza Rosman Peat Fire Mapping Using GIS Based Multi-Criteria Decision Making: Study Area of Kuala Langat, Selangor Ainon Nisa Othman Hazrul Nizam Ismail Nafisah Khalid Maisarah Abdul Halim Noorain Mohamad Saraf Commuters’ Travel Characteristics, Modal Choice and Performance of Public Transport Options in Lagos, Nigeria Wale Alade Mobolaji Olaseni Olufemi Adeniji Impact of Coarse Aggregate on Compressive Strength of Concrete Jeriscot H. Quayson Zakari Mustapha
Transcript of Built Environment Journal - bej.uitm.edu.my · various stages of activities namely: planning and...
Built Environment
Journal Faculty of Architecture, Planning and Surveying
Volume 16 No. 1 Jan 2019 ISSN 1675-5022
The Impact of Firm Type, Size and Experience on Professional Services of Architectural Firms in Nigeria Aluko Olusola Raphael Omoniyi Sunday Samuel Dipeolu Adedotun Ayodele
The Implementation of Corporate Social Responsibilities (CSR) Among G7 Contractors in Malaysia Hamimah Adnan Mas Elida Mohd Zahir Wan Norizan Wan Ismail
Muhammad Redza Rosman Peat Fire Mapping Using GIS Based Multi-Criteria Decision Making: Study Area of Kuala Langat, Selangor Ainon Nisa Othman Hazrul Nizam Ismail Nafisah Khalid Maisarah Abdul Halim Noorain Mohamad Saraf Commuters’ Travel Characteristics, Modal Choice and Performance of Public Transport Options in Lagos, Nigeria Wale Alade
Mobolaji Olaseni Olufemi Adeniji
Impact of Coarse Aggregate on Compressive Strength of Concrete Jeriscot H. Quayson Zakari Mustapha
BUILT ENVIRONMENT JOURNAL (BEJ)
Chief Editor Professor Sr Datin Dr Hamimah Adnan, Universiti Teknologi MARA, Malaysia
Managing Editor Sr Dr Siti Aekbal Salleh, Universiti Teknologi MARA, Malaysia
Associate Editors
Assoc. Prof. TPr Dr Oliver Ling Hoon Leh,
Universiti Teknologi MARA, Malaysia
Ts Dr Rumaizah Mohd Nordin, Universiti
Teknologi MARA, Malaysia
Dr Salina Mohamad Ali, Universiti
Teknologi MARA, Malaysia
Ts Muhammad Redza Rosman, Universiti
Teknologi MARA, Malaysia
Editorial Advisory and Review Board
Professor Dr Dasimah Omar, Universiti
Teknologi MARA, Malaysia
Professor Dr Sabarinah Sheikh Ahmad,
Universiti Teknologi MARA, Malaysia
Professor TPr.Dr Jamalunlaili Abdullah,
Universiti Teknologi MARA, Malaysia
Professor Dr Hjh Hamidah Mohd Saman,
Universiti Teknologi MARA, Malaysia
Professor Ir Dr Azmi Ibrahim, Universiti
Teknologi MARA, Malaysia
Assoc. Prof. Dr Bon-Gang Hwang, National
University of Singapore, Singapore
Dr Heap-Yih Chong, Curtin University,
Australia
Dr Asrul Nasid Masrom, Universiti Tun
Hussain Onn Malaysia, Malaysia.
Dr Low Sui Pheng, National University of
Singapore, Singapore
Copyright © January 2019 by Faculty of Architecture, Planning and Surveying, Universiti Teknologi
MARA, 40450 Shah Alam, Selangor, Malaysia.
All rights reserved. No part of this publication may be reproduced, stored in a retrieval system, or
transmitted in any form or any means, electronic, mechanical, photocopying, recording or otherwise,
without prior permission, in writing, from the publisher.
Built Environment Journal is jointly published by Faculty of Architecture, Planning and Surveying and
UiTM Press, Universiti Teknologi MARA, 40450 Shah Alam, Selangor, Malaysia.
The views and opinion expressed therein and those of the individual authors and the publication of these
statements in the Built Environment Journal do not imply endorsement by the publisher or the editorial
staff. Copyright vested in Universiti Teknologi MARA. Written permission is required to reproduce any
part of this publication.
Built Environment
Journal Faculty of Architecture, Planning and Surveying
Volume 16 No. 1 Jan 2019 ISSN 1675-5022
1. The Impact of Firm Type, Size and Experience on Professional Services of Architectural Firms in Nigeria
Aluko Olusola Raphael
Omoniyi Sunday Samuel
Dipeolu Adedotun Ayodele
2. The Implementation of Corporate Social Responsibilities (CSR)
Among G7 Contractors in Malaysia Hamimah Adnan
Mas Elida Mohd Zahir
Wan Norizan Wan Ismail
Muhammad Redza Rosman
3. Peat Fire Mapping Using GIS Based Multi-Criteria Decision
Making: Study Area of Kuala Langat, Selangor Ainon Nisa Othman
Hazrul Nizam Ismail
Nafisah Khalid
Maisarah Abdul Halim
Noorain Mohamad Saraf
4. Commuters’ Travel Characteristics, Modal Choice and Performance of Public Transport Options in Lagos, Nigeria Wale Alade
Mobolaji Olaseni
Olufemi Adeniji
5. Impact of Coarse Aggregate on Compressive Strength of
Concrete Jeriscot H. Quayson
Zakari Mustapha


Built Environment Journal Vol. 16 No.1, 1 - 12, 2019
1
THE IMPACT OF FIRM TYPE, SIZE AND EXPERIENCE ON PROFESSIONAL SERVICES OF ARCHITECTURAL FIRMS
IN NIGERIA
Aluko Olusola Raphael, Omoniyi Sunday Samuel and Dipeolu Adedotun Ayodele
Department of Architecture, Olabisi Onabanjo University, Ibogun Campus. Ogun State,
Nigeria.
Corresponding Email: [email protected]
ABSTRACT
Clients have expressed dissatisfaction about services of
professionals as a result of poor quality of service and errors
in documentations resulting into overrunning project cost and
delayed completion. This study investigated the influences of
firms’ types, size of firms and experience of firms on provision
of professional services of Architectural firms in the process of meeting the expectations of the
client. Questionnaires was used to collect data for the study through random sampling. The
results of ANOVA showed that firm types had no significance on services across the stages of
service, firm size showed significance while the experience of the firm showed significance
across the inception and the design stages. Multiple regression analysis showed that the
variables cumulatively explained 3.9% (at p < 0.05) of the variance in the overall professional
services of architectural firms. Among the variables, only the firm size showed a significant
impact on the overall professional services with a p-value of 0.003. The firm type and
experience of firm had no impact on the overall professional services. The findings serve as a
guide to the clients in making choice of consultancy firms for their project, and as a guide to
the consultancy firms in order to remain competitive in the globalized industry.
Keywords: Architectural firms, Building Projects, Clients, Firms’ Characteristics,
Professional Services
INTRODUCTION
In construction project, interrelated roles are played by different service providers or group of
service providers. The industry has the uniqueness of incorporating these service providers or
professionals at different project phases in order to deliver the project (Hughes, 2012). Meanwhile,
clients in the construction industry have expressed dissatisfaction towards the service providers due to
inferior quality, rework, defects in completed projects, errors in design, errors in documentations
resulting into overrunning project cost and delayed completion (CIDB, 2011).
In most cases, these defects emanate from poor quality of service and incompetency of professionals
who are at the very core of documentation and management of the projects (Chang, Proverbs & Oduoza,
2006). Aiyetan, Smallwood and Shakantu (2014) identify conflicting design information, delays in
issuing revised drawings, dimensional inaccuracies as critical factors emanating from incompetency in
design and resulting into delays in project delivery time. Oyedele, Jayeoba, Kadiri, Folagbade, Tijani
and Salami (2015) emphasize further that these deficiencies have contributed to poor construction
quality performance resulting into client dissatisfaction in the Nigerian construction industry. Therefore,
the aim of this study is to assess the influence of firms’ types, size of firms and experience of firms on
provision of professional services of architectural firms in the building delivery process for the client.
Received: 10 Nov 2018
Reviewed: 30 Dec 2018
Accepted: 18 Jan 2019
Built Environment Journal
2
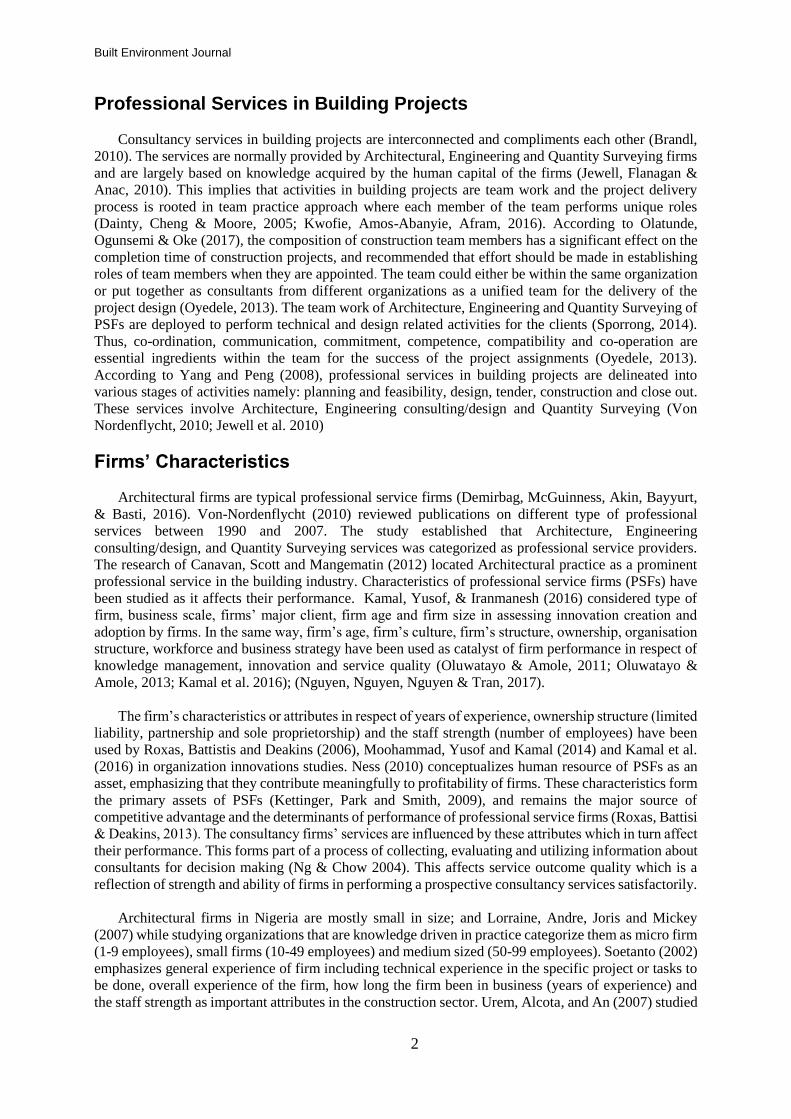
Professional Services in Building Projects
Consultancy services in building projects are interconnected and compliments each other (Brandl,
2010). The services are normally provided by Architectural, Engineering and Quantity Surveying firms
and are largely based on knowledge acquired by the human capital of the firms (Jewell, Flanagan &
Anac, 2010). This implies that activities in building projects are team work and the project delivery
process is rooted in team practice approach where each member of the team performs unique roles
(Dainty, Cheng & Moore, 2005; Kwofie, Amos-Abanyie, Afram, 2016). According to Olatunde,
Ogunsemi & Oke (2017), the composition of construction team members has a significant effect on the
completion time of construction projects, and recommended that effort should be made in establishing
roles of team members when they are appointed. The team could either be within the same organization
or put together as consultants from different organizations as a unified team for the delivery of the
project design (Oyedele, 2013). The team work of Architecture, Engineering and Quantity Surveying of
PSFs are deployed to perform technical and design related activities for the clients (Sporrong, 2014).
Thus, co-ordination, communication, commitment, competence, compatibility and co-operation are
essential ingredients within the team for the success of the project assignments (Oyedele, 2013).
According to Yang and Peng (2008), professional services in building projects are delineated into
various stages of activities namely: planning and feasibility, design, tender, construction and close out.
These services involve Architecture, Engineering consulting/design and Quantity Surveying (Von
Nordenflycht, 2010; Jewell et al. 2010)
Firms’ Characteristics
Architectural firms are typical professional service firms (Demirbag, McGuinness, Akin, Bayyurt,
& Basti, 2016). Von-Nordenflycht (2010) reviewed publications on different type of professional
services between 1990 and 2007. The study established that Architecture, Engineering
consulting/design, and Quantity Surveying services was categorized as professional service providers.
The research of Canavan, Scott and Mangematin (2012) located Architectural practice as a prominent
professional service in the building industry. Characteristics of professional service firms (PSFs) have
been studied as it affects their performance. Kamal, Yusof, & Iranmanesh (2016) considered type of
firm, business scale, firms’ major client, firm age and firm size in assessing innovation creation and
adoption by firms. In the same way, firm’s age, firm’s culture, firm’s structure, ownership, organisation
structure, workforce and business strategy have been used as catalyst of firm performance in respect of
knowledge management, innovation and service quality (Oluwatayo & Amole, 2011; Oluwatayo &
Amole, 2013; Kamal et al. 2016); (Nguyen, Nguyen, Nguyen & Tran, 2017).
The firm’s characteristics or attributes in respect of years of experience, ownership structure (limited
liability, partnership and sole proprietorship) and the staff strength (number of employees) have been
used by Roxas, Battistis and Deakins (2006), Moohammad, Yusof and Kamal (2014) and Kamal et al.
(2016) in organization innovations studies. Ness (2010) conceptualizes human resource of PSFs as an
asset, emphasizing that they contribute meaningfully to profitability of firms. These characteristics form
the primary assets of PSFs (Kettinger, Park and Smith, 2009), and remains the major source of
competitive advantage and the determinants of performance of professional service firms (Roxas, Battisi
& Deakins, 2013). The consultancy firms’ services are influenced by these attributes which in turn affect
their performance. This forms part of a process of collecting, evaluating and utilizing information about
consultants for decision making (Ng & Chow 2004). This affects service outcome quality which is a
reflection of strength and ability of firms in performing a prospective consultancy services satisfactorily.
Architectural firms in Nigeria are mostly small in size; and Lorraine, Andre, Joris and Mickey
(2007) while studying organizations that are knowledge driven in practice categorize them as micro firm
(1-9 employees), small firms (10-49 employees) and medium sized (50-99 employees). Soetanto (2002)
emphasizes general experience of firm including technical experience in the specific project or tasks to
be done, overall experience of the firm, how long the firm been in business (years of experience) and
the staff strength as important attributes in the construction sector. Urem, Alcota, and An (2007) studied
The Impact of Firm Type, Size and Experience on Professional Services of Architectural Firms in Nigeria
3
firm type or ownership status as publicly owned, privately owned, partnership or sole proprietorship.
Jewell, Flanagan, and Lu (2014) however states that many construction professional service firms in the
developed countries have evolved from a partnership and limited liability partnership, to either a
publicly-quoted firm, or a firm controlled by a Trust. Ownership through a Trust is when on employee
ownership is based on Trust rather than control by the Partners or (public) shareholders, which energized
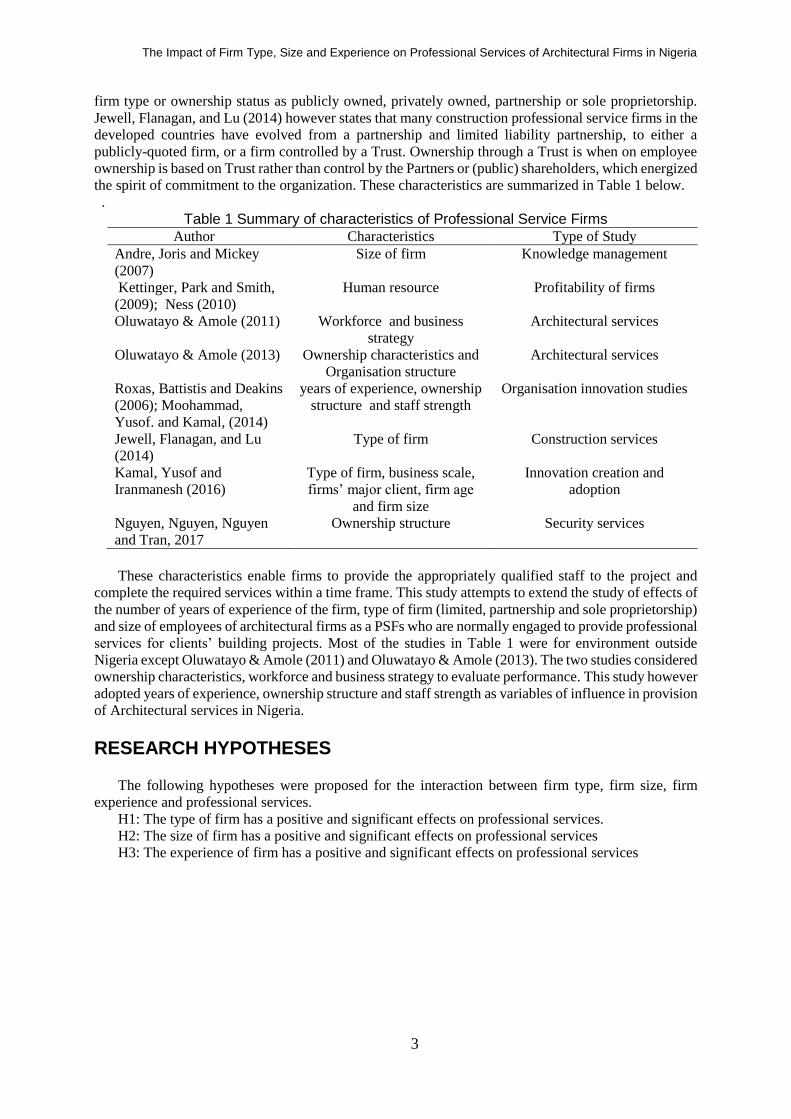
the spirit of commitment to the organization. These characteristics are summarized in Table 1 below.
.
Table 1 Summary of characteristics of Professional Service Firms
Author Characteristics Type of Study Andre, Joris and Mickey
(2007) Size of firm Knowledge management
Kettinger, Park and Smith,
(2009); Ness (2010) Human resource Profitability of firms
Oluwatayo & Amole (2011) Workforce and business
strategy Architectural services
Oluwatayo & Amole (2013) Ownership characteristics and
Organisation structure Architectural services
Roxas, Battistis and Deakins
(2006); Moohammad,
Yusof. and Kamal, (2014)
years of experience, ownership
structure and staff strength Organisation innovation studies
Jewell, Flanagan, and Lu
(2014) Type of firm Construction services
Kamal, Yusof and
Iranmanesh (2016) Type of firm, business scale,
firms’ major client, firm age
and firm size
Innovation creation and
adoption
Nguyen, Nguyen, Nguyen
and Tran, 2017 Ownership structure Security services
These characteristics enable firms to provide the appropriately qualified staff to the project and
complete the required services within a time frame. This study attempts to extend the study of effects of
the number of years of experience of the firm, type of firm (limited, partnership and sole proprietorship)
and size of employees of architectural firms as a PSFs who are normally engaged to provide professional
services for clients’ building projects. Most of the studies in Table 1 were for environment outside
Nigeria except Oluwatayo & Amole (2011) and Oluwatayo & Amole (2013). The two studies considered
ownership characteristics, workforce and business strategy to evaluate performance. This study however
adopted years of experience, ownership structure and staff strength as variables of influence in provision
of Architectural services in Nigeria.
RESEARCH HYPOTHESES
The following hypotheses were proposed for the interaction between firm type, firm size, firm
experience and professional services.
H1: The type of firm has a positive and significant effects on professional services.
H2: The size of firm has a positive and significant effects on professional services
H3: The experience of firm has a positive and significant effects on professional services

Built Environment Journal
4
METHODOLOGY
The population consists of architectural firms who are involved in recently completed or on-going
building projects that have reached advanced stage of completion for both public and private clients.
The sample frame consists of the list of Architectural firms that were registered to practice in Nigeria
(ARCON, 2014). The random sampling method was used to select the firms in the study, which was the
unit of data collection and analysis. In order to arrive at an acceptable sample distribution, the sample
size was calculated using the following formula as posited by Udofia (2011).
‘n’ = N / 1+ N(e2 ) ……………………………… (i)
where n = sample size, 1 = Unity; e = Level of significance = 0.05; N = Universe or population =970.
‘n’ = 970 / 1+ 970 (0.052) =285. To arrive at a reasonable response rate, 30% of 285 was added, given
a sample size of 371.
Random sampling technique was used to select the sample size from six cities where greater
percentage of firms were located. These cities were Lagos, Abuja, Port Harcourt, and Ibadan. The
questionnaires were hand-delivered using survey assistant. 371 questionnaires were distributed and 270
(73%) were received back for the analysis
Data Measurements
This section was about the characteristics (the independent variables) of the consultancy firms that
participated in the building projects of the clients. The attributes were categorized into three namely,
type of firm, experience of firm (in number of years) and size of firm (number of employees). Type of
firms are categorized as Sole Proprietorship (identified as 1), Partnership (identified as 2) and Limited
Liability (identified as 3). Experience of firm represents the number of years the firm has been in practice
in Nigeria. The variable is categorized into three intervals namely: 1-10 years (short experience), 11-20
years (average experience) and above 20 years (long experience). Size of firm was measured using the
number of employees. It was categorized into three intervals namely: 1-10 (micro firm), 11-20 (small
firm) and above 20 (medium firm). The provision of professional services (the dependent variable) by
architectural firms were sub-divided into stages of inception, design, tendering and construction. The
respondents were to choose Yes (if provided), represented by 1 and No (if not provided), represented by
0 for a particular project.
RESULTS
The questionnaire used to collect data for this study was administered to the respondent of resulted
in response rate as analysed in Table 2 below. The result shows that 371 questionnaires were distributed
and 270 (73.00%) were received back for the analysis.
Table 2: Descriptive Results of the Response to Research Instruments Questionnaire Number Percentage
Administered 371 100.00 Returned and used for the study 270 73.00
Respondents’ Characteristics
The features of the respondents of this study were investigated for an understanding of persons who
supplied the data used for the study. For the investigation five features namely: respondents’ gender,
academic qualification, professional affiliation, cadre and experience were selected. The distribution of
the respondents into the sub-variables of each feature was analysed. The results are presented in Table
3.
The Impact of Firm Type, Size and Experience on Professional Services of Architectural Firms in Nigeria
5
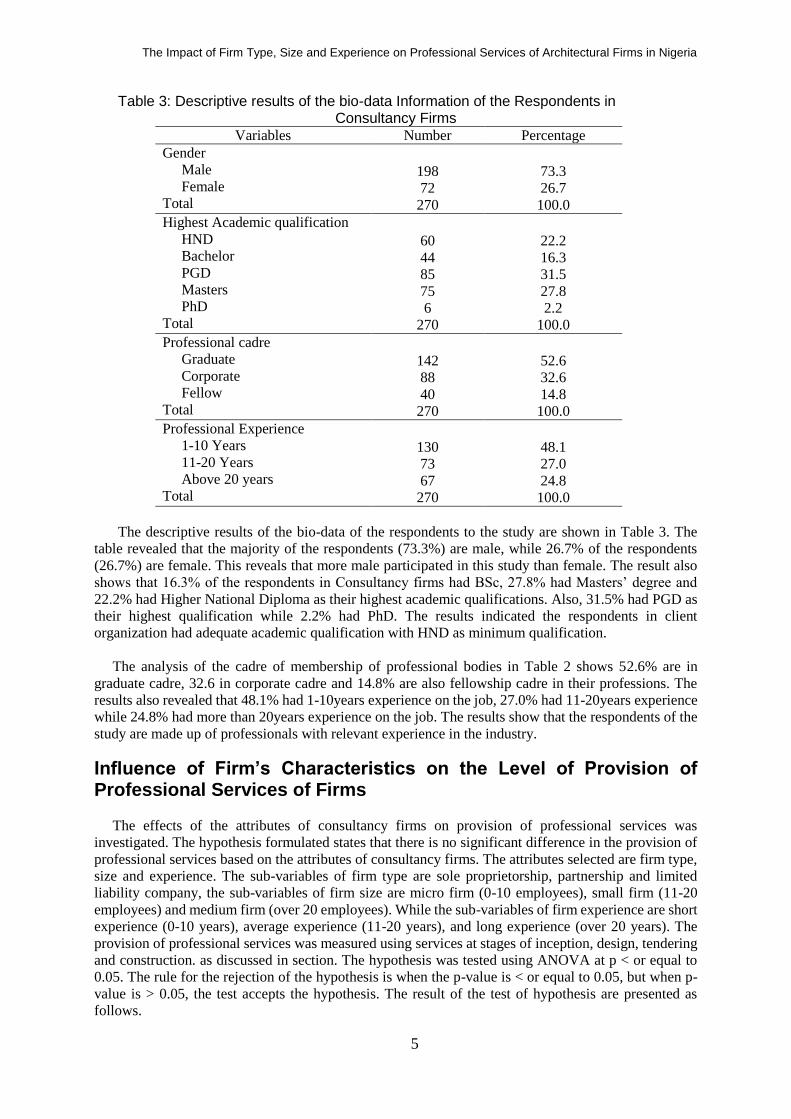
Table 3: Descriptive results of the bio-data Information of the Respondents in
Consultancy Firms Variables Number Percentage
Gender Male Female Total
198
73.3
72 26.7 270 100.0
Highest Academic qualification HND Bachelor PGD Masters PhD Total
60
22.2
44 16.3 85 31.5 75 27.8 6 2.2
270 100.0 Professional cadre Graduate Corporate Fellow Total
142
52.6
88 32.6 40 14.8
270 100.0 Professional Experience 1-10 Years 11-20 Years Above 20 years Total
130
48.1
73 27.0 67 24.8
270 100.0
The descriptive results of the bio-data of the respondents to the study are shown in Table 3. The
table revealed that the majority of the respondents (73.3%) are male, while 26.7% of the respondents
(26.7%) are female. This reveals that more male participated in this study than female. The result also
shows that 16.3% of the respondents in Consultancy firms had BSc, 27.8% had Masters’ degree and
22.2% had Higher National Diploma as their highest academic qualifications. Also, 31.5% had PGD as
their highest qualification while 2.2% had PhD. The results indicated the respondents in client
organization had adequate academic qualification with HND as minimum qualification.
The analysis of the cadre of membership of professional bodies in Table 2 shows 52.6% are in
graduate cadre, 32.6 in corporate cadre and 14.8% are also fellowship cadre in their professions. The
results also revealed that 48.1% had 1-10years experience on the job, 27.0% had 11-20years experience
while 24.8% had more than 20years experience on the job. The results show that the respondents of the
study are made up of professionals with relevant experience in the industry.
Influence of Firm’s Characteristics on the Level of Provision of Professional Services of Firms
The effects of the attributes of consultancy firms on provision of professional services was
investigated. The hypothesis formulated states that there is no significant difference in the provision of
professional services based on the attributes of consultancy firms. The attributes selected are firm type,
size and experience. The sub-variables of firm type are sole proprietorship, partnership and limited
liability company, the sub-variables of firm size are micro firm (0-10 employees), small firm (11-20
employees) and medium firm (over 20 employees). While the sub-variables of firm experience are short
experience (0-10 years), average experience (11-20 years), and long experience (over 20 years). The
provision of professional services was measured using services at stages of inception, design, tendering
and construction. as discussed in section. The hypothesis was tested using ANOVA at p < or equal to
0.05. The rule for the rejection of the hypothesis is when the p-value is < or equal to 0.05, but when p-
value is > 0.05, the test accepts the hypothesis. The result of the test of hypothesis are presented as
follows.
Built Environment Journal
6
Influence of Type of Firm on the Level of Provision of Professional Services
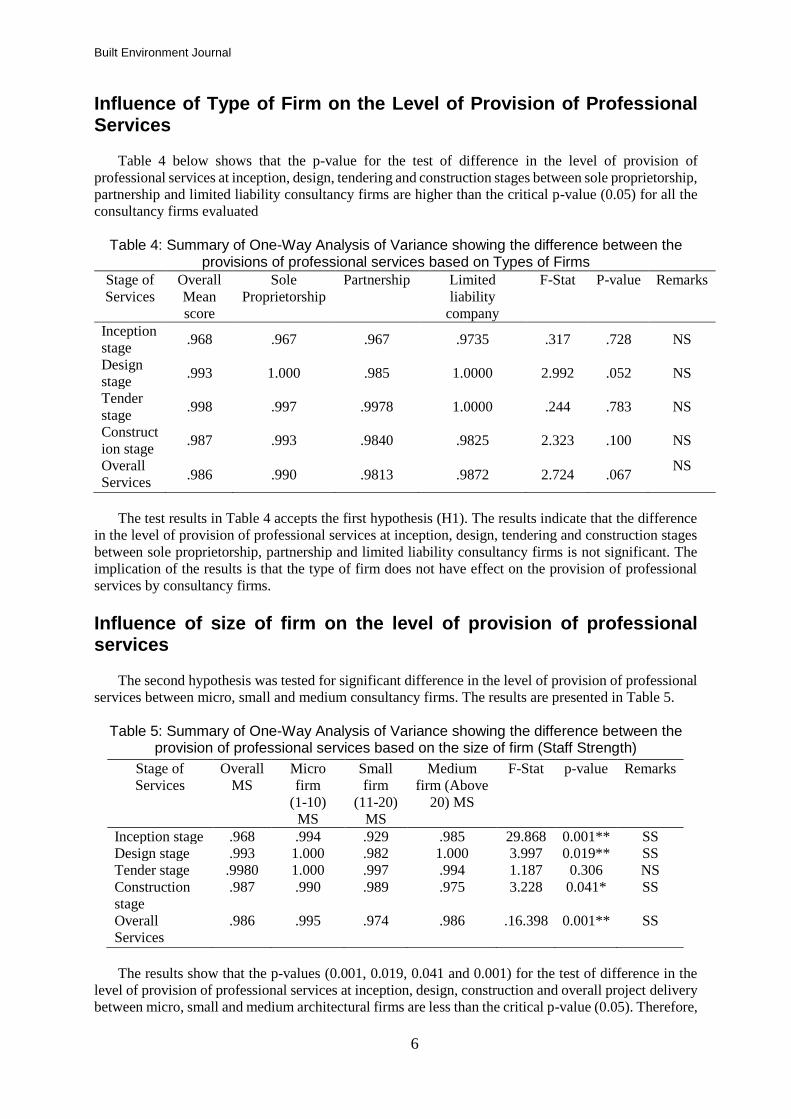
Table 4 below shows that the p-value for the test of difference in the level of provision of
professional services at inception, design, tendering and construction stages between sole proprietorship,
partnership and limited liability consultancy firms are higher than the critical p-value (0.05) for all the
consultancy firms evaluated
Table 4: Summary of One-Way Analysis of Variance showing the difference between the provisions of professional services based on Types of Firms
The test results in Table 4 accepts the first hypothesis (H1). The results indicate that the difference
in the level of provision of professional services at inception, design, tendering and construction stages
between sole proprietorship, partnership and limited liability consultancy firms is not significant. The
implication of the results is that the type of firm does not have effect on the provision of professional
services by consultancy firms.
Influence of size of firm on the level of provision of professional services
The second hypothesis was tested for significant difference in the level of provision of professional
services between micro, small and medium consultancy firms. The results are presented in Table 5.
Table 5: Summary of One-Way Analysis of Variance showing the difference between the provision of professional services based on the size of firm (Staff Strength)
The results show that the p-values (0.001, 0.019, 0.041 and 0.001) for the test of difference in the
level of provision of professional services at inception, design, construction and overall project delivery
between micro, small and medium architectural firms are less than the critical p-value (0.05). Therefore,
Stage of
Services Overall
Mean
score
Sole
Proprietorship Partnership Limited
liability
company
F-Stat P-value Remarks
Inception
stage .968 .967 .967 .9735 .317 .728 NS
Design
stage .993 1.000 .985 1.0000 2.992 .052 NS
Tender
stage .998 .997 .9978 1.0000 .244 .783 NS
Construct
ion stage .987 .993 .9840 .9825 2.323 .100 NS
Overall
Services .986 .990 .9813 .9872 2.724 .067
NS
Stage of
Services Overall
MS Micro
firm (1-10)
MS
Small
firm (11-20)
MS
Medium
firm (Above
20) MS
F-Stat p-value Remarks
Inception stage .968 .994 .929 .985 29.868 0.001** SS Design stage .993 1.000 .982 1.000 3.997 0.019** SS Tender stage .9980 1.000 .997 .994 1.187 0.306 NS Construction
stage .987 .990 .989 .975 3.228 0.041* SS
Overall
Services .986 .995 .974 .986 .16.398 0.001** SS
The Impact of Firm Type, Size and Experience on Professional Services of Architectural Firms in Nigeria
7
the test rejects the hypothesis. The result indicated that the difference in the level of provision of
professional services at inception, design, construction and overall project delivery between micro, small
and medium architectural consultancy firms is significant for architectural firms. The implication of the
results is that the size of firm has effect on the level of provision of professional services at inception,
design, construction and overall project delivery by architectural firms. However, at the tendering stage
the critical value is greater than 0.05 (0.306), accepting the hypothesis. This means that the size of firm
has no effect on the provision of professional services at the tendering stage.
A close examination of Table 5 shows that micro architectural firms provide the highest level of
professional services at inception, design, tendering, construction stages and overall project delivery
(MS at inception = 0.99; MS at design = 1.00; MS at construction = 0.99; MS at overall =0.99). They
are followed by medium architectural firms (MS at inception = 0.98; MS at design = 1.00; MS; MS at
construction = 0.97; MS at overall = 0.99), while small architectural firms provide the least level of
professional services (MS at inception = 0.93; MS at design = 0.97; MS at construction = 0.99; MS at
overall = 0.97).
Influence of firms’ experience on the level of provision of professional services
The third hypothesis was also tested for significant difference in the level of provision of
professional services between consultancy firms with short, average and long experience. The results
are presented in Table 6.
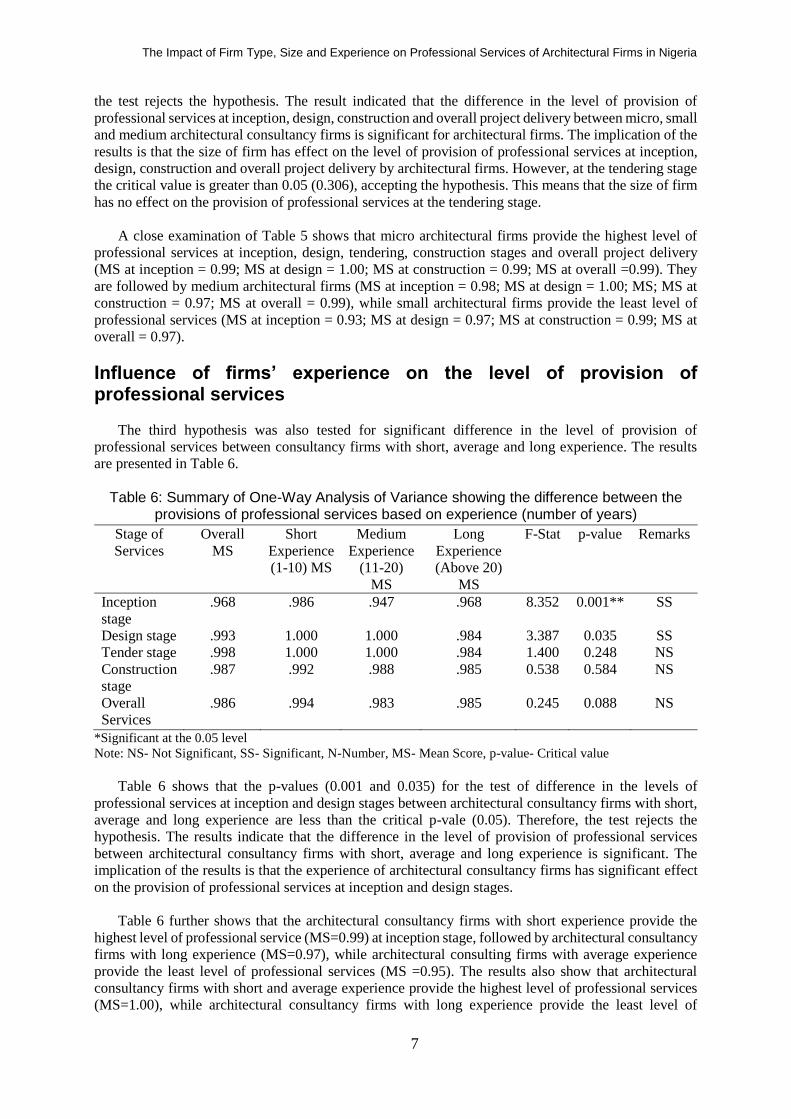
Table 6: Summary of One-Way Analysis of Variance showing the difference between the
provisions of professional services based on experience (number of years)
*Significant at the 0.05 level
Note: NS- Not Significant, SS- Significant, N-Number, MS- Mean Score, p-value- Critical value
Table 6 shows that the p-values (0.001 and 0.035) for the test of difference in the levels of
professional services at inception and design stages between architectural consultancy firms with short,
average and long experience are less than the critical p-vale (0.05). Therefore, the test rejects the
hypothesis. The results indicate that the difference in the level of provision of professional services
between architectural consultancy firms with short, average and long experience is significant. The
implication of the results is that the experience of architectural consultancy firms has significant effect
on the provision of professional services at inception and design stages.
Table 6 further shows that the architectural consultancy firms with short experience provide the
highest level of professional service (MS=0.99) at inception stage, followed by architectural consultancy
firms with long experience (MS=0.97), while architectural consulting firms with average experience
provide the least level of professional services (MS =0.95). The results also show that architectural
consultancy firms with short and average experience provide the highest level of professional services
(MS=1.00), while architectural consultancy firms with long experience provide the least level of
Stage of
Services Overall
MS Short
Experience (1-10) MS
Medium
Experience (11-20)
MS
Long
Experience
(Above 20)
MS
F-Stat p-value Remarks
Inception
stage .968 .986 .947 .968 8.352 0.001** SS
Design stage .993 1.000 1.000 .984 3.387 0.035 SS Tender stage .998 1.000 1.000 .984 1.400 0.248 NS Construction
stage .987 .992 .988 .985 0.538 0.584 NS
Overall
Services .986 .994 .983 .985 0.245 0.088 NS
Built Environment Journal
8
professional services. The p-values for the test of difference in the level of provision of professional
services between architectural consultancy firms with short, average and long experience at tendering,
construction and overall project delivery stages are higher than the critical p-value (0.05). This indicates
no difference at these stages, implying that they do not have any effect on the provision of professional
services.
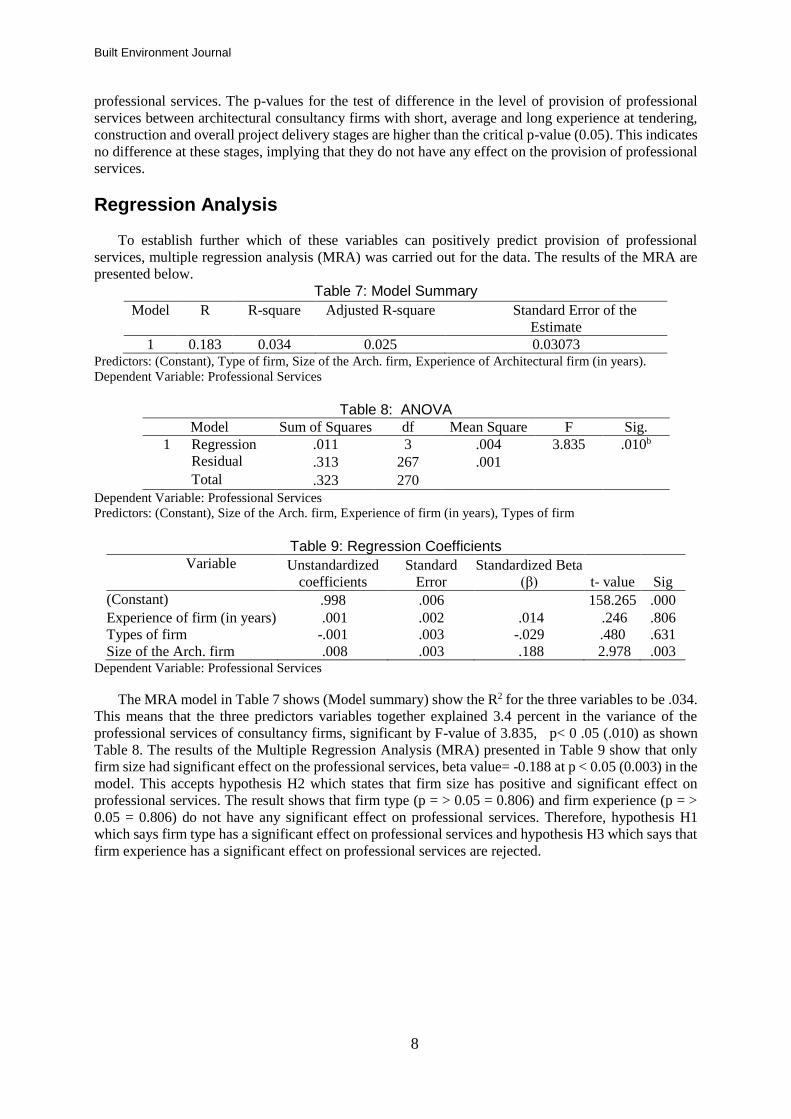
Regression Analysis
To establish further which of these variables can positively predict provision of professional
services, multiple regression analysis (MRA) was carried out for the data. The results of the MRA are
presented below.
Table 7: Model Summary
Predictors: (Constant), Type of firm, Size of the Arch. firm, Experience of Architectural firm (in years).
Dependent Variable: Professional Services
Table 8: ANOVA
Model Sum of Squares df Mean Square F Sig. 1 Regression .011 3 .004 3.835 .010b
Residual .313 267 .001 Total .323 270
Dependent Variable: Professional Services
Predictors: (Constant), Size of the Arch. firm, Experience of firm (in years), Types of firm
Table 9: Regression Coefficients Variable
Unstandardized
coefficients Standard
Error Standardized Beta
(β) t- value Sig (Constant) .998 .006 158.265 .000 Experience of firm (in years) .001 .002 .014 .246 .806 Types of firm -.001 .003 -.029 .480 .631 Size of the Arch. firm .008 .003 .188 2.978 .003
Dependent Variable: Professional Services
The MRA model in Table 7 shows (Model summary) show the R2 for the three variables to be .034.
This means that the three predictors variables together explained 3.4 percent in the variance of the
professional services of consultancy firms, significant by F-value of 3.835, p< 0 .05 (.010) as shown
Table 8. The results of the Multiple Regression Analysis (MRA) presented in Table 9 show that only
firm size had significant effect on the professional services, beta value= -0.188 at p < 0.05 (0.003) in the
model. This accepts hypothesis H2 which states that firm size has positive and significant effect on
professional services. The result shows that firm type (p = > 0.05 = 0.806) and firm experience (p = >
0.05 = 0.806) do not have any significant effect on professional services. Therefore, hypothesis H1
which says firm type has a significant effect on professional services and hypothesis H3 which says that
firm experience has a significant effect on professional services are rejected.
Model R R-square Adjusted R-square Standard Error of the
Estimate 1 0.183 0.034 0.025 0.03073
The Impact of Firm Type, Size and Experience on Professional Services of Architectural Firms in Nigeria
9
DISCUSSIONS AND CONCLUSION
The results of the MRA conducted for the study as shown in Table 7 indicates that the three firm
characteristics examined in the study (firm type, firm size and firm experience) cumulatively explained
3.4 percent of the variance in the professional services among architectural firms in Nigerian building
industry. The findings of the study based on the type of firm revealed no significant effects on the
provisions of professional services across the selected professionals. The p-value for architects at all the
stages of inception, design, tender and construction was greater than the critical value of 0.05. This
implies that the type of firm in terms of sole proprietorship, partnership and limited liability did not have
any impact on the level of professional services provided by the different consultancy firms in building
projects.
These findings are consistent with the research results of Nguyen, et al (2017); Mohammed et al.
(2014), and Oluwatayo and Amole (2013). Nguyen et al. (2017) findings on ownership structure of
firms and performance of professional service firms indicated a significantly negative relationship. The
study of Mohammed, et al (2014) was on firm characteristics on innovation practices. It was found that
the type of firm did not have any significant impact on the innovation practices of consultancy firms in
the building industry, and therefore were not statistically supported. Oluwatayo and Amole (2013)
concluded that there was no direct relationship between ownership characteristics and firm performance
of architectural firms. This also supported earlier study of Demsel and Villalonga (2001) which
concluded that the legal form of ownership of architectural firms did not directly influence the financial
performance of firms. This result showed that the hypothesis which stated that there is no significant
difference in the level of provision of professional services based on type of firm was accepted.
The provision of professional services based on the size of firm for architectural services was
significant at the inception, design and construction stages with p < 0.05. The p-value for overall services
was also less than the critical value of 0.05. However, the size had no impact at the tender stage. This is
in agreement with practice as level of architectural services at the tender stage are not always very
significant. Kaguri (2013) also found that firm size had a statistically significance influence on firm
performance. The result also confirmed the assertion of Ness (2010) that people are an asset in an
organization. It showed the importance of the workforce to the performance of firms. This means, for
an organization to remain competitive and remain positive, the human resource must be given adequate
attention, resulting in long term impact on the success of the projects (Xia, Chan & Yeung, 2009).
On the effect of the age of firms, only architectural services. had a p-value that is less than the critical
value of 0.05 at inception and design stages. This is consistent with the findings of Kaguri (2013), and
Kamal, Yusof and Iranmanesh (2016) which concluded a significant positive influence of firm’s age on
the performance and innovation of construction firms. However, this is in contrast with Mohammed et
al. (2014) which stated that firm age was not significant on consultancy firm’s innovation practices. In
conclusion, for client to get value for their investments it is recommended that the client should always
make concerted efforts to establish the staff strength of consultancy firms before they are engaged or
commissioned to offer professional services. This can be done by enforcing the requirements of Public
Procurement (2007) in Nigeria. The requirements make it mandatory for public procurements for
construction projects to undertake pre-qualification exercise before such an organizations are engaged.
This procedure is to get value for money that are invested in public infrastructures.
Built Environment Journal
10
Suggestion for Further Studies
The study established the effect of firms’ characteristics on professional services of Architectural
practice. Meanwhile, provision of professional relies heavily on the skills and competence that are
inherent in individual members of the firm. Therefore, further studies on the effect of personality traits
on the professional services of firms are suggested to complement the findings of the study.
REFERENCES
Architects Registration Council of Nigeria (ARCON), 2014. Register of Architectural firms entitled
to practice in the Federal Republic of Nigeria.
Aiyetan, A.A., Smallwood, J.J., and Shakantu, W. (2014). Influence of client understanding on quality
of design. In Jolanta, T, Kriengsak, P, Nobuo, M and Chien-Ho (Eds), 5th International
Conference Proceedings on Engineering, Project and Production Management, 26-28 Nov. 2014.
Nelson Mandela Metropolitan University, 244-253
Brandl, K (2010). Perspectives on globalization and the danish architecture and engineering
industry. Research Paper for Centre for Strategic Management and Globalization, Copenhagen
Business School, Denmark.
Canavan, D., Sharkey Scott, P., and Mangematin, V. (2012). How professional service firms
internationalize: Resources commitments and competencies for internationalization
Academy of Business, UK and Ireland Chapter. Liverpool ,31 March 2012.
Chang, J., Proverbs, D.G., and Oduoza, C.F. (2006). The satisfaction levels of UK construction
clients based on the performance of consultants: Results of a case study. Journal of
Engineering, Construction and Architectural Management,13 (6), 567-583.
CIDB (2011). Construction quality in South Africa: A client perspective. Construction
Industry Development Board Report, 1-56. http//www.cidb.org.za, accessed on 14/11/2017.
Dainty, A.R.J., Cheng, M.I., and Moore, D.R. (2005). Competency-based model for
predicting construction project managers’ performance. Journal of Management in
Engineering, 21 (1), 2-9.
Demsetz, H., and Villalonga, B. (2001). Ownership structure and corporate performance.
Journal of Corporate Finance, 7,209-233.
Demirbag, M., McGuinness, M., Akin, A., Bayyurt, N., and Basti, E. (2016). The professional
service firm (PSF) in a globalised economy: A study of the efficiency of securities firms in an
emerging market. International Business Review, 25(5), 1089-1102.
Hughes, W. (2012). The business of construction procurement: selecting, defining and
managing procurement. Proceedings of 4th West Africa Built Environment Research
(WABER) Conference in Nigeria, 24th-26th July 2012. 1-7.
Jewell, C., Flanagan, R., and Anac, C. (2010). Understanding UK construction professional
services exports: Definitions and characteristics. Construction Management and
Economics, 28 (3), 231-239. doi:10.1080/01446191003587729.
Jewell, C.A., Flanagan, R., and Lu, W (2014). The dilemma of scope and scale for construction
professional service firms. Construction Management and Economics,32 (5), 473- 486.
Kaguri, A. W (2013). Relationship between firm characteristics and financial performance of
life insurance companies in Kenya. An M.Sc Thesis Degree in Finance, University Of Nairobi.
Kamal, E.M., Yusof, N., and Iranmanesh, M. (2016). Innovation creation, innovation adoption, and
firm characteristics in the construction industry. Journal of Science & Technology Policy
Management, 7(1),43-57.doi.org/10.1108/JSTPM-03-2015-0011.
Kettinger, J.K., Park, S.S., and Smith, J. (2009). Understanding the consequences of information
systems service quality on information service reuse. Journal of Information and
Management, 46, 335-341.

The Impact of Firm Type, Size and Experience on Professional Services of Architectural Firms in Nigeria
11
Kwofie, T.E., Amos-Abanyie, S., and Afram, S.O. (2016). Principal component analysis of
professional competencies of architects in the Ghanaian construction industry. Engineering,
Construction and Architectural Management, 23 (5), 571-587. doi.org/10.1108/ECAM-08-
2014-0108.
Lorraine, U., Andre, S., Joris, M., and Mickey, F. (2007). The relationship between knowledge
management, innovation and firm performance: Evidence from Dutch SMEs. Scientific
Analysis of Entrepreneurship and SMEs (H200704). EIM Business and Policy
Research, Zoetermeer, The Netherlands. www.nl/smes-and-entrepreneurship, 17th Nov. 2017.
Moohammad. A., Yusof. N., and Kamal, E. M. (2014). Empirical assessment of Nigerian
construction industry consultancy services innovation practices. International Journal
of Managerial Studies and Research. 2 (9), 175-186.
Ness, K (2010). The discourse of ‘Respect for People” in UK construction. Construction
Management and Economics, 28 (5), 481-493.
Nguyen, T. H., Nguyen, X.M., Nguyen, T. T. H. and Tran, Q. T. (2017). Ownership structure
and performance of professional service firms in a declining industry: Evidence from
Vietnamese securities firms. Business and Economic Horizons, 13 (2), 142-151.
doi.org/10.15208/beh.2017.11
Nguyen, H.T and Hadikusumo, B. (2017). Impacts of human resource development on
engineering, procurement, and construction project success. Built Environment Project
and Asset Management, 7 (1)73-85,doi.org/10.1108/BEPAM-04-2016-0010
Olatunde, N.A., Ogunsemi,D.R., and Oke, A.E. (2017). Impact of team members’ composition
on construction projects delivery in selected higher institutions in Nigeria. Journal of
Engineering, Design and Technology. 15 (03), 355-377. doi.org/10.1108/JEDT-04-2016-0028
Oluwatayo, A.A., Ibem, E., and Amole, D. (2014). Satisfaction of first-time residential clients
architectural services. Journal of Engineering, Design and Technology, 12(3), 316-335.
doi.org/10.1108/JEDT--03-2012-0012.
Oluwatayo, A.A., and Amole, D. (2013). Ownership, structure, and performance of architectural
firms. Frontiers of Architectural Research. 2013 (2), 94–106. doi.org/10.1016/j.foar.2012.12.001
Oluwatayo, A A., and Amole, D. (2011) Architectural firms: Workforce, business strategy and
performance., Australasian Journal of Construction Economics and Building, 11 (4) 21-44.
Oyedele, L.O. (2013). Analysis of architects' demotivating factors in design firms. International
Journal of Project Management. 31, 342–354.
Oyedele, L. O., Jaiyeoba, B. E., Kadiri, K. O., Folagbade, S. O., Tijani, I. K and Salami, R.O. (2015). Critical factors affecting construction quality in Nigeria: evidence from industry professionals.
International Journal of Sustainable Building Technology and Urban Development, 6 (2),103-
113. doi:10.1080/2093761X.2015.1033662.
PP. (2007). The Public Procurement Act, Nigeria. 2007.
Roxas, B., Battisti, M., and Deakins, D. (2013). Learning, innovation and firm performance:
knowledge management in small firms. Knowledge Management Research and Practice, 12 (4),
443-453.
Soetanto, R. (2002). Modelling satisfaction for main participants of the construction project
coalition: A study of mutual performance assessment. A PhD thesis of the University of
Wolverhampton, UK.
Sporrong, J. (2014). Selecting Architectural and Engineering Consultants. A PhD Thesis, Chalmers
University of Technology, Sweden
Udofia, E.P. (2011). Applied Statistics with Multivariate Methods, Enugu. Nigeria. Immaculate Publications Limited.
Urem, B., Alcorta, L., and An, T. (2007). The innovativeness of foreign firms in China.
Working Paper Series. United Nations University-Maastricht Economic and Social Research
and Training Centre on Innovation and Technology, Maastricht, The Netherlands. URL:
http//www.merit.unu.edu.

Built Environment Journal
12
Von Nordenflycht, A. (2010). What is a professional service firm? Toward a theory and
taxonomy of knowledge-intensive firms. Academy of Management Review, 35(1), 155-17
Xia, B., Chan, A.P.C., and Yeung, J.F.Y. (2009). Identification of key competencies of design Builders in the construction market place of the People’s Republic of China (PRC).
Construction Management and Economics. 27 (11), 1141-1152.
Yang, J-B., and Peng S-C. (2008). Development of a customer satisfaction evaluation model for
construction project management. Journal of Building and Environment, 43, 458-468.
Built Environment Journal Vol. 16 No.1, 13 - 22, 2019
13
THE IMPLEMENTATION OF CORPORATE SOCIAL RESPONSIBILITIES (CSR) AMONG G7 CONTRACTORS IN
MALAYSIA
Hamimah Adnan 1, Mas Elida Mohd Zahir 1, Wan Norizan Wan Ismail 2,
Muhammad Redza Rosman2
1Center of Studies for Quantity Surveying
Faculty of Architecture, Planning and Surveying, Universiti Teknologi MARA,
Shah Alam, Malaysia 2Faculty of Architecture, Planning and Surveying, Universiti Teknologi MARA Cawangan
Perak, Kampus Seri Iskandar, Perak, Malaysia
Email: [email protected]
ABSTRACT
Corporate Social Responsibility (CSR) is one of way to
encourage among the stakeholders to improve not only the
society, but environment and economy of affected people. This
paper aims to identify the implementation, challenges and
ways to enhance Corporate Social Responsibility (CSR) among
G7 Contractors registered under the Malaysian Construction Industry Development Board.
(CIDB in Malaysia. Quantitative and qualitative methodology were involved which involved
questionnaires survey and interviews. Questionnaires were distributed to 150 respondents with
32 replied and 5 interviews were held among the respondents. The findings show that the
highest level of CSR implementation is in the relationship with clients and suppliers. Most
respondents agreed that the biggest challenges in implementing CSR were lack of support from
top management and lack of time. It also showed that most respondents agreed that the ways
to enhance the implementation of CSR were the involvement of system of governance
transparency with investors and shareholders, application of policy by employees, close
relationship with the clients and suppliers, concrete actions towards community and adoption
of measures on the environmental impact. It is recommended for the implementation of CSR
and ways to overcome the challenges needed to be enhanced to reach the highest level of
implementation and every stakeholder needs to act for effective improvement to enhance the
implementation.
Keywords: Construction, Contractor, Corporate Social Responsibility, Implementation
INTRODUCTION
In construction sector, as referred to Ofori (2015) study, the improvement of the performance of the
construction industries of developing countries and duty conduct in giving efforts to lift a billion people
from poverty, illiteracy, high infant mortality and other manifestations of poor socio-economic
development is critical. It is stated in Ofori (2015) study that conducting a study in construction industry
that relates to society, environment and economy, can improve the lives of billion people. Thus, this
study will be focused on the implementation of CSR since it gives benefits to the society and a key pillar
to the Malaysian economy.
In present time, the global economy requires such implementation or effort to keep the revolution
of business practices expanding and increasing, at the same time beneficial. Beneficial in business is
Received: 10 Sept 2018
Reviewed: 30 Dec 2018
Accepted: 18 Jan 2019
Built Environment Journal
14
very broad as it can be either environmental or profitability. Thus, the implementation of certain practice
such as CSR helps to get the best of both to gain benefits in business. Environmental and profitability
have a complex relationship. The impacts which corporations have on the environment are hard to
handle when many resources are used to provide service and produce building. It is the same with the
relationship of society and profitability in business. To make a profit-gained business takes one big
effort, but it is not a good business if it doesn’t consider the society. In relation to that, every business
should give considerations to the environment, profit and society where the best implementation for this
is by implementing CSR.
Problem Statement
The level of implementation of CSR for G7 Contractors in the Malaysia is still not widely applied
and usually based on “profit only” business. According to Mwangi and Otieno-Mwembe (2015), “CSR
is a concept that as much as it has been practiced by majorly corporate firms, it is yet to be embraced by
those in the construction industry”.
As stated by Meding and Social (2017), the blunt reality is that a company’s foremost priority is to
ensure financial security and ultimately, profitability. In order to make a company stable in gaining
profit and at the same considering and taking care of the surrounding factors, is by implementing CSR.
It is supported with the statement by Nasir (2015) “Generally, it can be concluded that CSR is focused
beyond profit making motive which needs the companies to consider other aspects such as protecting
the environment, caring for employees, being ethical in daily business activities and also improving the
society’s quality of life”.
There are many challenges of CSR for G7 Contractors in the Malaysian Construction Industry. As
stated by Mwangi and Otieno-Mwembe (2015), corruption becomes rife as business owners collude
with governmental officials to engage in illegal activities. Although the construction industry continues
to struggle with a poor societal image, many organizations however have adopted a positive CSR
towards their surrounding environment, with the objective of improving their persona within social
circles (Meding and Social, 2017).
Corporate Social Responsibility (CSR) improves the society. Sometimes construction firms
undertake their operations without taking into account the impact that their activities and policies have
on their employees as well as the society at large (Mwangi and Otieno-Mwembe, 2015). Thus, ways to
enhance the implementation of CSR in the construction industry need to be encouraged among the
stakeholders to improve not only the society, but the environment and economy of affected people. In
addition, the number of studies on ways to enhance the implementation of CSR is still low as scholarly
study of CSR is still new, as indicated by (Abdullah, 2016).
LITERATURE REVIEW
Corporate Social responsibility (CSR)
CSR is a concept that has captured the interest of the economy in the whole wide world. The
attention of CSR in the current time has contributed to the worldwide scale or global growth and directly
expands the variations of construction works. CSR not only increases the businesses but stimulates the
demands for corporate citizenship. CSR can be described as a means for establishing an effective
framework for strategic management and business relationship among various stakeholders (Mohamad
et al., 2012). CSR is also relevant for a study on engaging the whole self because it is tied to one’s self-
concept, as Korschun et al. (2014) explain, CSR “reflects a core belief rather than an attitude about a
particular social issue.” Adeyunju (2012) acknowledged that, CSR is an organization’s responsibility to
participate in vital activities needed to protect and contribute to the welfare of the society (community);
this involves the general communities, customers (Marketplace), shareholders, environment
The Implementation of Corporate Social Responsibilities (CSR) Among G7 Contractors in Malaysia
15
(Environment), and employees (Workplace). In that case, the hope and efforts are relied on the
mentioned elements as compared to the productions and what they offer.
The Malaysian Construction Industry
In the former time, it is the public sector or usually known as the government to be solely responsible
for the living and nature, as well as for the requirement of the society to be living in a good environment
and fulfilling living conditions. In recent time, the focus has shifted to the private sector in practicing
and giving benefits from the CSR implementation in contrast from the usual practices which only come
from the public sector. In addition, the value of construction work done in the second quarter 2017
recorded a double-digit growth of 11.2 per cent year-on-year to record RM33.8 billion (Q1 2017:
RM35.1 billion) (DOSM, 2017). The expansion in the value of construction work done was driven by
positive growth in all sub-sectors: Civil engineering (19.3%), Special trade activities (11.6%), Non-
residential buildings (9.7%) and Residential buildings (3.8%) sub-sector (DOSM, 2017). The private
sector continued to propel the construction activity with 63.8 per cent share (RM21.6 billion) as
compared to the public sector with 36.2 per cent share (RM12.2 billion) (DOSM, 2017). Thus, it is
more vital for the private sectors to implement CSR as compared to public sector as it has expanded
bigger than the public sector in current construction activity in recent economic state.
Grade 7 (G7) Contractors registered under the Malaysian Construction Industry Board (CIDB)
In relation to the private sector, contractors are a private sector that is closely related to construction
activities. A contractor plays an important role in ensuring the good delivery of project and also the
safety management of the construction work. As stated by Mat Yahya and Ismail (2015) in ensuring the
project to be well completed, the contractor’s performance must be analysed constantly to prevent
and handle issues or hazards which likely to happen on site. A contractor is anyone who directly employs
or engages construction workers or manages construction work. Contractors include sub-contractors,
any self-employed individual workers or businesses that carry out, manage or control construction work.
They must have skills, knowledge, experience and, where relevant, the organisational capability to carry
out the work safely and without risk to health. According to CIDB (2016) for Grade 7 Contractors, the
financial capacity for paid-up or net capacity must be worth of RM 750,000.00 and for technical person’s
qualification, he must be a 2-degree holder (at least one with 5 years of experience or A degree holder
and a diploma holder (both with minimum 5 years of experience) with other requirements (degree /
diploma / certificate must be related to the construction field and is recognized by the Malaysian
Government / CIDB).
RESEARCH METHODOLOGY
The information and data gathered from the survey were arranged and prepared using the frequency
and percentage method and average index method in relation to the targets, objectives, scope, and extent
of the study. Two statistical methods were applied, namely descriptive statistic and inferential statistic.
The formula being used is:
Percentage (%) = (n/N) x 100%
Where,
n = Number of respondents
N = Total number of respondents received
150 copies of questionnaires were distributed to the targeted respondents, from which twenty-one
per cent (21%) were received with complete information. The respondents were director, project
manager, engineer, quantity surveyor and site agents in Klang Valley, Malaysia. Forty per cent (40%)
of all questionnaires copies were distributed directly through postal and another sixty per cent (60%)
Built Environment Journal
16
were sent through electronic mail in PDF Form and Google Form. The respondents’ positions from the
G7 Contractors that give responses to the distributed questionnaire survey are director (3), project
manager (4), engineer (7), quantity surveyor (9) and site agents (9). The responses obtained by 30
respondents were reliable and rational for the present study.
Questions based on Likert scales were analysed by using average index method, and the outcomes
have been presented in the form of an average score or mean. For the Likert scales questions, respondents
needed to give answers in the form of scale 1 to 5. A scale of 5 categories has been used for the average
index method to show priority. The weighting scale for the analysis was based on the thirty-two (32)
respondents. The Likert scale was based on 5 points, where 1 for strongly disagree or very poor, 2 for
disagree or poor, 3 for neutral or average, 4 for agree or good and 5 for strongly agree or very good. The
questionnaire also required the demographic profiles of the respondents.
RESULT AND DISCUSSION
Result
The Respondent and Company Background
There were 5 questions related to position, gender, highest qualification, level of experience, and
nature of the company asked to the respondents. The given questions were then used for the
identification purpose of the respondents. It has further reflected the credibility of the respondent in
providing input to the questionnaire. The respondent’s profile was analysed by using frequency and
percentage method.
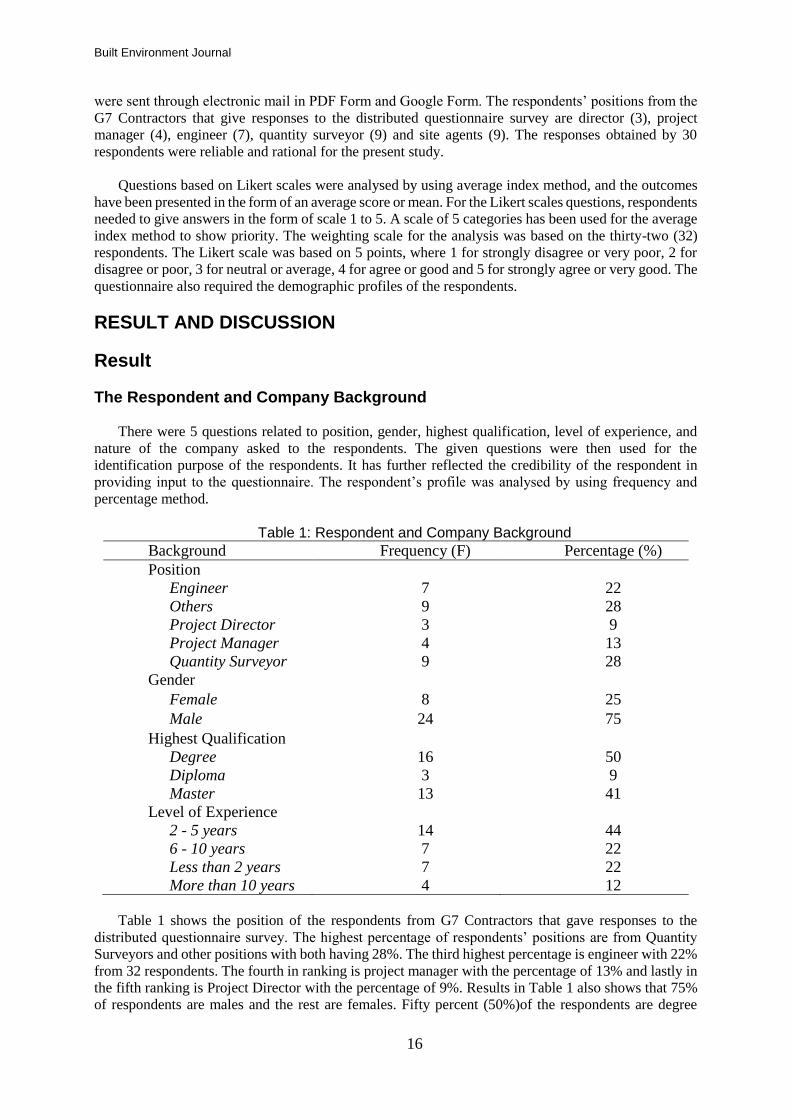
Table 1: Respondent and Company Background
Background Frequency (F) Percentage (%)
Position
Engineer 7 22
Others 9 28
Project Director 3 9
Project Manager 4 13
Quantity Surveyor 9 28
Gender
Female 8 25
Male 24 75
Highest Qualification
Degree 16 50
Diploma 3 9
Master 13 41
Level of Experience
2 - 5 years 14 44
6 - 10 years 7 22
Less than 2 years 7 22
More than 10 years 4 12
Table 1 shows the position of the respondents from G7 Contractors that gave responses to the
distributed questionnaire survey. The highest percentage of respondents’ positions are from Quantity
Surveyors and other positions with both having 28%. The third highest percentage is engineer with 22%
from 32 respondents. The fourth in ranking is project manager with the percentage of 13% and lastly in
the fifth ranking is Project Director with the percentage of 9%. Results in Table 1 also shows that 75%
of respondents are males and the rest are females. Fifty percent (50%)of the respondents are degree
The Implementation of Corporate Social Responsibilities (CSR) Among G7 Contractors in Malaysia
17
holders followed by master holders and diploma qualification while their highest qualification with 44%
of the respondents have between 2 - 5 years of experience followed by the second and third highest
respondents with between 6 - 10 years of experience and less than 2 years involved in the construction
works. While, the lowest percentage is 12% of respondents who have experience in the construction for
more than 10 years.
Lastly, it also shows the percentage of respondent’s company nature where Building Works
conquers the majority percentage compared to other works’ nature followed by the second highest is
Civil Engineering Works with 38% percentage. The third place is shared by four different company’s
natures, that are Electrical Works, Facilities Management Services, Interior Design Contractor and
Architectural and Interior Design with 3% each.
The Level of Implementation of CSR Among G7 Contractors in the Malaysian Construction Industry
The purpose of this section is to identify the level of Implementation of CSR among G7 Contractors
where there were four questions in this section, which are the implementation of CSR Policy, the practice
of CSR programs, the importance level of CSR in the construction industry and lastly, the
implementation of various stakeholders in the company/ organization. There were five criteria questions
which include the shareholders’ initiatives, among employees, relationship with clients and suppliers,
towards the community and towards the environment.
The first three questions were analysed by using frequency and percentage method. The fourth
question was provided with the list of scale by using the Likert Type Scale where 1, 2, 3, 4 and 5 stand
for very poor, poor, average, good and very good respectively. The data generated in this section, was
analysed by using SPSS to identify mean. A summary of the analysis is reported in the form of Average
Index. The result of average index by 32 responses will be presented in Table 2.
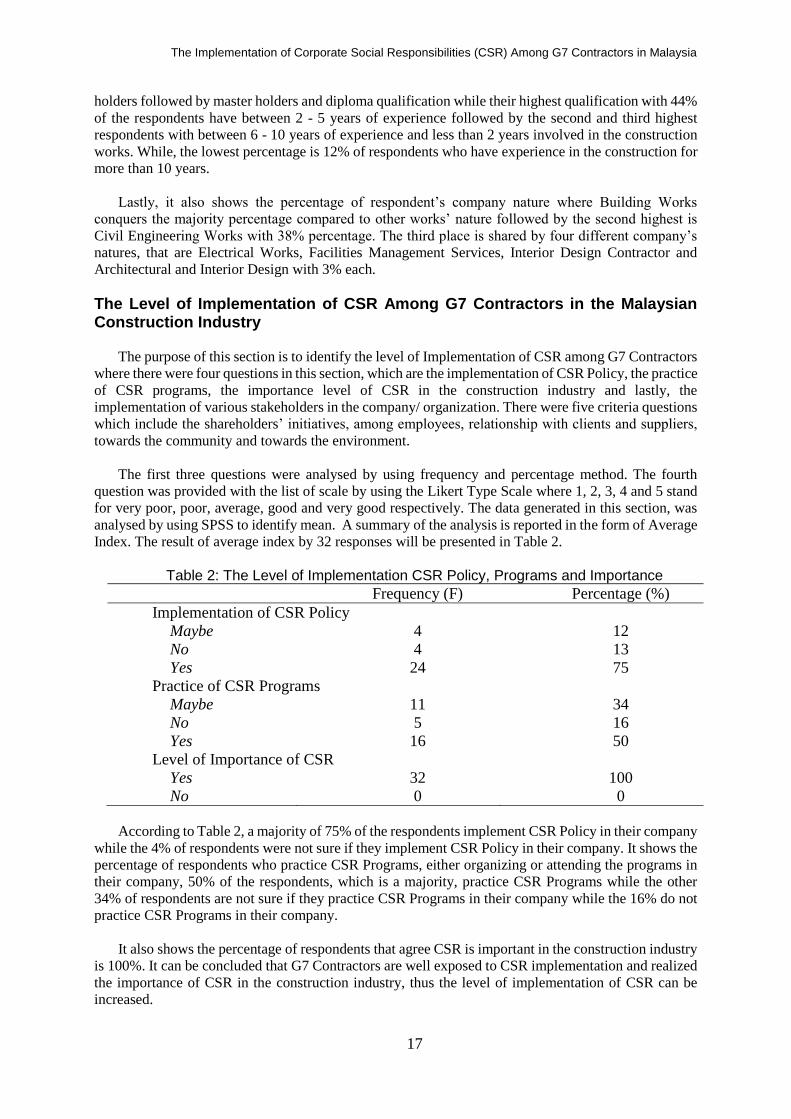
Table 2: The Level of Implementation CSR Policy, Programs and Importance
Frequency (F) Percentage (%)
Implementation of CSR Policy
Maybe 4 12
No 4 13
Yes 24 75
Practice of CSR Programs
Maybe 11 34
No 5 16
Yes 16 50
Level of Importance of CSR
Yes 32 100
No 0 0
According to Table 2, a majority of 75% of the respondents implement CSR Policy in their company
while the 4% of respondents were not sure if they implement CSR Policy in their company. It shows the
percentage of respondents who practice CSR Programs, either organizing or attending the programs in
their company, 50% of the respondents, which is a majority, practice CSR Programs while the other
34% of respondents are not sure if they practice CSR Programs in their company while the 16% do not
practice CSR Programs in their company.
It also shows the percentage of respondents that agree CSR is important in the construction industry
is 100%. It can be concluded that G7 Contractors are well exposed to CSR implementation and realized
the importance of CSR in the construction industry, thus the level of implementation of CSR can be
increased.

Built Environment Journal
18
The Implementation of Corporate Social Responsibilities (CSR) Among G7 Contractors in Malaysia
19
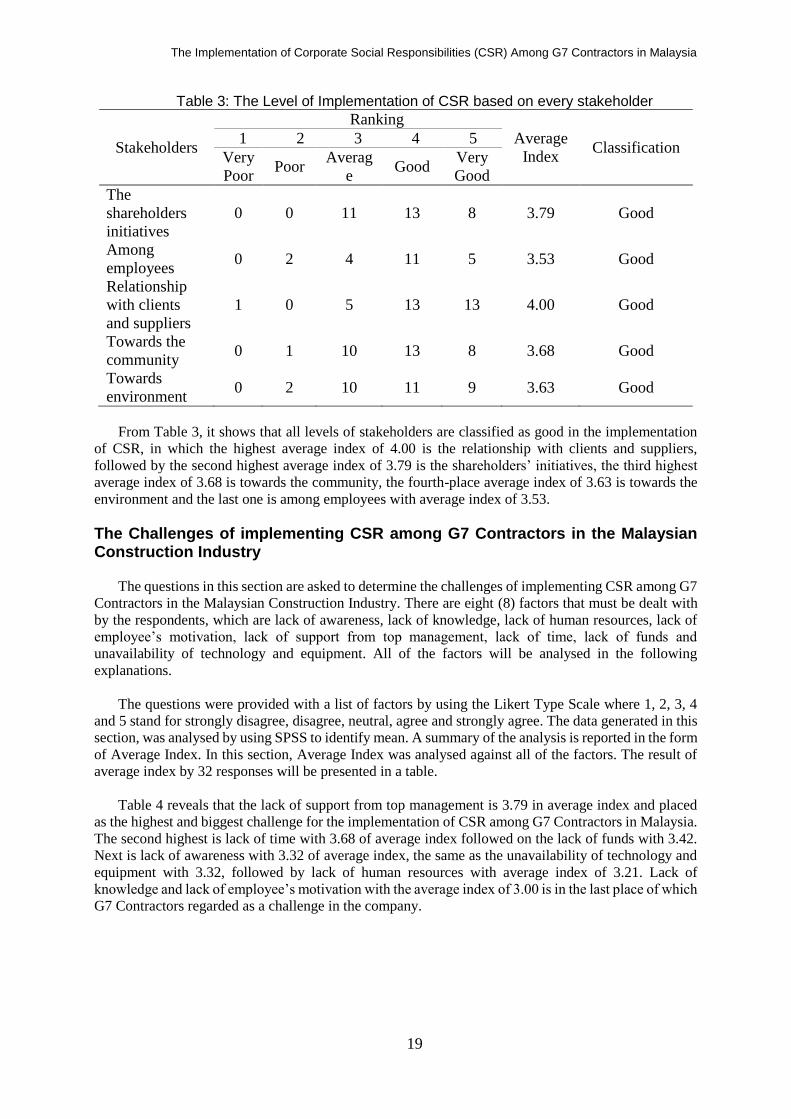
Table 3: The Level of Implementation of CSR based on every stakeholder
Stakeholders
Ranking
Average
Index Classification
1 2 3 4 5
Very
Poor Poor
Averag
e Good
Very
Good
The
shareholders
initiatives
0 0 11 13 8 3.79 Good
Among
employees 0 2 4 11 5 3.53 Good
Relationship
with clients
and suppliers
1 0 5 13 13 4.00 Good
Towards the
community 0 1 10 13 8 3.68 Good
Towards
environment 0 2 10 11 9 3.63 Good
From Table 3, it shows that all levels of stakeholders are classified as good in the implementation
of CSR, in which the highest average index of 4.00 is the relationship with clients and suppliers,
followed by the second highest average index of 3.79 is the shareholders’ initiatives, the third highest
average index of 3.68 is towards the community, the fourth-place average index of 3.63 is towards the
environment and the last one is among employees with average index of 3.53.
The Challenges of implementing CSR among G7 Contractors in the Malaysian Construction Industry
The questions in this section are asked to determine the challenges of implementing CSR among G7
Contractors in the Malaysian Construction Industry. There are eight (8) factors that must be dealt with
by the respondents, which are lack of awareness, lack of knowledge, lack of human resources, lack of
employee’s motivation, lack of support from top management, lack of time, lack of funds and
unavailability of technology and equipment. All of the factors will be analysed in the following
explanations.
The questions were provided with a list of factors by using the Likert Type Scale where 1, 2, 3, 4
and 5 stand for strongly disagree, disagree, neutral, agree and strongly agree. The data generated in this
section, was analysed by using SPSS to identify mean. A summary of the analysis is reported in the form
of Average Index. In this section, Average Index was analysed against all of the factors. The result of
average index by 32 responses will be presented in a table.
Table 4 reveals that the lack of support from top management is 3.79 in average index and placed
as the highest and biggest challenge for the implementation of CSR among G7 Contractors in Malaysia.
The second highest is lack of time with 3.68 of average index followed on the lack of funds with 3.42.
Next is lack of awareness with 3.32 of average index, the same as the unavailability of technology and
equipment with 3.32, followed by lack of human resources with average index of 3.21. Lack of
knowledge and lack of employee’s motivation with the average index of 3.00 is in the last place of which
G7 Contractors regarded as a challenge in the company.

Built Environment Journal
20
Table 4: The Challenges of implementing CSR
Factors
Ranking
Averag
e Index
Classifi
-cation
1 2 3 4 5
Strongl
y
Disagre
e
Disagree Neutra
l
Agre
e
Strongl
y Agree
Lack of awareness 2 6 9 10 5 3.32 Neutral
Lack of knowledge 1 11 6 10 4 3.11 Neutral
Lack of human
resources 0 11 12 5 4 3.21 Neutral
Lack of employee’s
motivation 1 10 9 5 7
3.00 Neutral
Lack of support from
top management 3 11 6 9 3 3.79 Agree
Lack of time 1 2 7 12 10 3.68 Agree
Lack of funds 0 6 5 10 11 3.42 Neutral
Unavailability of
technology and
equipment
1 7 9 10 5 3.32 Neutral
The ways of enhancing the Implementation of CSR among G7 Contractors in the Malaysian Construction Industry
The questions were designed to analyse the ways of enhancing the Implementation of CSR among
G7 Contractors in the Malaysian Construction Industry. The questions focused on governance
transparency system with investors and shareholders, application of policy by employees, close
relationship with clients and suppliers, concrete actions towards community and adoption of measures
on the environmental impact. All of the factors will be analysed in the following explanations.
The questions were already provided with a list of factors by using the Likert Type Scale where 1,
2, 3, 4 and 5 stand for strongly disagree, disagree, neutral, agree and strongly agree. The data generated
in this section, was analysed by using SPSS to identify mean. A summary of the analysis is reported in
the form of Average Index. In this section, Average Index was analysed against all of the factors. The
result of average index by 32 responses will be presented in a table.
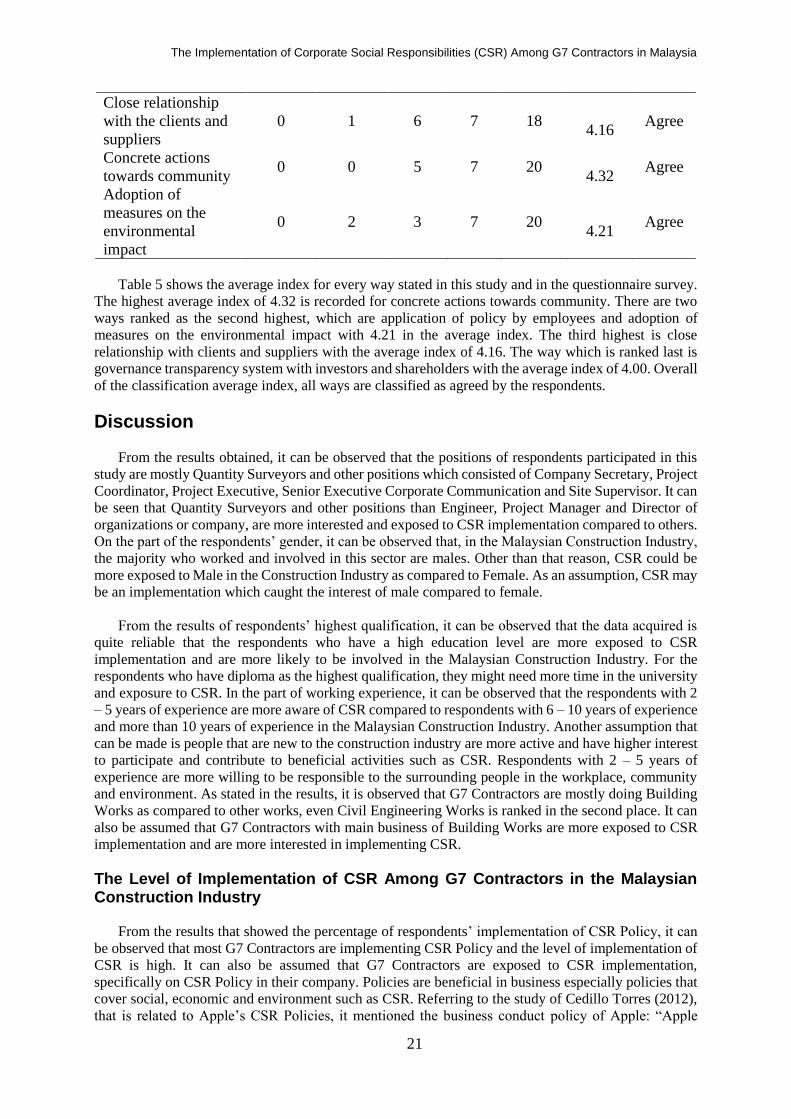
Table 5: The ways of enhancing the Implementation of CSR
Description Ranking Averag
e Index
Classif
ication 1 2 3 4 5
Strongl
y
Disagre
e
Disagree Neutra
l
Agree Strongl
y Agree
System of
governance
transparency with
investors and share
holders
0 2 7 7 16 4.00 Agree
Application of
policy by employees 0 3 3 6 20 4.21 Agree
The Implementation of Corporate Social Responsibilities (CSR) Among G7 Contractors in Malaysia
21
Close relationship
with the clients and
suppliers
0 1 6 7 18
4.16 Agree
Concrete actions
towards community 0 0 5 7 20
4.32 Agree
Adoption of
measures on the
environmental
impact
0 2 3 7 20
4.21 Agree
Table 5 shows the average index for every way stated in this study and in the questionnaire survey.
The highest average index of 4.32 is recorded for concrete actions towards community. There are two
ways ranked as the second highest, which are application of policy by employees and adoption of
measures on the environmental impact with 4.21 in the average index. The third highest is close
relationship with clients and suppliers with the average index of 4.16. The way which is ranked last is
governance transparency system with investors and shareholders with the average index of 4.00. Overall
of the classification average index, all ways are classified as agreed by the respondents.
Discussion
From the results obtained, it can be observed that the positions of respondents participated in this
study are mostly Quantity Surveyors and other positions which consisted of Company Secretary, Project
Coordinator, Project Executive, Senior Executive Corporate Communication and Site Supervisor. It can
be seen that Quantity Surveyors and other positions than Engineer, Project Manager and Director of
organizations or company, are more interested and exposed to CSR implementation compared to others.
On the part of the respondents’ gender, it can be observed that, in the Malaysian Construction Industry,
the majority who worked and involved in this sector are males. Other than that reason, CSR could be
more exposed to Male in the Construction Industry as compared to Female. As an assumption, CSR may
be an implementation which caught the interest of male compared to female.
From the results of respondents’ highest qualification, it can be observed that the data acquired is
quite reliable that the respondents who have a high education level are more exposed to CSR
implementation and are more likely to be involved in the Malaysian Construction Industry. For the
respondents who have diploma as the highest qualification, they might need more time in the university
and exposure to CSR. In the part of working experience, it can be observed that the respondents with 2
– 5 years of experience are more aware of CSR compared to respondents with 6 – 10 years of experience
and more than 10 years of experience in the Malaysian Construction Industry. Another assumption that
can be made is people that are new to the construction industry are more active and have higher interest
to participate and contribute to beneficial activities such as CSR. Respondents with 2 – 5 years of
experience are more willing to be responsible to the surrounding people in the workplace, community
and environment. As stated in the results, it is observed that G7 Contractors are mostly doing Building
Works as compared to other works, even Civil Engineering Works is ranked in the second place. It can
also be assumed that G7 Contractors with main business of Building Works are more exposed to CSR
implementation and are more interested in implementing CSR.
The Level of Implementation of CSR Among G7 Contractors in the Malaysian Construction Industry
From the results that showed the percentage of respondents’ implementation of CSR Policy, it can
be observed that most G7 Contractors are implementing CSR Policy and the level of implementation of
CSR is high. It can also be assumed that G7 Contractors are exposed to CSR implementation,
specifically on CSR Policy in their company. Policies are beneficial in business especially policies that
cover social, economic and environment such as CSR. Referring to the study of Cedillo Torres (2012),
that is related to Apple’s CSR Policies, it mentioned the business conduct policy of Apple: “Apple
Built Environment Journal
22
conducts business ethically, honestly and in full compliance with all laws and regulations” (Cedillo
Torres, 2012), in which it is applied to every business decision in every area of the company worldwide.
The discussed implementation of CSR is an application of policy by employees.
As observed from the results, most G7 Contractors practice CSR Programs and the level of
implementation of CSR is high. As mentioned by Senawi (2016), this positive development shows that
property organizations in Malaysia are heading towards enhancing their CSR measures. It shows that
there is a significant increase on the level of CSR disclosure since its implementation in 2006 (Senawi,
2016). All the respondents agreed that CSR is important in the construction industry, so it can be
assumed that G7 Contractors are well exposed to CSR implementation and realized the importance of
CSR in the construction industry, thus the level of implementation of CSR can be increased. As stated
in the results for the level of implementation for every stakeholder, it can be observed that most G7
Contractors implemented CSR, focusing on taking care of their relationship with clients and suppliers.
It can be assumed that any business organizations will likely to be focusing on the source of income and
making profits.
The Challenges of Implementing CSR among G7 Contractors in the Malaysian Construction Industry
As stated by Mwangi and Otieno-Mwembe (2015), there is a portion of the challenges in practicing
CSR which had to be faced, for example, deficient assets to do CSR exercises and absence of an
unmistakable authoritative and institutional structure to manage CSR exercises. What can be observed
from the results, the biggest challenge faced by G7 contractors is the lack of support from top
management that could be due to some unavoidable reasons faced by the top management. As stated by
Abdullah (2016) “low implementation of CSR among construction companies in Malaysia may indicate
barriers of implementing CSR such as lack of awareness, lack of knowledge, lack of human resources,
lack of employee’s motivation, no support of top management, lack of time, lack of funds, unavailability
of technology, too much duplication and over emphasis on inspection and cheating”. In this case, there
are still ways to improve and prevent these challenges faced by the G7 contractors.
The Ways of Enhancing the Implementation of CSR among G7 Contractors in the Malaysian Construction Industry
As stated by Zainal (2014), “firms are expected to take into consideration the social and
environmental implications of their business activities through the implementation of CSR-related
activities in their journey to maximise profit”. According to The CSR Digest (2008) when the company
helps to improve the conditions of the community it operates in, the community becomes more
prosperous and this ensures the company survival. It can be observed from the results that by evaluating
measures which include governance transparency system with investors and shareholders, application
of policy by employees, close relationship with the clients and suppliers, concrete actions towards
community and adoption of measures on the environmental impact. The results show that these measures
need to be practiced as CSR covers the whole area of social, economic and environment. The best
implementation is to cover all measures rather than focusing on one measure or few measures only.
Thus, all measures shall be encouraged more in their practice to increase the implementation of CSR
among G7 Contractors in Malaysia.
CONCLUSION
It was found that the level of implementation by every stakeholder from the findings obtained is
good and therefore, the implementation of CSR needs to be enhanced to reach the level of very good.
This can be made by having one responsible body or organization to lead in advertising and giving
advice regarding the benefits and advantages of doing CSR among them. It is important that they will
get the right understanding related to CSR benefits and advantages, thus will increase the level of
implementation of CSR among the G7 contractors. It was also found that the challenges of CSR
The Implementation of Corporate Social Responsibilities (CSR) Among G7 Contractors in Malaysia
23
implementation were lack of support from top management and lack of time. Therefore, all respondents
agreed that measures which include governance transparency system with investors and shareholders,
application of policy by employees, close relationship with the clients and suppliers, concrete actions
towards community and adoption of measures on the environmental impact will contribute in enhancing
the implementation of CSR. What can be concluded is, to enhance the implementation of CSR, measures
involving all stakeholders need to be taken for effective improvement. As an example, seminar,
exhibition and conference regarding joint venture need to be expanded to the maximum range. Thus,
general issues related to the CSR application could be minimized to a lower level and this may improve
the CSR application in the construction industry generally and G7 contractor sector specifically. The
implementation of CSR offers great benefits to the construction industry and with that, the promotions
of CSR implementation need to be expanded to encourage the implementation of CSR to reach and
achieve the same level as the international.
REFERENCES Abdullah, A. (2016) ‘The Practices of Corporate Social Responsibility among Construction Companies
in Malaysia’, Research Journal of Applied Sciences, Engineering and Technology, 12(7), pp. 742-
-755. doi: 10.19026/rjaset.12.2750.
Adeyanju, D. O. (2012). An assessment of the impact of corporate social responsibility on Nigerian
society: The examples of banking and communication industries. Universal Journal of Marketing
and Business Research, 1(1), pp. 017-043.
Cedillo Torres, C. A. (2012) ‘Four case studies on corporate social responsibility: Do conflicts affect a
company’s corporate social responsibility policy?’, Utrecht Law Review, 8(3), pp. 51–73. doi:
10.18352/ulr.205.
CIDB, C. I. D. B. M. (2016) ‘Contractor and Procedures Handbook’.
Department of Statistics Malaysia Press Release Malaysian Economic Indicators: Leading, Coincident
& Lagging Indexes August 2017’ (2017), (October).
Korschun, D., Bhattacharya, C. B., and Swain, S. D. (2014). Corporate social responsibility, customer
orientation, and the job performance of frontline employees. J. Market. 78, 20–37. doi:
10.1509/jm.11.0245
Mat Yahya, S. and Ismail, S. (2015). Performance Appraisal Amongst Contractors in Construction
Project in Malaysia. Applied Mechanics and Materials, 735, pp.154-158.
Meding, V. and Social, R. C. (2017) ‘Corporate Social Responsibility within the Northern Ireland
Construction Industry: A Regional Review Corporate Social Responsibility within the Northern
Ireland Construction Industry: A Regional Review’, (2013).
Mohamad, Z., Jaafar, M. A., & Clayton, G. J. (2012). Conference Proceeding: The 3rd International
Conference on Corporate Responsibility (CSR) & European Union Malaysian of Chamber of
Commerce & Industry (EUMCCI) Social Responsibility Week.
Mwangi, W. and Otieno-Mwembe, S. O. (2015) ‘the Use of Corporate Social Responsibility as a Tool
of Doing Business Amongst Kenya’S Construction Firms Introduction and Background’,
International Journal of Research in Business Management, 3(9), pp. 2321–886.
Nasir, N. E. M. (2015) ‘Corporate Social Responsibility: An Overview from Malaysia’, Journal of
Applied Environmental and Biological Sciences, 4(10S), pp. 82–87.
Ofori, G. (2015) ‘Nature of the Construction Industry, Its Needs and Its Development: A Review of
Four Decades of Research’, 20(2), pp. 115–135.
Senawi, A. (2016) ‘Corporate Social Responsibility Practices Among Malaysia Top Property
Developers’, The Social Sciences Research (ICSSR 2016), 2016(July), pp. 18–19. Available at:
http://worldconferences.net/home.
The CSR Digest (2008), Malaysia: CSR Report Card 2008 – Part 2 Retrieved 28 September:
http://www.csrdigest.com/2008/12/malaysia-csr-report-card-2008-part-1-marketplace/10
Zainal, D. (2014) ‘Stakeholders’ Influence on Corporate Social Responsibility Reporting (CSRR)’,
International Journal of Finance and Accounting, 3(1), pp. 29–36. doi:
10.5923/j.ijfa.20140301.04.
Built Environment Journal Vol. 16 No.1, 23 - 32, 2019
24
PEAT FIRE MAPPING USING GIS BASED MULTI-CRITERIA DECISION MAKING: STUDY AREA OF KUALA LANGAT,
SELANGOR
Ainon Nisa Othman, Hazrul Nizam Ismail, Nafisah Khalid, Maisarah Abdul Halim, Noorain
Mohamad Saraf
Centre of Studies for Surveying Science and Geomatics, Faculty of Architecture, Planning
and Surveying, Universiti Teknologi MARA, 40450 Shah Alam, Selangor Darul Ehsan,
MALAYSIA
ABSTRACT
Peat fire is a geological disaster that causes damages to
nature, human activities and environment. It is a geological
phenomenon that involves a wide range of forest fire,
vegetation burnt surface and smouldering fire underground.
Besides that, there are other contributing factors affecting the
peat fire and can lead to the forest fire disaster. In this study, GIS and MCDM Technique were
used as a tool to generate the prediction of peat fire potential area map at Kuala Langat,
Selangor. All the input is then being analyse in ArcGIS software. Many criteria may contribute
to the peat forest fire incident such as land use, temperature, pH value, and soil type criteria.
The main benefit for analysing the potential area is the possibility to prevent and predict peat
fire occurrences in future other than as a precaution step to face the problems.
Keywords: Peat Fire, Geographical Information System, Multi-Criteria Decision Making,
Prediction Peat Fire, Kuala Langat District
INTRODUCTION
Peat fires or peat forest fires are commonly known happened in our neighbouring country, which is
Indonesia (Usup et. al., 2004). Peninsular Malaysia were not of the same enormousness as them, but the
caused similarly destroy the vegetation, property, wildfire, public health and also the environment
(Rostam et al., 2010). Peat fire being known as foremost disaster that brought peat swamp forest damage
in a few regions of Malaysia (Setiawan et. al., 2004). Due to lacking acknowledgement of prevention
peat forest fire fighting technique and understanding the place to qualifying potential are made the
disaster become worse. Most of the fires involving the location of heath and peat forest plus in the bush
areas. The fires easily widespread even it is burned in a slow and inconsistent. According to Fire and
Rescue.
Department, thick peat layers are given away the fires spread slowly. It is hard to extinguish the
smouldering fire underground and also to detect them. An excessive water has to be used for completely
wet the surface area of peat because peat soil underground will continue to burn. Subsequently, lack of
necessary tools and deficiency of gaining experience by training to handle peat fire makes the
extinguishment of fire is difficult. So, monitoring and training necessary to prevent the symptoms of
forest fire is spreading in some parts of the region affected by the causes of fire.
There are five criteria that will investigate in order to predict the potential area of peat fire happen.
There is land surface temperature, soil type, PH value of soil, and land use (Ellery et al., 1989). These
five criteria will show the x y location and weightage to describe the potential area might happen in
scope of study area. Land surface temperature related with climate change which effected the peat fire
Received: 10 Oct 2018
Reviewed: 30 Dec 2018
Accepted: 18 Jan 2019

Peat Fire Mapping Using GIS Based Multi-Criteria Decision Making: Study Area of Kuala Langat, Selangor
25
burst by itself (Fanin et. al., 2016). When land surface temperature becoming too hot at noon, the fire
easily smouldering below on the ground and spread faster in surrounding of peat land. Using soil type
as reference, the compound of the soil is one of the causes that ignition of fire from moderate to strongly
flames (Cervarich et al., 2016). Soil type environment responsible to ignite the fire with a small spark
from any fuel around. Properties of soil can be used to find the peat area. There are a lot of soil type in
area of Kuala Langat. For precisely identified the location of peat soils may be easy and clearly recognize
(Rostam et al., 2010). According to Department of Agriculture (DOA), PH value of soils are important
to knowing the acidity of the soils. Peat soils contains the highest acidity compare to the other type of
soils and large amount of acid in soils may easily get burn by any fire sparks. By investigate the highest
PH value of soils, the peat soil may be recognized and can be located to a potential area of peat fires
(Cervarich et al., 2016). All of the criteria cannot support the fire burn without any human activities
(Marle et al., 2017). Land use data is very useful to know the surrounding of potential area involved the
human activities such as residential and factory operation (Noojipady et al., 2017).
Multi-Criteria Decision Making (MCDM) is one of the techniques collection that can be defined for
analysing depending on the spatial arrangement of the events by Geographic events results (Mäkelä,
2007). Weightage will be conduct with calculation due to the criteria chosen. The criteria used in this
study is depending on the suitability of the data. Overlaying the data or maps by using these technique
is really helpful and easy to understand to implement of the method. There are three methods under this
technique which are rating method, ranking method and pairwise comparison method.
METHODOLOGY
This research to verify the peat fire potential area using Geographical Information System (GIS)
and remote sensing technique. The peat fire potential area map derive from this project then may be
used as a guide to monitor peat forest fire occurrences in the location specified thus preventing or lessen
the peat forest fire activities in the area. The methods are explained from phase 1, phase 2, phase 3 and
phase 4. It includes the data acquisition, data processing, the planning process and lastly the details of
methodology used to generate the peat fire potential area map. The procedures including with the first
steps which is preliminary studies. Second with the data collection. Third will be the processing of the
data and lastly, the analysis. Peat fire potential area map will be produced it the final output after
proceeding the methodology.
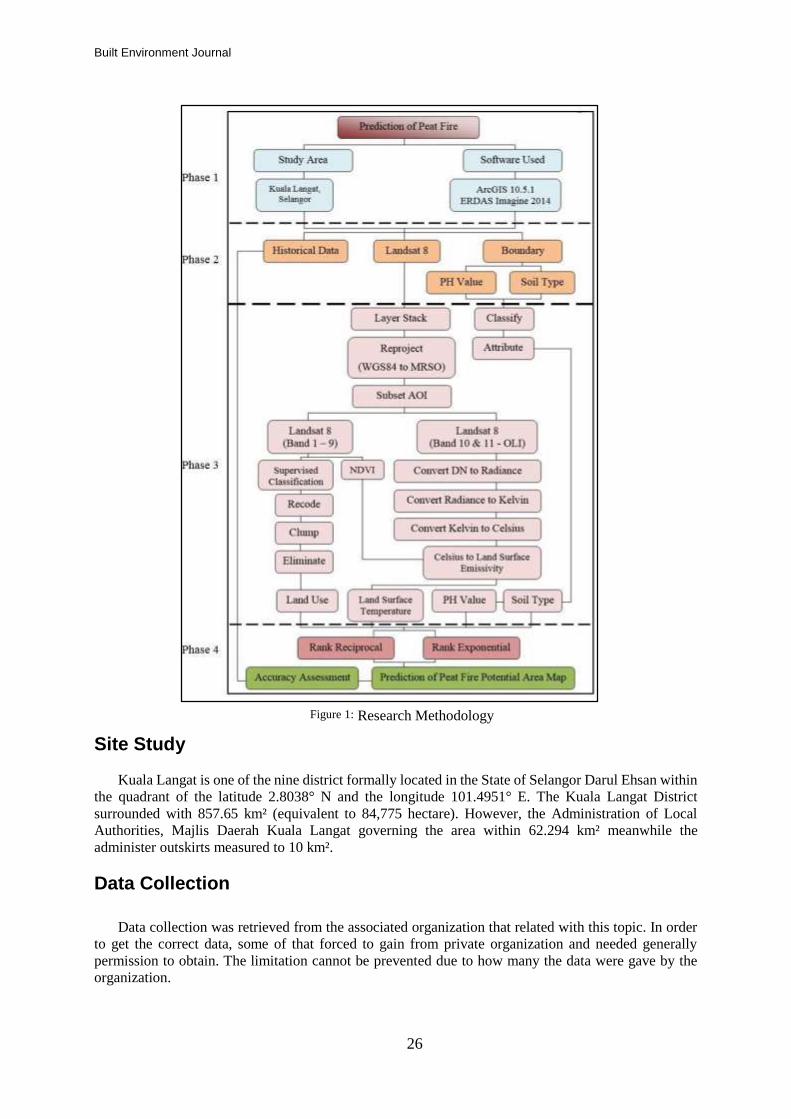
Built Environment Journal
26
Site Study
Kuala Langat is one of the nine district formally located in the State of Selangor Darul Ehsan within
the quadrant of the latitude 2.8038° N and the longitude 101.4951° E. The Kuala Langat District
surrounded with 857.65 km² (equivalent to 84,775 hectare). However, the Administration of Local
Authorities, Majlis Daerah Kuala Langat governing the area within 62.294 km² meanwhile the
administer outskirts measured to 10 km².
Data Collection
Data collection was retrieved from the associated organization that related with this topic. In order
to get the correct data, some of that forced to gain from private organization and needed generally
permission to obtain. The limitation cannot be prevented due to how many the data were gave by the
organization.
Figure 1 : Research Methodology
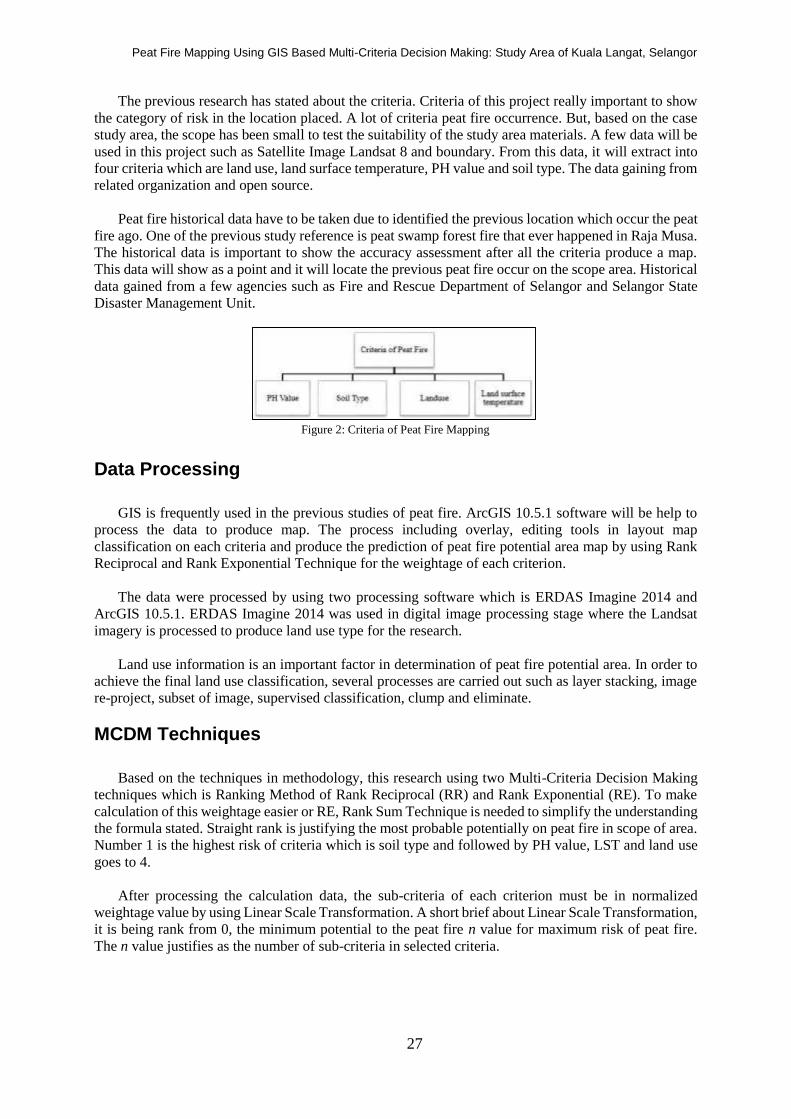
Peat Fire Mapping Using GIS Based Multi-Criteria Decision Making: Study Area of Kuala Langat, Selangor
27
The previous research has stated about the criteria. Criteria of this project really important to show
the category of risk in the location placed. A lot of criteria peat fire occurrence. But, based on the case
study area, the scope has been small to test the suitability of the study area materials. A few data will be
used in this project such as Satellite Image Landsat 8 and boundary. From this data, it will extract into
four criteria which are land use, land surface temperature, PH value and soil type. The data gaining from
related organization and open source.
Peat fire historical data have to be taken due to identified the previous location which occur the peat
fire ago. One of the previous study reference is peat swamp forest fire that ever happened in Raja Musa.
The historical data is important to show the accuracy assessment after all the criteria produce a map.
This data will show as a point and it will locate the previous peat fire occur on the scope area. Historical
data gained from a few agencies such as Fire and Rescue Department of Selangor and Selangor State
Disaster Management Unit.
Data Processing
GIS is frequently used in the previous studies of peat fire. ArcGIS 10.5.1 software will be help to
process the data to produce map. The process including overlay, editing tools in layout map
classification on each criteria and produce the prediction of peat fire potential area map by using Rank
Reciprocal and Rank Exponential Technique for the weightage of each criterion.
The data were processed by using two processing software which is ERDAS Imagine 2014 and
ArcGIS 10.5.1. ERDAS Imagine 2014 was used in digital image processing stage where the Landsat
imagery is processed to produce land use type for the research.
Land use information is an important factor in determination of peat fire potential area. In order to
achieve the final land use classification, several processes are carried out such as layer stacking, image
re-project, subset of image, supervised classification, clump and eliminate.
MCDM Techniques
Based on the techniques in methodology, this research using two Multi-Criteria Decision Making
techniques which is Ranking Method of Rank Reciprocal (RR) and Rank Exponential (RE). To make
calculation of this weightage easier or RE, Rank Sum Technique is needed to simplify the understanding
the formula stated. Straight rank is justifying the most probable potentially on peat fire in scope of area.
Number 1 is the highest risk of criteria which is soil type and followed by PH value, LST and land use
goes to 4.
After processing the calculation data, the sub-criteria of each criterion must be in normalized
weightage value by using Linear Scale Transformation. A short brief about Linear Scale Transformation,
it is being rank from 0, the minimum potential to the peat fire n value for maximum risk of peat fire.
The n value justifies as the number of sub-criteria in selected criteria.
Figure 2 : Criteria of Peat Fire Mapping
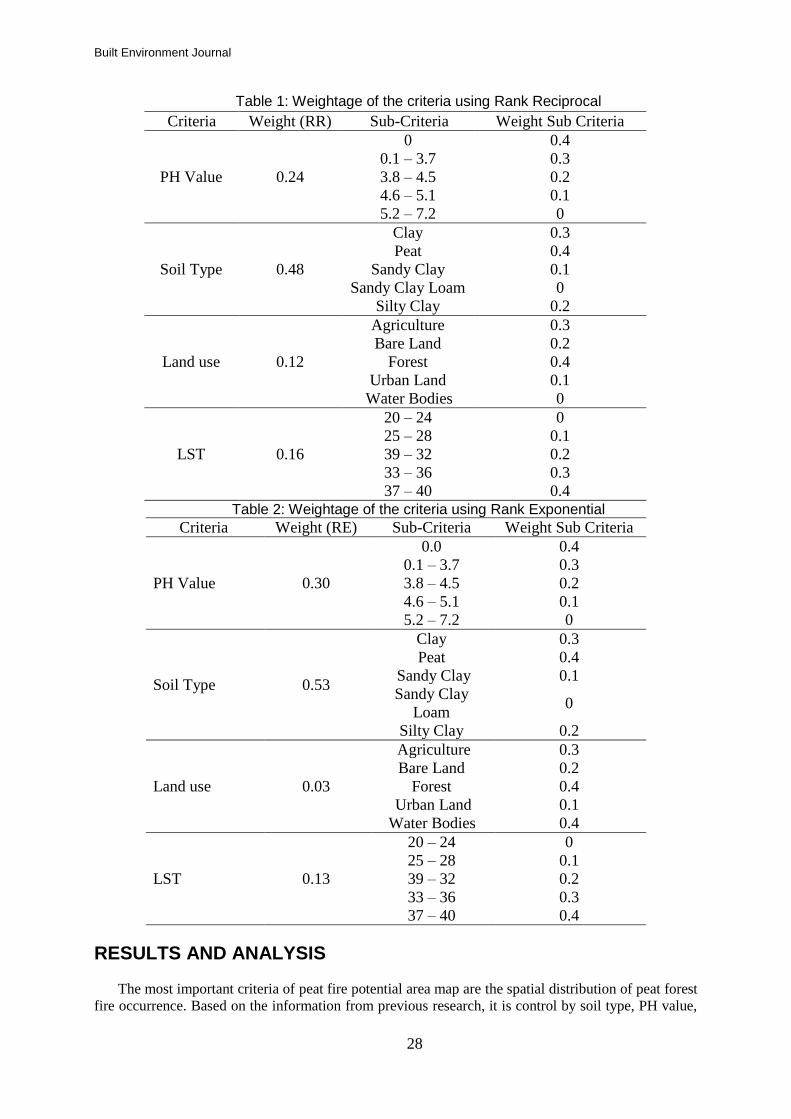
Built Environment Journal
28
Table 1: Weightage of the criteria using Rank Reciprocal
Table 2: Weightage of the criteria using Rank Exponential
Criteria Weight (RE) Sub-Criteria Weight Sub Criteria
PH Value 0.30
0.0 0.4
0.1 – 3.7 0.3
3.8 – 4.5 0.2
4.6 – 5.1 0.1
5.2 – 7.2 0
Soil Type 0.53
Clay 0.3
Peat 0.4
Sandy Clay 0.1
Sandy Clay
Loam 0
Silty Clay 0.2
Land use 0.03
Agriculture 0.3
Bare Land 0.2
Forest 0.4
Urban Land 0.1
Water Bodies 0.4
LST 0.13
20 – 24 0
25 – 28 0.1
39 – 32 0.2
33 – 36 0.3
37 – 40 0.4
RESULTS AND ANALYSIS
The most important criteria of peat fire potential area map are the spatial distribution of peat forest
fire occurrence. Based on the information from previous research, it is control by soil type, PH value,
Criteria Weight (RR) Sub-Criteria Weight Sub Criteria
PH Value 0.24
0 0.4
0.1 – 3.7 0.3
3.8 – 4.5 0.2
4.6 – 5.1 0.1
5.2 – 7.2 0
Soil Type 0.48
Clay 0.3
Peat 0.4
Sandy Clay 0.1
Sandy Clay Loam 0
Silty Clay 0.2
Land use 0.12
Agriculture 0.3
Bare Land 0.2
Forest 0.4
Urban Land 0.1
Water Bodies 0
LST 0.16
20 – 24 0
25 – 28 0.1
39 – 32 0.2
33 – 36 0.3
37 – 40 0.4

Peat Fire Mapping Using GIS Based Multi-Criteria Decision Making: Study Area of Kuala Langat, Selangor
29
land surface temperature and land use. These four criteria represented before calculating the weightage
then, merged together using union on MCDM techniques.
Table 3: Percentages historical point using Rank Reciprocal
Class Historical Percentages (%)
None 0 0
Very Low 1 8.3
Low 2 16.7
Medium 4 33.3
High 3 25
Very High 2 16.7
Table 4: Percentages historical point using Rank Exponential
Class Historical Percentages (%)
None 0 0
Very Low 1 8.3
Low 2 16.7
Medium 3 25
High 4 33.3
Very High 2 16.7
Figure 3 : Mapping of Peat Fire Using Rank Reciprocal
Figure 4 : Mapping of Peat Fire Using Rank Exponential

Built Environment Journal
30
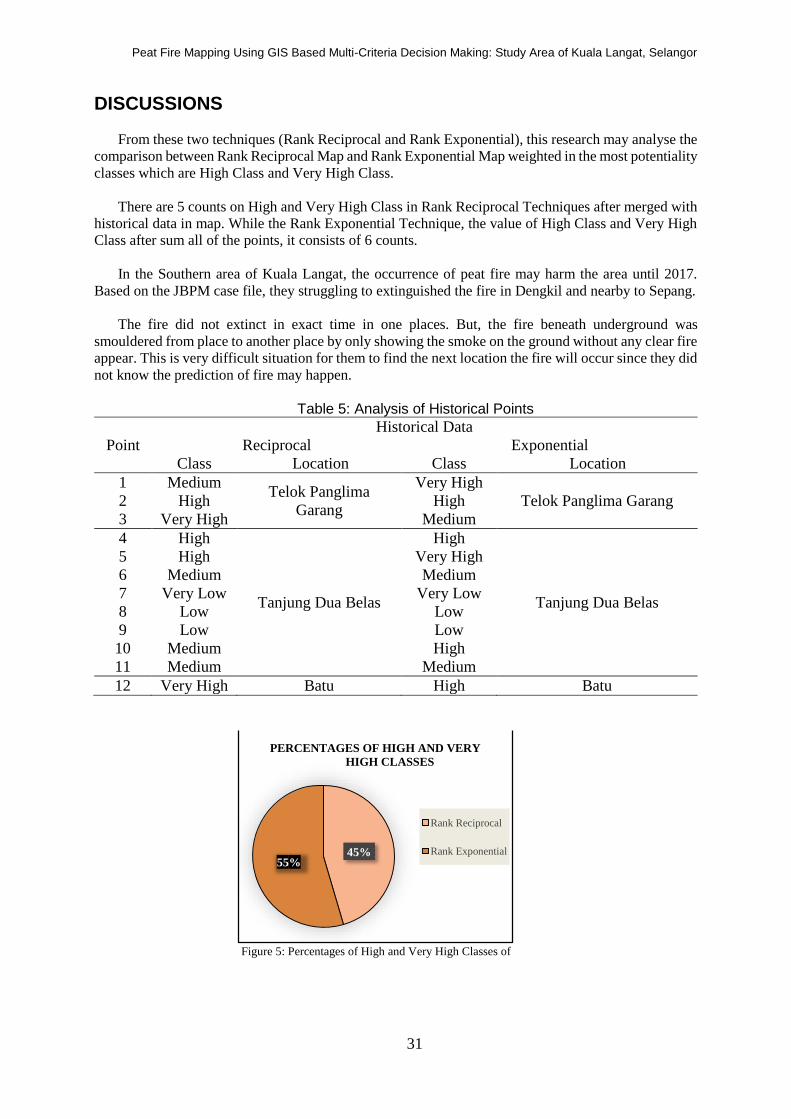
Peat Fire Mapping Using GIS Based Multi-Criteria Decision Making: Study Area of Kuala Langat, Selangor
31
DISCUSSIONS
From these two techniques (Rank Reciprocal and Rank Exponential), this research may analyse the
comparison between Rank Reciprocal Map and Rank Exponential Map weighted in the most potentiality
classes which are High Class and Very High Class.
There are 5 counts on High and Very High Class in Rank Reciprocal Techniques after merged with
historical data in map. While the Rank Exponential Technique, the value of High Class and Very High
Class after sum all of the points, it consists of 6 counts.
In the Southern area of Kuala Langat, the occurrence of peat fire may harm the area until 2017.
Based on the JBPM case file, they struggling to extinguished the fire in Dengkil and nearby to Sepang.
The fire did not extinct in exact time in one places. But, the fire beneath underground was
smouldered from place to another place by only showing the smoke on the ground without any clear fire
appear. This is very difficult situation for them to find the next location the fire will occur since they did
not know the prediction of fire may happen.
Table 5: Analysis of Historical Points
Point
Historical Data
Reciprocal Exponential
Class Location Class Location
1 Medium Telok Panglima
Garang
Very High
Telok Panglima Garang 2 High High
3 Very High Medium
4 High
Tanjung Dua Belas
High
Tanjung Dua Belas
5 High Very High
6 Medium Medium
7 Very Low Very Low
8 Low Low
9 Low Low
10 Medium High
11 Medium Medium
12 Very High Batu High Batu
Figure 5 : Percentages of High and Very High Classes of
45 % 55 %
PERCENTAGES OF HIGH AND VERY HIGH CLASSES
Rank Reciprocal
Rank Exponential
Built Environment Journal
32
Historical Data (RR and RE)
In a nutshell, Rank Exponential Technique is the most precision to use as a reference for the
prediction of peat fire in the future since it is shows 55% accurate than Rank Reciprocal Technique
which is 45% after analysing the historical data points in map.
CONCLUSIONS
The analysis of peat fire criteria which consists land use, land surface temperature, PH value and
soil type are complete to determine. Rank Reciprocal and Rank Exponential model was produced with
the series of weighted map derivation to achieve the first objective of this research. The findings of this
objectives analyse the sub-criteria of each criterion to be put in MCDM technique (Ranking Method).
This is important to discuss because it explains thoroughly about the criterion involved that prone to
peat fire occurrences. The first ranking of criteria is soil type since this research is about peat fire, so the
identifying the peat soil will be the first one. While it is followed by pH value, land surface temperature
and land use respectively. The final analysis is the prediction of peat fire potential area in Kuala Langat
that calculated from both predicted area model. The eastern of Kuala Langat more potential area of
happening peat fire. This is because that location consists a lot of peat soil and highest PH value. While
these two maps, Rank Exponential is more accurate than Rank Reciprocal to shows the potentiality of
peat fire after being merged with historical data.
ACKNOWLEDGEMENTS
Thanks to Tn. Alimaddia Bukri from JBPM for his patient guidance to enable this study is carried
out. Special thanks to who directly or indirectly involved in this study.
BIBLIOGRAPHY
Ahmad, M. F., & Samat, A. (2015). Species Composition and Abundance of Peat Swamp Fishes In
Selected Areas of Selangor, Malaysia. Malays. Appl. Biol., 44(1), 139-145.
Atwood, E. C., Englhart, S., Lorenz, E., Halle, W., Wiedemann, W., & Siegert, F. (2016, August 3).
Detection and Characterization of Low Temperature Peat Fires during the 2015 Fire Catastrophe
in Indonesia Using a New High-Sensitivity Fire
B., & Oelofse, R. (1989). A peat fire in the Okavango Delta, Botswana, and its importance as an
ecosystem process. Afr. J. Ecol., 27, 7-21.
Cervarich, M., Shu, S., Jain, A. K., Arneth, A., Canadell, J., Friedlingstein, P., . . . Zeng, N. (2016). The
terrestrial carbon budget of South and Southeast Asia. Environmental Research Letter (pp. 1-12).
Urbana: IOP Publishing.
Ellery, W. N., Ellery, K., McCarthy, T. S., Caincross,
Fanin, T., & Van der Werf, G. R. (2016). Precipitationfire linkages in Indonesia (1997-2015).
Biogeosciences Discuss (pp. 1 - 21). Amsterdam: Vrije Universiteit Amsterdam.
Fillkov, A. I., Sinyutkina, A., & Kharanzhevbkaya, Y. A. (2015). Geoinformation systems for
prediction of peat fires and its validation. 15th International Multidisciplinary Scientific
GeoConferences SGEM2015 (pp. 863-870). Tomsk: Siberian Research Institute of Agriculture
and Peat, 3 Gagarin Str.
Giuseppe, F. D., R'emy, S., Pappenberger, F., & Wetterhall, F. (2016). Improving GFAS and CAMS
biomass burning estimations by means of the Global ECMWF Fire Forecast system (GEFF). In
Technical Memorandum. ECMWF Publications.
Hazard Zonation,” Procedia: Social and Behavioral Sciences 35, 595-602 (2012). Malaysian Journal of
Society and Space, 6(2), 37 - 50.
Marle, M. J., Kloster, S., Magi, B. I., Marlon, J. R., Daniau, A., Field, R. D., Van der Werf, G. R.
(2017). Historic global biomass burning emissions based on merging satellite observations with
proxies and fire models (1750-2015). Geoscientific Model Development, 1(6), 1-56.
Peat Fire Mapping Using GIS Based Multi-Criteria Decision Making: Study Area of Kuala Langat, Selangor
33
Mer, J. L., & Roger, P. (2001). Production, oxidation, emission and consumption of methane by soils:
A review. Eur. J. Soil Biol., 37, 25-50.
Monitoring Satellite Sensor (FireBird). Retrieved from
http://journals.plos.org/plosone/article?id=10.1371/journal.pone.0159410
Nancy, H. (2016). Global Forest Watch Climate: Summary of Methods and Data. Washington: World
Resources Institute.
Nazeer, N., & Furuoka, F. (2017). Overview of ASEAN Environment, Transboundary Haze Pollution
Agreement and Public Health. Transboundary Haze Agreement, 13(1), 73 - 94.
Noojipady, P., Morton, D. C., Schroeder, W., Carlson, K. M., Huang, C., Gibbs, H. K., . . . Prince, S.
D. (2017). Managing fire risk during drought: the influence of certification and El Niño on fire-
driven forest conversion for oil palm in Southeast Asia. Earth Syst. Dynam. Discuss, 1(10), 1 -
23.
Othman, A. N., Naim, W. M., and Surip, N., “GIS Based Multi Criteria Decision Making for Landslide
Poh, T. C., Yi, K. J., Sing, L. K., Bahari, S., Tat, E. H., & Teik, C. H. (2006). Applications of Remote
Sensing in The Monitoring of Rice Crops. The Institution of Engineers, 67(4), 2-11.
Rein, G., Cleaver, N., Ashton, C., Pironi, P., & Torero, J. L. (2008). The Severity of Smouldering Peat
Fires and Damage to the Forest Soil. BRE Centre for Fire Safety Engineering (pp. 304-309).
United Kingdom: University of Edinburgh.
Rosdi, M. A. H. M., Latif, Z. A., Othman, A. N., and Nasir, N. M., “Sinkhole Susceptibility Hazard
Zones Using GIS Framework and Heuristic Method,” In: Advances in Remote Sensing and Geo
Informatics Applications. Advances in Science, Technology & Innovation (IEREK
Interdisciplinary Series for Sustainable Development). Springer, Cham., pp. 261-264 (2018).
Rosdi, M. A. H. M., Othman, A. N., Zubir, M. A. M., Latif, Z. A., and Yusoff, Z. M., “Sinkhole
Susceptibility Hazard Zones Using GIS and Analytical Hierarchical Process (AHP) – A Case
Study of Kuala Lumpur and Ampang Jaya,” In: International Archives of the Photogrammetry,
Remote Sensing and Spatial Information Sciences-ISPRS Archives, 42(4W5), pp. 145-151
(2017).
Rostam, K., Rosul, M., Choy, E. A., Mohd Nor, A. R., Sakawi, Z., Hashim, N. M., & Muhammad, A.
E. (2010). Urbanisation and urban sprawl in the fringe areas of Klang-Langat Metropolitan
Region.
Setiawan, I., Mahmud, A. R., Mansor, S., Mohamed Shariff, A. R., & Nuruddin, A. A. (2004). GIS-
gridbased and multi-criteria analysis for identifying and mapping peat swamp forest fire hazard
in Pahang, Malaysia. Disaster Prevention and Management: An International Journal, 13(5),
379-386.
Suliman, M. D., Mahmud, M., & Reba, M. N. (2014). Mapping and Analysis of Forest and Land Fire
Potential Using Geospatial Technology and Mathematical Modeling. Earth and Environmental
Science (pp. 1-6). Skudai: IOP Publishing.
Usup, A., Hashimoto, Y., Takahashi, H., & Hayasaka, H. (2004). Combustion and thermal
characteristics of peat fire in tropical peatland in Central Kalimantan, Indonesia. Tropics, 14, 1-
16.
Van der Werf, G. R., Randersion, J. T., Giglio, L., Collatz, G. J., Mu, M., Kasibhatla, P. S., . . . Van
Leeuwen, T. T. (2010). Global fire emissions and the contribution of deforestation, savanna,
forest, agricultural, and peat fires (1997–2009). Atmospheric Chemistry and Physics (pp. 11708 -
11735). Amsterdam: Copernicus Publications.
Yukili, L., Nuruddin, A. A., Abdul Malek, I. A., & Mohamad Razali, S. (2016). Analysis of Hotspot
Pattern Distribution at Sabah, Malaysia for Forest Fire Management. Journal of Environmental
Science and Technology, 9(3), 291-295.

Built Environment Journal
34
Built Environment Journal Vol. 16 No.1, 49 - 58, 2019
35
COMMUTERS’ TRAVEL CHARACTERISTICS, MODAL CHOICE AND PERFORMANCE OF PUBLIC TRANSPORT
OPTIONS IN LAGOS, NIGERIA
Wale Alade1, Mobolaji Olaseni2 and Olufemi Adeniji3 1 & 3 University of Lagos
2Yaba College of Technology
Correspondence email: [email protected]
ABSTRACT
In the past decade-plus there has been a paucity of
comparative studies of the performance of public transport
options in Lagos. This study evaluates commuters’ access to
public transport modes (yellow bus, BRT and ferry), trip
characteristics, factors influencing choice of, and the
performance of each mode in Lagos to establish improvement priorities. Research data was
obtained from 124 commuters through close-ended questionnaire at selected terminals on a
major corridor during the morning peak period using incidental sampling technique. The
performance of public transport modes was measured using seven variables on a 5-point rating
scale. Analysis of variance show significant variation in commuters’ trip cost to terminals. The
BRT is the most affordable with respect to fare but has the worst boarding delay occurrence,
the ferry is the most efficient with respect to trip time while 45% of yellow bus passengers spend
more than one hour per trip. From the linear regression results, delay time at the terminals,
travel time and travel cost to destinations accounted for about 55.8% of the total variance in
the preferred mode of travel. From the relative performance analysis results, the BRT has the
highest mean performance index of 3.72, followed by ferry (3.01) and the yellow bus (2.62).
These findings facilitate our understanding of factors influencing the performance and choice
of public transport modes in Lagos while providing insights into areas needing attention for
improvement. Based on these findings, the study recommended the provision of more BRT buses
to reduce the waiting time at terminals, and the review of ferry operations to reduce fare and
enhance safety and introduce measures to upscale the services of the for better performance.
Future studies should explore commuter waiting and comfort at bus stations and terminals and
on-board time use.
Keywords: Commuter; Modal Choice; Public Transport; Travel Behaviour; Mobility;
Performance
INTRODUCTION
Mobility has been identified as an essential component of life for humans, constituting an integral
part of the daily round of activities (Albalate and Bel, 2010). In recent times and in most cities, the
peoples’ mobility needs have been adequately met by the public modes of transport (Sam et al., 2014),
thus highlighting the services provided by these modes as specific and germane (Polat, 2012). As a basic
instrument of mobility for larger proportion of the population in almost all countries, public transport
ranks highly among the basics essentials of peoples’ daily living and this explains why it is not only
demanded but also required in modern times.
Globally and in Africa, public transport forms one of the driving forces of economic and social life
as it defines the behaviors and living standards of public commuters. Implicitly, public travel refers to
Received: 28 July 2018
Reviewed: 30 Dec 2018
Accepted: 18 Jan 2019

Built Environment Journal
36
the movement of passengers from a point of origin to another point of destination by group transport
systems available for use by the public and operated on established routes with attached financial cost
(Schofer, 2018). It could be inferred that commuters are people who exhibits the main characteristics
inherent in this definition of public travel. This includes journeying from one place to another, use of
systems/modes of group/public transport and the use of established routes for trips.
Commuters often find themselves in a public transport environment that is dynamic and even
interactive. This environment is characterized by a combination of alternative transport modes, various
types of passengers (such as students, workers and leisure commuters) with different travel purposes,
different travel frequencies and different travel times (Polat, 2012). This situation is typical of what exist
in cities of developed and developing countries of the world, including nations in sub-Saharan Africa,
and Nigeria is no exception.
The performance of different modes of public transport has been closely associated with commuters’
satisfaction which is a product of derived utility. It is also seen as a determining factor on modal choices
as well as a vital means of analysing commuters’ behaviour in the aspect of choice of mode (Mintesnot
and Shin-ei, 2007). Besides, Cao and Cao (2017); de Oña and de Oña (2015); Zhang, Cao, Nagpure, and
Agarwal (2017), reported that passenger satisfaction assessment helps service providers to set strategic
development goals and to determine service improvement priorities within limited budgets, to ultimately
improve the performance of service providers (Irfan, Kee, & Shahbaz, 2012).
Travel behaviour as an associate of choices of public transport and commuters’ satisfaction is
described as what people do over space, and how people make use of transport. Without a proper
understanding of the system dynamics and more importantly the behaviors of public commuters,
accurate forecasts and knowledge required for planning and policy making in public transportation
would be difficult to realise (Taylor and Camille, 2012). Thus, an analysis and understanding of the
performance of public transport, and the factors influencing modal choice and travel behaviors is
germane for the attainment of an efficient and effective public transport system in cities with a high rate
of population growth such as Lagos megacity.
In the past decade, Lagos state government has invested more in the expansion of public transport
system with the introduction of Bus Rapid Transit (BRT) to complement and ultimately replace the
conventional yellow (mini) bus and the development of water transport through public-private
partnership as entrenched in the state’s strategic transport masterplan (2002). The Lagos Rail project
has not yet completed, hence, excluded in this study. Although evidence from literature indicates that a
number of studies have explored the performance of the public transport system in Lagos (Olufemi,
2008; Adebambo and Adebayo, 2009; Bashorun and Rotowa, 2012; Amiegbebhor, Akarakiri and
Dickson, 2016), these existing studies have largely ignored the comparative analysis of the options
available to commuters. This study therefore examines the performance of the three dominant public
transport options (BRT, yellow bus and ferry) in Lagos, it evaluates commuter access to each mode and
the factors that influence modal choice.
The paper adopts the relative performance analysis (RPA) to determine the performance of each
mode. Then it employs linear regression to establish the factors influencing commuters’ modal choice.
Access to public transport and trip characteristics were analysed descriptively, however, analysis of
variance was used to establish the significance of the variation in commuters’ access to public transport.
The limited number of studies on this subject has hindered the capacity of practitioners to design and
enhance transport services with informed empirical knowledge, especially in respect of the yellow bus
being the only informal mode among the options studied in this paper.
Following the introduction, the next section reviews the literature on determinants of commuter
choice, travel behaviour and public transport performance. The methods of research and analysis are
presented in the third section while section 4 discusses the results of commuters’ access, travel
characteristics, factors influencing modal choice and the performance of public transport modes. The
final section summarizes the key findings and makes recommendations for future research.
Commuters’ Travel Characteristics, Modal Choice and Performance of Public Transport Options in Lagos, Nigeria
37
LITERATURE REVIEW
Determinants of Commuters’ Choice of Public Transport and Travel Behaviour
The preference of one mode of public transport over the other is unarguably dependent on a wide
range of factors as commuters are wont to choose travel modes most likely to offer them maximum
utility. As identified by Polat (2012) the factors of fare, travel time (walk access time and accessibility
of transport, waiting time, in-vehicle (journey time), service quality, comfort, reliability, availability and
costs of alternative travel modes, time of travel, purpose of travel and lastly the level of public transport
dependency are the demand determinants of public transport. There are other factors aside the
aforementioned that play significant roles in determining the choices and behaviour of passengers.
Researchers have argued that perceived safety and security orientation of a transport service provider
by commuters may also play active role in the decision of which service provider to patronize (Sam et
al., 2014).
Transport fares are critical to the supply of public transport services since they serve as the main
source of income for operators. Bresson et al., (2004) stated that the relationship between fares and
public transport patronage tend to be inverse, where higher fares are associated with decreased patronage
and vice versa. It is however, noted that the effect of fares on patronage is not similar in all modes of
public transport and in all time frames. For instance, Crotte (2008) examined the factors that
characterized travel demand in Mexico City and discovered that changes in fares did not explain changes
in Metro demand in Mexico City. The study detected that rather service improvements had a more
significant effect on patronage than changes in Metro fares or gasoline prices (Polat, 2012).
Travel time has been one of the significant factors that influence both the choice and use of one
public transport mode to the other. The fact that commuters cannot increase their travel time indefinitely
emphasizes its importance (Golob et al., 1972). There are several components of travel time within the
purview of public transport (Polat, 2012). Walk (or access) time, waiting time and journey (in-vehicle)
time are the three main components of travel time and the value attached to each of these components
vary from one commuter to the other. For a typical public commuter, the price includes many of these
cost components including access times to service points and final destinations, waiting times at stops
and interchanges and travel times at vehicles which in its entirety influence the commuters’ assessment
of public transport services (Horn, 2003).
The quality of service delivery on each public travel by each mode of public transport is another
variable with a direct and powerful influence on the choice and patronage of public commuters (FitzRoy
and Smith, 1998). Service quality includes but not limited to waiting time, service frequency, operating
speed, reliability and comfort (Sam et al., 2014). Despite the difference in the level of importance
attached to comfort from one group of passengers to another based on the journey time, journey purpose
and passenger type, comfort is a quality factor that should be considered. Comfort is expected to
positively affect demand on a mode of transport (Polat, 2012) and determine the pattern exhibited by
commuters on their trip. Another point to consider is the degree of overcrowding in vehicles as this is
expected to affect comfort and invariably create unpleasant and uncomfortable travel experiences for
commuters.
Seating arrangements in the vehicle and leg- room space as well as general vehicle cleanliness are
other aspects of comfort a vehicle and other modes of public transport should provide (Sam et al., 2014).
Koppelman and Lyon (1981) emphasized that people’s perceptions about convenience and comfort as
well as their normative beliefs associate positively with preference and hence the choice for a given
mode of transportation. It is even thought that elements with the most physiological importance to
comfort are those which affect quality of a ride as well as the effort of driving such as noise, vibration,
ventilation, glare, odour and seating arrangement (Neumann et al., 1978). Scholars have suggested that

Built Environment Journal
38
choice of mode for various trips is either directly or indirectly influenced by people’s personal
circumstances including their age, gender, household size, educational attainment and income
(Buchanan et al., 2006).
Perceptions of safety as well as travel experience with a mode of transport are likely to influence
travel decisions, behaviors and preference for one mode from the other (Ankomah, Crompton, and Baker
1996). The degree of reliability of the services on a mode of public transport is another important
determinant of preference, patronage and travel behaviour. Reliability on a transport mode refers to the
degree of dependability on and trust-ability of passengers in the services provided. It includes features
such as accessibility and confidence because the passengers should be able to depend on those services
and be able to see that they are obtainable on regular basis and are long termed. Longer waiting times
due to late arrival of buses and excessive in-vehicle times due to traffic or system problems reduce
reliability, one of the clearest measures of which is the degree of those services’ following time
schedules announced (Sam et al., 2014). Other factors such as service frequency and service capacity
also determine the usability of public transport services and thus also affect the reliability. If the service
capacity available is insufficient to meet the current demand, commuters are less likely to find those
services reliable”.
Public Transport Performance
Studies on performance of public transport abound in literature but largely skewed towards
passenger satisfaction and largely concentrated in the global north than the south. Besides, majority of
those studies concentrate on rail. Agunloye, Alade and Fadare (2010) investigated the performance of
passenger train service in Lagos, Nigeria. The study adopts a descriptive analysis based on the
perception of the intra-urban train passengers on service adequacy using six variables which include
safety, comfort, accessibility, reliability, fare and efficiency. The study concludes that train service is
Lagos is adequate and recommended the modernization of the system for better performance.
Similarly, Afolabi (2016) examined commuter perception and preferences on Lagos BRT. The study
was purely descriptive and merely used two variables (quality of service and reason for patronage) to
assess passengers’ evaluation of the BRT service. The study noted that 37% of respondents chose
affordability for patronage and about 50% rated service quality as good. In another study, Alade and
Olaseni (2018) explored the performance of the BRT in Lagos using passenger satisfaction index using
13 variables. The study revealed that the BRT generally offers a good service but concludes that 10
years down the line, passengers are still not satisfied with waiting time to board and comfort in transit
which are critical priorities as the government expands the BRT infrastructure.
In the global north, Zhen, Cao and Tang (2018) noted in their study of satisfaction with high-speed
rail (HSR) in China that rider satisfaction is an important research topic in the field of transit which has
received little attention, presumably because of its limited impact on transportation systems in English-
speaking countries such as the Netherlands, Australia, Canada, the UK, and the US. Chou and Kim
(2009) employed structure equations models (SEM) to compare HSR satisfaction of 418 passengers in
Taiwan and 414 passengers in Korea. In the study, it was assumed that service quality affects satisfaction
directly and indirectly through its influence on corporate image, and satisfaction in turn influences
complaints and loyalty. In their models, service quality is a latent construct underlying five groups of
observed service attributes including riding security, access convenience, service responses, tangible
facilities, and riding comfort.
Cao and Chen (2011), following the research design of Chou and Kim (2009), examined satisfaction
of 386 passengers of the Shanghai-Nanjing HSR. They reached the same conclusion on the relationships
among service quality, corporate image, and customer satisfaction as Chou and Kim (2009). Although
this study sheds light on HSR in China, it is also vulnerable to the limitation of Chou and Kim (2009).
Zhen, Cao and Tang (2018) reported that Wu, Lin, and Hsu (2011) overcomes the limitation of a
reflective SEM by explicitly measuring service quality, noting that, the study developed a conceptual

Commuters’ Travel Characteristics, Modal Choice and Performance of Public Transport Options in Lagos, Nigeria
39
model to connect service quality, perceived value, corporate image, satisfaction, and behavioral
intentions.
In another study reported by Zhen, Cao and Tang (2018), Lee, Jin, and Ji (2009) used 453 HSR
passengers in Korea to explore the effects of ambient, seat, tunnelling effect, and motion sickness factors
on human fatigue and ride comfort. The study appeared to employ a formative SEM as the latent
construct of ride comfort as predicted by seat comfort, overall satisfaction, and ride comfort. The results
showed that in terms of HSR attributes, both seat factors and ambient factors affect ride comfort; seat
pitch and width influence it the most.
Finally, Zhen, Cao and Tang (2018) noted that studies (e.g., Chou & Kim, 2009; Chou & Yeh, 2013)
examined the relationship between service quality and HSR satisfaction from a marketing perspective
and substantiated the relationship. The studies shed light on the significant impact of service quality on
customer satisfaction, loyalty, and behavioral intention. However, the reflective SEM used in these
studies does not allow researchers to differentiate which service attributes have a more important role
than others. A few studies assess the relative importance of different service attributes (e.g., Lee et al.,
2009; Wu et al., 2011), however, this study extracts seven variables from literature for assessing the
performance of public transport options using linear regression model to enable practitioners identify
key influential attributes for service and system improvement.
METHODOLOGY
The study utilised both quantitative and qualitative research approach to achieve its goal of
comparative analysis of commuters’ modal choice, travel behaviors and the performance of the three
major public modes in Lagos excluding rail transport on the Ikorodu-Lagos Island corridor. The corridor
which connects the northern and southern parts of Lagos together is the only corridor that features the
three public transport modes. The questionnaires are designed based on the literature and informed
knowledge. Primary data on commuter’s socio-economic access to public transport (travel mode, time
and cost to terminals), travel characteristics (travel time and cost to destination, delay at terminals etc.),
and, commuters’ assessment of public transport options e.g. fare, reliability, safety etc. to measure
performance.
Due to the nature of the research, selection of sample size is usually difficult since sampling frame
cannot be easily determined, hence, data was obtained from 124 commuters through close-ended
questionnaire at selected terminals during the morning peak period using incidental sampling technique.
This is a method where all passengers met at the terminals were purposively selected and sampled as
respondents. The performance of public transport modes was measured using seven variables (fare,
safety, waiting time to board, trip time, convenience, efficiency and user friendliness) on a 5-point rating
scale (1 = poor, 2 = fair, 3 = good, 4 = very good and 5 = excellent). The morning peak period was
chosen as the time to obtain data at selected terminals. Further, participant’s observation was also
adopted, using the three means of transportation to fully understand, analyse and compare between the
road and water modes of transportation.
Commuters’ access to public transport and travel characteristics were analysed descriptively using
frequency distribution. Analysis of variance was used to test the significance of the variation in
commuters’ access to public transport while linear regression analysis was used to determine the factors
that influence modal choice and relative performance analysis (RPA) was used to measure the
performance of each mode by calculating the mean performance index.
DATA ANALYSIS AND DISCUSSION
The analysis of data obtained from the field survey was carried out under four main categories.
These categories are the central issues examined in the study, namely, the socio-economic attributes of

Built Environment Journal
40
respondents (public commuters), users access to public transport, commuters’ experiences with public
transport and the performance of the selected modes of public transport in the study area.
Socio-Economic Attributes of Respondents
The analysis of the socio-economic characteristics of public commuters as compared among the
preferred mode of travel of the respondents, present variations in the demographic attributes of the users
as shown in Table 1. With respect to the gender distribution of public commuters, it was observed that
there was an even distribution of the male and female users of the yellow buses, a slight variation in the
gender distribution among the BRT users and a much wider disparity among users of the ferry services.
Thus, there were more proportion of male users of the BRT and ferry modes of public transport in the
study area as expressed in the percentage distribution of the respondents which was 50%, 59.1% and
70% of the user respondents of the yellow buses, BRT and ferry services respectively that were male.
The analysis of the age distribution of the respondents’ modal choice of transportation indicates that
more than half of the users who adopted road transport as a means of transportation were between the
ages of 16 and 35 years. The age distribution of the users of water transport (ferry) also revealed that a
sizeable proportion of the users were between ages 26 and 40 years. The age distribution of users of the
yellow buses indicated that about 27.5% were in the 16-25 years’ age group, 37.5% belonged to the 26-
35 years’ group and 20% were between ages 36-45 years. Other include 12.5% and 2.5% who belonged
to the 46-55 years and 56-65 years’ age groups respectively. Hence, it is evident that most public
commuters within the study area irrespective of their modal choice were young adults between the age
of 18 and 45 years, otherwise known as the active age group.
Further analysis of the socio-economic characteristics of the respondents as shown in Table 1 reveals
that the modal choices of respondents varied in relation to their educational attainment and employment
status. It was observed that public commuters by ferry had a minimum of secondary school education
and almost 60% of these commuters were employed by the informal sector of the economy. The sizeable
proportion of commuters engaged in informal activities further attest to the potential of the inland water
ways for movement of bulk goods, thereby easing the stress on the highways. Public commuters by BRT
were also noticed to have a minimum of basic primary education with about 65% of them employed
formally and informally, while a reasonable amount of the unemployed were students. The users of the
yellow buses were mainly literate people with about 85% of them having a minimum of secondary
school education. More than 70% of these users were employed either formally or informally while the
remain users than are less than 30% of the respondents were students and an insignificant proportion of
the unemployed. The public commuters across the three identified modal choices that were sampled for
the study were observed to be predominantly literates and employed. This is consistent with the nature
of the metropolitan area that has been identified as a city with a high level of commerce and employment
opportunities for skilled, semi-skilled and unskilled labour.
The average monthly income of the users of the yellow buses indicated that the respondents who
earned ₦100,000 and below monthly constituted about 75%, while 30% and 7.5% earned average
monthly incomes of ₦100,001 to ₦150,000 and ₦150,001 to ₦200,00 respectively. Similarly, about
90% of the users of the BRT earned ₦100,000 and below while 6.4% and 3% earned between ₦100,001
and ₦200,000 and a much insignificant proportion of about 3% earned above ₦200,000. Public
commuters by ferry however, had a different average monthly earning from the road users as it was
noticed that over 65% of these users earned more than ₦100,000 monthly. About 26.5% of respondents
who travelled by ferry earned between ₦50,000 and ₦100,000, while less than 10% of the user
respondents earned less than ₦50,000. Evidently, the occupation and monthly income of public
commuters influence their preferences on modes of public transport.

Commuters’ Travel Characteristics, Modal Choice and Performance of Public Transport Options in Lagos, Nigeria
41
Table 1: Socio-economic attributes of commuters
Demographic Attributes Yellow Bus
(N=40)
BRT (N=44) Ferry (N=40)
Freq % Freq % Freq %
Gender Male 20 50.0 26 59.1 28 70.0
Female 20 50.0 18 40.9 12 30.0
Total 40 100.0 44 100.0 40 100.0
Age (years) 16 - 25 11 27.5 11 25.0 2 5.0
26 - 35 15 37.5 21 47.7 12 30.0
36 - 45 8 20.0 9 20.5 20 50.0
46 - 55 5 12.5 2 4.5 5 12.5
56 - 65 1 2.5 1 2.3 1 2.5
Total 40 100.0 44 100.0 40 100.0
Educational
Qualifications
None 3 7.5 - - - -
Primary 3 7.5 1 2.3 - -
Secondary 16 40.0 17 38.6 9 22.5
Tertiary 18 45.0 26 59.1 31 77.5
Total 40 100.0 44 100.0 40 100.0
Employment
Status
Employed
(formal)
9 22.5 13 29.5 23 57.5
Employed
(informal)
21 52.5 16 36.4 12 30.0
Unemployed 3 7.5 3 6.8 1 2.5
Student 7 17.5 12 27.3 4 10.0
Total 40 100.0 44 100.0 40 100.0
Average
monthly income
₦1,000 - 50,000 10 25.0 16 35.5 2 5.9
₦50,001 - 100,000 12 30.0 25 54.8 11 26.5
₦100,001 -
150,000
7 17.5 1 3.2 8 20.6
₦150,001 -
200,000
1 2.5 1 3.2 6 14.7
Above ₦200,000 - - 1 3.2 13 32.4
Total 40 100.0 44 100.0 40 100.0
Commuters’ Access to Public Transport
Commuters’ access to public transport was analysed with respect to travel mode, travel time and the
cost of travel to the respective terminals. The various modes of travel to respective terminal identified
include: walking, motorcycle, bus, taxi and cars. A cursory examination of Table 2 reveals that patrons
of the yellow buses mainly accessed the bus service by walking (40%) while 30% and 25% accessed the
terminals by motorcycle and buses respectively. The remaining 5% accessed the yellow bus terminals
through the aid of cars and taxis. Similarly, a sizeable proportion (about 48%) of BRT users accessed
the terminals by using motorcycles whereas 29.5%, 6.8% and 15.9% access the BRT terminals by buses,
personal cars and walking respectively. With respect to ferry services, only about 10% of the user
respondents accessed the terminal by walking. The remaining 90% comprised of 30% who accessed the
terminals via motorcycle, 37.5% by cars,15% and 7.5% who adopted buses and taxis as access modes
to ferry terminals. The choice of access mode to the ferry terminals might not be unconnected with
observation that most users of ferry services are high income earners given that majority of them earned
above ₦100,000 per month.

Built Environment Journal
42
Table 2: Respondents’ access to public transport in the study area
Accessibility Variables Yellow Bus
(N=40)
Brt (N=44) Ferry (N=40)
Freq % Freq % Freq %
Travel mode to
terminal
Walk 16 40.0 7 15.9 4 10.0
Motorcycle 12 30.0 21 47.7 12 30.0
Taxi 1 2.5 - - 3 7.5
Car 1 2.5 3 6.8 15 37.5
Bus 10 25.0 13 29.5 6 15.0
Total 40 97.5 44 100.0 40 100.0
Travel time to
terminal
1 - 5 min 3 7.5 5 11.4 7 17.5
6 - 10 min 26 65.0 19 43.2 13 32.5
11 - 15 min 9 22.5 11 25.0 10 25.0
19 - 30 min 2 5.0 6 13.6 6 15.0
Above 30 min - - 3 6.8 4 10.0
Total 40 100.0 44 100.0 40 100.0
Travel cost to
terminal
₦1 - ₦50 7 18.5 11 25.0 3 7.7
₦51 - ₦100 27 66.7 21 47.2 17 42.3
₦101 - ₦150 2 3.7 9 19.4 6 15.4
₦151 - ₦200 4 11.1 2 5.6 8 19.2
Above ₦200 - - 1 2.8 6 15.4
Total 40 100.0 44 100.0 40 100.0
The analysis of the travel time to the various terminals of public transport as shown in Table 2
reveals that the yellow buses are the most accessible in terms of travel time. It was observed that more
than 90% of the yellow bus public commuters access the terminals in 15 minutes or less while a little
below 80% of the BRT users and about 75% of the users of the ferry commuters accessed their respective
terminals within the same time frame. The proportion of users who spent more than 30 minutes to get
to the terminal constituted 10% and 6.8% for ferry services and BRT users respectively. Perhaps, the
fact that none of the respondents using the yellow buses spent more than 30 minutes as travelling time
is related to the bus service which is characterized by fast paced and chaotic boarding and alighting
process.
Table 2 also shows that over 85% of the public commuters by the yellow buses spent ₦100 and
below as travel cost to the terminal while the remaining 14.8% spent between ₦101 and ₦200 as the
travel cost. Similarly, the BRT users also had 72.2% of the respondents who travelled to terminals for a
₦100 or less, about 25% whose travel costs ranged between ₦101 and ₦200 and 2.8% whose travel cost
was in excess of N200. Considering the mode, time and cost of travel to the terminals, it could be said
that the yellow buses are the most accessible public transport mode available to commuters in the study
area. This could be attributed to the long-term duration of operations they have had in the study area and
how residents of the area have adapted to their unorganised and largely unregulated services. However,
with consistency and constant improvement of the BRT and ferry services in the study area, it is expected
that the patronage of these public modes of travel would increase over time.
The analysis of variance test was conducted to check if there were significant differences between
the variables used to measure the commuters’ access to public transport modes in the study area. The
analysis examined the cost and time of travel to the various terminal of public transport using the null
and alternative hypotheses.
H0 = There is no significant difference between the cost and time of travel to the terminals
of selected modes of public transport
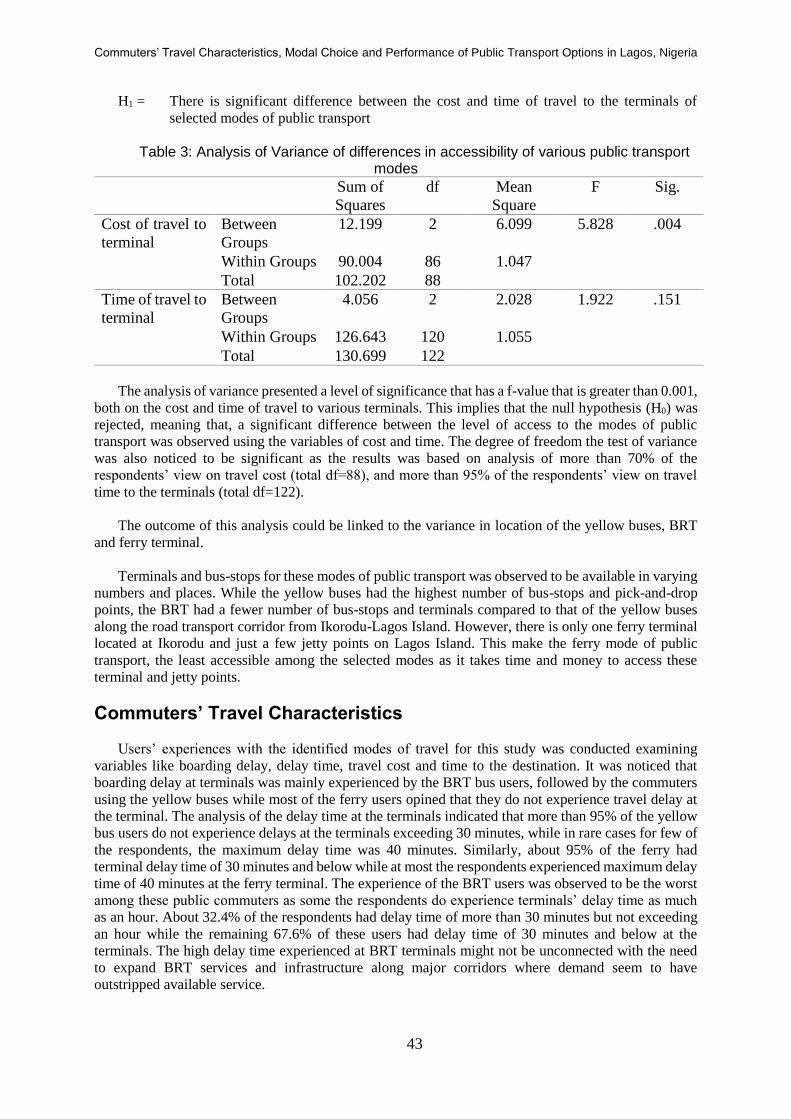
Commuters’ Travel Characteristics, Modal Choice and Performance of Public Transport Options in Lagos, Nigeria
43
H1 = There is significant difference between the cost and time of travel to the terminals of
selected modes of public transport
Table 3: Analysis of Variance of differences in accessibility of various public transport modes
Sum of
Squares
df Mean
Square
F Sig.
Cost of travel to
terminal
Between
Groups
12.199 2 6.099 5.828 .004
Within Groups 90.004 86 1.047
Total 102.202 88
Time of travel to
terminal
Between
Groups
4.056 2 2.028 1.922 .151
Within Groups 126.643 120 1.055
Total 130.699 122
The analysis of variance presented a level of significance that has a f-value that is greater than 0.001,
both on the cost and time of travel to various terminals. This implies that the null hypothesis (H0) was
rejected, meaning that, a significant difference between the level of access to the modes of public
transport was observed using the variables of cost and time. The degree of freedom the test of variance
was also noticed to be significant as the results was based on analysis of more than 70% of the
respondents’ view on travel cost (total df=88), and more than 95% of the respondents’ view on travel
time to the terminals (total df=122).
The outcome of this analysis could be linked to the variance in location of the yellow buses, BRT
and ferry terminal.
Terminals and bus-stops for these modes of public transport was observed to be available in varying
numbers and places. While the yellow buses had the highest number of bus-stops and pick-and-drop
points, the BRT had a fewer number of bus-stops and terminals compared to that of the yellow buses
along the road transport corridor from Ikorodu-Lagos Island. However, there is only one ferry terminal
located at Ikorodu and just a few jetty points on Lagos Island. This make the ferry mode of public
transport, the least accessible among the selected modes as it takes time and money to access these
terminal and jetty points.
Commuters’ Travel Characteristics
Users’ experiences with the identified modes of travel for this study was conducted examining
variables like boarding delay, delay time, travel cost and time to the destination. It was noticed that
boarding delay at terminals was mainly experienced by the BRT bus users, followed by the commuters
using the yellow buses while most of the ferry users opined that they do not experience travel delay at
the terminal. The analysis of the delay time at the terminals indicated that more than 95% of the yellow
bus users do not experience delays at the terminals exceeding 30 minutes, while in rare cases for few of
the respondents, the maximum delay time was 40 minutes. Similarly, about 95% of the ferry had
terminal delay time of 30 minutes and below while at most the respondents experienced maximum delay
time of 40 minutes at the ferry terminal. The experience of the BRT users was observed to be the worst
among these public commuters as some the respondents do experience terminals’ delay time as much
as an hour. About 32.4% of the respondents had delay time of more than 30 minutes but not exceeding
an hour while the remaining 67.6% of these users had delay time of 30 minutes and below at the
terminals. The high delay time experienced at BRT terminals might not be unconnected with the need
to expand BRT services and infrastructure along major corridors where demand seem to have
outstripped available service.
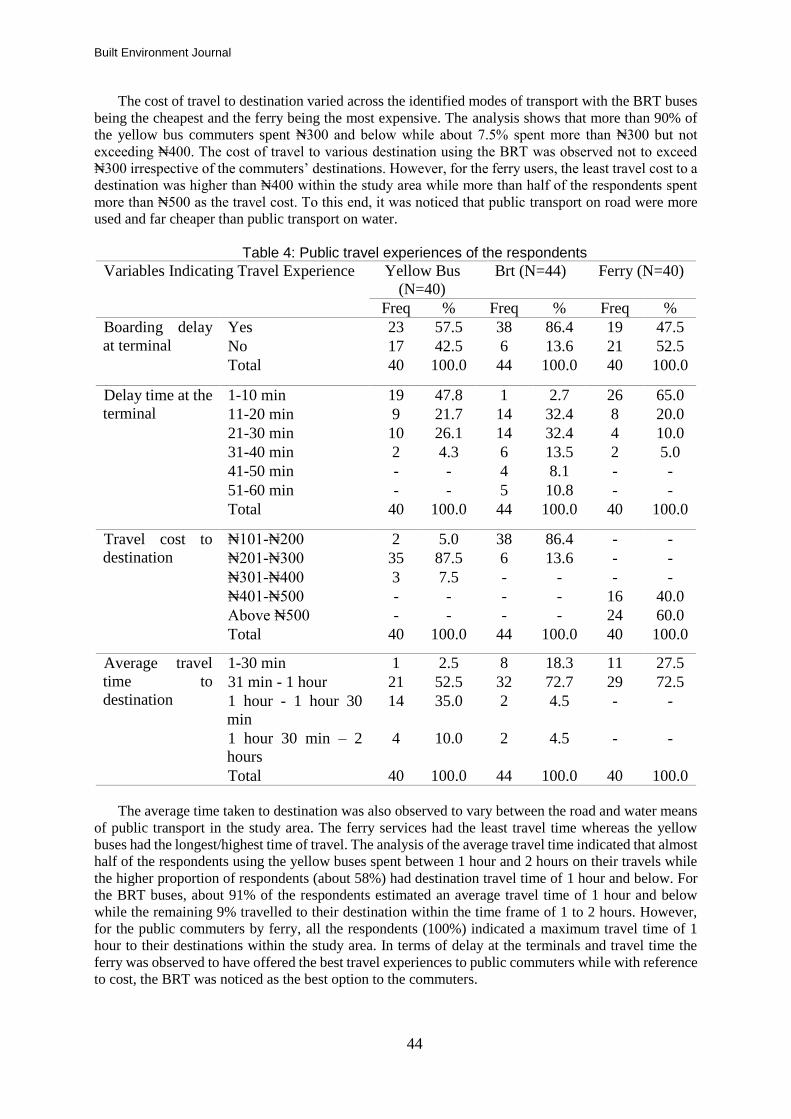
Built Environment Journal
44
The cost of travel to destination varied across the identified modes of transport with the BRT buses
being the cheapest and the ferry being the most expensive. The analysis shows that more than 90% of
the yellow bus commuters spent ₦300 and below while about 7.5% spent more than ₦300 but not
exceeding ₦400. The cost of travel to various destination using the BRT was observed not to exceed
₦300 irrespective of the commuters’ destinations. However, for the ferry users, the least travel cost to a
destination was higher than ₦400 within the study area while more than half of the respondents spent
more than ₦500 as the travel cost. To this end, it was noticed that public transport on road were more
used and far cheaper than public transport on water.
Table 4: Public travel experiences of the respondents
Variables Indicating Travel Experience Yellow Bus
(N=40)
Brt (N=44) Ferry (N=40)
Freq % Freq % Freq %
Boarding delay
at terminal
Yes 23 57.5 38 86.4 19 47.5
No 17 42.5 6 13.6 21 52.5
Total 40 100.0 44 100.0 40 100.0
Delay time at the
terminal
1-10 min 19 47.8 1 2.7 26 65.0
11-20 min 9 21.7 14 32.4 8 20.0
21-30 min 10 26.1 14 32.4 4 10.0
31-40 min 2 4.3 6 13.5 2 5.0
41-50 min - - 4 8.1 - -
51-60 min - - 5 10.8 - -
Total 40 100.0 44 100.0 40 100.0
Travel cost to
destination
₦101-₦200 2 5.0 38 86.4 - -
₦201-₦300 35 87.5 6 13.6 - -
₦301-₦400 3 7.5 - - - -
₦401-₦500 - - - - 16 40.0
Above ₦500 - - - - 24 60.0
Total 40 100.0 44 100.0 40 100.0
Average travel
time to
destination
1-30 min 1 2.5 8 18.3 11 27.5
31 min - 1 hour 21 52.5 32 72.7 29 72.5
1 hour - 1 hour 30
min
14 35.0 2 4.5 - -
1 hour 30 min – 2
hours
4 10.0 2 4.5 - -
Total 40 100.0 44 100.0 40 100.0
The average time taken to destination was also observed to vary between the road and water means
of public transport in the study area. The ferry services had the least travel time whereas the yellow
buses had the longest/highest time of travel. The analysis of the average travel time indicated that almost
half of the respondents using the yellow buses spent between 1 hour and 2 hours on their travels while
the higher proportion of respondents (about 58%) had destination travel time of 1 hour and below. For
the BRT buses, about 91% of the respondents estimated an average travel time of 1 hour and below
while the remaining 9% travelled to their destination within the time frame of 1 to 2 hours. However,
for the public commuters by ferry, all the respondents (100%) indicated a maximum travel time of 1
hour to their destinations within the study area. In terms of delay at the terminals and travel time the
ferry was observed to have offered the best travel experiences to public commuters while with reference
to cost, the BRT was noticed as the best option to the commuters.

Commuters’ Travel Characteristics, Modal Choice and Performance of Public Transport Options in Lagos, Nigeria
45
A linear regression analysis was conducted to predict the effect of the experiences of public
commuters on their preferred mode of public transport. The analysis examined their experiences from
the terminals of boarding to the point of destination considering the travel time, travel cost, delay time
and boarding delay at the terminals. The test was conducted using the stepwise method of linear
regression, which made the analysis of be broken down as each predictor is examined with an eventual
combination of all predictors. It was observed that the R2 value on the analysis of the combined predictor
is 0.558 with an adjusted R2 value of 0.534. This means that the results obtained from the linear
regression analysis explain about 55.8% of the total variance within the dataset.
Table 5: Model summary of the linear regression analysis
Model R R Square Adjusted R
Square
Std. Error of
the Estimate
Durbin-Watson
1 .552(a) .304 .292 .589
2 .725(b) .526 .509 .490
3 .747(c) .558 .534 .478 1.044
a Predictors: (Constant), Average Travel Time to Destination
b Predictors: (Constant), Average Travel Time to Destination, Cost of Travel to Destination
c Predictors: (Constant), Average Travel Time to Destination, Cost of Travel to Destination,
Delay Time at The Terminal
d Dependent Variable: Preferred Travel Mode
Since the regression analysis was carried out in a stepwise manner, the information presented in the
third row of the table of coefficients was examined as it combined the predictors of commuters’ preferred
mode. However, the boarding delay at the terminal was excluded from the stepwise linear regression
analysis as it had a p-value that is greater than 0.1. The table of coefficients was used to compare the
effects of the predictors on the commuters’ choice of public transport. It was noticed the cost of travel
to destination was the most effective factor influencing the choice of public commuters with a
standardized beta coefficient of 0.547 and a level of significance that is less than 0.001. The average
travel time to destination was the next effective experience of the commuters that influenced their
preference with standardized beta coefficient of -0.460 (p<0.001) and the delay time at the terminal was
another significant factor but the least among this three with a standardized beta coefficient of 0.195
(p<0.05).
Table 6: Linear regression coefficients
Model Unstandardized
Coefficients
Standardize
d
Coefficients
t Sig.
B Std.
Error
Beta B Std.
Error
1 (Constant) 3.040 .236 12.859 .000
Average Travel Time
to Destination
-.526 .104 -.552 -5.079 .000
2 (Constant) 2.183 .257 8.509 .000
Average Travel Time
to Destination
-.475 .087 -.498 -5.473 .000
Cost of Travel to
Destination
.242 .047 .474 5.204 .000
3 (Constant) 1.745 .330 5.287 .000
Average Travel Time
to Destination
-.438 .086 -.460 -5.070 .000
Cost of Travel to
Destination
.279 .049 .547 5.713 .000

Built Environment Journal
46
Delay Time at the
Terminal
.094 .046 .195 2.029 .047
a Dependent Variable: Preferred Travel Mode
It could be inferred that the experiences of public commuters from the terminals to their various
destinations were the key factors that influence their choices of public transport in the area. This is
because other factors of access to terminals had lesser levels of significance compared to the users’
experiences when analysed against their modal choices. These factors determine the utility derived by
the passengers on their public travel.

Commuters’ Travel Characteristics, Modal Choice and Performance of Public Transport Options in Lagos, Nigeria
47
Commuters’ Evaluation of Public Transport
Table 7: Relative performance analysis of the selected modes of public transport
Assessed Variables 5 4 3 2 1 PWV N RPI MPI MPD
Yellow
bus
Travel fare 5 20 78 16 - 119 40 2.98
2.6
2
0.36
Waiting time - 24 72 12 4 112 40 2.80 0.18
Travel time 5 16 75 14 3 113 40 2.83 0.21
Travel safety - 4 54 40 1 99 40 2.48 -0.14
Travel
convenience
- 8 45 40 3 96 40 2.40 -0.22
Travel efficiency - 8 72 24 2 106 40 2.65 0.03
User friendliness - 8 33 40 7 88 40 2.20 -0.42
Total 18.34
BRT Travel fare 55 80 33 4 - 172 44 3.91
3.7
2
0.19
Waiting time 5 24 27 22 17 95 44 2.16 -1.56
Travel time 50 92 27 4 - 173 44 3.93 0.22
Travel safety 45 96 30 2 - 169 44 3.84 0.12
Travel
convenience
95 64 24 2 - 185 44 4.20 0.48
Travel efficiency 85 64 24 6 - 179 44 4.07 0.35
User friendliness 45 92 33 2 - 172 44 3.91 0.19
Total 26.02
Ferry Travel fare 20 4 48 24 7 103 40 2.58
3.0
1
-0.43
Waiting time 65 40 36 10 - 151 40 3.78 0.77
Travel time 60 64 27 6 - 157 40 3.93 0.92
Travel safety - 4 27 38 11 80 40 2.00 -1.01
Travel
convenience
10 8 30 24 14 86 40 2.15 -0.86
Travel
efficiency
15 56 57 8 - 136 40 3.40 0.39
User friendliness 5 64 42 16 1 128 40 3.20 0.19
Total 21.04
Performance Weight Value (PWV) = 1n1 + 2n2 + 3n3 + 4n4+5n5
𝑃𝑊𝑉 = ∑ 𝑋𝑖𝑌𝑖
5
𝑖=1
Relative Performance Index (RPI) = Performance Weight Value (PWV)
Total number of responses (N)
Mean Performance Index (𝑀𝑃𝐼) = ∑𝑅𝑃𝐼
𝑁𝑣
Mean Performance Deviation (MPD) = MPI – RPI
Where N = Total number of responses
n = Ratings of respondents
Nv = Count of identified assessed variables
Ratings of the impact of the public transport system on sustainable livelihood indicators
1 = Poor, 2 = Fair, 3 = Good, 4 = Very good, 5 = Excellent
Built Environment Journal
48
The Relative Performance Analysis (RPA) conducted above was carried out to identify the assessed
variables of public transport that had significantly performed across the three selected modes, based on
the users’ ratings. The analysis made use of the Mean Performance Index (MPI) as the threshold when
compared with the Relative Performance Index (RPI) of each assessed variable. The assessed variables
in the analysis were travel fare, time, safety, convenience, travel efficiency, waiting time and user
friendliness. These variables were assessed and compared by the three identified public transport modes.
An evaluation of the performance of the yellow buses by public commuters resulted in a mean
performance index of 2.62, which was compared with the various indices of the variables. It was noted
that of these variables, there were significant performance ratings on the waiting time, the fare, time and
efficiency of this travel mode. It was also observed that the relative performance indexes of the variables
clustered around the mean performance index with mean deviations ranging from -0.42 to +0.36. This
means that there were no wide variations between the performance rating of the respondents using the
yellow buses. The performance of the BRT mode of public transport as rated by the respondents was
observed to be better than that of the yellow buses. From the performance analysis, the mean
performance index was 3.72 and when this was compared to the relative performance indexes, all the
assessed variables had significant performance ratings except for the waiting time at the terminals. A
wide variation was noticed between the mean performance index and the performance index of the
waiting time with a mean performance deviation of -1.56. However, the respondents’ performance
ratings on all the other variables did not have wide variations.
The assessed variables under the ferry mode of public transport with significant performance rating
include the waiting time, travel time, travel efficiency and user friendliness. Considering the mean
performance index of the ferry mode of transport, it was observed that this mode received more
performance ratings than the yellow buses but not up to the ratings of the BRT. This means that based
on the users’ ratings, the BRT had the best performance considering the user friendliness, waiting time,
the travel fare, time, safety, convenience and efficiency with a mean performance index of 3.72. This
was followed ferry mode of public transport with mean performance index of 3.01 and the yellow buses
were least rated in performance with an index of 2.62.
CONCLUSION
This study has compared the choices and behaviors of commuters/commuters using three selected
modes of public transport on the Ikorodu-Lagos Island axis of Lagos state. Having examined the access
to, travel experiences with, and performance of the yellow buses, BRT and ferry modes of public
transport in the study area, the study discovered there were significant variances in the issues influencing
choices and behaviors of public commuters. While the yellow buses were the most accessible mode of
public transport within the study area followed by the BRT and ferry in sequence of accessibility, the
ferry offered the best travel experiences in reference to delay at the terminals and travel time to various
destinations with the BRT and yellow buses following in ranks. However, with reference to travel cost,
and performance of public transport using the identified utility functions/variables of assessment, the
BRT had the highest performance rating on these variables and offered the best option in terms of travel
cost. The ferry and the yellow buses followed in sequence of performance ratings behind the BRT.
Since each of these modes of public transport has its strengths and weaknesses, there is the need to
improve of service delivery and quality of travel experiences for these selected modes of public travel
in the study area. These improvements will help to increase patronage by residents, enhance standard of
living of the people and developed the public transport systems within the study area. This study
therefore recommends that the BRT should try to improve their service delivery by providing more
buses to mitigate boarding delay and reduce the delay times at the terminals. Longer waiting times due
to late arrival of buses and excessive in-vehicle times has been identified by Sam et al., (2014) as a factor
that reduces reliability. Improving on this service aspect will help to ensure that public commuters have
confidence and trust in the services of the BRT thereby promising bus reliability to the users.

Commuters’ Travel Characteristics, Modal Choice and Performance of Public Transport Options in Lagos, Nigeria
49
Similarly, this study recommends the provision of more safety measures (in terms of policy and
equipment) in the services of the ferry such that commuters will have better travel experience of safety,
comfort and convenience on the ferries. Also, more jetty points could be provided at Ikorodu and Lagos
Island to increase accessibility to water transport by ferry, such that the time and cost of travel to jetty
points and ferry terminals would be reduced. The residents and the public can also be sensitized on the
safety, importance and need to embrace water transportation in the study area to relieve the pressure on
road infrastructure.
Finally, the improvement of the BRT and ferry services is paramount now considering the
population growth in Lagos state, particularly within the study area. This will help to increase
commuters’ preference on these modes of public transport that will support the existing traditionally
yellow buses and keep the forces of demand and supply of public transport balanced and effective. This
is expected to bring about a sustainable and efficient public transport system within the study area in the
long term.
Future studies should explore passenger on-board time use and their satisfaction with waiting time
comfort at bus and ferry terminals. Travel time is generally considered a cost. Making travel time
productive has the potential to enhance travel satisfaction (Ettema, Friman, Gärling, Olsson, & Fujii,
2012; Lyons, Jain, & Holley, 2007). Studying on-board time use patterns can help planners understand
the needs of BRT and ferry passengers (Lyons, Jain, Susilo, & Atkins, 2013). Further, waiting time is
an essential component of any BRT and ferry journey. This makes waiting-related studies even more
pertinent.
ACKNOWLEDGEMENTS
We would like to thank Iyetoni Diyaolu for her contribution in data gathering and Ojo Benjamin for
editorial work.
REFERENCES
Adebambo, S., & Adebayo, I. T. (2009). Impact of bus rapid transit system (BRT) on passengers’
satisfaction in Lagos metropolis, Nigeria. International Journal of Creativity and Technical
Development, 1(3), 106-119.
Afolabi, O. J. (2016). Commuters perception and preferences on the bus rapid transit in Lagos state,
Jorind 14(2), 34-41.
Agunloye, Alade and Fadare (2010). Perception of intra-urban train passengers on services in Lagos
metropolis. Journal of Environmental Sciences, 14(1), pp 105-113.
Alade and Olaseni (2018). Passenger satisfaction of bus rapid transit and bus franchise scheme in Lagos,
Ife Planning Journal, Department of Urban and Regional Planning, Obafemi Awolowo
University, Ile-Ife.
Albalate, D. and Bel, G. (2010). What shapes local public transportation in Europe? Economics,
mobility, institutions and geography. Transport Research Part E, No. 46,, 775-790.
Amiegbebhor, D. E., Akarakiri, J., & Dickson, O. (2016). Evaluation of Technical Innovations in Bus
Rapid Transit System in Lagos State, Nigeria. Advances in Research, 6(2), 1-12.
Ankomah, P., Crompton, J.L. and Baker, D. (1996). Influence of cognitive distance in vacation choice.
Annals of Tourism Research, 23(1), 138-150.
Basorun, J. O., & Rotowa, O. O. (2012). Regional assessment of public transport operations in Nigerian
cities: The case of Lagos island. International Journal of Developing Societies, 1(2), 82-87.
Bresson, G., Dargay, J., Madre J.L., and Pirotte, A. (2004). Economic and structural determinants of the
demand for public transport: An analysis on a panel of French urban areas using shrinkage
estimators. Transportation Research Part A, No. 38, 269-285.
Buchanan, N., Barnett, R., Kingham, S., and Johnson, D. (2006). The effect of urban growth on
commuting patterns in Christchurch, New Zealand. Journal of Transport Geography, Vol. 14,
342-354.
Built Environment Journal
50
Cao, C., and Chen, J. (2011). An empirical analysis of the relationship among the service quality,
customer satisfaction and loyalty of high-speed railway based on structural equation model.
Canadian Social Science, 7, 67–73.
Cao, J., and Cao, X. (2017). Comparing importance-performance analysis and three-factor theory in
assessing rider satisfaction with transit. Journal of Transport and Land Use, 10, 65–82.
Chou, J.-S., and Kim, C. (2009). A structural equation analysis of the QSL relationship with passenger
riding experience on high speed rail: An empirical study of Taiwan and Korea. Expert Systems
with Applications, 36 (6), 945–6,955.
Chou, J.-S., and Yeh, C.P. (2013). Influential constructs, mediating effects, and moderating effects on
operations performance of high-speed rail from passenger perspective. Transport Policy, 30, 207–
219.
Crotte, A. (2008). Estimation of transport related demand elasticities in Mexico city: An application to
road user charging. United Kingdom: MSc Thesis, Centre for Transport Studies, Department of
Civil and Environmental Engineering, Imperial College.
de Oña, J., and de Oña, R. (2015). Quality of service in public transport based on customer satisfaction
surveys: A review and assessment of methodological approaches. Transportation Science, 49,
605–622.
Ettema, D., Friman, M., Gärling, T., Olsson, L. E., and Fujii, S. (2012). How in-vehicle activities affect
work commuters’ satisfaction with public transport. Journal of Transport Geography, 24, 215–
222.
FitzRoy, F. and Smith, I. (1998). Public transport demand in Freiburg: Why did patronage double in
decade? Transport Policy, Vol. 5, 163-173.
Golob, T.F., Canty, E.T. and Gustafson, R.L. (1972). An analysis of consumer preferences for a public
transportation system. Transportation Research, Vol. 6,, 1-7.
Horn, M. (2003). An extended model and procedural framework for planning multi-modal passenger
journeys. Transportation Research Part B, No. 37, 641-660.
Irfan, S. M., Kee, D. M. H., and Shahbaz, S. (2012). Service quality and rail transport in Pakistan: A
passenger perspective. World Applied Sciences Journal, 18, 361–369.
Koppelman, F.S. and Lyon, P.K. (1981). Attitudinal analysis of work school travel. Transportation
Science, Vol. 15, 233-254.
Lagos Bureau of Statistics. (2016). Digest of Statistics 2016. Alausa, Ikeja, Lagos: Ministry of Economic
Planning and Budget.
Lee, J. H., Jin, B. S., and Ji, Y. (2009). Development of a structural equation model for ride comfort of
the Korean high-speed railway. International Journal of Industrial Ergonomics, 39, 7–14
Lyons, G., Jain, J., and Holley, D. (2007). The use of travel time by rail passengers in Great Britain.
Transportation Research Part A: Policy and Practice, 41, 107–120.
Lyons, G., Jain, J., Susilo, Y., and Atkins, S. (2013). Comparing rail passengers’ travel time use in Great
Britain between 2004 and 2010. Mobilities, 8, 560–579.
Mintesnot, G. and Shin-ei, T. (2007). The Effect of Commuters’ Level of Satisfaction on Transport Mode
Choice: An Input for Policy Analysis,. California: World Conference on Transport Research.
National Population Commission. (2009). Population by Sex and Local Government Area. Social
Statistics in Nigeria, Lagos State Population Figure 2009. Lagos, Nigeria: National Bureau of
Statistics.
Neumann, E.S., Romansky, M.L. and Plummer, R.W. (1978). Passenger car comfort and travel
decisions: A physiological study. Journal of Transport Economicsand Policy, Vol. 12, 231-243.
Odunola, C.O., Omole, F.K., Okoko E.E., Soyinka, O.A., and, Bako, A.I. (2014). Ferry Transport
Service in Lagos Metropolis: A Panacea for Movement in the Mega City. In J. A. Joseph A.
Fadamiro, Urban Environmental Sustainability: Liveable Cities (pp. 193-212). Akure, Nigeria:
Urban Design Research Team, Department of Architecture, School of Environmental
Techonology, Federal University of Technology Akure.
Olufemi, O. A. (2008). Public transport innovation: the impact of BRT on passenger’s movement in
Lagos metropolitan area of Nigeria. Pakistan Journal of Social Sciences, 5(8), 845-852.
Polat, C. (2012). The demand determinants for urban public transport service: a review of the literature.
Journal of Applied Sciences, Vol. 12, No. 12, 1211-1231.
Commuters’ Travel Characteristics, Modal Choice and Performance of Public Transport Options in Lagos, Nigeria
51
Sam E.F., Adu-Boahen K., Kissah-Korsah K. (2014). Assessing the factors that influence public
transport mode preference and patronage: Perspectives of students of University of Cape Coast
(UCC), Ghana. International Journal of Development and Sustainability, 3(2), 323-336.
Schofer, J. L. (2018). Mass Transit. Chicago, Illinios: Encyclopaedia Britannica.
Taylor, B.D. and Camille, N.Y. (2012). Factors influencing transit ridership: A review and analysis of
the ridership literature, working paper. Los Angeles: Department of Urban Planning, UCLA
Institute of Transport Studies.
Wu, J. H.-C., Lin, Y.-C., and Hsu, F.-S. (2011). An empirical analysis of synthesizing the effects of
service quality, perceived value, corporate image and customer satisfaction on behavioral
intentions in the transport industry: A case of Taiwan high-speed rail. Innovative Marketing, 7,
83–99.
Zhang, C., Cao, X., Nagpure, A., and Agarwal, S. (2017). Exploring rider satisfaction with transit service
in Indore, India: An application of the three-factor theory. Transportation Letters, 1–9.
Zhen, Cao and Tang (2018). Exploring correlates of passenger satisfaction and service improvement
priorities of the Shanghai-Nanjing High Speed Rail. The Journal of Transport and Land Use, 11(1) pp.
559–573, http://jtlu.org
Built Environment Journal Vol. 16 No.1, 49 - 58, 2019
52
IMPACT OF COARSE AGGREGATE ON COMPRESSIVE STRENGTH OF CONCRETE
1Jeriscot H. Quayson, MSc, 2Zakari Mustapha, PhD
School of Engineering, Department Building Technology P. O. Box AD. 50,
Cape Coast. Ghana.
E-mail: [email protected] [email protected]
ABSTRACT
Over one-third of the volume of concrete is occupied by coarse
aggregate and any changes in coarse aggregate type can
affect its strength and fracture properties. The paper examined
the impact of coarse aggregates on compressive strength of
concrete. Slump and compaction factor tests were conducted
on the mixture of quartzite and crushed granite course aggregates, and quarry dust (fine
aggregate). Nominal mix (1:2:3) was adopted and mix compositions were calculated by
absolute weight method. Twelve (12) cubes (150x150mm) of each type of coarse aggregate
were cast for 7, 14, 21, and 28 days to determine their compressive strengths. Quartzite was
found to have the highest average compressive strength of 24.48N/mm2 with an average density
of 2160kg/m3, while compressive strength of crushed granite was 22.01N/mm2 with an average
density of 2300kg/m3 on the 28 day of testing. Concrete made from granite had the highest
workability, while concrete made from quartzite aggregate had the highest compressive
strength. Densities and compressive strengths of the individual aggregates accounted for the
variation in strengths of the concrete, due to differences in properties and strengths. In
conclusion, the effect of any type of coarse aggregate on the compressive strength of concrete
will be known and also enable contractors to determine the type of aggregate to be selected for
a particular work.
Keywords: Compaction factor test; slump test; strength; workability.
INTRODUCTION
The use of granite in the construction industry as indicated by Ellis (2006) and Bremmer (2006)
cannot be over emphasize, with dimension stone, cement manufacture, construction aggregates, rail
track ballast and road construction. The physical properties of quartzite, including toughness and
density, make this metamorphic stone particularly resistant to erosion and weathering Perdikaris and
Romeo (2007). Properties of granite also include resistance of granite to heat, water, pressure, impact
(Ezeldin and Aitcin, 2006). Granite is frequently selected because it is a prestige material, used in
projects to produce impressions of elegance, durability and lasting quality (Anosike and Oyebande,
2012). The physical properties of quartzite depend on its formation (Ezeldin and Aitcin, 2006). The
specific heat capacity of quartzite is 0.75 kJ/Kg and it is one of the important properties of quartzite.
Properties of quartzite also include resistance of quartzite to heat, water, pressure, impact etc. (Ezeldin
and Aitcin, 2006). Production of concrete requires water that is free from suspended particles, inorganic
salts, acids and alkalis, contamination and algae (Elices and Rocco, 2008). Since the presence of
impurities may affect the strength of the concrete which can cause strength variation on the various
types of aggregates (Elices and Rocco, 2008).
Received: 11 Oct 2018
Reviewed: 30 Dec 2018
Accepted: 18 Jan 2019
Impact of Coarse Aggregate on Compressive Strength of Concrete
53
Moreover, the type of machine used indirectly affects the strength of concrete for the moulding of
the concrete cube (Duggal, 2003). Study has showed that the effects of poor curing method will reduce
the compressive strength of concrete. Curing of concrete products may start after 24hours of casting the
concrete and can be done in various ways and methods (sprinkling of water on the concrete, soaking
the product in water etc.). When all the concrete products are not given the same treatment of curing,
the formation of their chemical reactions would be different which will cause their strength to also
differ. Improper batching of material and mix proportion may affect the strength of concrete and excess
water may affect the strength of the concrete (Ruiz 2006). The paper examined the impact of coarse
aggregate on compressive strength of concrete. The preceding section discusses the various literature
on the materials and test on concrete. It also discusses relevance of compressive strength of concrete,
average compressive strength of concrete with crush granite and quartzite and factors that accounts for
the variation in strength.
LITERATURE REVIEW
This section presents literature relevant to compressive strength of concrete, average compressive
strength of concrete with crush granite and quartzite, and factors that accounts for the variation in
strength. The compressive strength of concrete depends on the water to cement ratio, degree of
compaction, ratio of cement to aggregate, bond between mortar and aggregate, and grading, shape,
strength and size of the aggregate Mindess, Young and Darwin (2003). Concrete can be visualized as a
multi-phase composite material made up of three phases; namely the mortar, mortar/aggregate interface,
and the coarse aggregate phase. The coarse aggregate in normal concrete are mainly from rock
fragments characterized by high strength. Therefore, the aggregate interface is not a limiting factor
governing the strength requirement (Beshr, Almusallam, and Maslehuddin 2003). The onset of failure
is manifested by crack growth in the concrete. For normal concrete, the crack growth is mainly around
the cement paste or at the aggregate/cement paste interfacial zone. The strength of concrete at the
interfacial zone essentially depends on the integrity of the cement paste and the nature of the coarse
aggregate. The effect of using crushed quartzite, crushed granite, limestone and marble as coarse
aggregate on the mechanical properties of high-performance concrete as indicated by Wu, Chen, Yao,
and Zhang (2007) in their study were that the strength, stiffness and fracture energy of concrete for a
given water/cement ratio depend on the type of aggregate. Özturan, and Çeçen (2007) posited that
basalt, limestone and gravel have been used as coarse aggregate to produce normal and high-
performance concrete. High performance concrete at 28 days, basalt produced the highest strength,
whereas gravel gave the lowest compressive strength. Normal strength concrete made with basalt and
gravel gave similar compressive strength while the concrete containing limestone attained higher
strength.
Meddah, Zitouni, and Belâabes (2010) conducted a research on the effects of content and particle
size distribution of coarse aggregate on the compressive strength of concrete. Three types of coarse
aggregates were mixed in four different proportions for concrete production. Plasticizers and Super
plasticizers were used in some mixes to reduce the water to cement ratio. The outcome of their work
showed that the mixture with a ternary combination of granular fraction with a maximum size of 25mm,
without admixtures have shown the highest compressive strength. At a lower water to cement ratio, the
binary granular system produced the highest compressive strength. Elices and Rocco (2008) compared
concretes with the same mix proportions containing four different coarse aggregate types. They
concluded that in high-strength concretes, higher strength coarse aggregates typically yield higher
compressive strengths, while in normal-strength concretes; coarse aggregate strength has little effect on
compressive strength. While Özturan and Çeçen (2007) compared the effects of limestone and basalt
on the compressive strength of high-strength concrete in their research and concluded that concrete
containing basalt as coarse aggregate exhibit higher bond strengths with reinforcing steel than concretes
containing limestone. A test conducted by Kyoung-Min, Lee and Jae-Yeol (2018) for mortar and
concrete specimens with various maximum aggregate sizes showed that the larger maximum coarse
aggregate sizes induce larger heterogeneity of specimens.
Built Environment Journal
54
Meddah, Zitouni and Belâabes (2010) posited that compressive strength increases with the type of
aggregate used. While, Walker and Bloem (2007) attest that the type of coarse aggregate used results
in a decrease in the compressive strength of concrete. Ruiz (2006) on the other hand, found that the
compressive strength of concrete increases when the content of the coarse aggregate increases until a
critical volume is reached. Mindess, Young and Darwin (2003) also indicated that compressive strength
of concrete depends on the water to cement ratio, degree of compaction, ratio of cement to aggregate,
bond between mortar and aggregate, grading, shape, strength and size of the aggregate. The preceding
section discusses the methods adopted in this research. It further describes the instruments and materials
used during the experiment, as well as how the experiments were carried out.
RESEARCH METHODOLOGY
This chapter describes the methods adopted for the research work. Materials used for the laboratory
work were obtained from Cape Coast in the Central Region of Ghana. The instruments used for the
laboratory work include, digital compressive machine of capacity 3000KN, 250ml measuring cylinder,
digital weighing scale, compacting factor apparatus, slump cone apparatus, base plate, mechanical
shaker,16mm tamping rod, concrete mixer and 150mm x 150mm x 150mm cube mould. Materials used
include coarse aggregates (crush granite and quartzite), fine aggregate, Dangote cement, Grade 45.5R)
and portable pipe-borne water from Ghana Water Company. The materials were batched by weight with
cement, sand to stone in proportion of 1:2:3, with water-cement ratio of 0.70. The material was mixed
and cast in mould and was cured for 7days, 14days, 21days and 28days before crushing. Compressive
test was conducted by mixing the materials in a concrete mixer, in accordance to American Standard of
Testing Materials (ASTM 192). The specimen was cast into 150mm x 150mm x 150mm steel moulds
and compacted with a tamping rod in three layers. A weighing scale was used in batching the
components of the concrete. The sample was demoulded and cured in water after 24hours. The
compressive strength of the cubes was determined by crushing them in a digital compressive machine
in accordance to British Standard. Three (3) cubes were tested to determine their compressive strength
at various ages of curing. Batching and mix proportions were done by weight using a weighing scale.
Since the mix ratio is 1:2:3, the batched were in relation to the ration. Mix proportions of concrete had
weights (kg) of materials as follows: Dangote cement –15kg, fine aggregate -30kg, coarse aggregates
– 45kg and pipe-borne water -10.5kg. Twenty-four (24) cubes, twelve (12) from each type of coarse
aggregate (crushed granite and quartzite) were moulded, cured and tested to determine the compressive
strengths of the various cubes. Out of the 12 cubes from each of the aggregate type (3 cubes) was tested
for seven days, 14 days, 21 days and 28 days respectively. Inferential statistics was used in data
analysis.
FINDINGS AND DISCUSSIONS
This section presents findings from the laboratory experiment conducted on compressive strengths
of coarse aggregates (crush granite and quartzite).
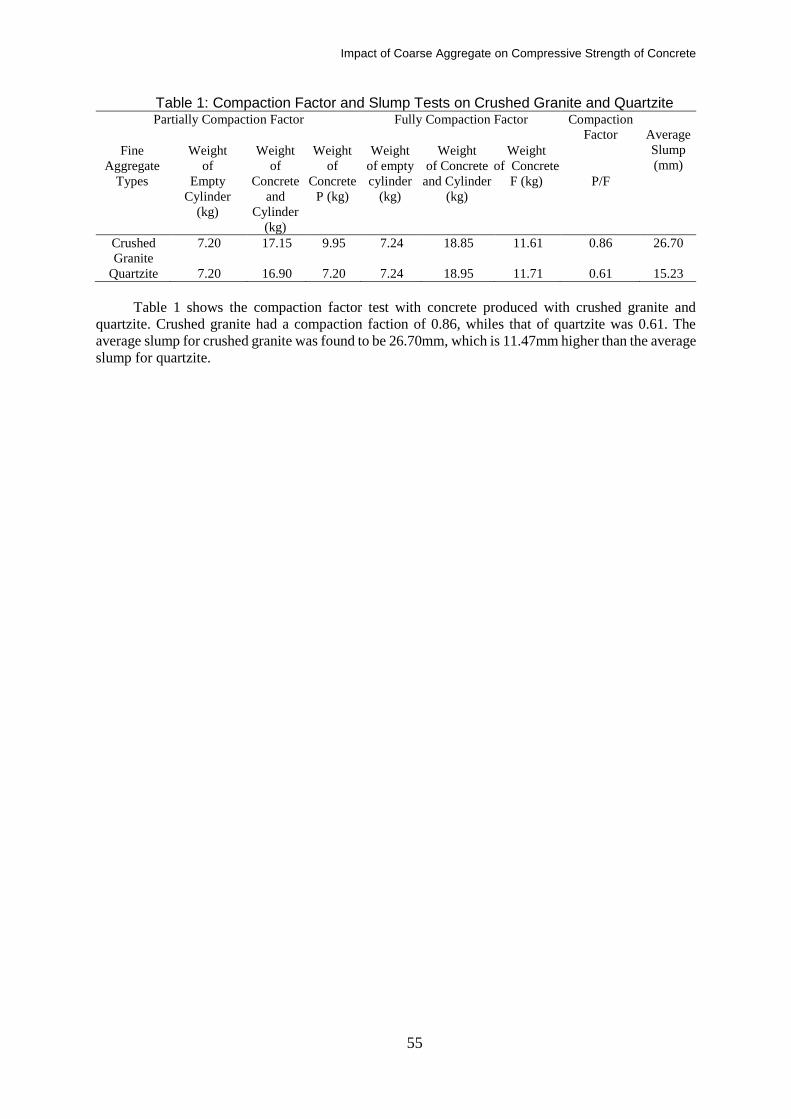
Impact of Coarse Aggregate on Compressive Strength of Concrete
55
Table 1: Compaction Factor and Slump Tests on Crushed Granite and Quartzite Partially Compaction Factor Fully Compaction Factor Compaction
Factor
Average
Slump
(mm) Fine
Aggregate
Types
Weight
of
Empty
Cylinder
(kg)
Weight
of
Concrete
and
Cylinder
(kg)
Weight
of
Concrete
P (kg)
Weight
of empty
cylinder
(kg)
Weight
of Concrete
and Cylinder
(kg)
Weight
of Concrete
F (kg)
P/F
Crushed
Granite
7.20 17.15 9.95 7.24 18.85 11.61 0.86 26.70
Quartzite 7.20 16.90 7.20 7.24 18.95 11.71 0.61 15.23
Table 1 shows the compaction factor test with concrete produced with crushed granite and
quartzite. Crushed granite had a compaction faction of 0.86, whiles that of quartzite was 0.61. The
average slump for crushed granite was found to be 26.70mm, which is 11.47mm higher than the average
slump for quartzite.
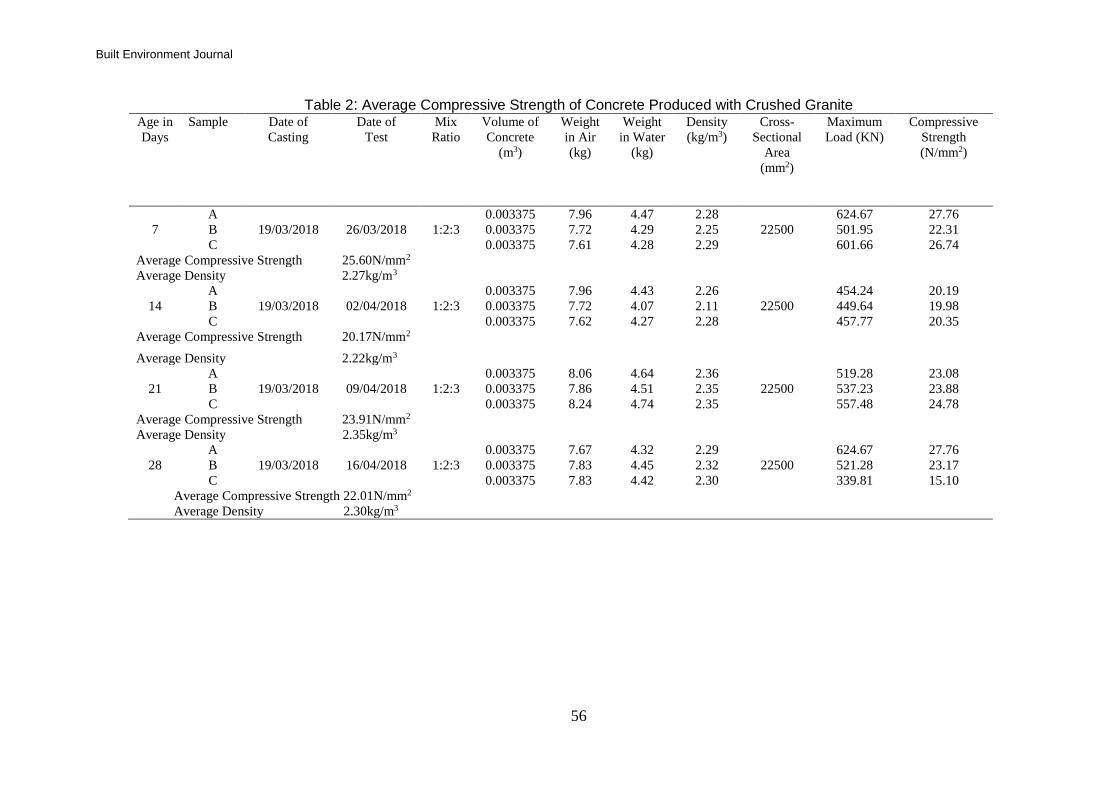
Built Environment Journal
56
Table 2: Average Compressive Strength of Concrete Produced with Crushed Granite Age in
Days
Sample Date of
Casting
Date of
Test
Mix
Ratio
Volume of
Concrete
(m3)
Weight
in Air
(kg)
Weight
in Water
(kg)
Density
(kg/m3)
Cross-
Sectional
Area
(mm2)
Maximum
Load (KN)
Compressive
Strength
(N/mm2)
7
A
19/03/2018
26/03/2018
1:2:3
0.003375 7.96 4.47 2.28
22500
624.67 27.76
B 0.003375 7.72 4.29 2.25 501.95 22.31
C 0.003375 7.61 4.28 2.29 601.66 26.74
Average Compressive Strength 25.60N/mm2
Average Density 2.27kg/m3
14
A
19/03/2018
02/04/2018
1:2:3
0.003375 7.96 4.43 2.26
22500
454.24 20.19
B 0.003375 7.72 4.07 2.11 449.64 19.98
C 0.003375 7.62 4.27 2.28 457.77 20.35
Average Compressive Strength 20.17N/mm2
Average Density 2.22kg/m3
21
A
19/03/2018
09/04/2018
1:2:3
0.003375 8.06 4.64 2.36
22500
519.28 23.08
B 0.003375 7.86 4.51 2.35 537.23 23.88
C 0.003375 8.24 4.74 2.35 557.48 24.78
Average Compressive Strength 23.91N/mm2
Average Density 2.35kg/m3
28
A
19/03/2018
16/04/2018
1:2:3
0.003375 7.67 4.32 2.29
22500
624.67 27.76
B 0.003375 7.83 4.45 2.32 521.28 23.17
C 0.003375 7.83 4.42 2.30 339.81 15.10
Average Compressive Strength 22.01N/mm2
Average Density 2.30kg/m3

Impact of Coarse Aggregate on Compressive Strength of Concrete
57
Table 2 shows the average compressive strength of concrete produced with crushed granite
for the 7days, 14days, 21days and 28days. The age of the concrete produced 7days had the
highest an average compressive strength of 25.60N/mm2, with density of 2.27kg/m3 followed
by the age of the concrete produced in 21days, with an average compressive strength of
23.91N/mm2 and density of 2.35kg/m3, and 28days with an average compressive strength of
22.01N/mm2 and density of 2.30kg/m3. The least average compressive strength of 20.17N/mm2
and density of 2.22kg/m3 was recorded in the age of 14days.

Built Environment Journal
58
Table 3: Average Compressive Strength of Concrete Produced with Quartzite Age in
Days
Sample Date of
Casting
Date of
Test
Mix
Ratio
Volume of
Concrete
(m3)
Weight
in Air
(kg)
Weight
in Water
(kg)
Density
(kg/m3)
Cross-
Sectional
Area
(mm2)
Maximum
Load (KN)
Compressive
Strength
(N/mm2)
7
A
21/03/2018
28/03/2018
1:2:3
0.003375 8.16 4.58 2.28
22500
632.34 28.10
B 0.003375 8.24 4.32 2.10 701.37 31.17
C 0.003375 7.85 4.23 2.17 509.62 22.65
Average Compressive Strength 27.31N/mm2
Average Density 2.18kg/m3
14
A
21/03/2018
04/04/2018
1:2:3
0.003375 7.89 4.42 2.27
22500
521.13 23.16
B 0.003375 7.49 4.17 2.26 464.37 20.64
C 0.003375 7.80 4.40 2.29 514.68 22.87
Average Compressive Strength 22.22N/mm2
Average Density 2.27kg/m3
21
A
21/03/2018
11/04/2018
1:2:3
0.003375 7.98 4.60 2.36
22500
631.73 28.08
B 0.003375 8.05 4.63 2.35 496.12 22.05
C 0.003375 7.72 4.45 2.36 349.47 15.53
Average Compressive Strength 21.89N/mm2
Average Density 2.36kg/m3
28
A
19/03/2018
18/04/2018
1:2:3
0.003375 8.16 4.59 2.29
22500
721.93 32.09
B 0.003375 7.78 4.17 2.16 325.23 15.65
C 0.003375 8.05 4.60 2.33 578.11 25.48
Average Compressive Strength 24.48N/mm2
Average Density 2.26kg/m3
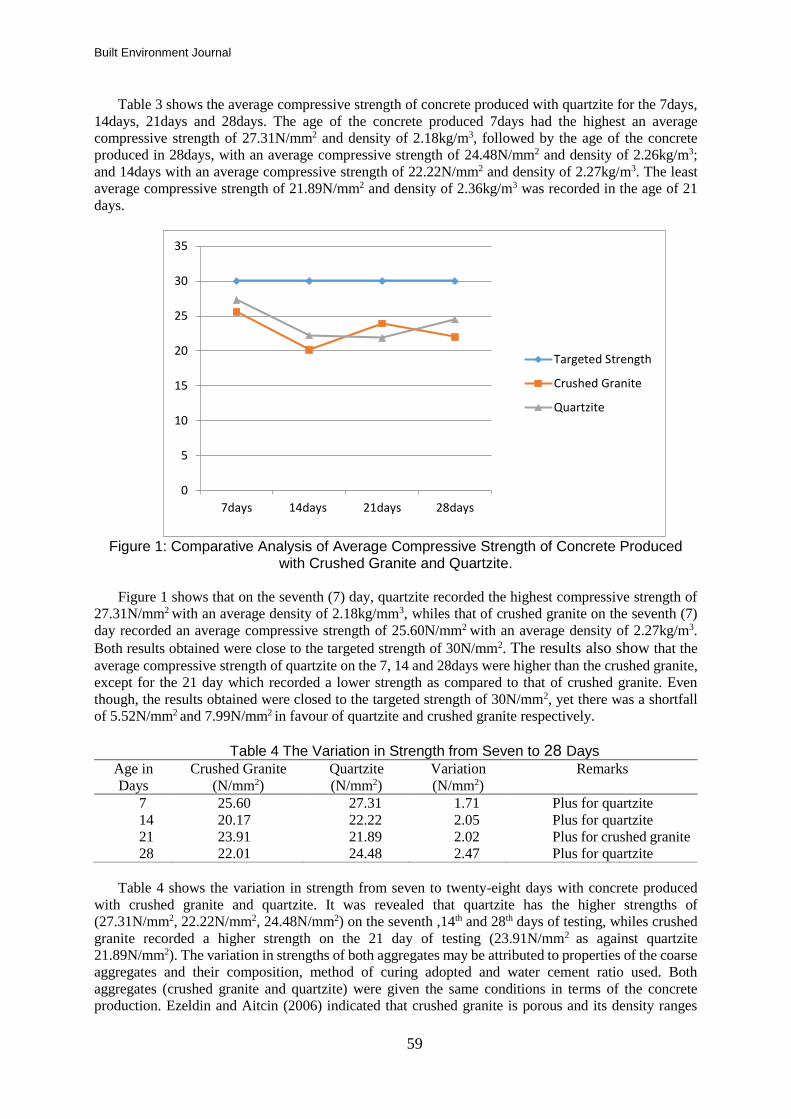
Built Environment Journal
59
Table 3 shows the average compressive strength of concrete produced with quartzite for the 7days,
14days, 21days and 28days. The age of the concrete produced 7days had the highest an average
compressive strength of 27.31N/mm2 and density of 2.18kg/m3, followed by the age of the concrete
produced in 28days, with an average compressive strength of 24.48N/mm2 and density of 2.26kg/m3;
and 14days with an average compressive strength of 22.22N/mm2 and density of 2.27kg/m3. The least
average compressive strength of 21.89N/mm2 and density of 2.36kg/m3 was recorded in the age of 21 days.
Figure 1: Comparative Analysis of Average Compressive Strength of Concrete Produced
with Crushed Granite and Quartzite.
Figure 1 shows that on the seventh (7) day, quartzite recorded the highest compressive strength of
27.31N/mm2 with an average density of 2.18kg/mm3, whiles that of crushed granite on the seventh (7)
day recorded an average compressive strength of 25.60N/mm2 with an average density of 2.27kg/m3.
Both results obtained were close to the targeted strength of 30N/mm2. The results also show that the
average compressive strength of quartzite on the 7, 14 and 28days were higher than the crushed granite,
except for the 21 day which recorded a lower strength as compared to that of crushed granite. Even
though, the results obtained were closed to the targeted strength of 30N/mm2, yet there was a shortfall
of 5.52N/mm2 and 7.99N/mm2 in favour of quartzite and crushed granite respectively.
Table 4 The Variation in Strength from Seven to 28 Days
Age in
Days
Crushed Granite
(N/mm2)
Quartzite
(N/mm2)
Variation
(N/mm2)
Remarks
7 25.60 27.31 1.71 Plus for quartzite
14 20.17 22.22 2.05 Plus for quartzite
21 23.91 21.89 2.02 Plus for crushed granite
28 22.01 24.48 2.47 Plus for quartzite
Table 4 shows the variation in strength from seven to twenty-eight days with concrete produced
with crushed granite and quartzite. It was revealed that quartzite has the higher strengths of
(27.31N/mm2, 22.22N/mm2, 24.48N/mm2) on the seventh ,14th and 28th days of testing, whiles crushed
granite recorded a higher strength on the 21 day of testing (23.91N/mm2 as against quartzite
21.89N/mm2). The variation in strengths of both aggregates may be attributed to properties of the coarse
aggregates and their composition, method of curing adopted and water cement ratio used. Both
aggregates (crushed granite and quartzite) were given the same conditions in terms of the concrete
production. Ezeldin and Aitcin (2006) indicated that crushed granite is porous and its density ranges
0
5
10
15
20
25
30
35
7days 14days 21days 28days
Targeted Strength
Crushed Granite
Quartzite
Built Environment Journal
60
between 2.65 - 2.75 g/cm3. While its hardness is 6-7 and compressive strength of 175.00 N/mm2. The
specific gravity of granite ranges between 2.6 - 2.7, with specific heat capacity of 0.79 kJ/Kg. The
strength of crushed granite reduces in the presence of water. Whereas, quartzite is porous and its density
is 2.32 - 2.42 g/cm3, which is lower than that of crushed granite. Both crushed granite and quartzite have
similar hardness, but with difference in compressive strength of 60 N/mm2 in favour of crushed granite.
The specific gravity of both crushed granite and quartzite were similar and difference in specific heat
capacity of 0.04 kJ/Kg in favour of quartzite (Ezeldin and Aitcin, 2006). Judging from the above
discussion, it can be concluded that strength from seven to twenty-eight days, as shown in Table 4 may
be attributed to the properties of the individual aggregates. Most especially, their densities and
compressive strengths as shown in Tables 2 and 3, due to different properties in aggregates. Kyoung-
Min, Lee and Jae-Yeol (2018) were of the view that the effect of coarse aggregate size can be based on
the dynamic concrete compressive strength.
CONCLUSION
The paper examined the impact of coarse aggregates type on the compressive strength of concrete.
Concrete made from quartzite aggregate had the highest compressive strength from the findings.
Quartzite had the highest average compressive strength of 24.48N/mm2 with an average density of
2.16kg/m3, whiles that of Crushed Granite was 22.01N/mm2 with an average density of 2.30kg/m3 on
the 28 day of testing. This shows that both aggregates (crushed granite and quartzite) could not meet the
targeted strength of 30N/mm2, used for concrete production. The average compressive strength of
Quartzite on the 7, 14 and 28days were found to be higher than the Crushed Granite, except for the 21
day which recorded a lower strength as compared to that of Crushed Granite. The results were close to
the targeted strength of 30N/mm2, with difference of 5.52N/mm2 and 7.99N/mm2 for Quartzite and
Crushed Granite respectively. Concrete strength of 25N/mm2 should be chosen over 30N/mm2, since all
the average compressive strengths from the 7day to the 28day did not meet the required target strength
of 30N/mm2. Both crushed granite and quartzite aggregates should not be encouraged for producing
concrete with a mix ratio 1:2:3 of strength 30N/mm2, but rather 25N/mm2. Quartzite aggregate had the
highest strength on the 7, 14 and 28days compared to the crushed granite. Different cement type should
be used in other to check the flow of its strength and aggregates with similar properties to produce the
concrete cube. The factors that accounted for the variation in strength of the concrete are attributed to
the properties of the individual aggregates (densities and compressive strengths) due to different
properties and strength.
REFERENCES
Anosike, D.L. & Oyebande R.D. (2012). "Shear Bond Strength between Coarse Aggregate and Cement
Paste or Mortar," ACI Journal, Proceedings, 61 (8), August, 939-957.
Beshr, H., Almusallam, A.A. & Maslehuddin, M., (2003). Effect of Coarse Aggregate Quality on the
Mechanical Properties of High Strength Concrete, Construction and Building Materials, 17(2),
97-103.
Bremmer G. (2006). Compressive strength of Concrete, Her Majesty Stationery Office, London.
Duggal, F. A. (2003). Comparative study of concrete properties Building and environment, 41(3), 297
– 301.
Elices, M. & Rocco, C.G. (2008). Effect of Aggregate Size on the Fracture and Mechanical Properties
of a Simple Concrete, Engineering Fracture Mechanics, 75(13), 3839-3851.
Ellis, S. (2006). "Effects of Aggregate Size on Properties of Concrete," ACI Journal, Proceedings 57
(3), September, 283-298.
Ezeldin, A. S. & Aitcin, P.C. (2006). "Effect of Coarse Aggregate on the Behavior of Normal and High-
Strength Concretes," Cement, Concrete, and Aggregates, CCAGDP, 13 (2), 121-124.
Kyoung-Min, K., Lee, K. and Jae-Yeol, C. (2018). Effect of maximum coarse aggregate size on dynamic
compressive strength of high-strength concrete, International Journal of Impact Engineering, vol.
125, 107-116, Available from: https://www.sciencedirect.com (accessed 29 January 2019).
Impact of Coarse Aggregate on Compressive Strength of Concrete
61
Meddah, M.S., Zitouni, S. and Belâabes, S. (2010). Effect of Content and Particle Size Distribution of
Coarse Aggregate on the Compressive Strength of Concrete, Construction and Building
Materials, 24(4), 505-512.
Mindess, S., Young, J.F. & Darwin, D. (2003). Concrete. 2nd EditionPearson Education, Inc. New Jersey.
Özturan, T. & Çeçen, C., (2007), Effect of Coarse Aggregate Type on Mechanical Properties of
Concretes with Different Strength, Cement and Concrete Research, 27, Issue 2, 165-170.
Perdikaris, P. C. & Romeo, A. (1995). "Size Effect on the Fracture Energy of Concrete and Stability
Issues in 3-Point Bending Fracture Toughness Testing," ACIMaterials Journal, 92 (5), September-
October, 483-496.
Ruiz, W. M. (2006) "Effect of Volume of Aggregate on the Elastic and Inelastic Properties of Concrete,"
M.S. Thesis, Cornell University, January.
Walker, D.A. & Bloem, F.H. (2007). "Effect of Specimen and Crack Sizes, Water/Cement Ratio and
Coarse Aggregate Texture upon Fracture Toughness of Concrete," Magazine of Concrete
Research, 36 (129), 227-236.
Wu, K.R., Chen, B., Yao, W. & Zhang, D., (1997). “Effect of Coarse Aggregate Type on Mechanical
Properties of High-Performance Concrete”, Cement and Concrete Research, 31(10), 1421-1425.
Built Environment Journal
62
NOTES FOR CONTRIBUTORS
SUBMISSION
All materials submitted for publication must be
original, unpublished work and are NOT under
consideration for publication elsewhere. Papers may
be submitted via
http://myjms.mohe.gov.my/index.php/bej/about/sub
missions and the authors may notify us via e-mail at
Address:
Sr Dr Siti Aekbal Salleh
Managing Editor
Built Environment Journal (BEJ)
Faculty of Architecture, Planning and Surveying
Universiti Teknologi MARA
40450 Shah Alam
Selangor, Malaysia.
Editors reserve the right to edit/comment on the
content of the manuscript. If major or substantial
amendments are recommended by the editors the
authors will be given the option to accept or reject
the recommendations (and withdraw participation).
MANUSCRIPT PREPARATION
Language
The manuscript must be submitted in British
English.
Length
The manuscript should be within the range of 5000
– 7500 words in Times New Roman font, 12-point
type. Authors are requested to state how many words
their paper contains. The manuscripts should be
typed and single spaced on one side of A4 paper
only, with 4 cm margins on the sides, the top and the
bottom. All text should be set aligned justified
throughout. The pages should be numbered in order.
Title Page
The first page of the manuscripts must contain the
full title, name of author(s), designation(s) of
affiliation(s), highest academic qualification and the
present address(es) with the telephone/fax/e-mail
contact information listed.
Abstract and Keywords
The abstract must not exceed 250 words and should
summarise the paper including the main conclusions.
There shall be not more than 5 keywords.
Text
The order when typing manuscripts: Title, author(s),
highest academic qualification, Affiliations,
Abstract, Keywords, Main Text (Aim, Problem
Statement/Issues, Methodology and Analysis),
Conclusion and Recommendations, References,
Acknowledgment and Appendix (if any). Simple
language, short sentences and a good use of headings
are encouraged. Headings should be numbered and
the use of more than three levels of heading should
be avoided. Headings and paragraphs should be
separated by two carriage returns. Text following a
heading should not be indented.
Illustration
Photographs, diagrams and charts should be referred
to as “Figure(s)” and numbered in the order in which
they are referred to in the text. Maps and diagrams
should be submitted in a form ready for
reproduction, all in legible digital format. Please
note that illustrations in the journal shall be printed
in black-and-white or grey-scale.
Units
All measurements and data should be given in metric
units or, if other units are used, then the metric
equivalent should be given in parentheses.
Reference
The APA 6th reference system is used. The
reference is referred to in the text by the following
manner:
Journal
Alesheikh, A. A., Ghorbanali, A., & Nouri, N.
(2007). Coastline change detection using remote
sensing. International Journal of Environmental
Science & Technology, 4(1), 61-66.
Baig, M. H. A., Zhang, L., Shuai, T., & Tong, Q.
(2014). Derivation of a tasselled cap
transformation based on Landsat 8 at-satellite
reflectance. Remote Sensing Letters, 5(5), 423-
431.
Book
Malcolm Taylor (2000) Avoiding Claims in Building
Design: Risk Management in Practice,
Blackwell Science Ltd, London
Conference Proceeding
Hamzeh, F.R. (2011). The Lean Journey:
Implementing the Last Planner System in
Construction, Proceedings of the 19th Annual
Conference of the International Group for Lean
Construction, IGLC 19, 13-15 July, Lima, Peru,
pp. 379- 390
COPYRIGHT
Once published in the Built Environment Journal,
the copyright including electronic copyrights of the
article is automatically invested with UiTM. The
copyright covers the exclusive use of rights to
reproduce and distribute the article, including
reprints, photography reproductions, microfilm,
electronic publication or any reproduction of a
similar nature and translations. Permission to publish
illustrations must be obtained by the author before
submission. Any acknowledgements should be
included in the figure captions.