Building Your Portfolio A Roadmap to Financial Freedom John Jonkman [email protected] Ph/txt:...
23
Building Your Building Your Portfolio Portfolio A Roadmap to Financial Freedom John Jonkman [email protected] Ph/txt: 801-262-3296 www.slreia.homestead.com Salt Lake Real Estate Investors Association 10 June 2015 copyright: 2015. John Jonkman
-
Upload
joseph-washington -
Category
Documents
-
view
214 -
download
0
Transcript of Building Your Portfolio A Roadmap to Financial Freedom John Jonkman [email protected] Ph/txt:...

Building Your Building Your PortfolioPortfolio
A Roadmap to Financial Freedom
John [email protected]/txt: 801-262-3296
www.slreia.homestead.com
Salt Lake Real Estate Investors Association10 June 2015
copyright: 2015. John Jonkman

How I Got StartedHow I Got Started
• Came to USA in 1973• Lived in apartments for 5+ years• Bought duplex in mid-1978: rented out 1 side• Job transfer: sold it 12 weeks later• Bought 4-plex in Dec. 1978 – Sold it in Dec. 03• Bought duplex in July 1979 – Sold it in Jan. 04• Bought 4-plex in April 1980 – sold in Sept. 1997

How I Got StartedHow I Got Started• Started Partnership in 1983
– Bought five 4-plexes in 1983/1984– Rental market collapsed in 1986/1987– Went broke; lost properties, credit, etc.
• Started Partnerships in 1989 – Bought 11 more 4-plexes; 1989 – 1992– Sold them 1997 – 2003
• Now own 12 single family homes & condos

www.jj2.uswww.jj2.us

My StrategyMy Strategy
• Buy properties from distressed situations - very cheap
• Make them livable/rentable asap - interior• Initially rent them out cheap• Use cash flow to fix up exterior – curb appeal• When vacant: improve interior: raise rents

My FormulaMy Formula
AttractBetter
Tenants
Charge Higher Rents
Improve the
BuildingIncrease Value of the Property
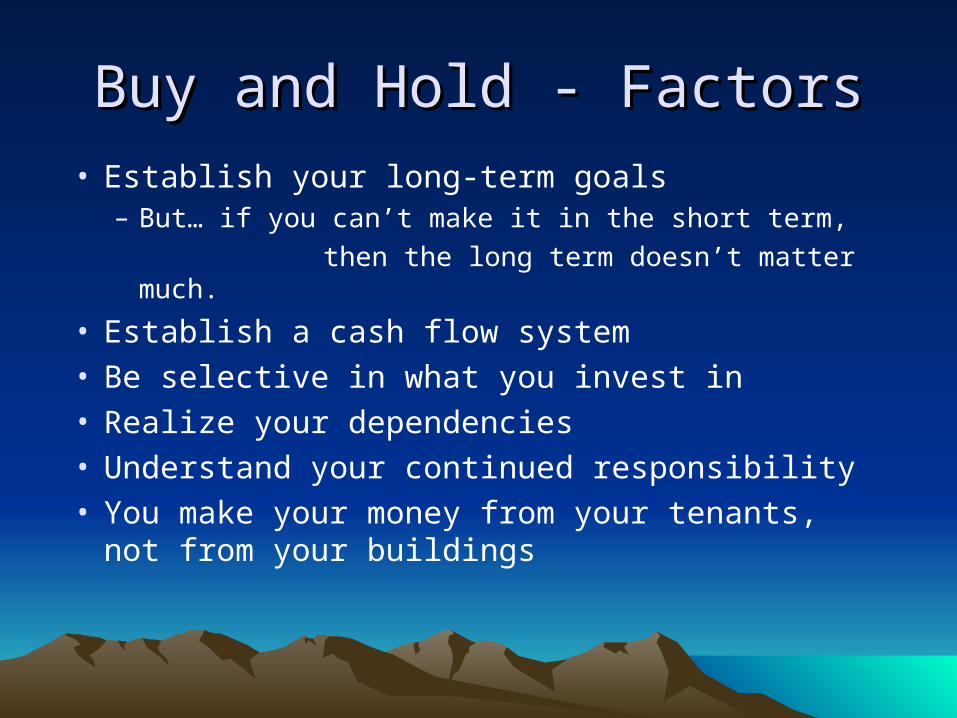
Buy and Hold - FactorsBuy and Hold - Factors
• Establish your long-term goals– But… if you can’t make it in the short term,
then the long term doesn’t matter much.
• Establish a cash flow system• Be selective in what you invest in• Realize your dependencies• Understand your continued responsibility• You make your money from your tenants, not
from your buildings

Take Advantage of Cycles and trendsTake Advantage of Cycles and trends
Source: www.bankrate.com
30 fixed mortgage rates
Average Home ValuesSL County
Source: www.zillow.com
Source: www.zillow.com
Average RentsSL County

Management PhilosophyManagement Philosophy
Loyal Tenants
Profitable Tenants
Happy TenantsMaximizeMaximize
ValueValue


HUD - Section 8:HUD - Section 8:Fair Market Rents for FY2015Fair Market Rents for FY2015
County 0 BR 1 BR 2 BR 3 BR 4 BR
Salt Lake $606 $727 $901 $1,285 $1,513
Davis, Morgan, Weber $485 $594 $778 $1,097 $1,317
Utah, Juab $500 $639 $763 $1,103 $1,351
Summit $682 $749 $1,014 $1,406 $1,411
Tooele $538 $568 $757 $977 $1,241
Wasatch $659 $732 $868 $1,279 $1,283
Subtract Utility Allowance www.huduser.org* For larger units: add 15% per bedroom to amount for 4 BR unit

Wasatch FrontRents by Unit Type
Source: www.comre.com/research
(July 2014)
2.6 percent vacancy rate for properties with fewer than 100 units.
The rental inventory of Salt Lake County is nearly “fully occupied.”

Wasatch FrontRents by Unit Type
Source: www. equimark.com

East vs. West Rental RatesEast vs. West Rental Rates
Source: www.comre.com/research
(July 2014)

SL County Vacancy RatesSL County Vacancy Rates
0.0%
2.0%
4.0%
6.0%
8.0%
10.0%
12.0%
14.0%
19
90
91
92
93
94
95
96
97
98
99
00
01
02
03
04
05
06
07
08
09
10
11
12
13
20
14
East West
Sources: www. equimark.com www.comre.com/research

Salt Lake CountyTraffic Infrastructure
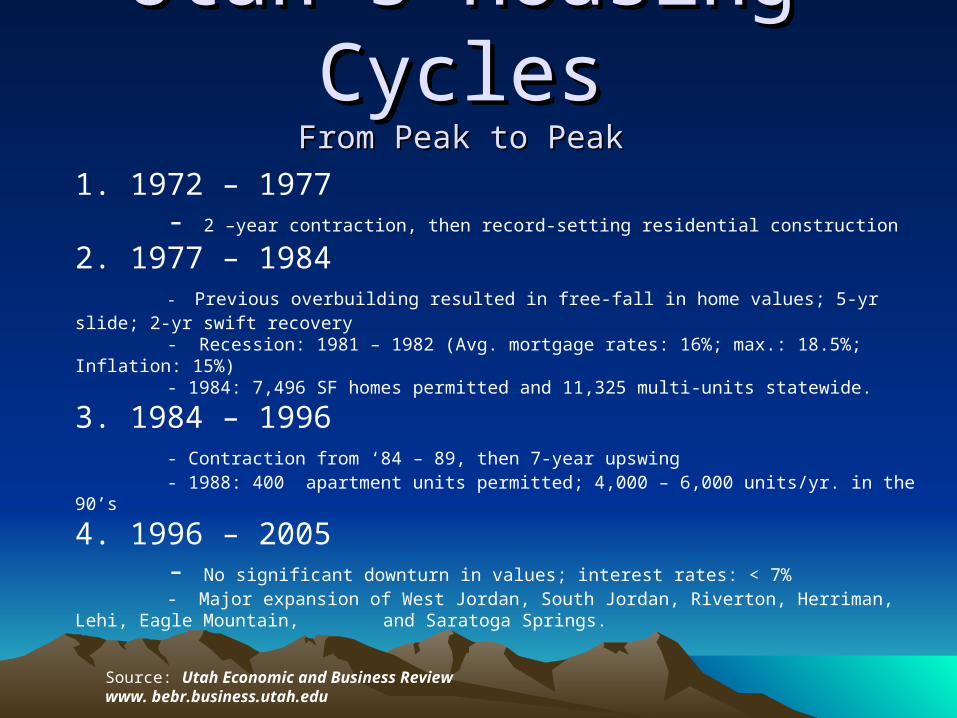
Utah’s Housing CyclesUtah’s Housing CyclesFrom Peak to PeakFrom Peak to Peak
1. 1972 – 1977- 2 –year contraction, then record-setting residential construction
2. 1977 – 1984- Previous overbuilding resulted in free-fall in home values; 5-yr slide; 2-yr swift recovery- Recession: 1981 – 1982 (Avg. mortgage rates: 16%; max.: 18.5%; Inflation: 15%)- 1984: 7,496 SF homes permitted and 11,325 multi-units statewide.
3. 1984 – 1996 - Contraction from ‘84 – 89, then 7-year upswing- 1988: 400 apartment units permitted; 4,000 – 6,000 units/yr. in the 90’s
4. 1996 – 2005- No significant downturn in values; interest rates: < 7%- Major expansion of West Jordan, South Jordan, Riverton, Herriman, Lehi, Eagle
Mountain, and Saratoga Springs.
Source: Utah Economic and Business Reviewwww. bebr.business.utah.edu

Utah’s Housing CyclesUtah’s Housing CyclesFrom Peak to PeakFrom Peak to Peak
5. 2005 – present: the Great Recession Cycle- 4 Years of falling housing prices, then slowest/longest post-WW2 recovery- $25B equity loss for Utah home owners- Record number of foreclosures- Loss of 70,000 jobs- 21% decline in home values- 1,000’s of doubling up of households- 2000 to 2010: average annual growth rate for renter-occupied units 2.65% percent owner-occupied units: 2.11%. - Mortgage interest rates since 2010: < 5%
Source: Utah Economic and Business Reviewwww. bebr.business.utah.edu
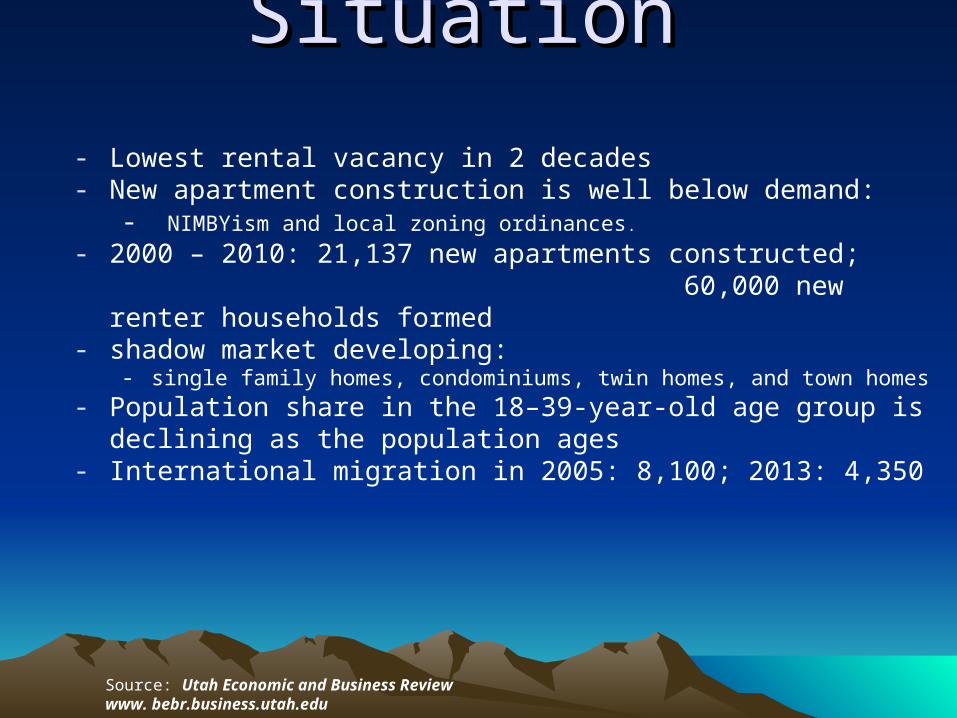
Current SituationCurrent Situation
- Lowest rental vacancy in 2 decades- New apartment construction is well below demand:
- NIMBYism and local zoning ordinances.
- 2000 – 2010: 21,137 new apartments constructed; 60,000 new renter households formed
- shadow market developing:- single family homes, condominiums, twin homes, and town homes
- Population share in the 18–39-year-old age group is declining as the population ages
- International migration in 2005: 8,100; 2013: 4,350
Source: Utah Economic and Business Reviewwww. bebr.business.utah.edu
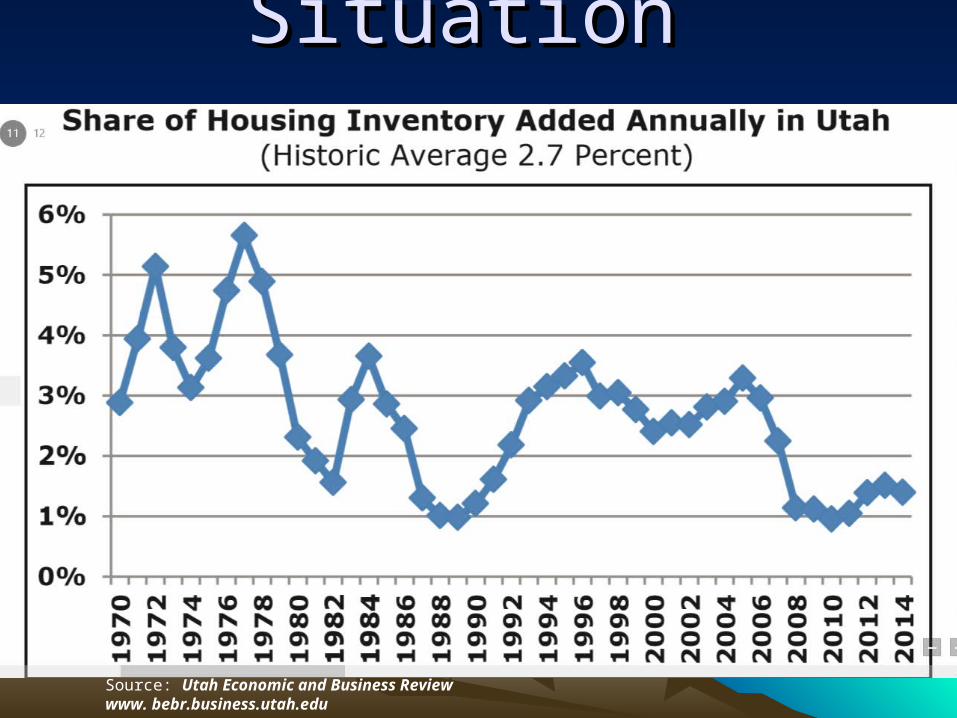
Current SituationCurrent Situation
Source: Utah Economic and Business Reviewwww. bebr.business.utah.edu

OutlookOutlook
- Annual apartment construction to triple in the next 3 years- SL area: from 1,223 to 3,261/yr. Highest in 30 years; might reach saturation point- Mostly 1 or 2 bdrm, Class A units; $1,000 - $1,400/month- Sugarhouse and Downtown SL: Rents at $2.00/sq. ft.
- New projects not affordable by average renter- Shortage of affordable units- 1st time homebuyers are strapped for cash- Slower household formation- Historic shift away from buying towards renting- US homeownership rate is at 20-year low; from 69% in 2004 to 64% in 2014- Utah’s population expected to double by 2050- Since 2007 the median household income has fallen by 7 percent when
adjusted for inflation.
- Large players entering SFR market (American Homes 4 Rent, Blackstone, Colony American Homes)
- 2 Subgroups of renters- Millenials: 25-35 yr. olds; smaller units, mobility, public transport, homeownership not important
- Do not want a house, 2 cars, a picket fence, and a long commute- Boomerang baby boomer parents: living with adult children’s households
Source: Utah Economic and Business Reviewwww. bebr.business.utah.edu

Building Your Building Your PortfolioPortfolio
A Roadmap to Financial Freedom
John [email protected]/txt: 801-262-3296
Salt Lake Real Estate Investors Association10 June, 2015
copyright: 2015. John Jonkman