Building Up Demand-Oriented Charging Infrastructure for ...elib.dlr.de/109724/1/Soylu Anderson et...
15
Available online at www.sciencedirect.com ScienceDirect Transportation Research Procedia 00 (2016) 000–000 www.elsevier.com/locate/procedia 2214-241X © 2016 The Authors. Published by Elsevier B.V. Peer-review under responsibility of the organizing committee of mobil.TUM 2016. International Scientific Conference on Mobility and Transport Transforming Urban Mobility, mobil.TUM 2016, 6-7 June 2016, Munich, Germany Building Up Demand-Oriented Charging Infrastructure for Electric Vehicles in Germany Tamer Soylu *,a , John E. Anderson b , Nicole Böttcher b , Christine Weiß a , Bastian Chlond a , Tobias Kuhnimhof b *Corresponding author: [email protected] a Karlsruhe Institute of Technology, Institute for Transport Studies, Otto-Ammann-Platz 9, 76131 Karlsruhe, Germany b Institute of Transport Research, German Aerospace Center, Rutherfordstr. 2, 12489 Berlin, Germany Abstract Mobility offerings have never been as abundant and varied as the present. While users welcome new and innovative mobility options, this current paradigm shift presents a challenge for authorities that plan, organize, and operate such services. In particular, integrating new mobility services into existing infrastructure systems can generate problems of acceptance, co- operability, and compatibility. This problem is especially relevant for electric vehicles. Limited range and battery capacity of battery electric vehicles make them dependent on charging infrastructure, which in turn hinders their acceptance. In light of the German government’s goal of one million electric vehicles by 2020, establishing a demand-oriented charging infrastructure is of crucial importance. However, numerous questions remain unanswered regarding the quantity, type, and location of electric vehicle charging stations in Germany. This article presents the findings of the project “LADEN2020: Concept to build up a demand-oriented charging infrastructure in Germany between today and 2020.” The research project develops a systematically comprehensible and consistent strategy for electric vehicle charging infrastructure in Germany. The paper presents the methodological framework to estimate the charging demand for daily and long-distance travel, which is unique and innovative as similar comprehensive and consistent analytical tools do not exist to date. © 2016 The Authors. Published by Elsevier B.V. Peer-review under responsibility of the organizing committee of mobil.TUM 2016. Keywords: Electric vehicles, electric mobility, charging infrastructure, daily travel, long-distance travel, Germany
Transcript of Building Up Demand-Oriented Charging Infrastructure for ...elib.dlr.de/109724/1/Soylu Anderson et...

Available online at www.sciencedirect.com
ScienceDirect Transportation Research Procedia 00 (2016) 000–000
www.elsevier.com/locate/procedia
2214-241X © 2016 The Authors. Published by Elsevier B.V. Peer-review under responsibility of the organizing committee of mobil.TUM 2016.
International Scientific Conference on Mobility and Transport Transforming Urban Mobility, mobil.TUM 2016, 6-7 June 2016, Munich, Germany
Building Up Demand-Oriented Charging Infrastructure for Electric Vehicles in Germany
Tamer Soylu*,a, John E. Andersonb, Nicole Böttcherb , Christine Weißa, Bastian Chlonda, Tobias Kuhnimhofb
*Corresponding author: [email protected] a Karlsruhe Institute of Technology, Institute for Transport Studies, Otto-Ammann-Platz 9, 76131 Karlsruhe, Germany
b Institute of Transport Research, German Aerospace Center, Rutherfordstr. 2, 12489 Berlin, Germany
Abstract
Mobility offerings have never been as abundant and varied as the present. While users welcome new and innovative mobility
options, this current paradigm shift presents a challenge for authorities that plan, organize, and operate such services. In
particular, integrating new mobility services into existing infrastructure systems can generate problems of acceptance, co-
operability, and compatibility. This problem is especially relevant for electric vehicles. Limited range and battery capacity of
battery electric vehicles make them dependent on charging infrastructure, which in turn hinders their acceptance. In light of the
German government’s goal of one million electric vehicles by 2020, establishing a demand-oriented charging infrastructure is of
crucial importance. However, numerous questions remain unanswered regarding the quantity, type, and location of electric
vehicle charging stations in Germany. This article presents the findings of the project “LADEN2020: Concept to build up a
demand-oriented charging infrastructure in Germany between today and 2020.” The research project develops a systematically
comprehensible and consistent strategy for electric vehicle charging infrastructure in Germany. The paper presents the
methodological framework to estimate the charging demand for daily and long-distance travel, which is unique and innovative as
similar comprehensive and consistent analytical tools do not exist to date.
© 2016 The Authors. Published by Elsevier B.V. Peer-review under responsibility of the organizing committee of mobil.TUM 2016.
Keywords: Electric vehicles, electric mobility, charging infrastructure, daily travel, long-distance travel, Germany

2 Soylu et al. / Transportation Research Procedia 00 (2016) 000–000
1. Introduction
In order to mitigate global climate change and reduce urban air pollution, many European countries (1), as well as
the USA (2), China (3), and Japan (4), advocate for electric vehicle (EV) deployment. In Germany, the federal
government aims to have one million electric vehicles – mainly battery electric vehicles (BEVs) and plug-in hybrid
electric vehicles (PHEVs) – by 2020 (7).
Given that there are three million new vehicle registrations per year in Germany, reaching the goal of one million
EVs by 2020 requires that around 7% of all vehicle registrations between now and 2020 are EVs. This high market
penetration requires that a large segment of new car buyers, not just early-adopters, opt for EVs (2). The successful
mass commercialization of EVs requires sufficient charging infrastructure (6). This raises the question of how much
infrastructure is necessary (11). One particular challenge in determining nation-wide charging infrastructure is the
dissimilar characteristics of daily travel (DT) and long-distance travel (LD-travel). For DT, repetitive and short
distances trips can be met with either one long over-night charge or fast charging during typically daily events (e.g.,
shopping). For LD-travel, the above charging pattern is not sufficient as charging events must occur during a very
short time span.
In this paper, we introduce a new method to determine the number of charging points required for the German case
study. Our method focuses on a flexible modelling approach without computational complexity, and aims for a
straightforward analysis of a large amount of input data. The method has two separate approaches: one for the daily
travel and one for the long-distance travel. In the following section (Section 2) we present a literature review of
charging infrastructure planning. Section 3 describes charging infrastructure for daily travel outlining the
methodology, data, assumptions, and analysis. Section 4 illustrates the methodology for charging infrastructure
planning in long-distance travel. Section 5 summarizes the results of the research, and finally Section 6 presents the
conclusions of the paper.
2. Literature review
For Germany, the National Platform for Electric-mobility recommends the development of 77,100 public charging
points for normal and fast charging to fulfill the requirements of one million EVs (13). Alternatively, the European
Commission suggests 1.5 million charging points in Germany by 2020, of which 150,000 should be publically
accessible charging points (11). Funke et al. estimate a need for 15,000 charging points for on-street parkers and
2,000 fast charging stations in 2020 based on a user-need analysis model (14). Thus, there is substantial variation in
the recommended quantity of charging infrastructure due to differences in analysis methodologies. Existing
approaches to establish charging infrastructure use complex mathematical models, such as discrete, graph theory
based methods (15, 16), or diverse location models (17, 18).

Author name / Transportation Research Procedia 00 (2016) 000–000 3
For the estimation of demand in long-distance travel, available studies also vary from relative simple estimation
methods to complex optimization approaches such as capturing models (29). In the capturing approaches, a given
number of refueling facilities are located such that the total vehicle flows refueled are maximized. These approaches
also vary in spatial resolution, which means they cover partly freeway sections, small city-regions, and seldom
countries as a whole. The main difficulty of estimation charging demand using capturing models in LD-travel lies in
the contradiction that spatially detailed complex models are time and cost inefficient.
3. Charging infrastructure – daily travel
3.1. Methodology
Based on the premise that electric mobility will be a mass market by 2020, we assume that EVs will be used
similarly to today’s relatively new conventional vehicles. Therefore, we utilize actual travel survey data (i.e., vehicle
usage profiles, destination information, parking durations) for conventional vehicles to derive charging demand for
EVs similar to other research (12). We also design charging infrastructure such that it allows people to charge in
situations during which their cars park anyway (e.g., at work or during shopping). Further, we assume that users do
not change their activity and travel patterns due to EVs. Rather, they just choose slightly different destinations.
3.2. Data and assumptions
In order to provide an empirical basis for assumptions about charging demand, data from the most recent German
National Travel Survey (MiD) from 2008 (24) are used. To match travel behavior of EVs in 2020 as closely as
possible, vehicles older than six years (about the median age of the German passenger car fleet) were excluded from
the analysis. This reduces the sample size of the vehicle data set to 16,419 vehicles. The MID 24-hour person diaries
are rearranged into 24-hour vehicle usage profiles representing car use on a typical day.
We examine three major factors, and the resulting six scenarios, influencing infrastructure requirements (see
TABLE 1):
• Fleet composition: In order to determine the influence of fleet composition on infrastructure requirements,
two alternatives are evaluated: a BEV dominated EV fleet and a PHEV dominated EV fleet.
• Availability of private parking at home: Having a private parking spot at home assumes that the vehicle can
be charged at home. The MiD data show that 73% of vehicles have a private parking spot at home. The first
scenario evaluated is that only those persons with a parking spot at home purchase an EV (i.e., 100% home
parking). The alternative is that 73% of vehicles have a private parking spot at home.
• Availability of on-street charging infrastructure: Curbside charging has a potentially large influence on
total infrastructure needs, especially for those without private parking at home. Two scenarios are
examined: charging infrastructure is not available for on-street locations at home and at work, and charging
infrastructure is available at these locations.
4 Soylu et al. / Transportation Research Procedia 00 (2016) 000–000
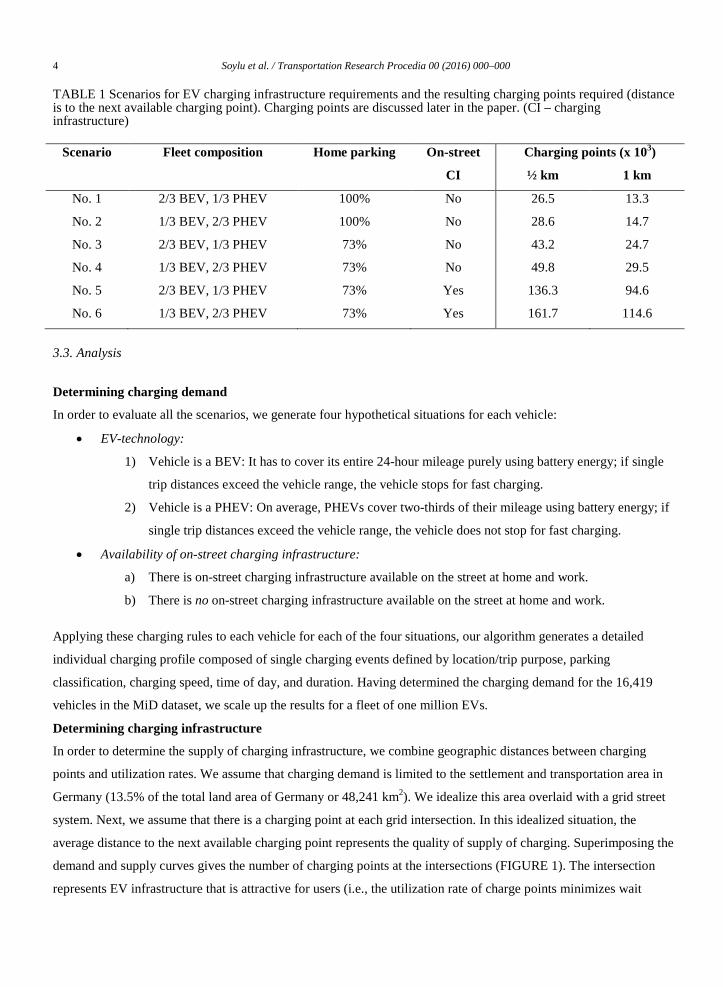
TABLE 1 Scenarios for EV charging infrastructure requirements and the resulting charging points required (distance is to the next available charging point). Charging points are discussed later in the paper. (CI – charging infrastructure)
Scenario Fleet composition Home parking On-street
CI
Charging points (x 103)
½ km 1 km
No. 1 2/3 BEV, 1/3 PHEV 100% No 26.5 13.3
No. 2 1/3 BEV, 2/3 PHEV 100% No 28.6 14.7
No. 3 2/3 BEV, 1/3 PHEV 73% No 43.2 24.7
No. 4 1/3 BEV, 2/3 PHEV 73% No 49.8 29.5
No. 5 2/3 BEV, 1/3 PHEV 73% Yes 136.3 94.6
No. 6 1/3 BEV, 2/3 PHEV 73% Yes 161.7 114.6
3.3. Analysis
Determining charging demand
In order to evaluate all the scenarios, we generate four hypothetical situations for each vehicle:
• EV-technology:
1) Vehicle is a BEV: It has to cover its entire 24-hour mileage purely using battery energy; if single
trip distances exceed the vehicle range, the vehicle stops for fast charging.
2) Vehicle is a PHEV: On average, PHEVs cover two-thirds of their mileage using battery energy; if
single trip distances exceed the vehicle range, the vehicle does not stop for fast charging.
• Availability of on-street charging infrastructure:
a) There is on-street charging infrastructure available on the street at home and work.
b) There is no on-street charging infrastructure available on the street at home and work.
Applying these charging rules to each vehicle for each of the four situations, our algorithm generates a detailed
individual charging profile composed of single charging events defined by location/trip purpose, parking
classification, charging speed, time of day, and duration. Having determined the charging demand for the 16,419
vehicles in the MiD dataset, we scale up the results for a fleet of one million EVs.
Determining charging infrastructure
In order to determine the supply of charging infrastructure, we combine geographic distances between charging
points and utilization rates. We assume that charging demand is limited to the settlement and transportation area in
Germany (13.5% of the total land area of Germany or 48,241 km2). We idealize this area overlaid with a grid street
system. Next, we assume that there is a charging point at each grid intersection. In this idealized situation, the
average distance to the next available charging point represents the quality of supply of charging. Superimposing the
demand and supply curves gives the number of charging points at the intersections (FIGURE 1). The intersection
represents EV infrastructure that is attractive for users (i.e., the utilization rate of charge points minimizes wait

Author name / Transportation Research Procedia 00 (2016) 000–000 5
times) and efficient (i.e., the utilization rate is not so low that points are underutilized).
3.4. Results and discussion
The resulting EV charging infrastructure demand and supply curves are shown in FIGURE 1.
FIGURE 1 Infrastructure demand curves (downward sloping) superimposed with supply curves (upward sloping). Twelve solutions (i.e., intersections) for charging points are found. (HP – home parking, percentage of vehicles that have a private parking spot at home; Curbside – whether or not vehicles can charge on-street outside residential and work locations; d – the average geographic distance between charging points). See TABLE 3 for the results of the six scenarios.
The number of charging points is determined by the intersection of the demand and supply curves. TABLE 1
summarizes the number of charging points for each scenario. There are three factors affecting the demand curves
(i.e., fleet composition, home parking, and on-street charging) and one factor affecting the supply curves (i.e.,
distance to next available charging point). While the exact number of charging points is of importance, the general
lessons from the scenario analysis provide decision-makers with critical insights.
First, providing on-street charging in residential areas and at work dramatically increases required charging
infrastructure. The reason for this is that cars park much longer than they need to be charged. This results in a
0,00
0,10
0,20
0,30
0,40
0,50
0,60
0,70
0 20.000 40.000 60.000 80.000 100.000 120.000 140.000 160.000 180.000 200.000
Util
izat
ion
rate
(occ
upie
d tim
e) o
f cha
rgin
g po
ints
Charging points (No.)
No. 1: 67%BEV-100%HP-noCurbside No. 2: 67%PHEV-100%HP-noCurbsideNo. 3: 67%BEV- 73%HP-noCurbside No. 4: 67%PHEV- 73%HP-noCurbsideNo. 5: 67%BEV- 73%HP-Curbside No. 6: 67%PHEV- 73%HP-Curbside
1.0 km to next free charging point 0.5 km to next free charging point
No. 1 No. 2
No. 4
No. 3
No. 5
No. 6
d = 1.0 km
d = 0.5 km

6 Soylu et al. / Transportation Research Procedia 00 (2016) 000–000
charging infrastructure that is blocked much longer than being used efficiently for charging. Second, a high
percentage of EVs with a private parking spot at home notably decreases the total number of charging stations. The
findings show that if only individuals with home parking purchase EVs, charging points decrease between 39 and
51% compared to scenarios with lower home parking availability.
Third, the results illustrate that a larger proportion of PHEVs in the total EV fleet slightly increases charging
infrastructure. This is due to the fact that the PHEVs are modeled to mainly use their electric engine, which have a
lower range than BEVs (i.e., PHEV range – 50 km, BEV range 150km). In addition, PHEVs charged faster than
BEVs but remain parked at the charging point, which results in an inefficient use of the infrastructure. Finally, the
influence of the supply side shows that decreasing the distance to the next available charging point markedly
increases the number of charging points.
4. Charging infrastructure – long-distance travel
The LD-travel patterns differ from daily travel. The short and repetitive characteristics of daily travel demand
require a different approach than the estimation of charging infrastructure for the less frequent LD-travel. For this
analysis, we considered only long-distance trips with a trip length of at least 150 km since we assume that BEVs can
cover shorter distances without additional charging.
4.1. Methodology
We combined three different methodological approaches for the estimation of EV charging infrastructure in LD-
travel:
1. Germany-wide macroscopic transport demand model: We use the VALIDATE model to determine the
Germany-wide car travel demand on an average workday on the street network (30). According to the
assignment results we obtain at least one route with all used nodes and links as geo-referenced points for
each assigned origin-destination (O-D) relation. The share of trips by EVs on these routes is also calculated
at this step. These routes and their traffic volumes are then imported into Geographical Information System
(GIS) software.
2. Modeling in GIS: We calculate the distances between each node on each route based on the list of routes
from the VALIDATE model. By doing so, it is possible to measure the distance between the starting node
and any other node on the route. This allows us to spatially locate each charging event on the freeway
depending on the various ranges of EVs. According to the assumptions of a) the battery range, b) the
charging state of the battery at the beginning of the LD-trip, and c) the amount of energy which can be
recharged in 30 minutes, for each O-D-relation we display every charging event as a point on the relevant
route. Afterwards all these charging events are cumulated along the routes. Thus, the total charging demand

Author name / Transportation Research Procedia 00 (2016) 000–000 7
along the routes (in kWh per day respective of number of charging events per day) is summed and mapped.
3. Spatial and temporal differentiation: The temporal distribution of the aggregated charging demand over 24
hours needs to be considered in order to convert the demand into the number of charging spots, since LD-
travel demand varies over the day. We define typical temporal demand profiles of LD car trips based on the
data of the German Mobility Panel (31). Our analyses indicate that the temporal demand profiles of LD
trips do not have the typical morning and afternoon peaks, but rather demand is nearly constant between
8:00 a.m. and 6:00 p.m. Subsequently, the temporal distribution of the total demand in terms of densities is
modeled using these temporal demand profiles. As a result, the number of charging spots required is
determined. Comfort aspects in terms of waiting times while charging are also considered. We develop an
analytical approach based on queuing theory assuming certain arrival and service rates to identify which
excess charging infrastructure is required to achieve certain comfort levels.
4.2. Data and assumptions
The travel demand model VALIDATE contains a Germany-wide attributed digital street network which is
comprised of around two million nodes, 120 million links, and 10,200 traffic zones. The model is calibrated with the
data of around 70,000 traffic counters. The assignment results in eight million O-D-relations and supplies all
necessary information to nodes and links in the form of georeferenced points (around 250 million) with attributes
such as “from node,” “to node,” and “traffic volume.”
We assume that the usage of EVs in long-distance travel could be similar to conventional cars, if there is sufficient
public charging infrastructure. However, primary survey data on car usage over longer periods for representative car
fleets do not exist. Therefore, a model based representation of a conventional car fleet for each day of year is used.
CUMILE (Car Usage Model Integrating Long Distance Events) (32) models usage patterns (in particular mileages)
of a representative car fleet over a full year. The CUMILE model thus provides an essential basis for assigning EVs
of different configurations (i.e., PHEV, BEV) in accordance with the interpersonal differing mobility requirements
of the owner, and supplies information on the usage intensity and frequency of vehicles in LD-travel.
For the determination of the charging needs in LD-travel, assumptions on fleet composition and share described in
section 3.2 are used. In addition, further assumptions regarding the charging time and range are:
• All vehicles have a 100% SOC (state-of-charge) before the journey starts.
• PHEVs drive first in an electric mode, then drive in conventional mode, and charge only when they refuel
anyway (assuming after 400 km).
• BEVs recharge first when their SOC is below 20%.

8 Soylu et al. / Transportation Research Procedia 00 (2016) 000–000
• Only fast charging (i.e., 50 kW, 30-minute charging time and up to 80% SOC) occur. This means that
vehicles reach only 60% of a theoretical range after their first charging event (i.e., a BEV with 150 km
range will have only 90 km range after the first charge).
• A charging event just before the destination (ca. 20 km) does not take place. It is assumed that the driver
will drive straight to their actual destination.
4.3. Analysis
Determining charging demand
The above methodology consists of three different components. First, the usage patterns of conventional cars in the
LD-travel are modeled. This forms the basis for the use of EVs. According to trip length distribution of conventional
cars only 1.2% of all trips are more than 150 km. For 1 million EVs, the total number of journeys with EVs is
expected to be approximately 2.7 million for one day. Assuming a share of 1.2% of all trips are more than 150 km,
around 30,000 EVs would have daily trips greater than 150 km. These rare long-distance events are of considerable
importance for the development of a demand-oriented charging infrastructure.
Next, using the CUMILE model, trip length distribution for EVs depending on the first scenario (1/3 BEV, 2/3
PHEV) are calculated. According to this distribution, on an average day about 1% of the BEVs would be travelling
between 150 and 200 kilometers. The resulting share of EVs per trip length classes thus constitutes input parameters
for the calculation of the charging demand in the network model.
As mentioned, the core of the demand calculation is comprised of a Germany-wide traffic demand model and further
processed in GIS. The first step of the analysis in this part is the assignment of demand on road infrastructure. After
the assignment process approximately eight million relations have been created. Each relation has information on
the actually used routes, which consist of a huge number of nodes and edges. By means of a link based listing of
relations, the replication of each individual route at the node level is possible.
Subsequently, the entire listing of routes as nodes and their relevant information (e.g., coordinates of nodes, loads on
the links, and length of each route) is exported to GIS. In this step, every single relation and their route selection are
reproduced in form of points. The distances between two nodes along a route are then added cumulatively in GIS.
Thus it is possible to locate any distance from the origin zone as certain points on the map. This node-following
model forms the basis of the calculation procedure of charging demand. First, by means of trip length distributions
and share of EVs, the number of relevant trips from each origin zone is calculated. For example, it is known from
the trip length distribution in CUMILE model that on an average day 1% of the BEVs travel is between 150 and 200
km. It can be concluded that for each O-D relationship with a distance between 150 and 200 km, 0.0075% of the
total demand would be traveled by BEVs (since 1 million EVs corresponds to 2.2% of the entire fleet and BEVs

Author name / Transportation Research Procedia 00 (2016) 000–000 9
makes up 1/3 of the EV fleet). Afterwards the percentage of EV trips for each OD-relation is calculated as described
above.
Next, the number of charging events for individual O-D-relations is determined. As an example we can analyze an
O-D-relation of 250 km. Since we assume that charging events of an BEV (range assumption: 150 km) will take
place first when the SOC is around 20%, the distance traveled until the first charging event is around 120 km. The
second charging event would be around 90 km after first event (the amount recharged between first and second
event is just 60% of actual battery capacity). Our BEV has a total of 210 km traveled with one charging event. Since
the distance to the destination is more than 20 km, a second charging process must take place. Consequently, the
number of all necessary charging events for each O-D-relation is calculated and each event is mapped on the
network. Finally, the number of charging events and share of electric trips are multiplied. For each link on the route
the total charging demand is calculated and summed. Furthermore, the links on highways are separated into equal
parts of 50 km or 100 km. Thus, charging demand is displayed as densities on highways (charging point per 100
km). The mapping of densities allows for detecting different types of highway corridors.
Determining charging infrastructure demand Traffic volume is not evenly distributed on a network, but there are significant and typical temporal patterns. The
loads on weekdays, on weekends, in the morning, midday, and evening hours vary. This temporal variation in
demand creates a heavy burden on the transport network. Moreover, these temporal variations play a crucial role by
determining the demand for charging infrastructure. The number of required charging points is governed by the
daily maximum of traffic volume, so that there are no bottlenecks in the quality of service. Thus, the quality of
service has a decisive influence on the acceptance of the public charging infrastructure. In order to represent the
temporal variability, generalized traffic load curves are used.
10 Soylu et al. / Transportation Research Procedia 00 (2016) 000–000
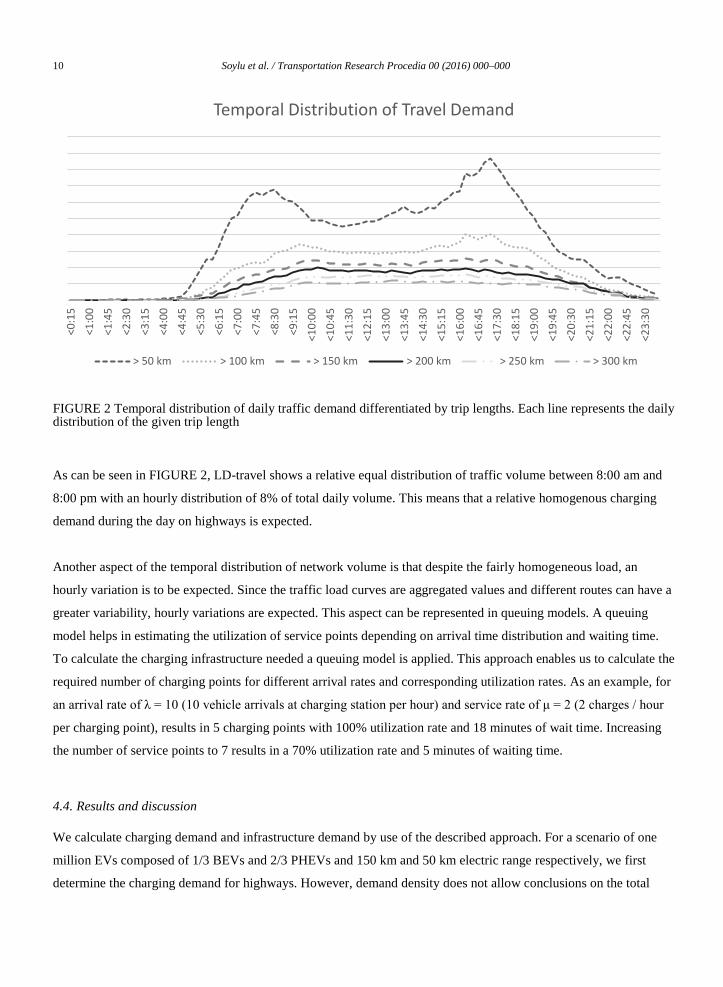
FIGURE 2 Temporal distribution of daily traffic demand differentiated by trip lengths. Each line represents the daily distribution of the given trip length
As can be seen in FIGURE 2, LD-travel shows a relative equal distribution of traffic volume between 8:00 am and
8:00 pm with an hourly distribution of 8% of total daily volume. This means that a relative homogenous charging
demand during the day on highways is expected.
Another aspect of the temporal distribution of network volume is that despite the fairly homogeneous load, an
hourly variation is to be expected. Since the traffic load curves are aggregated values and different routes can have a
greater variability, hourly variations are expected. This aspect can be represented in queuing models. A queuing
model helps in estimating the utilization of service points depending on arrival time distribution and waiting time.
To calculate the charging infrastructure needed a queuing model is applied. This approach enables us to calculate the
required number of charging points for different arrival rates and corresponding utilization rates. As an example, for
an arrival rate of λ = 10 (10 vehicle arrivals at charging station per hour) and service rate of μ = 2 (2 charges / hour
per charging point), results in 5 charging points with 100% utilization rate and 18 minutes of wait time. Increasing
the number of service points to 7 results in a 70% utilization rate and 5 minutes of waiting time.
4.4. Results and discussion
We calculate charging demand and infrastructure demand by use of the described approach. For a scenario of one
million EVs composed of 1/3 BEVs and 2/3 PHEVs and 150 km and 50 km electric range respectively, we first
determine the charging demand for highways. However, demand density does not allow conclusions on the total
<0:1
5<1
:00
<1:4
5<2
:30
<3:1
5<4
:00
<4:4
5<5
:30
<6:1
5<7
:00
<7:4
5<8
:30
<9:1
5<1
0:00
<10:
45<1
1:30
<12:
15<1
3:00
<13:
45<1
4:30
<15:
15<1
6:00
<16:
45<1
7:30
<18:
15<1
9:00
<19:
45<2
0:30
<21:
15<2
2:00
<22:
45<2
3:30
Temporal Distribution of Travel Demand
> 50 km > 100 km > 150 km > 200 km > 250 km > 300 km

Author name / Transportation Research Procedia 00 (2016) 000–000 11
number of charging points. Therefore, the demand for infrastructure is calculated using the demand densities by
means of temporal distributions (i.e., using load curves and queuing model). Considering the optimal capacity
utilization of the charging stations and an acceptable waiting time (less than 5 minutes) the demand for charging
infrastructure on German freeways yields the total number of 1,150 charging points. However, these are the results
of just one scenario. Analysis with different range and fleet composition, waiting times, and utilization rates provide
varying results. See FIGURE 3 for the results.
FIGURE 3 Number of charging points for LD-travel with waiting times less than five minutes. Different colors represent number of charging points needed on that section of highway. Highway sections are around 50 km on average. (Bundesfernstraßen – highways, μ = 2 (2 charges / hour per charging point).

12 Soylu et al. / Transportation Research Procedia 00 (2016) 000–000
Variations in the model parameters should be considered in future research. To date the modelling is based on the
workday traffic demand data. Here the parameters such as holiday and weekend demand should also be taken into
account. Currently it is assumed that EVs have the same usage patterns as conventional cars. However, a model
based estimation of probabilities that certain trip lengths would be carried out by BEVs or PHEVs is necessary. A
detailed spatial analysis is also necessary in order to differentiate and test for certain highway sections and for the
options of clustering or homogeneous distribution of charging points.
5. Results
For one million EVs in Germany by 2020 we recommend between 14,700 and 29,500 charging points for daily
travel and 1,150 charging points for LD-travel. For daily travel, the results show that infrastructure requirements are
most influenced by on-street charging followed by home parking, and finally fleet composition. As on-street
charging in residential areas dramatically increases the total infrastructure, we recommend a system without on-
street charging in residential neighborhoods or at work. We also anticipate PHEVs to dominate the fleet composition
in 2020 due to consumer demand. Thus, we recommend planning for Scenario No. 2 or No. 4. Finally, we think that
a charging supply with an average distance of 1 km to the next available charging point is satisfactory. This results
in 14,700 to 29,500 charging points for Germany in 2020.
Based on the analysis of LD-travel, the share of PHEVs would not change the demand dramatically on the highways
because of the realistic assumption that most of the LD-travel would be done in combustion mode and a charging
event would occur when the vehicle already refuels. BEVs, on the other hand, especially the ones with higher ranges
and higher probabilities to be used in LD-travels, will drastically affect the demand structure.
6. Conclusion
In this paper we develop a demand-oriented approach to determine charging infrastructure for EVs examining both
daily and long-distance travel. The methodology is based on the assumption that mass commercialization of EVs
results in users maintaining their current travel behavior. Utilizing commonly available travel data, the methodology
allows for the calculation of infrastructure demand.
For daily travel, we present four key findings from the German case study. First, offering on-street charging in
residential areas and at work dramatically increases required charging infrastructure. Second, increasing the
percentage of EVs with a private parking spot at home notably decreases the total number of charging stations.
Third, PHEVs slightly increase charging infrastructure. Fourth, demand for charging infrastructure does not increase
linearly with charging demand.

Author name / Transportation Research Procedia 00 (2016) 000–000 13
For LD-travel, both the model-driven approach with VALIDATE and the analytical approach using the car usage
model CUMILE supply similar results at an aggregated level. Our main finding is that the comfort assumptions (i.e.,
waiting times) and fleet composition (i.e., share of BEVs) are crucial to infrastructure demand. The relation between
the number of charging points, waiting time, and spatial distribution of charging points (i.e., allocating points in
clusters in one point or distributing them along highway in equal distances) were analyzed in detail. However, first
insights from the preliminary analysis illustrate a strong effect of spatial form on the number of stations.
Future work in the area of charging infrastructure should expand upon user preferences and infrastructure
attractiveness. In particular, integrating pricing is a critical topic, which should be explored. Finally, the integration
of EVs into the overall electricity network is crucial to achieve system wide energy savings and meet environmental
objectives, and should be studied further.
Acknowledgements
The research was funded by a grant from the German Federal Ministry for Economic Affairs and Energy under the
project LADEN2020: Concept to build up a demand-oriented charging infrastructure in Germany between today and
2020 (Grant number: 01MX15001). The authors thank the Institute of Vehicle Concepts (German Aerospace
Center) for their analysis of EV fleets used in the research. The authors also thank the anonymous reviewers for their
insightful comments on the first draft of the paper.
Literature
1. Hacker, F., R. Harthan, F. Matthes, and W. Zimmer. Environmental impacts and impact on the electricity market of a large scale introduction of electric cars in Europe - Critical Review of Literature. ETC/ACC Technical Paper, No. 4, 2009.
2. Carley, S., R. M. Krause, B. W. Lane, and J. D. Graham. Intent to purchase a plug-in electric vehicle: A survey of early impressions in large US cites. Transportation Research Part D: Transport and Environment, Vol. 18, 2013, pp. 39-45. DOI: http://dx.doi.org/10.1016/j.trd.2012.09.007.
3. Gong, H., M. Wang, and H. Wang. New energy vehicles in China: policies, demonstration, and progress. Mitigation and Adaptation Strategies for Global Change, Vol. 18, No. 2, 2013, pp. 207-228. DOI: 10.1007/s11027-012-9358-6.
4. Yabe, K., Y. Shinoda, T. Seki, H. Tanaka, and A. Akisawa. Market penetration speed and effects on CO2 reduction of electric vehicles and plug-in hybrid electric vehicles in Japan. Energy Policy, Vol. 45, 2012, pp. 529-540. DOI: 10.1016/j.enpol.2012.02.068.
5. BMUB. Aktionsprogramm Klimaschutz 2020. Kabinettsbeschluss vom 3. Dezember 2014. Bundesministerium für Umwelt, Naturschutz, Bau und Reaktorsicherheit (BMUB), Berlin, Germany, 2014. http://www.bmub.bund.de/service/publikationen/downloads/details/artikel/aktionsprogramm-klimaschutz-2020/. Accessed July 14, 2016.
6. IEA. Global EV Outlook: Understanding the Electric Vehicle Landscape to 2020. International Energy Agency (IEA), Paris, France, 2013. http://www.iea.org/publications/freepublications/publication/global-ev-outlook.html. Accessed July 14, 2016.
7. Die Bundesregierung. Nationaler Entwicklungsplan Elektromobilität der Bundesregierung. The Federal

14 Soylu et al. / Transportation Research Procedia 00 (2016) 000–000
Government of Germany (Die Bundesregierung), Berlin, Germany, 2009. http://www.bmub.bund.de/themen/luft-laerm-verkehr/verkehr/luft-verkehr-download/artikel/nationaler-entwicklungsplan-elektromobilitaet-der-bundesregierung/ Accessed July 14, 2016.
8. KBA. Bestandsbarometer: Personenkraftwagen am 1. Januar 2015 nach ausgewählten Merkmalen (Teil 1). Kraftfahrt-Bundesamt (KBA), Flensburg, Germany, 2015. http://www.kba.de/DE/Statistik/Fahrzeuge/Bestand/Ueberblick/2015_b_bestandsbarometer_teil1_absolut.html?nn=1343806. Accessed July 14, 2016.
9. KBA. Neuzulassungsbarometer: Personenkraftwagen im Juni 2015 nach ausgewählten Kraftstoffarten. Kraftfahrt-Bundesamt (KBA), Flensburg, Germany, 2015. http://www.kba.de/DE/Statistik/Fahrzeuge/Neuzulassungen/MonatlicheNeuzulassungen/monatl_neuzulassungen_node.html. Accessed July 14, 2016.
10. Kley, F., C. Lerch, and D. Dallinger. New business models for electric cars - A holistic approach. Energy Policy, Vol. 39, No. 6, 2011, pp. 3392-3403. DOI: 10.1016/j.enpol.2011.03.036.
11. European Parliament, and Council of the European Union. Directive 2014/94/EU of the European Parliament and of the Council of 22 October 2014 on the deployment of alternative fuels infrastructure (Text with EEA relevance). Document 32014L0094, 2014.
12. Dong, J., C. Liu, and Z. Lin. Charging infrastructure planning for promoting battery electric vehicles: An activity-based approach using multiday travel data. Transportation Research Part C: Emerging Technologies, Vol. 38, 2014, pp. 44-55. DOI: http://dx.doi.org/10.1016/j.trc.2013.11.001.
13. Nationale Plattform Elektromobilität (NPE). Fortschrittsbericht 2014 - Bilanz der Marktvorbereitung. Gemeinsame Geschäftsstelle Elektromobilität der Bundesregierung (GGEMO), Berlin, Germany, 2014. http://nationale-plattform-elektromobilitaet.de/die-npe/publikationen/. Accessed July 14, 2016.
14. Funke, S. Á., T. Gnann, and P. Plötz. Addressing the Different Needs for Charging Infrastructure: An Analysis of Some Criteria for Charging Infrastructure Set-up. In E-Mobility in Europe, Springer International Publishing, 2015, pp. 73-90.
15. Wang, Y.-W., and C.-R. Wang. Locating passenger vehicle refueling stations. Transportation Research Part E: Logistics and Transportation Review, Vol. 46, No. 5, 2010, pp. 791-801. DOI: http://dx.doi.org/10.1016/j.tre.2009.12.001.
16. Wang, Y.-W., and C.-C. Lin. Locating multiple types of recharging stations for battery-powered electric vehicle transport. Transportation Research Part E: Logistics and Transportation Review, Vol. 58, 2013, pp. 76-87. DOI: 10.1016/j.tre.2013.07.003.
17. Sathaye, N., and S. Kelley. An approach for the optimal planning of electric vehicle infrastructure for highway corridors. Transportation Research Part E: Logistics and Transportation Review, Vol. 59, 2013, pp. 15-33. DOI: 10.1016/j.tre.2013.08.003.
18. He, F., D. Wu, Y. Yin, and Y. Guan. Optimal deployment of public charging stations for plug-in hybrid electric vehicles. Transportation Research Part B: Methodological, Vol. 47, 2013, pp. 87-101. DOI: 10.1016/j.trb.2012.09.007.
19. Krems, J. F., L. Bartholdt, P. Cocron, B. Dielmann, T. Franke, M. Henning, M. Ischebeck, K. Schleinitz, and M. Žilytė-Lennertz. MINI E powered by Vattenfall V2.0. Schlussbericht zum Forschungsvorhaben Verbundprojekt: MINI E powerd by Vattenfall V2.0 (Abschlussbericht, Förderkennzeichen 16EM0070). Technische Universität Chemnitz, Chemnitz, Germany, 2011. https://www.tu-chemnitz.de/hsw/psychologie/professuren/allpsy1/E-Mobility/mini2.php. Accessed July 14, 2016.
20. Smart, J., W. Powell, and S. Schey. Extended Range Electric Vehicle Driving and Charging Behavior Observed Early in the EV Project. SAE Technical Paper 2013-01-1441, 2013, 2013. DOI: 10.4271/2013-01-1441.
21. Turrentine, T., D. Garas, A. Lentz, and J. Woodjack. The UC Davis MINI E Consumer Study. Institute of Transportation Studies, University of California, Davis, California, USA, 2011. http://www.its.ucdavis.edu/research/publications/publication-detail/?pub_id=1470. Accessed July 28, 2015.
22. Pasaoglu, G., A. Zubaryeva, D. Fiorello, and C. Thiel. Analysis of European mobility surveys and their potential to support studies on the impact of electric vehicles on energy and infrastructure needs in Europe. Technological forecasting & social change: an international journal, Vol. 87, No. 9, 2014, pp. 41-50. DOI:

Author name / Transportation Research Procedia 00 (2016) 000–000 15
10.1016/j.techfore.2013.09.002. 23. Prof. Dr. Wermuth Verkehrsforschung und Infrastrukturplanung (WVI), Institut für Verkehr und Technik
(IVT), Deutsches Zentrum für Luft- und Raumfahrt (DLR), and Kraftfahrt-Bundesamt (KBA). Kraftfahrzeugverkehr in Deutschland 2010 – Basisdatensatz. Survey on the commission of the Bundesministerium für Verkehr, Bau und Stadtentwicklung (BMVBS). Data referenced by http://www.clearingstelle-verkehr.de, 2012.
24. Institut für angewandte Sozialwissenschaft (infas), and Deutsches Zentrum für Luft- und Raumfahrt (DLR). Mobilität in Deutschland 2008 – Basisdatensatz. Survey on the commission of the Bundesministerium für Verkehr, Bau und Stadtentwicklung (BMVBS). Data referenced by http://www.clearingstelle-verkehr.de, 2010.
25. KBA. Methodische Erläuterungen zu Statistiken über Fahrzeugzulassungen (Stand: Januar 2015). Kraftfahrt-Bundesamt (KBA), Flensburg, Germany, 2015. http://www.kba.de/DE/Statistik/MethodischeErlaeuterungen/methodische_erlaeuterungen_node.html. Accessed July 14, 2016.
26. Kuhnimhof, T., R. Collet, J. Armoogum, and J.-L. Madre. Generating Internationally Comparable Figures on Long-Distance Travel for Europe Transportation research record: journal of the transportation research board, No. 2105, 2009, pp. 18-27. DOI: 10.3141/2105-03.
27. Nationale Plattform Elektromobilität (NPE). Zwischenbericht der Arbeitsgruppe 3 - Lade-Infrastruktur und Netzintegration. Gemeinsame Geschäftsstelle Elektromobilität der Bundesregierung (GGEMO), Berlin, Germany, 2010. http://www.bmwi.de/DE/Mediathek/publikationen,did=370860.html. Accessed July 14, 2016.
28. Frenzel, I., J. Jarass, S. Trommer, and B. Lenz. Erstnutzer von Elektrofahrzeugen in Deutschland: Nutzerprofile, Anschaffung, Fahrzeugnutzung. Deutsches Zentrum für Luft- und Raumfahrt e. V. (DLR), 2015, p. 69.
29. Lim, S., Kuby, M. Heuristic algorithms for siting alternative-fuel stations using the flow-refueling location model. European Journal of Operational Research, 204 (1), 51-61, 2010.
30. Vortisch, P., and V. Waßmuth. VALIDATE - A Nationwide Dynamic Travel Demand Model for Germany. In Proceedings of the 11th National Transportation Planning Application Conference of the Transport Research Board, Daytona Beach, Florida, USA, 2007.
31. Streit, T., B. Chlond, C. Weiss, and P. Vortisch. Deutsches Mobilitätspanel (MOP) -Wissenschaftliche Begleitung und Auswertungen Bericht 2013/2014: Alltagsmobilität und Fahrleistung, 2015.
32. Chlond, B.; Weiss, C.; Heilig, M.; Vortisch, P. Hybrid Modeling Approach of Car Uses in Germany on Basis of Empirical Data with Different Granularities Transportation Research Record: Journal of the Transportation Research Board, No. 2412, 2014, pp. 67 – 74.