"Tomorrow, and tomorrow, and tomorrow": the players on the curation stage

TOROMONT INDUSTRIES LTD.
2020 ANNUAL REPORT
BUILDINGTOMORROW

Toromont Industries Ltd. employs more than 6,000 empowered people across seven business units and more than 150 locations in a common cause: to create value through the provision of specialized brand-name equipment and lifecycle product support. We are united as one Toromont by the business model, corporate values and core strategies that fuel our performance.
Toromont Cat Toromont is one of the largest Caterpillar dealers in the world with 46 branches across seven provinces and one territory. Through Toromont Cat, we serve the specialized heavy equipment, power generation, heavy rent and product support needs of thousands of public infrastructure, construction, demolition, paving, mining, aggregate, waste management, agriculture, forestry, trucking, shipping, transit and data centre customers.
AgWest Ltd. From six facilities, AgWest serves the year-round equipment and product support needs of Manitoba’s agriculture industry as an official dealer of AGCO and CLAAS, two trusted brands for crop and livestock applications.
Battlefield Equipment Rentals – The Cat Rental StoreFrom 68 stores in our Cat dealer territories, supported by a rapid equipment delivery-to-site system, Battlefield Equipment Rentals addresses the full rental service, purchase and product support needs of contractors, specialty trades and do-it-yourself customers with brand-name machines, tools and supplies.
SITECH Mid-Canada Ltd.SITECH specializes in providing machine control, site positioning and asset management technologies as well as professional support services as a Trimble and Cat AccuGrade® dealer across Eastern Canada.
Jobsite Industrial Rental Services Across eight locations, Jobsite Industrial Rental Services meets the specialized tool crib rental equipment needs of contractors working in refinery industries, healthcare, automotive, steel and pulp and paper.
CIMCO RefrigerationCIMCO serves the North American food, dairy, cold storage, beverage, pharmaceutical, automotive, chemical, petrochemical, mining and recreational ice rink markets as a leading supplier of refrigeration equipment and product support services.
Toromont Material Handling From 16 locations across eastern Canada, Toromont Material Handling serves ports and terminals, paper producers, automotive parts manufacturers, beverage companies, hardware retailers and government agencies by selling, renting and supporting brand name lift trucks, container handlers, industrial batteries, chargers and racking systems.
Multiple Growth Platforms

Annual Report 2020 1
The world changed in 2020, and Toromont rose to meet the challenges. To protect our employees and customers from COVID-19 and address the essential requirements of the customers and communities we serve, we implemented rigorous measures to keep our stores, branches and warehouses operating safely. We also applied technology in new ways to respond to opportunity, more deeply entrench our financial disciplines and increase competitiveness. These changes served us well in 2020, and in some cases, will support better ways of doing business in the years to come.
Toromont earned $3.09 per diluted share in 2020
as we worked hard to address customer needs and
responded to volatile market conditions without
sacrificing service.
We also succeeded in remaining a safe and essential
contributor to our customers’ successes in the
markets we serve, completed high-priority business
improvement and integration tasks and maintained
a strong financial position. Leverage, as represented
by our net debt to total capitalization ratio was 3% at
year end, compared to 15% at December 2019, and
40% at December 2017, the year we made the largest
acquisition in our history.
Toromont ended 2020 with substantial liquidity
provided by a $500 million revolving credit facility and
a $250 million one-year syndicated facility arranged
in April 2020 as a precautionary measure. These
facilities were undrawn at December 31, 2020.
While revenue of $3.5 billion was down 5% from
the record achieved in 2019, the advantages of
market diversification and coverage, along with the
steadying business model effects of selling, renting
and supporting leading brands, served us well in a
challenging environment. Re-investment amounted
to $133 million for rental fleets, branches and plants.
This was lower than our three-year annual average
of $208 million as we scaled rental inventory
investment to demand signals.
We measure the efficiency and effectiveness
of our use of capital through return on opening
shareholders’ equity (“ROE”) and pre-tax return on
capital employed (“ROCE”). In 2020, ROE was 16.6%,
compared to our long-term goal of 18% after-tax over
a business cycle. ROCE was 20.4% at December 31,
2020 compared to 22.9% at year-end 2019.
FELLOW SHAREHOLDERS:
Robert M. Ogilvie
Chair of the Board
Scott J. Medhurst
President and Chief Executive Officer

2 Toromont Industries Ltd.
In February 2020, the Board announced a 14.8% year-
over-year increase in Toromont’s dividend per common
share on the strength of cash generation. Since 1968,
Toromont has paid a dividend uninterrupted and has
consistently grown the dividend annually for 31 years.
Teamwork at Its Finest
Each year, Toromont’s success is the result of the
commitment, teamwork and tenacity of our employees.
In 2020, the pandemic required even more, in the form
of quick thinking and the courage to break habits formed
over years in favour of physically distant ways of working.
Team sacrifices were made at every level and in many
ways. Many employees shared hours – a move that
protected jobs and Toromont’s ability to respond to
future opportunity. Technicians along with store, parts
and remanufacturing personnel served as front-line
responders, enabling Toromont to perform as an
essential business for customers. Additional shifts
in many locations provided the means for physical
distancing. In the months following March, those who
could work from home did so, and as 2020 ended, many
employees continued to balance work and family
obligations without the usual separation between the
two. The Board of Directors, executives and senior
leaders voluntarily reduced their compensation. Many
specific safety measures and new protocols were
introduced under the guidance of our Critical Incident
Executive Response Team.
Over the past few years, our mantra has been Building
Together. As Toromont demonstrated in 2020, together
is not defined in a physical sense but in the cohesion and
collaboration that come from a shared sense of purpose.
Integration Progress
In late 2017, Toromont began a multi-year effort to
integrate the Caterpillar territories of Québec and the
Maritimes (“QM”) we acquired. This effort focused
on elevating the performance of new and existing
operations by sharing best practices and leveraging
the talents of the combined organization. In 2018, the
first stages were completed. Toromont brands were
introduced across QM, key management appointments
were made, Toromont’s branch model was embedded
in Atlantic Canada and we invested to bring our
full-service rental model to QM. In 2019, technology
integration brought all Battlefield Equipment Rentals
stores on the same management system and the
Toromont Cat branch model was activated in Québec.
The key integration event of 2020 was the
implementation of the Toromont Dealer Management
System (“TDMS”) at Toromont Cat in QM, as well as the
Québec operations of Toromont Material Handling.
For our decentralized organization, TDMS has long
been an indispensable tool for reporting, monitoring
and benchmarking branch performance against
system-wide key performance indicators. It also allows
for greater working capital visibility and teamwork.
While branch staff in new territories received training
in our business approach since acquisition, TDMS
creates the visibility they need to entrench Toromont’s
customer service and financial disciplines. It is an
enabler of alignment, authority and accountability
Return on opening shareholders’ equity
16.6%
2020 Revenues
New & used equipment – 42%
Refrigeration equipment – 5%
Rentals – 10%
Product support – 43%
Annual Report 2020 3
and forms part of the backbone of customer-facing
digital services and business analytics.
Operating with a unified technology platform cleared
a path for two operational changes at Toromont Cat
on January 1, 2021: the consolidation of our working
practices for construction and mining businesses each
under dedicated leadership. These changes eliminated
the last regional silo that impeded full Eastern Canada
alignment and represent the next step in achieving
business excellence through tight integration.
Much more work is needed to unlock the full value
of our larger scale, but 2020’s performance
demonstrated that we can execute and leverage our
strengths through technology.
2020 Business Unit Highlights
Toromont Cat’s customers remained active in 2020.
Although construction machine monitoring showed
hours worked fell in the spring due to COVID-19
restrictions, some lost ground was recovered by late
summer. Similarly, over 20 mines moved to care and
maintenance rather than production at the outset of the
pandemic. To conserve cash in response to uncertain
economic conditions, many customers opted to buy
used equipment instead of new machines and reduced
their use of Toromont’s heavy rental fleet. We responded
by increasing our used equipment supply and moving
to match rental inventory with demand. Late in the
year, some large construction accounts returned to the
market to augment their fleets with new equipment
purchases and most mines returned to production. The
52/48 revenue split in our mining business between
precious metals and base metals/other resulting from
the addition of QM territories improved our risk profile.
Power Systems was a steady performer, completing
several noteworthy projects and experiencing relatively
healthy demand for customers, particularly data
centres. The deployment of Power Systems proprietary
IMACS+ project management software in QM enabled
efficient project sharing using common methodologies.
Dealership product support revenue was down from
2019. This reflected a cautious customer tone with
decisions to defer maintenance and certified rebuilds,
partly offset by Customer Value Agreements (“CVAs”)
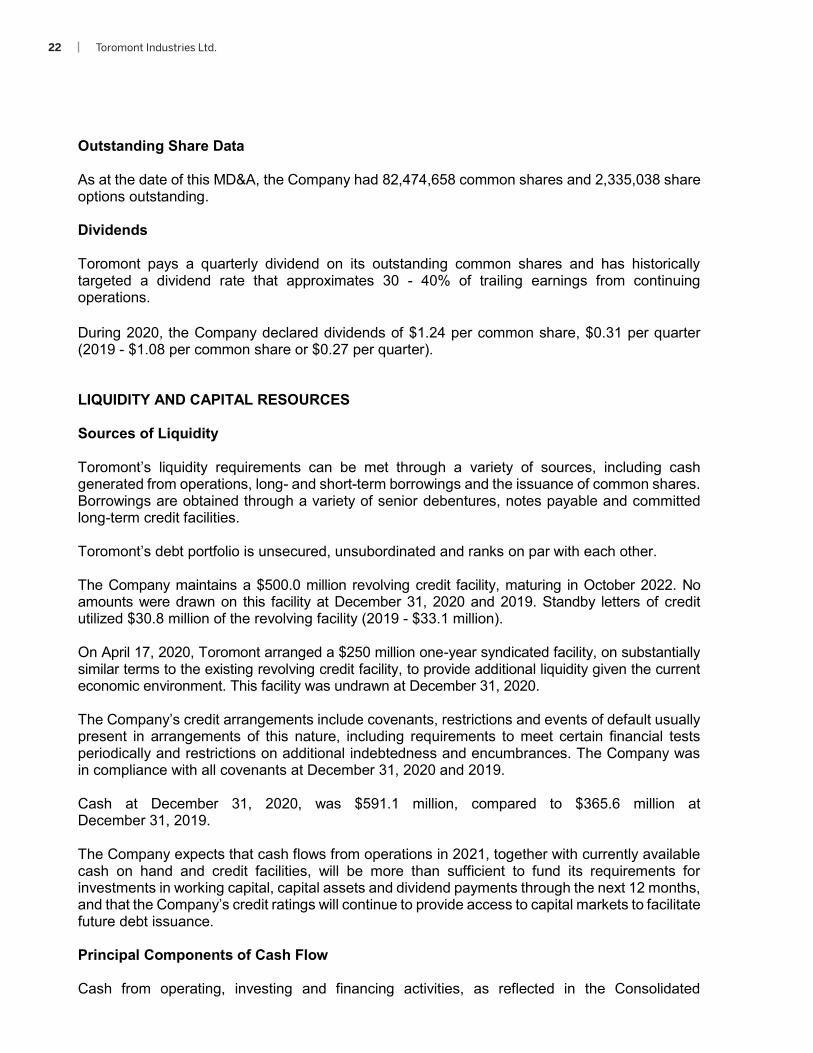
and relative strength in remanufacturing. Consistent
with Caterpillar’s objective to offer clients additional
value-added services and capitalize on aftermarket
opportunities, we improved the attach rate of CVAs on
new machine sales. Pre-scheduled mining fleet rebuilds
and the expansion of Toromont Cat’s component
exchange program in Québec were important
contributors to the year’s results.
Battlefield Equipment Rentals made good use of its
broad Eastern Canada footprint, augmented by a new
store in Terrebonne, Québec, diverse product offering
and digitally enabled marketing and sales capabilities to
serve customers in 2020. These advantages, and sales of
Cat CCE machines to landscapers partially mitigated the
Province of Québec’s decision to shutter construction
sites for eight weeks at the beginning of the pandemic.
After installing its fleet management and reporting
system in QM in 2019, much attention was focused
on improving the efficiency of service and delivery
processes and maximizing returns per dollar invested in
the regional fleet. Rental equipment coming back from
job sites was returned to ready status faster than it was
in the prior year as a result of better service disciplines
and as technicians grew familiar with maintaining the
expanded fleet. This meant better product availability
for customers. The ongoing maturation of the inventory
aging and product disposition cycle should contribute to
improved performance over time.
Toromont Material Handling (“TMH”) continued
where it left off in 2019 by embedding new business
and financial disciplines with the help of TDMS. Another
key highlight was the expansion of TMH’s customer
base through new product offerings including Kalmar
container handlers in Manitoba and Saskatchewan,
Landoll and Bendi forklifts in Ontario and AUSA rough
terrain forklifts throughout Eastern Canada. Broadening
its range of products fits with TMH’s goal as a single-
source supplier. TMH also brought greater focus to
its rental business by clearing inventory of unpopular
machines and replacing them with high-demand
equipment. Growth in its workforce of mechanics,
centralized quoting, and a new telephony system for
its parts business were among efforts made to improve
product support and market coverage. Due to its

4 Toromont Industries Ltd.
alignment with Caterpillar, Jungheinrich and Rocla, TMH
is well equipped to meet demand for electric propulsion
and autonomous lift vehicles. For environmental reasons,
more customers are turning to these equipment styles
and TMH’s related product support capabilities.
Jobsite Industrial Rental Services counted a joint
win with Battlefield Equipment Rentals in securing a
five-year labour, tooling and equipment agreement with
a lubricants manufacturer and the opening of a new
location in Vars, Ontario to serve customers in the Ottawa
region and Québec, among its 2020 achievements.
SITECH had a solid year on the strength of customer
demand for its productivity and efficiency-enhancing
machine control software, hardware and technology
expertise. Silver Top Supply, acquired in 2019, introduced
new cloud-based technology to help waste disposal
customers capture weights and measures for faster
invoicing and more precise environmental management.
AgWest made good progress in representing new
combine machines. Specialization in the sales force
brought greater focus to AGCO and CLAAS products.
Reflecting the importance of product support to customer
and business performance, more emphasis was placed
on proactive machine inspections that led to maintenance
work and parts sales. To more quickly respond to
customer orders and more efficiently use internal
resources, all parts counters were connected to a central
phone system. Improved results over 2019 reflected good
execution by the team and a better harvest.
CIMCO performed essential services for many industrial
customers in 2020, including those in the food, beverage,
energy and pharmaceutical markets. Fortunately, project
backlog entering the pandemic was sizeable, which
created a good base of business for a challenging year.
Notable project wins included the first cold storage
facility in Canada to use 100% CO2 refrigeration – 700
tonnes of it supplied by six rooftop refrigeration packages
– and the design/build of a central refrigeration system
that supplies three cooling temperatures as well as heat
recovery for a large poultry plant. For CIMCO’s engineers,
the poultry plant requires extensive and complex 3D
modelling, while CIMCO’s automation group is creating
control, data logging and alarm systems. Scheduled
completion is June 2022. CIMCO’s prefabricating
capabilities served as a safety control and cost advantage
by reducing time on site at customer locations.
Recreational markets struggled due to COVID-19 safety
restrictions. However, CIMCO booked nine CO2 U.S. ice
rink projects, including one in California. Product support
revenue was effectively flat compared to 2019 as growth
in industrial markets, driven by the presence of additional
service technicians particularly in the United States,
offset lower activity levels in recreational markets.
Sustainability at Toromont
Toromont operates with a long-term sustainability
mindset. Our focus areas include workplace safety,
workforce development and environmental management.
In each area, our Board of Directors ensures we set
realistic goals, create effective strategies, measure
performance and account for our results.
Our Environmental, Social and Governance framework
along with our principles and priorities are described
beginning on page 6, while our 2020 activities are
profiled in the Sustainability Report on our website. To
highlight a few developments:
• The core measure of safety performance – Total
Recordable Injury Frequency Rate – has declined
9% over the past five years with the help of 110,000
hours of safety training and continued vigilance
Toromont Connect, an android-compatible application
available free with every new Cat machine, was introduced
in 2020 pre-COVID-19. Toromont feeds the application with
machine information such as service hours and physical
location and uses it to proactively advise customers of
upcoming preventative maintenance events.

Annual Report 2020 5
• Efforts to foster a culture of diversity and inclusion
continued with 22% of all senior leadership roles
held by women
• Toromont remanufacturing operations rebuilt
three million tonnes of used equipment parts
and components in 2020 as part of our circular
economy effort
• For 2020, emissions from Scope 1, Scope 2 and
limited Scope 3 – those that include business air
travel and upstream fossil fuel and electricity use –
were 75,454 CO2 equivalent tonnes
• Customers using CIMCO’s ECO CHILL® have
cumulatively offset approximately one million CO2-
equivalent tonnes by our estimate compared to
traditional refrigeration and saved 19.7 billion cubic
feet of natural gas since we introduced this product
some 15 years ago
We actively participate in the introduction of electric
battery and dual-fuel powered equipment in our
territories. As a dealer, we are well aligned with OEMs
including Caterpillar that are innovating to create
alternatives to the internal combustion engine and
developing ever-lower emission machines.
Governance
On February 10, 2021, we welcomed a new independent
director, Ben Cherniavsky. Mr. Cherniavsky brings
deep capital markets, infrastructure, construction and
transportation sector expertise to our deliberations.
During his 25-year career, he served as a senior
investment analyst at a global investment bank, at
Canada’s Department of Finance and at the University
of Toronto’s International Centre for Tax Studies at the
Rotman School of Management. With this addition, our
Board of Directors will consist of 11 members, of whom
ten are independent.
Looking Ahead
At the time of writing, COVID-19 remains a health threat
and Toromont remains an essential service provider.
Accordingly, we continue to marshal the company’s
considerable resources to protect what is important to
us as we pursue growth and improvement.
While safely adapting to and navigating the current
health crisis, some workarounds have led to efficiency
and effectiveness gains, particularly in how we
communicate and interact with customers and each
other. We will take what we learn and leverage it for
future advantage. As always, people development,
cost and working capital management will remain
critical priorities.
Building Tomorrow
While Toromont changed in many ways in 2020
and unlocked new benefits from the integration of
operations in our new territories that began in 2017,
our values and strategies did not. This steady approach
provides predictability and certainty in an uncertain
world. It enables employees to act with confidence
in addressing new challenges and always with the
knowledge of what is expected of them as customer
service providers and shareholder value creators. It
allows us to work together in Building Tomorrow for the
benefit of all stakeholders.
Our Thanks
Times like these test the business IQ of every company.
Toromont is led by dedicated and experienced people
at all levels. We sincerely thank the members of our
Board of Directors for continuing to oversee the
strategic direction, offer independent perspectives, and
act in the best interests of the company as a whole in
performing their duties.
Special thanks to our customers and shareholders for
their loyalty. We reserve our utmost gratitude to our valued
employees who delivered our products and services in
this unprecedented and challenging environment. We look
forward to working with our partners to emerge stronger
so we can build a better tomorrow.
Yours sincerely,
Robert M. Ogilvie Scott J. Medhurst
Chair of the Board President and Chief
Executive Officer

6 Toromont Industries Ltd.
BUILDING TOMORROW, SUSTAINABLYToromont’s business model, governance principles and leadership practices foster an empowered, collaborative and ethical culture that seeks to deliver returns to all stakeholders: customers, employees, shareowners, business partners and the communities where we work. Our Environmental, Social and Governance (ESG) approach starts with our Board of Directors and accountability for sustainable business practices is shared company wide. In 2020, we sharpened our focus on priority areas with the formation of an ESG Committee of the Board and in early 2021, updated our Code of Conduct. This is how Corporate Governance works at Toromont.
Toromont’s Management Information Circular and Code of Conduct are online at www.toromont.com.
Board of Directors
• Oversees risk, strategic
planning, compliance
with Code of Conduct and
regulatory obligations
• Provides dedicated
Environmental, Social and
Governance oversight through
the ESG Committee
• Requires management to set
objectives, ensure strategies/
programs are in place to
achieve objectives
• Scrutinizes results
• Assesses Board and Director
effectiveness annually
• Monitors changes in
governance best practices for
continuous improvement
Executive Team
• Establishes corporate
strategy and objectives for
customer, financial, safety,
workforce development and
environmental performance
• Provides leadership to
embed corporate Values
across all operations,
preserve business model
and manage risk
• Empowers decentralized
business units, ensures
focus and alignment,
scrutinizes results
• Fosters relationships with
shareholders, debtholders,
key business partners
Business Units
• Sets objectives aligned to
corporate strategic priorities,
implements, executes to
achieve objectives
• Allocates resources to
achieve priorities and
performance objectives
• Creates and delivers
workplace safety, workforce
development, environmental
management programs
• Grows customer
and business partner
relationships
ESG Framework

Annual Report 2020 7
ESG Principles and Priorities
Toromont understands that good governance is fundamental to the long-term success of the organization. We also recognize that good governance is not just about structure; it is about principled, invested people moving with purpose to create a sustainable future and standing accountable for results in our key areas of focus. We account for our 2020 performance in detail in our Sustainability Report available at www.toromont.com.
Workplace Safety
Safety is paramount at Toromont. Our objective is
to achieve and sustain a zero-harm workplace built
on a strong safety culture. Our Board of Directors
regularly reviews our safety strategies and programs for
effectiveness and improvement and scrutinizes reports
on safety outcomes. Our primary reporting measure is
Total Recordable Injury Rate (“TRIR”). Our Executive
Team and business unit leaders are responsible for
the design and administration of an extensive safety
program tailored to the risks inherent in the jobs we
perform and the equipment we use. This program
is refreshed annually, enlists internal and external
subject-matter experts and receives significant funding.
Everyone at Toromont at every level is accountable for
compliance with the safe operating practices embodied
in our Five Cardinal Safety Rules. To further demonstrate
the importance of safety as a way of life, the variable
compensation of our senior leaders is tied to safety
outcomes measured by TRIR.
Workforce Development
Employee empowerment is a core Toromont value
that has contributed significantly to our success. To
empower employees, we operate with comprehensive
human resources strategies and practices that allow
us to attract and retain the industry’s best people and
ensure the sustainability and competitiveness of our
workforce. The Human Resources and Health and Safety
Committee of the Board is responsible for succession
planning, executive officer appointments, leadership
development and the design of short- and long-term
incentive plans that align management behaviours
to sustainable value creation. Our Executive Team
provides guidance and support to our business units
to ensure that workforce development and succession
programs are in place and functioning with programs
that focus on business needs and the improvement of
employee knowledge, skills, productivity, effectiveness
and wellbeing.
Diversity and Inclusion
Toromont acknowledges the benefits of a diverse
and respectful workforce in our Code of Conduct,
Employment Equity Policy and our Board and Leadership
Diversity Policy. We consider diversity and inclusion in
promotions at all levels and when hiring new members
Toromont Cat’s Tom Agueci, Parts Counterperson (left)
and Jeremy Heslop, Parts Counterperson prepare a package
of consumables at Kirkland Lake Gold’s Detour Lake Mine.

8 Toromont Industries Ltd.
of our team. Our Board, its ESG Committee and senior
management regularly review the outcomes of our
diversity strategies and look for new opportunities
to foster a culture of inclusion that respects the
features that make individuals unique: gender, gender
identity, sexual orientation, race, ethnicity, age, cultural
background, physical and mental ability and religion.
Environmental Management and Stewardship
We are committed to addressing the environmental
impacts of our activities and to conserving resources
on the understanding that there is a direct connection
between economic and environmental sustainability.
Our environmental impact is measured annually –
including carbon emissions, energy and water usage
– and our strategic and annual business plans include
goals for continuous improvement. A dedicated
Toromont Cat environmental team is responsible for
workforce education and training and performing
compliance and audit functions under the auspices
of a formal Environmental Management Program.
Green procurement, waste reduction, landfill diversion
and conservation actions reduce our environmental
footprint. We contribute to the circular economy by
remanufacturing used equipment and components
to as-new condition, and through software upgrades
and engine updates, make modifications that reduce
emissions in rebuilt machines, including underground
mining machines. We innovate and educate in
collaboration with our customers and business partners
to produce and implement solutions that reduce
greenhouse gas emissions and build a more efficient,
sustainable future. This includes equipment, products,
solutions and service in the field of alternative energy
(battery electric, wind, solar, landfill gas, heat recapture)
and natural refrigerants.
Community Engagement and Impact
We believe Toromont has a role to play in the health and
wellbeing of the communities where we live and work.
In line with our Values and focus on social responsibility,
Toromont encourages community volunteerism through
our employee Day of Caring Policy. Our corporate giving
program is dedicated to United Way because it reaches
all communities connected to our business and provides
opportunities for employees to work together for the
biggest societal impact.
Hilda Antwi-Nsiah (Engineer, CIMCO), Sunitha Michael
(Recruiter, Toromont Cat), and Kamel (McMaster University
student) take a break from a pre-pandemic National
Society for Black Engineers networking event to smile
for the camera.
Toromont’s Sustainability Report is online at www.toromont.com.

10K report starts
MANAGEMENT’S DISCUSSION & ANALYSIS

10 Toromont Industries Ltd.
1
Management’s Discussion and Analysis This Management’s Discussion and Analysis (“MD&A”) comments on the operations, performance and financial condition of Toromont Industries Ltd. (“Toromont” or the “Company”) as at and for the year ended December 31, 2020, compared to the preceding year. This MD&A should be read in conjunction with the audited consolidated financial statements and related notes for the year ended December 31, 2020. The consolidated financial statements reported herein have been prepared in accordance with International Financial Reporting Standards (“IFRS”) and are reported in Canadian dollars. The information in this MD&A is current to February 10, 2021. Advisory Information in this MD&A that is not a historical fact is "forward-looking information". Words such as "plans", "intends", "outlook", "expects", "anticipates", "estimates", "believes", "likely", "should", "could", "will", "may" and similar expressions are intended to identify statements containing forward-looking information. Forward-looking information in this MD&A reflects current estimates, beliefs, and assumptions, which are based on Toromont’s perception of historical trends, current conditions and expected future developments, as well as other factors management believes are appropriate in the circumstances. Toromont’s estimates, beliefs and assumptions are inherently subject to significant business, economic, competitive and other uncertainties and contingencies regarding future events and as such, are subject to change. Toromont can give no assurance that such estimates, beliefs and assumptions will prove to be correct. This MD&A also contains forward-looking statements about the recently acquired businesses. Numerous risks and uncertainties could cause the actual results to differ materially from the estimates, beliefs and assumptions expressed or implied in the forward-looking statements, including, but not limited to: business cycles, including general economic conditions in the countries and regions in which Toromont operates; commodity price changes, including changes in the price of precious and base metals; potential risks and uncertainties relating to the novel COVID-19 global pandemic, including an economic downturn, reduction or disruption in supply or demand for our products and services, or adverse impacts on our workforce, capital resources, or share trading price or liquidity, and increased regulation of or restrictions placed on our businesses; changes in foreign exchange rates, including the Cdn$/US$ exchange rate; the termination of distribution or original equipment manufacturer agreements; equipment product acceptance and availability of supply; increased competition; credit of third parties; additional costs associated with warranties and maintenance contracts; changes in interest rates; the availability of financing; potential environmental liabilities of the acquired businesses and changes to environmental regulation; failure to attract and retain key employees; damage to the reputation of Caterpillar, product quality and product safety risks which could expose Toromont to product liability claims and negative publicity; new, or changes to current, federal and provincial laws, rules and regulations including changes in infrastructure spending; any requirement of Toromont to make contributions to the registered funded defined benefit pension plans, postemployment benefits plan or the multi-employer pension plan obligations in which it participates and acquired in excess of those currently contemplated; and ability to secure insurance coverage and cost of premiums. Readers are cautioned that the foregoing list of factors is not exhaustive. Any of the above mentioned risks and uncertainties could cause or contribute to actual results that are materially different from those expressed or implied in the forward-looking information and statements included in this MD&A. For a further description of certain risks and uncertainties

Annual Report 2020 11
2
and other factors that could cause or contribute to actual results that are materially different, see the risks and uncertainties set out in the "Risks and Risk Management" and "Outlook" sections herein. Other factors, risks and uncertainties not presently known to Toromont or that Toromont currently believes are not material could also cause actual results or events to differ materially from those expressed or implied by statements containing forward-looking information. Readers are cautioned not to place undue reliance on statements containing forward-looking information, which reflect Toromont’s expectations only as of the date of this MD&A, and not to use such information for anything other than their intended purpose. Toromont disclaims any obligation to update or revise any forward-looking information, whether as a result of new information, future events or otherwise, except as required by law. CORPORATE PROFILE AND BUSINESS SEGMENTATION As at December 31, 2020, Toromont employed over 6,000 people in more than 150 locations across Canada and the United States. Toromont is listed on the Toronto Stock Exchange under the symbol TIH. Toromont has two reportable operating segments: the Equipment Group and CIMCO. The Equipment Group includes Toromont CAT, one of the world’s larger Caterpillar dealerships, Battlefield – The CAT Rental Store, an industry-leading rental operation, SITECH, providing Trimble technology products and services, Toromont Material Handling, representing MCFA, Kalmar and other manufacturers’’ products, and AgWest, an agricultural equipment and solutions dealer representing AGCO, CLAAS and other manufacturers’ products. The Company is the exclusive Caterpillar dealer for a contiguous geographical territory in Canada that covers Manitoba, Ontario, Quebec, Newfoundland, New Brunswick, Nova Scotia, Prince Edward Island and most of Nunavut. Additionally, the Company is the MaK engine dealer for the Eastern Seaboard of the United States, from Maine to Virginia. Performance in the Equipment Group is driven by activity in several industries: road building and other infrastructure-related activities; mining; residential and commercial construction; power generation; aggregates; waste management; steel; forestry; and agriculture. Significant activities include the sale, rental and service of mobile equipment for Caterpillar and other manufacturers; sale, rental and service of engines used in a variety of applications including industrial, commercial, marine, on-highway trucks and power generation; and sale of complementary and related products, parts and service. CIMCO is a market leader in the design, engineering, fabrication, installation and after-sale support of refrigeration systems in industrial and recreational markets. Results of CIMCO are influenced by conditions in the primary market segments served: beverage and food processing; cold storage; food distribution; mining; and recreational ice rinks. CIMCO offers systems designed to optimize energy usage through proprietary products such as ECO CHILL®. CIMCO has manufacturing facilities in Canada and the United States and sells its products and services globally. PRIMARY OBJECTIVE AND MAJOR STRATEGIES The primary objective of the Company is to build shareholder value through sustainable and profitable growth, supported by a strong financial foundation. To guide its activities in pursuit of this objective, Toromont works toward specific, long-term financial goals (see section heading

12 Toromont Industries Ltd.
3
“Key Performance Measures” in this MD&A) and each of its operating groups consistently employs the following broad strategies: Expand Markets Toromont serves diverse markets that offer significant long-term potential for profitable expansion. Each operating group strives to achieve or maintain leading positions in markets served. Incremental revenues are derived from improved coverage, market share gains and geographic expansion. Expansion of the installed base of equipment provides the foundation for product support growth and leverages the fixed costs associated with the Company’s infrastructure. Strengthen Product Support Toromont’s parts and service business is a significant contributor to overall profitability and serves to stabilize results through economic downturns. Product support activities also represent opportunities to develop closer relationships with customers and differentiate the Company’s product and service offering. The ability to consistently meet or exceed customers’ expectations for service efficiency and quality is critical, as after-market support is an integral part of the customer’s decision-making process when purchasing equipment. Broaden Product Offerings Toromont delivers specialized capital equipment to a diverse range of customers and industries. Collectively, hundreds of thousands of different parts are offered through the Company’s distribution channels. The Company expands its customer base through selectively extending product lines and capabilities. In support of this strategy, Toromont represents product lines that are considered leading and generally best-in-class from suppliers and business partners who continually expand and develop their offerings. Strong relationships with suppliers and business partners are critical in achieving growth objectives. Invest in Resources The combined knowledge and experience of Toromont’s people is a key competitive advantage. Growth is dependent on attracting, retaining and developing employees with values that are consistent with Toromont’s. A highly principled culture, share ownership and profitability-based incentive programs result in a close alignment of employee and shareholder interests. By investing in employee training and development, the capabilities and productivity of employees continually improve to better serve shareholders, customers and business partners. Toromont’s information technology represents another competitive differentiator in the marketplace. The Company’s selective investments in technology, inclusive of e-commerce initiatives, strengthen customer service capabilities, generate new opportunities for growth, drive efficiency and increase returns to shareholders. Maintain a Strong Financial Position A strong, well-capitalized balance sheet creates stability and financial flexibility, and has contributed to the Company’s long-term track record of profitable growth. It is also fundamental to the Company’s future success.

Annual Report 2020 13
4
CONSOLIDATED ANNUAL OPERATING RESULTS
The Company demonstrated resilience and ability to adapt to an ever-changing environment and execute in a very challenging market. Results reflect reduced economic activity stemming from reaction to the COVID-19 pandemic. While there was gradual recovery from the earlier part of the year, with certain restrictions easing, customer activity was still cautious and below last year’s levels. Cost containment initiatives have served to lessen the impact of the lower revenues while being supportive of the workforce during the transitional time. The Equipment Group’s core dealership business experienced lower results in most market segments across most regions, due to the lower market demands, although fourth quarter results showed some sequential improvement. CIMCO generated strong bookings, but this was not converted to revenue growth due to customer construction schedules, delayed in part by site restrictions. Net earnings decreased 11% versus a year ago on a 5% decrease in revenues. Revenues decreased $199.8 million or 5% for the year with a decline of 5% in the Equipment Group and 7% at CIMCO. Product support across the enterprise was down 4% with a decrease of 5% in the Equipment Group and 3% in CIMCO. Market demand for product support is correlated to equipment activity levels in the field. Gross profit margin decreased 60 basis points (“bps”) to 24.0% versus last year. The Equipment Group reported lower margins mainly on lower rental fleet utilization. Margins at CIMCO were higher on good project execution. Both Groups benefitted from a favorable sales mix of higher product support revenues to total revenues. Selling and administrative expenses were $30.3 million (6%) lower for the year compared to the prior year. Compensation costs decreased $17.5 million including senior leadership and Board wage reductions, governmental work-share and subsidy programs, temporary lay-offs, and
($ thousands, except per share amounts) 2020 2019 $ change % changeREVENUES 3,478,897$ 3,678,705$ (199,808) (5%)Cost of goods sold 2,643,151 2,772,583 (129,432) (5%)Gross profit (1) 835,746 906,122 (70,376) (8%)Selling and administrative expenses 463,312 493,627 (30,315) (6%)OPERATING INCOME (1) 372,434 412,495 (40,061) (10%)Interest expense 29,981 27,707 2,274 8% Interest and investment income (9,083) (9,752) 669 (7%)Income before income taxes 351,536 394,540 (43,004) (11%)Income taxes 96,621 107,740 (11,119) (10%)
NET EARNINGS 254,915 286,800 (31,885) (11%)
BASIC EARNINGS PER SHARE 3.10$ 3.52$ (0.42)$ (12%)
KEY RATIOS:Gross profit margin (1) 24.0% 24.6%Selling and administrative expenses as a % of revenues 13.3% 13.4%Operating income margin (1) 10.7% 11.2%Income taxes as a % of income before income taxes 27.5% 27.3%Return on capital employed (1) 20.4% 22.9%Return on equity (1) 16.6% 21.4%(1) Described in the sections titled "Additional GAAP Measures and Non-GAAP Measures".

14 Toromont Industries Ltd.
5
reduced profit sharing accruals on the lower earnings. Mark-to-market adjustments on Deferred Share Units (“DSUs”) increased expenses $1.3 million year over year. Sales related and other travel and training expenses were $17.6 million lower in light of lower market activity and travel restrictions, while information technology expenses were $3.1 million higher as systems integration work and other enhancements continued. The Government of Canada introduced the Canada Emergency Wage Subsidy (“CEWS”) in April 2020 to facilitate the economic recovery. The program provides a subsidy subject to certain criteria, including demonstration of revenue declines. The qualification and application of the CEWS is assessed in application periods as defined by the program. The Company qualified for a $12.8 million subsidy for 2020, recognized as a reduction of selling and administrative expenses. These funds have supported our workforce since the pandemic took hold by helping to offset lower productivity levels and maintaining higher employment. Operating income decreased $40.1 million or 10% reflecting the lower revenues and lower overall gross margins. Operating income margin decreased 50 basis points (“bps”) to 10.7%. Interest expense increased $2.3 million on costs related to the new credit facility and associated drawings earlier this year. Interest income decreased $0.7 million on lower interest income earned on conversion of equipment on rent with a purchase option (“RPO”). The effective income tax rate for 2020 was 27.5% compared to 27.3% in 2019. Net earnings in 2020 of $254.9 million were down $31.9 million or 11% from 2019. Basic earnings per share (“EPS”) decreased $0.42 or 12% to $3.10 mainly reflecting the lower revenues. Other comprehensive loss of $12.3 million in 2020 (2019 – comprehensive loss of $24.9 million) arose on actuarial losses on defined benefit pension and other post-employment benefit plans of $11.2 million (2019 – actuarial loss of $18.6 million). The actuarial loss reflects a lower weighted-average discount rate (2.6% at December 31, 2020 versus 3.1% at December 31, 2019) as well as changes in the fair value of pension plan assets, both of which are reflective of underlying financial markets. Other comprehensive loss also included an unfavorable net change in the fair value of cash flow hedges of $0.7 million (2019 - $5.8 million). These changes reflect mark to market differences in the value of foreign exchange derivative contracts designated as cash flow hedges and are largely a function of the underlying USD/CAD exchange rates at period end compared to contract date. BUSINESS SEGMENT ANNUAL OPERATING RESULTS The accounting policies of the segments are the same as those of the consolidated entity. Management evaluates overall business segment performance based on revenue growth, operating income relative to revenues and return on capital employed. Corporate expenses are allocated based on each segment’s revenue. Interest expense and interest and investment income are not allocated.

Annual Report 2020 15
6
Equipment Group
The Equipment Group’s results for 2020, reflect the significant downturn in economic activity as a result of the response to the pandemic, despite the classification as an essential service. Although there was some gradual recovery from the second quarter as restrictions eased, activity was lower than the prior year. Cost containment actions were employed, including human resource initiatives, reduced travel and discretionary spending. Total equipment sales (new and used) decreased $54.8 million or 4%. Sales in construction markets increased $8.5 million or 1%. In Ontario, activity levels continued to improve, while deliveries into Atlantic Canada and Quebec were lower on certain project activity due to pandemic shut downs and disruptions to project schedules. All other market segments were down across most regions for the year compared to prior year. Power systems sales (down $14.8 million or 8%); mining (down $41.8 million or 26%); material handling (down $3.1 million or 6%) and agriculture (down $3.6 million or 5%). Used equipment benefitted from used machine sourcing and a cautious market environment. Rental revenues decreased $60.6 million or 14% versus last year. All markets and most segments were lower reflecting the reduction in market activity. Rental revenues from equipment on rent with a purchase option (“RPO”) were down 37% reflecting the lower market demand and cautious tone. At December 31, 2020, the RPO fleet was $35.1 million versus $47.3 million a year ago. Product support revenues decreased $62.9 million or 5%, with a decrease in both parts (-4%) and service (-6%) across most markets and regions. Product support activity in construction markets increased 1% on continued operation of equipment in the field. Mining product support was 9% lower, reflecting temporary mine site restrictions and lower activity levels earlier in the year. Agricultural markets reported increases in both parts and services, up 15% and 11% respectively, reflective of stronger market activity as well as weaker comparative results in 2019.
($ thousands) 2020 2019 $ change % changeEquipment sales and rentals New 1,088,031$ 1,195,646$ (107,615)$ (9%) Used 381,346 328,539 52,807 16% Rentals 358,266 418,818 (60,552) (14%)Total equipment sales and rentals 1,827,643 1,943,003 (115,360) (6%)Product support 1,327,478 1,390,340 (62,862) (5%)Power generation 10,978 10,607 371 3% Total revenues 3,166,099$ 3,343,950$ (177,851)$ (5%)Operating income 345,953$ 384,077$ (38,124)$ (10%)
Capital expenditures (net)Rental 51,060$ 153,390$ (102,330)$ (67%)Other 17,631$ 54,130$ (36,499) (67%)
Total 68,691$ 207,520$ (138,829)$ (67%)
KEY RATIOS:Product support revenues as a % of total revenues 41.9% 41.6%Operating income margin 10.9% 11.5%Group total revenues as a % of consolidated revenues 91.0% 90.9%Return on capital employed 19.2% 19.0%

16 Toromont Industries Ltd.
7
Power generation revenues were comparable to 2019. Gross profit margin decreased 70 bps, to 24.0% versus last year of 24.7%. Equipment margins were down 30 bps mainly due to sales mix, with a higher proportion of smaller equipment models. Rental margins were down 10 bps reflecting the lower fleet utilization offset by selective reductions in the fleet. Product support margins were down 30 bps, a result of a higher portion of parts to service volumes. The overall sales mix of product support revenues to total revenues had a favourable impact of 10 bps. Selling and administrative expenses decreased $28.7 million or 6%. Governmental subsidies under the CEWS program reduced expenses by $11.4 million. Compensation costs also decreased on other human resource initiatives such as vacation scheduling, selected salary reductions, use of work-share programs and lay-offs and reduced profit sharing accruals on the lower earnings. Travel and training was restricted through much of the year, resulting in additional cost savings of $9.0 million. Allowance for doubtful accounts increased $1.1 million in consideration of potential increased collection risk in the current economic environment. Information technology related costs increased $3.1 million on system integration efforts and other enhancements. Expenses in 2020 included a $4.1 million gain on the sale of a property while 2019 included a $5.0 million gain on a pension plan curtailment. Operating income was down $38.1 million or 10% and was 60 bps lower as a percentage of revenues (10.9% versus 11.5% last year) reflecting the lower gross margins. Capital expenditures, net of dispositions, decreased $138.8 million, largely due to the strategic decision to reduce the level of new investments in the light equipment rental fleet portfolio across Eastern Canada as a result of the current market conditions, as well as in recognition of the time required to absorb recent investments to full utilization. Net rental fleet additions decreased $102.3 million to $51.1 million while other capital expenditures decreased $36.5 million. During the first quarter of 2020, a property previously identified as available for sale was disposed of for $9.4 million, resulting in a capital gain of $4.1 million ($3.5 million after-tax). Bookings and Backlogs
Bookings increased $101.8 million or 7%. Higher orders resulted across all market segments: construction orders (+5%); mining (+21%), power systems (+3%), material handling lift trucks (+1%) and agriculture orders (+26%). Backlogs increased $100.7 million or 37% to $373.0 million. At December 31, 2020, the total backlog related to power systems (29%), construction (38%), mining (17%), agriculture (10%) and lift trucks (6%), most of which is expected to be delivered in 2021. Bookings and backlogs can vary significantly from period to period on large project activities, especially in mining and power systems, the timing of orders and deliveries and the availability of equipment from either inventory or suppliers.
($ millions) 2020 2019 $ change % changeBookings - year ended December 31 1,570.0$ 1,468.2$ 101.8$ 7% Backlogs - as at December 31 373.0$ 272.3$ 100.7$ 37%

Annual Report 2020 17
8
CIMCO
CIMCO’s results for 2020 were lower than the prior year on reduced construction and recreational activity stemming in part from site restrictions and closures related to the pandemic. Customer specific construction schedules also affect timing of revenue recognition. Product support activity continued given the essential nature of the business, albeit at lower levels. The translation of financial results at the US operations did not have a significant impact on results year over year. Packages sales were down $16.8 million or 9% versus 2019. In Canada, package revenues were down $17.8 million or 12%, reflecting lower sales into both the industrial (down $6.3 million or 6%) and recreational market segment (down $11.5 million or 22%). In the US, package revenues increased $1 million or 4% as higher sales into recreational markets (up $3.2 million or 18%) were partially offset by lower industrial revenues (down $2.3 million or 26%). Product support revenues decreased $5.1 million or 3% versus last year on weaker sales in Canada (down 5%) on lower economic activity resulting mainly from COVID-19 related restrictions, partially offset by higher sales in the US (up 3%). The strong installed base continues to provide a growth platform for product support activity. Gross profit margin improved 50 basis points. Package margins increased on improved project execution and a favourable sales mix of higher product support revenues to total revenues. Selling and administrative expenses decreased $1.5 million or 3% versus last year. Governmental subsidies under the CEWS program reduced expenses by $1.4 million. Higher compensation costs related to increased headcount to support the substantial backlog of orders, were offset by cost reductions in other areas related to reduced activity. Operating income was down by $2.0 million or 7% in 2020 largely reflecting the lower revenues. Operating income as percentage of revenues was unchanged at 8.5% in both years. Capital expenditures, net of dispositions, were up $12.4 million or 531% to $14.7 million, the majority of the expenditure in 2020 related to the acquisition of land for CIMCO’s new head office facility in Canada ($10.3 million). Other expenditures related to additional service vehicles ($2.4 million), information technology enhancements and upgrades ($0.8 million), and machinery and equipment ($0.3 million).
($ thousands) 2020 2019 $ change % changePackage sales 161,144$ 177,974$ (16,830)$ (9%)Product support 151,654 156,781 (5,127) (3%)Total revenues 312,798$ 334,755$ (21,957)$ (7%)Operating income 26,481$ 28,418$ (1,937)$ (7%)
Capital expenditures (net) 14,735$ 2,335$ 12,400$ 531%
KEY RATIOS:Product support revenues as a % of total revenues 48.5% 46.8%Operating income margin 8.5% 8.5%Group total revenues as a % of consolidated revenues 9.0% 9.1%Return on capital employed 78.0% 75.9%

18 Toromont Industries Ltd.
9
Bookings and Backlogs
Bookings of $228.3 million were up $34.7 million or 18%, with higher industrial orders (+54%) in both Canada (+51%) and the US (+95%), offsetting lower recreational orders (-30%) down in both Canada (-24%) and the US (-41%). Backlogs of $184.4 million were higher by $61.9 million or 51% versus last year. Industrial backlogs were 96% higher on good activity in both Canada (+99%) and the US (+69%), while recreational backlogs were 13% lower in both Canada (-14%) and the US (-11%). The backlog levels provide a good base entering 2021. Substantially all of the backlog is expected to be realized as revenue in 2021, however this is subject to construction schedules and potential changes stemming from the pandemic. CONSOLIDATED FINANCIAL CONDITION The Company’s strong financial position continued. At December 31, 2020, the ratio of net debt to total capitalization decreased to 3% versus 15% at December 31, 2019. Non-cash Working Capital The Company’s investment in non-cash working capital was $486.8 million at December 31, 2020. The major components, along with the changes from December 31, 2019, are identified in the following table.
Accounts receivable increased $16.5 million or 3% year over year. Trade accounts receivable and other receivables were down slightly on improved collections within both the Equipment Group and CIMCO. Days sales outstanding (“DSOs”) decreased 2 days to 41 days, on improvements in both the Equipment Group (down 2 days) and CIMCO (down 1 day). The increase in accounts receivable is mainly attributable to unbilled receivables where performance on projects and other long-term contracts has progressed further than contractual billing milestones.
($ millions) 2020 2019 $ change % changeBookings - year ended December 31 228.3$ 193.6$ 34.7$ 18% Backlogs - as at December 31 184.4$ 122.5$ 61.9$ 51%
($ thousands) 2020 2019 $ %Accounts receivable 541,580$ 525,052$ 16,528$ 3%Inventories 728,404 912,186 (183,782) (20%)Other current assets 10,897 12,063 (1,166) (10%)Accounts payable and accrued liabilities (558,443) (797,807) 239,364 (30%)Provisions (26,645) (23,680) (2,965) 13%Income taxes (payable) receivable, net (23,281) 9,275 (32,556) n/mDerivative financial instruments (11,043) (10,366) (677) 7%Dividends payable (25,560) (22,139) (3,421) 15%Deferred revenues and contract liabilities (149,109) (140,898) (8,211) 6%Total non-cash working capital 486,800$ 463,686$ 23,114$ 5%

Annual Report 2020 19
10
Inventories decreased $183.8 million or 20%, largely due to a decrease in the Equipment Group, partially offset by an increase in CIMCO:
Equipment Group inventories were down $197.1 million or 22%, with decreases in equipment (down $163.9 million or 29%), parts (down $22.1 million or 9%) and service work-in-process (down $11.1 million or 17%). Equipment inventory was intentionally reduced from the previous high and in light of market activity. Service work-in-process levels reflect lower activity levels generally and an enhanced focus on timely billing.
CIMCO inventories were up $13.3 million or 60%, predominantly driven by higher work-in-process and inventory held to support order backlog.
Other current assets mainly relates to prepaid expenses, which vary year-over-year on the timing of payments and the realization of expenses. Accounts payable and accrued liabilities decreased $239.4 million or 30% largely reflecting lower activity levels. The extended credit terms from suppliers are unwinding as expected, thus transitioning accounts payable to more normal levels. The DSU liability increased during the year versus prior year on the higher relative closing share price. Income taxes (payable) receivable reflects the difference between tax installments and current income tax expense. Derivative financial instruments represent the fair value of foreign exchange contracts. Fluctuations in the value of the Canadian dollar (weaker) have led to a cumulative net loss of $11.0 million as at December 31, 2020. This is not expected to affect net earnings as the unrealized losses will offset future gains on the related hedged items. Higher dividends payable year-over-year reflect the higher dividend rate. Effective with the April 2, 2020 payment, the quarterly dividend rate was increased 14.8% from $0.27 per share to $0.31 per share. Deferred revenues and contract liabilities represent billings to customers in excess of revenue recognized.
In the Equipment Group, these arise due to progress billings from the sale of power and energy systems; long-term product support maintenance contracts; sales of equipment with residual value guarantees; and, customer deposits for machinery to be delivered in the future. These balances were lower in 2020 generally on lower economic activity levels and timing of progress of work under long-term contracts.
At CIMCO, these arise on progress billings from the sale of refrigeration packages and were up $22.6 million or 95.8%, reflecting order backlog, and timing of billings compared to customer’s construction schedules.
Goodwill and Intangibles The Company performs impairment tests on its goodwill and intangibles with indefinite lives on an annual basis or as warranted by events or circumstances. The assessment entails estimating the fair value of operations to which the goodwill and intangibles relate using the fair value less cost to sell valuation method. This assessment affirmed goodwill and intangibles values as at December 31, 2020 as outlined in note 7 of the notes to the consolidated financial statements.

20 Toromont Industries Ltd.
11
Employee Share Ownership The Company employs a variety of stock-based compensation plans to align employees’ interests with corporate objectives. 1. An Executive Stock Option Plan for its senior employees. Stock options have a 10-year life,
vest 20% per year on each anniversary date of the grant and are exercisable at the designated common share price, which is fixed at prevailing market prices at the date the option is granted. At December 31, 2020, 2.3 million options to purchase common shares were outstanding, of which 0.9 million were exercisable.
2. An Employee Share Purchase Plan whereby employees can purchase shares by way of
payroll deductions. Under the terms of this plan, which is designed to incentivize long-term share ownership, eligible employees may purchase common shares of the Company in the open market at the then-current market price. The Company pays a portion of the purchase price, matching contributions at a rate of $1 for every $3 contributed, to a maximum of 2.5% of an employee’s base salary per annum. Company contributions prior to 2019 vested to the employee immediately, while contributions in 2019 onwards will vest in five years from date of contribution. Company contributions amounting to $2.9 million in 2020 (2019 – $2.7 million) were charged to selling and administrative expense when paid. Approximately 39% of employees participate in the plan (2019 – 33%), which is administered by an independent third party.
3. A deferred share unit (“DSU”) plan for executives, certain senior managers and non-employee
directors. Executives and senior managers may elect, on an annual basis, to receive all or a portion of their performance incentive bonus in DSUs. Non-employee directors receive approximately 55% of their annual compensation in the form of DSUs and may also elect to receive the balance of their annual compensation in DSUs. A DSU is a notional unit that reflects the market value of a single Toromont common share and generally vests immediately. DSUs may be redeemed only on cessation of employment or directorship. DSUs have dividend equivalent rights, which are expensed as earned. The Company records the cost of the DSU plan as compensation expense in selling and administrative expenses. As at December 31, 2020, 394,154 DSUs were outstanding with a total value of $35.6 million (2019 – 388,547 units at a value of $27.4 million). The liability for DSUs is included in accounts payable and accrued liabilities on the consolidated statements of financial position.
Employee Future Benefits The Company sponsors pension arrangements for substantially all of its employees. These include:
Defined contribution plans, which cover the largest segment of employees, including all newly hired employees;
Defined benefit plans, which are largely associated with acquired businesses; 401(k) matched savings plans for employees in the US; and Other post-employment benefit plans for certain grandfathered employees in the acquired
businesses. Certain unionized employees do not participate in Company-sponsored plans, and contributions are made to their retirement programs in accordance with the respective collective bargaining agreements.

Annual Report 2020 21
12
Defined Contribution Plans In the case of defined contribution plans, regular contributions are made to the individual employee accounts, which are administered by a plan trustee in accordance with the plan documents. At December 31, 2020, approximately 4,100 employees participated in Company-sponsored defined contribution plans. Defined Benefit Plans
The Company sponsors defined benefit pension plans, which provide pension and other post-retirement benefits for approximately 1,600 qualifying employees. All Plans are administered by a separate Fund that is legally separate from the Company, with the exception of the Executive Plan described below. The funded status of these plans changed by $23.7 million (an increase in the accrued pension liability) during 2020. The Executive Plan is a supplemental plan and is solely the obligation of the Company. All members of the plan are retired. The Company is not obligated to fund the plan but is obligated to pay benefits under the terms of the plan as they come due. The Company has posted letters of credit to secure the obligations under this plan, which were $15.6 million as at December 31, 2020. A key assumption in pension accounting is the discount rate. This rate is set with regard to the yield on high-quality corporate bonds of similar average duration to the cash flow liabilities of the Plans. Yields are volatile and can deviate significantly from period to period. Legal and Other Contingencies Due to the size, complexity and nature of the Company’s operations, various legal matters are pending. Exposure to these claims is mitigated through levels of insurance coverage considered appropriate by management and by active management of these matters. In the opinion of management, none of these matters will have a material effect on the Company’s consolidated financial position or results of operations. Normal Course Issuer Bid (“NCIB”) During the year the Company purchased and cancelled 67,800 common shares for $4.0 million (average cost of $59.62 per share, including transaction costs) under the NCIB program. No shares were purchased and cancelled in 2019. The Company’s NCIB program expired in August 2020 and was not renewed. Shareholder Rights Plan (“SRP”) A new amended and restated SRP will be presented to a vote of shareholders at our annual and special meeting on May 5, 2021. The proposed amended and restated SRP, if adopted, would expire at the earlier of the Termination Time (as defined in the proposed new plan) and the termination of the annual meeting of our shareholders in the year that is three years after the year in which such adoption occurs.
22 Toromont Industries Ltd.
13
Outstanding Share Data As at the date of this MD&A, the Company had 82,474,658 common shares and 2,335,038 share options outstanding. Dividends Toromont pays a quarterly dividend on its outstanding common shares and has historically targeted a dividend rate that approximates 30 - 40% of trailing earnings from continuing operations. During 2020, the Company declared dividends of $1.24 per common share, $0.31 per quarter (2019 - $1.08 per common share or $0.27 per quarter). LIQUIDITY AND CAPITAL RESOURCES Sources of Liquidity Toromont’s liquidity requirements can be met through a variety of sources, including cash generated from operations, long- and short-term borrowings and the issuance of common shares. Borrowings are obtained through a variety of senior debentures, notes payable and committed long-term credit facilities. Toromont’s debt portfolio is unsecured, unsubordinated and ranks on par with each other. The Company maintains a $500.0 million revolving credit facility, maturing in October 2022. No amounts were drawn on this facility at December 31, 2020 and 2019. Standby letters of credit utilized $30.8 million of the revolving facility (2019 - $33.1 million). On April 17, 2020, Toromont arranged a $250 million one-year syndicated facility, on substantially similar terms to the existing revolving credit facility, to provide additional liquidity given the current economic environment. This facility was undrawn at December 31, 2020. The Company’s credit arrangements include covenants, restrictions and events of default usually present in arrangements of this nature, including requirements to meet certain financial tests periodically and restrictions on additional indebtedness and encumbrances. The Company was in compliance with all covenants at December 31, 2020 and 2019. Cash at December 31, 2020, was $591.1 million, compared to $365.6 million at December 31, 2019. The Company expects that cash flows from operations in 2021, together with currently available cash on hand and credit facilities, will be more than sufficient to fund its requirements for investments in working capital, capital assets and dividend payments through the next 12 months, and that the Company’s credit ratings will continue to provide access to capital markets to facilitate future debt issuance. Principal Components of Cash Flow Cash from operating, investing and financing activities, as reflected in the Consolidated
Annual Report 2020 23
14
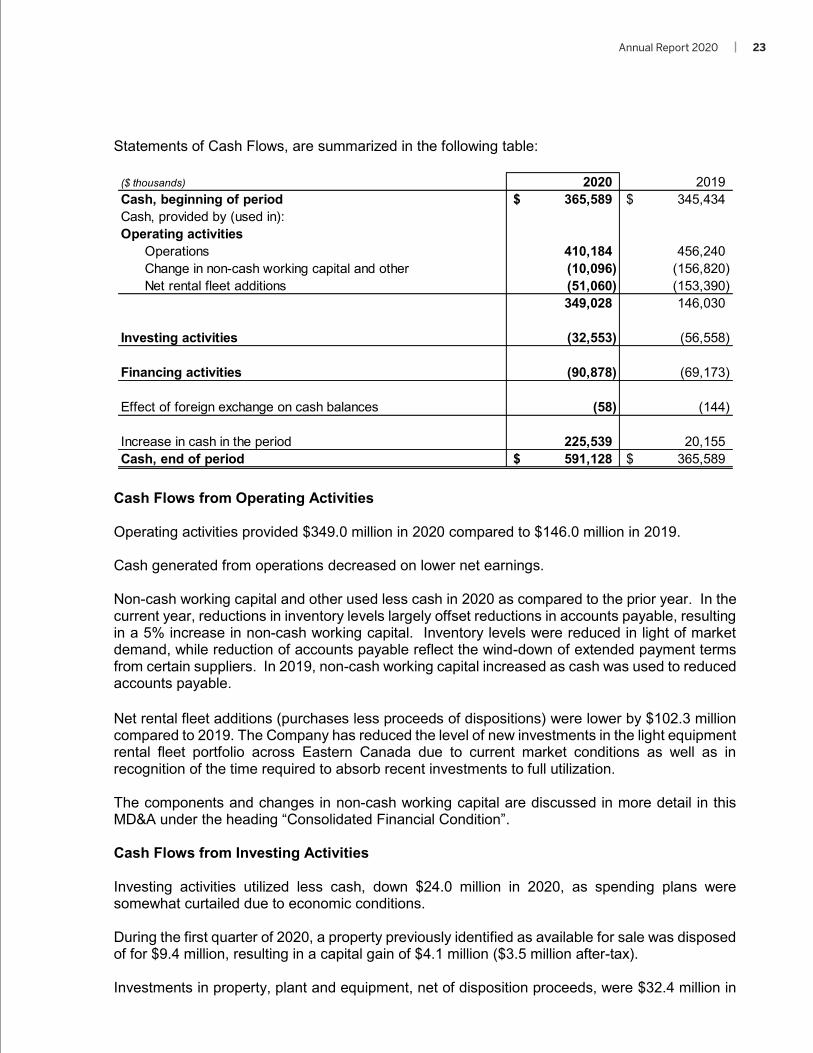
Statements of Cash Flows, are summarized in the following table:
Cash Flows from Operating Activities Operating activities provided $349.0 million in 2020 compared to $146.0 million in 2019. Cash generated from operations decreased on lower net earnings. Non-cash working capital and other used less cash in 2020 as compared to the prior year. In the current year, reductions in inventory levels largely offset reductions in accounts payable, resulting in a 5% increase in non-cash working capital. Inventory levels were reduced in light of market demand, while reduction of accounts payable reflect the wind-down of extended payment terms from certain suppliers. In 2019, non-cash working capital increased as cash was used to reduced accounts payable. Net rental fleet additions (purchases less proceeds of dispositions) were lower by $102.3 million compared to 2019. The Company has reduced the level of new investments in the light equipment rental fleet portfolio across Eastern Canada due to current market conditions as well as in recognition of the time required to absorb recent investments to full utilization. The components and changes in non-cash working capital are discussed in more detail in this MD&A under the heading “Consolidated Financial Condition”. Cash Flows from Investing Activities Investing activities utilized less cash, down $24.0 million in 2020, as spending plans were somewhat curtailed due to economic conditions. During the first quarter of 2020, a property previously identified as available for sale was disposed of for $9.4 million, resulting in a capital gain of $4.1 million ($3.5 million after-tax). Investments in property, plant and equipment, net of disposition proceeds, were $32.4 million in
($ thousands) 2020 2019Cash, beginning of period 365,589$ 345,434$ Cash, provided by (used in):Operating activities
Operations 410,184 456,240 Change in non-cash working capital and other (10,096) (156,820) Net rental fleet additions (51,060) (153,390)
349,028 146,030
Investing activities (32,553) (56,558)
Financing activities (90,878) (69,173)
Effect of foreign exchange on cash balances (58) (144)
Increase in cash in the period 225,539 20,155 Cash, end of period 591,128$ 365,589$

24 Toromont Industries Ltd.
15
2020 versus $56.5 million in 2019 as follows: $9.2 million for land and buildings for new and expanded branches (2019 - $25.5 million); $15.0 million for service vehicles (2019 - $15.7 million); $3.6 million for upgrades and enhancements to information technology infrastructure and
furniture and fixtures (2019 - $7.7 million); and $4.6 million for machinery and equipment (2019 - $7.6 million).
Cash Flows from Financing Activities Financing activities used $90.9 million in 2020 versus $69.2 million in 2019. In 2020, the Company purchased and cancelled 67,800 common shares at an average cost of $59.62 (including transaction costs) for $4.0 million. No shares were purchased and cancelled in 2019. Other significant sources and uses of cash from financing activities included:
Dividends paid to common shareholders of $98.5 million or $1.20 per share (2019 - $84.8 million or $1.04 per share);
Cash received on exercise of share options of $22.4 million (2019 - $26.7 million); and Lease liability payments of $10.3 million (2019 - $10.1 million).
OUTLOOK The COVID-19 pandemic has resulted in governments worldwide enacting emergency measures to combat the spread of the virus. These measures, which include the implementation of travel bans, self isolation and quarantine periods, social distancing, and business operating restrictions and closures have affected economies and financial markets around the world resulting in an economic slowdown. This outbreak may also cause staff shortages, affect customer demand and supply chains, impact capital resources, as well as increase government regulations or intervention, all of which may negatively impact the business, financial results and conditions of the Company. Toromont’s businesses were classified as essential in all circumstances requiring such a designation to date and supports operations. Emergency measures are variable and evolving based on local conditions. The duration and impact of the COVID-19 outbreak is unknown at this time and it is not possible to reliably estimate the length and severity of these developments nor the impact on the financial results and condition of the Company in future periods. The Equipment Group’s parts and service business provides stability along with a large and diversified installed base of equipment, so long as it is working in the field. Prior to the outbreak, the long-term outlook for infrastructure projects and other construction activity was positive across most territories. The Company has a large base of mining customers which in some cases saw reduced operating activities as a result of the COVID-19 implications. These customers and jurisdictions they operate in continue to evaluate appropriate activity levels on a regular basis. Longer term, mine expansion is still possible depending on global economic and financial conditions. Human capital, including our technician workforce, is one of our most valuable assets and we will protect that asset to the extent possible. Workforce planning initiatives undertaken to support our team through this time included voluntary compensation reductions by the executive team and the Board of Directors; wage increase freezes in some cases; advancement of vacation
Annual Report 2020 25
16
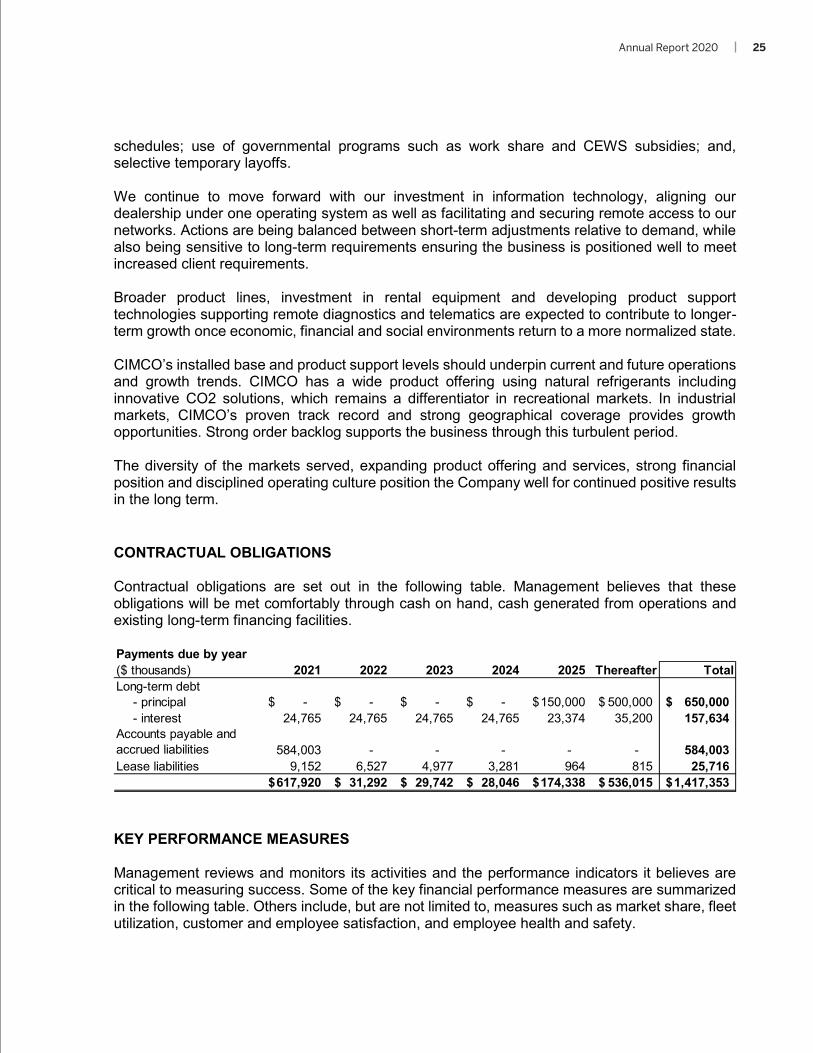
schedules; use of governmental programs such as work share and CEWS subsidies; and, selective temporary layoffs. We continue to move forward with our investment in information technology, aligning our dealership under one operating system as well as facilitating and securing remote access to our networks. Actions are being balanced between short-term adjustments relative to demand, while also being sensitive to long-term requirements ensuring the business is positioned well to meet increased client requirements. Broader product lines, investment in rental equipment and developing product support technologies supporting remote diagnostics and telematics are expected to contribute to longer-term growth once economic, financial and social environments return to a more normalized state. CIMCO’s installed base and product support levels should underpin current and future operations and growth trends. CIMCO has a wide product offering using natural refrigerants including innovative CO2 solutions, which remains a differentiator in recreational markets. In industrial markets, CIMCO’s proven track record and strong geographical coverage provides growth opportunities. Strong order backlog supports the business through this turbulent period. The diversity of the markets served, expanding product offering and services, strong financial position and disciplined operating culture position the Company well for continued positive results in the long term. CONTRACTUAL OBLIGATIONS Contractual obligations are set out in the following table. Management believes that these obligations will be met comfortably through cash on hand, cash generated from operations and existing long-term financing facilities.
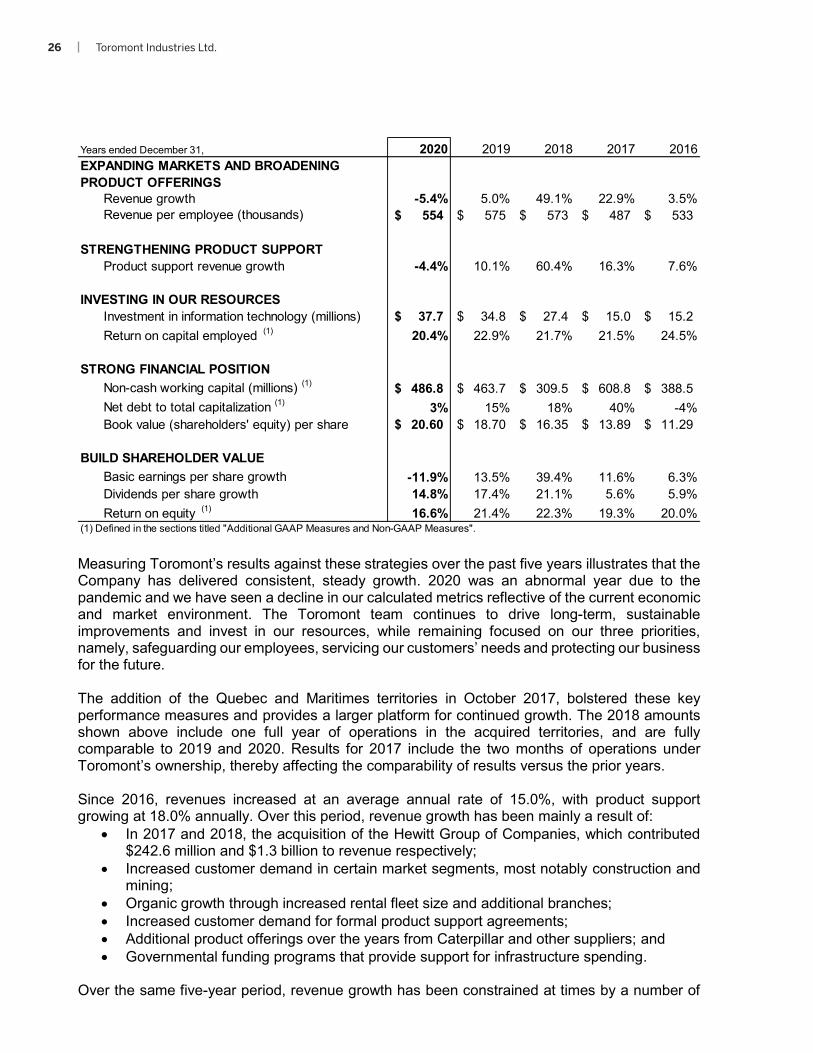
KEY PERFORMANCE MEASURES Management reviews and monitors its activities and the performance indicators it believes are critical to measuring success. Some of the key financial performance measures are summarized in the following table. Others include, but are not limited to, measures such as market share, fleet utilization, customer and employee satisfaction, and employee health and safety.
Payments due by year($ thousands) 2021 2022 2023 2024 2025 Thereafter TotalLong-term debt
- principal -$ -$ -$ -$ 150,000$ 500,000$ 650,000$ - interest 24,765 24,765 24,765 24,765 23,374 35,200 157,634
Accounts payable and accrued liabilities 584,003 - - - - - 584,003 Lease liabilities 9,152 6,527 4,977 3,281 964 815 25,716
617,920$ 31,292$ 29,742$ 28,046$ 174,338$ 536,015$ 1,417,353$
26 Toromont Industries Ltd.
17
Measuring Toromont’s results against these strategies over the past five years illustrates that the Company has delivered consistent, steady growth. 2020 was an abnormal year due to the pandemic and we have seen a decline in our calculated metrics reflective of the current economic and market environment. The Toromont team continues to drive long-term, sustainable improvements and invest in our resources, while remaining focused on our three priorities, namely, safeguarding our employees, servicing our customers’ needs and protecting our business for the future. The addition of the Quebec and Maritimes territories in October 2017, bolstered these key performance measures and provides a larger platform for continued growth. The 2018 amounts shown above include one full year of operations in the acquired territories, and are fully comparable to 2019 and 2020. Results for 2017 include the two months of operations under Toromont’s ownership, thereby affecting the comparability of results versus the prior years. Since 2016, revenues increased at an average annual rate of 15.0%, with product support growing at 18.0% annually. Over this period, revenue growth has been mainly a result of:
In 2017 and 2018, the acquisition of the Hewitt Group of Companies, which contributed $242.6 million and $1.3 billion to revenue respectively;
Increased customer demand in certain market segments, most notably construction and mining;
Organic growth through increased rental fleet size and additional branches; Increased customer demand for formal product support agreements; Additional product offerings over the years from Caterpillar and other suppliers; and Governmental funding programs that provide support for infrastructure spending.
Over the same five-year period, revenue growth has been constrained at times by a number of
Years ended December 31, 2020 2019 2018 2017 2016
Revenue growth -5.4% 5.0% 49.1% 22.9% 3.5%Revenue per employee (thousands) 554$ 575$ 573$ 487$ 533$
STRENGTHENING PRODUCT SUPPORTProduct support revenue growth -4.4% 10.1% 60.4% 16.3% 7.6%
INVESTING IN OUR RESOURCESInvestment in information technology (millions) 37.7$ 34.8$ 27.4$ 15.0$ 15.2$ Return on capital employed (1) 20.4% 22.9% 21.7% 21.5% 24.5%
STRONG FINANCIAL POSITIONNon-cash working capital (millions) (1) 486.8$ 463.7$ 309.5$ 608.8$ 388.5$ Net debt to total capitalization (1) 3% 15% 18% 40% -4%Book value (shareholders' equity) per share 20.60$ 18.70$ 16.35$ 13.89$ 11.29$
BUILD SHAREHOLDER VALUEBasic earnings per share growth -11.9% 13.5% 39.4% 11.6% 6.3%Dividends per share growth 14.8% 17.4% 21.1% 5.6% 5.9%Return on equity (1) 16.6% 21.4% 22.3% 19.3% 20.0%
(1) Defined in the sections titled "Additional GAAP Measures and Non-GAAP Measures".
EXPANDING MARKETS AND BROADENING PRODUCT OFFERINGS

Annual Report 2020 27
18
factors including: General economic weakness and uncertainty in specific sectors; Volatility in commodity prices; Competitive conditions; Inability to source equipment and parts from suppliers to meet customer demand or
delivery schedules; Ability to hire necessary skilled technicians to service the market demand; Declines in underlying market conditions such as depressed US industrial markets and
Manitoba agricultural markets; Recent political trade wars between the USA and China which have created uncertainty
and adversely impacted several industries, including steel and agriculture; and The COVID-19 pandemic in 2020, reflect the significant downturn in economic activity,
disrupting normal operations, stemming in part from site restrictions and closures and timing of delivery of project schedules.
Changes in the Canadian/US exchange rate also affect reported revenues as the exchange rate impacts the purchase price of equipment that, in turn, is reflected in selling prices. Since 2015, there have been fluctuations in the average yearly exchange rate of the Canadian dollar against the US dollar, during which time it has ranged between $0.75 and $0.77 and averaged $0.76, however, there have been periods of higher volatility. Toromont has generated a significant competitive advantage by investing in its resources, in part to increase productivity levels, as well as to maintain our systems to be relevant in the ever-changing technological environment in which we operate. We will continue this into the future as it is a crucial element to our success in the marketplace. Toromont continues to maintain a strong balance sheet. Leverage, as represented by the ratio of net debt to total capitalization, was 3% at the end of 2020 versus 15% at the end of 2019. An additional credit facility was secured in early 2020, in an abundance of caution in an uncertain economic environment, bringing total revolving credit lines to $750 million; no amounts were drawn on these facilities as at December 31, 2020. The decrease in the leverage ratio reflects strong cash generation from operations. Toromont has paid dividends consistently since 1968 and has increased the dividend in each of the last 32 years. The regular quarterly dividend rate was increased 14.8% from $0.27 per share to $0.31 per share in 2020, evidencing our commitment to delivering exceptional shareholder value.

28 Toromont Industries Ltd.
19
CONSOLIDATED FOURTH QUARTER OPERATING RESULTS
Fourth quarter results reflect continued lower economic activity levels stemming from the pandemic. While activity has improved on a sequential basis, it is still lower than the comparative period in 2019, reflecting continued site restrictions and general market uncertainty. Revenues decreased $33.0 million or 3% on weaker revenues in the Equipment Group (-4%), partially offset by higher revenues at CIMCO (+3%). Equipment Group reported reduced equipment sales and rental activity was lower. CIMCO reported strong package sales as progressed continued on projects. Product support activity continued in both Groups, supported by the essential nature of these services, down 1% in the quarter compared to last year. Gross profit margin decreased 30 bps to 24.6% in the quarter, with lower reported gross margins in both the Equipment Group and CIMCO. Selling and administrative expenses decreased $9.7 million or 8% in the fourth quarter compared to the prior year. Compensation costs decreased $4.8 million including senior leadership and Board wage reductions, governmental work-share and subsidy programs, temporary lay offs, and reduced profit sharing accruals on the lower earnings. Mark-to-market adjustments on DSU increased expenses by $2.5 million. Sales related and other travel and training expenses were $6.1 million lower in light of lower market activity and travel restrictions. As a percentage of revenues, expenses improved 60 bps to 11.8% in 2020 compared to 12.4% in 2019. Operating income decreased $1.0 million or 1% reflecting the lower activity levels in the Equipment Group, partially offset by improvements at CIMCO. Operating income margin increased 30 bps to 12.8%. Interest expense increased $0.4 million in the quarter due to financing costs related to the higher debt levels.
Three months ended December 31($ thousands, except per share amounts) 2020 2019 $ change % changeREVENUES 992,185$ 1,025,190$ (33,005)$ (3%)Cost of goods sold 747,697 770,016 (22,319) (3%)Gross profit 244,488 255,174 (10,686) (4%)Selling and administrative expenses 117,306 126,976 (9,670) (8%)OPERATING INCOME 127,182 128,198 (1,016) (1%)Interest expense 7,286 6,854 432 6% Interest and investment income (3,075) (3,166) 91 (3%)Income before income taxes 122,971 124,510 (1,539) (1%)Income taxes 34,021 34,056 (35) (0%)
NET EARNINGS 88,950 90,454 (1,504) (2%)
BASIC EARNINGS PER SHARE 1.08$ 1.10$ (0.02)$ (2%)
KEY RATIOS:Gross profit margin 24.6% 24.9%Selling and administrative expenses as a % of revenues 11.8% 12.4%Operating income margin 12.8% 12.5%Income taxes as a % of income before income taxes 27.7% 27.4%

Annual Report 2020 29
20
Interest income decreased $0.1 million resulting from higher interest from conversions of RPOs offset by lower interest earned on average cash balances, reflective of market interest rates. The effective income tax rate for the fourth quarter was 27.7% compared to 27.4% in 2019. Net earnings in the quarter were down $1.5 million or 2% to $88.9 million. Basic EPS decreased $0.02 or 2% to $1.08 versus $1.10 in 2019. BUSINESS SEGMENT FOURTH QUARTER OPERATING RESULTS Equipment Group
The Equipment Group continued to see gradual recovery of results from the more significantly reduced activity levels in the earlier part of the year. Restrictions vary by jurisdiction and activity is still below prior year’s levels. New order bookings increased late in the quarter, which is supportive for next year. Total equipment sales (new and used) decreased $16.8 million or 4%. Higher sales into construction (up 8%) were offset by lower sales into mining (down 28%), power systems (down 30%), material handling (down 9%) and agricultural markets (down 20%). Rental revenues decreased $14.3 million or 12%. All markets and most segments were lower reflecting the reduction in market activity. Revenue declines in each market for the quarter were as follows: Light equipment rentals 8%, Power 13%, Heavy rental in the construction market 5% and Material Handling 8%. Rental revenues from RPO equipment were down 44% reflecting a reduced fleet on both market demand and focused efforts to minimize fleet investments. Product support revenues decreased $5.1 million or 1% on lower service (down 5%) while parts were relatively unchanged from the comparable period last year. Service activity levels decreased across most market segments: mining (down 13%); power systems (down 10%) and material
Three months ended December 31($ thousands) 2020 2019 $ change % changeEquipment sales and rentals New 335,035$ 363,660$ (28,625)$ (8%) Used 111,446 99,589 11,857 12% Rentals 100,448 114,729 (14,281) (12%)Total equipment sales and rentals 546,929 577,978 (31,050) (5%)Product support 347,153 352,243 (5,090) (1%)Power generation 2,822 2,910 (88) (3%)Total revenues 896,904$ 933,131$ (36,228)$ (4%)Operating income 114,976$ 117,728$ (2,752)$ (2%)
Bookings ($ millions) 563.3$ 415.1$ 148.2$ 36%
KEY RATIOS:Product support revenues as a % of total revenues 38.7% 37.7%Operating income margin 12.8% 12.6%Group total revenues as a % of consolidated revenues 90.4% 91.0%

30 Toromont Industries Ltd.
21
handling (down 6%), partially offset by increases in the construction (up 15%) and agricultural market (up 9%). Gross margins decreased 10 bps in the quarter versus last year. Equipment margins were lower, down 40 bps, on product mix. Product support margins were also lower, down 60 bps, reflective of lower activity levels. Rental gross margins improved in quarter compared to the comparable period last year, up 70 bps, reflective of reductions in the rental fleet made over the last year. Sales mix was also favourable (positive 20 bps) with a larger proportion of product support revenues to total. Selling and administrative expenses decreased $7.8 million or 7%. Governmental subsidies under the CEWS program reduced expenses by $4.1 million. Compensation costs continued to decrease on strategic initiatives mentioned previously. Travel and training was restricted through much of the quarter, resulting in additional $2.5 million in savings. Operating income decreased $2.8 million or 2% in the quarter. Operating income was 12.8% as a percentage of revenues, 20 bps higher than the comparable period last year, mainly reflecting the lower expenses. Bookings increased $148.2 million or 36% to $563.3 million reflecting strong activity in construction (+37%), mining (+107%), and agricultural (+48%). This was partially offset by lower power systems (-8%) and material handling lift truck orders (-14%). CIMCO
CIMCO’s results in the fourth quarter were higher, despite the pandemic, which continues to impact the business with some project delays, as strong backlog, good margins in product support, and reduced expenses all contributed to favourable results year-over-year. Translation of US operations did not have a significant impact on results. Package revenues were up $3.2 million or 6% in the quarter compared to last year. In Canada revenues were up 6%, with increases in both the industrial (+2%) and recreational (+14%) market segment. In the US, package sales were up 9% on strong recreational revenues (+20%), partially offset by lower industrial activity (down 14%). Product support revenues were in line with last year as growth in the US (+7%) was offset by a
Three months ended December 31($ thousands) 2020 2019 $ change % changePackage sales 53,934$ 50,780$ 3,154$ 6% Product support 41,347 41,279 68 -Total revenues 95,281$ 92,059$ 3,222$ 3% Operating income 12,206$ 10,470$ 1,736$ 17%
Bookings ($ millions) 24.5$ 44.4$ (19.9)$ (45%)
KEY RATIOS:Product support revenues as a % of total revenues 43.4% 44.8%Operating income margin 12.8% 11.4%Group total revenues as a % of consolidated revenues 9.6% 9.0%
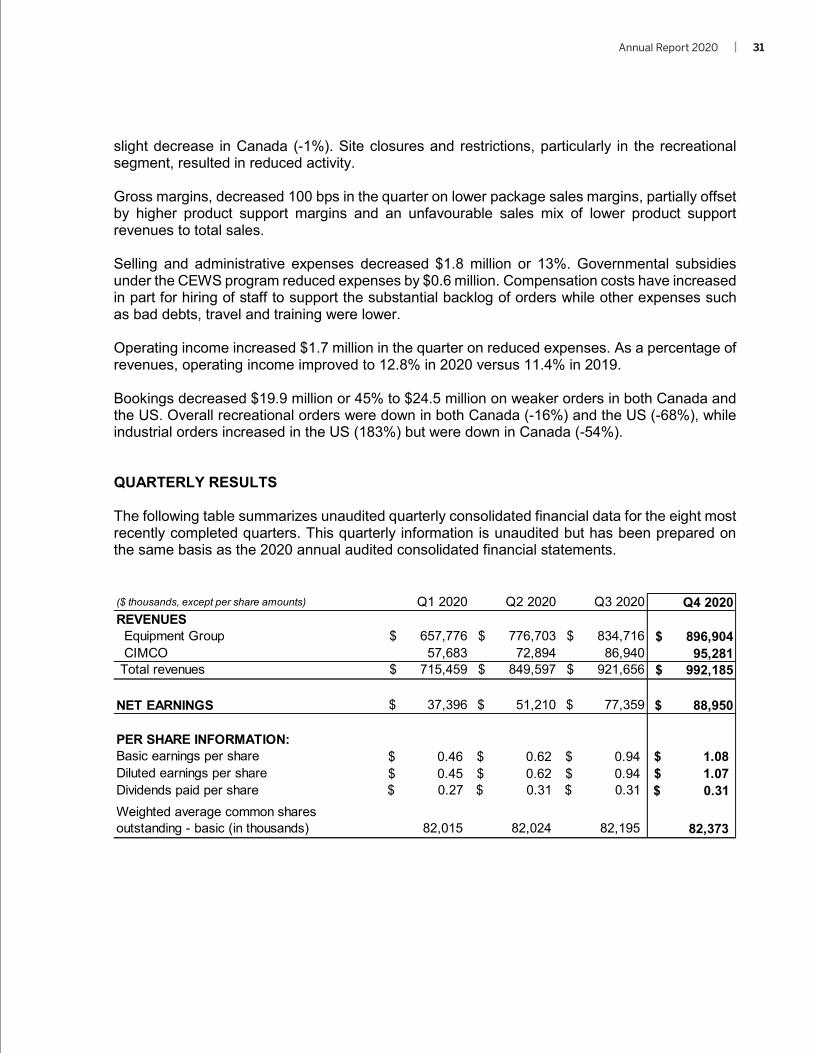
Annual Report 2020 31
22
slight decrease in Canada (-1%). Site closures and restrictions, particularly in the recreational segment, resulted in reduced activity. Gross margins, decreased 100 bps in the quarter on lower package sales margins, partially offset by higher product support margins and an unfavourable sales mix of lower product support revenues to total sales. Selling and administrative expenses decreased $1.8 million or 13%. Governmental subsidies under the CEWS program reduced expenses by $0.6 million. Compensation costs have increased in part for hiring of staff to support the substantial backlog of orders while other expenses such as bad debts, travel and training were lower. Operating income increased $1.7 million in the quarter on reduced expenses. As a percentage of revenues, operating income improved to 12.8% in 2020 versus 11.4% in 2019. Bookings decreased $19.9 million or 45% to $24.5 million on weaker orders in both Canada and the US. Overall recreational orders were down in both Canada (-16%) and the US (-68%), while industrial orders increased in the US (183%) but were down in Canada (-54%). QUARTERLY RESULTS The following table summarizes unaudited quarterly consolidated financial data for the eight most recently completed quarters. This quarterly information is unaudited but has been prepared on the same basis as the 2020 annual audited consolidated financial statements.
($ thousands, except per share amounts) Q1 2020 Q2 2020 Q3 2020 Q4 2020REVENUES Equipment Group $ 657,776 $ 776,703 $ 834,716 $ 896,904 CIMCO 57,683 72,894 86,940 95,281 Total revenues $ 715,459 $ 849,597 $ 921,656 $ 992,185
NET EARNINGS $ 37,396 $ 51,210 $ 77,359 $ 88,950
PER SHARE INFORMATION:Basic earnings per share 0.46$ 0.62$ 0.94$ 1.08$ Diluted earnings per share 0.45$ 0.62$ 0.94$ 1.07$ Dividends paid per share $ 0.27 $ 0.31 $ 0.31 $ 0.31 Weighted average common shares outstanding - basic (in thousands) 82,015 82,024 82,195 82,373

32 Toromont Industries Ltd.
23
Interim period revenues and earnings historically reflect variability from quarter to quarter due to seasonality. The Equipment Group has historically had a distinct seasonal trend in activity levels. Lower revenues are recorded during the first quarter due to winter shutdowns in the construction industry. The fourth quarter had typically been the strongest due in part to the timing of customers’ capital investment decisions, delivery of equipment from suppliers for customer-specific orders and conversions of equipment on rent with a purchase option. This pattern is impacted by the timing of significant sales to mining and other customers, resulting from the timing of mine site development and access, and construction project schedules. CIMCO has also had a distinct seasonal trend in results historically, due to timing of construction activity. Lower revenues are recorded during the first quarter on slower construction schedules due to winter weather. Revenues increase in subsequent quarters as construction schedules ramp up. This trend can be, and has been, impacted somewhat by significant governmental funding initiatives and significant industrial projects. Historically, inventories have increased through the year to meet the expected demand for higher deliveries in the third and fourth quarters of the fiscal year. This seasonal sales trend also leads accounts receivable to be at their highest level at year-end. Year-over-year quarterly comparisons were impacted by the governmental and market response and reaction to COVID-19. Revenues and earnings for the first quarter of 2020 were trending up from the prior year before the onset of the pandemic, with results ending largely flat to 2019. The second quarter experienced the most significant slowdown in market activity, resulting in reduction in revenues and earnings quarter-over-quarter. Market activity improved in the third quarter sequentially, but was still below that of the prior year. Continued improvements were noted in the fourth quarter of the year on a sequential basis, although activity remained below that of the prior year.
($ thousands, except per share amounts) Q1 2019 Q2 2019 Q3 2019 Q4 2019REVENUES Equipment Group $ 633,875 $ 895,457 $ 881,487 $ 933,131 CIMCO 66,099 82,863 93,734 92,059 Total revenues $ 699,974 $ 978,320 $ 975,221 $ 1,025,190
NET EARNINGS $ 39,261 $ 77,398 $ 79,687 $ 90,454
PER SHARE INFORMATION:Basic earnings per share 0.48$ 0.95$ 0.98$ 1.10$ Diluted earnings per share 0.48$ 0.94$ 0.97$ 1.10$ Dividends paid per share $ 0.23 $ 0.27 $ 0.27 $ 0.27
Weighted average common shares outstanding - basic (in thousands) 81,326 81,510 81,622 81,897

Annual Report 2020 33
24
SELECTED ANNUAL INFORMATION
Revenues decreased 5% in 2020. Equipment Group revenues decreased 5% on lower product support, new equipment sales and rentals reflecting significant downturn in economic activity as a result of the COVID-19 pandemic, slightly offset by increased used equipment sales and prime power generation projects. CIMCO revenues were down 7% on reduced construction activity stemming in part from construction and recreational site restrictions and closures related to the pandemic. Timing of receipt of orders and customer specific construction schedules also affect timing of revenue recognition. Product support activity continued given the essential nature of the business, albeit at lower levels, along with lower package sales. Revenues grew 5% in 2019 compared to 2018. Equipment Group revenues increased 6% on growth in product support, total new and used equipment sales and rentals resulting from good market activity and increased investment in the rental fleets. CIMCO revenues were down 2% as continued growth in product support activity was offset by lower package sales. Net earnings decreased 11% in 2020, largely reflecting the lower revenue levels in both the Equipment Group and CIMCO. Lower selling and administrative expenses due to the curtailment of non-essential expenditures was slightly off set by increased financing costs from the increased credit facility. Net earnings increased 14% in 2019 compared to 2018. Equipment Group delivered good results on the higher revenues and a lower relative expense ratio, while CIMCO’s results improved on better project execution and a one-time inventory write-down in 2018 which did not repeat. Net interest expense was lower in 2019 as strong cash inflows resulted in lower net debt levels. Dividends have generally increased in proportion to trailing earnings growth. The quarterly dividend rate continued to increase - in 2018 by 21.1% to $0.23 per share, in 2019 by 17.4% to $0.27 per share, and in 2020, by 14.8% to $0.31. The Company has paid dividends every year since 1968. Total assets decreased 1% in 2020. Equipment inventory was intentionally reduced from the previous high levels and in light of reduced economic activity. Investments in light equipment rental fleet was also reduced due to current market conditions, as well as in recognition of the time required to absorb recent significant investments to full utilization. In 2019, total assets increased 4% on continued investments in the rental fleets and capital assets, as well as higher inventory levels held generally in support of the expanded business territory and volumes.
(in thousands, except per share amounts) 2020 2019 2018Revenues 3,478,897$ 3,678,705$ 3,504,236$ Net earnings 254,915$ 286,800$ 251,984$
Earnings per share ("EPS")- Basic 3.10$ 3.52$ 3.10$ - Diluted 3.09$ 3.49$ 3.07$ Dividends declared per share 1.24$ 1.08$ 0.92$ Total assets 3,346,792$ 3,371,337$ 3,234,531$ Total long-term debt 646,299$ 645,471$ 645,562$ Weighted average common shares outstanding - basic (in millions) 82.2 81.6 81.2

34 Toromont Industries Ltd.
25
Long-term debt was largely unchanged from 2019. During 2020, the Company drew on the term credit facility in an abundance of caution early in the year at the start of the pandemic. These amounts were repaid within the year, in light of more stable market conditions and continued strong cash balances and cash flows. RISKS AND RISK MANAGEMENT In the normal course of business, Toromont is exposed to risks that may potentially impact its financial results in any or all of its business segments. The Company and each operating segment employ risk management strategies with a view to mitigating these risks on a cost-effective basis. Business Cycle Expenditures on capital goods have historically been cyclical, reflecting a variety of factors including interest rates, foreign exchange rates, consumer and business confidence, commodity prices, corporate profits, credit conditions and the availability of capital to finance purchases. Toromont’s customers are typically affected, to varying degrees, by these factors and trends in the general business cycle within their respective markets. As a result, Toromont’s financial performance is affected by the impact of such business cycles on the Company’s customer base. Commodity prices, and, in particular, changes in the view on long-term trends, affect demand for the Company’s products and services in the Equipment Group. Commodity price movements in base and precious metals sectors in particular can have an impact on customers’ demands for equipment and service. Lower commodity prices reduces short term demand as development of new and existing projects may be curtailed or deferred, leading to less demand for heavy equipment. The business of the Company is diversified across a wide range of industry market segments, serving to temper the effects of business cycles on consolidated results. Continued diversification strategies such as expanding the Company’s customer base, broadening product offerings and geographic diversification are designed to moderate business cycle impacts. The Company has focused on the sale of specialized equipment and ongoing support through parts distribution and skilled service. Product support growth has been, and will continue to be, fundamental to the mitigation of downturns in the business cycle. The product support business contributes significantly higher profit margins and is typically subject to less volatility than equipment supply activities. Product and Supply The Equipment Group purchases most of its equipment inventories and parts from Caterpillar Inc. (“Caterpillar”) under a dealership agreement that dates back to 1993. As is customary in distribution arrangements of this type, the agreement with Caterpillar can be terminated by either party upon 90 days’ notice. In the event Caterpillar terminates, it must repurchase substantially all inventories of new equipment and parts at cost. Toromont has maintained an excellent relationship with Caterpillar since inception and management expects this will continue going forward. Toromont is dependent on the continued market acceptance of Caterpillar’s products. It is believed that Caterpillar has a solid reputation as a high-quality manufacturer, with excellent brand recognition and customer support as well as leading market shares in many of the markets it

Annual Report 2020 35
26
serves. However, there can be no assurance that Caterpillar will be able to maintain its reputation and market position in the future. Any resulting decrease in the demand for Caterpillar products could have a material adverse impact on the Company’s business, results of operations and future prospects. Toromont is also dependent on Caterpillar for timely supply of equipment and parts. From time to time during periods of intense demand, Caterpillar may find it necessary to allocate its supply of particular products among its dealers. Such allocations of supply have not in the past proven to be a significant impediment in the conduct of business. However, there can be no assurance that Caterpillar will continue to supply its products in the quantities and timeframes required by customers. Competition The Company competes with a large number of international, national, regional and local suppliers in each of its markets. Although price competition can be strong, there are a number of factors that have enhanced the Company’s ability to compete throughout its market areas including the range and quality of products and services, ability to meet sophisticated customer requirements, distribution capabilities including number and proximity of locations, financing offered by Caterpillar Finance, e-commerce solutions, reputation and financial strength. Increased competitive pressures or the inability of the Company to maintain the factors that have enhanced its competitive position to date could adversely affect the Company’s business, results of operations or financial condition. Specialized Skills The Company relies on the skills and availability of trained and experienced tradesmen and technicians in order to provide efficient and appropriate services to customers. Hiring and retaining such individuals is critical to the success of these businesses. Demographic trends are reducing the number of individuals entering the trades, making access to skilled individuals more difficult. The Company has several remote locations, which make attracting and retaining skilled individuals more difficult. The Company addresses this issue by attempting to become the “employer of choice” for technicians in the industries in which we operate, as well as encouraging and attracting young people to the trades, and investing in on-going training and development of the current workforce. Credit Risk Financial instruments that potentially subject the Company to concentrations of credit risk consist of cash equivalents, accounts receivable and derivative financial instruments. The carrying amounts on the statement of financial position represent the maximum expected credit exposure. When the Company has cash on hand it may be invested in short-term instruments, such as money-market deposits. The Company has deposited cash with reputable financial institutions, from which management believes the risk of loss to be remote. The Company has accounts receivable from a large diversified customer base, and is not dependent on any single customer or industry. The Company has accounts receivable from

36 Toromont Industries Ltd.
27
customers engaged in various industries including construction, mining, food and beverage, and governmental agencies. Management does not believe that any single customer represents significant credit risk. These customers are based predominately in Canada. The credit risk associated with derivative financial instruments arises from the possibility that the counterparties may default on their obligations. In order to minimize this risk, the Company enters into derivative transactions only with highly rated financial institutions. Warranties and Maintenance Contracts Warranties are provided for most of the equipment sold, typically for a one-year period following sale. The warranty claim risk is generally shared jointly with the equipment manufacturer. Accordingly, liability is generally limited to the service component of the warranty claim, while the manufacturer is responsible for providing the required parts. The Company also enters into long-term maintenance and repair contracts, whereby it is obligated to maintain equipment for its customers. The length of these contracts varies generally from two to five years. The contracts are typically fixed price on either machine hours or cost per hour, with provisions for inflationary and exchange adjustments. Due to the long-term nature of these contracts, there is a risk that maintenance costs may exceed the estimate, thereby resulting in a loss on the contract. These contracts are closely monitored for early warning signs of cost overruns. In addition, the manufacturer may, in certain circumstances, share in the cost overruns if profitability falls below a certain threshold. Foreign Exchange The Company transacts business in multiple currencies, the most significant of which are the Canadian dollar and the US dollar. As a result, the Company has foreign currency exposure with respect to items denominated in foreign currencies. The rate of exchange between the Canadian and US dollar can have an impact on revenue trends. As substantially all of the equipment and parts sold in the Equipment Group are sourced in US dollars, and Canadian dollar sales prices generally reflect changes in the rate of exchange, a stronger Canadian dollar can adversely affect revenues, while a weaker Canadian dollar can increase reported revenues. The impact is not readily estimable as it is largely dependent on when customers order the equipment versus when it was sold. Bookings in a given period would more closely follow period-over-period changes in exchange rates. Sales of parts come from inventories maintained to service customer requirements. As a result, constant parts replenishment means that there is a lagging impact of changes in exchange rates. In CIMCO, sales are largely affected by the same factors. In addition, revenues from CIMCO’s US subsidiary reflect changes in exchange rates on the translation of results, although this is not significant. The Canadian dollar averaged US$0.75 in both 2020 and 2019. Foreign exchange contracts reduce volatility by fixing landed costs related to specific customer orders and establishing a level of price stability for high-volume goods such as spare parts. The Company does not enter into foreign exchange forward contracts for speculative purposes. The gains and losses on the foreign exchange forward contracts designated as cash flow hedges are intended to offset the translation losses and gains on the hedged foreign currency transactions when they occur. As a result, the foreign exchange impact on earnings with respect to transactional activity is not significant.

Annual Report 2020 37
28
Interest Rate The Company minimizes its interest rate risk by managing its portfolio of floating-and fixed-rate debt, as well as managing the term to maturity. At December 31, 2020, the Company’s outstanding debt of $650.0 million bears interest at fixed-rates and matures between 2025 and 2027. Fixed-rate debt exposes the Company to future interest rate movements upon refinancing the debt at maturity. Further, the fair value of the Company’s fixed-rate debt obligations may be negatively affected by declines in interest rates, thereby exposing the Company to potential losses on early settlements or refinancing. The Company does not intend to settle or refinance any existing fixed-rate debt before maturity. The Company’s revolving credit facilities totalling $750.0 million bear interest at floating-rates and exposes the Company to fluctuations in short-term interest rates by causing related interest payments and finance expense to vary. At December 31, 2020, no amounts were drawn on these facilities while standby letters of credit utilized $30.8 million. Financing Arrangements The Company requires capital to finance its growth and to refinance its outstanding debt obligations as they come due for repayment. If the cash generated from the Company’s business, together with the credit available under existing bank facilities, are not sufficient to fund future capital requirements, the Company will require additional debt or equity financing in the capital markets. The Company’s ability to access capital markets, on terms that are acceptable, will be dependent upon prevailing market conditions, as well as the Company’s future financial condition. Further, the Company’s ability to increase its debt financing may be limited by its financial covenants or its credit rating objectives. The Company maintains a conservative leverage structure and although it does not anticipate difficulties, there can be no assurance that capital will be available on suitable terms and conditions, or that borrowing costs and credit ratings will not be adversely affected. Environmental Regulation Toromont’s customers are subject to significant and ever-increasing environmental legislation and regulation. This legislation can impact Toromont in two ways. First, it may increase the technical difficulty in meeting environmental requirements in product design, which could increase the cost of these businesses’ products. Second, it may result in a reduction in activity by Toromont’s customers in environmentally sensitive areas, in turn reducing the sales opportunities available to Toromont. Toromont is also subject to a broad range of environmental laws and regulations. These may, in certain circumstances, impose strict liability for environmental contamination, which may render Toromont liable for remediation costs, natural resource damages and other damages as a result of conduct that was lawful at the time it occurred or the conduct of, or conditions caused by, prior owners, operators or other third parties. In addition, where contamination may be present, it is not uncommon for neighbouring land owners and other third parties to file claims for personal injury, property damage and recovery of response costs. Remediation costs and other damages arising as a result of environmental laws and regulations, and costs associated with new information, changes in existing environmental laws and regulations or the adoption of new environmental laws and regulations could be substantial and could negatively impact Toromont’s business, results of operations or financial condition.

38 Toromont Industries Ltd.
29
Information Technology and Cybersecurity Risk The Company depends on information technology infrastructure and systems, hosted internally or outsourced, to conduct day-to-day operations and for the effective operation of our business. Our business also requires the appropriate and secure utilization of sensitive and confidential information belonging to third parties such as our customers and suppliers. While we strive to leverage technology to meet the growing needs of our customers and enhance the efficiency of our operations, it nevertheless comes with information security and cybersecurity risks. These risks include information technology system failures and non-availability, and cyber-attacks, including but not limited to hacking, malware, unauthorized access to confidential, proprietary or sensitive information or other breaches of network or Information Technology (IT) security. The Company continues to monitor and enhance its defences and procedures to prevent, detect, respond to and manage these threats, which are constantly evolving. Disruption to information systems or breaches of security could result in a negative impact on the Company’s financial results or result in reputational damage. Pandemic Risk (Coronavirus COVID-19) A pandemic can create significant volatility, uncertainty and economic disruption. The outbreak of the novel strain of coronavirus COVID-19 has resulted in governments worldwide enacting emergency measures to contain the spread of the virus including the implementation of travel bans, self-imposed quarantine periods, self-isolation, physical and social distancing and at times, the closure of non-essential businesses. These, and potential future emergency measures and restrictions, have and may cause, significant disruption to businesses in Canada and globally, resulting in an uncertain and challenging economic environment. Global debt and equity capital markets have experienced significant volatility. Governments and central banks have reacted with considerable monetary and fiscal interventions designed to stabilize economic conditions. As an emerging risk, the duration and impact of the COVID-19 pandemic is unknown at this time, as is the efficacy of the government and central bank interventions. Any estimate of the length and severity of these developments is therefore subject to significant uncertainty, and accordingly estimates of the extent to which the COVID-19 pandemic may, directly or indirectly, materially and adversely affect the Company’s operations, financial results and condition in future periods are also subject to significant uncertainty. The risks and uncertainties disclosed previously above could be particularly exacerbated by extraordinary externalities such as the COVID-19 pandemic and the recent commodity price challenges, including, risks described under “Business Cycle”, “Product and Supply”, “Specialized Skills”, “Credit Risk”, “Foreign Exchange”, “Interest Rate”, “Financing Arrangements” and “Environmental Regulation”. Such risks include, but are not limited to:
a) uncertainty associated with the costs and ability of resources, including technicians, required to provide the appropriate/required levels of service to our customers on site;
b) a material reduction in demand for, or profitability of, our products or services; c) an increase in accounts receivable delinquencies from financial hardship for our
customers;
Annual Report 2020 39
30
d) issues delivering the Company’s products and services due to illness, Company or government imposed isolation programs, restrictions on the movement of personnel and supply chain disruptions;
e) the impact of additional legislation, regulation and other government interventions in response to the COVID-19 pandemic;
f) the negative impact on global debt and equity capital markets, including the trading price of the Company’s securities; and
g) the ability to access capital markets at a reasonable cost. Any of these risks, and others, could have a material adverse effect on our business, operations, capital resources and/or financial results of operations. In response to the COVID-19 pandemic, management has directed significant focus towards ensuring the ongoing safety of our employees, continuing to serve our customers’ needs as an essential service, and protecting the business and organization for the long-term. A Critical Incident Executive Response Team was activated at an early stage and continues to assess developments and respond appropriately, including limiting business travel, enabling work from home where practical, enforcing social distancing practices, mask wearing and sanitation protocols in all areas. Steps have also been taken to ensure that information technology, including remote access, is secure. The Company is regularly updating employees to provide information on the situation and on necessary precautions to take. We continue to have an open dialogue with public safety and government officials at all levels, as well as key suppliers, partners, and customers. SIGNIFICANT ACCOUNTING POLICIES AND ESTIMATES The preparation of the Company’s consolidated financial statements in conformity with IFRS requires management to make judgments, estimates and assumptions that affect the reported amounts of revenues, expenses, assets and liabilities, and the disclosure of contingent liabilities, at the end of the reporting period. However, uncertainty about these assumptions and estimates could result in outcomes that require a material adjustment to the carrying amount of the asset or liability affected in future periods. In making estimates and judgments, management relies on external information and observable conditions where possible, supplemented by internal analysis as required. Management reviews its estimates and judgments on an ongoing basis. The Company has discussed the development, selection, and application of its key accounting policies, and the critical accounting estimates and assumptions they involve, with the Audit Committee. The Company’s significant accounting policies, estimates and assumptions are described in notes 1 and 2 of the notes to the consolidated financial statements. Changes in Accounting Policies No changes in accounting policies were adopted in 2020 as a result of new standards and interpretations which became effective during the year. The accounting policy Government grants was adopted in 2020 in light of the Canada Emergency Wage Subsidy program (“CEWS”), which provided subsidies during the year in response to the pandemic.
40 Toromont Industries Ltd.
31
Government Grants Government grants are recognized when there is reasonable assurance that the grant will be received and all conditions associated with the grant are met. Claims under income-related government grants are reported in the consolidated income statements as other income included in selling and administrative expenses. Government grants receivable are recorded in accounts receivable on the consolidated statements of financial position. Pending Accounting Changes A number of amendments to standards have been issued but are not yet effective for the financial year ending December 31, 2020, and accordingly, have not been applied. The Company reviewed these amendments and concluded that there would be no impact on adoption given their nature and applicability. CONTROLS AND PROCEDURES Disclosure Controls and Procedures Management, under the supervision of the President and Chief Executive Officer (“CEO”) and Executive Vice President and Chief Financial Officer (“CFO”), is responsible for establishing and maintaining disclosure controls and procedures, as defined in National Instrument 52-109 – Certification of Disclosure in Issuers’ Annual and Interim Filings, and have designed such disclosure controls and procedures, or have caused it to be designed under their supervision, to provide reasonable assurance that material information with respect to Toromont is made known to them. The CEO and the CFO, together with other members of management, have evaluated the effectiveness of the Company’s disclosure controls and procedures. Based on that evaluation, the CEO and CFO concluded that the Company’s disclosure controls and procedures were effective as at December 31, 2020. Internal Control over Financial Reporting Management, under the supervision of the CEO and CFO, is responsible for establishing and maintaining adequate internal control over financial reporting, as defined by National Instrument 52-109 – Certification of Disclosure in Issuers’ Annual and Interim Filings, and have designed such internal control over financial reporting, or caused it to be designed under their supervision, to provide reasonable assurance regarding the reliability of financial reporting and the preparation of the consolidated financial statements in accordance with IFRS. The CEO and the CFO, together with other members of management, have evaluated the effectiveness of the Company’s internal control over financial reporting as at December 31, 2020, using the criteria set forth in Internal Control - Integrated Framework (2013 edition) issued by the Committee of Sponsoring Organizations of the Treadway Commission (“COSO”). Based on that evaluation, the CEO and CFO concluded that the Company’s internal control over financial reporting was effective as at December 31, 2020.

Annual Report 2020 41
32
There have been no changes in the design of the Company’s internal control over financial reporting during 2020 that would materially affect, or are reasonably likely to materially affect, the Company’s internal control over financial reporting. Due to its inherent limitations, internal control over financial reporting may not prevent or detect misstatements on a timely basis. Also, a projection of the evaluation of the effectiveness of internal control over financial reporting to future periods is subject to the risk that the controls may become inadequate because of changes in conditions, or that the degree of compliance with the policies or procedures may deteriorate. Therefore, even those systems determined to be effective can provide only reasonable assurance with respect to the financial statement preparation and presentation. Internal controls over financial reporting may not prevent all errors and fraud. A control system, no matter how well conceived or operated, can only provide reasonable, not absolute, assurance that the objectives of the control system are met. ADDITIONAL GAAP MEASURES IFRS mandates certain minimum line items for financial statements and also requires presentation of additional line items, headings and subtotals when such presentation is relevant to an understanding of the Company’s financial position or performance. IFRS also requires the notes to the financial statements to provide information that is not presented elsewhere in the financial statements, but is relevant to understanding them. Such measures outside of the minimum mandated line items are considered additional GAAP measures. The Company’s consolidated financial statements and notes thereto include certain additional GAAP measures where management considers such information to be useful to the understanding of the Company’s results. Gross Profit Gross Profit is defined as total revenues less cost of goods sold. Operating Income Operating income is defined as net earnings before interest expense, interest and investment income and income taxes and is used by management to assess and evaluate the financial performance of its operating segments. Financing and related interest charges cannot be attributed to business segments on a meaningful basis that is comparable to other companies. Business segments do not correspond to income tax jurisdictions, and it is believed that the allocation of income taxes distorts the historical comparability of the performance of the business segments.
($ thousands) 2020 2019 2020 2019Net earnings 88,950$ 90,454$ 254,915$ 286,800$
plus: Interest expense 7,286 6,854 29,981 27,707 less: Interest and investment income (3,075) (3,166) (9,083) (9,752) plus: Income taxes 34,021 34,056 96,621 107,740
Operating income 127,182$ 128,198$ 372,434$ 412,495$
Total Revenues 992,185 1,025,190 3,478,897 3,678,705 Operating income margin 12.8% 12.5% 10.7% 11.2%
Three months ended December 31 Years ended December 31

42 Toromont Industries Ltd.
33
Net Debt to Total Capitalization/Equity Net debt to total capitalization/equity are calculated as net debt divided by total capitalization and shareholders’ equity, respectively, as defined below, and are used by management as measures of the Company’s financial leverage. Net debt is calculated as long-term debt plus current portion of long-term debt less cash. Total capitalization is calculated as shareholders’ equity plus net debt. The calculations are as follows:
NON-GAAP MEASURES Management believes that providing certain non-GAAP measures provides users of the Company’s consolidated financial statements with important information regarding the operational performance and related trends of the Company's business. By considering these measures in combination with the comparable IFRS measures set out below, management believes that users are provided a better overall understanding of the Company's business and its financial performance during the relevant period than if they simply considered the IFRS measures alone. The non-GAAP measures used by management do not have any standardized meaning prescribed by IFRS and are therefore unlikely to be comparable to similar measures presented by other issuers. Accordingly, these measures should not be considered as a substitute or alternative for net income or cash flow, in each case as determined in accordance with IFRS. Working Capital Working capital is defined as total current assets less total current liabilities. Management views working capital as a measure for assessing overall liquidity.
($ thousands) 2020 2019Long-term debt 646,299$ 645,471$
less: Cash 591,128 365,589 Net debt 55,171 279,882
Shareholders' equity 1,698,652 1,533,891 Total capitalization 1,753,823$ 1,813,773$
Net debt to total capitalization 3% 15%Net debt to equity 0.03:1 0.18:1
($ thousands) 2020 2019Total current assets 1,872,144$ 1,824,254$
less: Total current liabilities 794,216 994,979 Working capital 1,077,928$ 829,275$

Annual Report 2020 43
34
Non-Cash Working Capital Non-cash working capital is defined as total current assets (excluding cash) less total current liabilities (excluding current portion of long-term debt).
Market Capitalization & Total Enterprise Value Market capitalization represents the total market value of the Company’s equity. It is calculated by multiplying the market price of the Company’s share by the total outstanding shares. Total enterprise value represents the total value of the Company and is often used as a more comprehensive alternative to market capitalization. It is calculated by adding net debt (defined above) to market capitalization. The calculations are as follows:
Key Performance Indicators (“KPIs”) Management uses key performance indicators to consistently measure performance against the Company’s priorities across the organization. The Company’s KPIs include gross profit margin, operating margin, order bookings and backlogs, return on capital employed and return on equity. Although some of these KPIs are expressed as ratios, they are non-GAAP financial measures that do not have a standardized meaning under IFRS and may not be comparable to similar measures used by other issuers.
($ thousands) 2020 2019Total current assets 1,872,144$ 1,824,254$
less: Cash 591,128 365,589 1,281,016 1,458,665
Total current liabilities 794,216 994,979
Non-cash working capital 486,800$ 463,686$
($ thousands, except for shares and share price) 2020 2019Outstanding common shares 82,474,658 82,012,448
times: Ending share price 89.20$ 70.59$ Market capitalization 7,356,739$ 5,789,258$
Long-term debt 646,299$ 645,471$ less: Cash 591,128 365,589
Net debt 55,171$ 279,882$
Total enterprise value 7,411,910$ 6,069,140$

44 Toromont Industries Ltd.
35
Gross Profit Margin This measure is defined as gross profit (defined above) divided by total revenues. Operating Income Margin This measure is defined as operating income (defined above) divided by total revenues. Order Bookings and Backlogs The Company’s order bookings represent equipment unit orders that management believes are firm. Backlogs are defined as the retail value of equipment unit ordered by customers for future deliveries. Management uses order backlog as a measure of projecting future equipment deliveries. There are no directly comparable IFRS measures for order bookings or backlog. Return on Capital Employed (“ROCE”) ROCE is utilized to assess both current operating performance and prospective investments. The adjusted earnings numerator used for the calculation is income before income taxes, interest expense and interest income (excluding interest on rental conversions). The denominator in the calculation is the monthly average capital employed, which is defined as net debt plus shareholders’ equity or total capitalization.
Return on Equity (“ROE”) ROE is monitored to assess the profitability of the consolidated company and is calculated by dividing net earnings by opening shareholders’ equity (adjusted for shares issued and redeemed during the year).
($ thousands) 2020 2019Net earnings 254,915$ 286,800$
plus: Interest expense 29,981 27,707 less: Interest and investment income (9,083) (9,752) plus: Interest income - rental conversions 3,529 4,283 plus: Income taxes 96,621 107,740
Adjusted net earnings 375,963$ 416,778$
Average capital employed 1,838,533$ 1,823,420$ Return on capital employed 20.4% 22.9%
($ thousands) 2020 2019Net earnings 254,915$ 286,800$
Opening shareholders' equity (net of adjustments) 1,538,817$ 1,338,468$ Return on equity 16.6% 21.4%
Annual Report 2020 45
1
MANAGEMENT’S REPORT TO THE SHAREHOLDERS The preparation and presentation of the Company’s consolidated financial statements is the responsibility of management. The consolidated financial statements have been prepared in accordance with International Financial Reporting Standards as issued by the International Accounting Standards Board and necessarily include estimates. The consolidated financial statements reflect amounts which must, of necessity, be based on the best estimates and judgment of management. Information contained in the Company’s Management’s Discussion and Analysis is consistent, where applicable, with that contained in the consolidated financial statements. Management maintains appropriate systems of internal control. Policies and procedures are designed to give reasonable assurance that transactions are appropriately authorized, assets are safeguarded from loss or unauthorized use and financial records are properly maintained to provide reliable information for preparation of the consolidated financial statements. Ernst & Young LLP, an independent firm of Chartered Professional Accountants, were appointed by the shareholders as external auditor to examine the consolidated financial statements in accordance with generally accepted auditing standards in Canada and provide an independent professional opinion. Their report is presented with the consolidated financial statements. The Board of Directors, acting through an Audit Committee comprised solely of independent directors, is responsible for determining that management fulfils its responsibilities in the preparation of the consolidated financial statements and the financial control of operations. The Audit Committee recommends the independent auditor for appointment by the shareholders. It meets regularly with financial management and the internal and external auditor to discuss internal controls, auditing matters and financial reporting issues. The independent auditor has unrestricted access to the Audit Committee. The consolidated financial statements and Management’s Discussion and Analysis have been approved by the Board of Directors, based on the review and recommendation of the Audit Committee. /s/ S.J. Medhurst /s/ M.S. McMillan Scott J. Medhurst Michael S. McMillan February 10, 2021 President and Executive Vice President and Toronto, Canada Chief Executive Officer Chief Financial Officer

46 Toromont Industries Ltd.
2
INDEPENDENT AUDITOR’S REPORT To the Shareholders of Toromont Industries Ltd., Opinion We have audited the consolidated financial statements of Toromont Industries Ltd. and its subsidiaries (the Group), which comprise the consolidated statements of financial position as at December 31, 2020 and 2019, and the consolidated income statements, consolidated statements of comprehensive income, consolidated statements of changes in shareholders’ equity and consolidated statements of cash flows for the years then ended, and notes to the consolidated financial statements, including a summary of significant accounting policies. In our opinion, the accompanying consolidated financial statements present fairly, in all material respects, the consolidated financial position of the Group as at December 31, 2020 and 2019, and its consolidated financial performance and its consolidated cash flows for the years then ended in accordance with International Financial Reporting Standards (IFRS). Basis for Opinion We conducted our audit in accordance with Canadian generally accepted auditing standards. Our responsibilities under those standards are further described in the Auditor’s Responsibilities for the Audit of the Consolidated Financial Statements section of our report. We are independent of the Group in accordance with the ethical requirements that are relevant to our audit of the consolidated financial statements in Canada, and we have fulfilled our other ethical responsibilities in accordance with these requirements. We believe that the audit evidence we have obtained is sufficient and appropriate to provide a basis for our opinion. Key Audit Matter Key audit matters are those matters that, in our professional judgment, were of most significance in our audit of the consolidated financial statements of the current period. These matters were addressed in the context of our audit of the consolidated financial statements as a whole, and in forming our auditor’s opinion thereon, and we do not provide a separate opinion on these matters. For the matter below, our description of how our audit addressed the matter is provided in that context. We have fulfilled the responsibilities described in the Auditor’s Responsibilities for the Audit of the Consolidated Financial Statements section of our report, including in relation to this matter. Accordingly, our audit included the performance of procedures designed to respond to our assessment of the risks of material misstatement of the consolidated financial statements. The results of our audit procedures, including the procedures performed to address the matter below, provide the basis for our audit opinion on the accompanying consolidated financial statements. Revenue recognition for long-term refrigeration packages Key audit matter How our audit addressed the key audit
matter The Group sells industrial and recreational refrigeration packages, which involve the design, manufacture, installation and commissioning of longer-term projects under the customer’s control and can span from
For long-term refrigeration package contracts that were open as of December 31, 2020, our audit procedures included the following, among others:
Annual Report 2020 47
3
three months to one year. Revenue is recognized progressively based on the percentage-of-completion method. This method is measured by reference to costs incurred to date as a percentage of the total estimated costs. The Group’s policy for revenue recognition together with the related significant accounting estimates and assumptions is described in notes 1 and 2 of the consolidated financial statements. The Group recognized $161.1 million of revenues for the year ended December 31, 2020 related to these contracts. The determination of the estimated costs to complete projects that are open at period end is a significant judgement that can have a material impact on the amount of revenue and profit recognized in the period. These significant judgements include those related to estimated future labour, materials and overhead costs for contracts. Given the variation in the types of refrigeration projects, these judgements related to the estimation of future costs are subjective in nature and dependent on the complexity and status of the related contract as of the period end date.
We obtained an understanding, evaluated the design, and tested the operating effectiveness of controls related to the Group’s estimation processes (including the approval of the initial budget, and the monitoring and assessment of contract activities and estimated costs to complete), and the recording of revenue in the consolidated financial statements; We reviewed contractual arrangements, including pricing and billing terms, change orders and terms and conditions impacting revenue recognition, if any, had discussions with operational personnel and assessed whether appropriate approvals were obtained in accordance with the Company’s authorization matrix for a sample of projects. Once a project commenced, we also obtained and reviewed a sample of meeting minutes and observed a sample of project update calls where management and project managers discussed the status of each project; We compared prior period cost estimates to actual contract costs incurred in the current period to assess management’s ability to estimate the costs to complete a contract; We obtained management’s initial cost estimates and tested a sample of actual material and labour costs incurred to assess the measurement of the estimated costs to complete at period end; and We assessed the adequacy of disclosures in describing the areas of judgement and estimation uncertainties involving revenue recognition for projects that are open at period end.
Other Information Management is responsible for the other information. The other information comprises:
• Management’s Discussion and Analysis • The information, other than the consolidated financial statements and our auditor’s report
thereon, in the Annual Report
Our opinion on the consolidated financial statements does not cover the other information and we do not express any form of assurance conclusion thereon.

48 Toromont Industries Ltd.
4
In connection with our audit of the consolidated financial statements, our responsibility is to read the other information, and in doing so, consider whether the other information is materially inconsistent with the consolidated financial statements or our knowledge obtained in the audit or otherwise appears to be materially misstated. We obtained Management’s Discussion and Analysis prior to the date of this auditor’s report. If, based on the work we have performed, we conclude that there is a material misstatement of this other information, we are required to report that fact in this auditor’s report. We have nothing to report in this regard. The Annual Report is expected to be made available to us after the date of the auditor’s report. If based on the work we will perform on this other information, we conclude there is a material misstatement of other information, we are required to report that fact to those charged with governance. Responsibilities of Management and Those Charged with Governance for the Consolidated Financial Statements Management is responsible for the preparation and fair presentation of the consolidated financial statements in accordance with IFRS, and for such internal control as management determines is necessary to enable the preparation of consolidated financial statements that are free from material misstatement, whether due to fraud or error. In preparing the consolidated financial statements, management is responsible for assessing the Group’s ability to continue as a going concern, disclosing, as applicable, matters related to going concern and using the going concern basis of accounting unless management either intends to liquidate the Group or to cease operations, or has no realistic alternative but to do so. Those charged with governance are responsible for overseeing the Group’s financial reporting process. Auditor’s Responsibilities for the Audit of the Consolidated Financial Statements Our objectives are to obtain reasonable assurance about whether the consolidated financial statements as a whole are free from material misstatement, whether due to fraud or error, and to issue an auditor’s report that includes our opinion. Reasonable assurance is a high level of assurance, but is not a guarantee that an audit conducted in accordance with Canadian generally accepted auditing standards will always detect a material misstatement when it exists. Misstatements can arise from fraud or error and are considered material if, individually or in the aggregate, they could reasonably be expected to influence the economic decisions of users taken on the basis of these consolidated financial statements. As part of an audit in accordance with Canadian generally accepted auditing standards, we exercise professional judgment and maintain professional skepticism throughout the audit. We also:
• Identify and assess the risks of material misstatement of the consolidated financial statements, whether due to fraud or error, design and perform audit procedures responsive to those risks, and obtain audit evidence that is sufficient and appropriate to provide a basis for our opinion. The risk of not detecting a material misstatement resulting
Annual Report 2020 49
5
from fraud is higher than for one resulting from error, as fraud may involve collusion, forgery, intentional omissions, misrepresentations, or the override of internal control.
• Obtain an understanding of internal control relevant to the audit in order to design audit procedures that are appropriate in the circumstances, but not for the purpose of expressing an opinion on the effectiveness of the Group’s internal control.
• Evaluate the appropriateness of accounting policies used and the reasonableness of accounting estimates and related disclosures made by management.
• Conclude on the appropriateness of management’s use of the going concern basis of accounting and, based on the audit evidence obtained, whether a material uncertainty exists related to events or conditions that may cast significant doubt on the Group’s ability to continue as a going concern. If we conclude that a material uncertainty exists, we are required to draw attention in our auditor’s report to the related disclosures in the consolidated financial statements or, if such disclosures are inadequate, to modify our opinion. Our conclusions are based on the audit evidence obtained up to the date of our auditor’s report. However, future events or conditions may cause the Group to cease to continue as a going concern.
• Evaluate the overall presentation, structure, and content of the consolidated financial statements, including the disclosures, and whether the consolidated financial statements represent the underlying transactions and events in a manner that achieves fair presentation.
• Obtain sufficient appropriate audit evidence regarding the financial information of the entities or business activities within the Group to express an opinion on the consolidated financial statements. We are responsible for the direction, supervision and performance of the group audit. We remain solely responsible for our audit opinion.
We communicate with those charged with governance regarding, among other matters, the planned scope and timing of the audit and significant audit findings, including any significant deficiencies in internal control that we identify during our audit. We also provide those charged with governance with a statement that we have complied with relevant ethical requirements regarding independence, and to communicate with them all relationships and other matters that may reasonably be thought to bear on our independence, and where applicable, related safeguards. From the matters communicated with those charged with governance, we determine those matters that were of most significance in the audit of the consolidated financial statements of the current period and are therefore the key audit matters. We describe these matters in our auditor’s report unless law or regulation precludes public disclosure about the matter or when, in extremely rare circumstances, we determine that a matter should not be communicated in our report because the adverse consequences of doing so would reasonably be expected to outweigh the public interest benefits of such communication. The engagement partner on the audit resulting in this independent auditor’s report is Paula J. Smith. /s/ Ernst & Young LLP Ernst & Young LLP February 10, 2021 Chartered Professional Accountants Toronto, Canada Licensed Public Accountants

50 Toromont Industries Ltd.
6
TOROMONT INDUSTRIES LTD.CONSOLIDATED STATEMENTS OF FINANCIAL POSITION
As at December 31 ($ thousands) Note 2020 2019AssetsCurrent assets Cash 591,128$ 365,589$ Accounts receivable 3 541,580 525,052 Inventories 4 728,404 912,186 Income taxes recoverable 135 9,364 Other current assets 10,897 12,063 Total current assets 1,872,144 1,824,254
Property, plant and equipment 5 423,282 428,527 Rental equipment 5 539,412 592,403 Other assets 6 33,263 42,105 Deferred tax assets 15 504 1,217 Goodwill and intangible assets 7 478,187 482,831 Total assets 3,346,792$ 3,371,337$
LiabilitiesCurrent liabilities Accounts payable and accrued liabilities 6, 18 584,003$ 819,946$ Provisions 8 26,645 23,680 Deferred revenues and contract liabilities 9 149,109 140,898 Derivative financial instruments 12 11,043 10,366 Income taxes payable 23,416 89 Total current liabilities 794,216 994,979
Deferred revenues and contract liabilities 9 16,383 16,407 Long-term lease liabilities 6 16,565 21,734 Long-term debt 10, 12 646,299 645,471 Post-employment obligations 19 149,451 125,705 Deferred tax liabilities 15 25,226 33,150 Total liabilities 1,648,140 1,837,446
Shareholders' equityShare capital 11 516,591 490,047 Contributed surplus 14,243 13,088 Retained earnings 1,169,239 1,031,097 Accumulated other comprehensive loss (1,421) (341) Total shareholders' equity 1,698,652 1,533,891 Total liabilities and shareholders' equity 3,346,792$ 3,371,337$
Commitments - see note 22See accompanying notes
Approved by the Board:
(signed) R. M. Ogilvie (signed) C. E. Cranston____________________ ____________________
Robert M. Ogilvie Cathy E. CranstonDirector Director
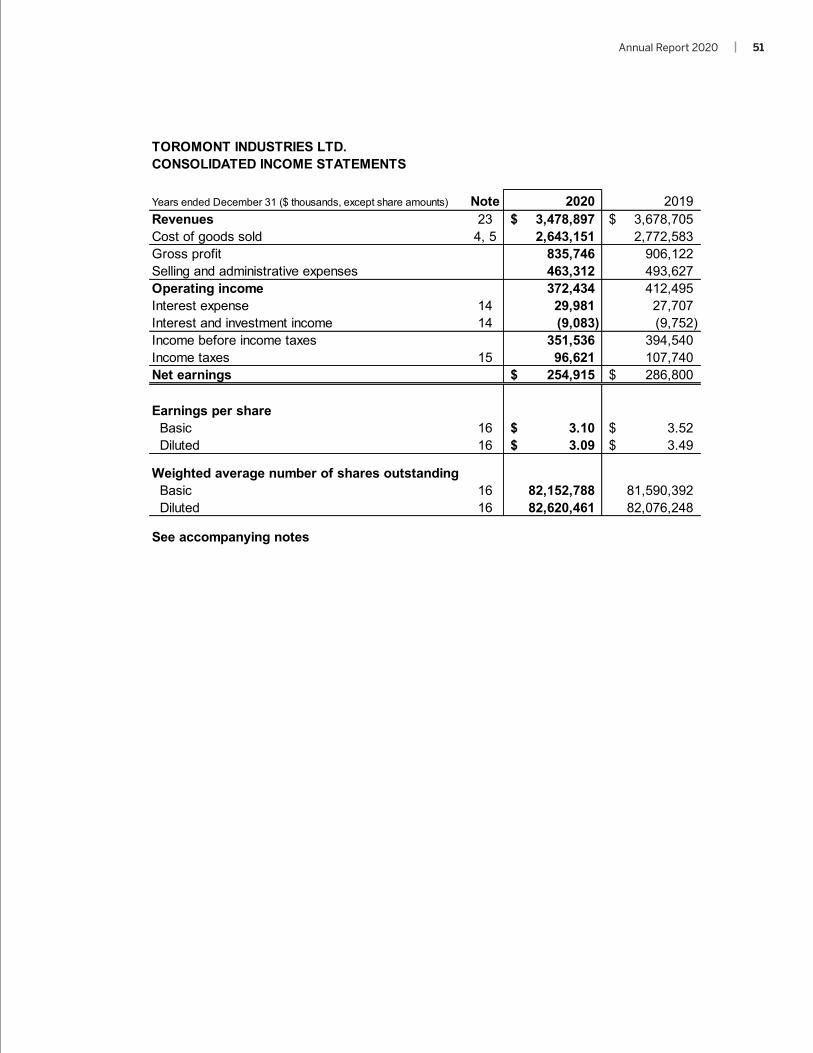
Annual Report 2020 51
7
TOROMONT INDUSTRIES LTD.CONSOLIDATED INCOME STATEMENTS
Years ended December 31 ($ thousands, except share amounts) Note 2020 2019Revenues 23 3,478,897$ 3,678,705$ Cost of goods sold 4, 5 2,643,151 2,772,583 Gross profit 835,746 906,122 Selling and administrative expenses 463,312 493,627 Operating income 372,434 412,495 Interest expense 14 29,981 27,707 Interest and investment income 14 (9,083) (9,752) Income before income taxes 351,536 394,540 Income taxes 15 96,621 107,740 Net earnings 254,915$ 286,800$
Earnings per share Basic 16 3.10$ 3.52$ Diluted 16 3.09$ 3.49$
Weighted average number of shares outstanding Basic 16 82,152,788 81,590,392 Diluted 16 82,620,461 82,076,248
See accompanying notes

52 Toromont Industries Ltd.
8
TOROMONT INDUSTRIES LTD.CONSOLIDATED STATEMENTS OF COMPREHENSIVE INCOME
Years ended December 31 ($ thousands) 2020 2019Net earnings 254,915$ 286,800$
Other comprehensive loss, net of income taxes:
Items that may be reclassified subsequently to net earnings:Foreign currency translation adjustments (339) (481)
Unrealized losses on derivatives designated as cash flow hedges (2,911) (12,232) Income tax recovery 744 3,180 Unrealized losses on cash flow hedges, net of income taxes (2,167) (9,052)
Realized losses on derivatives designated as cash flow hedges 1,909 4,380 Income tax recovery (483) (1,139) Realized losses on cash flow hedges, net of income taxes 1,426 3,241
Items that will not be reclassified subsequently to net earnings:Actuarial and other losses (15,213) (25,252) Income tax recovery 4,031 6,692 Actuarial and other losses, net of income taxes (11,182) (18,560)
Other comprehensive loss (12,262) (24,852)
Total comprehensive income 242,653$ 261,948$
See accompanying notes

Annual Report 2020 53
9
TOROMONT INDUSTRIES LTD.CONSOLIDATED STATEMENTS OF CASH FLOWS
Years ended December 31 ($ thousands) Note 2020 2019Operating activities
Net earnings 254,915$ 286,800$ Items not requiring cash:
Depreciation and amortization 5,6,7,10 166,307 162,962 Stock-based compensation 5,731 5,730 Post-employment obligations 8,530 (3,889) Deferred income taxes (2,919) 26,757 Gain on sale of rental equipment and property, plant and equipment (22,380) (22,120)
410,184 456,240 Net change in non-cash working capital and other 21 (10,096) (156,820) Additions to rental equipment (103,515) (212,176) Proceeds on disposal of rental equipment 52,455 58,786
Cash provided by operating activities 349,028 146,030
Investing activitiesAdditions to property, plant and equipment (43,290) (57,202) Proceeds on disposal of property, plant and equipment 10,924 737 Increase in other assets (187) (93)
Cash used in investing activities (32,553) (56,558)
Financing activitiesRepayment of senior debentures - (1,022) Debt issuance costs (338) - Dividends paid 11 (98,531) (84,790) Cash received on exercise of stock options 22,373 26,726 Shares purchased for cancellation 11 (4,043) - Payment of lease liabilities (10,339) (10,087)
Cash used in financing activities (90,878) (69,173)
Effect of currency translation on cash balances (58) (144) Increase in cash during the year 225,539 20,155 Cash, at beginning of year 365,589 345,434 Cash, at end of year 591,128$ 365,589$
Supplemental cash flow information (note 21)See accompanying notes

54 Toromont Industries Ltd.
10
TOROMONT INDUSTRIES LTD.CONSOLIDATED STATEMENTS OF CHANGES IN SHAREHOLDERS' EQUITY
($ thousands, except share numbers) Number AmountContributed
surplusRetained earnings
Foreign currency
translation adjustments
Cash flow hedges Total
Total shareholders'
equityAs at January 1, 2019 81,226,383 457,800$ 12,879$ 851,049$ 2,700$ 3,251$ 5,951$ 1,327,679$ Net earnings - - - 286,800 - - - 286,800 Other comprehensive loss - - - (18,560) (481) (5,811) (6,292) (24,852) Total comprehensive income (loss) - - - 268,240 (481) (5,811) (6,292) 261,948 Exercise of stock options 786,065 32,247 (5,521) - - - - 26,726 Stock-based compensation expense - - 5,730 - - - - 5,730 Effect of stock compensation plans 786,065 32,247 209 - - - - 32,456 Dividends declared - - - (88,192) - - - (88,192) As at December 31, 2019 82,012,448 490,047$ 13,088$ 1,031,097$ 2,219$ (2,560)$ (341)$ 1,533,891$ Net earnings - - - 254,915 - - - 254,915 Other comprehensive loss - - - (11,182) (339) (741) (1,080) (12,262) Total comprehensive income (loss) - - - 243,733 (339) (741) (1,080) 242,653 Exercise of stock options 530,010 26,949 (4,576) - - - - 22,373 Stock-based compensation expense - - 5,731 - - - - 5,731 Effect of stock compensation plans 530,010 26,949 1,155 - - - - 28,104 Shares purchased for cancellation (67,800) (405) - (3,638) - - - (4,043) Dividends declared - - - (101,953) - - - (101,953) As at December 31, 2020 82,474,658 516,591$ 14,243$ 1,169,239$ 1,880$ (3,301)$ (1,421)$ 1,698,652$
See accompanying notes
Accumulated other comprehensive income (loss)Share capital
TOROMONT INDUSTRIES LTD.CONSOLIDATED STATEMENTS OF CHANGES IN SHAREHOLDERS' EQUITY
($ thousands, except share numbers) Number AmountContributed
surplusRetained earnings
As at January 1, 2019 81,226,383 457,800$ 12,879$ 851,049$ Net earnings - - - 286,800 Other comprehensive loss - - - (18,560) Total comprehensive income (loss) - - - 268,240 Exercise of stock options 786,065 32,247 (5,521) -
Stock-based compensation expense - - 5,730 - Effect of stock compensation plans 786,065 32,247 209 - Shares purchased for cancellation - - - - Dividends declared - - - (88,192) As at December 31, 2019 82,012,448 490,047$ 13,088$ 1,031,097$ Net earnings - - - 254,915 Other comprehensive loss - - - (11,182) Total comprehensive income (loss) - - - 243,733 Exercise of stock options 530,010 26,949 (4,576) -
Stock-based compensation expense - - 5,731 - Effect of stock compensation plans 530,010 26,949 1,155 - Shares purchased for cancellation (67,800) (405) - (3,638) Dividends declared - - - (101,953) As at December 31, 2020 82,474,658 516,591$ 14,243$ 1,169,239$
See accompanying notes
Share capitalAccumulated other
Foreign currency
translation adjustments
Cash flow hedges Total
Total shareholders'
equity2,700$ 3,251$ 5,951$ 1,327,679$
- - - 286,800 (481) (5,811) (6,292) (24,852) (481) (5,811) (6,292) 261,948
- - - 26,726
- - - 5,730 - - - 32,456 - - - - - - - (88,192)
2,219$ (2,560)$ (341)$ 1,533,891$ - - - 254,915
(339) (741) (1,080) (12,262) (339) (741) (1,080) 242,653
- - - 22,373
- - - 5,731 - - - 28,104 - - - (4,043) - - - (101,953)
1,880$ (3,301)$ (1,421)$ 1,698,652$
comprehensive income (loss)
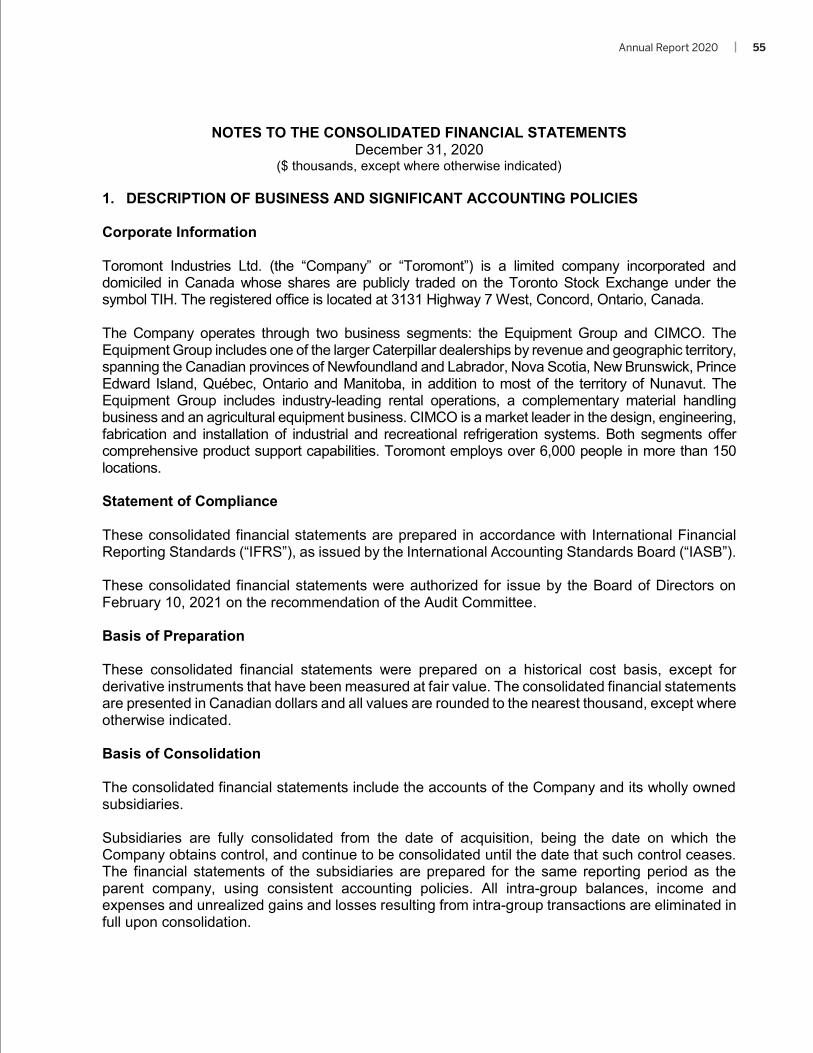
Annual Report 2020 55
11
NOTES TO THE CONSOLIDATED FINANCIAL STATEMENTS December 31, 2020
($ thousands, except where otherwise indicated) 1. DESCRIPTION OF BUSINESS AND SIGNIFICANT ACCOUNTING POLICIES Corporate Information Toromont Industries Ltd. (the “Company” or “Toromont”) is a limited company incorporated and domiciled in Canada whose shares are publicly traded on the Toronto Stock Exchange under the symbol TIH. The registered office is located at 3131 Highway 7 West, Concord, Ontario, Canada. The Company operates through two business segments: the Equipment Group and CIMCO. The Equipment Group includes one of the larger Caterpillar dealerships by revenue and geographic territory, spanning the Canadian provinces of Newfoundland and Labrador, Nova Scotia, New Brunswick, Prince Edward Island, Québec, Ontario and Manitoba, in addition to most of the territory of Nunavut. The Equipment Group includes industry-leading rental operations, a complementary material handling business and an agricultural equipment business. CIMCO is a market leader in the design, engineering, fabrication and installation of industrial and recreational refrigeration systems. Both segments offer comprehensive product support capabilities. Toromont employs over 6,000 people in more than 150 locations. Statement of Compliance These consolidated financial statements are prepared in accordance with International Financial Reporting Standards (“IFRS”), as issued by the International Accounting Standards Board (“IASB”). These consolidated financial statements were authorized for issue by the Board of Directors on February 10, 2021 on the recommendation of the Audit Committee. Basis of Preparation These consolidated financial statements were prepared on a historical cost basis, except for derivative instruments that have been measured at fair value. The consolidated financial statements are presented in Canadian dollars and all values are rounded to the nearest thousand, except where otherwise indicated. Basis of Consolidation The consolidated financial statements include the accounts of the Company and its wholly owned subsidiaries. Subsidiaries are fully consolidated from the date of acquisition, being the date on which the Company obtains control, and continue to be consolidated until the date that such control ceases. The financial statements of the subsidiaries are prepared for the same reporting period as the parent company, using consistent accounting policies. All intra-group balances, income and expenses and unrealized gains and losses resulting from intra-group transactions are eliminated in full upon consolidation.

56 Toromont Industries Ltd.
12 Notes to the Consolidated Financial Statements for the year ended December 31, 2020
Business Combinations and Goodwill When determining the nature of an acquisition, as either a business combination or an asset acquisition, management defines a business as “an integrated set of activities and assets that is capable of being conducted and managed for the purpose of providing a return in the form of dividends, lower costs or other economic benefits directly to investors or other owners, members or participants.” An integrated set of activities and assets requires inputs and processes applied to those inputs, which together, are or will be used to create outputs. However, a business need not include all of the inputs or processes that the seller used in operating that business if the Company is capable of acquiring the business and continuing to produce outputs, for example, by integrating the business with their own inputs and processes. If the transaction does not meet the criteria of a business, it is accounted for as an asset acquisition. Business combinations are accounted for using the acquisition method. The cost of an acquisition is measured as the aggregate of consideration transferred, measured at acquisition date fair value. Acquisition costs are expensed as incurred. Goodwill is initially measured at cost, being the excess of the cost of the business combination over the Company’s share in the net fair value of the acquiree’s identifiable assets, liabilities and contingent liabilities. If the cost of acquisition is less than the fair value of the net assets of the subsidiary acquired, the difference is recognized directly in the consolidated income statements. After initial recognition, goodwill is measured at cost less any accumulated impairment losses. For the purpose of impairment testing, goodwill acquired in a business combination is, from the acquisition date, allocated to each of the Company’s cash-generating units (“CGUs”) that are expected to benefit from the synergies of the combination, irrespective of whether other assets or liabilities of the acquiree are assigned to those units. Where goodwill forms part of a CGU and part of the operation within that unit is disposed of, the goodwill associated with the operation disposed of is included in the carrying amount of the operation when determining the gain or loss on disposal of the operation. Goodwill disposed of in this circumstance is measured based on the relative fair values of the operation disposed of and the portion of the CGU retained. Cash and Cash Equivalents Cash consists of petty cash and demand deposits. Cash equivalents, when applicable, consist of short-term deposits with an original maturity of three months or less. Accounts Receivable Trade accounts receivable are amounts due from customers for merchandise sold or services performed in the ordinary course of business. If collection is expected in one year or less (or in the normal operating cycle of the business, if longer), they are classified as current assets. If not, they are presented as non-current assets. Trade accounts receivable are recognized initially at amounts due, net of impairment for estimated expected credit loss (allowance for doubtful accounts). The expense relating to expected credit loss is included within selling and administrative expenses in the consolidated income statements. Unbilled receivables represent contract assets related to the Company’s rights to consideration for work completed but not billed as at the reporting date on the sale of power and energy systems and refrigeration packages. These are transferred to receivables when the entitlement to payment becomes unconditional.

Annual Report 2020 57
13 Notes to the Consolidated Financial Statements for the year ended December 31, 2020
Inventories Inventories are valued at the lower of cost and net realizable value. Cost of equipment, repair and distribution parts and direct materials include purchase cost and costs incurred in bringing each product to its present location and condition. Serialized inventory is determined on a specific-item basis. Non-serialized inventory is determined based on a weighted average actual cost. Cost of work-in-process includes cost of direct materials, labour and an allocation of manufacturing overheads, excluding borrowing costs, based on normal operating capacity. Cost of work-in-process (contracts) are costs specifically chargeable to customers that are deferred in inventories and are probable of recovery. Cost of inventories includes the transfer of gains and losses on qualifying cash flow hedges, recognized in other comprehensive income (loss), in respect of the purchase of inventory. Net realizable value is the estimated selling price in the ordinary course of business, less estimated costs of completion and the estimated costs necessary to make the sale. Property, Plant and Equipment Property, plant and equipment are recorded at cost, net of accumulated depreciation and accumulated impairment losses, if any. Depreciation is recognized principally on a straight-line basis over the estimated useful lives of the assets. Estimated useful lives range from 20 to 30 years for buildings, 3 to 10 years for equipment and 20 years for power generation assets. Leasehold improvements are amortized on a straight-line basis over the term of the lease. Land is not depreciated. The assets’ residual values, useful lives and methods of depreciation are reviewed at each financial year-end and adjusted prospectively, if appropriate. Rental Equipment Rental equipment is recorded at cost, net of accumulated depreciation and any impairment losses. Cost is determined on a specific-item basis. Rental equipment is depreciated to its estimated residual value over its estimated useful life on a straight-line basis, which ranges from 1 to 10 years. The assets’ residual values, useful lives and methods of depreciation are reviewed at each financial year-end and adjusted prospectively, if appropriate. Intangible Assets Intangible assets acquired separately are measured on initial recognition at cost. Intangible assets acquired as part of a business acquisition are initially recorded at the acquisition date fair value. Following initial recognition, intangible assets are carried at cost less any accumulated amortization and accumulated impairment losses, as applicable. Intangible assets with a finite useful life are amortized over their estimated useful lives and are assessed for impairment whenever there is an indication that the intangible assets may be impaired.

58 Toromont Industries Ltd.
14 Notes to the Consolidated Financial Statements for the year ended December 31, 2020
The amortization period and the amortization method for intangible assets with finite useful lives are reviewed at least at the end of each reporting period. Amortization is recorded as follows:
Customer Relationships – 8 years, straight-line ERP System – 5 years, straight-line Customer Order Backlog – specific basis Patents and Licenses – remaining life, straight-line
Intangible assets with indefinite useful lives are not amortized, but are tested for impairment annually or when indicators of impairment are present. Distribution networks are considered to have an indefinite life based on the terms of the distribution rights contracts. The assessment of indefinite life is reviewed annually to determine whether the indefinite life continues to be supportable. Provisions Provisions are recognized when the Company has a present obligation, legal or constructive, as a result of a past event, it is probable that an outflow of resources embodying economic benefits will be required to settle the obligation and a reliable estimate can be made of the amount of the obligation. Provisions for warranty costs are recognized when the product is sold or service provided. Initial recognition is based on historical experience. Government Grants Government grants are recognized when there is reasonable assurance that the grant will be received and all conditions associated with the grant are met. Claims under income-related government grants are reported in the consolidated income statements as other income included in selling and administrative expenses. Government grants receivable are recorded in accounts receivable on the consolidated statements of financial position. Financial Instruments Financial assets and liabilities are recognized when the entity becomes a party to the contractual provisions of the instrument. The Company determines the classification of its financial assets and liabilities at initial recognition or when reclassified on the consolidated statements of financial position. Financial assets and liabilities are classified in the following measurement categories: (i) amortized cost; (ii) fair value through other comprehensive income (loss); or (iii) fair value through profit usually, or loss (“FVTPL”). Initially, all financial assets and liabilities are recognized at fair value. Regular-way trades of financial assets and liabilities are recognized on the trade date. Transaction costs are expensed as incurred, except for loans and receivables and loans and borrowings, in which case transaction costs are included in the initial cost. Financial Assets Subsequent measurement of financial assets depends on the classification. The Company has made the following classifications:
Cash is classified as held for trading and as such is measured at fair value, with changes in fair value being included in profit or loss.
Accounts receivable are classified as loans and receivables and are recorded at amortized cost using the effective interest rate method, less provisions for doubtful accounts.

Annual Report 2020 59
15 Notes to the Consolidated Financial Statements for the year ended December 31, 2020
The Company assesses, as at each consolidated statement of financial position date, whether there is any objective evidence that a financial asset or a group of financial assets is impaired. Financial Liabilities All financial liabilities are subsequently measured at amortized cost using the effective interest rate method or at FVTPL. Financial liabilities are classified as FVTPL when the financial liability is: (i) contingent consideration of an acquirer in a business combination; (ii) held for trading; or (iii) it is designated as FVTPL. For financial liabilities that are designated as FVTPL, the amount of change in the fair value of the financial liability that is attributable to changes in the credit risk of that liability is recognized in other comprehensive income (loss) (“OCI”), unless the recognition of the effects of changes in the liability’s credit risk in OCI would create or enlarge an accounting mismatch in the consolidated income statements. The remaining amount of change in the fair value of liability is recognized in the consolidated income statements. Changes in fair value attributable to a financial liability’s credit risk that are recognized in OCI are not subsequently reclassified to the consolidated income statements; instead, they are transferred to retained earnings upon derecognition of the financial liability. Financial liabilities that are not: (i) contingent consideration of an acquirer in a business combination; (ii) held for trading; or (iii) are designated as FVTPL, are subsequently measured at amortized cost using the effective interest rate method. Derivatives Derivative assets and liabilities are classified as held for trading and are measured at fair value with changes in fair value being included in profit or loss, unless they are designated as hedging instruments, in which case changes in fair value are included in OCI. Fair Value of Financial Instruments The Company uses the following hierarchy for determining and disclosing the fair value of financial instruments by valuation technique:
Level 1 – unadjusted quoted prices in active markets for identical assets or liabilities. Level 2 – other techniques for which all inputs that have a significant effect on the recorded
fair value are observable, either directly or indirectly. Level 3 – techniques that use inputs that have a significant effect on the recorded fair value
that are not based on observable market data. Impairment of Financial Assets Financial assets classified as amortized cost are assessed for impairment at the end of each reporting period and a loss allowance is measured by estimating the lifetime expected credit losses. Certain categories of financial assets, such as trade receivables, that are considered not to be impaired individually are also assessed for impairment on a collective basis. A financial asset is considered in default when contractual payments are 90 days past due. A financial asset may also be considered to be in default if internal or external information indicates that the Company is unlikely to receive the outstanding contractual amounts in full before taking

60 Toromont Industries Ltd.
16 Notes to the Consolidated Financial Statements for the year ended December 31, 2020
into account any credit enhancements held. A financial asset is written off when there is no reasonable expectation of recovering the contractual cash flows. Derivative Financial Instruments and Hedge Accounting Derivative financial arrangements are used to hedge exposure to fluctuations in exchange rates. Such derivative financial instruments are initially recognized at fair value on the date on which a derivative contract is entered into and are subsequently measured at fair value. Derivatives are carried as financial assets when the fair value is positive and as financial liabilities when the fair value is negative. At inception, the Company designates and documents the hedge relationship, including identification of the transaction and the risk management objectives and strategy for undertaking the hedge. The Company also documents its assessment, both at hedge inception and on an ongoing basis, of whether the derivatives that are used in hedging transactions are highly effective in offsetting changes in cash flows of hedged items. The Company has designated certain derivatives as cash flow hedges. These are hedges of firm commitments and highly probable forecast transactions. The effective portion of changes in the fair value of derivatives that are designated as a cash flow hedge is recognized in OCI. The gain or loss relating to the ineffective portion is recognized immediately in the consolidated income statements. Additionally:
If a hedge of a forecast transaction subsequently results in the recognition of a non-financial asset, the associated gains or losses that were recognized in OCI are included in the initial cost or other carrying amount of the asset;
For cash flow hedges other than those identified above, amounts accumulated in OCI are recycled to the consolidated income statements in the period when the hedged item will affect earnings (for instance, when the forecast sale that is hedged takes place);
When a hedging instrument expires or is sold, or when a hedge no longer meets the criteria for hedge accounting, any cumulative gain or loss in OCI remains in OCI and is recognized when the forecast transaction is ultimately recognized in the consolidated income statements; and
When a forecast transaction is no longer expected to occur, the cumulative gain or loss that was reported in OCI is immediately recognized in the consolidated income statements.
Impairment of Non-financial Assets The Company assesses whether goodwill or intangible assets with indefinite lives may be impaired annually during the fourth quarter, or when indicators of impairment are present. For the purpose of impairment testing, goodwill arising from acquisitions is allocated to each of the Company’s CGUs or group of CGUs expected to benefit from the acquisition. The level at which goodwill is allocated represents the lowest level at which goodwill is monitored for internal management purposes, and is not higher than an operating segment. Intangible assets with indefinite lives that do not have separate identifiable cash flows are also allocated to CGUs or a group of CGUs. Any potential impairment of goodwill or intangible assets is identified by comparing the recoverable amount of a CGU or a group of CGUs to its carrying value. The recoverable amount is the higher of its fair value less costs to sell and its value-in-use. If the recoverable amount is less than the carrying amount, then the impairment loss is allocated first to reduce the carrying amount of any goodwill and then to the other assets pro-rata on the basis of the carrying amount of each asset. In determining fair value less costs to sell, recent market transactions are taken into account, if available. In assessing value-in-use, the estimated future cash flows are discounted to their present value using a pre-tax discount rate that reflects current market assessments of the time value of

Annual Report 2020 61
17 Notes to the Consolidated Financial Statements for the year ended December 31, 2020
money and the risks specific to the asset. Impairment losses are recognized in the consolidated income statements. For non-financial assets other than goodwill and intangible assets with indefinite lives, an assessment is made at each reporting date whether there is any indication of impairment, or that previously recognized impairment losses may no longer exist or may have decreased. If such indication exists, the Company estimates the asset’s recoverable amount. An impairment loss is recognized for the amount by which the asset’s carrying amount exceeds its recoverable amount. A previously recognized impairment loss is reversed only if there has been a change in the assumptions used to determine the asset’s recoverable amount since the last impairment loss was recognized. The reversal is limited so that the carrying amount of the asset does not exceed its recoverable amount, nor exceed the carrying amount that would have been determined, net of depreciation, had no impairment loss been recognized for the asset in prior years. Such reversal is recognized in the consolidated income statements. Revenue from Contracts with Customers Revenue from contracts with customers is recognized when control of the goods or services are transferred to the customer at an amount that reflects the consideration to which the Company expects to be entitled in exchange for those goods or services.
Sale of Equipment – Revenue is recognized when control of the equipment has been transferred to the customer. This usually occurs when the equipment is delivered or picked-up by the customer. The transaction price is documented on the sales invoice and agreed to by the customer. Payment is generally due at the time of delivery, as such, a receivable is recognized as the consideration is unconditional and only the passage of time is required before payment is due. In certain situations, control transfers to the customer through a bill and hold arrangement when the following criteria are met: (i) there is a substantive reason for the arrangement; (ii) the equipment is separately identified as belonging to the customer; (iii) Toromont is no longer able to use the equipment or direct it to another customer; and (iv) the equipment is currently ready for physical transfer to the customer.
Sale of Equipment with a Guaranteed Residual Value or Repurchase Commitment – The sale of equipment for which the Company has provided a guarantee to repurchase the equipment at a predetermined residual value and date is accounted for as an operating lease in accordance with IFRS 16 – Leases (“IFRS 16”). Revenue is therefore recognized over the period extending to the date of the residual guarantee.
Sale of Systems – The Company sells systems, including power and energy facilities and industrial and recreational refrigeration systems, which involve the design, manufacture, installation and commissioning of longer-term projects under the customer’s control and can span from three months to one year. Revenue is recognized progressively based on the percentage-of-completion method. This method is normally measured by reference to costs incurred to date as a percentage of the total estimated costs as outlined in the contract. Payment terms are usually based on set milestones outlined in the contract. Periodically: (i) amounts are received in advance of the associated contract work being performed - these amounts are recorded as deferred revenues and contract liabilities; and (ii) revenue is recognized without issuing an invoice – this entitlement to consideration is recognized as unbilled receivables. Any foreseeable losses on such projects are recognized immediately in profit or loss as identified.
Equipment Rentals – Revenue is accounted for in accordance with IFRS 16. Revenue is recognized on a straight-line basis over the term of the agreement. Payment terms are generally 30 days from invoicing.
Product Support Services – Revenue from product support services includes the sale of parts and performance of service work on equipment. For the sale of parts, revenue is

62 Toromont Industries Ltd.
18 Notes to the Consolidated Financial Statements for the year ended December 31, 2020
recognized when the part is shipped or picked-up by the customer. For the servicing of equipment, revenue on both the labour and parts used in performing the work is recognized when the job is completed. Payment terms are generally 30 days from invoicing.
Long-term Maintenance Contracts – Long-term maintenance contracts generally range from one to five years and are customer-specific. These contracts are sold either separately or bundled together with the sale of equipment to a customer. These arrangements cover a range of services from regular maintenance to major repairs. The Company has concluded that these are two separate performance obligations as each of the promises to transfer equipment and provide services is capable of being distinct and separately identifiable. If the sales are bundled, the Company allocates a portion of the transaction price based on the relative stand-alone selling price to each performance obligation. Customers are invoiced on a periodic basis reflecting the terms of the agreement, generally based on machine hours, with payment terms of 30 days from invoicing. These amounts are recognized as deferred revenues and contract liabilities. Revenue is recognized as work is performed under the contract based on standard or contract rates. Revenue from maintenance services is recognized over time, using an input method to measure progress towards complete satisfaction of the service.
Extended Warranty – Extended warranty may be purchased by a customer at time of purchase of a machine to provide additional warranty coverage beyond the initial one-year standard warranty covered by the supplier. Extended warranty generally covers specified components for a term from three to five years. Extended warranty is normally invoiced at time of purchase and payment is expected at time of invoicing. These billings are included in deferred revenues and contract liabilities. The Company recognizes revenue for extended warranty as work is performed under the extended warranty contract using standard rates.
Power Generation – The Company owns and operates power generation plants that sell electricity and thermal power. Revenue is recognized monthly based on set rates as power is consumed. Payment is due within 30 days of invoicing.
Consideration is given whether there are other promises in a contract with a customer that are separate performance obligations to which a portion of the transaction price needs to be allocated. In determining the transaction price for the sale of equipment, variable consideration, the existence of significant financing components, non-cash consideration, and consideration payable to the customer (if any) are considered. Leases The Company assesses at contract inception whether a contract is, or contains, a lease, that is, if the contract conveys the right to control the use of an identified asset for a period of time in exchange for consideration. Toromont as Lessee A single recognition and measurement approach is applied for all leases, except for short-term leases and leases of low-value assets. Right-of-use assets representing the right to use the underlying assets and lease liabilities representing lease payments are recognized. Right-of-use assets Right-of-use assets are recognized at the commencement date of the lease (i.e., the date the underlying asset is available for use) and are measured at cost, less any accumulated depreciation and impairment losses. The cost of right-of-use assets includes the amount of lease liabilities recognized, initial direct costs incurred, and lease payments made at or before the commencement date, less any lease incentives received. Unless the Company is reasonably certain to obtain

Annual Report 2020 63
19 Notes to the Consolidated Financial Statements for the year ended December 31, 2020
ownership of the leased asset at the end of the lease term, the recognized right-of-use assets are depreciated on a straight-line basis over the shorter of its estimated useful life and the lease term, which ranges from three to five years for vehicles and 1 to 15 years for properties. Right-of-use assets are subject to impairment. Lease liabilities
At the commencement date of the lease, lease liabilities are recognized and measured at the present value of lease payments to be made over the lease term. The lease payments include fixed payments less any lease incentives receivable, variable lease payments that depend on an index or a rate, and amounts expected to be paid under residual value guarantees. The interest rate implicit in the lease is used, if readily determinable, to calculate the present value of lease payments. If not readily determinable, the Company’s incremental borrowing rate at the lease commencement date is used in the present value calculation. After the commencement date, the amount of lease liabilities is reduced by the lease payments made. In addition, the carrying amount of lease liabilities is remeasured if there is a modification, a change in the lease term, a change in the in-substance fixed lease payments or a change in the assessment to purchase the underlying asset. Short-term leases and leases of low-value assets
The short-term lease recognition exemption is applied to leases that have a lease term of 12 months or less from the commencement date and do not contain a purchase option. It also applies the recognition exemption for leases that are considered of low value. Lease payments on short-term leases and leases of low-value assets are recognized as an expense on a straight-line basis over the lease term. Toromont as Lessor Leases in which the Company does not transfer substantially all the risks and rewards incidental to ownership of an asset are classified as operating leases. Rental income arising is recognized on a straight-line basis over the lease terms and is included in the consolidated income statement. Initial direct costs incurred in negotiating and arranging an operating lease are added to the carrying amount of the leased asset and recognized over the lease term on the same basis as rental income. Foreign Currency Translation The functional and presentation currency of the Company is the Canadian dollar. Each of the Company’s subsidiaries determines its functional currency. Transactions in foreign currencies are initially recorded at the functional currency rate prevailing as at the date of the transaction or at the average rate for the period when this is a reasonable approximation. Monetary assets and liabilities denominated in foreign currencies are retranslated at the functional currency spot rate of exchange as at the reporting date. All differences are taken directly to profit or loss. Non-monetary items that are measured in terms of historical cost in a foreign currency are translated using the exchange rates as at the dates of the initial transactions. The assets and liabilities of foreign operations (having a functional currency other than the Canadian dollar) are translated into Canadian dollars at the rate of exchange prevailing at the consolidated statement of financial position dates and the consolidated income statements are translated at the average exchange rate for the period. The exchange differences arising on translation are recognized in accumulated other comprehensive income (loss) in shareholders’
64 Toromont Industries Ltd.
20 Notes to the Consolidated Financial Statements for the year ended December 31, 2020
equity. On disposal of a foreign operation, the deferred cumulative amount recognized in equity is recognized in the consolidated income statements. Share-based Payment Transactions The Company maintains both equity-settled and cash-settled share-based compensation plans under which the Company receives services from employees, including senior executives and directors, as consideration for equity instruments of the Company. For equity-settled plans, expense is based on the fair value of the awards granted determined using the Black-Scholes option pricing model and the best estimate of the number of equity instruments that will ultimately vest. For awards with graded vesting, each tranche is considered to be a separate grant based on its respective vesting period. The fair value of each tranche is determined separately on the date of the grant and is recognized as stock-based compensation expense, net of forfeiture estimate, over its respective vesting period. For cash-settled plans, the expense is determined based on the fair value of the liability incurred at each award date. The fair value of the liability is measured by applying quoted market prices. Changes in fair value are recognized in the consolidated income statements in selling and administrative expenses. Employee Future Benefits For defined contribution plans, the pension expense recorded in the consolidated income statement is the amount of the contributions the Company is required to pay in accordance with the terms of the plans. For defined benefit pension plans and other post-employment benefit plans, the expense is determined separately for each plan using the following policies:
The cost of future benefits earned by employees is actuarially determined using the projected unit credit method prorated on length of service and management’s best estimate assumptions using a measurement date of December 31;
Net interest is calculated by applying the discount rate to the net defined benefit liability or asset;
Past service costs from plan amendments are recognized immediately in net earnings to the extent that the benefits have vested; otherwise, they are amortized on a straight-line basis over the vesting period; and
Actuarial gains and losses arising from experience adjustments and changes in actuarial assumptions are recognized in retained earnings and included in the consolidated statements of comprehensive income in the period in which they occur.
Income Taxes Current income tax assets and liabilities are measured at the amount expected to be recovered from or paid to taxation authorities. Deferred income taxes are provided for, using the liability method on temporary differences between the tax bases of assets and liabilities and their carrying amounts for financial reporting purposes at the reporting date. Deferred tax assets and liabilities are measured using enacted or substantively enacted income tax rates expected to apply to taxable income in the years in which those temporary differences are expected to be recovered or settled. The effect on deferred tax assets and liabilities of a change in income tax rates is recognized in the consolidated income

Annual Report 2020 65
21 Notes to the Consolidated Financial Statements for the year ended December 31, 2020
statements in the period that includes the date of substantive enactment. The Company assesses recoverability of deferred tax assets based on the Company’s estimates and assumptions. Deferred tax assets are recorded at an amount that the Company considers probable to be realized. Current and deferred income taxes, relating to items recognized directly in shareholders’ equity, are also recognized directly in shareholders’ equity. Borrowing Costs Borrowing costs directly attributable to the acquisition, construction or production of an asset that necessarily takes a substantial period of time to get ready for its intended use or sale are capitalized as part of the cost of the respective asset. All other borrowing costs are expensed in the period they occur. Standards Adopted in 2020 The Company has not early-adopted any other standard, interpretation or amendment that has been issued but is not yet effective. Amendments Issued but Not Effective A number of amendments to standards have been issued but are not yet effective for the financial year ended December 31, 2020, and accordingly, have not been applied in preparing these consolidated financial statements. The Company reviewed these amendments and concluded that there would be no impact on adoption given their nature and applicability. 2. SIGNIFICANT ACCOUNTING ESTIMATES AND ASSUMPTIONS The preparation of the Company’s consolidated financial statements in conformity with IFRS requires management to make judgments, estimates and assumptions that affect the reported amounts of revenue, expenses, assets and liabilities, and the disclosure of contingent liabilities at the end of the reporting period. However, uncertainty about these assumptions and estimates could result in outcomes that require a material adjustment to the carrying amount of the asset or liability affected in future periods. In making estimates and judgments, management relies on external information and observable conditions where possible, supplemented by internal analysis as required. Management reviews its estimates and judgments on an ongoing basis. The outbreak of COVID-19 as a pandemic has resulted in a series of public health and emergency measures that have been put in place to combat the spread of the virus. The duration and impact of the pandemic is unknown at this time and it is not possible to reliably estimate the impact that the length and severity of the pandemic will have on the financial results and the condition of the Company in future periods. In the process of applying the Company’s accounting policies, management has made the following judgments, estimates and assumptions that have the most significant effect on the amounts recognized in the consolidated financial statements.

66 Toromont Industries Ltd.
22 Notes to the Consolidated Financial Statements for the year ended December 31, 2020
Sale of Power and Energy Systems and Refrigeration Packages Revenue is recognized over time for the sale of power and energy systems and refrigeration packages. Because of the control transferring over time, revenue is recognized based on the extent of progress towards completion of the performance obligation. The selection of the method to measure progress towards completion requires judgment and is based on the nature of the products and services to be provided. The percentage-of-completion method is used as the measure of progress for these contracts as it best depicts the transfer of assets to the customer, which occurs as costs are incurred on the contracts. Under the percentage-of-completion method, the extent of progress towards completion is measured based on the ratio of costs incurred to date to the total estimated costs of completion of the performance obligation. Revenue is recorded proportionally as costs are incurred. Costs to fulfill include labour, materials and subcontractors’ costs, other direct costs, and an allocation of indirect costs. This method requires management to make a number of estimates and assumptions about the expected profitability of the contract. These factors are routinely reviewed as part of the project management process. Long-term Maintenance Contracts These contracts typically have fixed prices based on either machine hours or cost per hour, with provisions for inflationary and exchange adjustments. Revenue is recognized as work is performed under the contract based on standard or contract rates. Revenue from maintenance services is recognized over time, using an input method to measure progress towards complete satisfaction of the service. Management makes a number of estimates and assumptions surrounding machine usage, machine performance, future parts and labour pricing, manufacturers’ warranty coverage and other detailed factors. These factors are routinely reviewed as part of the project management process. Property, Plant and Equipment and Rental Equipment Depreciation is calculated based on the estimated useful lives of the assets and estimated residual values. Depreciation expense is sensitive to the estimated service lives and residual values determined for each type of asset. Actual lives and residual values may vary depending on a number of factors including technological innovation, product life cycles and physical condition of the asset, prospective use, and maintenance programs. Impairment of Non-financial Assets Judgment is used in identifying an appropriate discount rate and growth rate for the calculations required in assessing potential impairment of non-financial assets. Judgment is also used in identifying the CGUs to which the intangible assets should be allocated, and the CGU or group of CGUs at which goodwill is monitored for internal management purposes. The impairment calculations require the use of estimates related to the future operating results and cash generating ability of the assets. Income Taxes Estimates and judgments are made for uncertainties that exist with respect to the interpretation of complex tax regulations, changes in tax laws, and the amount and timing of future taxable income.

Annual Report 2020 67
23 Notes to the Consolidated Financial Statements for the year ended December 31, 2020
Inventories Management is required to make an assessment of the net realizable value of inventory at each reporting period. These estimates are determined on the basis of age, stock levels, current market prices, current economic trends and past experience in the measurement of net realizable value. Allowance for Doubtful Accounts The Company makes estimates for allowances that represent its estimate of potential losses in respect of trade receivables. The main components of this allowance are a specific loss component that relates to individually significant exposures, and a collective loss component established for groups of similar assets in respect of losses that may have been incurred but not yet specifically identified. The Company’s allowance is determined by historical experiences, and considers factors including the aging of the balances, the customer’s credit worthiness, current economic conditions, expectation of bankruptcies and the economic volatility in the markets/locations of customers. COVID-19 has increased the measurement uncertainty with respect to the determination of the allowance for doubtful accounts. Share-based Compensation The option pricing model used to determine the fair value of share-based payments requires various estimates relating to volatility, interest rates, dividend yields and expected life of the options granted. Fair value inputs are subject to market factors as well as internal estimates. The Company considers historic trends together with any new information to determine the best estimate of fair value at the date of grant. Separate from the fair value calculation, the Company is required to estimate the expected forfeiture rate of equity-settled share-based payments. Post-employment Benefit Plans The Company has defined benefit pension plans and other post-employment benefit plans that provide certain benefits to its employees. Actuarial valuations of these plans are based on assumptions, which include discount rates, retail price inflation, mortality rates, employee turnover and salary escalation rates. Judgment is exercised in setting these assumptions. These assumptions impact the measurement of the net employee benefit obligation, funding levels, the net benefit cost and the actuarial gains and losses recognized in OCI. Leases The lease term is determined as the non-cancellable term of the lease, together with any periods covered by an option to extend the lease if it is reasonably certain to be exercised. The Company applies judgment in evaluating whether it is reasonably certain to exercise the option to renew. All relevant factors that create an economic incentive for it to exercise the renewal are considered. After the commencement date, the lease term is reassessed if there is a significant event or change in circumstances that is within the Company’s control and affects its ability to exercise (or not to exercise) the option to renew. The Company cannot readily determine the interest rate implicit in the lease, therefore, it uses its incremental borrowing rate (“IBR”) to measure lease liabilities. The IBR is a rate of interest that the Company would have to pay to borrow funds, over a similar term and with similar security, in order to obtain an asset of similar value to the right-of-use asset in a similar economic environment. The Company estimates the IBR using observable market interest rates and adjusts for entity-specific estimates, such as credit rating.

68 Toromont Industries Ltd.
24 Notes to the Consolidated Financial Statements for the year ended December 31, 2020
3. ACCOUNTS RECEIVABLE
The aging of gross trade receivables was as follows:
The movement in the Company’s allowance for doubtful accounts were as follows:
The movement in the Company’s unbilled receivables were as follows:
4. INVENTORIES
The amount of inventory recognized as an expense in cost of goods sold (accounted for other than by the percentage-of-completion method) during 2020 was $2.2 billion (2019 - $2.2 billion). In 2020 cost of goods sold included a net reversal of write-downs of $4.0 million. In 2019 cost of goods sold included inventory write-downs pertaining to obsolescence and aging, net of reversal of write-downs of $1.4 million.
2020 2019Trade receivables 485,429$ 491,683$
Less: Allowance for doubtful accounts (20,661) (19,941)Trade receivables, net 464,768 471,742 Unbilled receivables 53,671 26,844 Other receivables 23,141 26,466
541,580$ 525,052$
2020 2019Current to 90 days 461,908$ 458,332$ Over 90 days 23,521 33,351 Trade receivables 485,429$ 491,683$
2020 2019Balance, January 1 19,941$ 19,484$ Provisions and revisions, net 720 457 Balance, December 31 20,661$ 19,941$
2020 2019Balance, January 1 26,844$ 28,738$ Transfer from opening balance to trade receivables (23,597) (27,523) Increase as a result of changes in the measure of progress 50,424 25,629 Balance, December 31 53,671$ 26,844$
2020 2019Equipment 407,240$ 571,134$ Repair and distribution parts 230,877 253,077 Direct materials 5,055 5,057 Work-in-process 53,398 69,915 Work-in-process (contracts) 31,834 13,003
728,404$ 912,186$

Annual Report 2020 69
25 Notes to the Consolidated Financial Statements for the year ended December 31, 2020
5. PROPERTY, PLANT AND EQUIPMENT AND RENTAL EQUIPMENT
During 2020, depreciation expense of $128.6 million was charged to cost of goods sold (2019 - $125.7 million) and $21.2 million was charged to selling and administrative expenses (2019 - $22.4 million). Property, plant and equipment as at December 31, 2020 included $0.5 million (2019 - $5.2 million) related to properties that are available-for-sale. Operating income from rental operations for the year ended December 31, 2020, was $38.4 million (2019 - $53.3 million).
Land Buildings EquipmentPower
Generation
Property, Plant and
EquipmentRental
EquipmentCostJanuary 1, 2020 147,701$ 292,553$ 239,134$ 39,140$ 718,528$ 940,708$ Additions 11,084 8,570 23,493 542 43,689 88,942 Disposals (3,450) (3,803) (17,480) - (24,733) (96,671) Currency translation effects (3) (54) (122) - (179) - December 31, 2020 155,332$ 297,266$ 245,025$ 39,682$ 737,305$ 932,979$
Accumulated depreciationJanuary 1, 2020 -$ 102,140$ 155,098$ 32,763$ 290,001$ 348,305$ Depreciation expense - 13,326 27,707 1,630 42,663 107,122 Depreciation of disposals - (1,231) (17,314) - (18,545) (61,860) Currency translation effects - (9) (87) - (96) - December 31, 2020 -$ 114,226$ 165,404$ 34,393$ 314,023$ 393,567$ Net book value - December 31, 2020 155,332$ 183,040$ 79,621$ 5,289$ 423,282$ 539,412$
Land Buildings EquipmentPower
Generation
Property, Plant and
EquipmentRental
EquipmentCostJanuary 1, 2019 129,699$ 285,795$ 216,679$ 39,054$ 671,227$ 836,035$ Additions 18,071 7,304 30,791 86 56,252 196,011 Disposals (61) (411) (8,047) - (8,519) (91,338) Currency translation effects (8) (135) (289) - (432) - December 31, 2019 147,701$ 292,553$ 239,134$ 39,140$ 718,528$ 940,708$
Accumulated depreciationJanuary 1, 2019 -$ 89,655$ 137,646$ 31,150$ 258,451$ 294,505$ Depreciation expense - 12,796 25,344 1,613 39,753 108,265 Depreciation of disposals - (290) (7,697) - (7,987) (54,465) Currency translation effects - (21) (195) - (216) - December 31, 2019 -$ 102,140$ 155,098$ 32,763$ 290,001$ 348,305$ Net book value - December 31, 2019 147,701$ 190,413$ 84,036$ 6,377$ 428,527$ 592,403$

70 Toromont Industries Ltd.
26 Notes to the Consolidated Financial Statements for the year ended December 31, 2020
6. OTHER ASSETS AND LEASE LIABILITIES
Right-of-use Assets and Lease Liabilities Activity within right-of-use assets and lease liabilities during the year was as follows:
The current portion of lease liabilities as at December 31, 2020 of $9.2 million (2019 - $9.7 million) is included in accounts payable and accrued liabilities on the consolidated statement of financial position. The following amounts were recognized in the consolidated income statements during the year:
Cash outflows for leases in 2020 were $10.3 million (2019 - $10.1 million). The future cash outflows relating to leases are disclosed in note 22.
2020 2019Right-of-use assets 24,967$ 30,975$ Equipment sold with guaranteed residual values 5,304 8,325 Other 2,992 2,805 Other assets 33,263$ 42,105$
Properties Vehicles TotalJanuary 1, 2020 15,655$ 15,320$ 30,975$ 31,423$ Additions and remeasurements 6,017 230 6,247 6,247 Depreciation expense (4,957) (5,711) (10,668) - Disposals and expirations (1,437) (150) (1,587) (1,615) Payments - - - (10,339) December 31, 2020 15,278$ 9,689$ 24,967$ 25,716$
Right-of-use Assets LeaseLiabilities
Properties Vehicles TotalJanuary 1, 2019 18,025$ 15,740$ 33,765$ 33,765$ Additions 2,279 5,466 7,745 7,745 Depreciation expense (4,649) (5,886) (10,535) - Payments - - - (10,087) December 31, 2019 15,655$ 15,320$ 30,975$ 31,423$
Right-of-use Assets LeaseLiabilities
2020 2019Depreciation expense of right-of-use assets 10,668$ 10,535$ Interest expense on lease liabilities 905 991 Expense relating to short-term leases and leases of low-value assets 176 223
11,749$ 11,749$

Annual Report 2020 71
27 Notes to the Consolidated Financial Statements for the year ended December 31, 2020
7. GOODWILL AND INTANGIBLE ASSETS
Goodwill The carrying amount of goodwill has been allocated as follows:
The Company performed the annual impairment test as at December 31, 2020. The recoverable amounts have been determined based on the fair value less costs to sell (FVLCS) based on a range of relevant historical company and current market multiples of earnings, applied to current earnings. As a result of the analysis, management determined there was no impairment of goodwill. Intangible Assets with Indefinite Lives – Distribution Networks The carrying amount distribution networks has been allocated to the following CGUs and/or group of CGUs:
The Company performed the annual impairment test of intangible assets as at December 31, 2020. The recoverable amounts have been determined based on FVLCS based on a range of relevant historical company and current market multiples of earnings, applied to current earnings, adjusted
Patents and
Licenses
Customer Order
BacklogERP
SystemCustomer
RelationshipsDistribution Networks Goodwill Total
CostJanuary 1, 2019 500$ 8,691$ 5,000$ 15,137$ 371,551$ 93,780$ 494,659$ December 31, 2019 500$ 8,691$ 5,000$ 15,137$ 371,551$ 93,780$ 494,659$ December 31, 2020 500$ 8,691$ 5,000$ 15,137$ 371,551$ 93,780$ 494,659$
Accumulated amortizationJanuary 1, 2019 176$ 4,642$ 1,333$ 2,199$ -$ -$ 8,350$ Amortization expense 30 556 1,000 1,892 - - 3,478 December 31, 2019 206$ 5,198$ 2,333$ 4,091$ -$ -$ 11,828$ Amortization expense 30 722 2,000 1,892 - - 4,644 December 31, 2020 236$ 5,920$ 4,333$ 5,983$ -$ -$ 16,472$
Net book value -December 31, 2019 294$ 3,493$ 2,667$ 11,046$ 371,551$ 93,780$ 482,831$ December 31, 2020 264$ 2,771$ 667$ 9,154$ 371,551$ 93,780$ 478,187$
2020 2019Equipment Group Toromont Cat 89,270$ 89,270$ Battlefield Equipment Rentals 4,060 4,060 CIMCO 450 450
93,780$ 93,780$
2020 2019Equipment Group Toromont Cat - Quebec/Maritimes 352,434$ 352,434$ Toromont Cat - all other locations 13,669 13,669 Battlefield Equipment Rentals - Quebec/Maritimes 5,448 5,448
371,551$ 371,551$
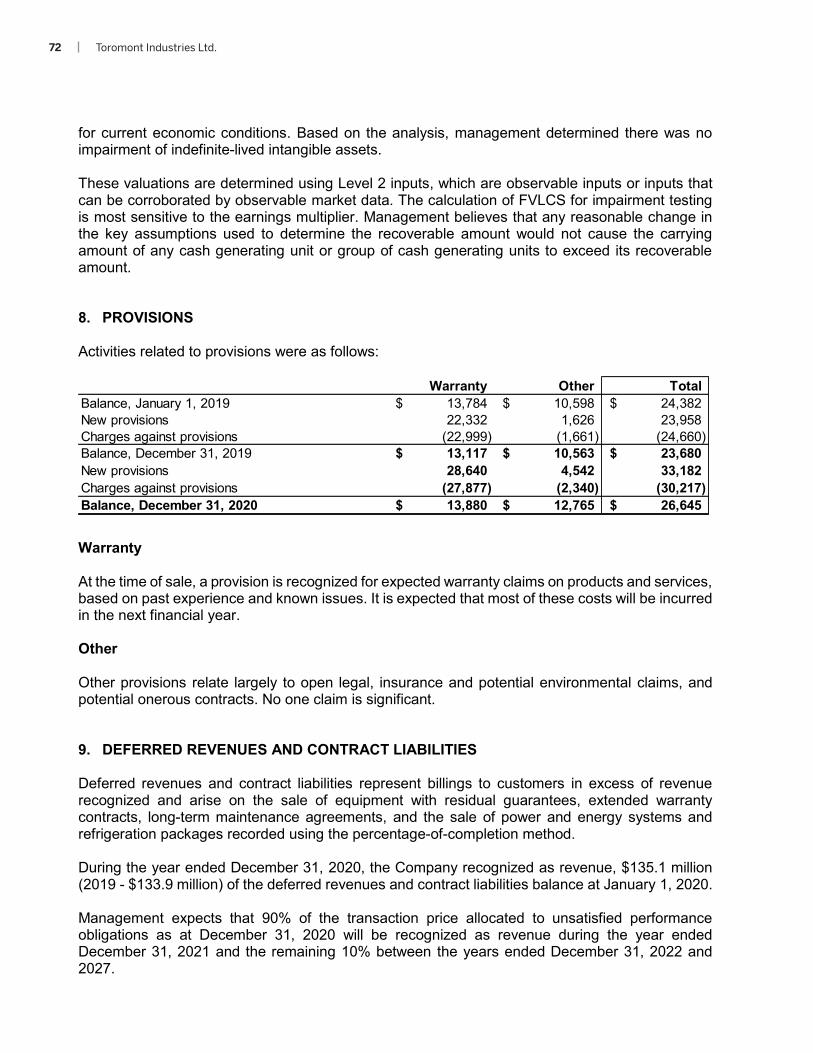
72 Toromont Industries Ltd.
28 Notes to the Consolidated Financial Statements for the year ended December 31, 2020
for current economic conditions. Based on the analysis, management determined there was no impairment of indefinite-lived intangible assets. These valuations are determined using Level 2 inputs, which are observable inputs or inputs that can be corroborated by observable market data. The calculation of FVLCS for impairment testing is most sensitive to the earnings multiplier. Management believes that any reasonable change in the key assumptions used to determine the recoverable amount would not cause the carrying amount of any cash generating unit or group of cash generating units to exceed its recoverable amount. 8. PROVISIONS Activities related to provisions were as follows:
Warranty At the time of sale, a provision is recognized for expected warranty claims on products and services, based on past experience and known issues. It is expected that most of these costs will be incurred in the next financial year. Other Other provisions relate largely to open legal, insurance and potential environmental claims, and potential onerous contracts. No one claim is significant. 9. DEFERRED REVENUES AND CONTRACT LIABILITIES Deferred revenues and contract liabilities represent billings to customers in excess of revenue recognized and arise on the sale of equipment with residual guarantees, extended warranty contracts, long-term maintenance agreements, and the sale of power and energy systems and refrigeration packages recorded using the percentage-of-completion method. During the year ended December 31, 2020, the Company recognized as revenue, $135.1 million (2019 - $133.9 million) of the deferred revenues and contract liabilities balance at January 1, 2020. Management expects that 90% of the transaction price allocated to unsatisfied performance obligations as at December 31, 2020 will be recognized as revenue during the year ended December 31, 2021 and the remaining 10% between the years ended December 31, 2022 and 2027.
Warranty Other TotalBalance, January 1, 2019 13,784$ 10,598$ 24,382$ New provisions 22,332 1,626 23,958 Charges against provisions (22,999) (1,661) (24,660) Balance, December 31, 2019 13,117$ 10,563$ 23,680$ New provisions 28,640 4,542 33,182 Charges against provisions (27,877) (2,340) (30,217) Balance, December 31, 2020 13,880$ 12,765$ 26,645$
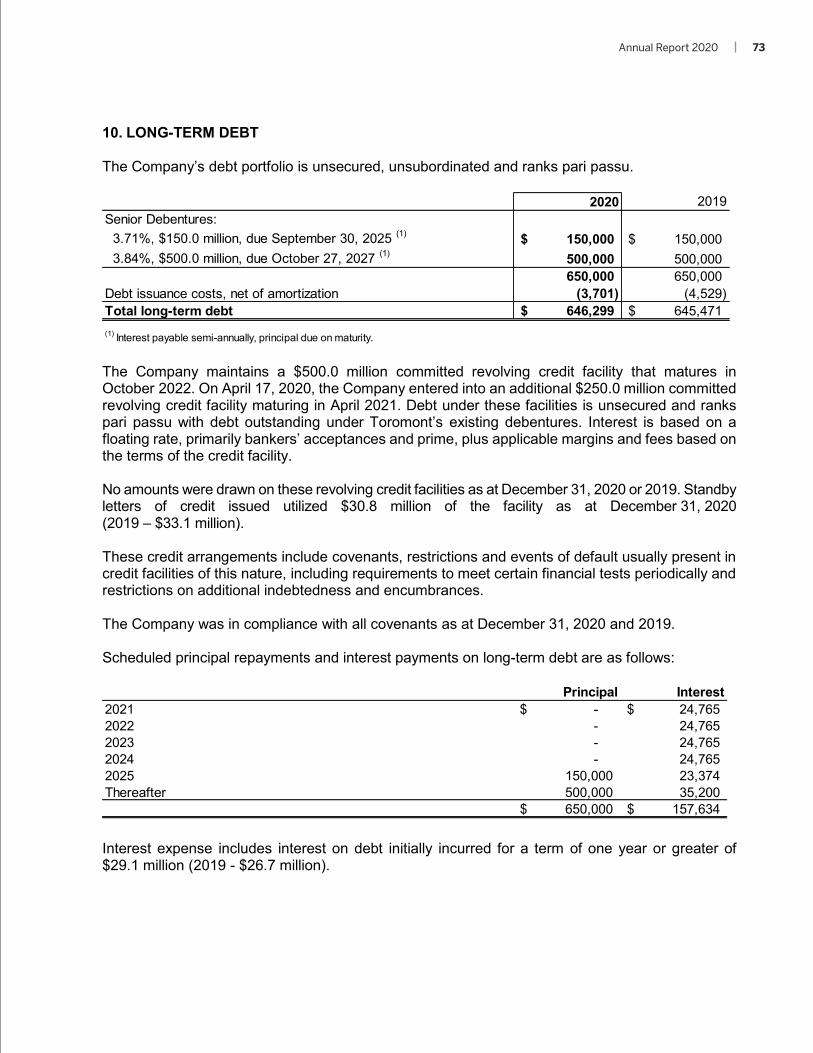
Annual Report 2020 73
29 Notes to the Consolidated Financial Statements for the year ended December 31, 2020
10. LONG-TERM DEBT The Company’s debt portfolio is unsecured, unsubordinated and ranks pari passu.
The Company maintains a $500.0 million committed revolving credit facility that matures in October 2022. On April 17, 2020, the Company entered into an additional $250.0 million committed revolving credit facility maturing in April 2021. Debt under these facilities is unsecured and ranks pari passu with debt outstanding under Toromont’s existing debentures. Interest is based on a floating rate, primarily bankers’ acceptances and prime, plus applicable margins and fees based on the terms of the credit facility. No amounts were drawn on these revolving credit facilities as at December 31, 2020 or 2019. Standby letters of credit issued utilized $30.8 million of the facility as at December 31, 2020 (2019 – $33.1 million). These credit arrangements include covenants, restrictions and events of default usually present in credit facilities of this nature, including requirements to meet certain financial tests periodically and restrictions on additional indebtedness and encumbrances. The Company was in compliance with all covenants as at December 31, 2020 and 2019. Scheduled principal repayments and interest payments on long-term debt are as follows:
Interest expense includes interest on debt initially incurred for a term of one year or greater of $29.1 million (2019 - $26.7 million).
2020 2019Senior Debentures: 3.71%, $150.0 million, due September 30, 2025 (1) 150,000$ 150,000$ 3.84%, $500.0 million, due October 27, 2027 (1) 500,000 500,000
650,000 650,000 Debt issuance costs, net of amortization (3,701) (4,529) Total long-term debt 646,299$ 645,471$ (1) Interest payable semi-annually, principal due on maturity.
Principal Interest2021 -$ 24,765$ 2022 - 24,765 2023 - 24,765 2024 - 24,765 2025 150,000 23,374 Thereafter 500,000 35,200
650,000$ 157,634$

74 Toromont Industries Ltd.
30 Notes to the Consolidated Financial Statements for the year ended December 31, 2020
11. SHARE CAPITAL Authorized The Company is authorized to issue an unlimited number of common shares (no par value) and preferred shares. No preferred shares were issued or outstanding for the years ended December 31, 2020 and 2019. A continuity of the shares issued and outstanding for the years ended December 31, 2020 and 2019, is presented in the consolidated statements of changes in shareholders’ equity. Shareholder Rights Plan (“SRP”) The SRP is designed to encourage the fair treatment of shareholders in connection with any takeover offer for the Company. Rights issued under the plan become exercisable when a person, and any related parties, acquires or commences a takeover bid to acquire 20% or more of the Company’s outstanding common shares without complying with certain provisions set out in the plan or without approval of the Company’s Board of Directors. Should such an acquisition occur, each rights holder, other than the acquiring person and related parties, will have the right to purchase common shares of the Company at a 50% discount to the market price at that time. The SRP expires at the end of the annual meeting of shareholders in 2021. Normal Course Issuer Bid (“NCIB”) During the year, the Company purchased and cancelled 67,800 common shares for $4.0 million (average cost of $59.62 per share, including transaction costs) under the NCIB program. No shares were purchased and cancelled during the comparative period in 2019. The Company’s NCIB program expired in August 2020 and was not renewed. Dividends Paid The Company paid dividends of $98.5 million ($1.20 per share) for the year ended December 31, 2020, and $84.8 million ($1.04 per share) for the year ended December 31, 2019. Subsequent to the year ended December 31, 2020, the Board of Directors approved a quarterly dividend of $0.31 per share payable on April 1, 2021, to shareholders on record at the close of business on March 9, 2021.
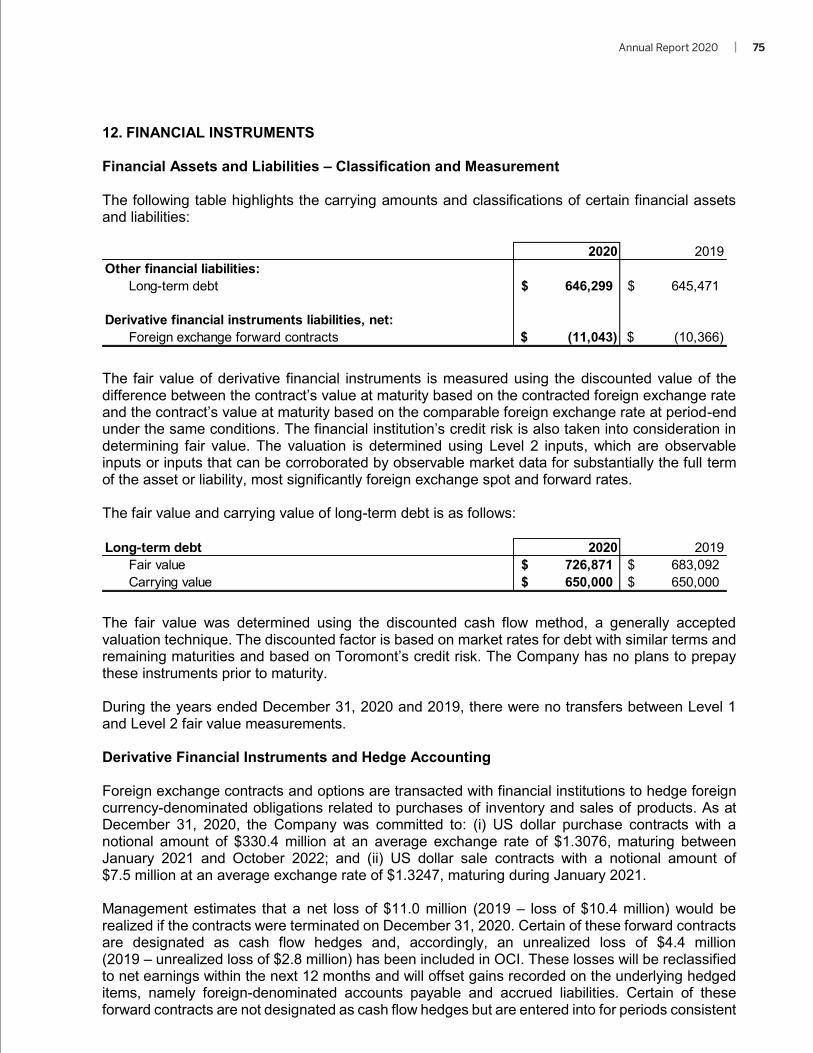
Annual Report 2020 75
31 Notes to the Consolidated Financial Statements for the year ended December 31, 2020
12. FINANCIAL INSTRUMENTS Financial Assets and Liabilities – Classification and Measurement The following table highlights the carrying amounts and classifications of certain financial assets and liabilities:
The fair value of derivative financial instruments is measured using the discounted value of the difference between the contract’s value at maturity based on the contracted foreign exchange rate and the contract’s value at maturity based on the comparable foreign exchange rate at period-end under the same conditions. The financial institution’s credit risk is also taken into consideration in determining fair value. The valuation is determined using Level 2 inputs, which are observable inputs or inputs that can be corroborated by observable market data for substantially the full term of the asset or liability, most significantly foreign exchange spot and forward rates. The fair value and carrying value of long-term debt is as follows:
The fair value was determined using the discounted cash flow method, a generally accepted valuation technique. The discounted factor is based on market rates for debt with similar terms and remaining maturities and based on Toromont’s credit risk. The Company has no plans to prepay these instruments prior to maturity. During the years ended December 31, 2020 and 2019, there were no transfers between Level 1 and Level 2 fair value measurements. Derivative Financial Instruments and Hedge Accounting Foreign exchange contracts and options are transacted with financial institutions to hedge foreign currency-denominated obligations related to purchases of inventory and sales of products. As at December 31, 2020, the Company was committed to: (i) US dollar purchase contracts with a notional amount of $330.4 million at an average exchange rate of $1.3076, maturing between January 2021 and October 2022; and (ii) US dollar sale contracts with a notional amount of $7.5 million at an average exchange rate of $1.3247, maturing during January 2021. Management estimates that a net loss of $11.0 million (2019 – loss of $10.4 million) would be realized if the contracts were terminated on December 31, 2020. Certain of these forward contracts are designated as cash flow hedges and, accordingly, an unrealized loss of $4.4 million (2019 – unrealized loss of $2.8 million) has been included in OCI. These losses will be reclassified to net earnings within the next 12 months and will offset gains recorded on the underlying hedged items, namely foreign-denominated accounts payable and accrued liabilities. Certain of these forward contracts are not designated as cash flow hedges but are entered into for periods consistent
2020 2019Other financial liabilities:
Long-term debt 646,299$ 645,471$
Derivative financial instruments liabilities, net:Foreign exchange forward contracts (11,043)$ (10,366)$
Long-term debt 2020 2019Fair value 726,871$ 683,092$ Carrying value 650,000$ 650,000$
76 Toromont Industries Ltd.
32 Notes to the Consolidated Financial Statements for the year ended December 31, 2020
with foreign currency exposure of the underlying transactions. A loss of $6.6 million (2019 – loss of $7.6 million) on these forward contracts is included in net earnings, which offsets gains recorded on the foreign-denominated items, namely accounts payable and accrued liabilities. All hedging relationships are formally documented, including the risk management objective and strategy. On an ongoing basis, an assessment is made as to whether the designated derivative financial instruments continue to be effective in offsetting changes in cash flows of the hedged transactions. 13. FINANCIAL INSTRUMENTS - RISK MANAGEMENT In the normal course of business, Toromont is exposed to financial risks that may potentially impact its operating results in one or all of its reportable segments. The Company employs risk management strategies with a view to mitigating these risks on a cost-effective basis. Derivative financial agreements are used to manage exposure to fluctuations in exchange rates. The Company does not enter into derivative financial agreements for speculative purposes. Currency Risk The Canadian operations of the Company source the majority of its products and major components from the United States. Consequently, reported costs of inventory and the transaction prices charged to customers for equipment and parts are affected by the relative strength of the Canadian dollar. The Company mitigates exchange rate risk by entering into foreign currency contracts to fix the cost of imported inventory where appropriate. In addition, pricing to customers is customarily adjusted to reflect changes in the Canadian dollar landed cost of imported goods. The Company also sells its products to certain customers in US currency. The Company mitigates exchange rate risk by entering into foreign currency contracts to fix the cash inflows where appropriate. The Company maintains a hedging policy whereby all significant transactional currency risks are identified and hedged. Sensitivity Analysis The following sensitivity analysis is intended to illustrate the sensitivity to changes in foreign exchange rates on the Company’s financial instruments and show the impact on net earnings and comprehensive income. It is provided as a reasonably possible change in currency in a volatile environment. Financial instruments affected by currency risk include cash, accounts receivable, accounts payable and accrued liabilities and derivative financial instruments. As at December 31, 2020, a 5% weakening (strengthening) of the Canadian dollar against the US dollar would result in a $0.4 million (decrease) increase in OCI for financial instruments held in foreign operations, and a $0.1 million (decrease) increase in net earnings and $9.1 million (decrease) increase in OCI for financial instruments held in Canadian operations. Credit Risk Financial instruments that potentially subject the Company to credit risk consist of cash, accounts receivable and derivative financial instruments. The carrying amount of assets included on the consolidated statements of financial position represents the maximum credit exposure.
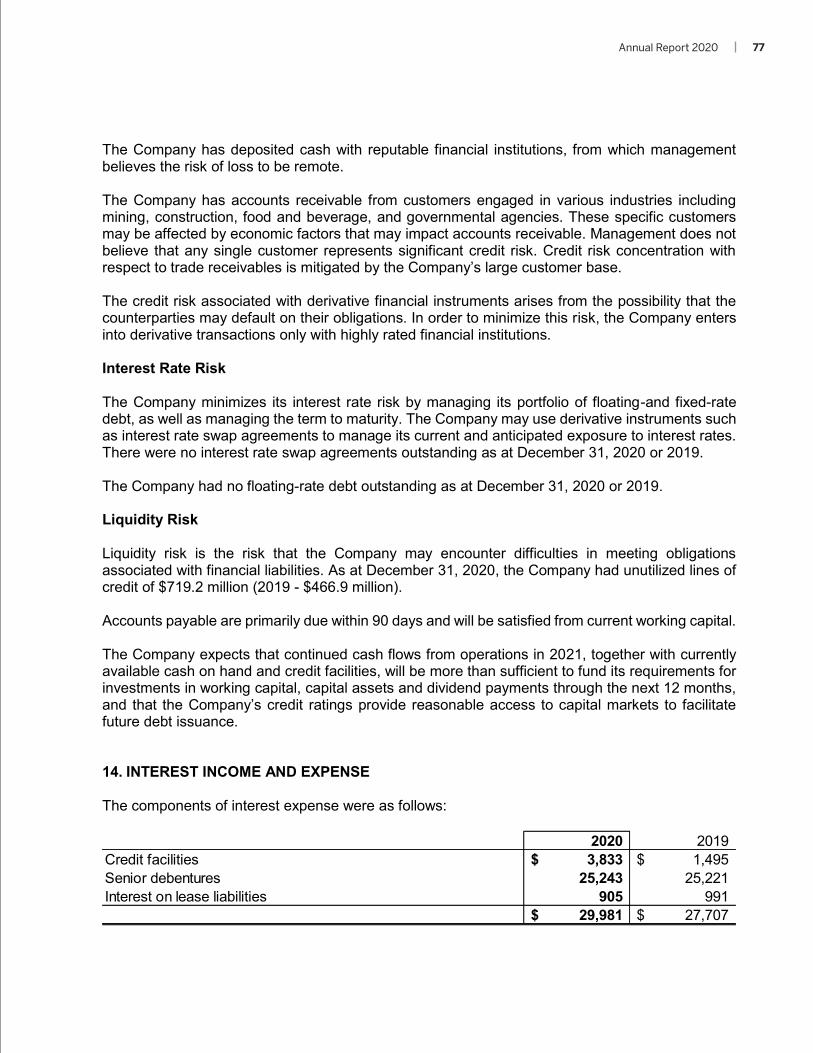
Annual Report 2020 77
33 Notes to the Consolidated Financial Statements for the year ended December 31, 2020
The Company has deposited cash with reputable financial institutions, from which management believes the risk of loss to be remote. The Company has accounts receivable from customers engaged in various industries including mining, construction, food and beverage, and governmental agencies. These specific customers may be affected by economic factors that may impact accounts receivable. Management does not believe that any single customer represents significant credit risk. Credit risk concentration with respect to trade receivables is mitigated by the Company’s large customer base. The credit risk associated with derivative financial instruments arises from the possibility that the counterparties may default on their obligations. In order to minimize this risk, the Company enters into derivative transactions only with highly rated financial institutions. Interest Rate Risk The Company minimizes its interest rate risk by managing its portfolio of floating-and fixed-rate debt, as well as managing the term to maturity. The Company may use derivative instruments such as interest rate swap agreements to manage its current and anticipated exposure to interest rates. There were no interest rate swap agreements outstanding as at December 31, 2020 or 2019. The Company had no floating-rate debt outstanding as at December 31, 2020 or 2019. Liquidity Risk Liquidity risk is the risk that the Company may encounter difficulties in meeting obligations associated with financial liabilities. As at December 31, 2020, the Company had unutilized lines of credit of $719.2 million (2019 - $466.9 million). Accounts payable are primarily due within 90 days and will be satisfied from current working capital. The Company expects that continued cash flows from operations in 2021, together with currently available cash on hand and credit facilities, will be more than sufficient to fund its requirements for investments in working capital, capital assets and dividend payments through the next 12 months, and that the Company’s credit ratings provide reasonable access to capital markets to facilitate future debt issuance. 14. INTEREST INCOME AND EXPENSE The components of interest expense were as follows:
2020 2019Credit facilities 3,833$ 1,495$ Senior debentures 25,243 25,221 Interest on lease liabilities 905 991
29,981$ 27,707$
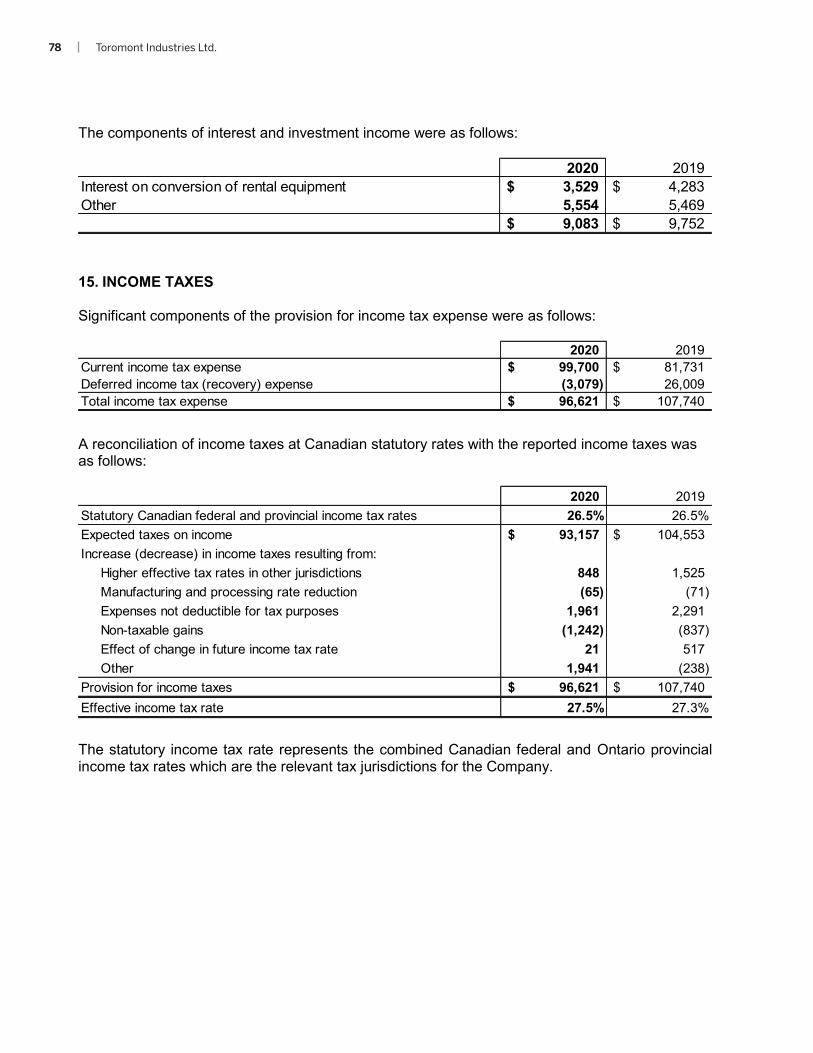
78 Toromont Industries Ltd.
34 Notes to the Consolidated Financial Statements for the year ended December 31, 2020
The components of interest and investment income were as follows:
15. INCOME TAXES Significant components of the provision for income tax expense were as follows:
A reconciliation of income taxes at Canadian statutory rates with the reported income taxes was as follows:
The statutory income tax rate represents the combined Canadian federal and Ontario provincial income tax rates which are the relevant tax jurisdictions for the Company.
2020 2019Interest on conversion of rental equipment 3,529$ 4,283$ Other 5,554 5,469
9,083$ 9,752$
2020 2019Current income tax expense 99,700$ 81,731$ Deferred income tax (recovery) expense (3,079) 26,009 Total income tax expense 96,621$ 107,740$
2020 2019Statutory Canadian federal and provincial income tax rates 26.5% 26.5%Expected taxes on income 93,157$ 104,553$ Increase (decrease) in income taxes resulting from:
Higher effective tax rates in other jurisdictions 848 1,525 Manufacturing and processing rate reduction (65) (71) Expenses not deductible for tax purposes 1,961 2,291 Non-taxable gains (1,242) (837) Effect of change in future income tax rate 21 517 Other 1,941 (238)
Provision for income taxes 96,621$ 107,740$ Effective income tax rate 27.5% 27.3%

Annual Report 2020 79
35 Notes to the Consolidated Financial Statements for the year ended December 31, 2020
The sources of deferred income taxes were as follows:
The movement in net deferred income taxes were as follows:
The aggregate amount of unremitted earnings in the Company’s subsidiaries was $30.4 million (2019 - $21.7 million). These earnings can be remitted with no tax consequences. 16. EARNINGS PER SHARE
There were no anti-dilutive options for the calculation of diluted earnings per share for the year ended December 31, 2020. For the comparative period in 2019, 1,030,260 outstanding stock options with a weighted average exercise price of $65.98 were considered anti-dilutive (exercise price in excess of average market price during the year) and, as such, were excluded from the calculation.
2020 2019Accrued liabilities 28,308$ 21,615$ Deferred revenues and contract liabilities 4,151 4,439 Accounts receivable 5,070 4,277 Inventories 6,557 5,850
Deferred tax assets on current assets and current liabilities 44,086$ 36,181$
Capital assets (78,110)$ (73,060)$ Goodwill and intangible assets (18,617) (13,204) Tax loss carryforward 411 774 Other 2,466 1,095 Cash flow hedges in OCI 1,160 900 Post-employment obligations 23,882 15,381
Deferred tax (liabilities) on non-current assets and non-current liabilities (68,808)$ (68,114)$ Net deferred tax liabilities (24,722)$ (31,933)$
2020 2019Balance January 1 (31,933)$ (13,919)$ Tax expense (recovery) recognized in income 3,079 (26,009) Foreign exchange and others (160) (738) Tax recovery recognized in OCI 4,292 8,733 Balance December 31 (24,722)$ (31,933)$
2020 2019Net earnings available to common shareholders 254,915$ 286,800$
Weighted average common shares outstanding 82,152,788 81,590,392 Dilutive effect of stock option conversions 467,673 485,856 Diluted weighted average common shares outstanding 82,620,461 82,076,248
Earnings per share: Basic 3.10$ 3.52$ Diluted 3.09$ 3.49$
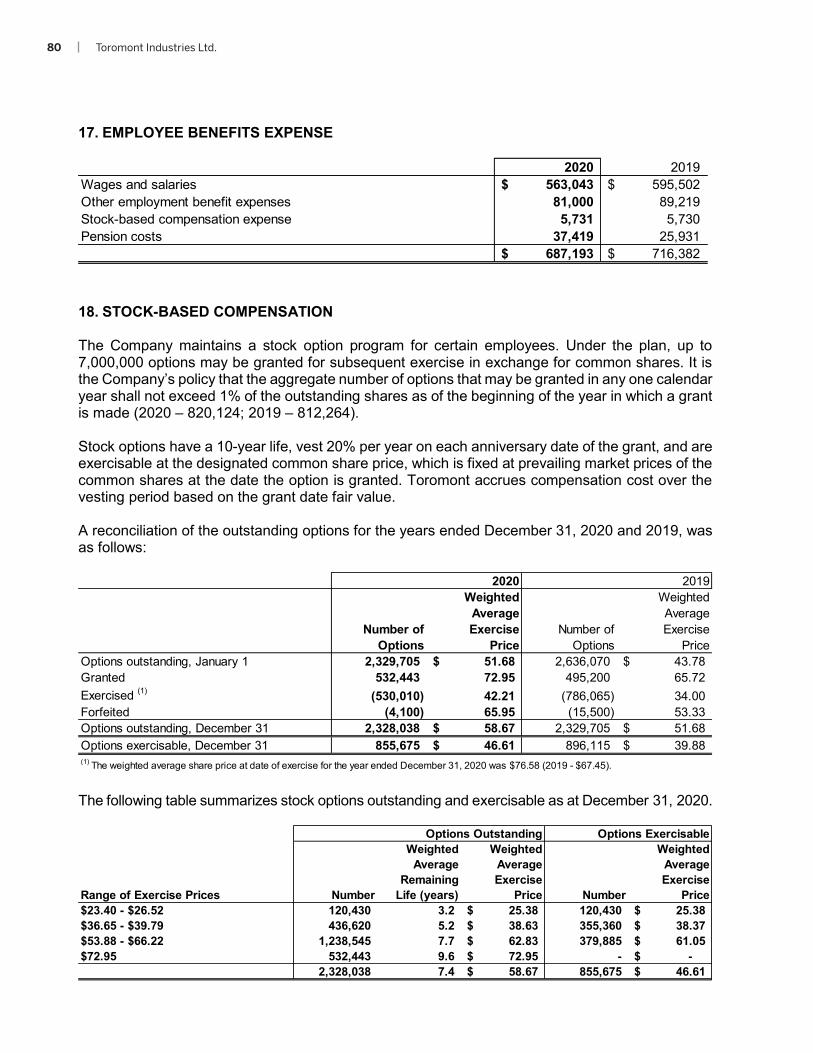
80 Toromont Industries Ltd.
36 Notes to the Consolidated Financial Statements for the year ended December 31, 2020
17. EMPLOYEE BENEFITS EXPENSE
18. STOCK-BASED COMPENSATION The Company maintains a stock option program for certain employees. Under the plan, up to 7,000,000 options may be granted for subsequent exercise in exchange for common shares. It is the Company’s policy that the aggregate number of options that may be granted in any one calendar year shall not exceed 1% of the outstanding shares as of the beginning of the year in which a grant is made (2020 – 820,124; 2019 – 812,264). Stock options have a 10-year life, vest 20% per year on each anniversary date of the grant, and are exercisable at the designated common share price, which is fixed at prevailing market prices of the common shares at the date the option is granted. Toromont accrues compensation cost over the vesting period based on the grant date fair value. A reconciliation of the outstanding options for the years ended December 31, 2020 and 2019, was as follows:
The following table summarizes stock options outstanding and exercisable as at December 31, 2020.
2020 2019Wages and salaries 563,043$ 595,502$ Other employment benefit expenses 81,000 89,219 Stock-based compensation expense 5,731 5,730 Pension costs 37,419 25,931
687,193$ 716,382$
Weighted WeightedAverage Average
Number of Exercise Number of ExerciseOptions Price Options Price
Options outstanding, January 1 2,329,705 51.68$ 2,636,070 43.78$ Granted 532,443 72.95 495,200 65.72 Exercised (1) (530,010) 42.21 (786,065) 34.00 Forfeited (4,100) 65.95 (15,500) 53.33 Options outstanding, December 31 2,328,038 58.67$ 2,329,705 51.68$ Options exercisable, December 31 855,675 46.61$ 896,115 39.88$ (1) The weighted average share price at date of exercise for the year ended December 31, 2020 was $76.58 (2019 - $67.45).
2020 2019
Weighted Weighted WeightedAverage Average Average
Remaining Exercise ExerciseRange of Exercise Prices Number Life (years) Price Number Price$23.40 - $26.52 120,430 3.2 25.38$ 120,430 25.38$ $36.65 - $39.79 436,620 5.2 38.63$ 355,360 38.37$ $53.88 - $66.22 1,238,545 7.7 62.83$ 379,885 61.05$ $72.95 532,443 9.6 72.95$ - -$
2,328,038 7.4 58.67$ 855,675 46.61$
Options Outstanding Options Exercisable
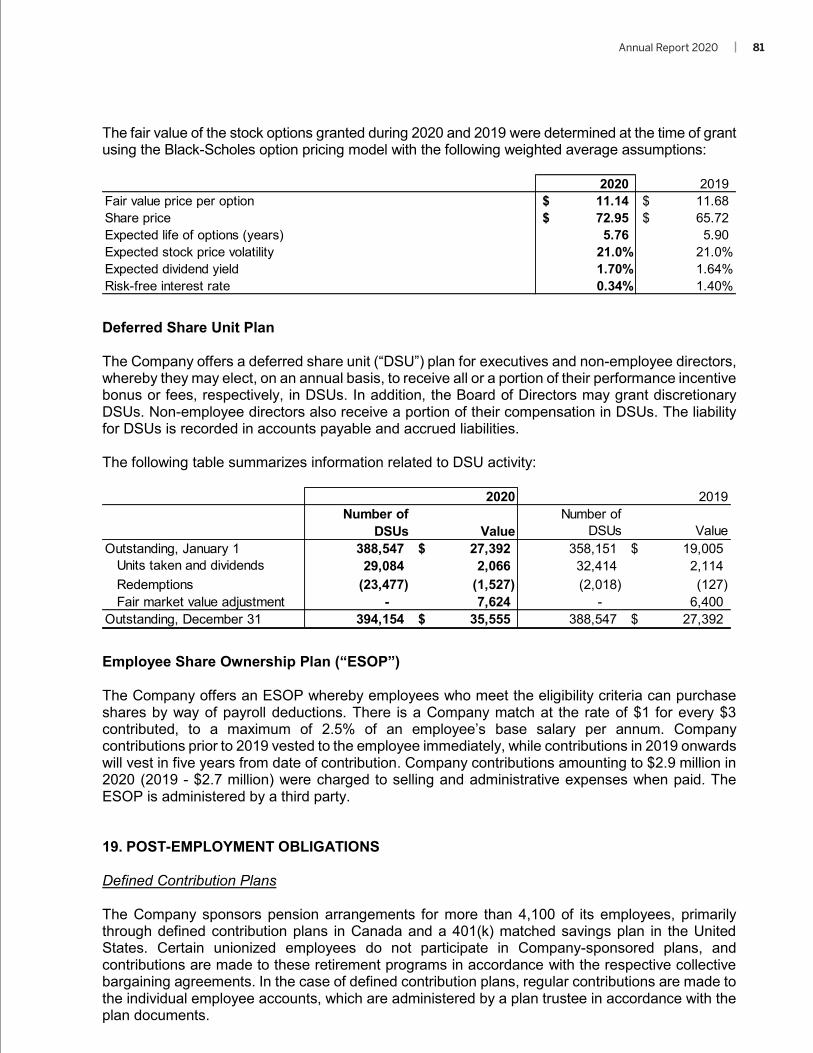
Annual Report 2020 81
37 Notes to the Consolidated Financial Statements for the year ended December 31, 2020
The fair value of the stock options granted during 2020 and 2019 were determined at the time of grant using the Black-Scholes option pricing model with the following weighted average assumptions:
Deferred Share Unit Plan The Company offers a deferred share unit (“DSU”) plan for executives and non-employee directors, whereby they may elect, on an annual basis, to receive all or a portion of their performance incentive bonus or fees, respectively, in DSUs. In addition, the Board of Directors may grant discretionary DSUs. Non-employee directors also receive a portion of their compensation in DSUs. The liability for DSUs is recorded in accounts payable and accrued liabilities. The following table summarizes information related to DSU activity:
Employee Share Ownership Plan (“ESOP”) The Company offers an ESOP whereby employees who meet the eligibility criteria can purchase shares by way of payroll deductions. There is a Company match at the rate of $1 for every $3 contributed, to a maximum of 2.5% of an employee’s base salary per annum. Company contributions prior to 2019 vested to the employee immediately, while contributions in 2019 onwards will vest in five years from date of contribution. Company contributions amounting to $2.9 million in 2020 (2019 - $2.7 million) were charged to selling and administrative expenses when paid. The ESOP is administered by a third party. 19. POST-EMPLOYMENT OBLIGATIONS Defined Contribution Plans The Company sponsors pension arrangements for more than 4,100 of its employees, primarily through defined contribution plans in Canada and a 401(k) matched savings plan in the United States. Certain unionized employees do not participate in Company-sponsored plans, and contributions are made to these retirement programs in accordance with the respective collective bargaining agreements. In the case of defined contribution plans, regular contributions are made to the individual employee accounts, which are administered by a plan trustee in accordance with the plan documents.
2020 2019Fair value price per option 11.14$ 11.68$ Share price 72.95$ 65.72$ Expected life of options (years) 5.76 5.90 Expected stock price volatility 21.0% 21.0%Expected dividend yield 1.70% 1.64%Risk-free interest rate 0.34% 1.40%
Number of DSUs Value
Number of DSUs Value
Outstanding, January 1 388,547 27,392$ 358,151 19,005$ Units taken and dividends 29,084 2,066 32,414 2,114 Redemptions (23,477) (1,527) (2,018) (127) Fair market value adjustment - 7,624 - 6,400
Outstanding, December 31 394,154 35,555$ 388,547 27,392$
2020 2019

82 Toromont Industries Ltd.
38 Notes to the Consolidated Financial Statements for the year ended December 31, 2020
Pre-tax pension expenses recognized in net earnings were as follows:
Defined Benefit Plans
The Company sponsors funded and unfunded defined benefit pension plans and post-employment benefit plans as described below with approximately 1,600 qualifying employees. In late 2020, a plan merger of all seven funded defined benefit pension plans was announced effective December 31, 2020. The plan merger is not expected to gain regulatory approval for 18 to 24 months, in which time the plans will continue to be valued separately. a) Defined Benefit Pension Plans – The Company sponsors six plans that provide pension benefits based on length of service and career average earnings, five of which are contributory. The funded plans are currently registered with various provincial regulators and are subject to provincial pension legislation as well as the Income Tax Act (Canada). The plans are administered by the Toromont Pension Management Committee with assets held in a pension fund that is legally separate from the Company and cannot be used for any purpose other than payment of pension benefits and related administrative fees. In addition, the Company has posted a letter of credit in the amount of $7.2 million to secure obligations under one of the plans. Actuarial valuations were completed for each plan at dates ranging from October 31, 2018 to December 31, 2019. As a result of the plan merger, actuarial valuations will be performed for all plans as of December 31, 2020. b) Executive Pension Plan – The plan is a supplemental pension plan and is solely the obligation of the Company. All members of the plan are retired. The Company is not obligated to fund the plan but is obligated to pay benefits under the terms of the plan as they come due. At December 31, 2020, the Company has posted letters of credit in the amount of $15.6 million to secure the obligations under this plan. The most recent actuarial valuation was completed as at December 31, 2020, with the next valuation scheduled as at December 31, 2021. c) Other Plan Assets and Obligations – This plan provides for certain retirees and terminated vested employees of businesses previously acquired by the Company as well as for retired participants of the defined contribution plan at that time, that, in accordance with the plan provisions, had elected to receive a pension directly from the plan. The most recent actuarial valuation was completed as at January 1, 2018 with the next valuation scheduled for December 31, 2020 along with all the other funded plans. d) Post-employment Benefit Plans – These plans provide supplementary post-employment health and life insurance coverage to certain employees. The Company is not obligated to fund the plans but is obligated to pay benefits under the terms of the plan as they come due. The most recent actuarial valuation was completed as at January 1, 2020, with the next valuation scheduled as at January 1, 2023.
2020 2019Defined contribution plans 15,686$ 15,082$ 401(k) matched savings plans 306 312
15,992$ 15,394$

Annual Report 2020 83
39 Notes to the Consolidated Financial Statements for the year ended December 31, 2020
Risks Defined benefit pension plans and other post-employment benefit plans expose the Company to risks as described below:
Investment risk - The present value of the defined benefit plan liability is calculated using a discount rate determined by reference to high-quality corporate bond yields; if the return on plan assets is below this rate, it will create a plan deficit. Currently, the plans have a relatively balanced investment in equity securities, debt instruments and real estate assets. The Toromont Pension Management Committee reviews the asset mix and performance of the plan assets on a quarterly basis with the balanced investment strategy intention.
Interest rate risk - A decrease in the bond yields will increase the plan liability; however, this will be partially offset by higher market values of the plan’s holdings in debt instruments.
Longevity risk - An increase in the life expectancy of the plan participants will increase the plan’s liability by lengthening the period in which benefits are paid.
Salary risk - The present value of the defined benefit plan liability is calculated by reference to the future salaries of plan participants. As such, an increase in the salary of the plan participants will increase the plan’s liability.
Information about the Company’s defined benefit plans as at December 31, in aggregate, is as follows:
2020 2019 2020 2019Defined benefit obligations:
Balance, January 1 551,250$ 474,549$ 18,346$ 23,726$ Curtailment gain - - - (5,000) Current service cost 15,575 11,424 1,959 588 Interest cost 17,023 18,158 586 597 Actuarial remeasurement (gains) losses arising from:
Experience adjustments 3,695 (464) 1,096 (2,121) Demographic assumptions (4,965) - (184) - Changes in financial assumptions 49,159 65,808 1,254 1,943
Benefits paid (21,652) (22,581) (1,428) (1,387) Contributions by plan participants 4,098 4,356 - -
Balance, December 31 614,183 551,250 21,629 18,346
Plan assets:Fair value, January 1 443,891 393,933 - - Interest income on plan assets 13,716 15,230 - - Return on plan assets (excluding amounts included in net interest expense) 34,842 39,914 - - Contributions by the Company 11,466 13,039 1,432 1,387 Contributions by plan participants 4,098 4,356 - - Benefits paid (21,652) (22,581) (1,432) (1,387)
Fair value, December 31 486,361 443,891 - - Net post-employment obligations 127,822$ 107,359$ 21,629$ 18,346$
Pension Benefit PlansOther Post-employment
Benefit Plans
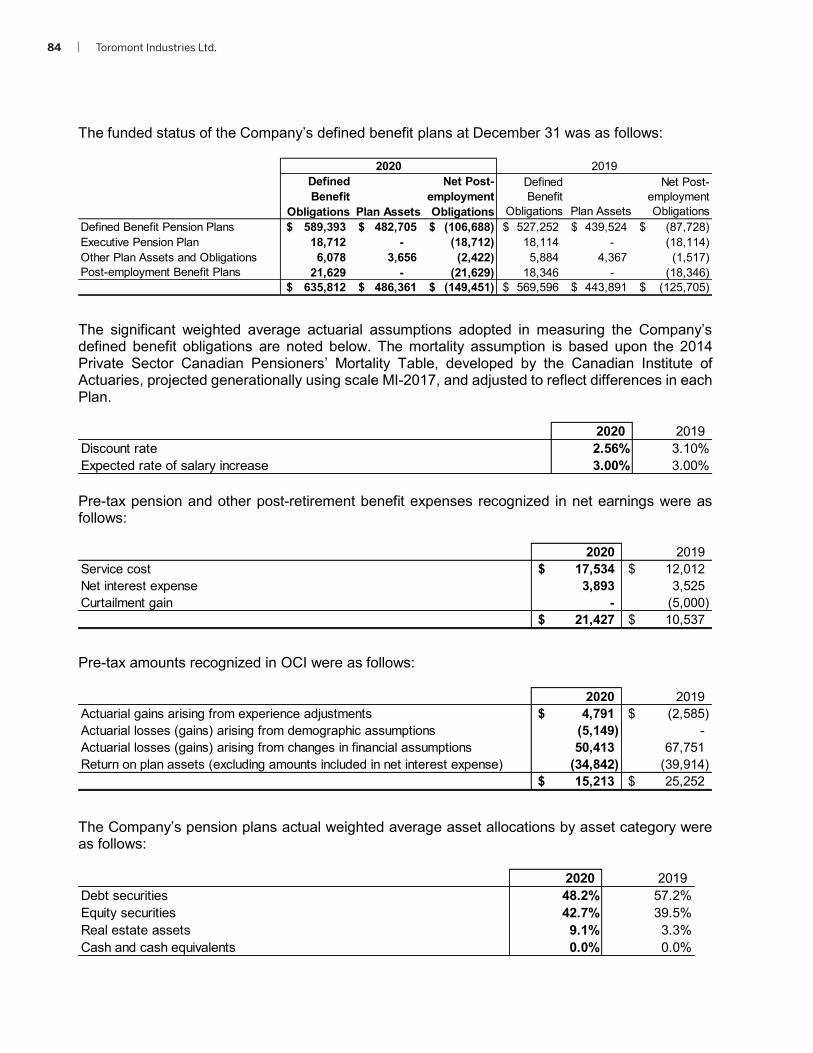
84 Toromont Industries Ltd.
40 Notes to the Consolidated Financial Statements for the year ended December 31, 2020
The funded status of the Company’s defined benefit plans at December 31 was as follows:
The significant weighted average actuarial assumptions adopted in measuring the Company’s defined benefit obligations are noted below. The mortality assumption is based upon the 2014 Private Sector Canadian Pensioners’ Mortality Table, developed by the Canadian Institute of Actuaries, projected generationally using scale MI-2017, and adjusted to reflect differences in each Plan.
Pre-tax pension and other post-retirement benefit expenses recognized in net earnings were as follows:
Pre-tax amounts recognized in OCI were as follows:
The Company’s pension plans actual weighted average asset allocations by asset category were as follows:
Defined Benefit
Obligations Plan Assets
Net Post-employment Obligations
Defined Benefit
Obligations Plan Assets
Net Post-employment Obligations
Defined Benefit Pension Plans 589,393$ 482,705$ (106,688)$ 527,252$ 439,524$ (87,728)$ Executive Pension Plan 18,712 - (18,712) 18,114 - (18,114) Other Plan Assets and Obligations 6,078 3,656 (2,422) 5,884 4,367 (1,517) Post-employment Benefit Plans 21,629 - (21,629) 18,346 - (18,346)
635,812$ 486,361$ (149,451)$ 569,596$ 443,891$ (125,705)$
2020 2019
2020 2019Discount rate 2.56% 3.10%Expected rate of salary increase 3.00% 3.00%
2020 2019Service cost 17,534$ 12,012$ Net interest expense 3,893 3,525 Curtailment gain - (5,000)
21,427$ 10,537$
2020 2019Actuarial gains arising from experience adjustments 4,791$ (2,585)$ Actuarial losses (gains) arising from demographic assumptions (5,149) - Actuarial losses (gains) arising from changes in financial assumptions 50,413 67,751 Return on plan assets (excluding amounts included in net interest expense) (34,842) (39,914)
15,213$ 25,252$
2020 2019Debt securities 48.2% 57.2%Equity securities 42.7% 39.5%Real estate assets 9.1% 3.3%Cash and cash equivalents 0.0% 0.0%

Annual Report 2020 85
41 Notes to the Consolidated Financial Statements for the year ended December 31, 2020
The fair values of the plan assets were determined based on the following methods:
Equity securities – generally quoted market prices in active markets. Debt securities – generally quoted market prices in active markets. Real estate assets – valued based on appraisals performed by a qualified external real
estate appraiser. Real estate assets are located primarily in Canada. Cash and cash equivalents – generally recorded at cost, which approximates fair value.
The actual return on plan assets for the year ended December 31, 2020, was $48.6 million (2019 - $55.1 million). The Company expects to contribute $28 million to pension and other benefit plans in 2021, inclusive of defined contribution plans. The weighted average duration of the defined benefit plan obligations at December 31, 2020 was 17.3 years (2019 - 17.3 years). Sensitivity Analysis Significant actuarial assumptions for the determination of the defined benefit obligations (“DBO”) are discount rate and life expectancy. The sensitivity analyses have been determined based on reasonably possible changes of the respective assumptions occurring at the end of the reporting period, while holding all other assumptions constant. As at December 31, 2020, the following quantitative analysis shows changes to the significant actuarial assumptions and the corresponding impact to the DBO:
The sensitivity analysis presented above may not be representative of the actual change in the DBO as it is unlikely that the change in assumptions would occur in isolation of one another as some of the assumptions may be correlated.
Actuarial Assumption SensitivityPension
Benefit Plans
Other Post-retirement
Benefit Plans Total
Period- end discount rate 1% increase (90,739)$ (2,112)$ (92,851)$ 1% decrease 106,755$ 2,553$ 109,308$
Mortality Increase of 1 year in expected lifetime of plan participants
13,206$ (365)$ 12,841$
Increase (Decrease) in DBO

86 Toromont Industries Ltd.
42 Notes to the Consolidated Financial Statements for the year ended December 31, 2020
20. CAPITAL MANAGEMENT The Company defines capital as the aggregate of shareholders’ equity and long-term debt, less cash. The Company’s capital management framework is designed to maintain a flexible capital structure that allows for optimization of the cost of capital at acceptable risk while balancing the interests of both equity and debt holders. The Company generally targets a net debt to total capitalization ratio of 33%, although there is a degree of variability associated with the timing of cash flows. Also, if appropriate opportunities are identified, the Company is prepared to significantly increase this ratio depending upon the opportunity. The Company’s capital management criteria can be illustrated as follows:
The Company is subject to minimum capital requirements relating to bank credit facilities and senior debentures. The Company has met these minimum requirements during the years ended December 31, 2020 and 2019. There were no changes in the Company’s approach to capital management during the years ended December 31, 2020 and 2019.
2020 2019Long-term debt 646,299$ 645,471$
Less : Cash 591,128 365,589 Net debt 55,171 279,882
Shareholders' equity 1,698,652 1,533,891 Total capitalization 1,753,823$ 1,813,773$
Net debt as a % of total capitalization 3% 15%Net debt to equity ratio 0.03:1 0.18:1
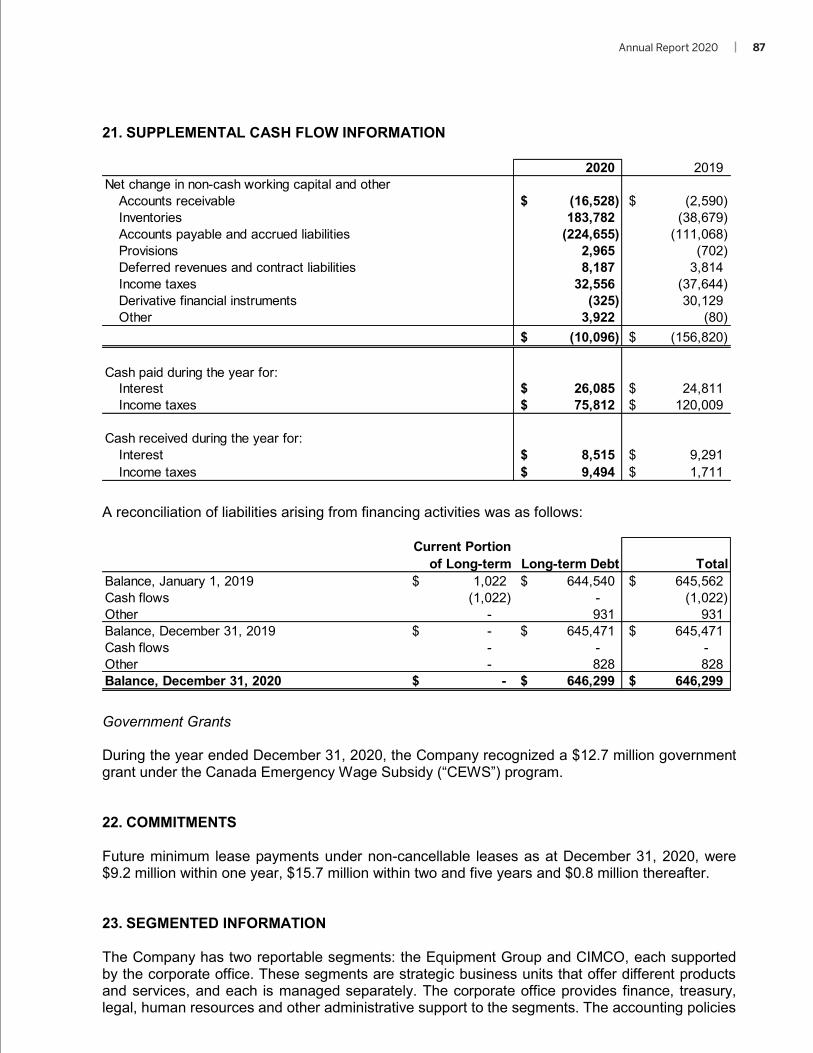
Annual Report 2020 87
43 Notes to the Consolidated Financial Statements for the year ended December 31, 2020
21. SUPPLEMENTAL CASH FLOW INFORMATION
A reconciliation of liabilities arising from financing activities was as follows:
Government Grants During the year ended December 31, 2020, the Company recognized a $12.7 million government grant under the Canada Emergency Wage Subsidy (“CEWS”) program. 22. COMMITMENTS Future minimum lease payments under non-cancellable leases as at December 31, 2020, were $9.2 million within one year, $15.7 million within two and five years and $0.8 million thereafter. 23. SEGMENTED INFORMATION The Company has two reportable segments: the Equipment Group and CIMCO, each supported by the corporate office. These segments are strategic business units that offer different products and services, and each is managed separately. The corporate office provides finance, treasury, legal, human resources and other administrative support to the segments. The accounting policies
2020 2019Net change in non-cash working capital and other
Accounts receivable (16,528)$ (2,590)$ Inventories 183,782 (38,679) Accounts payable and accrued liabilities (224,655) (111,068) Provisions 2,965 (702) Deferred revenues and contract liabilities 8,187 3,814 Income taxes 32,556 (37,644) Derivative financial instruments (325) 30,129 Other 3,922 (80)
(10,096)$ (156,820)$
Cash paid during the year for:Interest 26,085$ 24,811$ Income taxes 75,812$ 120,009$
Cash received during the year for:Interest 8,515$ 9,291$ Income taxes 9,494$ 1,711$
Current Portion of Long-term Long-term Debt Total
Balance, January 1, 2019 1,022$ 644,540$ 645,562$ Cash flows (1,022) - (1,022) Other - 931 931 Balance, December 31, 2019 -$ 645,471$ 645,471$ Cash flows - - - Other - 828 828 Balance, December 31, 2020 -$ 646,299$ 646,299$

88 Toromont Industries Ltd.
44 Notes to the Consolidated Financial Statements for the year ended December 31, 2020
of each of the reportable segments are the same as the significant accounting policies described in note 1. The operating segments are being reported based on the financial information provided to the Chief Executive Officer and Chief Financial Officer, who have been identified as the Chief Operating Decision Makers (“CODMs”) in monitoring segment performance and allocating resources between segments. The CODMs assess segment performance based on segment operating income, which is measured differently than income from operations in the consolidated financial statements. Corporate overheads are allocated to the segments based on revenue. Income taxes, interest expense, interest and investment income are managed at a consolidated level and are not allocated to the reportable operating segments. Current income taxes, deferred income taxes and certain financial assets and liabilities are not allocated to the segments as they are also managed on a consolidated level. The aggregation of the operating segments is based on the economic characteristics of the business units. These business units are considered to have similar economic characteristics including nature of products and services, class of customers and markets served and similar distribution models. No reportable segment is reliant on any single external customer. Equipment Group The Equipment Group comprises the following:
Toromont CAT – supplies, rents and provides product support services for specialized mobile equipment and industrial engines.
Battlefield Equipment Rentals – The CAT Rental Store – supplies and rents specialized mobile equipment as well as specialty supplies and tools.
Toromont Material Handling – supplies, rents and provides product support services for material handling lift trucks.
AgWest – supplies and provides product support services for specialized mobile equipment to the agriculture industry.
SITECH – supplies control systems for specialized mobile equipment. Toromont Energy – develops distributed generators and combined heat and power projects
using Caterpillar engines.
CIMCO Provides design, engineering, fabrication, installation, and product support services for industrial and recreational refrigeration systems. Corporate Office The corporate office does not meet the definition of a reportable operating segment as defined in IFRS 8 – Operating Segments, as it does not earn revenue.

Annual Report 2020 89
45 Notes to the Consolidated Financial Statements for the year ended December 31, 2020
The following table sets forth information by segment:
Selected consolidated statements of financial position information:
Operations are based in Canada and the United States. The following tables summarize the final destination of revenue to customers and the capital assets and goodwill held in each geographic segment:
Years ended December 31 2020 2019 2020 2019 2020 2019
Equipment/package sales 1,469,377$ 1,524,185$ 161,144$ 177,974$ 1,630,521$ 1,702,159$ Rentals 358,266 418,818 - - 358,266 418,818 Product support 1,327,478 1,390,340 151,654 156,781 1,479,132 1,547,121 Power generation 10,978 10,607 - - 10,978 10,607 Total revenues 3,166,099$ 3,343,950$ 312,798$ 334,755$ 3,478,897$ 3,678,705$
Operating income 345,953$ 384,077$ 26,481$ 28,418$ 372,434$ 412,495$
Interest expense 29,981 27,707 Interest and investment income (9,083) (9,752) Income taxes 96,621 107,740 Net earnings 254,915$ 286,800$
Equipment Group CIMCO Consolidated
As at December 31 2020 2019 2020 2019 2020 2019Identifiable assets 2,563,391$ 2,829,147$ 151,526$ 119,600$ 2,714,917$ 2,948,747$ Corporate assets 631,875 422,590 Total assets 3,346,792$ 3,371,337$
Identifiable liabilities 742,550$ 991,950$ 107,143$ 81,712$ 849,693$ 1,073,662$ Corporate liabilities 798,447 763,784 Total liabilities 1,648,140$ 1,837,446$
Capital expenditures, net 68,691$ 207,520$ 14,735$ 2,335$ 83,426$ 209,855$
Depreciation expense 154,011$ 152,900$ 6,486$ 5,660$ 160,497$ 158,560$
Equipment Group CIMCO Consolidated
Years ended December 31 2020 2019 Canada 3,396,536$ 3,581,029$ United States 80,710 95,731 International 1,651 1,945 Revenues 3,478,897$ 3,678,705$
As at December 31 2020 2019 Canada 1,051,965$ 1,109,961$ United States 4,509 4,749 Capital assets and goodwill 1,056,474$ 1,114,710$

90 Toromont Industries Ltd.
46 Notes to the Consolidated Financial Statements for the year ended December 31, 2020
24. RELATED PARTY DISCLOSURES Key management personnel and director compensation comprised:
The remuneration of directors and key management is determined by the Human Resources Committee having regard to the performance of the individual and Company and market trends. 25. ECONOMIC RELATIONSHIP The Company, through its Equipment Group, sells and services heavy equipment and related parts. Distribution agreements are maintained with several equipment manufacturers, of which the most significant are with subsidiaries of Caterpillar Inc. The distribution and servicing of these products account for the major portion of the Equipment Group’s operations. Toromont has had a strong relationship with Caterpillar Inc. since inception in 1993.
2020 2019Salaries 3,029$ 3,315$ Stock options and DSU awards 2,508 2,524 Annual non-equity incentive based plan compensation 1,713 3,271 Pension costs 684 740 All other compensation 132 151
8,066$ 10,001$

Annual Report 2020 91

92 Toromont Industries Ltd.
OUR BOARD OF DIRECTORS
OUR EXECUTIVE OPERATING TEAM
Robert M. Ogilvie
Chair of the Board
(Director since 1986)
Peter J. Blake
Corporate Director
(Director since 2019)
Jeffrey S. Chisholm
Corporate Director
(Director since 2011),
Chair of Human Resources
and Health and Safety
Committee
Cathryn E. Cranston
Corporate Director
(Director since 2013),
Chair of Audit Committee
James W. Gill
Corporate Director
(Director since 2015)
Wayne S. Hill
Corporate Director
(Director since 1988)
Sharon L. Hodgson
Corporate Director
(Director since 2019)
Scott J Medhurst
President and Chief
Executive Officer
(Director since 2012)
Katherine A. Rethy
Corporate Director
(Director since 2013)
Richard G. Roy
Corporate Director
(Director since 2018),
Chair of Environmental,
Social and Governance
Committee
Jennifer J. Cochrane
Vice President, Finance
Michael P. Cuddy
Vice President and Chief
Information Officer
Paul R. Jewer
Executive Vice President
Lynn M. Korbak
General Counsel and
Corporate Secretary
David A. Malinauskas
President, CIMCO
Refrigeration
Scott J. Medhurst
President and Chief
Executive Officer
Michael McMillan
Executive Vice President
and Chief Financial Officer

Toromont Cat
3131 Highway 7 West
P.O. Box 5511
Concord, Ontario L4K 1B7
T: 416.667.5511 F: 416.667.5555
www.toromontcat.com
5001 Trans-Canada Highway
Pointe-Claire, Québec H9R 1B8
T: 514.630.3100 F: 514.630.9020
Battlefield Equipment Rentals
880 South Service Road
Stoney Creek, Ontario L8E 5M7
T: 905.643.9410 F: 905.643.6008
www.battlefieldequipment.ca
Toromont Material Handling
425 Millway Avenue
Concord, Ontario L4K 3V8
T: 905.669.6590 F: 416.661.1513
www.toromontmaterialhandling.com
AgWest Ltd.
Highway #1 West
P.O. Box 432
Elie, Manitoba R0H 0H0
T: 204.353.3850 F: 877.353.2486
www.agwest.com
CIMCO Refrigeration
65 Villiers Street
Toronto, Ontario M5A 3S1
T: 416.465.7581 F: 416.465.8815
www.cimcorefrigeration.com
Annual Meeting
The Annual and Special Meeting of the Shareholders
of Toromont Industries Ltd. will be held at 10:00 am
(EST) on Wednesday, May 5, 2021.
Visit Toromont.com for more details.
How to Get in Touch With Us
Tel: 416.667.5511 Fax: 416.667.5555
E-mail: [email protected]
www.toromont.com
How to Reach Our Transfer
Agent and Registrar
Investors are encouraged to contact AST Trust Company
(Canada) for information regarding their security holdings.
AST Trust Company (Canada)
P.O. Box 700
Station B
Montreal, Québec H3B 3K3
Toll-Free North America: 1.800.387.0825
Local: 416.682.3860
E-mail: [email protected]
www.astfinancial.com/ca-en
Common Shares
Listed on the Toronto Stock Exchange
Stock Symbol – TIH
CORPORATE INFORMATION

Toromont Industries Ltd.Corporate Office3131 Highway 7 WestP.O. Box 5511Concord ON L4K 1B7
www.toromont.com


![Rebuilding Tomorrow - Foreign Affairs · 2020-04-06 · SponSored report [] JAPAN Rebuilding Tomorrow A s an innovator in a wide range of industries, Japan has exported its game-changing](https://static.fdocuments.us/doc/165x107/5f25cdea4bde127f151e04b6/rebuilding-tomorrow-foreign-affairs-2020-04-06-sponsored-report-japan-rebuilding.jpg)