Building the Wires, Capacity and Harmonization for True ...
16
SOUTHERN AFRICAN POWER POOL 1 Building the Wires, Capacity and Harmonization for True Regional Integration Presentation by Pius N Gumbi SAPP – Executive Committee Chairperson Johannesburg, SOUTH AFRICA September 15 – 16, 2011
Transcript of Building the Wires, Capacity and Harmonization for True ...

SOUTHERN AFRICAN POWER POOL 1
Building the Wires, Capacity and Harmonization for True Regional
Integration
Presentation by
Pius N Gumbi
SAPP – Executive Committee Chairperson
Johannesburg, SOUTH AFRICA
September 15 – 16, 2011
SOUTHERN AFRICAN POWER POOL 2
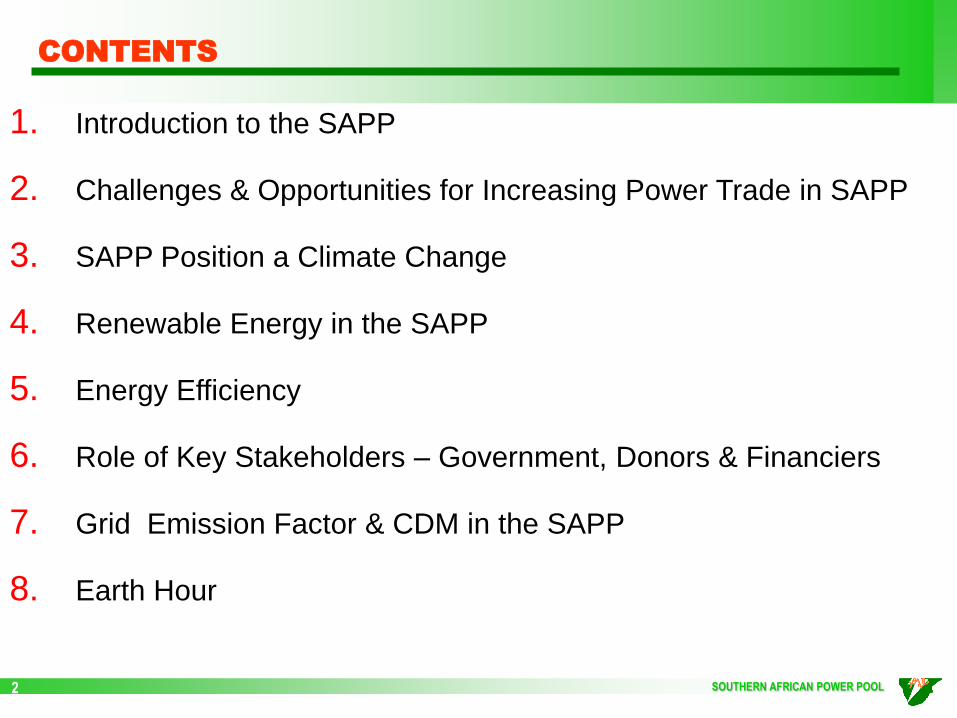
1. Introduction to the SAPP
2. Challenges & Opportunities for Increasing Power Trade in SAPP
3. SAPP Position a Climate Change
4. Renewable Energy in the SAPP
5. Energy Efficiency
6. Role of Key Stakeholders – Government, Donors & Financiers
7. Grid Emission Factor & CDM in the SAPP
8. Earth Hour
CONTENTS

SOUTHERN AFRICAN POWER POOL 3
1. Introduction to the SAPP
1.1 Geographic
DR Congo Tanzania
Zambia
Angola Malawi
Zimbabwe
Mozambique Botswana Namibia
South Africa Lesotho
Swaziland
12 Countries
230 Million people
Average electricity growth
rate 3% p.a.
For South Africa
demand growth was
4.9% in 2007 and for
whole region 4.1%.

SOUTHERN AFRICAN POWER POOL 4
1.2 Generation Mix & Contributions – Year 2010
74.3% Coal
20.1% Hydro
4.0% Nuclear
1.6% Gas/Diesel
80.4% South Africa
5.0% Mozambique
4.1% Zimbabwe
3.6% Zambia
2.6% DRC
4.4% Rest

SOUTHERN AFRICAN POWER POOL 5
SAPP Pool Plan.
The current Pool plan is 10 years old. The last revision was
done in 2008.
SAPP is in the process of reviewing the Pool Plan.
Stakeholder engagement and consultation including SADC is
ongoing.
Project priority to be indicated for funding considerations.
2. Challenges and Opportunities for Increasing
Power Trade in SAPP
SOUTHERN AFRICAN POWER POOL 6
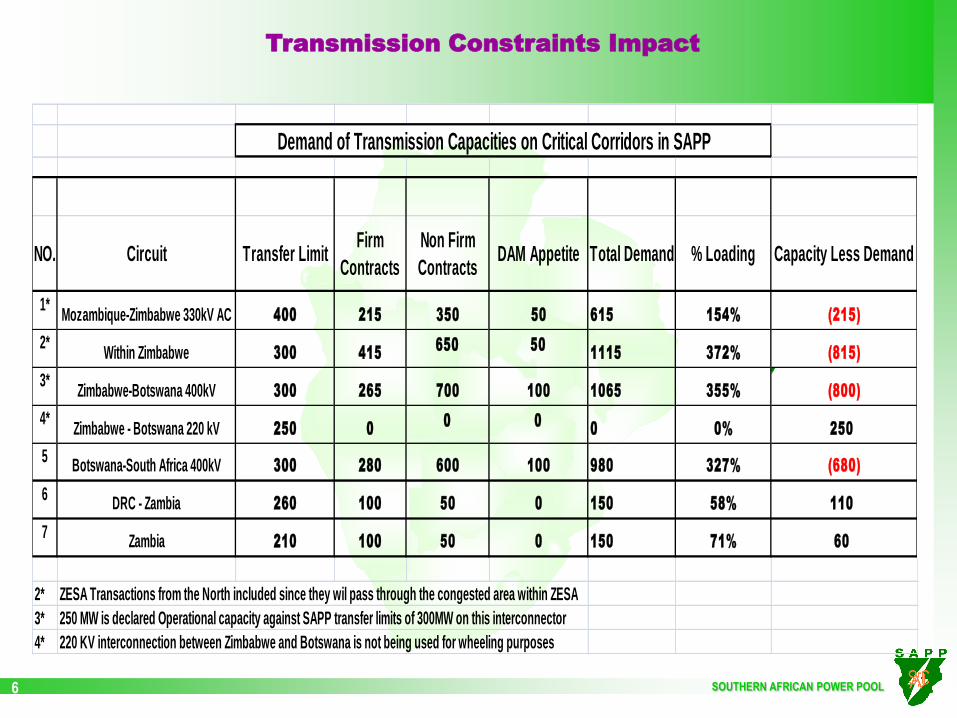
Transmission Constraints Impact
Demand of Transmission Capacities on Critical Corridors in SAPP
1*Mozambique-Zimbabwe 330kV AC 400 215 350 50 615 154% (215)
2*Within Zimbabwe 300 415
650 501115 372% (815)
3*Zimbabwe-Botswana 400kV 300 265 700 100 1065 355% (800)
4*Zimbabwe - Botswana 220 kV 250 0
0 00 0% 250
5Botswana-South Africa 400kV 300 280 600 100 980 327% (680)
6DRC - Zambia 260 100 50 0 150 58% 110
7Zambia 210 100 50 0 150 71% 60
2* ZESA Transactions from the North included since they wil pass through the congested area within ZESA
3* 250 MW is declared Operational capacity against SAPP transfer limits of 300MW on this interconnector
4* 220 KV interconnection between Zimbabwe and Botswana is not being used for wheeling purposes
Capacity Less DemandTotal Demand % LoadingNO. Circuit Transfer LimitFirm
Contracts
Non Firm
ContractsDAM Appetite

SOUTHERN AFRICAN POWER POOL 7
Challenges and Opportunities for Increasing Power Trade in SAPP
Opportunities for Increasing Power Trade.
ZIZABONA interconnector Projects.
SAPP Central Transmission Corridor
Mozambique - Malawi interconnector.
DRC - Zambia interconnector.
Zambia - Tanzania – Kenya.
Mozambique Backbone.
Kafue Town - Muzuma – Livingstone
Namibia - Angola Interconnector
Mozambique – Tanzania Transmission Corridor
SOUTHERN AFRICAN POWER POOL 8
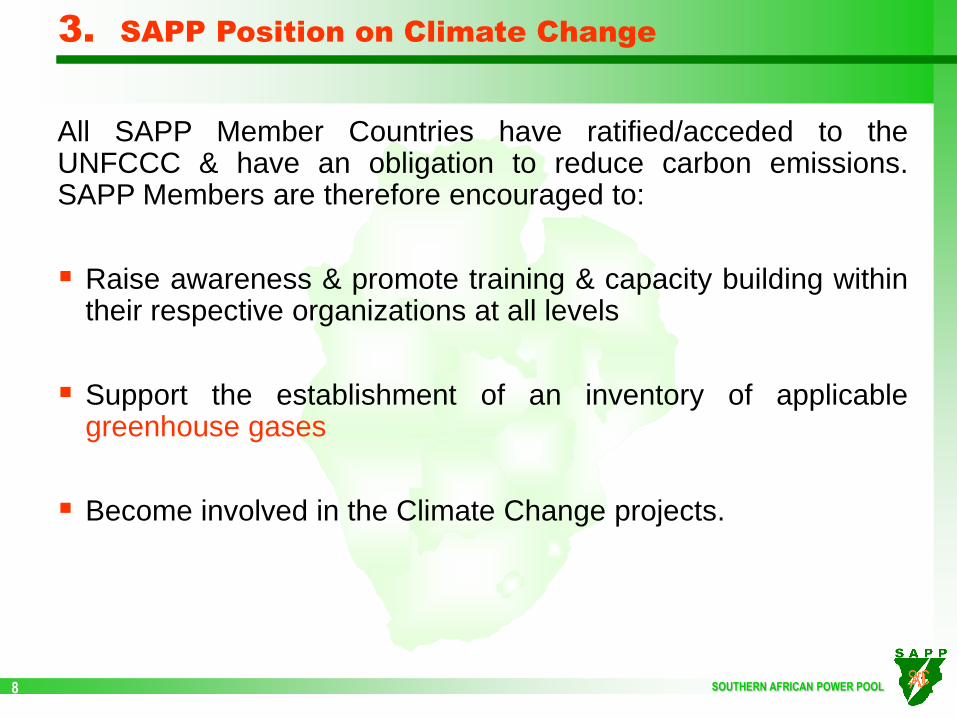
All SAPP Member Countries have ratified/acceded to the UNFCCC & have an obligation to reduce carbon emissions. SAPP Members are therefore encouraged to:
Raise awareness & promote training & capacity building within their respective organizations at all levels
Support the establishment of an inventory of applicable greenhouse gases
Become involved in the Climate Change projects.
3. SAPP Position on Climate Change

SOUTHERN AFRICAN POWER POOL 9
4. SAPP Initiatives – Renewable Energy
SAPP Embarking on Renewable Energy Initiatives
SAPP recognizes the importance of Renewable energy in Climate Change stabilization
Embarking on Renewable Energy & action Plan for SADC countries
SAPP intends to promote renewable energy & benefit from significant renewable energy resources that exist in the region
The following forms of renewable energy have been identified in the region:
SOUTHERN AFRICAN POWER POOL 10
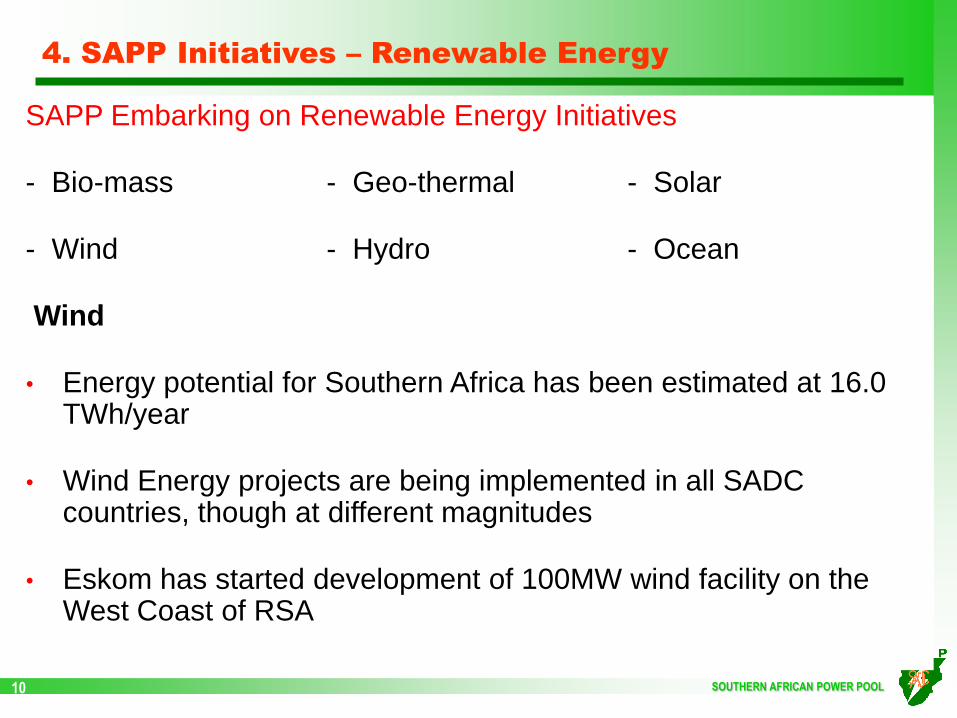
4. SAPP Initiatives – Renewable Energy
SAPP Embarking on Renewable Energy Initiatives
- Bio-mass - Geo-thermal - Solar
- Wind - Hydro - Ocean
Wind
• Energy potential for Southern Africa has been estimated at 16.0 TWh/year
• Wind Energy projects are being implemented in all SADC countries, though at different magnitudes
• Eskom has started development of 100MW wind facility on the West Coast of RSA

SOUTHERN AFRICAN POWER POOL 11
3. SAPP Initiatives – Renewable Energy
Solar
• Most abundant of all energy resources
• Solar potential in Southern Africa is estimated at between 25,000 to 30,000 TWh/year
Geo-thermal
• Studies indicate that Malawi, Zambia & Tanzania & Mozambique have a potential of 4,000MW from Geo-thermal
Ocean Energy
• SA has so far attempted to assess the ocean potential
• Eskom has completed an ocean energy assessment
Overall, the SAPP expects to increase Renewable Energy contribution from the current 20% to 29% by 2030

SOUTHERN AFRICAN POWER POOL 12
5. Energy Efficiency Initiatives
SAPP taking an active part in Energy efficiency through introducing;
• Compact fluorescent Lamps – Energy saving bulbs
• Commercial Lighting
• Hot Water Load Control measures
• Solar Water Heaters
• Has so far realized 850 MW through saved power
Also taking active part in Transmission Loss reductions

SOUTHERN AFRICAN POWER POOL 13
Signing of PPA`s would promote viability of project and thus attract
investments.
There is a need to develop Financial models for cross-
boarder projects i.e. SPV ,PPP.
SAPP is working with Donors & Financiers to implement least cost
solution to promote cross border energy trading.
Most Governments in the SADC can not raise the necessary
investment finance without the help of international financiers.
Tendering procedures, low tariffs and political instability are major
stumbling blocks by some investors.
6. Role of Governments , Regional Economic
Communities , Donors and Financiers in Advancing
key , transformational cross boarder projects.

SOUTHERN AFRICAN POWER POOL 14
7. SAPP Grid Emission Factor & CDM
• SAPP has done a study to calculate the Grid emission Factor
• Average emissions from the electricity in the SAPP stands at 1.0136 tones of carbon –dioxide per MW
• This results in additional carbon finance impact of 1.52USc
• An energy CDM project in the SAPP may claim 1.0136 tonnes of carbon emission reductions per MWh fed into the SAPP
• SAPP working on the Registration of a CDM Project for the region by 2012
• There is a need for SADC Policy on Incandescent bulbs for the C&M Project to be a success.

SOUTHERN AFRICAN POWER POOL 15
8. Earth Hour
• SAPP Recognizes the importance of the Earth Hour which call for
individuals and businesses to switch themselves off for an hour one
day per year as a stand against climate change.
• The Earth Hour, 2011 was held on 26 March, 2011 and all SAPP
countries recognized this day by switching themselves off for an hour
at 8.30pm.
• The Earth Hour, 2012 will be held on 30 March, 2012 and the SAPP
will again take note of the day and switch themselves off for an hour
and measure the impact.

SOUTHERN AFRICAN POWER POOL 16
THE END