An Exclusive Showcase of Tennessee's Finest Architects, Designers and Builders

Report of the Tennessee Advisory Commission on Intergovernmental Relations
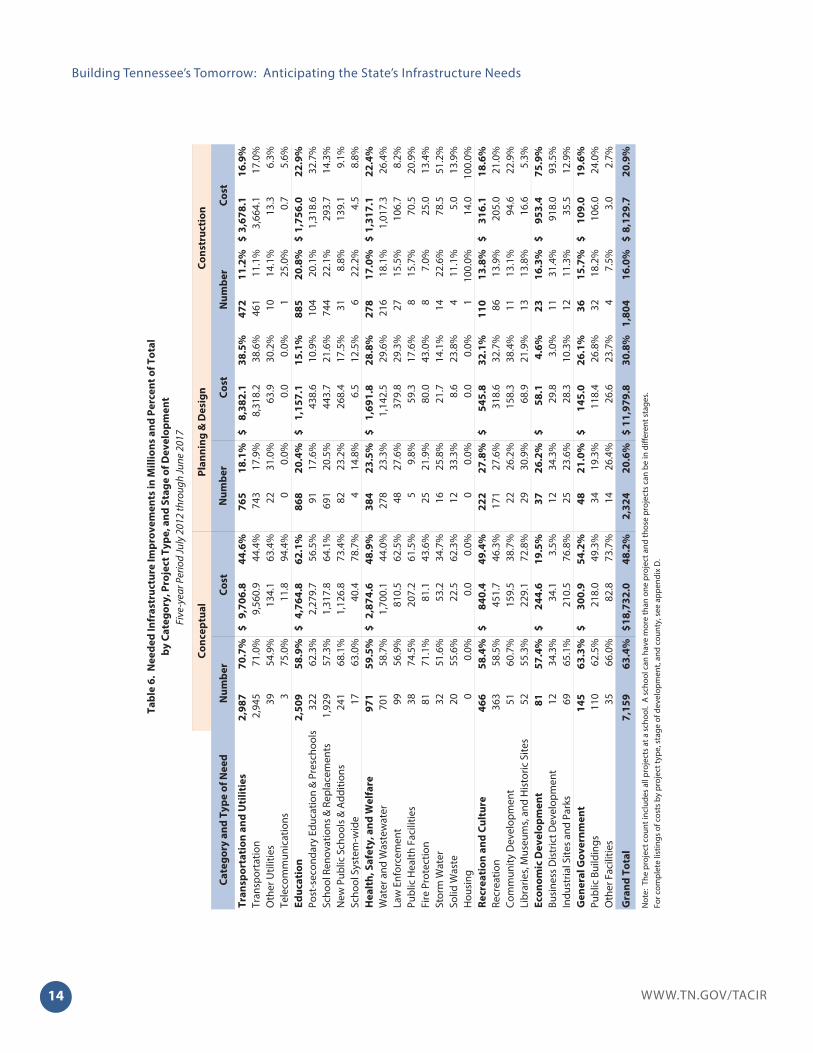
Building Tennessee’s Tomorrow:
Anticipating the State’s Infrastructure Needs
July 2012 through June 2017
David W. Lewis, M.A.Research Manager
Co-Author
David L. Keiser, M.A.Project Manager
Co-Author
Michael Mount, M.A.Senior Research Associate
Co-Author
Jennifer Barrie, M.S.Research Associate
Co-Author
Matthew Owen, Ph.D.Research Associate
Co-Author
Janet SteenInformation Technology Consultant
Teresa GibsonWeb Development & Publications Manager
June 2014

East Tennessee Development District
Terry Bobrowski, Executive Director
Mollie Childress, Infrastructure Planner
First Tennessee Development District
Susan Reid, Executive Director
Beulah Ferguson, Director of Special Projects
Ken Rea, Deputy Director of Economic and Community Development
Bill Forrester, Industrial Programs Director
Semone Burleson, Community Development Project Coordinator
Gray Stothart, Community Development Coordinator/Historic Preservation Planner
Chris Craig, Assistant Director/Director of Environmental Management and RPO
Greater Nashville Regional Council
Sam Edwards, Executive Director
Tim Roach, Deputy Director of Research, Planning, and Development
Grant Green, Chief of Research
Patty Cavanah, Executive Administrative Assistant
Memphis Area Association of Governments
Pamela Marshall, Executive Director
James McDougal, Planner
Lisa Trexler, Administrative Assistant
Northwest Tennessee Development District
John Bucy, Executive Director
Wanda Fuzzell, Planner
Southeast Tennessee Development District
Beth Jones, Executive Director
Richie Johnson, Regional Planner
South Central Tennessee Development District
Jerry Mansfi eld, Executive Director
Lisa Cross, Community Development Specialist
Lori Fisher-Braly, Community Development Director
Southwest Tennessee Development District
Joe Barker, Executive Director
Jeff Reece, Environmental Programs Coordinator
Upper Cumberland Development District
Mark Farley, Executive Director
James Wheeler, Systems Coordinator
Matthew Reeves, HMIS System Admin/Project Manager
TACIR staff wish to acknowledge the eff orts of the development district staff responsible for the
inventory:


iWWW.TN.GOV/TACIR
Executive Summary
Building Tennessee’s Tomorrow:
Anticipating the State’s Infrastructure Needs
July 2012 through June 2017
EXECUTIVE SUMMARY
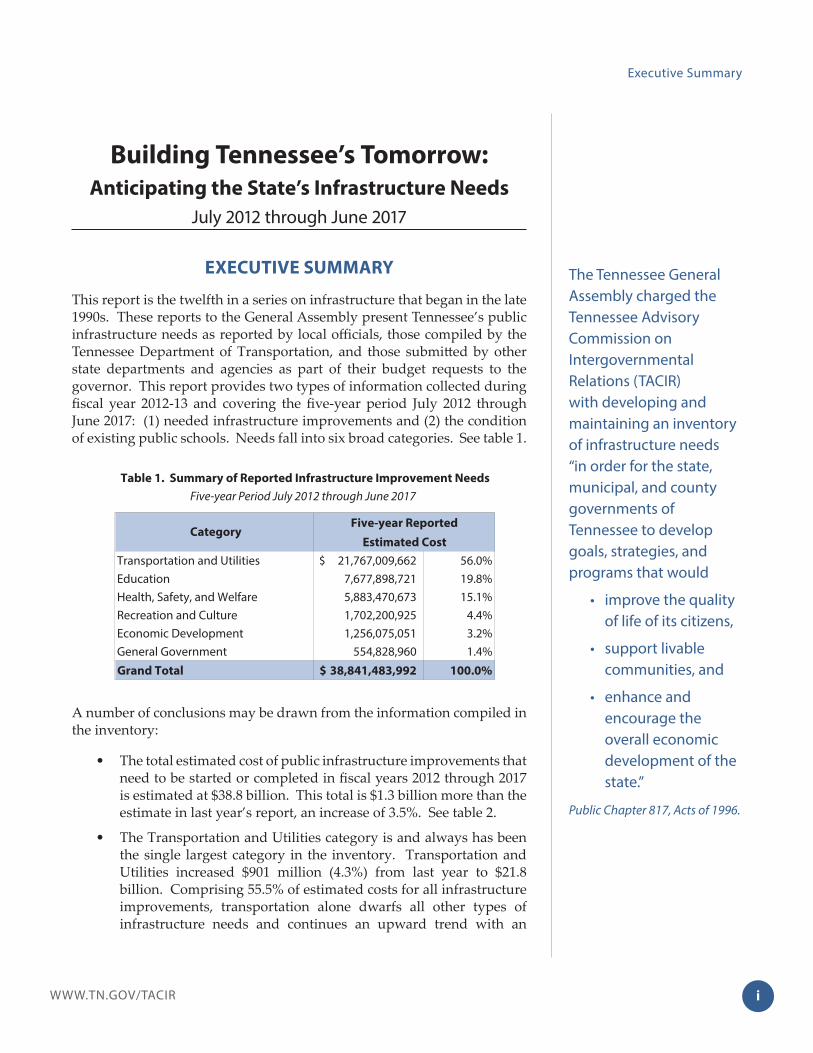
This report is the twelfth in a series on infrastructure that began in the late 1990s. These reports to the General Assembly present Tennessee’s public infrastructure needs as reported by local offi cials, those compiled by the Tennessee Department of Transportation, and those submitt ed by other state departments and agencies as part of their budget requests to the governor. This report provides two types of information collected during fi scal year 2012-13 and covering the fi ve-year period July 2012 through June 2017: (1) needed infrastructure improvements and (2) the condition of existing public schools. Needs fall into six broad categories. See table 1.
A number of conclusions may be drawn from the information compiled in the inventory:
• The total estimated cost of public infrastructure improvements that need to be started or completed in fi scal years 2012 through 2017 is estimated at $38.8 billion. This total is $1.3 billion more than the estimate in last year’s report, an increase of 3.5%. See table 2.
• The Transportation and Utilities category is and always has been the single largest category in the inventory. Transportation and Utilities increased $901 million (4.3%) from last year to $21.8 billion. Comprising 55.5% of estimated costs for all infrastructure improvements, transportation alone dwarfs all other types of infrastructure needs and continues an upward trend with an
The Tennessee General Assembly charged the Tennessee Advisory Commission on Intergovernmental Relations (TACIR) with developing and maintaining an inventory of infrastructure needs “in order for the state, municipal, and county governments of Tennessee to develop goals, strategies, and programs that would
• improve the quality of life of its citizens,
• support livable communities, and
• enhance and encourage the overall economic development of the state.”
Public Chapter 817, Acts of 1996.
Transportation and Utilities 21,767,009,662$ 56.0%Education 7,677,898,721 19.8%Health, Safety, and Welfare 5,883,470,673 15.1%Recreation and Culture 1,702,200,925 4.4%Economic Development 1,256,075,051 3.2%General Government 554,828,960 1.4%
Grand Total 38,841,483,992$ 100.0%
Five-year Period July 2012 through June 2017 Table 1. Summary of Reported Infrastructure Improvement Needs
Estimated Cost
Five-year Reported Category

WWW.TN.GOV/TACIRii
Building Tennessee’s Tomorrow: Anticipating the State’s Infrastructure Needs
increase of $917 million (4.4%), the largest increase of any type of infrastructure.
• Education is the second largest category and increased $406 million (5.6%) to $7.7 billion, mainly because of a $327 million (8.8%) increase in the cost of improvements needed at the state’s public college and university campuses, which now stands at $4 billion. The estimated cost for improving the state’s public school buildings remained fl at with a slight increase of $90 million (2.6%) to $3.6 billion because there has been a shift from adding new space to improving existing space. Asked about the overall condition of their school buildings, public school offi cials reported that 93% are in good or bett er condition.
• Health, Safety, and Welfare, the third largest category in the inventory, decreased by $58 million (1%) to $5.9 billion. This decline resulted primarily from decreases in the need for improved water and wastewater infrastructure and public health facilities. Water and wastewater accounts for the largest portion of the Health, Safety, and Welfare category at $3.9 billion; it decreased by $104 million (2.6%) from last year. Three other types of infrastructure in this category also had a net decrease in total cost: public health facilities, storm water, and housing. The estimated cost of infrastructure improvements needed for law enforcement, fi re protection, and handling solid waste increased.
• The Recreation and Culture category decreased overall by $2.6 million (0.2%) to $1.7 billion, even though the estimated cost for recreation infrastructure increased by $43 million (4.6%). This increase was off set by decreases in community development ($43 million) and libraries, museums, and historic sites ($1.8 million).
• The estimated cost of both types of infrastructure in the Economic Development category increased and now totals $1.3 billion, up by $23 million (1.9%) since the last inventory. The cost of industrial
Transportation and Utilities 20,865,809,131$ 21,767,009,662$ 901,200,531$ 4.3%Education 7,271,463,459 7,677,898,721 406,435,262 5.6%Health, Safety, and Welfare 5,941,679,207 5,883,470,673 (58,208,534) -1.0%Recreation and Culture 1,704,816,699 1,702,200,925 (2,615,774) -0.2%Economic Development 1,232,847,959 1,256,075,051 23,227,092 1.9%General Government 518,672,149 554,828,960 36,156,811 7.0%
Grand Total 37,535,288,604$ 38,841,483,992$ 1,306,195,388$ 3.5%
Table 2. Comparison of Estimated Cost of Infrastructure Improvement Needs
July 2011 Inventory vs. July 2012 Inventory
Percent
Change
Reported Cost
July 2011
through
June 2016
July 2012
through
June 2017 Category Difference
iiiWWW.TN.GOV/TACIR
Executive Summary
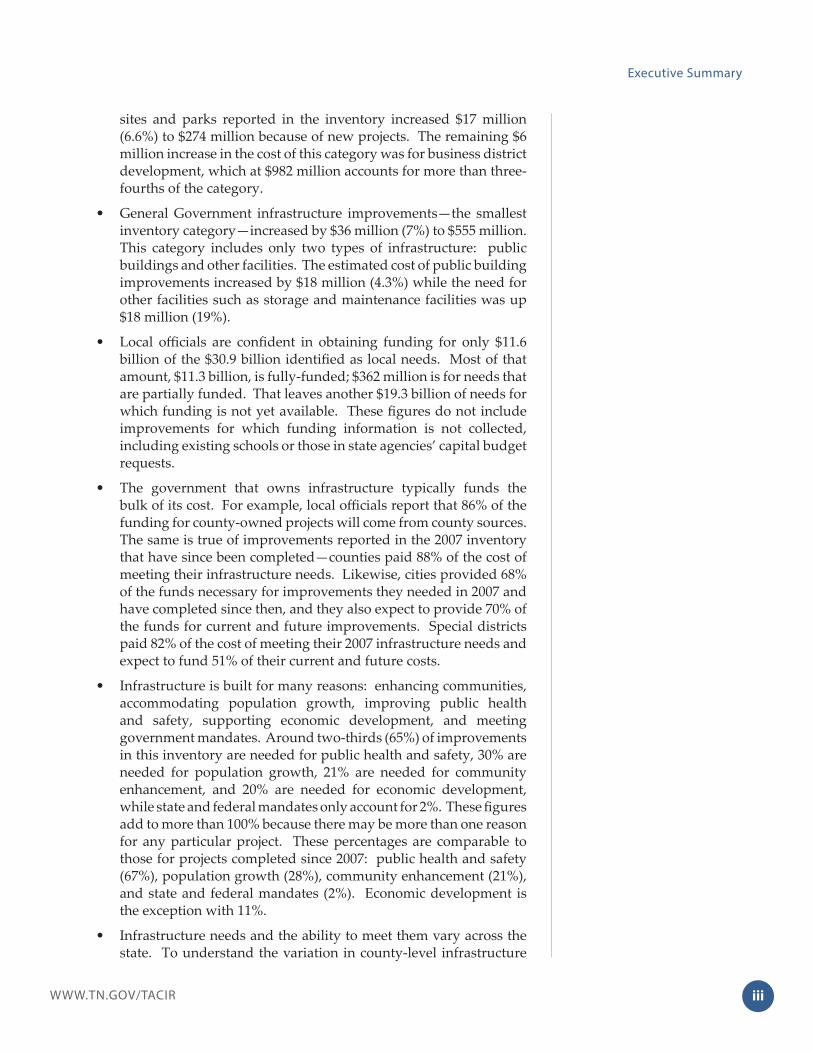
sites and parks reported in the inventory increased $17 million (6.6%) to $274 million because of new projects. The remaining $6 million increase in the cost of this category was for business district development, which at $982 million accounts for more than three- fourths of the category.
• General Government infrastructure improvements—the smallest inventory category—increased by $36 million (7%) to $555 million. This category includes only two types of infrastructure: public buildings and other facilities. The estimated cost of public building improvements increased by $18 million (4.3%) while the need for other facilities such as storage and maintenance facilities was up $18 million (19%).
• Local offi cials are confi dent in obtaining funding for only $11.6 billion of the $30.9 billion identifi ed as local needs. Most of that amount, $11.3 billion, is fully-funded; $362 million is for needs that are partially funded. That leaves another $19.3 billion of needs for which funding is not yet available. These fi gures do not include improvements for which funding information is not collected, including existing schools or those in state agencies’ capital budget requests.
• The government that owns infrastructure typically funds the bulk of its cost. For example, local offi cials report that 86% of the funding for county-owned projects will come from county sources. The same is true of improvements reported in the 2007 inventory that have since been completed—counties paid 88% of the cost of meeting their infrastructure needs. Likewise, cities provided 68% of the funds necessary for improvements they needed in 2007 and have completed since then, and they also expect to provide 70% of the funds for current and future improvements. Special districts paid 82% of the cost of meeting their 2007 infrastructure needs and expect to fund 51% of their current and future costs.
• Infrastructure is built for many reasons: enhancing communities, accommodating population growth, improving public health and safety, supporting economic development, and meeting government mandates. Around two-thirds (65%) of improvements in this inventory are needed for public health and safety, 30% are needed for population growth, 21% are needed for community enhancement, and 20% are needed for economic development, while state and federal mandates only account for 2%. These fi gures add to more than 100% because there may be more than one reason for any particular project. These percentages are comparable to those for projects completed since 2007: public health and safety (67%), population growth (28%), community enhancement (21%), and state and federal mandates (2%). Economic development is the exception with 11%.
• Infrastructure needs and the ability to meet them vary across the state. To understand the variation in county-level infrastructure

WWW.TN.GOV/TACIRiv
Building Tennessee’s Tomorrow: Anticipating the State’s Infrastructure Needs
needs and local governments’ ability to meet them, TACIR staff analyzed infrastructure needs relative to total population, population gain, and fi nancial resources, including local revenue sources and personal income as a measure of residents’ ability to pay taxes. Both the need for infrastructure improvements and improvements that have been completed are closely related to fi nancial resources, population, and population gain or loss but are weakly correlated with population growth rates. Sales tax, one of the local revenue measures, is related to a county’s ability to complete infrastructure improvements but is not signifi cantly related to how much infrastructure is needed, perhaps because of where people shop. Many of Tennessee’s smaller counties have litt le retail activity, and consequently, their residents do much of their shopping in other counties, contributing through the sales taxes they pay to the destination county’s ability to meet its needs rather than their home county’s.
vWWW.TN.GOV/TACIR
Contents
Building Tennessee’s Tomorrow:
Anticipating the State’s Infrastructure Needs
July 2012 through June 2017
CONTENTS
EXECUTIVE SUMMARY ................................................................................................................................................ i
INTRODUCTION ..............................................................................................................................................................1
Why inventory public infrastructure needs? ......................................................................................................1
What infrastructure is included in the inventory?............................................................................................2
How is the inventory accomplished? ....................................................................................................................3
How is the inventory used? ......................................................................................................................................4
What else needs to be done? ..................................................................................................................................5
INFRASTRUCTURE NEEDS STATEWIDE ................................................................................................................7
The estimated cost of public infrastructure needed statewide increased slightly to $38.8 billion. .....................................................................................................................................................7
State infrastructure improvements continue to dominate overall, and county improvements continue to exceed those of cities. .............................................................................. 11
The estimated cost of infrastructure improvements in all three stages of development continues to trend upward. .......................................................................................................................... 12
State and federal mandates aff ect 4.8% of all projects. .............................................................................. 15
INFRASTRUCTURE NEEDS BY COUNTY .......................................................................................................... 17
Infrastructure needs vary widely across Tennessee counties. ................................................................. 17
Both population and wealth factors are strongly tied to infrastructure needs and the ability to meet them. ....................................................................................................................... 20
Population plays the strongest role in explaining infrastructure needs and completions. ........... 21
FUNDING THE STATE’S INFRASTRUCTURE NEEDS ................................................................................... 23
Nearly two-thirds of the funding needed for infrastructure in the current inventory is not yet available. ........................................................................................................................................... 23
Reasons, ownership, and funding sources vary by type of infrastructure ........................................... 25

WWW.TN.GOV/TACIRvi
Building Tennessee’s Tomorrow: Anticipating the State’s Infrastructure Needs
PUBLIC SCHOOL INFRASTRUCTURE NEEDS ................................................................................................... 33
Estimated cost of public school building improvements remains steady ........................................... 33
The need for new public schools and additions increased slightly after declining last year. ...... 34
The number of portables at Tennessee’s public schools has declined slightly as enrollment growth has fl attened out. .................................................................................................. 35
The need to improve existing school buildings continues to increase and now stands at $2.1 billion. ..................................................................................................................................................... 37
Estimated cost to improve school buildings continues to increase, mainly for renovations. ....... 40
Larger systems report greater total costs, while smaller systems often have greater costs per student. ............................................................................................................................................. 41
APPENDIXES .................................................................................................................................................................. 43
Appendix A: Enabling Legislation ................................................................................................................... 45
Appendix B: Project History ............................................................................................................................... 55
Appendix C: Inventory Forms ........................................................................................................................... 57
Appendix D: Public Infrastructure Needs by County ................................................................................ 67
Appendix E: Estimated Cost of Infrastructure Needs Completed by County ................................143
Appendix F: 2012 Property and Sales Tax Bases by County ................................................................147
Appendix G: School System Infrastructure Needs by County .............................................................151
GLOSSARY OF TERMS ............................................................................................................................................. 187
TENNESSEE DEVELOPMENT DISTRICT MAP ................................................................................................ 193

1WWW.TN.GOV/TACIR
Introduction
Building Tennessee’s Tomorrow:
Anticipating the State’s Infrastructure Needs
July 2012 through June 2017
INTRODUCTION
One of the greatest fi scal challenges facing our elected offi cials is dealing with the nation’s aging infrastructure. As the population grows and shifts, new classrooms must be built and equipped to meet our children’s needs. As roads and bridges wear out, they must be repaired or replaced to ensure our safety. And as outdated water lines begin to crack and fail, they must be upgraded to carry clean drinking water safely and effi ciently. These examples are just a few of the demands confronting state and local offi cials as they struggle with the daunting task of matching limited funds to seemingly unlimited needs.
Why do we rely on the public sector for roads, bridges, water lines, and schoolhouses instead of looking to the private sector? The private sector does a fi ne job of providing goods and services when it is possible to monitor and control their use and exclude those who cannot or will not pay an amount suffi cient to generate profi t. In the interest of general health and safety, excluding users is not always desirable, and profi t may not always be possible. Public infrastructure is the answer when the service supported is essential to the common good and the private sector cannot profi tably provide it at a price that makes it accessible to all. Therefore, we look to those who represent us in our public institutions to set priorities and fi nd ways to fund them.
Why inventory public infrastructure needs?
The Tennessee General Assembly affi rmed the value of public infrastructure in legislation enacted in 1996 when it deemed an inventory of those needs necessary “in order for the state, municipal, and county governments of Tennessee to develop goals, strategies, and programs which would
• improve the quality of life of its citizens,
• support livable communities, and
• enhance and encourage the overall economic development of the state

WWW.TN.GOV/TACIR2
Building Tennessee’s Tomorrow: Anticipating the State’s Infrastructure Needs
through the provision of adequate and essential public infrastructure.”1 The public infrastructure needs inventory on which this report is based was derived from surveys of local offi cials by staff of the state’s nine development districts,2 the capital budget requests submitt ed to the Governor by state offi cials as part of the annual budget process, and bridge and road needs from project listings provided by state transportation offi cials. The Commission relies entirely on state and local offi cials to evaluate the infrastructure needs of Tennessee’s citizens as envisioned by the enabling legislation.
What infrastructure is included in the inventory?
For purposes of this report, and based on the direction provided in the public act and common usage, public infrastructure is defi ned as
capital facilities and land assets under public ownershipor operated or maintained for public benefi t.
To be included in the inventory, infrastructure projects must not be considered normal or routine maintenance and must involve a capital cost of at least $50,000.3 This approach, dictated by the public act, is consistent with the characterization of capital projects adopted by the Tennessee General Assembly for its annual budget.
Local offi cials were asked to describe anticipated needs for the period July 1, 2012, through June 30, 2032, classifying those needs by type of project. State-level needs were derived from capital budget requests. Both state and local offi cials were also asked to identify the stage of development as of July 1, 2012. The period covered by each inventory was expanded to 20 years in 2000 because of legislation requiring its use by the Commission to monitor implementation of Tennessee’s Growth Policy Act.4 Plans developed pursuant to that act established growth boundaries for annexation by the state’s municipalities. This report focuses on the fi rst fi ve years of the period covered by the inventory.
Within these parameters, local offi cials are encouraged to report their needs as they relate to developing goals, strategies, and programs to improve their communities. They are limited only by the very broad purposes for public infrastructure as prescribed by law. No independent assessment of need constrains their reporting. In addition, the inventory includes bridge and road needs from project listings provided by state transportation and
1 Chapter 817, Public Acts of 1996. For more information about the enabling legislation, see appendix A.2 For more information on the importance of the inventory to the development districts and local offi cials, see appendix B.3 School technology infrastructure is included for existing schools regardless of cost in order to provide information related to the technology component of the state’s education funding formula.4 Chapter 672, Public Acts of 2000.
The Commission relies entirely on state and
local offi cials to evaluate the infrastructure needs
of Tennessee’s citizens as envisioned by the enabling legislation.
Local offi cials are encouraged to report
their needs as they relate to developing
goals, strategies, and programs to improve
their communities. They are limited only by the
very broad purposes for public infrastructure as
prescribed by law.
3WWW.TN.GOV/TACIR
Introduction
capital needs identifi ed by state offi cials and submitt ed to the governor as part of the annual budget process.
How is the inventory accomplished?
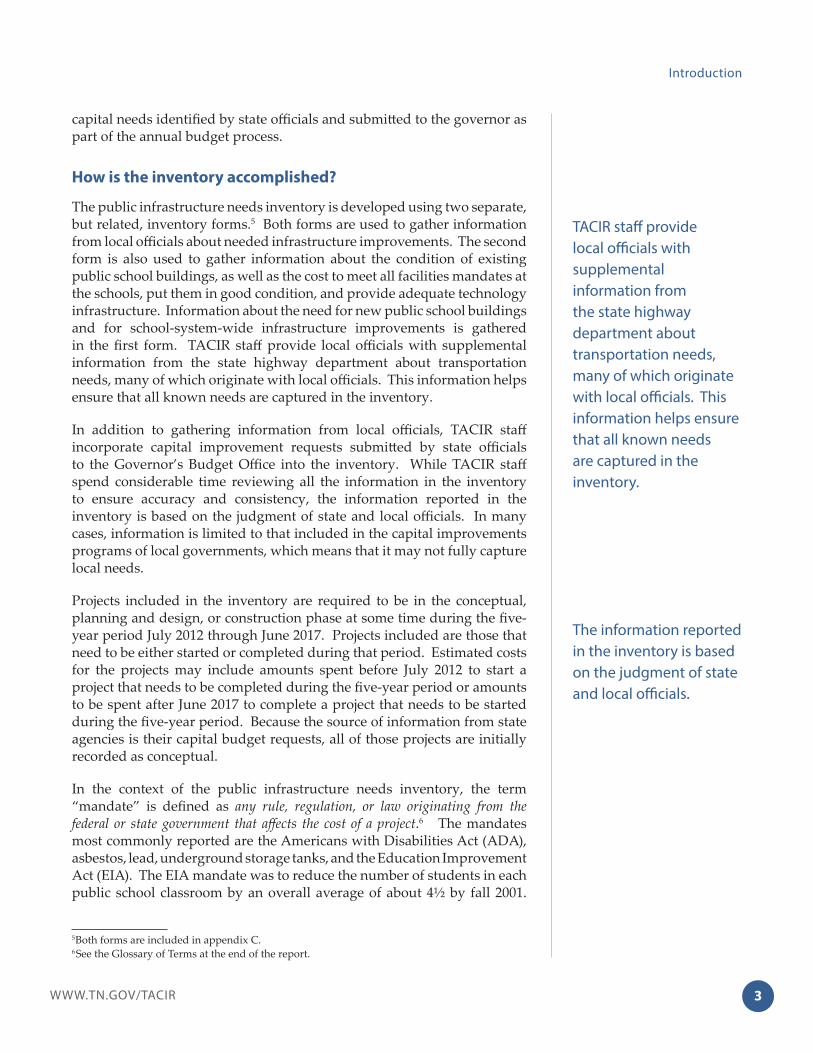
The public infrastructure needs inventory is developed using two separate, but related, inventory forms.5 Both forms are used to gather information from local offi cials about needed infrastructure improvements. The second form is also used to gather information about the condition of existing public school buildings, as well as the cost to meet all facilities mandates at the schools, put them in good condition, and provide adequate technology infrastructure. Information about the need for new public school buildings and for school-system-wide infrastructure improvements is gathered in the fi rst form. TACIR staff provide local offi cials with supplemental information from the state highway department about transportation needs, many of which originate with local offi cials. This information helps ensure that all known needs are captured in the inventory.
In addition to gathering information from local offi cials, TACIR staff incorporate capital improvement requests submitt ed by state offi cials to the Governor’s Budget Offi ce into the inventory. While TACIR staff spend considerable time reviewing all the information in the inventory to ensure accuracy and consistency, the information reported in the inventory is based on the judgment of state and local offi cials. In many cases, information is limited to that included in the capital improvements programs of local governments, which means that it may not fully capture local needs.
Projects included in the inventory are required to be in the conceptual, planning and design, or construction phase at some time during the fi ve-year period July 2012 through June 2017. Projects included are those that need to be either started or completed during that period. Estimated costs for the projects may include amounts spent before July 2012 to start a project that needs to be completed during the fi ve-year period or amounts to be spent after June 2017 to complete a project that needs to be started during the fi ve-year period. Because the source of information from state agencies is their capital budget requests, all of those projects are initially recorded as conceptual.
In the context of the public infrastructure needs inventory, the term “mandate” is defi ned as any rule, regulation, or law originating from the federal or state government that aff ects the cost of a project.6 The mandates most commonly reported are the Americans with Disabilities Act (ADA), asbestos, lead, underground storage tanks, and the Education Improvement Act (EIA). The EIA mandate was to reduce the number of students in each public school classroom by an overall average of about 4½ by fall 2001.
5 Both forms are included in appendix C.6 See the Glossary of Terms at the end of the report.
TACIR staff provide local offi cials with supplemental information from the state highway department about transportation needs, many of which originate with local offi cials. This information helps ensure that all known needs are captured in the inventory.
The information reported in the inventory is based on the judgment of state and local offi cials.
WWW.TN.GOV/TACIR4
Building Tennessee’s Tomorrow: Anticipating the State’s Infrastructure Needs
Tennessee public schools began working toward that goal with passage of the EIA in 1992 and met it by hiring a suffi cient number of teachers.
Except in the case of existing public schools, the inventory does not include estimates of the cost to comply with mandates, only whether the need was the result of a mandate; therefore, mandates themselves are not analyzed here other than to report the number of projects aff ected by mandates.
How is the inventory used?
The public infrastructure needs inventory is both a product and a continuous process, one that has been useful in
• short-term and long-range planning,
• providing a framework for funding decisions,
• increasing public awareness of infrastructure needs, and
• fostering bett er communication and collaboration among agencies and decision makers.
The inventory promotes planning and setting priorities.
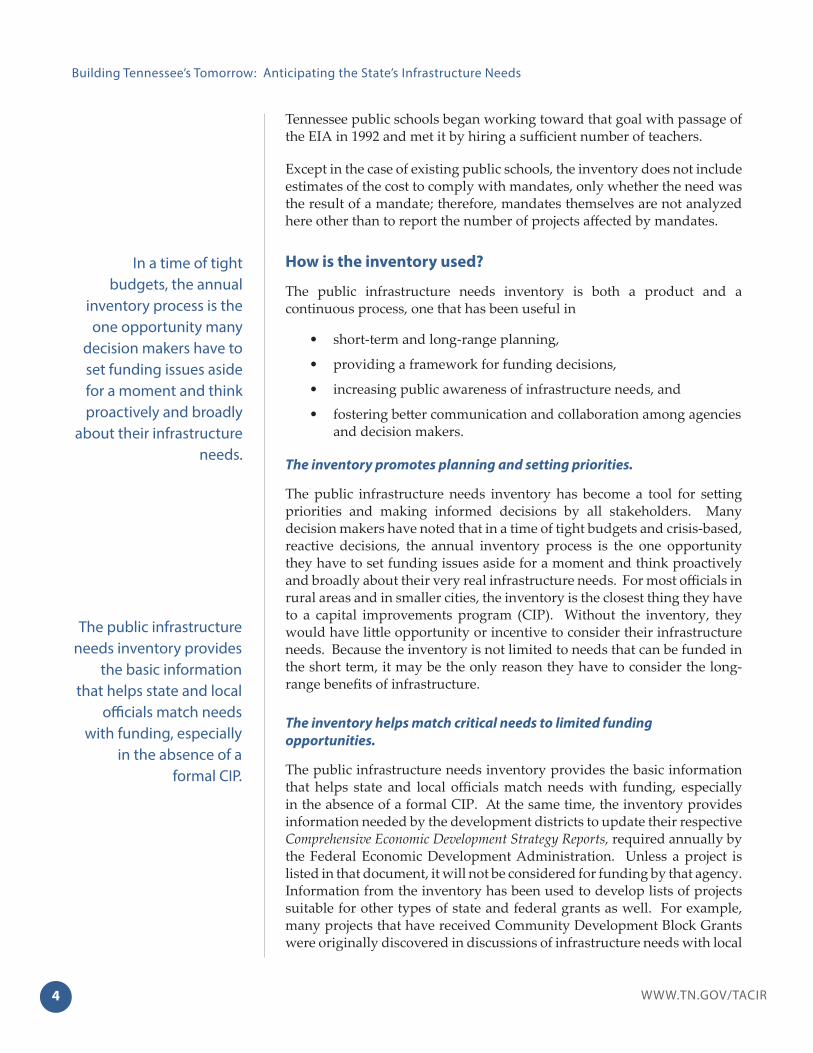
The public infrastructure needs inventory has become a tool for sett ing priorities and making informed decisions by all stakeholders. Many decision makers have noted that in a time of tight budgets and crisis-based, reactive decisions, the annual inventory process is the one opportunity they have to set funding issues aside for a moment and think proactively and broadly about their very real infrastructure needs. For most offi cials in rural areas and in smaller cities, the inventory is the closest thing they have to a capital improvements program (CIP). Without the inventory, they would have litt le opportunity or incentive to consider their infrastructure needs. Because the inventory is not limited to needs that can be funded in the short term, it may be the only reason they have to consider the long-range benefi ts of infrastructure.
The inventory helps match critical needs to limited funding
opportunities.
The public infrastructure needs inventory provides the basic information that helps state and local offi cials match needs with funding, especially in the absence of a formal CIP. At the same time, the inventory provides information needed by the development districts to update their respective Comprehensive Economic Development Strategy Reports, required annually by the Federal Economic Development Administration. Unless a project is listed in that document, it will not be considered for funding by that agency. Information from the inventory has been used to develop lists of projects suitable for other types of state and federal grants as well. For example, many projects that have received Community Development Block Grants were originally discovered in discussions of infrastructure needs with local
The public infrastructure needs inventory provides
the basic information that helps state and local
offi cials match needs with funding, especially
in the absence of a formal CIP.
In a time of tight budgets, the annual
inventory process is the one opportunity many
decision makers have to set funding issues aside for a moment and think proactively and broadly
about their infrastructure needs.

5WWW.TN.GOV/TACIR
Introduction
government offi cials. And it has also helped state decision makers identify gaps between critical needs and available state, local, and federal funding, including an assessment of whether various communities can aff ord to meet their infrastructure needs or whether some additional planning needs to be done at the state level about how to help them.
The inventory provides an annual review of conditions and needs of
public school facilities.
The schools’ portion of the inventory is structured so that the condition of all schools is known, not just the ones in need of repair or replacement. Data can be retrieved from the database and analyzed to identify particular needs, such as technology. This information is useful in pinpointing pressing needs for particular schools and districts, as well as providing an overview of statewide needs. This unique, statewide database provides information about the condition and needs of Tennessee’s public school facilities.
The inventory increases public awareness and fosters better
communication and collaboration among decision makers.
The state’s infrastructure needs have been reported to a larger public audience, and the process has fostered bett er communication between the development districts, local and state offi cials, and decision makers. The resulting report has become a working document used at the local, state, and regional levels. It gives voice to the often-underserved small towns and rural communities. Each update of the report provides an opportunity for reevaluation and reexamination of projects and for improvements in the quality of the inventory and the report itself. This report is unique in terms of its broad scope and comprehensive nature. Through the inventory process, development districts have expanded their contact, communication, and collaboration with agencies not traditionally sought after (e.g., local boards of education, utility districts, and the Tennessee Department of Transportation) and strengthened personal relationships and trust with their more traditional local and state contacts. Infrastructure needs are being identifi ed, assessed, and addressed locally and documented for the Tennessee General Assembly, various state agencies, and decision makers for further assessment and consideration.
What else needs to be done?
The data collection process continues to improve, and the current inventory is more complete and accurate than ever. The Commission has tried to strike a balance between requiring suffi cient information to satisfy the intent of the law and creating an impediment to local offi cials reporting their needs. By law, the inventory is required of TACIR, but it is not required of state or local offi cials; they may decline to participate without penalty. Similarly, they may provide only partial information. This can make comparisons across jurisdictions and across time diffi cult.
Many projects that have received Community Development Block Grants were originally discovered in discussions of infrastructure needs with local government offi cials.
Each update of this report provides an opportunity for reevaluation and reexamination of projects and for improvements in the quality of the inventory and the report itself.

WWW.TN.GOV/TACIR6
Building Tennessee’s Tomorrow: Anticipating the State’s Infrastructure Needs
But with each annual inventory, participants have become more familiar with the process and more supportive of the program.
Information from the annual inventory is being used for local planning and community and economic development grants. In addition, anyone with an interest in infrastructure needs can access this information online at ctasdata.utk.tennessee.edu through a partnership with the University of Tennessee’s County Technical Assistance Service. There you can compare counties and diff erent types of infrastructure needs using online mapping services, extract data, and even link to the data.
Information about public infrastructure
needs in Tennessee is now available online at ctasdata.utk.tennessee.
edu.

7WWW.TN.GOV/TACIR
Infrastructure Needs Statewide
Building Tennessee’s Tomorrow:
Anticipating the State’s Infrastructure Needs
July 2012 through June 2017
INFRASTRUCTURE NEEDS STATEWIDE
The estimated cost of public infrastructure needed statewide increased slightly
to $38.8 billion.
State and local offi cials estimate the cost of public infrastructure improvements that need to be in some stage of development between July 1, 2012, and June 30, 2017, at $38.8 billion, an increase of approximately $1.3 billion (3.5%) from last year’s report (see table 3).7 This is the largest amount
7 Totals for the July 2011 inventory have been adjusted because of ongoing data quality control. For complete listings of all needs reported in the July 2012 inventory by county and by public school system, see appendixes D and G.
Category and Type of Need
July 2011
Inventory
July 2012
Inventory Difference
Percent
Change
Transportation and Utilities 20,865,809,131$ 21,767,009,662$ 901,200,531$ 4.3%
Transportation 20,626,268,422 21,543,213,953 916,945,531 4.4%Other Utilities 226,440,709 211,295,709 (15,145,000) -6.7%Telecommunications 13,100,000 12,500,000 (600,000) -4.6%Education 7,271,463,459$ 7,677,898,721$ 406,435,262$ 5.6%
Post-secondary Education & Preschools 3,710,190,100 4,036,894,855 326,704,755 8.8%School Renovations & Replacements* 2,001,594,801 2,055,256,934 53,662,133 2.7%New Public Schools & Additions 1,496,433,558 1,534,325,932 37,892,374 2.5%School System-wide 63,245,000 51,421,000 (11,824,000) -18.7%Health, Safety, and Welfare 5,941,679,207$ 5,883,470,673$ (58,208,534)$ -1.0%
Water and Wastewater 3,963,989,570 3,859,873,821 (104,115,749) -2.6%Law Enforcement 1,178,436,758 1,297,045,107 118,608,349 10.1%Public Health Facilities 426,157,900 336,964,500 (89,193,400) -20.9%Fire Protection 169,835,678 186,075,132 16,239,454 9.6%Storm Water 154,941,202 153,340,113 (1,601,089) -1.0%Solid Waste 33,518,099 36,172,000 2,653,901 7.9%Housing 14,800,000 14,000,000 (800,000) -5.4%Recreation and Culture 1,704,816,699$ 1,702,200,925$ (2,615,774)$ -0.2%
Recreation 932,706,629 975,235,657 42,529,028 4.6%Community Development 455,741,259 412,358,334 (43,382,925) -9.5%Libraries, Museums, and Historic Sites 316,368,811 314,606,934 (1,761,877) -0.6%Economic Development 1,232,847,959$ 1,256,075,051$ 23,227,092$ 1.9%
Business District Development 975,460,620 981,788,620 6,328,000 0.6%Industrial Sites and Parks 257,387,339 274,286,431 16,899,092 6.6%General Government 518,672,149$ 554,828,960$ 36,156,811$ 7.0%
Public Buildings 424,174,200 442,438,106 18,263,906 4.3%Other Facilities 94,497,949 112,390,854 17,892,905 18.9%Grand Total 37,535,288,604$ 38,841,483,992$ 1,306,195,388$ 3.5%
July 2011 Inventory vs. July 2012 InventoryTable 3. Comparison of Estimated Cost of Needed Infrastructure Improvements
*Existing school improvements include technology projects with estimated costs below the $50,000 threshold used for other infrastructure types analyzed in this inventory. Individual technology projects under the threshold totaled $4,041,845 in 2012 and $5,501,526 in 2011.
WWW.TN.GOV/TACIR8
Building Tennessee’s Tomorrow: Anticipating the State’s Infrastructure Needs
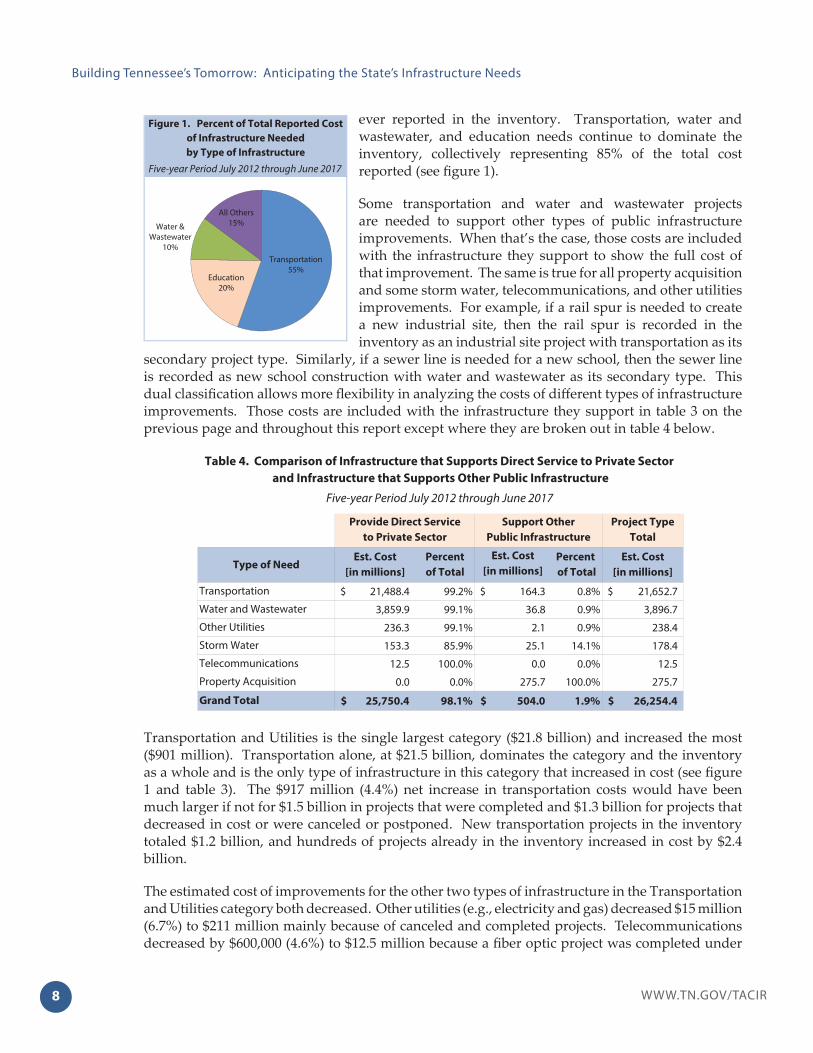
ever reported in the inventory. Transportation, water and wastewater, and education needs continue to dominate the inventory, collectively representing 85% of the total cost reported (see fi gure 1).
Some transportation and water and wastewater projects are needed to support other types of public infrastructure improvements. When that’s the case, those costs are included with the infrastructure they support to show the full cost of that improvement. The same is true for all property acquisition and some storm water, telecommunications, and other utilities improvements. For example, if a rail spur is needed to create a new industrial site, then the rail spur is recorded in the inventory as an industrial site project with transportation as its
secondary project type. Similarly, if a sewer line is needed for a new school, then the sewer line is recorded as new school construction with water and wastewater as its secondary type. This dual classifi cation allows more fl exibility in analyzing the costs of diff erent types of infrastructure improvements. Those costs are included with the infrastructure they support in table 3 on the previous page and throughout this report except where they are broken out in table 4 below.
Transportation and Utilities is the single largest category ($21.8 billion) and increased the most ($901 million). Transportation alone, at $21.5 billion, dominates the category and the inventory as a whole and is the only type of infrastructure in this category that increased in cost (see fi gure 1 and table 3). The $917 million (4.4%) net increase in transportation costs would have been much larger if not for $1.5 billion in projects that were completed and $1.3 billion for projects that decreased in cost or were canceled or postponed. New transportation projects in the inventory totaled $1.2 billion, and hundreds of projects already in the inventory increased in cost by $2.4 billion.
The estimated cost of improvements for the other two types of infrastructure in the Transportation and Utilities category both decreased. Other utilities (e.g., electricity and gas) decreased $15 million (6.7%) to $211 million mainly because of canceled and completed projects. Telecommunications decreased by $600,000 (4.6%) to $12.5 million because a fi ber optic project was completed under
Project Type
Total
Est. Cost
[in millions]
Percent
of Total
Est. Cost
[in millions]
Percent
of Total
Est. Cost
[in millions]
21,488.4$ 99.2% 164.3$ 0.8% 21,652.7$
3,859.9 99.1% 36.8 0.9% 3,896.7
236.3 99.1% 2.1 0.9% 238.4
153.3 85.9% 25.1 14.1% 178.4
12.5 100.0% 0.0 0.0% 12.5
0.0 0.0% 275.7 100.0% 275.7
25,750.4$ 98.1% 504.0$ 1.9% 26,254.4$
Table 4. Comparison of Infrastructure that Supports Direct Service to Private Sector
and Infrastructure that Supports Other Public Infrastructure
Five-year Period July 2012 through June 2017
Grand Total
Provide Direct Service
to Private Sector
Support Other
Public Infrastructure
Type of Need
Storm Water
Telecommunications
Property Acquisition
Water and Wastewater
Other Utilities
Transportation
Figure 1. Percent of Total Reported Cost
of Infrastructure Needed
by Type of Infrastructure
Five-year Period July 2012 through June 2017
Transportation 55%
Education20%
Water & Wastewater
10%
All Others15%
9WWW.TN.GOV/TACIR
Infrastructure Needs Statewide
budget in Greeneville, and a plan to expand the county communication network to cities in Dickson County was canceled.
The other categories are relatively small compared with Transportation and Utilities. Education is the second largest ($7.7 billion) and increased $406 million (5.6%) mainly because the cost of improvements needed at the state’s public college and university campuses increased $327 million (8.8%) to $4 billion. Proposed new science facilities and energy upgrades are the primary reasons for this increase. The University of Tennessee in Knoxville (UTK) is responsible for almost half of the new cost ($280 million), including a $90 million, 200,000-square-foot, multi-disciplinary science lab and a $45 million, 120,000-square-foot, energy and environmental science and research center at the Institute of Agriculture in Knox County. The UT Health Science Center in Shelby County also needs $45 million to renovate classrooms and labs, and UT Martin in Weakley County needs $32 million to renovate and expand engineering classrooms. Finally, Tennessee State University needs $38 million to modernize its long-term student housing.
The estimated cost of school additions and new public schools has been on a downward trend since 2007, and there has been a shift from adding new space to improving or replacing existing space. The shift from new space to improving existing space is partly the result of a slowing of enrollment growth that began in 2007, coinciding with the economic downturn, and remains low. Even so, the need for both additions and new schools increased slightly since last year, $38 million (2.5%), to $1.5 billion mainly because Williamson County needs $81 million for four new schools. The cost of improvements needed at existing schools, including renovations ($1.5 billion), replacement schools ($302 million), technology ($124 million), and renovations caused by mandates ($122 million), increased $54 million (2.7%) to $2.1 billion—the fourth straight year that the estimated cost for this type of infrastructure improvement has grown. School-system-wide needs for projects like bus garages and central offi ce buildings, which serve entire school systems, decreased $12 million (18.7%) to $51 million. The school chapter, presented later in this report, provides more information about infrastructure needs for the state’s public schools.
Health, Safety, and Welfare, the third-largest category, decreased $58 million (1%) to $5.9 billion. This decline resulted primarily from decreases in the need for improved water and wastewater infrastructure and public health facilities. Water and wastewater accounts for the largest portion of the Health, Safety, and Welfare category at $3.9 billion; it decreased by $104 million (2.6%) from last year. Water treatment plant expansions were completed in Shelbyville and Murfreesboro at a cost of $25 and $37 million, a sewer treatment plant upgrade was completed in Gallatin at a cost of $30 million, and the Water and Wastewater Authority of Wilson County completed a water distribution system at a cost of $20 million. The largest new project was Clarksville’s $71 million wastewater treatment plant, needed to replace the one severely damaged in the 2010 fl ood.
In 2010, it was estimated that defi ciencies in America’s surface transportation systems cost households and businesses (including vehicle repairs and operating costs) nearly $130 billion. If present trends continue, by 2020 the annual costs imposed on the U.S. economy from deteriorating surface transportation will increase to $210 billion, and by 2040 to $520 billion.American Society of Civic Engineers, Failure to Act: The Economic Impact of Current Investment Trends in Surface Transportation Infrastructure, 2013, pg 17. http://www.asce.org/uploadedFiles/Infrastructure/Failure_to_Act/Failure_to_Act_Report.pdf
WWW.TN.GOV/TACIR10
Building Tennessee’s Tomorrow: Anticipating the State’s Infrastructure Needs
The estimated cost for public health facilities declined $89 million (21%) to $337 million because of postponed and completed projects. The Tennessee Department of Intellectual and Developmental Disabilities postponed $47 million in facilities and upgrades because of changes in their facilities master plan. Out of $34 million in completed projects, the two largest were the $8.5 million Woodbine Clinic in Nashville and the $8.4 million regional health facility in Putnam County.
Storm water infrastructure and public housing also contributed to the decrease in the Health, Safety, and Welfare category. Storm water improvements declined $1.6 million (1%) to $153 million mainly because of four completed projects totaling $7.5 million. The two largest were drainage mitigation projects in Clarksville ($3.7 million) and Madisonville ($3.5 million). The cost of public housing improvements fell by $800,000 (5.4%) to $14 million. No new housing infrastructure needs were reported; two projects were completed in Carter and Grundy counties totaling $793,000.
The decrease in cost for Health, Safety, and Welfare projects would have been larger if not for increases in law enforcement, fi re protection, and solid waste infrastructure. Although law enforcement needs, including prisons, jails, justice centers, and police stations, declined in each of the last three inventories, they increased $119 million (10.1%) to $1.3 billion this year because the fi ve-year reporting period now includes a $198 million women’s prison in East Tennessee. Infrastructure needed for fi re protection (e.g., emergency communications systems, sprinkler systems, and fi re stations) increased $16 million (9.6%) to $186 million. This increase was mainly caused by new projects totaling $25 million. In addition, the estimated cost of six fi re protection projects grew by a combined $14 million. Infrastructure needed to handle solid waste increased $2.7 million (8%) to $36 million because Smith and White counties now need to expand their landfi lls.
The Recreation and Culture category decreased only slightly this year, $2.6 million (0.2%) to $1.7 billion, because increases in cost of recreation infrastructure partially off set decreases in the other two types of infrastructure in this category, community development and libraries, museums, and historic sites. The cost of recreational infrastructure improvements reported in the inventory increased almost $43 million (4.6%) to $975 million because of new projects. The three largest projects are Gatlinburg’s Rocky Top Sports Arena ($22 million), a new soccer complex in Clarksville ($15 million), and East Tennessee State University’s proposed renovation of the multi-purpose Memorial Center Arena, also known as the “Mini-Dome” ($12 million).
The estimated cost of infrastructure improvements for community development declined by more than $43 million (9.5%) to $412 million because of a combination of completed projects, postponed projects, and decreases in estimates for projects already in the inventory. The largest
The American Water Works Association indicated that
the 237,600 water line breaks each year in the U.S.
cost public water utilities approximately $2.8 billion
annually. Further, aging, leaky pipes steal 7 billion
gallons each day from our water systems, according
to the American Society of Civil Engineers.
Jesse Berst, Water World Magazine, “Patching Up the Pipes: How Smart
Technologies Help Cities Prevent Leaks and Save Money,” July 2014,
Vol. 30, Issue 7.http://www.waterworld.com/
articles/print/volume-30/issue-7/editorial-features/patching-up-the-
pipes-how-smart-technologies-help-cities-prevent-leaks-and-save-
money.html
11WWW.TN.GOV/TACIR
Infrastructure Needs Statewide
project completed was a $15 million community center in Johnson City. Similarly, the estimated cost of infrastructure improvements for libraries, museums, and historic sites decreased by $1.8 million (0.6%) to $315 million because of completed needs. Goodlett sville’s newly fi nished $6 million library by itself represented 62% of the $9.7 million in completed needs for libraries, museums, and historic sites in this year’s inventory.
The estimated cost of both types of infrastructure in the Economic Development category increased and now totals $1.3 billion, up by $23 million (1.9%) since the last inventory. The cost of industrial sites and parks reported in the inventory increased $17 million (6.6%) to $274 million because of new projects, including a new $10 million park in Sevier County and a $15 million park in Fairview with a greenway between the industrial and commercial complexes. The remaining $6 million increase in the cost of this category was for business district development, which at $982 million accounts for more than three-fourths of the Economic Development category. The largest increase was in the estimated cost of the Putnam County business park ($5 million). The second-largest increase was $1.5 million for phase 2 of Erwin City’s downtown historic district renovation. The overall increase in business district development would have been larger if not for a canceled $2 million plan to redevelop a neglected commercial space in Maury County.
At $555 million, General Government is the smallest category, but it increased by the third-largest amount, $36 million (7%) since the last inventory. This category includes only two types of infrastructure: public buildings ($442 million) and other facilities that do not fi t the defi nition of a more specifi c type of infrastructure, (e.g., $112 million for storage and maintenance facilities). The estimated cost of new or improved public buildings increased $18 million (4.3%) and includes $120 million to renovate and upgrade state buildings in Davidson County. Infrastructure improvements needed for other facilities increased $18 million (18.9%), including a new $12 million armory in Warren County. Shelby and Davidson counties also need a combined $10 million to renovate and expand state veteran cemeteries.
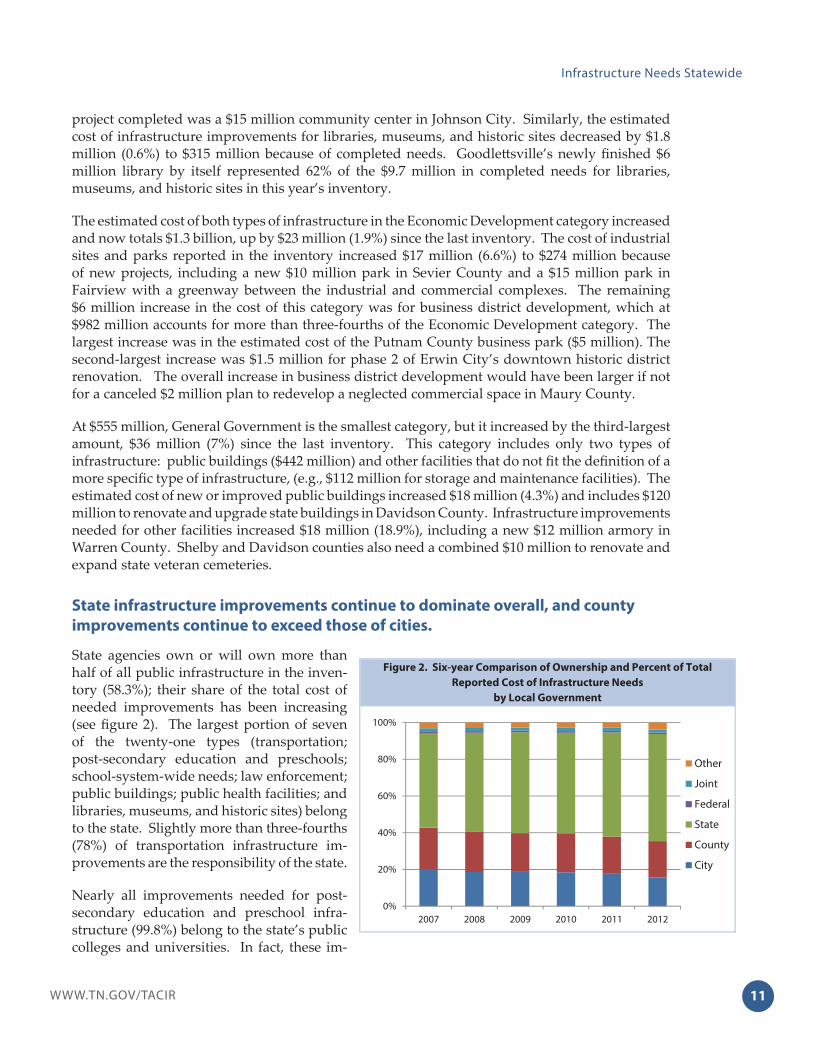
State infrastructure improvements continue to dominate overall, and county
improvements continue to exceed those of cities.
State agencies own or will own more than half of all public infrastructure in the inven-tory (58.3%); their share of the total cost of needed improvements has been increasing (see fi gure 2). The largest portion of seven of the twenty-one types (transportation; post-secondary education and preschools; school-system-wide needs; law enforcement; public buildings; public health facilities; and libraries, museums, and historic sites) belong to the state. Slightly more than three-fourths (78%) of transportation infrastructure im-provements are the responsibility of the state.
Nearly all improvements needed for post-secondary education and preschool infra-structure (99.8%) belong to the state’s public colleges and universities. In fact, these im-
Figure 2. Six-year Comparison of Ownership and Percent of Total
Reported Cost of Infrastructure Needs
by Local Government
0%
20%
40%
60%
80%
100%
2007 2008 2009 2010 2011 2012
Other
Joint
Federal
State
County
City

WWW.TN.GOV/TACIR12
Building Tennessee’s Tomorrow: Anticipating the State’s Infrastructure Needs
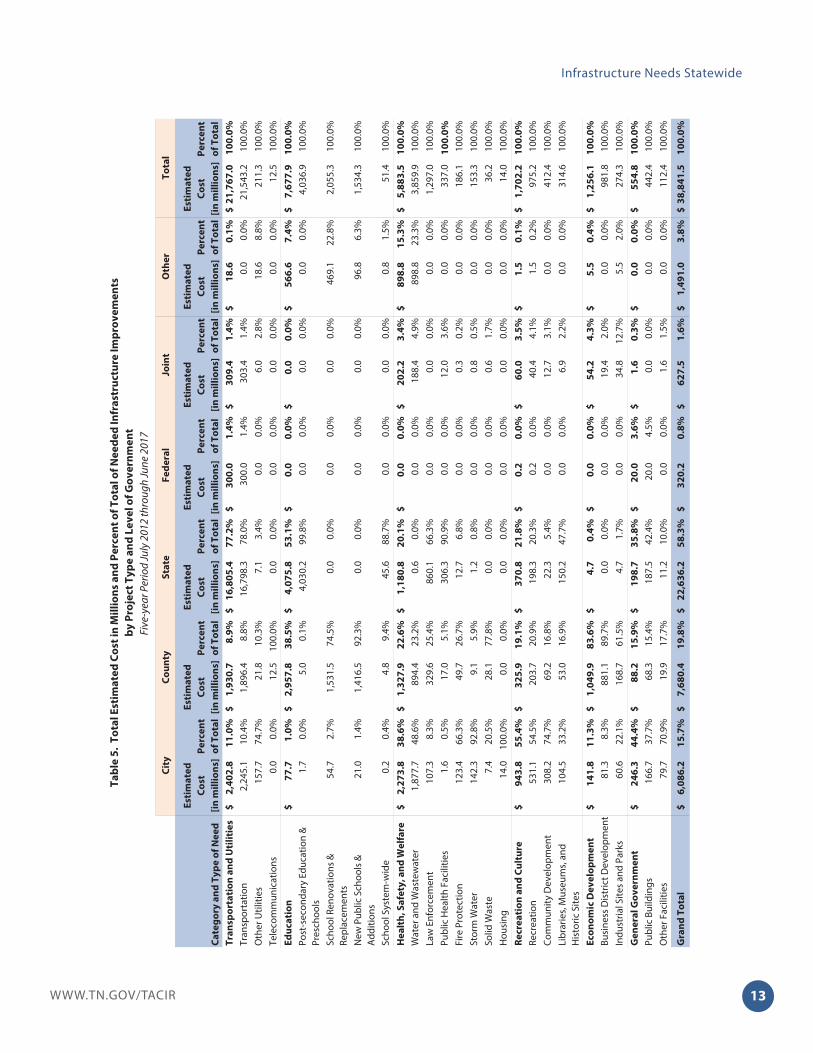
provements, combined with transportation, comprise the bulk of state-owned infrastructure in the inventory, accounting for $20.8 billion of the $22.6 billion total reported for state government. The next largest areas of state responsibility are law enforcement and public health facilities. As shown in table 5, state needs exceed half of the totals for both of these types of infrastructure even though the dollar amounts are relatively small. The state’s share of law enforcement costs is 66.3% ($860.1 million) and the state’s share of public health facilities is 90.9% ($306.3 million). When transportation projects are excluded from total costs, ownership is more evenly distributed across cities (22.2%), counties (33.4%), and the state (33.7%), with 1.9% in joint ownership, 8.6% owned by other types of governmental entities such as utility districts, and only a tiny fraction (0.1%) in federal ownership.
At the local level, infrastructure needed by counties slightly exceeds what is needed by cities. Counties’ improvements make up over 83.6% of the Economic Development category because of the new convention center in Nashville. The convention center accounts for 71.7% of the estimated cost for business district development and 56% of the total for the entire Economic Development category.8 The convention center is treated as a county need because it was reported by a metropolitan government.9 Besides economic development, counties are also responsible for most of the new school and addition construction (92.3%), solid waste (77.8%), and school renovations and replacements (74.5%).
On the other hand, cities’ needs make up the largest portion of the Recreation and Culture category (55.4%); the General Government category (44.4%); and the Health, Safety, and Welfare category (38.6%). Cities need most of the infrastructure in eight of the twenty-one project types in the inventory. Around half of the water and wastewater infrastructure (48.6%) in the inventory will belong to cities, as will all public housing, nearly all storm water (92.8%), most other utilities (74.7%), community development (74.7%), other facilities (70.9%), fi re protection (66.3%), and recreation (54.5%) infrastructure. Cities will also own 37.7% of public building improvements.
The estimated cost of infrastructure improvements in all three stages of
development continues to trend upward.
The overall distribu-tion of infrastructure by stage—conceptual, planning and design, and construction—has remained consis-tent over the past six years with upward trends in the estimat-ed cost of infrastruc-ture improvements in all three (see fi gure 3). Projects in the con-ceptual stage make up
8 The Nashville convention center was completed in the spring of 2013 but this report only includes completions as of July 1, 2012.9 Metropolitan governments have the characteristics of incorporated places and remain administrative divisions of the state with all the responsibilities of counties. For that reason, they are treated as county governments in the inventory.
Figure 3. Six-year Comparison of Percent of Total Reported Cost
of Infrastructure Needs by Stage
0
2,000
4,000
6,000
8,000
10,000
12,000
14,000
16,000
18,000
20,000
Conceptual Planning & Design Construction
Co
st i
n M
illi
on
s
Stage of Development
2007
2008
2009
2010
2011
2012
13WWW.TN.GOV/TACIR
Infrastructure Needs Statewide
Cit
yC
ou
nty
Sta
teF
ed
era
lJo
int
Oth
er
To
tal
Ca
teg
ory
an
d T
yp
e o
f N
ee
d
Est
ima
ted
Co
st
[in
mil
lio
ns]
Pe
rce
nt
of
To
tal
Est
ima
ted
Co
st
[in
mil
lio
ns]
Pe
rce
nt
of
To
tal
Est
ima
ted
Co
st
[in
mil
lio
ns]
Pe
rce
nt
of
To
tal
Est
ima
ted
Co
st
[in
mil
lio
ns]
Pe
rce
nt
of
To
tal
Est
ima
ted
Co
st
[in
mil
lio
ns]
Pe
rce
nt
of
To
tal
Est
ima
ted
Co
st
[in
mil
lio
ns]
Pe
rce
nt
of
To
tal
Est
ima
ted
Co
st
[in
mil
lio
ns]
Pe
rce
nt
of
To
tal
Tra
nsp
ort
ati
on
an
d U
tili
tie
s2
,40
2.8
$
1
1.0
%1
,93
0.7
$
8
.9%
16
,80
5.4
$
7
7.2
%3
00
.0$
1
.4%
30
9.4
$
1.4
%1
8.6
$
0
.1%
21
,76
7.0
$
10
0.0
%
Tran
spor
tatio
n2,
245.
1
10.4
%1,
896.
4
8.8%
16,7
98.3
78
.0%
300.
0
1.4%
303.
4
1.4%
0.0
0.0%
21,5
43.2
10
0.0%
Oth
er U
tiliti
es15
7.7
74
.7%
21.8
10
.3%
7.1
3.
4%0.
0
0.
0%6.
0
2.
8%18
.6
8.8%
211.
3
10
0.0%
Tele
com
mun
icat
ions
0.0
0.0%
12.5
10
0.0%
0.0
0.
0%0.
0
0.
0%0.
0
0.
0%0.
0
0.
0%12
.5
100.
0%E
du
ca
tio
n7
7.7
$
1
.0%
2,9
57
.8$
38
.5%
4,0
75
.8$
5
3.1
%0
.0$
0
.0%
0.0
$
0.0
%5
66
.6$
7
.4%
7,6
77
.9$
10
0.0
%
Post
-sec
onda
ry E
duca
tion
&
Pres
choo
ls1.
7
0.
0%5.
0
0.
1%4,
030.
2
99
.8%
0.0
0.0%
0.0
0.0%
0.0
0.0%
4,03
6.9
10
0.0%
Scho
ol R
enov
atio
ns &
Re
plac
emen
ts54
.7
2.7%
1,53
1.5
74
.5%
0.0
0.
0%0.
0
0.
0%0.
0
0.
0%46
9.1
22
.8%
2,05
5.3
10
0.0%
New
Pub
lic S
choo
ls &
A
dditi
ons
21.0
1.
4%1,
416.
5
92.3
%0.
0
0.0%
0.0
0.0%
0.0
0.0%
96.8
6.
3%1,
534.
3
100.
0%
Scho
ol S
yste
m-w
ide
0.2
0.4%
4.8
9.4%
45.6
88.7
%0.
0
0.
0%0.
0
0.
0%0.
8
1.
5%51
.4
100.
0%H
ea
lth
, S
afe
ty,
an
d W
elf
are
2,2
73
.8$
38
.6%
1,3
27
.9$
22
.6%
1,1
80
.8$
2
0.1
%0
.0$
0
.0%
20
2.2
$
3.4
%8
98
.8$
1
5.3
%5
,88
3.5
$
1
00
.0%
Wat
er a
nd W
aste
wat
er1,
877.
7
48.6
%89
4.4
23
.2%
0.6
0.
0%0.
0
0.
0%18
8.4
4.
9%89
8.8
23
.3%
3,85
9.9
10
0.0%
Law
Enf
orce
men
t10
7.3
8.
3%32
9.6
25
.4%
860.
1
66.3
%0.
0
0.
0%0.
0
0.
0%0.
0
0.
0%1,
297.
0
100.
0%Pu
blic
Hea
lth F
acili
ties
1.6
0.5%
17.0
5.
1%30
6.3
90
.9%
0.0
0.0%
12.0
3.
6%0.
0
0.
0%33
7.0
10
0.0
%
Fire
Pro
tect
ion
123.
4
66.3
%49
.7
26.7
%12
.7
6.
8%0.
0
0.
0%0.
3
0.
2%0.
0
0.
0%18
6.1
100.
0%St
orm
Wat
er14
2.3
92
.8%
9.1
5.9%
1.2
0.
8%0.
0
0.
0%0.
8
0.
5%0.
0
0.
0%15
3.3
100.
0%So
lid W
aste
7.4
20.5
%28
.1
77.8
%0.
0
0.0%
0.0
0.0%
0.6
1.7%
0.0
0.0%
36.2
10
0.0%
Hou
sing
14.0
10
0.0%
0.0
0.0%
0.0
0.
0%0.
0
0.
0%0.
0
0.
0%0.
0
0.
0%14
.0
100.
0%R
ec
rea
tio
n a
nd
Cu
ltu
re9
43
.8$
5
5.4
%3
25
.9$
1
9.1
%3
70
.8$
21
.8%
0.2
$
0.0
%6
0.0
$
3
.5%
1.5
$
0.1
%1
,70
2.2
$
1
00
.0%
Recr
eatio
n53
1.1
54
.5%
203.
7
20.9
%19
8.3
20
.3%
0.2
0.0%
40.4
4.
1%1.
5
0.
2%97
5.2
100.
0%Co
mm
unity
Dev
elop
men
t30
8.2
74
.7%
69.2
16
.8%
22.3
5.4%
0.0
0.0%
12.7
3.
1%0.
0
0.
0%41
2.4
100.
0%Li
brar
ies,
Mus
eum
s, a
nd
His
toric
Site
s10
4.5
33
.2%
53.0
16
.9%
150.
2
47.7
%0.
0
0.
0%6.
9
2.
2%0.
0
0.
0%31
4.6
100.
0%
Ec
on
om
ic D
ev
elo
pm
en
t1
41
.8$
1
1.3
%1
,04
9.9
$
8
3.6
%4
.7$
0.4
%0
.0$
0
.0%
54
.2$
4.3
%5
.5$
0
.4%
1,2
56
.1$
10
0.0
%
Busi
ness
Dis
tric
t Dev
elop
men
t81
.3
8.3%
881.
1
89.7
%0.
0
0.0%
0.0
0.0%
19.4
2.
0%0.
0
0.
0%98
1.8
100.
0%In
dust
rial S
ites
and
Park
s60
.6
22.1
%16
8.7
61
.5%
4.7
1.
7%0.
0
0.
0%34
.8
12.7
%5.
5
2.
0%27
4.3
100.
0%G
en
era
l G
ov
ern
me
nt
24
6.3
$
44
.4%
88
.2$
15
.9%
19
8.7
$
3
5.8
%2
0.0
$
3
.6%
1.6
$
0.3
%0
.0$
0
.0%
55
4.8
$
10
0.0
%
Publ
ic B
uild
ings
166.
7
37.7
%68
.3
15.4
%18
7.5
42
.4%
20.0
4.
5%0.
0
0.
0%0.
0
0.
0%44
2.4
100.
0%O
ther
Fac
ilitie
s79
.7
70.9
%19
.9
17.7
%11
.2
10
.0%
0.0
0.0%
1.6
1.5%
0.0
0.0%
112.
4
10
0.0%
Gra
nd
To
tal
6,0
86
.2$
15
.7%
7,6
80
.4$
19
.8%
22
,63
6.2
$
5
8.3
%3
20
.2$
0
.8%
62
7.5
$
1.6
%1
,49
1.0
$
3
.8%
38
,84
1.5
$
10
0.0
%
Ta
ble
5.
To
tal
Est
ima
ted
Co
st i
n M
illi
on
s a
nd
Pe
rce
nt
of
To
tal
of
Ne
ed
ed
In
fra
stru
ctu
re I
mp
rov
em
en
ts
by
Pro
jec
t T
yp
e a
nd
Le
ve
l o
f G
ov
ern
me
nt
Five
-yea
r Per
iod
July
201
2 th
roug
h Ju
ne 2
017
WWW.TN.GOV/TACIR14
Building Tennessee’s Tomorrow: Anticipating the State’s Infrastructure Needs
Ca
teg
ory
an
d T
yp
e o
f N
ee
dN
um
be
rC
ost
C
ost
N
um
be
rC
ost
Tra
nsp
ort
ati
on
an
d U
tili
tie
s2
,98
7
70
.7%
9,7
06
.8$
4
4.6
%7
65
18
.1%
8,3
82
.1$
38
.5%
47
2
11
.2%
3,6
78
.1$
1
6.9
%
Tran
spor
tatio
n2,
945
71.0
%9,
560.
9
44.4
%74
3
17.9
%8,
318.
2
38.6
%46
1
11
.1%
3,66
4.1
17.0
%O
ther
Util
ities
39
54
.9%
134.
1
63
.4%
22
31
.0%
63.9
30
.2%
10
14.1
%13
.3
6.
3%Te
leco
mm
unic
atio
ns3
75.0
%11
.8
94.4
%0
0.
0%0.
0
0.
0%1
25.0
%0.
7
5.6%
Ed
uc
ati
on
2,5
09
5
8.9
%4
,76
4.8
$
62
.1%
86
8
2
0.4
%1
,15
7.1
$
1
5.1
%8
85
2
0.8
%1
,75
6.0
$
22
.9%
Post
-sec
onda
ry E
duca
tion
& P
resc
hool
s32
2
62.3
%2,
279.
7
56.5
%91
17.6
%43
8.6
10.9
%10
4
20
.1%
1,31
8.6
32.7
%Sc
hool
Ren
ovat
ions
& R
epla
cem
ents
1,92
9
57
.3%
1,31
7.8
64
.1%
691
20
.5%
443.
7
21
.6%
744
22.1
%29
3.7
14.3
%N
ew P
ublic
Sch
ools
& A
dditi
ons
241
68
.1%
1,12
6.8
73
.4%
82
23
.2%
268.
4
17
.5%
31
8.8%
139.
1
9.
1%Sc
hool
Sys
tem
-wid
e17
63.0
%40
.4
78.7
%4
14
.8%
6.5
12.5
%6
22.2
%4.
5
8.8%
He
alt
h,
Sa
fety
, a
nd
We
lfa
re9
71
5
9.5
%2
,87
4.6
$
48
.9%
38
4
2
3.5
%1
,69
1.8
$
2
8.8
%2
78
1
7.0
%1
,31
7.1
$
22
.4%
Wat
er a
nd W
aste
wat
er70
1
58.7
%1,
700.
1
44.0
%27
8
23.3
%1,
142.
5
29.6
%21
6
18
.1%
1,01
7.3
26.4
%La
w E
nfor
cem
ent
99
56
.9%
810.
5
62
.5%
48
27
.6%
379.
8
29
.3%
27
15.5
%10
6.7
8.2%
Publ
ic H
ealth
Fac
ilitie
s38
74.5
%20
7.2
61.5
%5
9.
8%59
.3
17.6
%8
15.7
%70
.5
20
.9%
Fire
Pro
tect
ion
81
71
.1%
81.1
43
.6%
25
21
.9%
80.0
43
.0%
8
7.
0%25
.0
13
.4%
Stor
m W
ater
32
51
.6%
53.2
34
.7%
16
25
.8%
21.7
14
.1%
14
22.6
%78
.5
51
.2%
Solid
Was
te20
55.6
%22
.5
62.3
%12
33.3
%8.
6
23
.8%
4
11
.1%
5.0
13
.9%
Hou
sing
0
0.
0%0.
0
0.0%
0
0.0%
0.0
0.0%
1
10
0.0%
14.0
100.
0%R
ec
rea
tio
n a
nd
Cu
ltu
re4
66
5
8.4
%8
40
.4$
49
.4%
22
2
2
7.8
%5
45
.8$
3
2.1
%1
10
1
3.8
%3
16
.1$
18
.6%
Recr
eatio
n36
3
58.5
%45
1.7
46.3
%17
1
27.6
%31
8.6
32.7
%86
13
.9%
205.
0
21
.0%
Com
mun
ity D
evel
opm
ent
51
60
.7%
159.
5
38
.7%
22
26
.2%
158.
3
38
.4%
11
13.1
%94
.6
22
.9%
Libr
arie
s, M
useu
ms,
and
His
toric
Site
s52
55.3
%22
9.1
72.8
%29
30.9
%68
.9
21.9
%13
13
.8%
16.6
5.3%
Ec
on
om
ic D
ev
elo
pm
en
t8
1
57
.4%
24
4.6
$
1
9.5
%3
7
26
.2%
58
.1$
4.6
%2
3
1
6.3
%9
53
.4$
75
.9%
Busi
ness
Dis
tric
t Dev
elop
men
t12
34.3
%34
.1
3.5%
12
34
.3%
29.8
3.
0%11
31
.4%
918.
0
93
.5%
Indu
stria
l Site
s an
d Pa
rks
69
65
.1%
210.
5
76
.8%
25
23
.6%
28.3
10
.3%
12
11.3
%35
.5
12
.9%
Ge
ne
ral
Go
ve
rnm
en
t1
45
6
3.3
%3
00
.9$
54
.2%
48
2
1.0
%1
45
.0$
2
6.1
%3
6
1
5.7
%1
09
.0$
19
.6%
Publ
ic B
uild
ings
110
62
.5%
218.
0
49
.3%
34
19
.3%
118.
4
26
.8%
32
18.2
%10
6.0
24.0
%O
ther
Fac
ilitie
s35
66.0
%82
.8
73.7
%14
26.4
%26
.6
23.7
%4
7.5%
3.0
2.
7%
Gra
nd
To
tal
7,1
59
6
3.4
%1
8,7
32
.0$
4
8.2
%2
,32
4
2
0.6
%1
1,9
79
.8$
3
0.8
%1
,80
4
16
.0%
8,1
29
.7$
2
0.9
%
Not
e: T
he p
roje
ct c
ount
incl
udes
all
proj
ects
at a
sch
ool.
A s
choo
l can
hav
e m
ore
than
one
pro
ject
and
thos
e pr
ojec
ts c
an b
e in
diff
eren
t sta
ges.
Fo
r com
plet
e lis
tings
of c
osts
by
proj
ect t
ype,
sta
ge o
f dev
elop
men
t, an
d co
unty
, see
app
endi
x D
.
Co
nc
ep
tua
lP
lan
nin
g &
De
sig
nC
on
stru
cti
on
Nu
mb
er
Ta
ble
6.
Ne
ed
ed
In
fra
stru
ctu
re I
mp
rov
em
en
ts i
n M
illi
on
s a
nd
Pe
rce
nt
of
To
tal
by
Ca
teg
ory
, P
roje
ct
Ty
pe
, a
nd
Sta
ge
of
De
ve
lop
me
nt
Five
-yea
r Per
iod
July
201
2 th
roug
h Ju
ne 2
017
15WWW.TN.GOV/TACIR
Infrastructure Needs Statewide
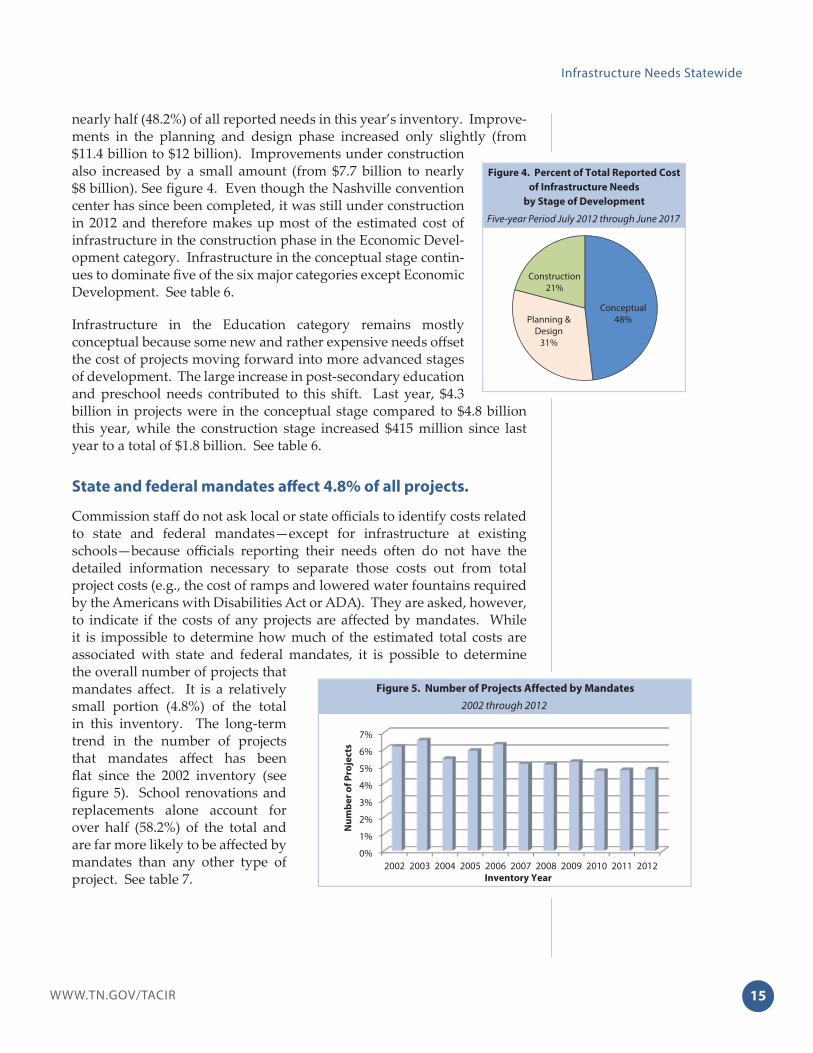
nearly half (48.2%) of all reported needs in this year’s inventory. Improve-ments in the planning and design phase increased only slightly (from $11.4 billion to $12 billion). Improvements under construction also increased by a small amount (from $7.7 billion to nearly $8 billion). See fi gure 4. Even though the Nashville convention center has since been completed, it was still under construction in 2012 and therefore makes up most of the estimated cost of infrastructure in the construction phase in the Economic Devel-opment category. Infrastructure in the conceptual stage contin-ues to dominate fi ve of the six major categories except Economic Development. See table 6.
Infrastructure in the Education category remains mostly conceptual because some new and rather expensive needs off set the cost of projects moving forward into more advanced stages of development. The large increase in post-secondary education and preschool needs contributed to this shift. Last year, $4.3 billion in projects were in the conceptual stage compared to $4.8 billion this year, while the construction stage increased $415 million since last year to a total of $1.8 billion. See table 6.
State and federal mandates aff ect 4.8% of all projects.
Commission staff do not ask local or state offi cials to identify costs related to state and federal mandates—except for infrastructure at existing schools—because offi cials reporting their needs often do not have the detailed information necessary to separate those costs out from total project costs (e.g., the cost of ramps and lowered water fountains required by the Americans with Disabilities Act or ADA). They are asked, however, to indicate if the costs of any projects are aff ected by mandates. While it is impossible to determine how much of the estimated total costs are associated with state and federal mandates, it is possible to determine the overall number of projects that mandates aff ect. It is a relatively small portion (4.8%) of the total in this inventory. The long-term trend in the number of projects that mandates aff ect has been fl at since the 2002 inventory (see fi gure 5). School renovations and replacements alone account for over half (58.2%) of the total and are far more likely to be aff ected by mandates than any other type of project. See table 7.
Figure 5. Number of Projects Affected by Mandates
2002 through 2012
0%
1%
2%
3%
4%
5%
6%
7%
2002 2003 2004 2005 2006 2007 2008 2009 2010 2011 2012
Nu
mb
er
of
Pro
jec
ts
Inventory Year
Figure 4. Percent of Total Reported Cost
of Infrastructure Needs
by Stage of Development
Five-year Period July 2012 through June 2017
Conceptual48%Planning &
Design31%
Construction21%

WWW.TN.GOV/TACIR16
Building Tennessee’s Tomorrow: Anticipating the State’s Infrastructure Needs
Number Percent
School Renovations & Replacements 1,246 254 20.4%Post-secondary Education & Preschools 517 49 9.5%Transportation 4,149 42 1.0%Recreation 620 31 5.0%Water and Wastewater 1,195 22 1.8%Law Enforcement 174 7 4.0%Public Buildings 176 7 4.0%Fire Protection 114 7 6.1%Public Health Facilities 51 6 11.8%Libraries, Museums, and Historic Sites 94 3 3.2%Community Development 84 3 3.6%New Public Schools & Additions 250 2 0.8%School System-wide 17 1 5.9%Solid Waste 36 1 2.8%Storm Water 62 1 1.6%Housing 1 0 0.0%Business District Development 35 0 0.0%Industrial Sites and Parks 106 0 0.0%Other Facilities 53 0 0.0%Other Utilities 71 0 0.0%Telecommunications 4 0 0.0%
Grand Total 9,055 436 4.8%
Note: The project count includes all projects at a school. A school can have more than one project and those projects can be in different stages.
Projects or Schools
Affected by
Mandates
Table 7. Percent of Projects Affected by Mandates
Five-year Period July 2012 through June 2017
Number of
Projects or
Schools
Reported
Type of Need
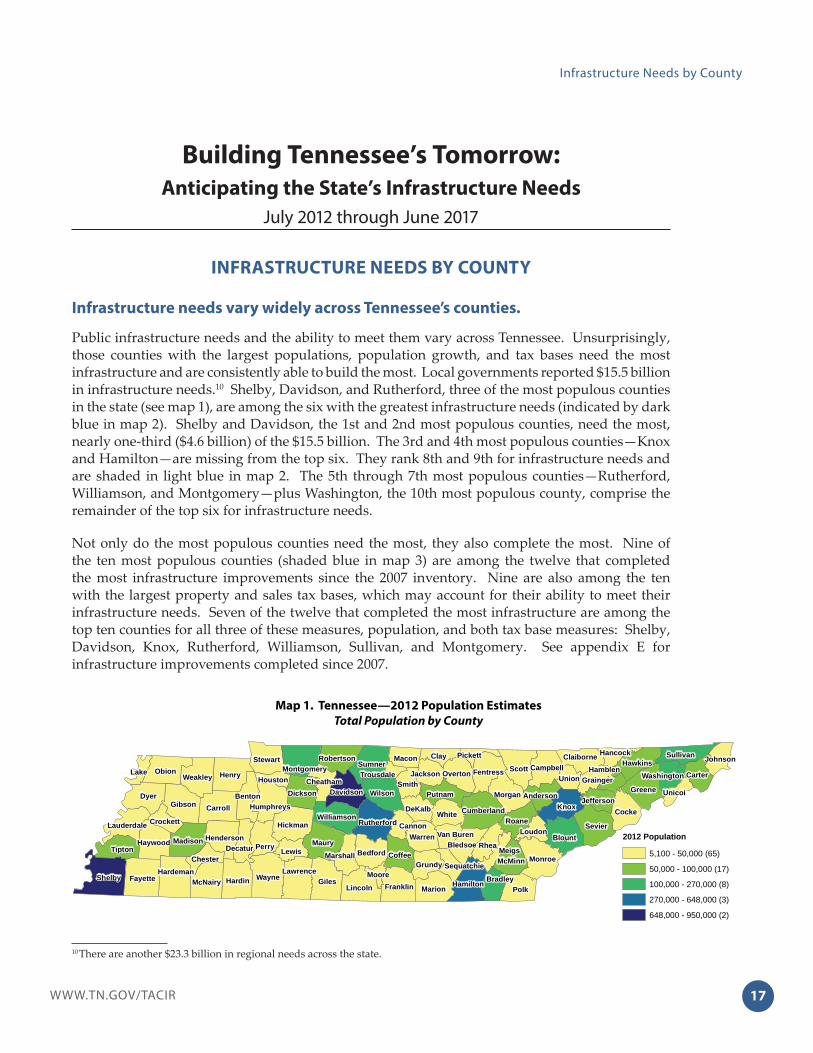
17WWW.TN.GOV/TACIR
Infrastructure Needs by County
Building Tennessee’s Tomorrow:
Anticipating the State’s Infrastructure Needs
July 2012 through June 2017
INFRASTRUCTURE NEEDS BY COUNTY
Infrastructure needs vary widely across Tennessee’s counties.
Public infrastructure needs and the ability to meet them vary across Tennessee. Unsurprisingly, those counties with the largest populations, population growth, and tax bases need the most infrastructure and are consistently able to build the most. Local governments reported $15.5 billion in infrastructure needs.10 Shelby, Davidson, and Rutherford, three of the most populous counties in the state (see map 1), are among the six with the greatest infrastructure needs (indicated by dark blue in map 2). Shelby and Davidson, the 1st and 2nd most populous counties, need the most, nearly one-third ($4.6 billion) of the $15.5 billion. The 3rd and 4th most populous counties—Knox and Hamilton—are missing from the top six. They rank 8th and 9th for infrastructure needs and are shaded in light blue in map 2. The 5th through 7th most populous counties—Rutherford, Williamson, and Montgomery—plus Washington, the 10th most populous county, comprise the remainder of the top six for infrastructure needs.
Not only do the most populous counties need the most, they also complete the most. Nine of the ten most populous counties (shaded blue in map 3) are among the twelve that completed the most infrastructure improvements since the 2007 inventory. Nine are also among the ten with the largest property and sales tax bases, which may account for their ability to meet their infrastructure needs. Seven of the twelve that completed the most infrastructure are among the top ten counties for all three of these measures, population, and both tax base measures: Shelby, Davidson, Knox, Rutherford, Williamson, Sullivan, and Montgomery. See appendix E for infrastructure improvements completed since 2007.
10 There are another $23.3 billion in regional needs across the state.
GilesShelby Wayne
Dyer
Scott
Maury
Knox
Henry
Fayette
Sevier
Polk
Obion
Carroll
Hardin
Monroe
Greene
Blount
GibsonWilson
Lincoln Marion
Perry
Hickman
Cocke
FranklinMcNairy
Tipton
Weakley
Madison
Stewart
White
Coffee
Warren
Bedford
Clay
Williamson
Sullivan
Putnam
Claiborne
Lewis
MaconSumner
Morgan
HamiltonHardeman Lawrence
Rhea
Roane
Dickson
Haywood
Benton
Hawkins
Rutherford
Carter
Cumberland
Fentress
Davidson
McMinn
OvertonCampbell
Smith
Bledsoe
Humphreys
Grundy
Henderson
Robertson
DeKalb
Lauderdale
Decatur
Montgomery
Marshall
Bradley
UnionLake Jackson
ChesterMeigs
Anderson
Johnson
Grainger
Jefferson
LoudonCannon
Unicoi
Crockett
CheathamWashington
Pickett Hancock
Van Buren
Houston
SequatchieMoore
HamblenTrousdale
2012 Population
5,100 - 50,000 (65)
50,000 - 100,000 (17)
100,000 - 270,000 (8)
270,000 - 648,000 (3)
648,000 - 950,000 (2)
Map 1. Tennessee—2012 Population Estimates
Total Population by County

WWW.TN.GOV/TACIR18
Building Tennessee’s Tomorrow: Anticipating the State’s Infrastructure Needs
Hamilton, 4th in population and tax bases, ranks 14th for infrastructure improvements since 2007 and is shaded green in map 3. Sumner, 8th in population and for infrastructure improvements since 2007, is among the top ten for property tax base but not for sales tax base. Washington, 10th in population and for infrastructure improvements, is among the top ten for sales but not for property. Sevier, home to Gatlinburg and Pigeon Forge, is one of the twelve that completed the most infrastructure improvements and has the 7th largest sales tax base and the 9th largest property tax base in the state but only the 15th largest population. Wilson, the 12th largest county, is the only county among the twelve completing the most infrastructure that is not among the ten with the largest property and sales tax bases. Robertson, the smallest county in the group of 12 that completed the most infrastructure (a $21 million jail expansion and a $35 million high school), is not among the ten largest nor is it among the ten with the largest tax bases. See appendix F for property and sales tax base information for the 95 counties.
Four other counties fall into the same range on map 3 as Hamilton: Blount, Putnam, Cumberland, and Maury, in order of infrastructure improvements completed since 2007. None of them are in the top ten for population or tax bases, but Blount is 11th for population and property and 13th for sales. Putnam is the 18th largest county and ranks 15th for sales and 22nd for property. Cumberland is the smallest of these, ranking 24th for population, 22nd for sales, and 20th for property. Maury is the 16th largest county and has the 17th largest sales and property tax bases.
GilesShelby Wayne
Dyer
Scott
Maury
Knox
Henry
Fayette
Sevier
Polk
Obion
Carroll
Hardin
Monroe
Greene
Blount
GibsonWilson
Lincoln Marion
Perry
Hickman
Cocke
FranklinMcNairy
Tipton
Weakley
Madison
Stewart
White
Coffee
Warren
Bedford
Clay
Williamson
Sullivan
Putnam
Claiborne
Lewis
MaconSumner
Morgan
HamiltonHardeman Lawrence
Rhea
Roane
Dickson
Haywood
Benton
Hawkins
Rutherford
Carter
Cumberland
Fentress
Davidson
McMinn
OvertonCampbell
Smith
Bledsoe
Humphreys
Grundy
Henderson
Robertson
DeKalb
Lauderdale
Decatur
Montgomery
Marshall
Bradley
UnionLake Jackson
ChesterMeigs
Anderson
Johnson
Grainger
Jefferson
LoudonCannon
Unicoi
Crockett
CheathamWashington
Pickett Hancock
Van Buren
Houston
SequatchieMoore
HamblenTrousdale
Estimated Cost (in millions)
$2 - $25 (47)
$25 - $115 (31)
$115 - $170 (5)
$170 - $450 (7)
$450 - $1,500 (5)
Map 3. Estimated Cost of Completed Infrastructure Needs
Infrastructure Needs Reported July 1, 2007, and Completed by July 1, 2012
GilesShelby Wayne
Dyer
Scott
Maury
Knox
Henry
Fayette
Sevier
Polk
Obion
Carroll
Hardin
Monroe
Greene
Blount
GibsonWilson
Lincoln Marion
Perry
Hickman
Cocke
FranklinMcNairy
Tipton
Weakley
Madison
Stewart
White
Coffee
Warren
Bedford
Clay
Williamson
Sullivan
Putnam
Claiborne
Lewis
MaconSumner
Morgan
HamiltonHardeman Lawrence
Rhea
Roane
Dickson
Haywood
Benton
Hawkins
Rutherford
Carter
Cumberland
Fentress
Davidson
McMinn
OvertonCampbell
Smith
Bledsoe
Humphreys
Grundy
Henderson
Robertson
DeKalb
Lauderdale
Decatur
Montgomery
Marshall
Bradley
UnionLake Jackson
ChesterMeigs
Anderson
Johnson
Grainger
Jefferson
LoudonCannon
Unicoi
Crockett
CheathamWashington
Pickett Hancock
Van Buren
Houston
SequatchieMoore
HamblenTrousdale
Estimated Cost (in millions)
$4 - $50 (39)
$50 - $150 (34)
$150 - $250 (9)
$250 - $600 (7)
$600 - $2,500 (6)
Map 2. Estimated Cost of Total Infrastructure Needs
Five-year Period July 2012 through June 2017
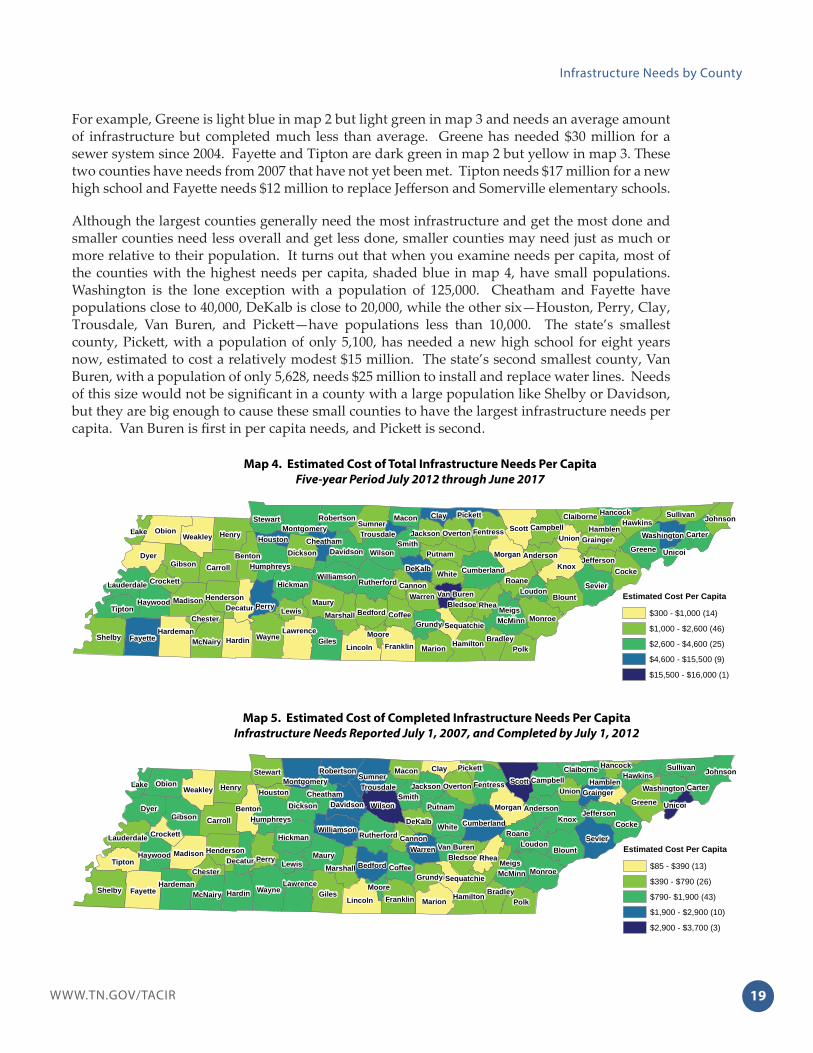
19WWW.TN.GOV/TACIR
Infrastructure Needs by County
For example, Greene is light blue in map 2 but light green in map 3 and needs an average amount of infrastructure but completed much less than average. Greene has needed $30 million for a sewer system since 2004. Fayett e and Tipton are dark green in map 2 but yellow in map 3. These two counties have needs from 2007 that have not yet been met. Tipton needs $17 million for a new high school and Fayett e needs $12 million to replace Jeff erson and Somerville elementary schools.
Although the largest counties generally need the most infrastructure and get the most done and smaller counties need less overall and get less done, smaller counties may need just as much or more relative to their population. It turns out that when you examine needs per capita, most of the counties with the highest needs per capita, shaded blue in map 4, have small populations. Washington is the lone exception with a population of 125,000. Cheatham and Fayett e have populations close to 40,000, DeKalb is close to 20,000, while the other six—Houston, Perry, Clay, Trousdale, Van Buren, and Pickett —have populations less than 10,000. The state’s smallest county, Pickett , with a population of only 5,100, has needed a new high school for eight years now, estimated to cost a relatively modest $15 million. The state’s second smallest county, Van Buren, with a population of only 5,628, needs $25 million to install and replace water lines. Needs of this size would not be signifi cant in a county with a large population like Shelby or Davidson, but they are big enough to cause these small counties to have the largest infrastructure needs per capita. Van Buren is fi rst in per capita needs, and Pickett is second.
GilesShelby Wayne
Dyer
Scott
Maury
Knox
Henry
Fayette
Sevier
Polk
Obion
Carroll
Hardin
Monroe
Greene
Blount
GibsonWilson
Lincoln Marion
Perry
Hickman
Cocke
FranklinMcNairy
Tipton
Weakley
Madison
Stewart
White
Coffee
Warren
Bedford
Clay
Williamson
Sullivan
Putnam
Claiborne
Lewis
MaconSumner
Morgan
HamiltonHardeman Lawrence
Rhea
Roane
Dickson
Haywood
Benton
Hawkins
Rutherford
Carter
Cumberland
Fentress
Davidson
McMinn
OvertonCampbell
Smith
Bledsoe
Humphreys
Grundy
Henderson
Robertson
DeKalb
Lauderdale
Decatur
Montgomery
Marshall
Bradley
UnionLake Jackson
ChesterMeigs
Anderson
Johnson
Grainger
Jefferson
LoudonCannon
Unicoi
Crockett
CheathamWashington
Pickett Hancock
Van Buren
Houston
SequatchieMoore
HamblenTrousdale
Estimated Cost Per Capita
$300 - $1,000 (14)
$1,000 - $2,600 (46)
$2,600 - $4,600 (25)
$4,600 - $15,500 (9)
$15,500 - $16,000 (1)
Map 4. Estimated Cost of Total Infrastructure Needs Per Capita
Five-year Period July 2012 through June 2017
GilesShelby Wayne
Dyer
Scott
Maury
Knox
Henry
Fayette
Sevier
Polk
Obion
Carroll
Hardin
Monroe
Greene
Blount
GibsonWilson
Lincoln Marion
Perry
Hickman
Cocke
FranklinMcNairy
Tipton
Weakley
Madison
Stewart
White
Coffee
Warren
Bedford
Clay
Williamson
Sullivan
Putnam
Claiborne
Lewis
MaconSumner
Morgan
HamiltonHardeman Lawrence
Rhea
Roane
Dickson
Haywood
Benton
Hawkins
Rutherford
Carter
Cumberland
Fentress
Davidson
McMinn
OvertonCampbell
Smith
Bledsoe
Humphreys
Grundy
Henderson
Robertson
DeKalb
Lauderdale
Decatur
Montgomery
Marshall
Bradley
UnionLake Jackson
ChesterMeigs
Anderson
Johnson
Grainger
Jefferson
LoudonCannon
Unicoi
Crockett
CheathamWashington
Pickett Hancock
Van Buren
Houston
SequatchieMoore
HamblenTrousdale
Estimated Cost Per Capita
$85 - $390 (13)
$390 - $790 (26)
$790- $1,900 (43)
$1,900 - $2,900 (10)
$2,900 - $3,700 (3)
Map 5. Estimated Cost of Completed Infrastructure Needs Per Capita
Infrastructure Needs Reported July 1, 2007, and Completed by July 1, 2012
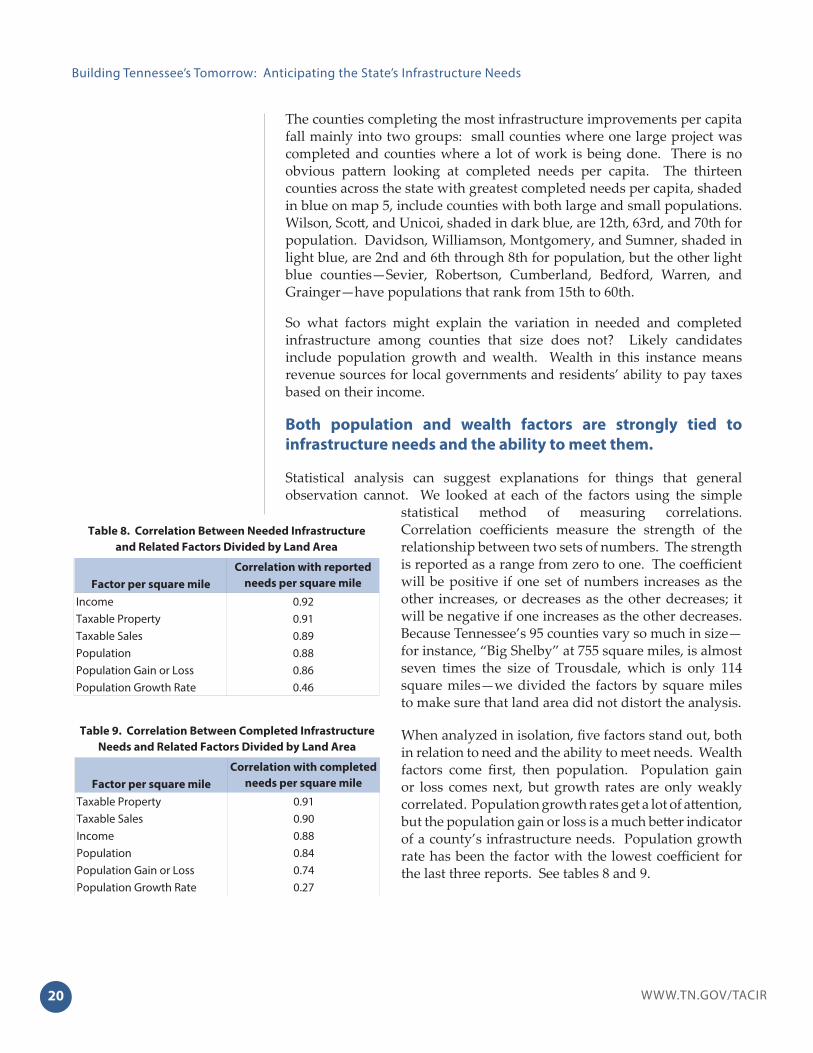
WWW.TN.GOV/TACIR20
Building Tennessee’s Tomorrow: Anticipating the State’s Infrastructure Needs
The counties completing the most infrastructure improvements per capita fall mainly into two groups: small counties where one large project was completed and counties where a lot of work is being done. There is no obvious patt ern looking at completed needs per capita. The thirteen counties across the state with greatest completed needs per capita, shaded in blue on map 5, include counties with both large and small populations. Wilson, Scott , and Unicoi, shaded in dark blue, are 12th, 63rd, and 70th for population. Davidson, Williamson, Montgomery, and Sumner, shaded in light blue, are 2nd and 6th through 8th for population, but the other light blue counties—Sevier, Robertson, Cumberland, Bedford, Warren, and Grainger—have populations that rank from 15th to 60th.
So what factors might explain the variation in needed and completed infrastructure among counties that size does not? Likely candidates include population growth and wealth. Wealth in this instance means revenue sources for local governments and residents’ ability to pay taxes based on their income.
Both population and wealth factors are strongly tied to
infrastructure needs and the ability to meet them.
Statistical analysis can suggest explanations for things that general observation cannot. We looked at each of the factors using the simple
statistical method of measuring correlations. Correlation coeffi cients measure the strength of the relationship between two sets of numbers. The strength is reported as a range from zero to one. The coeffi cient will be positive if one set of numbers increases as the other increases, or decreases as the other decreases; it will be negative if one increases as the other decreases. Because Tennessee’s 95 counties vary so much in size—for instance, “Big Shelby” at 755 square miles, is almost seven times the size of Trousdale, which is only 114 square miles—we divided the factors by square miles to make sure that land area did not distort the analysis.
When analyzed in isolation, fi ve factors stand out, both in relation to need and the ability to meet needs. Wealth factors come fi rst, then population. Population gain or loss comes next, but growth rates are only weakly correlated. Population growth rates get a lot of att ention, but the population gain or loss is a much bett er indicator of a county’s infrastructure needs. Population growth rate has been the factor with the lowest coeffi cient for the last three reports. See tables 8 and 9.
Factor per square mile
Correlation with reported
needs per square mile
Income 0.92Taxable Property 0.91Taxable Sales 0.89Population 0.88Population Gain or Loss 0.86Population Growth Rate 0.46
Table 8. Correlation Between Needed Infrastructure
and Related Factors Divided by Land Area
Factor per square mile
Correlation with completed
needs per square mile
Taxable Property 0.91Taxable Sales 0.90Income 0.88Population 0.84Population Gain or Loss 0.74Population Growth Rate 0.27
Table 9. Correlation Between Completed Infrastructure
Needs and Related Factors Divided by Land Area

21WWW.TN.GOV/TACIR
Infrastructure Needs by County
Population plays the strongest role in explaining
infrastructure needs and completions.
While correlation allows comparison of two factors at a time, regression analysis allows you to compare a group of factors. Two regressions were performed—one examining factors as they relate to infrastructure needs and a second examining factors as they relate to completions. We found that population was the most signifi cant factor in explaining infrastructure needs, followed by income and taxable property. Population gain was also signifi cant but taxable sales were not. See Table 10.
Population was also the most signifi cant factor explaining a county’s ability to meet its needs. Population gain, taxable property, and taxable sales followed in order of decreasing signifi cance. In contrast to needs, income is not as signifi cant to completing infrastructure needs. See table 11. People and businesses shopping in a county other than the one in which they live or are located may explain why sales is signifi cant for completions but not for needs. By shopping out of county, they contribute to the destination county’s ability to meet its needs rather than their home county. Income is highly signifi cant for needs but not for completions, possibly because property and sales are taxed by local governments but income is not.
Statistical
Significance Population Income
Taxable
Property
Population
Gain or Loss
Taxable
Sales
Highly Significant X X X X
Significant
Not Significant XNote: All variables were divided by land area.
Table 10. Significance of Factors Affecting Infrastructure Needs
Factors in Order of Significance
Statistical
Significance Population
Population
Gain or Loss
Taxable
Property
Taxable
Sales Income
Highly Significant X X X X
Significant X
Not SignifcantNote: All variables were divided by land area.
Table 11. Significance of Factors Affecting Infrastructure Completed Needs
Factors in Order of Significance

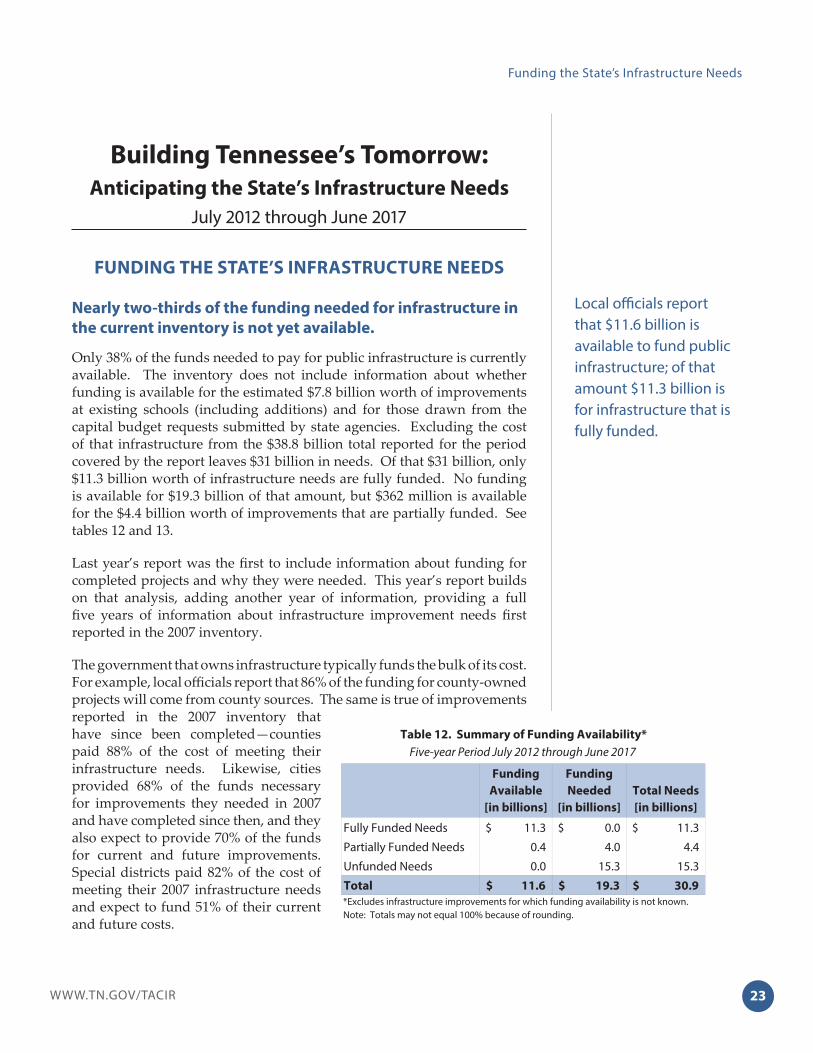
23WWW.TN.GOV/TACIR
Funding the State’s Infrastructure Needs
Building Tennessee’s Tomorrow:
Anticipating the State’s Infrastructure Needs
July 2012 through June 2017
FUNDING THE STATE’S INFRASTRUCTURE NEEDS
Nearly two-thirds of the funding needed for infrastructure in
the current inventory is not yet available.
Only 38% of the funds needed to pay for public infrastructure is currently available. The inventory does not include information about whether funding is available for the estimated $7.8 billion worth of improvements at existing schools (including additions) and for those drawn from the capital budget requests submitt ed by state agencies. Excluding the cost of that infrastructure from the $38.8 billion total reported for the period covered by the report leaves $31 billion in needs. Of that $31 billion, only $11.3 billion worth of infrastructure needs are fully funded. No funding is available for $19.3 billion of that amount, but $362 million is available for the $4.4 billion worth of improvements that are partially funded. See tables 12 and 13.
Last year’s report was the fi rst to include information about funding for completed projects and why they were needed. This year’s report builds on that analysis, adding another year of information, providing a full fi ve years of information about infrastructure improvement needs fi rst reported in the 2007 inventory.
The government that owns infrastructure typically funds the bulk of its cost. For example, local offi cials report that 86% of the funding for county-owned projects will come from county sources. The same is true of improvements reported in the 2007 inventory that have since been completed—counties paid 88% of the cost of meeting their infrastructure needs. Likewise, cities provided 68% of the funds necessary for improvements they needed in 2007 and have completed since then, and they also expect to provide 70% of the funds for current and future improvements. Special districts paid 82% of the cost of meeting their 2007 infrastructure needs and expect to fund 51% of their current and future costs.
Local offi cials report that $11.6 billion is available to fund public infrastructure; of that amount $11.3 billion is for infrastructure that is fully funded.
Funding
Available
[in billions]
Funding
Needed
[in billions]
Total Needs
[in billions]
Fully Funded Needs 11.3$ 0.0$ 11.3$
Partially Funded Needs 0.4 4.0 4.4
Unfunded Needs 0.0 15.3 15.3
Total 11.6$ 19.3$ 30.9$
Table 12. Summary of Funding Availability*
Five-year Period July 2012 through June 2017
*Excludes infrastructure improvements for which funding availability is not known.Note: Totals may not equal 100% because of rounding.

WWW.TN.GOV/TACIR24
Building Tennessee’s Tomorrow: Anticipating the State’s Infrastructure Needs
Infrastructure is built for many reasons: enhancing communities, accommodating population growth, improving public health and safety, supporting economic development, and meeting government mandates. Around two-thirds (65%) of unmet infrastructure needs in this inventory would improve public health and safety, 30% would accommodate population growth, and 21% would enhance communities (see fi gure 6). These percentages add to more than 100% because there may be more than one reason for any particular project. These percentages are comparable to those for projects completed since 2007: public health and safety (69%),
Category and Project Type
Total Needs
[in millions]
Fully
Funded
Needs
[in millions]
Percent
of Total
Needs
Transportation and Utilities $ 21,684.4 $ 7,542.5 34.8%
Transportation 21,467.8 7,480.9 34.8%
Other Utilities 204.2 60.9 29.8%
Telecommunications 12.5 0.7 5.6%
Health, Safety, and Welfare $ 4,703.6 $ 1,893.0 40.2%
Water and Wastewater 3,859.3 1,639.9 42.5%
Law Enforcement 437.9 100.1 22.9%
Fire Protection 173.4 34.1 19.7%
Storm Water 152.2 83.2 54.7%
Solid Waste 36.2 9.2 25.4%
Public Health Facilities 30.7 12.5 40.9%
Housing 14.0 14.0 100.0%
Education $ 1,542.3 $ 319.9 20.7%
New Public Schools* 1,517.7 309.5 20.4%
School System-wide 14.9 10.2 68.3%
Post-secondary Education & Preschools 9.7 0.2 2.3%
Recreation and Culture $ 1,363.7 $ 425.2 31.2%
Recreation 792.1 267.4 33.8%
Community Development 403.4 118.0 29.2%
Libraries, Museums, and Historic Sites 168.2 39.8 23.7%
Economic Development $ 1,256.1 $ 975.7 77.7%
Business District Development 981.8 928.3 94.6%
Industrial Sites and Parks 274.3 47.3 17.3%
General Government $ 356.4 $ 121.0 34.0%
Public Buildings 255.0 93.1 36.5%
Other Facilities 101.4 28.0 27.6%
Grand Total $ 30,906.5 $ 11,277.3 36.5%
* Includes replacement of existing schools.
Table 13. Percent of Needs Fully Funded by Type of Need
Five-year Period July 2012 through June 2017
The long-term sustainability of the gas
tax is being threatened by two unrelated issues: a
shrinking tax base and a shrinking tax rate.
Carl Davis, State Tax Notes, “Pay-Per-Mile Tax is Only a Partial Solution,”
Volume 72, Number 7, May 19, 2014.
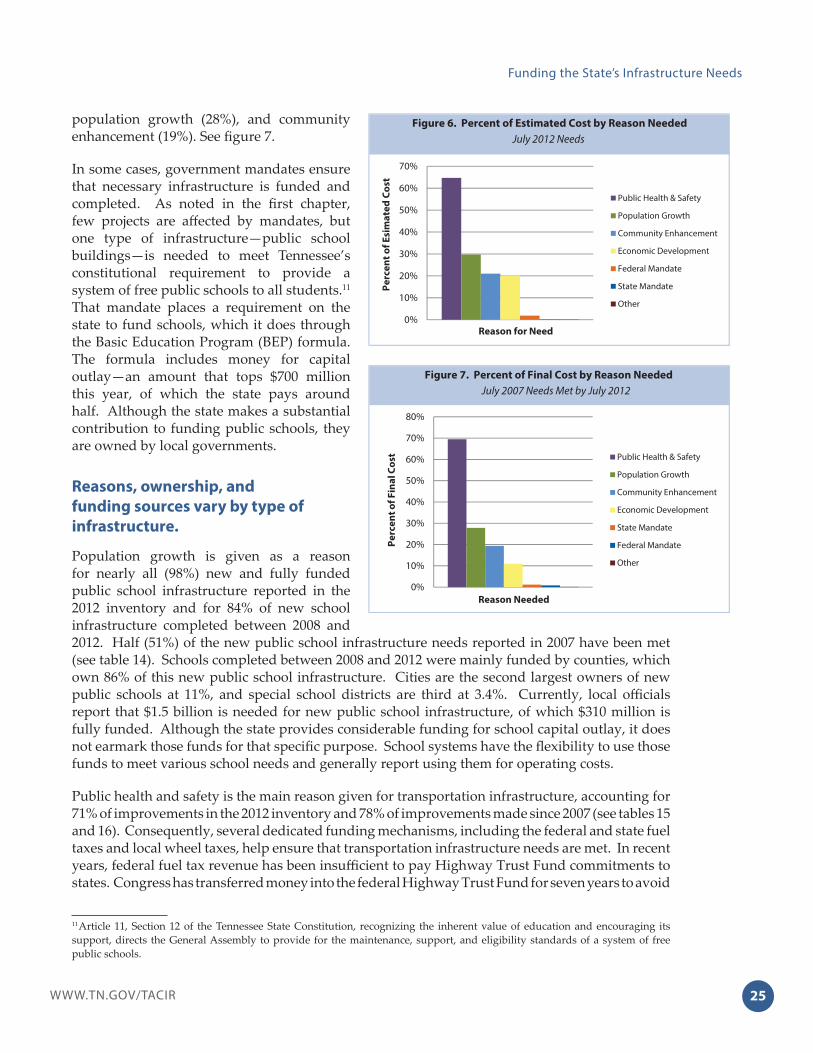
25WWW.TN.GOV/TACIR
Funding the State’s Infrastructure Needs
population growth (28%), and community enhancement (19%). See fi gure 7.
In some cases, government mandates ensure that necessary infrastructure is funded and completed. As noted in the fi rst chapter, few projects are aff ected by mandates, but one type of infrastructure—public school buildings—is needed to meet Tennessee’s constitutional requirement to provide a system of free public schools to all students.11 That mandate places a requirement on the state to fund schools, which it does through the Basic Education Program (BEP) formula. The formula includes money for capital outlay—an amount that tops $700 million this year, of which the state pays around half. Although the state makes a substantial contribution to funding public schools, they are owned by local governments.
Reasons, ownership, and
funding sources vary by type of
infrastructure.
Population growth is given as a reason for nearly all (98%) new and fully funded public school infrastructure reported in the 2012 inventory and for 84% of new school infrastructure completed between 2008 and 2012. Half (51%) of the new public school infrastructure needs reported in 2007 have been met (see table 14). Schools completed between 2008 and 2012 were mainly funded by counties, which own 86% of this new public school infrastructure. Cities are the second largest owners of new public schools at 11%, and special school districts are third at 3.4%. Currently, local offi cials report that $1.5 billion is needed for new public school infrastructure, of which $310 million is fully funded. Although the state provides considerable funding for school capital outlay, it does not earmark those funds for that specifi c purpose. School systems have the fl exibility to use those funds to meet various school needs and generally report using them for operating costs.
Public health and safety is the main reason given for transportation infrastructure, accounting for 71% of improvements in the 2012 inventory and 78% of improvements made since 2007 (see tables 15 and 16). Consequently, several dedicated funding mechanisms, including the federal and state fuel taxes and local wheel taxes, help ensure that transportation infrastructure needs are met. In recent years, federal fuel tax revenue has been insuffi cient to pay Highway Trust Fund commitments to states. Congress has transferred money into the federal Highway Trust Fund for seven years to avoid
11 Article 11, Section 12 of the Tennessee State Constitution, recognizing the inherent value of education and encouraging its support, directs the General Assembly to provide for the maintenance, support, and eligibility standards of a system of free public schools.
Figure 6. Percent of Estimated Cost by Reason Needed
July 2012 Needs
0%
10%
20%
30%
40%
50%
60%
70%
Pe
rce
nt
of
Esi
ma
ted
Co
st
Reason for Need
Public Health & Safety
Population Growth
Community Enhancement
Economic Development
Federal Mandate
State Mandate
Other
Figure 7. Percent of Final Cost by Reason Needed
July 2007 Needs Met by July 2012
0%
10%
20%
30%
40%
50%
60%
70%
80%
Pe
rce
nt
of
Fin
al
Co
st
Reason Needed
Public Health & Safety
Population Growth
Community Enhancement
Economic Development
State Mandate
Federal Mandate
Other

WWW.TN.GOV/TACIR26
Building Tennessee’s Tomorrow: Anticipating the State’s Infrastructure Needs
reducing funding to all states, but the resulting uncertainty in funding makes it diffi cult for states to plan. If federal funds were reduced, the Tennessee Department of Transportation (TDOT) would likely abandon some new construction in favor of maintenance.
Transportation accounts for 69% ($21 billion) of all infrastructure costs for which funding information is available, 66% of the improvements that are fully funded, and 46% of the cost of total completions. The majority of transportation infrastructure needs completed since the 2007 inventory were state-owned (73%); 68% of the funding for those improvements was state revenue, and 28% was federal revenue. Local governments owned the remainder of the projects. Cities own 15% of the transportation infrastructure completed since 2007 and funded about half (52%); most of the remaining funding came from state (15%) and federal (30%) sources. Counties own 11% of the
Category and Project Type
July 2007
Inventory
Total
Completions
Completion
Rate
Percent
of Total
Transportation and Utilities 17,414,430,630$ 3,786,123,477$ 21.7% 51.5%
Transportation 16,818,744,164 3,345,811,874 19.9% 45.5%
Other Utilities 578,277,566 429,952,703 74.4% 5.9%
Telecommunications 17,408,900 10,358,900 59.5% 0.1%
Health, Safety, and Welfare 5,155,221,465$ 1,889,926,328$ 36.7% 25.7%
Water and Wastewater 3,759,747,476 1,269,753,134 33.8% 17.3%
Law Enforcement 739,903,580 388,567,033 52.5% 5.3%
Storm Water 264,425,356 60,455,204 22.9% 0.8%
Fire Protection 209,019,045 60,042,949 28.7% 0.8%
Housing 71,788,740 47,599,740 66.3% 0.6%
Public Health Facilities 57,403,268 42,196,268 73.5% 0.6%
Solid Waste 52,934,000 21,312,000 40.3% 0.3%Education 1,862,839,839$ 943,066,318$ 50.6% 12.8%
New Public Schools* 1,783,181,339 912,840,318 51.2% 12.4%
School System-wide 44,112,000 18,182,000 41.2% 0.2%
Post-secondary Education & Preschools 35,546,500 12,044,000 33.9% 0.2%
Recreation and Culture 1,484,320,256$ 398,530,597$ 26.8% 5.4%
Recreation 905,349,132 295,516,418 32.6% 4.0%
Community Development 421,268,405 41,986,522 10.0% 0.6%
Libraries, Museums, and Historic Sites 157,702,719 61,027,657 38.7% 0.8%
Economic Development 566,293,020$ 125,606,900$ 22.2% 1.7%
Business District Development 343,616,020 62,207,900 18.1% 0.8%
Industrial Sites and Parks 222,677,000 63,399,000 28.5% 0.9%
General Government 500,329,874$ 202,658,036$ 40.5% 2.8%
Public Buildings 460,387,874 180,088,036 39.1% 2.5%
Other Facilities 39,942,000 22,570,000 56.5% 0.3%
Grand Total 26,983,435,084$ 7,345,911,656$ 27.2% 100%
* Includes replacements of existing schools.
Table 14. Percent of July 2007 Needs Completed by Type of Need
Infrastructure Needs Reported July 1, 2007, and Completed by July 1, 2012
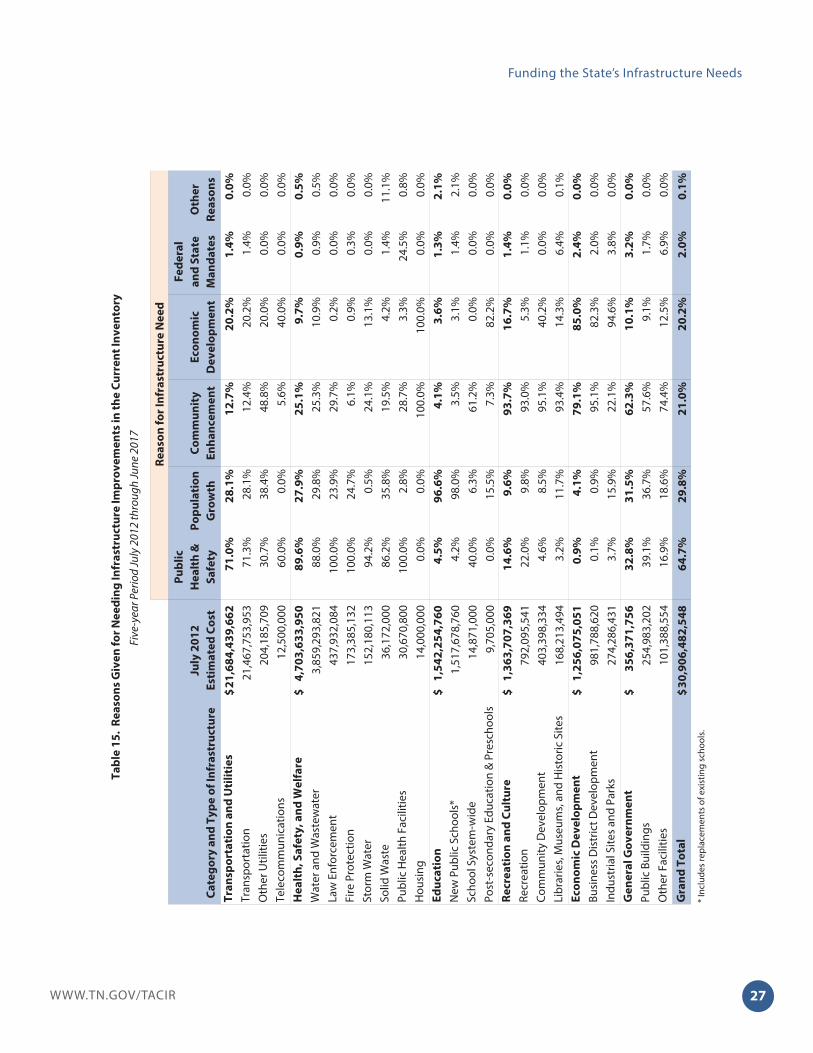
27WWW.TN.GOV/TACIR
Funding the State’s Infrastructure Needs
Ca
teg
ory
an
d T
yp
e o
f In
fra
stru
ctu
re
July
20
12
Est
ima
ted
Co
st
Pu
bli
c
He
alt
h &
Sa
fety
Po
pu
lati
on
Gro
wth
Co
mm
un
ity
En
ha
nc
em
en
t
Ec
on
om
ic
De
ve
lop
me
nt
Fe
de
ral
an
d S
tate
Ma
nd
ate
s
Oth
er
Re
aso
ns
Tra
nsp
ort
ati
on
an
d U
tili
tie
s2
1,6
84
,43
9,6
62
$
71
.0%
28
.1%
12
.7%
20
.2%
1.4
%0
.0%
Tran
spor
tatio
n21
,467
,753
,953
71
.3%
28.1
%12
.4%
20.2
%1.
4%0.
0%O
ther
Util
ities
204,
185,
709
30
.7%
38.4
%48
.8%
20.0
%0.
0%0.
0%Te
leco
mm
unic
atio
ns12
,500
,000
60
.0%
0.0%
5.6%
40.0
%0.
0%0.
0%H
ea
lth
, S
afe
ty,
an
d W
elf
are
4,7
03
,63
3,9
50
$
8
9.6
%2
7.9
%2
5.1
%9
.7%
0.9
%0
.5%
Wat
er a
nd W
aste
wat
er3,
859,
293,
821
88
.0%
29.8
%25
.3%
10.9
%0.
9%0.
5%La
w E
nfor
cem
ent
437,
932,
084
10
0.0%
23.9
%29
.7%
0.2%
0.0%
0.0%
Fire
Pro
tect
ion
173,
385,
132
10
0.0%
24.7
%6.
1%0.
9%0.
3%0.
0%St
orm
Wat
er15
2,18
0,11
3
94.2
%0.
5%24
.1%
13.1
%0.
0%0.
0%So
lid W
aste
36,1
72,0
00
86.2
%35
.8%
19.5
%4.
2%1.
4%11
.1%
Publ
ic H
ealth
Fac
ilitie
s30
,670
,800
10
0.0%
2.8%
28.7
%3.
3%24
.5%
0.8%
Hou
sing
14,0
00,0
00
0.0%
0.0%
100.
0%10
0.0%
0.0%
0.0%
Ed
uc
ati
on
1,5
42
,25
4,7
60
$
4
.5%
96
.6%
4.1
%3
.6%
1.3
%2
.1%
New
Pub
lic S
choo
ls*
1,51
7,67
8,76
0
4.2%
98.0
%3.
5%3.
1%1.
4%2.
1%Sc
hool
Sys
tem
-wid
e14
,871
,000
40
.0%
6.3%
61.2
%0.
0%0.
0%0.
0%Po
st-s
econ
dary
Edu
catio
n &
Pre
scho
ols
9,70
5,00
0
0.
0%15
.5%
7.3%
82.2
%0.
0%0.
0%R
ec
rea
tio
n a
nd
Cu
ltu
re1
,36
3,7
07
,36
9$
14
.6%
9.6
%9
3.7
%1
6.7
%1
.4%
0.0
%
Recr
eatio
n79
2,09
5,54
1
22.0
%9.
8%93
.0%
5.3%
1.1%
0.0%
Com
mun
ity D
evel
opm
ent
403,
398,
334
4.
6%8.
5%95
.1%
40.2
%0.
0%0.
0%Li
brar
ies,
Mus
eum
s, a
nd H
isto
ric S
ites
168,
213,
494
3.
2%11
.7%
93.4
%14
.3%
6.4%
0.1%
Ec
on
om
ic D
ev
elo
pm
en
t1
,25
6,0
75
,05
1$
0.9
%4
.1%
79
.1%
85
.0%
2.4
%0
.0%
Busi
ness
Dis
tric
t Dev
elop
men
t98
1,78
8,62
0
0.1%
0.9%
95.1
%82
.3%
2.0%
0.0%
Indu
stria
l Site
s an
d Pa
rks
274,
286,
431
3.
7%15
.9%
22.1
%94
.6%
3.8%
0.0%
Ge
ne
ral
Go
ve
rnm
en
t3
56
,37
1,7
56
$
32
.8%
31
.5%
62
.3%
10
.1%
3.2
%0
.0%
Publ
ic B
uild
ings
254,
983,
202
39
.1%
36.7
%57
.6%
9.1%
1.7%
0.0%
Oth
er F
acili
ties
101,
388,
554
16
.9%
18.6
%74
.4%
12.5
%6.
9%0.
0%G
ran
d T
ota
l3
0,9
06
,48
2,5
48
$
64
.7%
29
.8%
21
.0%
20
.2%
2.0
%0
.1%
* In
clud
es re
plac
emen
ts o
f exi
stin
g sc
hool
s.
Re
aso
n f
or
Infr
ast
ruc
ture
Ne
ed
Ta
ble
15
. R
ea
son
s G
ive
n f
or
Ne
ed
ing
In
fra
stru
ctu
re I
mp
rov
em
en
ts i
n t
he
Cu
rre
nt
Inv
en
tory
Five
-yea
r Per
iod
July
201
2 th
roug
h Ju
ne 2
017

WWW.TN.GOV/TACIR28
Building Tennessee’s Tomorrow: Anticipating the State’s Infrastructure Needs
Ca
teg
ory
an
d T
yp
e o
f In
fra
stru
ctu
re
July
20
07
Co
mp
leti
on
s
20
08
-12
Pu
bli
c
He
alt
h
& S
afe
ty
Po
pu
lati
on
Gro
wth
Co
mm
un
ity
En
ha
nc
em
en
t
Ec
on
om
ic
De
ve
lop
me
nt
Fe
de
ral
an
d
Sta
te
Ma
nd
ate
s
Oth
er
Re
aso
ns
Tra
nsp
ort
ati
on
an
d U
tili
tie
s3
,78
6,1
23
,47
7$
7
9.8
%1
5.9
%1
4.3
%1
2.1
%0
.2%
0.0
%
Tran
spor
tatio
n3,
345,
811,
874
77
.9%
17.5
%16
.1%
13.4
%0.
2%0.
0%O
ther
Util
ities
429,
952,
703
95.5
%3.
8%0.
7%1.
4%0.
0%0.
0%Te
leco
mm
unic
atio
ns10
,358
,900
68
.1%
0.0%
0.0%
31.9
%0.
0%0.
0%H
ea
lth
, S
afe
ty,
an
d W
elf
are
1,8
89
,92
6,3
28
$
88
.9%
28
.2%
15
.0%
5.9
%3
.6%
0.2
%
Wat
er a
nd W
aste
wat
er1,
269,
753,
134
87
.1%
31.1
%12
.7%
7.7%
3.3%
0.1%
Law
Enf
orce
men
t38
8,56
7,03
3
10
0.0%
27.5
%14
.0%
0.0%
6.2%
0.0%
Stor
m W
ater
60,4
55,2
04
98.3
%3.
6%5.
1%3.
3%0.
4%3.
3%Fi
re P
rote
ctio
n60
,042
,949
10
0.0%
25.6
%18
.9%
0.7%
3.5%
0.0%
Hou
sing
47,5
99,7
40
23.3
%24
.4%
98.9
%22
.3%
0.0%
0.0%
Publ
ic H
ealth
Fac
ilitie
s42
,196
,268
10
0.0%
0.8%
0.0%
0.0%
0.0%
0.0%
Solid
Was
te21
,312
,000
65
.8%
14.2
%26
.6%
4.2%
0.0%
0.0%
Ed
uc
ati
on
94
3,0
66
,31
8$
9.0
%8
2.6
%2
6.4
%2
.1%
6.5
%0
.8%
New
Pub
lic S
choo
ls*
912,
840,
318
8.0%
83.5
%26
.2%
1.9%
6.7%
0.8%
Scho
ol S
yste
m-w
ide
18,1
82,0
00
37.9
%63
.5%
33.7
%0.
0%1.
6%2.
2%Po
st-s
econ
dary
Edu
catio
n &
Pre
scho
ols
12,0
44,0
00
34.9
%45
.1%
31.6
%23
.2%
0.0%
0.0%
Re
cre
ati
on
an
d C
ult
ure
39
8,5
30
,59
7$
12
.8%
9.8
%9
3.1
%6
.8%
0.5
%0
.0%
Recr
eatio
n29
5,51
6,41
8
15
.9%
9.8%
93.6
%3.
7%0.
6%0.
0%Li
brar
ies,
Mus
eum
s, a
nd H
isto
ric S
ites
61,0
27,6
57
0.2%
16.5
%89
.6%
5.7%
0.0%
0.0%
Com
mun
ity D
evel
opm
ent
41,9
86,5
22
9.5%
0.5%
94.4
%30
.7%
0.0%
0.0%
Ec
on
om
ic D
ev
elo
pm
en
t1
25
,60
6,9
00
$
2
.3%
27
.9%
19
.9%
82
.3%
0.0
%0
.0%
Indu
stria
l Site
s an
d Pa
rks
63,3
99,0
00
4.5%
0.0%
4.7%
98.7
%0.
0%0.
0%Bu
sine
ss D
istr
ict D
evel
opm
ent
62,2
07,9
00
0.0%
56.3
%35
.5%
65.6
%0.
0%0.
0%G
en
era
l G
ov
ern
me
nt
20
2,6
58
,03
6$
52
.2%
24
.7%
25
.7%
23
.6%
6.3
%0
.0%
Publ
ic B
uild
ings
180,
088,
036
54.7
%19
.3%
28.5
%26
.6%
7.1%
0.0%
Oth
er F
acili
ties
22,5
70,0
00
31.9
%67
.7%
3.7%
0.0%
0.0%
0.0%
Gra
nd
To
tal
7,3
45
,91
1,6
56
$
67
.4%
27
.7%
20
.7%
10
.5%
2.0
%0
.2%
* In
clud
es re
plac
emen
ts o
f exi
stin
g sc
hool
s.
Re
aso
n f
or
Infr
ast
ruc
ture
Ne
ed
Infra
stru
ctur
e N
eeds
Rep
orte
d Ju
ly 1
, 200
7, a
nd C
ompl
eted
by
July
1, 2
012
Ta
ble
16
. R
ea
son
s G
ive
n f
or
Ne
ed
ing
In
fra
stru
ctu
re I
mp
rov
em
en
ts C
om
ple
ted
Sin
ce
20
07
29WWW.TN.GOV/TACIR
Funding the State’s Infrastructure Needs
transportation infrastructure completed since 2007 and funded about 53%; most of the rest of the funding came from state (14%) and federal sources (32%).
Water and wastewater infrastructure is needed to ensure clean drinking water and protect water supply sources. Consequently, public health and safety was the main reason given for 88% of the estimated cost of improvements reported in the 2012 inventory, as well as 87% of improvements completed between 2008 and 2012. The utilities that provide these services are required to be self-sustaining, funded mainly by user fees rather than through taxes, so that the amount each customer pays is in proportion to the amount that customer uses. Water and wastewater projects made up 17% ($1.3 billion) of the total dollars needed for all 2007 projects completed since then and had a completion rate of 34%. Half of the water and wastewater infrastructure improvements completed since 2007 belong to cities, which paid for 73% of the cost of their improvements, and 17% of the improvements are owned by counties, which paid 91% of their costs. The remaining 28% is owned by utility districts, which paid 80% of the cost of their infrastructure improvements. Although they don’t own any of this infrastructure, the state and federal governments contributed 19% of the funding necessary to complete it.
Storm water infrastructure is also necessary to protect our drinking water and control fl ooding, and the reason given most often for needing it is public health and safety (94%). Although the need for it grows as the amount of land covered by impervious surfaces (e.g., buildings, roads and streets, and parking lots) increases, population growth is rarely mentioned as a reason for needing it (0.5% of all storm water improvements in the current inventory and 3.6% of the 2007 improvements that have been completed). Counties provide some storm water infrastructure, but 90% of the fully funded improvements in the current inventory are owned by cities, and 93% of the cost of completed projects were paid for by cities. A total of $152 million is needed for storm water infrastructure in the current inventory, of which $83 million is available. Only 23% ($60 million) of the storm water improvements needed in 2007 have been completed. Storm water infrastructure is primarily funded with general tax revenue and, to a lesser extent, with user fees.
Public health and safety was the reason given for 31% of other utility infrastructure—infrastructure owned by public gas and electric utilities— in the current inventory, but for 96% of the improvements completed since 2007. In contrast, population growth and community enhancement were more often given as reasons for other utility infrastructure needs in the current inventory (38% and 49%) than for those needs completed since 2007 (4% and 0.7%). Economic development is given as a reason for 20% of the improvements in the current inventory but only 1% of the improvements completed since 2007. Of the $578 million worth of other utility infrastructure needs reported in 2007, 74% has been completed. A single project in Nashville, owned by the metropolitan government,
The Environmental Protection Agency says the capital needs of water utilities over 20 years amount to $384 billion to keep tap water clean and another $298 billion to address wastewater and runoff . By comparison, over the last 25 years, the E.P.A.’s primary wastewater grant and loan program distributed over $100 billion, a fraction of the investment the nation needs to make now.David S. Beckman, New York Times, “The Threats to Our Drinking Water,” August. 6, 2014.
WWW.TN.GOV/TACIR30
Building Tennessee’s Tomorrow: Anticipating the State’s Infrastructure Needs
accounts for more than two-thirds of the 2007 total and 94% of the cost of improvements completed since then. All of the county costs were paid for by the counties themselves, mainly from user fees. Cities own just 5% of other utility infrastructure and paid 97% of the cost of their own.
Public health and safety is the main reason given for all fi re protection infrastructure, but population growth is also given as a reason for 25% of it. Although community enhancement is given as a reason for only 6% of the fi re protection improvements in the current inventory, it is given as a reason for nearly 19% of improvements completed since 2007. Local offi cials report that $173 million is needed for the fi re protection infrastructure in the current inventory and that around one-fi fth of that cost ($34 million) is funded. Only 29% ($60 million) of the fi re protection infrastructure needed in 2007 has been completed. Almost two-thirds (62%) of fi re protection infrastructure improvements completed since 2007 belong to cities, which paid 91% of the cost of their improvements, and 38% of the improvements are owned by counties, which paid 96% of their costs.
As with fi re protection, public health and safety is the main reason given for all law enforcement infrastructure. Population growth is also given as a reason for 24% of law enforcement infrastructure. Community enhancement is given as a reason for 30% of the law enforcement improvements in the current inventory and about 14% of improvements completed since 2007. Local offi cials report that $438 million is needed for the law enforcement infrastructure improvements in the current inventory and that $100 million of this cost is funded. Approximately 53% ($389 million) of the law enforcement infrastructure needed in 2007 has been completed. Counties own 86% of the law enforcement infrastructure improvements made since 2007 and paid nearly all (99%) the cost of that infrastructure; 14% is owned by cities, which paid 100% of their costs. Like fi re protection infrastructure, law enforcement infrastructure is funded with general tax revenue.
Public buildings, mainly including county courthouses, county offi ces, city halls, and public works offi ces, serve a variety of purposes and are needed for many reasons. The public building improvements in the current inventory are needed largely for community enhancement (58%) and public health and safety (39%) but also for population growth (37%). A very small percentage (9%) is needed for economic development. Improvements that have been completed since 2007 were needed mainly for public health and safety (55%) but also for community enhancement (29%) and economic development (27%), and to a lesser extent for population growth (19%). About $255 million is needed for public building infrastructure in the current inventory, and $93 million of this cost is funded, mostly with general tax revenue. More than one-third ($180 million) of the public building improvements needed in 2007 have been completed. Approximately 61% of those belong to counties, which paid nearly their entire cost (97%), and 37% of them are owned by cities, which paid 91% of their cost.
The Highway Trust Fund is running broke
because it is funded by one of the few taxes in
the federal government that is denominated in a dollar amount rather
than a percentage, and is not indexed for infl ation.
Since it was set at 18.4 cents per gallon in 1993,
it has lost nearly half its value and would have to
be raised to 30 cents now just to have the same
purchasing power that 18.4 cents had more than
two decades ago.USA Today Editorial Board, The Leaf Chronicle, “House Plan on
Highways Irresponsible,” July 15, 2014.
http://www.theleafchronicle.com/article/20140716/
OPINION/307160008/GUEST-EDITORIAL-House-plan-highways-
irresponsible

31WWW.TN.GOV/TACIR
Funding the State’s Infrastructure Needs
Community enhancement is the reason given most often (95%) for business district development infrastructure in the current inventory, but only for 35% of the improvements completed since 2007. Not surprisingly, economic development is often the reason for needing this type of infrastructure (82% in the current inventory and 66% for those improvements completed since 2007). While population growth is listed as a reason for only 1% of the business district improvements in the current inventory, it is listed as a reason for over half (56%) of those completed since 2007. Of the $982 million needed for business district infrastructure in the current inventory, 95% ($928 million) is funded, and nearly all of it belongs to counties. Most of this is for the new convention center and the adjacent art district redevelopment area in Nashville, which together cost an estimated $854 million and are included as county infrastructure because they are owned by a metropolitan government. About one-fi fth ($62 million) of the business district infrastructure needed in 2007 has been completed. Nearly all (95%) of the $62 million worth of business district infrastructure improvements completed since 2007 belong to counties, which paid 63% of the cost of their improvements. Three-quarters of this belongs to Metropolitan Nashville and Davidson County. Most of the remainder of county costs (33%) was funded by the federal government.
Economic development is the main reason for nearly all industrial sites and parks infrastructure (95% of improvements in the current inventory and 99% of those completed). Community enhancement and population growth are reasons given for 22% and 16% of industrial sites and parks in the current inventory. Community enhancement was given as a reason for only 5% of industrial site and park improvements completed since 2007; population growth was not given as a reason for any of this new infrastructure. These projects can be complex with multiple components, such as roads, rail spurs, ports, and utilities that are classifi ed as other types of infrastructure (e.g., transportation and water and wastewater) and have diff erent funding sources. Rail spurs and ports are typically funded with state or federal grants; utilities are typically funded with user fees. Only 17% ($47 million) of the $274 million needed for industrial site and park infrastructure in the current inventory is fully funded. Slightly over 28% ($63 million) of the industrial site and park improvements needed in 2007 have been completed. Approximately 66% of industrial site and park improvements completed since 2007 belong to counties, which paid 53% of the cost of their improvements. Federal and state sources, such as the state departments of transportation and of economic and community development, paid 44% of the cost of counties’ improvements. About 23% of the improvements are owned by cities, which paid 54% of their costs. The state paid about a quarter of the cost of these, and special districts paid 15% of cities’ costs, mainly for water or wastewater infrastructure.
Community enhancement is the reason given for nearly all (93%) new recreation infrastructure in the current inventory and nearly all (94%) improvements completed since 2007. About 34% ($267 million) of the $792 million worth of recreation infrastructure is fully funded, mainly
The gap between what it would cost to properly maintain and upgrade America’s infrastructure and what governments currently spend is vast.Charles Chieppo, Governing, “How Technology Can Stretch Infrastructure Dollars,” July 9, 2014.http://www.governing.com/blogs/bfc/col-infrastructure-maintenance-cost-south-carolina-bridge-monitoring.html
WWW.TN.GOV/TACIR32
Building Tennessee’s Tomorrow: Anticipating the State’s Infrastructure Needs
by general tax revenue. About 33% ($296 million) of the recreation improvements needed in 2007 have been completed. When looking at the 2007 completions, 57% were owned by cities and 36% were owned by counties. Cities paid 62% of their costs and counties paid 72% of theirs. The rest of the funding came from state and federal agencies, with federal agencies paying 20% of the cost of city-owned improvements and 18% of the cost of county-owned improvements. The state paid the other 13% for cities and 2% for counties.
The current inventory includes only one housing project; two were completed in 2012. Community enhancement is given as a reason for all three of these projects, and economic development is given for the one in Memphis, which is the only housing need in the current inventory. Community enhancement was the main reason for nearly all (99%) of the housing improvements made since 2007. Population growth, public health and safety, and economic development were reasons for 24%, 23%, and 22% of those improvements. Of the $72 million in housing improvement needs reported in 2007, 66% has been completed. Cities own 62% of this housing and paid 47% of the cost; federal and private grants shared the rest of the cost about equally. The federal government paid nearly all (99%) of the cost of county-owned housing improvements, which accounted for the remaining 38% of this public infrastructure.
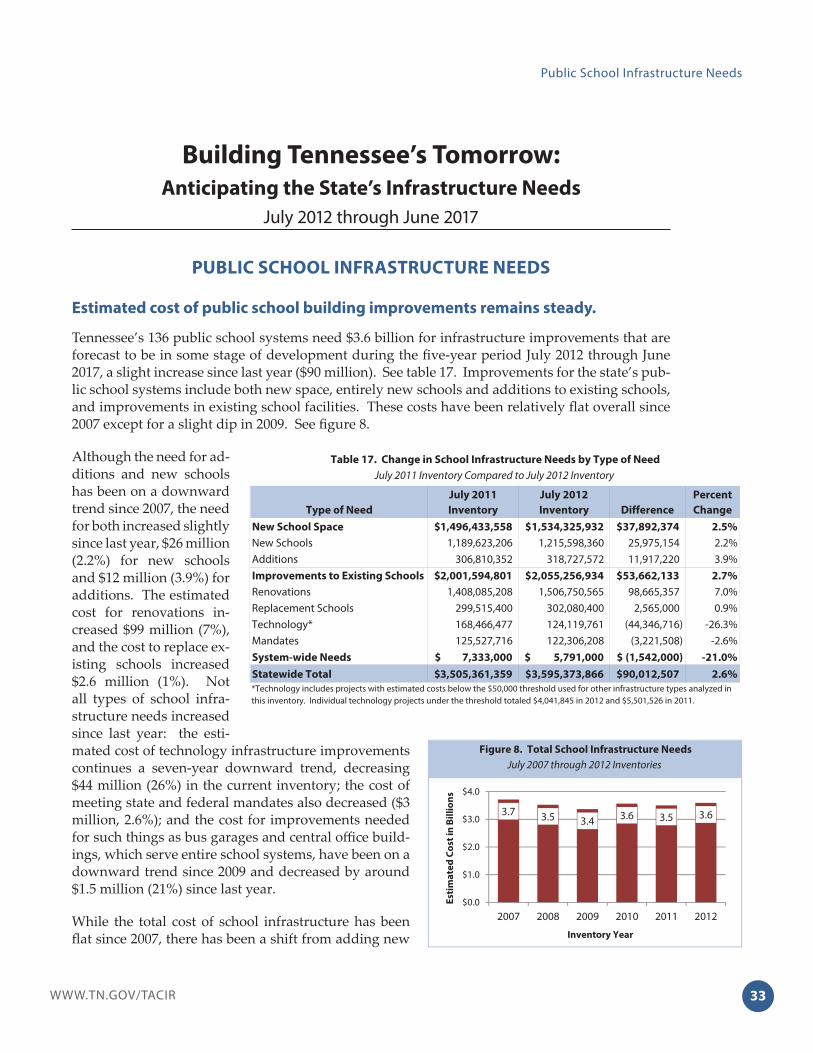
33WWW.TN.GOV/TACIR
Public School Infrastructure Needs
Building Tennessee’s Tomorrow:
Anticipating the State’s Infrastructure Needs
July 2012 through June 2017
PUBLIC SCHOOL INFRASTRUCTURE NEEDS
Estimated cost of public school building improvements remains steady.
Tennessee’s 136 public school systems need $3.6 billion for infrastructure improvements that are forecast to be in some stage of development during the fi ve-year period July 2012 through June 2017, a slight increase since last year ($90 million). See table 17. Improvements for the state’s pub-lic school systems include both new space, entirely new schools and additions to existing schools, and improvements in existing school facilities. These costs have been relatively fl at overall since 2007 except for a slight dip in 2009. See fi gure 8.
Although the need for ad-ditions and new schools has been on a downward trend since 2007, the need for both increased slightly since last year, $26 million (2.2%) for new schools and $12 million (3.9%) for additions. The estimated cost for renovations in-creased $99 million (7%), and the cost to replace ex-isting schools increased $2.6 million (1%). Not all types of school infra-structure needs increased since last year: the esti-mated cost of technology infrastructure improvements continues a seven-year downward trend, decreasing $44 million (26%) in the current inventory; the cost of meeting state and federal mandates also decreased ($3 million, 2.6%); and the cost for improvements needed for such things as bus garages and central offi ce build-ings, which serve entire school systems, have been on a downward trend since 2009 and decreased by around $1.5 million (21%) since last year.
While the total cost of school infrastructure has been fl at since 2007, there has been a shift from adding new
New School Space 1,496,433,558$ 1,534,325,932$ 37,892,374$ 2.5%
New Schools 1,189,623,206 1,215,598,360 25,975,154 2.2%Additions 306,810,352 318,727,572 11,917,220 3.9%Improvements to Existing Schools 2,001,594,801$ 2,055,256,934$ 53,662,133$ 2.7%
Renovations 1,408,085,208 1,506,750,565 98,665,357 7.0%Replacement Schools 299,515,400 302,080,400 2,565,000 0.9%Technology* 168,466,477 124,119,761 (44,346,716) -26.3%Mandates 125,527,716 122,306,208 (3,221,508) -2.6%System-wide Needs 7,333,000$ 5,791,000$ (1,542,000)$ -21.0%
Statewide Total 3,505,361,359$ 3,595,373,866$ 90,012,507$ 2.6%
Table 17. Change in School Infrastructure Needs by Type of Need
July 2011 Inventory Compared to July 2012 Inventory
*Technology includes projects with estimated costs below the $50,000 threshold used for other infrastructure types analyzed in this inventory. Individual technology projects under the threshold totaled $4,041,845 in 2012 and $5,501,526 in 2011.
Type of Need Difference
July 2011
Inventory
July 2012
Inventory
Percent
Change
Figure 8. Total School Infrastructure Needs
July 2007 through 2012 Inventories
3.7 3.5 3.4 3.6 3.5 3.6
$0.0
$1.0
$2.0
$3.0
$4.0
2007 2008 2009 2010 2011 2012
Est
ima
ted
Co
st i
n B
illi
on
s
Inventory Year
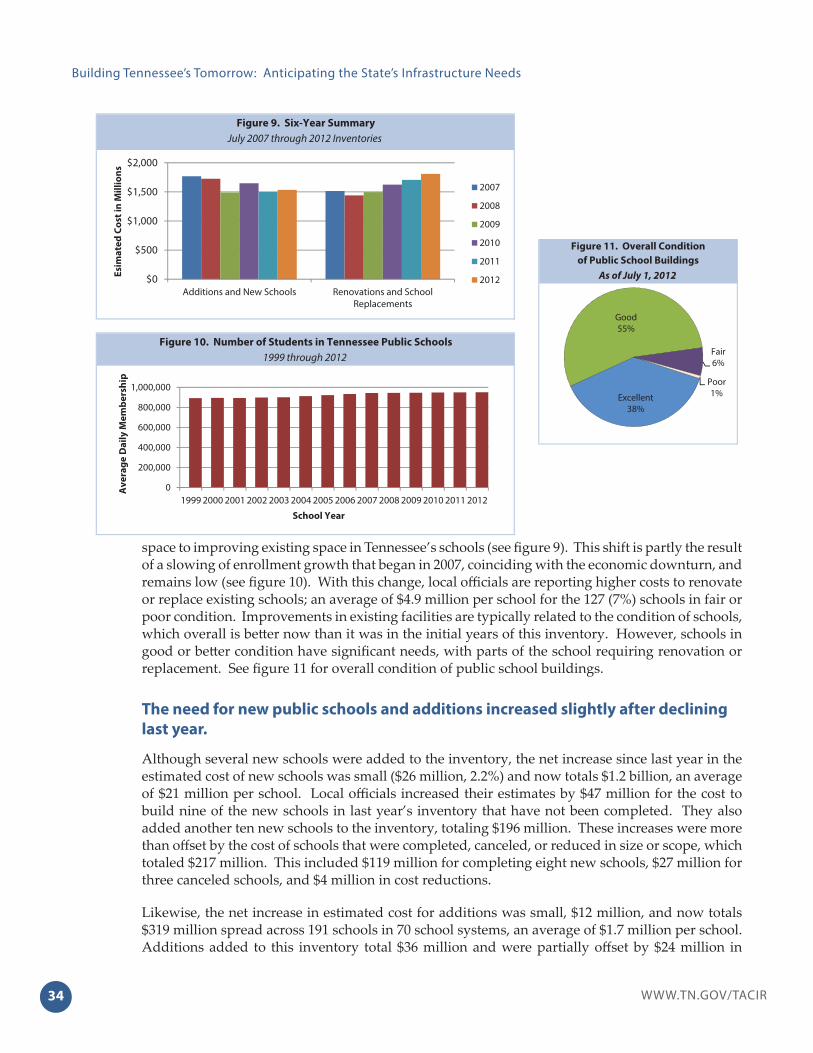
WWW.TN.GOV/TACIR34
Building Tennessee’s Tomorrow: Anticipating the State’s Infrastructure Needs
space to improving existing space in Tennessee’s schools (see fi gure 9). This shift is partly the result of a slowing of enrollment growth that began in 2007, coinciding with the economic downturn, and remains low (see fi gure 10). With this change, local offi cials are reporting higher costs to renovate or replace existing schools; an average of $4.9 million per school for the 127 (7%) schools in fair or poor condition. Improvements in existing facilities are typically related to the condition of schools, which overall is bett er now than it was in the initial years of this inventory. However, schools in good or bett er condition have signifi cant needs, with parts of the school requiring renovation or replacement. See fi gure 11 for overall condition of public school buildings.
The need for new public schools and additions increased slightly after declining
last year.
Although several new schools were added to the inventory, the net increase since last year in the estimated cost of new schools was small ($26 million, 2.2%) and now totals $1.2 billion, an average of $21 million per school. Local offi cials increased their estimates by $47 million for the cost to build nine of the new schools in last year’s inventory that have not been completed. They also added another ten new schools to the inventory, totaling $196 million. These increases were more than off set by the cost of schools that were completed, canceled, or reduced in size or scope, which totaled $217 million. This included $119 million for completing eight new schools, $27 million for three canceled schools, and $4 million in cost reductions.
Likewise, the net increase in estimated cost for additions was small, $12 million, and now totals $319 million spread across 191 schools in 70 school systems, an average of $1.7 million per school. Additions added to this inventory total $36 million and were partially off set by $24 million in
July 2007 through 2012 InventoriesFigure 9. Six-Year Summary
$0
$500
$1,000
$1,500
$2,000
Additions and New Schools Renovations and SchoolReplacements
Esi
ma
ted
Co
st i
n M
illi
on
s
2007
2008
2009
2010
2011
2012
Figure 10. Number of Students in Tennessee Public Schools
1999 through 2012
0
200,000
400,000
600,000
800,000
1,000,000
1999 2000 2001 2002 2003 2004 2005 2006 2007 2008 2009 2010 2011 2012
School Year
Av
era
ge
Da
ily
Me
mb
ers
hip
Figure 11. Overall Condition
of Public School Buildings
As of July 1, 2012
Good 55%
Fair 6%
Poor1%Excellent
38%

35WWW.TN.GOV/TACIR
Public School Infrastructure Needs
cancelled or completed additions. The largest net increase for additions ($6.7 million) was in Montgomery County, most of which was for classrooms at four schools at a combined cost of $5.5 million. The second-largest net increase ($6.3 million) was in Williamson County and included a gym at a middle school, 12 classrooms at an elementary school, and increases in the estimated cost of new auditoriums at four middle schools. Fourteen other school systems added additions for 18 schools to the inventory. Hamblen County added $6.3 million to the inventory for 16 classrooms at Morristown West High School, and Davidson County added $3.7 million to the inventory for 12 additional classrooms at William Henry Oliver Middle School. The remaining 12 systems are both large and small with combined needs totaling less than $15 million.
The number of portables at Tennessee’s public schools has declined slightly as
enrollment growth has fl attened out.
Statewide, school systems report 2,170 portable classrooms, down by 87 since the 2007 inventory (see fi gure 12). School systems use portables to deal with unanticipated space shortages, such as those caused by natural disasters, and to provide temporary classroom space for large infl uxes of new students while they plan more permanent solutions. Williamson County is a good example of a system that used additional portables as a temporary solution while building new schools. They had 21 portable classrooms in 2007, 61 in 2009 pending construction of six new schools, and 22 in 2011 as those schools were completed. For this inventory, as they awaited completion of nine new schools, they increased the number of portables to 28.
As indicated in fi gure 12, this year’s total of 2,170 portable classrooms (3.1% of all classrooms) is just three less than the total reported last year. As illustrated in map 6, which sums system-level information on portables to the county level, most counties (70 of 95) rely on portables for 3.5% or less of their total classrooms but several use them more. Twenty-two counties rely on portables for between 3.5% and 7.5% of their classrooms and three, Cannon, Clay and Jeff erson, rely on them for
GilesShelby Wayne
Dyer
Scott
Maury
Knox
Henry
Fayette
Sevier
Polk
Obion
Carroll
Hardin
Monroe
Greene
Blount
GibsonWilson
Lincoln Marion
Perry
Hickman
Cocke
FranklinMcNairy
Tipton
Weakley
Madison
Stewart
White
Coffee
Warren
Bedford
Clay
Williamson
Sullivan
Putnam
Claiborne
Lewis
MaconSumner
Morgan
HamiltonHardeman Lawrence
Rhea
Roane
Dickson
Haywood
Benton
Hawkins
Rutherford
Carter
Cumberland
Fentress
Davidson
McMinn
OvertonCampbell
Smith
Bledsoe
Humphreys
Grundy
Henderson
Robertson
DeKalb
Lauderdale
Decatur
Montgomery
Marshall
Bradley
UnionLake Jackson
ChesterMeigs
Anderson
Johnson
Grainger
Jefferson
LoudonCannon
Unicoi
Crockett
CheathamWashington
Pickett Hancock
Van Buren
Houston
SequatchieMoore
HamblenTrousdale
Zero (18)
< 2% (34)
2% - 3.5% (18)
3.5% - 7.5% (22)
7.5% - 11% (3)
Map 6. Portable Classrooms as a Percent of Total Classrooms by County
July 2012 Inventory
Portable classrooms
as a Percentage of
Total Classrooms
July 2007 through 2012 InventoriesFigure 12. Number of Portable Classrooms
0
1,000
2,000
3,000
2007 2008 2009 2010 2011 2012
2,257 2,308 2,296 2,206 2,173 2,170
Nu
mb
er
of
Po
rta
ble
Cla
ssro
om
s
Inventory Year

WWW.TN.GOV/TACIR36
Building Tennessee’s Tomorrow: Anticipating the State’s Infrastructure Needs
more than 7.5%. These three counties are shaded dark blue in map 6. Cannon and Clay counties both use portables for 11% of their classrooms, and Jeff erson uses portables for 8%. Cannon has reported that portables made up 11% of their classrooms each year since the 2007 inventory. Clay’s use of portables peaked in 2010 at 13%, and Jeff erson’s use of portables peaked the same year at 12%. Information about each school system’s use of portables can be found in appendix G-7.
Twenty-one school systems used more portables in 2012 than in 2007. While most school systems added only a few, fi ve added 10 or more portables—Rhea (18), Cumberland (17), Wilson (13), Montgomery (11), and Knox (10). In the case of Rhea County, two schools added portable classrooms in 2008, which were still in use in 2012, to accommodate student population growth while a new school is being built. Cumberland County had only eight portable classrooms in 2007 but now has 25. Wilson County also increased their use of portable classrooms at three elementary schools, up 13 since 2007, because of increasing enrollment. They are 9th in enrollment growth and report the third-highest need for new space. Montgomery County has steadily increased the use of portables from 58 in 2007 to 69 in 2012. Knox County continues to use 143 portables for the fourth year in a row, at least one at 38 of their 88 schools.
Overall, 29 school systems report fewer portable classrooms in 2012 than they did in 2007. Shelby and Davidson counties, the two largest school systems, had two of the largest decreases in the number of portable classrooms. Respectively, they are using 104 and 332 portables now, which is fewer than in 2007 when they had 147 and 351. They no longer need as many portables because both systems built new schools and completed additions to existing schools. Dyer County now only uses fi ve portable classrooms after using 25 portables since 2007 while they awaited two replacement school projects that were completed in 2012. Similarly, Hardin County decreased its number of portable classrooms to three in 2010 from 28 in 2007 by consolidating fi ve existing schools that used portables into two schools that do not. The other 25 systems with decreases used from one to ten fewer portable classrooms, and four systems now use zero portables.
Not every system uses portables. The number of systems not using them has increased from 46 in 2007 to 48 in 2012. Four systems that had portable classrooms in 2007 no longer do—Athens, Manchester, and Hawkins and Moore counties. This could be because of slow-growing or shrinking enrollment. Athens’ student enrollment decreased by 222 students and Hawkins County decreased by 317. Student enrollment in Moore County increased by only 12 students. Manchester’s enrollment increased by 108 students. Since 2007, enrollment also decreased in 29 of the other 44 systems without portables. Of the 44 systems that had no portables in 2007 and still don’t have any, 29 decreased in enrollment by an average of 140 students, and 14 increased by an average of 131 students.
Some school systems (42) continue to use the same number of portable classrooms as they did in 2007. The largest unchanged user of portables is Blount County, which has been using 53 portables spread out over the same ten schools in each of the past six inventories with an average age of 38 years. Portables are used mainly for two reasons—to fulfi ll the need for additional space caused by enrollment growth or to add temporary space needed during a period of extensive renovation. The ten schools using portables in Blount have an average of $190 thousand in renovation and upgrade needs of which none are over $420 thousand individually. Their enrollment numbers have increased by 338 since 2001 and quite possibly caused this need, but we anticipate this need to decrease some time in the future because after peaking in 2008, their enrollment has decreased 555 students (4.8%). The second-largest example is Jeff erson County with 40 portables spread
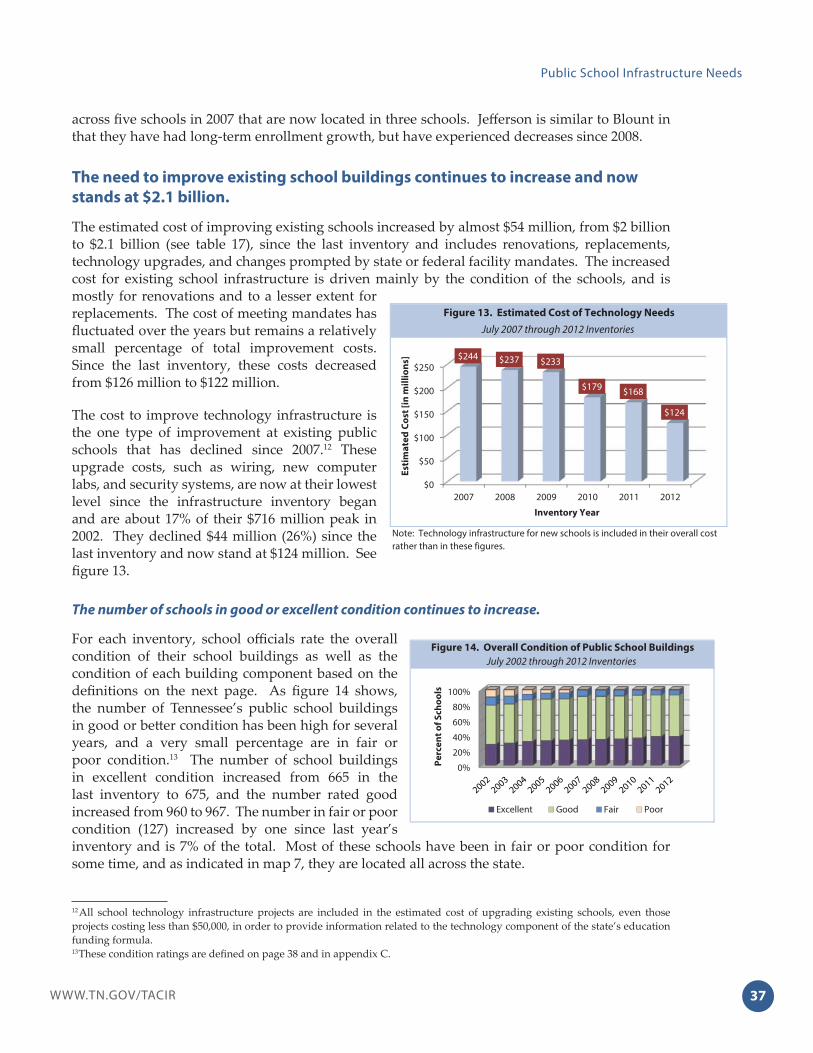
37WWW.TN.GOV/TACIR
Public School Infrastructure Needs
across fi ve schools in 2007 that are now located in three schools. Jeff erson is similar to Blount in that they have had long-term enrollment growth, but have experienced decreases since 2008.
The need to improve existing school buildings continues to increase and now
stands at $2.1 billion.
The estimated cost of improving existing schools increased by almost $54 million, from $2 billion to $2.1 billion (see table 17), since the last inventory and includes renovations, replacements, technology upgrades, and changes prompted by state or federal facility mandates. The increased cost for existing school infrastructure is driven mainly by the condition of the schools, and is mostly for renovations and to a lesser extent for replacements. The cost of meeting mandates has fl uctuated over the years but remains a relatively small percentage of total improvement costs. Since the last inventory, these costs decreased from $126 million to $122 million.
The cost to improve technology infrastructure is the one type of improvement at existing public schools that has declined since 2007.12 These upgrade costs, such as wiring, new computer labs, and security systems, are now at their lowest level since the infrastructure inventory began and are about 17% of their $716 million peak in 2002. They declined $44 million (26%) since the last inventory and now stand at $124 million. See fi gure 13.
The number of schools in good or excellent condition continues to increase.
For each inventory, school offi cials rate the overall condition of their school buildings as well as the condition of each building component based on the defi nitions on the next page. As fi gure 14 shows, the number of Tennessee’s public school buildings in good or bett er condition has been high for several years, and a very small percentage are in fair or poor condition.13 The number of school buildings in excellent condition increased from 665 in the last inventory to 675, and the number rated good increased from 960 to 967. The number in fair or poor condition (127) increased by one since last year’s inventory and is 7% of the total. Most of these schools have been in fair or poor condition for some time, and as indicated in map 7, they are located all across the state.
12 All school technology infrastructure projects are included in the estimated cost of upgrading existing schools, even those projects costing less than $50,000, in order to provide information related to the technology component of the state’s education funding formula.13 These condition ratings are defi ned on page 38 and in appendix C.
July 2007 through 2012 Inventories
Figure 13. Estimated Cost of Technology Needs
Note: Technology infrastructure for new schools is included in their overall cost rather than in these figures.
$0
$50
$100
$150
$200
$250
2007 2008 2009 2010 2011 2012
$244 $237 $233
$179 $168
$124E
stim
ate
d C
ost
[in
mil
lio
ns]
Inventory Year
Figure 14. Overall Condition of Public School Buildings
July 2002 through 2012 Inventories
0%
20%
40%
60%
80%
100%
Pe
rce
nt
of
Sc
ho
ols
Excellent Good Fair Poor
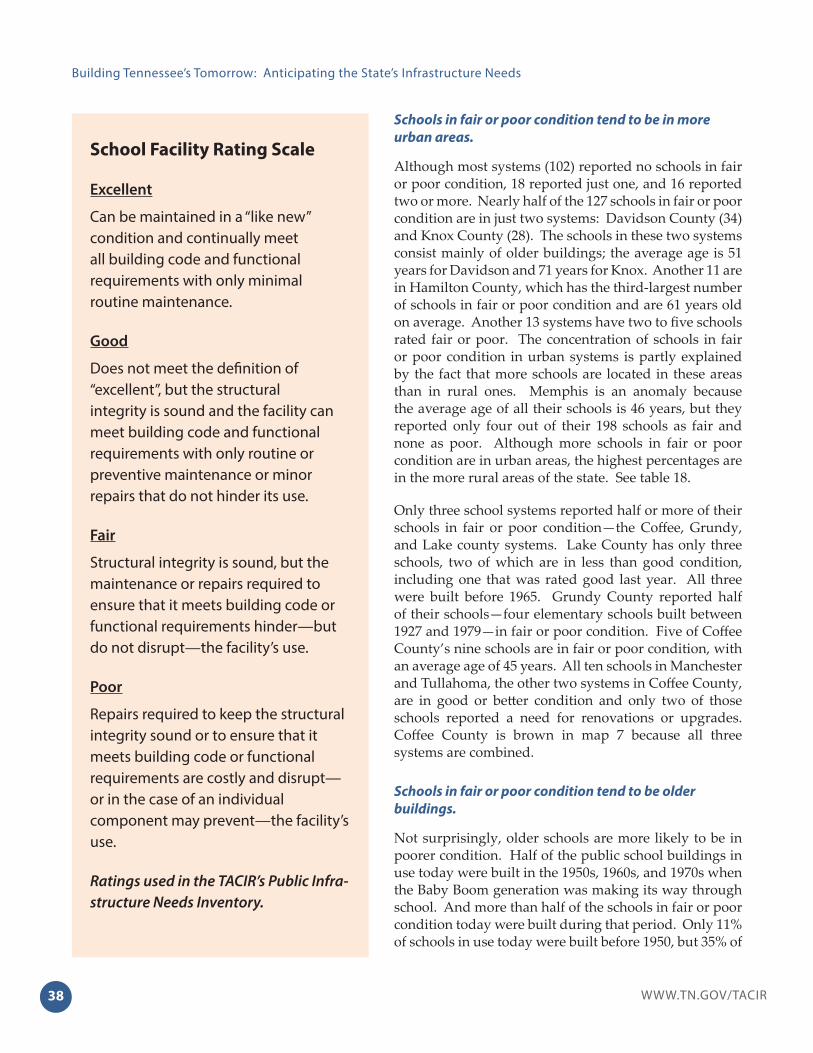
WWW.TN.GOV/TACIR38
Building Tennessee’s Tomorrow: Anticipating the State’s Infrastructure Needs
Schools in fair or poor condition tend to be in more
urban areas.
Although most systems (102) reported no schools in fair or poor condition, 18 reported just one, and 16 reported two or more. Nearly half of the 127 schools in fair or poor condition are in just two systems: Davidson County (34) and Knox County (28). The schools in these two systems consist mainly of older buildings; the average age is 51 years for Davidson and 71 years for Knox. Another 11 are in Hamilton County, which has the third-largest number of schools in fair or poor condition and are 61 years old on average. Another 13 systems have two to fi ve schools rated fair or poor. The concentration of schools in fair or poor condition in urban systems is partly explained by the fact that more schools are located in these areas than in rural ones. Memphis is an anomaly because the average age of all their schools is 46 years, but they reported only four out of their 198 schools as fair and none as poor. Although more schools in fair or poor condition are in urban areas, the highest percentages are in the more rural areas of the state. See table 18.
Only three school systems reported half or more of their schools in fair or poor condition—the Coff ee, Grundy, and Lake county systems. Lake County has only three schools, two of which are in less than good condition, including one that was rated good last year. All three were built before 1965. Grundy County reported half of their schools—four elementary schools built between 1927 and 1979—in fair or poor condition. Five of Coff ee County’s nine schools are in fair or poor condition, with an average age of 45 years. All ten schools in Manchester and Tullahoma, the other two systems in Coff ee County, are in good or bett er condition and only two of those schools reported a need for renovations or upgrades. Coff ee County is brown in map 7 because all three systems are combined.
Schools in fair or poor condition tend to be older
buildings.
Not surprisingly, older schools are more likely to be in poorer condition. Half of the public school buildings in use today were built in the 1950s, 1960s, and 1970s when the Baby Boom generation was making its way through school. And more than half of the schools in fair or poor condition today were built during that period. Only 11% of schools in use today were built before 1950, but 35% of
School Facility Rating Scale
Excellent
Can be maintained in a “like new” condition and continually meet all building code and functional requirements with only minimal routine maintenance.
Good
Does not meet the defi nition of “excellent”, but the structural integrity is sound and the facility can meet building code and functional requirements with only routine or preventive maintenance or minor repairs that do not hinder its use.
Fair
Structural integrity is sound, but the maintenance or repairs required to ensure that it meets building code or functional requirements hinder—but do not disrupt—the facility’s use.
Poor
Repairs required to keep the structural integrity sound or to ensure that it meets building code or functional requirements are costly and disrupt—or in the case of an individual component may prevent—the facility’s use.
Ratings used in the TACIR’s Public Infra-structure Needs Inventory.

39WWW.TN.GOV/TACIR
Public School Infrastructure Needs
GilesShelby Wayne
Dyer
Scott
Maury
Knox
Henry
Fayette
Sevier
Polk
Obion
Carroll
Hardin
Monroe
Greene
Blount
GibsonWilson
Lincoln Marion
Perry
Hickman
Cocke
FranklinMcNairy
Tipton
Weakley
Madison
Stewart
White
Coffee
Warren
Bedford
Clay
Williamson
Sullivan
Putnam
Claiborne
Lewis
MaconSumner
Morgan
HamiltonHardeman Lawrence
Rhea
Roane
Dickson
Haywood
Benton
Hawkins
Rutherford
Carter
Cumberland
Fentress
Davidson
McMinn
OvertonCampbell
Smith
Bledsoe
Humphreys
Grundy
Henderson
Robertson
DeKalb
Lauderdale
Decatur
Montgomery
Marshall
Bradley
UnionLake Jackson
ChesterMeigs
Anderson
Johnson
Grainger
Jefferson
LoudonCannon
Unicoi
Crockett
CheathamWashington
Pickett Hancock
Van Buren
Houston
SequatchieMoore
HamblenTrousdale
Zero (63)
0% - 15% (22)
15% - 30% (7)
30% - 45% (1)
45% - 60% (1)
> 60% (1)
Map 7. Percent of School Buildings in Fair or Poor Condition by County
As of July 1, 2012
Percent of Total Schools
in Fair or Poor Condition
All Schools Schools in Fair or Poor Condition
School System
Number
of
Schools
Estimated Cost
to Renovate and
Replace
Number
of
Schools
Percent
Fair/Poor
Estimated Cost
to Renovate
and Replace
Percent of
Renovation
Needs
Knox County 88 91,924,998$ 34 38.6% 54,774,500$ 59.6%
Davidson County 139 519,648,000 28 20.1% 195,155,000 37.6%
Hamilton County 76 28,075,500 11 14.5% 20,598,000 73.4%
Coffee County 9 41,755,000 5 55.6% 41,755,000 100.0%
Grundy County 8 6,765,000 4 50.0% 6,015,000 88.9%
Memphis 198 226,717,021 4 2.0% 1,464,000 0.6%
Bradley County 19 13,015,000 3 15.8% 5,260,000 40.4%
Putnam County 21 27,255,000 3 14.3% 26,505,000 97.2%
Bristol 8 39,357,000 3 37.5% 28,857,000 73.3%
Oak Ridge 8 15,073,133 2 25.0% 14,000,000 92.9%
Fayette County 11 14,160,000 2 18.2% 13,130,000 92.7%
Lake County 3 10,660,000 2 66.7% 10,660,000 100.0%
Marion County 10 8,050,000 2 20.0% 7,870,000 97.8%
Monroe County 13 33,909,630 2 15.4% 17,143,890 50.6%
Morgan County 8 5,299,000 2 25.0% 2,194,000 41.4%
Sullivan County 23 11,715,000 2 8.7% 610,000 5.2%
Subtotal 642 1,093,379,282$ 109 17% 445,991,390$ 40.8%
All Others 1,127 715,451,683 18 2% 171,331,788 23.9%
State Total 1,769 1,808,830,965$ 127 7% 617,323,178$ 34.1%
Table 18. Renovation and Replacement Costs for the 16 Systems
with Two or More Schools in Fair or Poor Condition
Five-year Period July 2012 through June 2017
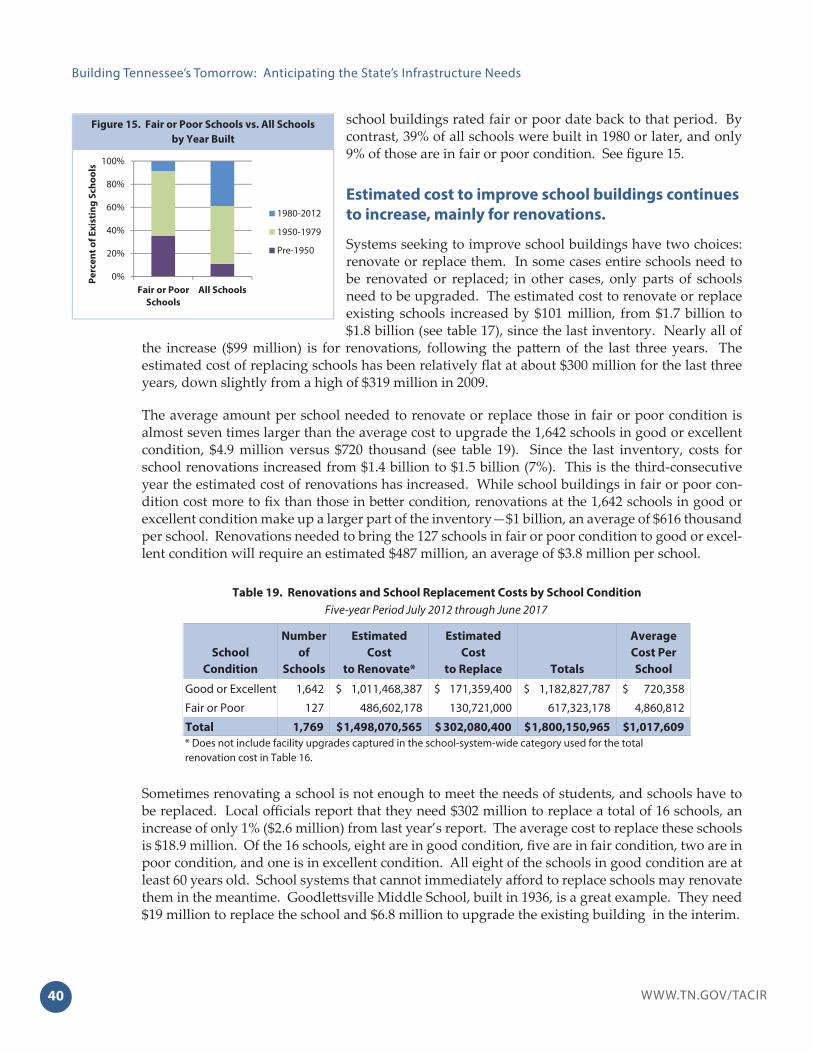
WWW.TN.GOV/TACIR40
Building Tennessee’s Tomorrow: Anticipating the State’s Infrastructure Needs
school buildings rated fair or poor date back to that period. By contrast, 39% of all schools were built in 1980 or later, and only 9% of those are in fair or poor condition. See fi gure 15.
Estimated cost to improve school buildings continues
to increase, mainly for renovations.
Systems seeking to improve school buildings have two choices: renovate or replace them. In some cases entire schools need to be renovated or replaced; in other cases, only parts of schools need to be upgraded. The estimated cost to renovate or replace existing schools increased by $101 million, from $1.7 billion to $1.8 billion (see table 17), since the last inventory. Nearly all of
the increase ($99 million) is for renovations, following the patt ern of the last three years. The estimated cost of replacing schools has been relatively fl at at about $300 million for the last three years, down slightly from a high of $319 million in 2009.
The average amount per school needed to renovate or replace those in fair or poor condition is almost seven times larger than the average cost to upgrade the 1,642 schools in good or excellent condition, $4.9 million versus $720 thousand (see table 19). Since the last inventory, costs for school renovations increased from $1.4 billion to $1.5 billion (7%). This is the third-consecutive year the estimated cost of renovations has increased. While school buildings in fair or poor con-dition cost more to fi x than those in bett er condition, renovations at the 1,642 schools in good or excellent condition make up a larger part of the inventory—$1 billion, an average of $616 thousand per school. Renovations needed to bring the 127 schools in fair or poor condition to good or excel-lent condition will require an estimated $487 million, an average of $3.8 million per school.
Sometimes renovating a school is not enough to meet the needs of students, and schools have to be replaced. Local offi cials report that they need $302 million to replace a total of 16 schools, an increase of only 1% ($2.6 million) from last year’s report. The average cost to replace these schools is $18.9 million. Of the 16 schools, eight are in good condition, fi ve are in fair condition, two are in poor condition, and one is in excellent condition. All eight of the schools in good condition are at least 60 years old. School systems that cannot immediately aff ord to replace schools may renovate them in the meantime. Goodlett sville Middle School, built in 1936, is a great example. They need $19 million to replace the school and $6.8 million to upgrade the existing building in the interim.
School
Condition
Number
of
Schools
Estimated
Cost
to Renovate*
Estimated
Cost
to Replace Totals
Average
Cost Per
School
Good or Excellent 1,642 1,011,468,387$ 171,359,400$ 1,182,827,787$ 720,358$
Fair or Poor 127 486,602,178 130,721,000 617,323,178 4,860,812
Total 1,769 1,498,070,565$ 302,080,400$ 1,800,150,965$ 1,017,609$
Table 19. Renovations and School Replacement Costs by School Condition
Five-year Period July 2012 through June 2017
* Does not include facility upgrades captured in the school-system-wide category used for the total renovation cost in Table 16.
Figure 15. Fair or Poor Schools vs. All Schools
by Year Built
0%
20%
40%
60%
80%
100%
Fair or Poor
Schools
All Schools
Pe
rce
nt
of
Ex
isti
ng
Sc
ho
ols
1980-2012
1950-1979
Pre-1950
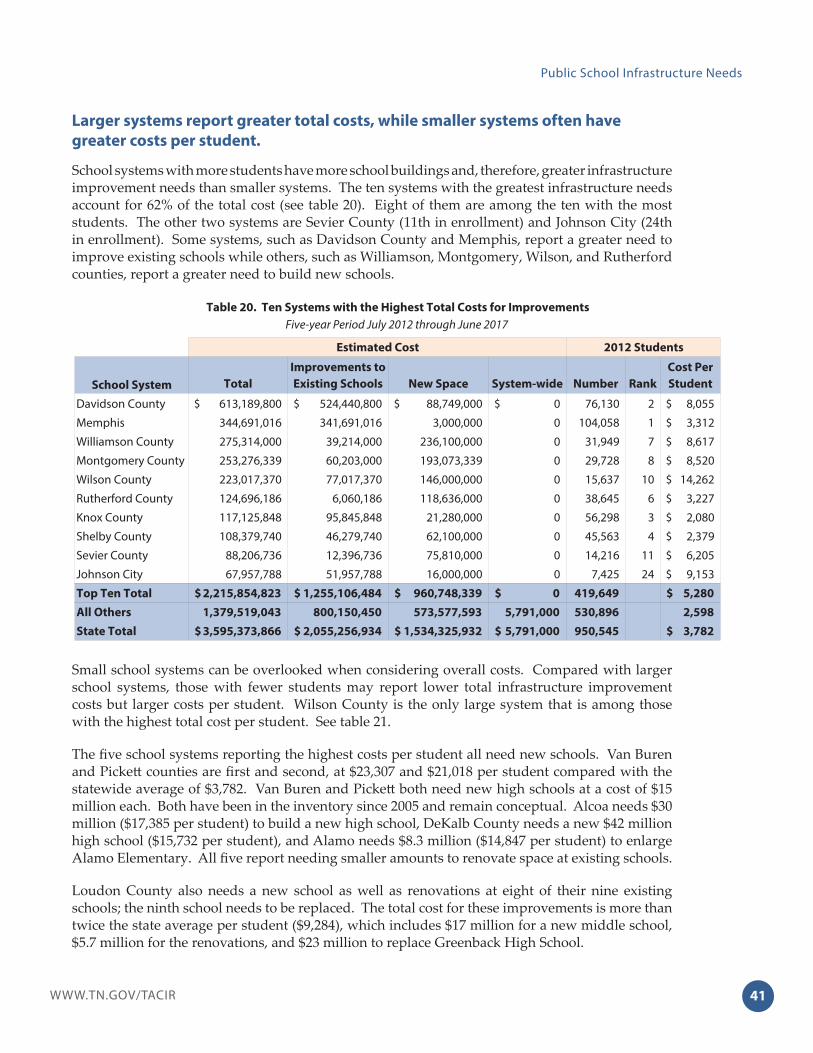
41WWW.TN.GOV/TACIR
Public School Infrastructure Needs
Larger systems report greater total costs, while smaller systems often have
greater costs per student.
School systems with more students have more school buildings and, therefore, greater infrastructure improvement needs than smaller systems. The ten systems with the greatest infrastructure needs account for 62% of the total cost (see table 20). Eight of them are among the ten with the most students. The other two systems are Sevier County (11th in enrollment) and Johnson City (24th in enrollment). Some systems, such as Davidson County and Memphis, report a greater need to improve existing schools while others, such as Williamson, Montgomery, Wilson, and Rutherford counties, report a greater need to build new schools.
Small school systems can be overlooked when considering overall costs. Compared with larger school systems, those with fewer students may report lower total infrastructure improvement costs but larger costs per student. Wilson County is the only large system that is among those with the highest total cost per student. See table 21.
The fi ve school systems reporting the highest costs per student all need new schools. Van Buren and Pickett counties are fi rst and second, at $23,307 and $21,018 per student compared with the statewide average of $3,782. Van Buren and Pickett both need new high schools at a cost of $15 million each. Both have been in the inventory since 2005 and remain conceptual. Alcoa needs $30 million ($17,385 per student) to build a new high school, DeKalb County needs a new $42 million high school ($15,732 per student), and Alamo needs $8.3 million ($14,847 per student) to enlarge Alamo Elementary. All fi ve report needing smaller amounts to renovate space at existing schools.
Loudon County also needs a new school as well as renovations at eight of their nine existing schools; the ninth school needs to be replaced. The total cost for these improvements is more than twice the state average per student ($9,284), which includes $17 million for a new middle school, $5.7 million for the renovations, and $23 million to replace Greenback High School.
School System Total
Improvements to
Existing Schools New Space System-wide Number Rank
Cost Per
Student
Davidson County 613,189,800$ 524,440,800$ 88,749,000$ 0$ 76,130 2 8,055$
Memphis 344,691,016 341,691,016 3,000,000 0 104,058 1 3,312$
Williamson County 275,314,000 39,214,000 236,100,000 0 31,949 7 8,617$
Montgomery County 253,276,339 60,203,000 193,073,339 0 29,728 8 8,520$
Wilson County 223,017,370 77,017,370 146,000,000 0 15,637 10 14,262$
Rutherford County 124,696,186 6,060,186 118,636,000 0 38,645 6 3,227$
Knox County 117,125,848 95,845,848 21,280,000 0 56,298 3 2,080$
Shelby County 108,379,740 46,279,740 62,100,000 0 45,563 4 2,379$
Sevier County 88,206,736 12,396,736 75,810,000 0 14,216 11 6,205$
Johnson City 67,957,788 51,957,788 16,000,000 0 7,425 24 9,153$
Top Ten Total 2,215,854,823$ 1,255,106,484$ 960,748,339$ 0$ 419,649 5,280$
All Others 1,379,519,043 800,150,450 573,577,593 5,791,000 530,896 2,598
State Total 3,595,373,866$ 2,055,256,934$ 1,534,325,932$ 5,791,000$ 950,545 3,782$
Estimated Cost 2012 Students
Five-year Period July 2012 through June 2017Table 20. Ten Systems with the Highest Total Costs for Improvements
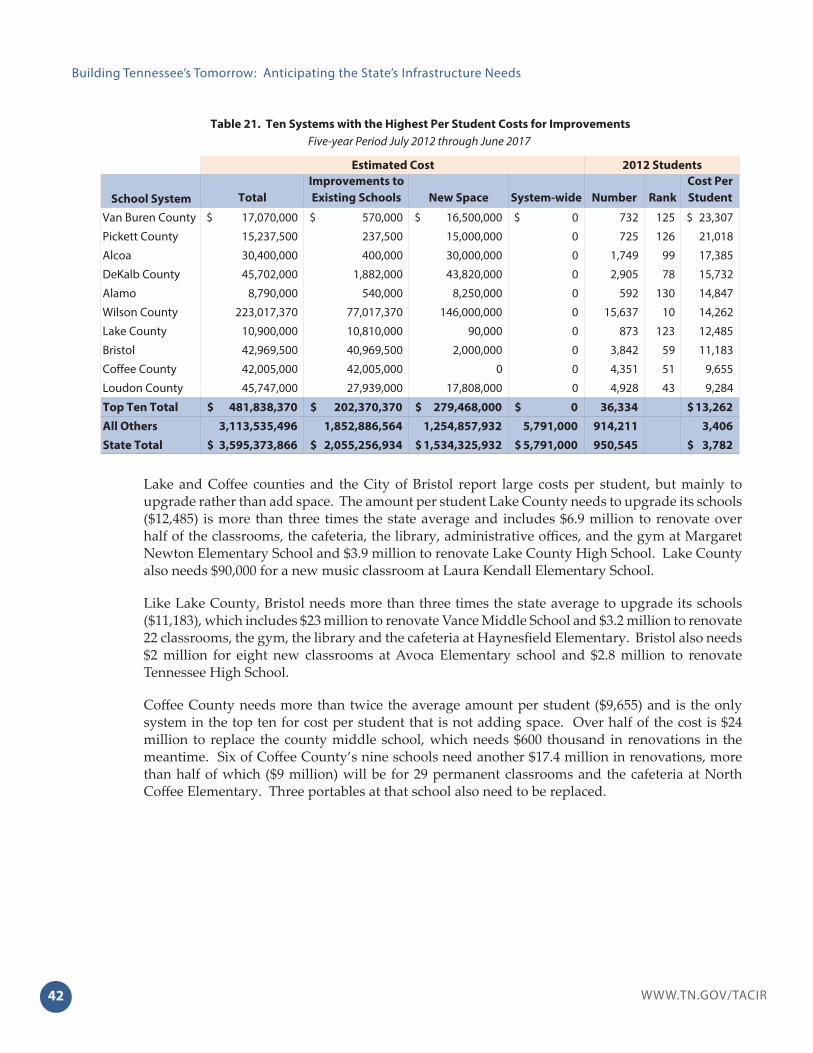
WWW.TN.GOV/TACIR42
Building Tennessee’s Tomorrow: Anticipating the State’s Infrastructure Needs
Lake and Coff ee counties and the City of Bristol report large costs per student, but mainly to upgrade rather than add space. The amount per student Lake County needs to upgrade its schools ($12,485) is more than three times the state average and includes $6.9 million to renovate over half of the classrooms, the cafeteria, the library, administrative offi ces, and the gym at Margaret Newton Elementary School and $3.9 million to renovate Lake County High School. Lake County also needs $90,000 for a new music classroom at Laura Kendall Elementary School.
Like Lake County, Bristol needs more than three times the state average to upgrade its schools ($11,183), which includes $23 million to renovate Vance Middle School and $3.2 million to renovate 22 classrooms, the gym, the library and the cafeteria at Haynesfi eld Elementary. Bristol also needs $2 million for eight new classrooms at Avoca Elementary school and $2.8 million to renovate Tennessee High School.
Coff ee County needs more than twice the average amount per student ($9,655) and is the only system in the top ten for cost per student that is not adding space. Over half of the cost is $24 million to replace the county middle school, which needs $600 thousand in renovations in the meantime. Six of Coff ee County’s nine schools need another $17.4 million in renovations, more than half of which ($9 million) will be for 29 permanent classrooms and the cafeteria at North Coff ee Elementary. Three portables at that school also need to be replaced.
School System Total
Improvements to
Existing Schools New Space System-wide Number Rank
Cost Per
Student
Van Buren County 17,070,000$ 570,000$ 16,500,000$ 0$ 732 125 23,307$
Pickett County 15,237,500 237,500 15,000,000 0 725 126 21,018
Alcoa 30,400,000 400,000 30,000,000 0 1,749 99 17,385
DeKalb County 45,702,000 1,882,000 43,820,000 0 2,905 78 15,732
Alamo 8,790,000 540,000 8,250,000 0 592 130 14,847
Wilson County 223,017,370 77,017,370 146,000,000 0 15,637 10 14,262
Lake County 10,900,000 10,810,000 90,000 0 873 123 12,485
Bristol 42,969,500 40,969,500 2,000,000 0 3,842 59 11,183
Coffee County 42,005,000 42,005,000 0 0 4,351 51 9,655
Loudon County 45,747,000 27,939,000 17,808,000 0 4,928 43 9,284
Top Ten Total 481,838,370$ 202,370,370$ 279,468,000$ 0$ 36,334 13,262$
All Others 3,113,535,496 1,852,886,564 1,254,857,932 5,791,000 914,211 3,406
State Total 3,595,373,866$ 2,055,256,934$ 1,534,325,932$ 5,791,000$ 950,545 3,782$
Estimated Cost 2012 Students
Table 21. Ten Systems with the Highest Per Student Costs for Improvements
Five-year Period July 2012 through June 2017