Building science 2 report pdf
121
ARC 3413 BUILDING SCIENCE 2 Project 1: Lighting and Acoustic Performance Evaluation and Design of Reggae Mansion Hostel, Kuala Lumpur Tutor: Mr. Azim Sulaiman Sumit Dee 0310892 Maria Rosa Seu 0317067 Jayesh Ellayah 0317119 Shuri Kimura 0306575 Ameerah Peerun 0313939 Maria Rosa Seu 0317067 Deenas Talib 1101F12533 Kimberly Ann Ngieng 0319306 Ivan Ling 0313583
Transcript of Building science 2 report pdf

ARC 3413 BUILDING SCIENCE 2
Project1:LightingandAcousticPerformanceEvaluationandDesignofReggaeMansion
Hostel,KualaLumpur
Tutor:Mr.AzimSulaiman
SumitDee0310892
MariaRosaSeu0317067JayeshEllayah0317119ShuriKimura0306575
AmeerahPeerun0313939MariaRosaSeu0317067DeenasTalib1101F12533
KimberlyAnnNgieng0319306IvanLing0313583

2
Contents ABSTRACT 1.0 INTRODUCTION 1.1 AIM AND OBJECTIVES 1.2 SITE STUDY 1.2.1 Introduction to Reggae Mansion Hostel 1.2.2 Reason for Selection 1.2.3 Measured Drawing 2.0 METHODOLOGY 2.0.1 Precedent Studies 2.0.2 Preparations 2.0.3 Site Visit 2.0.4 Recording Data 2.0.5 Diagramming 2.0.6 Calculation 2.0.7 Conclusion
- 3.0 LIGHTING
3.1 LITERATURE REVIEW 3.1.1 Importance of Lights in Architecture 3.1.2 Balance between Science and Arts 3.1.3 Lumen 3.1.4 Illuminance 3.1.5 Brightness and Luminance
3.1.6 Natural Day Lighting and Artificial Electrical Lighting 3.1.7 Daylight Factor
3.2 LIGHTING PRECEDENT STUDY 3.3 SITE STUDY 3.3.1 Zoning of Spaces 3.3.2 Tabulation of Data 3.3.3 Daylight Factor Analysis 3.3.4 Types and Specification of Lights Used 4.0 LIGHTING ANALYSIS AND CALCULATIONS
4.1 ZONE 1: RECEPTION/ LOBBY 4.2 ZONE 2: DINING ROOM/ BAR 4.3 ZONE 3: COURTYARD

3
6.0 ACOUSTICS 6.1 LITERATURE REVIEW 6.1.1 Sound 6.1.2 Architectural Acoustics 6.1.3 Wavelength 6.1.4 Sound Pressure Level 6.1.5 Reverberation Time 6.1.6 Sound Reduction Index (SRI)
6.1.7 Issues of Acoustic Design System 6.2 ACOUSTIC PRECEDENT STUDY 6.3 SITE STUDY
6.3.1 External Noise Sources 6.3.2 Tabulation of Data
7.0 Sound Coefficient Absorption 8.0 INTERIOR NOISE SOURCES ANALYSIS AND CALCULATIONS
8.1 Zone 1: Lobby And Reception 8.2 Zone 2: Dining Room And Bar 8.3 Zone 3: Courtyard
9.0 CONCLUSION REFERENCES

4
ABSTRACT: This report contains the details of the study conducted on the Reggae Mansion Hostel, with
regards to the structure’s lighting and acoustical performances. From researching and
analyzing in the site, the report’s components has been broken down into two major segments,
which are lighting and acoustics. Formulas, equations and calculations are included as
technical data, used as technical data to estimate both the illuminance levels as well as the
noise levels for both light and acoustics. The orthographical drawings such as the floor plans
were given by the management, whereas the sections and elevations of the hostel had to be
done within the group after measuring the selected spaces. The diagrams were made with
programs such as Photoshop, AutoCAD, Ecotect and Revit. To ease navigation throughout
the report, a list of figures and tables are utilized as well as references provided at the end of
the report.
1.0 INTRODUCTION: Lighting design is a major element when concerning architectural design, in interior as well as
exterior architecture. The textures, colors and solid volumes in enclosed spaces can only be
fully appreciated and enhanced when lighting fixtures are made used of appropriately. This
report is meant to expose and introduce us to daylighting and artificial lighting requirements in
suggested spaced.
The architectural design process for lighting takes account of:
• The kind of human activity for which lighting is to be provided
• The amount of light required
• The color of the light as it may affect the views of particular objects and the
environment as a whole.
• The distribution of light within the space to be lighted, whether indoor or outdoor
• The effect of the lightened system itself on the user
Acoustic design in architecture is concerned with the control of sound in enclosed spaces, as
well as the preservation and enhancement of a desired sound. Its goal is also to reduce or
eliminate unwanted noise that interferes with user’s activities. This project exposes and
introduces students to acoustic design and acoustic requirements in suggested spaces.

5
In a group of 7, we had chosen Reggae Mansion Hostel, located in Jalan H.S. Lee, Kuala
Lumpur, as our site of study. We have conducted several visits to out site to ensure the
success of our project outcome. Measured drawings, lighting and acoustic measurements as
well as photographs had been taken while we were on site. We have also performed
calculations and analysis on the spaces studied to produce the results shown in this report.
1.1 AIM AND OBJECTIVES The main motive of the project is to bring forth a deep understanding of lighting and acoustic
performance within a space as well as help students comprehend how lighting and acoustic
influence a space. The assignment is composed of two main components, which are, research
and analysis as well as a comparison study. Comparison studies are essential as it enables
us to note the difference in site context and variation. The aim for students is to understand
the daylighting and artificial lighting as well as the acoustic requirements in a suggested space.
Also, to determine the characteristics and function of daylighting and artificial lighting and
sound and acoustic within the intended space, as well as to critically report and analyze the
selected spaces.
Introduced within the Malaysian context, the project has been programmed in accordance to
the local building codes. Students are assigned to choose a case study and analyze the space
or set of spaces within the same perimeter. Usually the case studies will focus more on
restaurants, auditoriums and galleries as these spaces are more exposed to a disproportion
of lighting and sound sources. Several sites visits had to be conducted at different periods in
order to measure the brightness level and noise level within the space.
This project also aims to provide a better understanding on the relationship between the type
of materials that are employed in terms of building material and how internal furnishing and
finishes affect an internal space. This can help us analyze the impacts on acoustical and
lightings conditions in the building based on the building functions. Understanding the
volume and area of each functional space also helps in determining the lighting
requirements based on acoustical or lighting inadequacy that is reflected in the data
collection. Acknowledging adjacent spaces is also vital to address acoustic concern.
In terms of lighting, specification of luminaries, height of each light as well as existence of
fenestrations helps students to understand the lighting conditions within each space. Backed
up with precedent studies, drawing comparisons with our site study, our precedent studies
will aid in determining the different types of lighting and acoustic.

6
In relation to Building Science 1, Building Science 2 focuses on the human comfort level,
specifically in lighting and acoustic comfort. Once the data was collected, students identified
the issues from light and sound transmissions and how it affects the users in the space. After
that, we had to come up with a handful of solutions in order to maximize the quality of
illumination and acoustic levels. As an architect, it is very important to understand the built
spaces in order to achieve a pleasant environment for users.

7
1.2 SITE STUDY 1.2.1 INTRODUCTION TO REGGAE MANSION HOSTEL
Fig. 1: Exterior of Reggae Mansion
Case Study: Reggae Mansion Hostel (find website for full details) Architect: Siang Chin
Address: 53, Jalan Tun H.S. Lee, Kuala Lumpur, 50000 Malaysia
Type of building: Hostel Reggae Mansion KL, located in the heart of bustling China Town, Kuala Lumpur, is known as
a budget backpacker’s hostel. Surrounded by towering buildings and skyscrapers in the city,
it is a modern, renovated colonial- style building, which are very scarce to find these days,
except in that sector of KL, namely, Jalan H.S. Lee. It invokes a sense of nostalgia of an olden
Kuala Lumpur, both to locals and visitors alike. Happily, Reggae Mansion KL now captures
those nostalgic feelings, with its colonial charm unspoiled, reminiscent to the days gone by.
The hostel is known as the “best and funkiest hostel in KL”. The hostel is a beautifully
renovated 3- story colonial building with a lot of facilities cramped into the structure such dining
room, kitchen and bar and of course variety of lodging facilities. The comfy lounge area is a
hub for backpackers from all over the world to meet, share travel stories & party. Reggae

8
Mansion also features a rooftop bar, which stays open until late and hosts lively parties where
you can see a panoramic view of Kuala Lumpur, including the KL Tower and the Petronas
Twin Towers.
Fig. 2: Reggae Mansion Hostel on Google Map.
Reggae Mansion was designed with an optimizing passive outtake whereby the façade of the
ground floor is covered with glass panel doors to maximize the natural daylight to enter the lobby
and the dining room. As for the courtyard, the roof is provided in a way to make sure that the
natural daylight enters the space. Therefore, one side of the wall is semi- open to achieve the
feel of an open space with natural lighting and natural ventilation.

9
1.2.2 REASON FOR SELECTION After pondering on the site selection thoroughly, we finally decided upon Reggae Mansion as
a case study for lighting and acoustics for diverse reasons:
• A dissimilarity of materials present in the study area such as; ceramic tiles, glass curtain
walls, brick walls, marble floors, concrete walls and much more which will be analyzed
further into the report.
• Variety of lighting system used in different spaces; distinctive types of artificial lighting
(such as LED lights, lamps, and normal lighting fixtures) are utilized and custom made for
specific spaces.
• The acoustic performance and management of spaces. For example, sound sources
emanating from the dining room and how it affects the other surroundings rooms/ spaces.
• Relationship between natural and artificial lighting; how natural lighting is predominantly
used in the daytime and in spaces with glass curtain facades and why artificial lighting
fixtures are utilized in other spaces (materiality, atmosphere etc).
• Relationship between the type of environment and lighting and acoustic.
Also, the dissimilarity between sound sources during non- peak times (morning and afternoon)
and peak times (evenings) were interesting to analyze since Reggae Mansion offers a lot of
night life activities through its rooftop bar, where it blares music. The music can be heard
throughout the whole street and is very different as compared to the mornings and afternoons
where it its relatively quiet, apart from the usual traffic noise. However, for this report, we have
only analyzed the acoustic component during the weekday, where the rooftop bar is inactive.
Also, in terms of lighting, during the day time, most of the spaces make use of natural day
lighting, by utilizing a full glass façade where sun light floods the room and artificial lighting will
only be used at night.

10
1.2.3 MEASURED DRAWINGS
Fig. 3: Site Plan of Reggae Mansion.
Fig. 4: Front Elevation.

11
Fig. 5: Floor Plan of the Ground Floor and the three main zones we are analyzing.

12
Fig. 6: Floor plan with grids added.

13
Fig. 7: SECTION A
Fig. 8: SECTION B

14
ZONE 1: RECEPTION/ LOBBY
Fig. 9: VERTICAL SECTION OF RECEPTION/ LOBBY
Fig. 10: HORIZONTAL SECTION OF RECEPTION/ LOBBY

15
Fig 11: VERTICAL SECTION OF DINING ROOM/ BAR
Fig. 12: HORIZONTAL SECTION OF DINING ROOM/ BAR

16
Fig. 13: VERTICAL SECTION OF COURTYARD
Fig. 14: HORIZONTAL SECTION OF COURTYARD

17
2.0 METHODOLOGY 2.0.1 PRECEDENT STUDIES
Studies of other small- scale hostels, hotels, lodgings, restaurants etc. were conducted, one
for architectural lighting and another for acoustics. We chose certain spaces that are similar
to the selected site spaces. After reading through and analyzing the chosen precedent studies,
important information and diagrams were extracted for our further analysis and references on
site. We used the precedent studies in this report to aid us in analyzing our chosen zones and
has helped us sufficiently.
2.0.2 PREPARATIONS The plans were given from the management of the hostel, whereas the elevations and sections
of the building had to be done within the group. The data collection points were marked and
chosen on the floor plans before going to the site to ease the process so that we could
measure the sound levels and lighting levels quickly and accurately. The method of using the
lux meter and the sound level meter was taught to us before visiting the site. To study the
basic standard and regulations for the analysis, we have referred to CIBSE, ASHREA and
MS1525 and extracted some points for further purposes.
2.0.3 SITE VISIT
We were permitted to analyze and take recordings of the public spaces of Reggae Mansion
such as the reception/ lobby, dining room and the outdoor café of the hostel. However, we
were not permitted to enter the dorms/ sleeping quarters as it is a private area that only guests
can access. We went to the site at least 4 times, during the daytime (12pm-2pm) and during

18
the evening (8pm-9pm). We had to visit the site several times due to various discrepancies
such as bad weather (raining, too cloudy) that could potentially translate to inaccurate
readings, especially for the lighting analysis. Also, acoustic readings varied from day to day
as some of the days that we visited the site had more people than the others, perhaps due to
events. Photographs were taken on site to show the types of lighting fixtures and materials
used as well as the amount of human activity that takes place within and around the building
to account for as evidence.
2.0.4 RECORDING DATA For lighting, data collection was conducted using the Lux Meter. Depending on the spaces
chosen, readings were taken at 1.5 m when standing, and 1 m for the sitting position. The Lux
meter is meant to capture the illuminance of a space and aided us in recording results and
further tabulations. From those tabulations, we performed the Lumen Method calculation, in
which we can figure out if the number of lamps provided in each space is sufficient and if it is
not, what is the ideal amount of lamps that is needed to be installed. For acoustics, data
collection was conducted using the Sound Level Meter. Through that, we recorded the results
of the acoustic qualities and further tabulation was carried out. The calculations associated
with those tabulations are the reverberation time an sound reduction index of each space. The
materiality of each component of the spaces was also recorded for further analysis purposes.
All procedures were repeated again to obtain full accuracy of the readings. The readings were
then analyzed and compared to the standard comparison tool, such as CIBSE, ASHRAE,
MS125 and LEEDS.
Fig. 15: Sound Level Meter Fig. 16; Lux Meter

19
The Sound Level Meter is used for acoustic measurements. It is a commonly a hand- held
instrument with a microphone attached to the head. The diaphragm of the microphone
responds to changes in air pressure caused by sound waves. The movement in the
diaphragm, i.e. the sound pressure deviation (Pascal Pa), is converted into electrical signals
(volts V). The Lux Meter measures the illuminance and illuminous emittance of a space,
measuring luminous flux per unit area. This is used as a measure of the intensity, as
perceived by the human eye, of the light that hits or passes through a surface.
2.0.5 DIAGRAMMING Diagrams were done to show the concentrations of lighting fixtures and sound for different
parts of the areas of study. For example, we did cross sections and floor plans indicating the
positions of artificial lighting sources as well as sound sources.
Fig. 17: Diagrams done for the report to help analyze the spaces.

20
2.0.6 CALCULATIONS
Calculations were carried out to fully understand the acoustical and lighting effectiveness of
the particular space(s). The key calculations need for lighting were the Lumen Method, for
lighting, and Reverberation Time (RT) and Sound Reduction Index (SRI) for acoustic.
2.0.7 CONCLUSION From the studies and analysis made throughout the site site visit and report, we are able to
demonstrate, through calculations, observations and discussions, whether the lighting and
the noise levels are suitable for the selected spaces. If the results are less or exceeding the
appropriate level, solutions are conducted such as what material could be added in the
space to get an appropriate level for the selected space.

21
LIGHTING

22
3.0 LIGHTING 3.1 LITERATURE REVIEW
3.1.1 IMPORTANCE OF LIGHT IN ARCHITECTURE Light is a form of energy manifesting itself as electromagnetic radiation and is closely related
to other forms of electromagnetic radiation such as radio waves, radar, microwaves, infrared
and ultraviolet radiation and X- rays. Light is a fundamental element to architecture; it
interacts with the space, affecting the way we perceive it. The way lighting acts can change
the spatiality, the atmosphere and the visibility of an enclosed space. The built environment
deals with brightness, shadows, lighting distribution, color and many other aspects that
influence our visual experience and plays with our mood.
The perception of space is directly connected to the way light integrates with it. What we
see, what we experience and how we interpret the elements is affected by how light
interacts with us and with the environment. Regarding architecture, in whatever dimension it
can be analyzed, either as space, as material or as color, it is essentially dependent on the
lighting situation that involves both the object and the observer.
The dynamic daylight and the controlled artificial lighting are able to affect not only distinct
physical measurable conditions in a space, but also to instigate and provoke different visual
experiences and moods. Due to the light, it is possible to perceive different atmospheres in
the same physical environment. Light constitutes an element of fundamental relevance for
the design of spaces and therefore it plays a significant role in the discussion of quality in
architecture.
3.1.2 BALANCE BETWEEN SCIENCE AND ARTS
In our design environment, science of light production and luminaire photometric are
important as they are balanced with the artistic application of light. Day lighting systems
should be integrated together with electrical lighting systems while considering the impacts
of it.The fundamental aspects in architecture lighting design for are divided to three which
are the aesthetic appeal, ergonomic aspect and energy efficiency of illumination. First of all,
the aesthetic appeal focuses on the importance of illumination in retail environment. Then,
ergonomic aspect is the measurement of how much function the lighting produces. Last but
not least, energy efficiency is about the issue of light wastage due to over illumination which
could happen by unnecessary illumination of spaces or over providing light sources for
aesthetic purposes. Each of these aspects is important when lighting works are carried out.

23
3.1.3 LUMEN
Lumen is the SI unit of Luminous Flux (F), equal to the quantity of light emitted per second in
a solid angle of one steradian from a uniform source of one candela. The power which light
is emitted from a lamp is called luminous flux and is measured in the unit of Lumens (lm).
Thus, the quantity of light a lamp emits in all directions is indicated by its lumen value.
Lumens measure how much light a bulb emits. The higher the number of lumens, means it is
a brighter light, fewer lumens means it’s a dimmer light.
3.1.4 ILLUMINANCE
The lumens from a light source will light up a surface; illuminance is therefore equal to the
number of lumens falling at one square meter of a surface. The unit for illuminance is
measured in Lux. It is usually measured in illuminance meters or photometers. For a given
light source, the closer to a light source the illuminated area is, the higher the illuminance
value.
Fig.18: Diagram demonstrating the meaning of luminous flux, luminance, luminous intensity
and illuminance.

24
3.1.5 BRIGHTNESS AND LUMINANCE
Brightness and luminance are two closely related terms. A brightness of an object refers to
the subjective perception of the human observer; an object’s luminance is usually subject to
the object’s measurements of a lux meter. Luminance is often used to characterize the
emission from a diffused surface. It indicated how much luminous power will be perceived by
the eye when viewing the surface from a particular angle. Luminance remains the same
regardless of the distance from the light source.
3.1.6 NATURAL DAY LIGHTING & ARTIFICIAL ELECTRICAL LIGHTING
Daylighting is usually utilized as a design feature in a building to create a more pleasing and
interesting atmosphere for the people within, it usually provides a link upwards or side wards
to the outdoor environment while distributing a dynamic share of natural light. Natural light is
one of the most important elements in architecture, helping to transform spaces and save
energy. In a way, architects sculpt buildings in order for the light to play off their different
surfaces.The dynamic daylight and the controlled artificial lighting are able to affect not only
distinct physical measurable conditions in a space, but also to instigate and provoke different
visual experiences and moods. Due to the light, it is possible to perceive different
atmospheres in the same physical environment. Light constitutes an element of fundamental
relevance for the design of spaces and therefore it plays a significant role in the discussion
of quality in architecture.
Generally, in the form of daylight, the generous use of both sunlight and skylight in the
spaces is considered positive; adding tremendous value to the architectural object.
Furthermore, the importance of a well-designed day lighting today is not only because of the
improvement it gives to the space or its benefits to our health and well-being, but also
because of the ecological issues which are in debate today, since it means less energy
consumption for the artificial lighting.

25
3.1.7 DAYLIGHT FACTOR
Daylight factor is the ratio of internal light to the level of the external light. It is used in
architecture to determine the natural lighting present in the internal space on the working
plane or surface, if it meets the required light level to carry out the assigned duty in the
particular space.
Daylight factor is defined as follows,
Where, Ei = Illuminance due to daylight at a point on the indoor working plane
E0= Simultaneous outdoor illuminance on a horizontal plane from an unobstructed
hemisphere of overcast sky.
Zone Daylight Factor Distribution Very bright >6 Very large with thermal
and glare problem Bright 3-6 Good
Average 1-3 Fair Very Dark 0-1 Poor
Table (number): Daylight factors and distribution (Department of Standards Malaysia, 2007)
Daylight Factor DF = 𝑰𝒏𝒅𝒐𝒐𝒓𝒊𝒍𝒍𝒖𝒎𝒊𝒏𝒂𝒏𝒄𝒆,𝑬𝒊𝑶𝒖𝒕𝒅𝒐𝒐𝒓𝒊𝒍𝒍𝒖𝒎𝒊𝒏𝒂𝒏𝒄𝒆,𝑬𝟎 X 100 %

26
3.1.8 LUMEN METHOD
The Lumen Method is used to determine the number of lamp fixtures that should be installed
for a given or particular room to achieve uniform light distribution. We must calculate the
total illuminance of the space based on the number of fixtures and determine whether the
particular space has sufficient lightings.
The number of lightings is given by the formula:
Where, N= Number of lamps required
E= Illuminance level required (Lux)
A= Area at working height plane (m2)
F= Average luminous flux from each lamp (lm)
UF= Utilization Factor, an allowance for the light distribution of the luminaire and the room
surfaces.
MF= Maintenance factor, an allowance for reduced light output because of deterioration and
dirt over the years. When MF value is not given, it can be assumed the figure is 0.80.
N=𝑬𝑿𝑨
𝑭𝑿𝑼𝑭𝑿𝑴𝑭

27
Room Index (RI) is the ratio of the room plan area to half the wall area between the working
and luminaire planes:
Where, L= Length of room
W= Width of room
Hm= Mounting height, i.e. the vertical distance between the working plane and the luminaire.
Maintenance factor, MF, is a multiple of factors:
MF=LLMFXLSFXLMFXRSMF
Where, LLMF= Lamp lumen maintenance factor
MSF= Lamp survival factor
LMF= Luminaire maintenance factor
RSMF= Room surface maintenance factor
RI= (𝑳𝑿𝑾)𝑯𝒎𝒙(𝑳G𝑾)

28
3.2 LIGHTING PRECEDENT STUDY PRECEDENT STUDY: Generator Berlin Mitte by Ester Bruzkus, Design Agency
Generator Berlin Mitte is eclectic urban design hostel that features a social café and
canteen, a chill-out library, a bar, a sky lit gallery and event space. The architect, Ester
Bruzkus worked together with WAF Architects to transform two 19th century office buildings
into the current Generator Hostel. The area of the hostel is 5500sqm. The hostel is located
within Hackerscher Markt, Alexanderplatz Museum Island and the iconic Kunthaus
Tacheles. This project began in March 2012 and was completed in 2013.
Figure 19: Ground floor plan.

29
REASON FOR CHOOSING GENERATOR BERLIN MITTE AS A PRECEDENT STUDY: The concept and functions of the spaces are similar to our chosen site study, such as the
fact that it was renovated into a totally different space, a social hostel like Reggae Mansion,
from a 19th century building. The spaces demonstrate excellent choices of materials and
colors to attract young guests. There are a few elements used in the building such as the
concrete structure of old interiors that were purposely left exposed in the corridors and guest
rooms and also brilliant ways of manipulating diffused natural lighting at gallery space. The
graffiti mural at the corridor and the colour coded walls are lit with extraordinary lighting
effects. This building showcases theatrical effects achieved from the wall colours and the
use of artificial lighting.
Figure 1: Ground floor plan
Figure 2: Photo of gallery space with large skylight
Figure 20: Photo of gallery space with large skylight

30
DESIGN INTENTIONS AND CONSIDERATIONS: WHITE WALL: The café and reception white walls are decorated with a layer of wood boards punctured by
a horizontal line of wooden pegs which are used for functionality and art displays. The wood
walls are furnished with cubes seating platforms, while the white walls serve as backdrop for
the French artist Sebastian Preschoux’s geometric string artwork that is attached from the
exposed pipes and the electric conduits on the concrete ceilings.
In the photo below, the lamps are seen to be pointed upwards while the white walls in the
background act as reflective surfaces by projecting excellent spreads of light beam effects in
order to achieve dramatic shadows and highlights, bringing the abstraction of the artwork to
life.
Figure 21: Painted artwork on the white walls in the café and layers of wooden pegs installed on the wall of the seating area.

31
COPPER WALL PANELS AND BLACK PAINTED WALLS: Despite the elegant edgy feel intended by the designer, the black painted walls at the bar is
covered with generous amount of copper panels and mirror projecting lighting from the
headlights by PSLAB, part of creating dramatic illusions and atmospheres which are part of
the concept as well. Contrasting with the reflective copper panels, parts of the café were
painted in black. The function of the matte black wall surface is to absorb excessive lights
reflected or produced by the headlights in an effort to achieve balance. Otherwise, the
amount of lighting within the spaces will cause eye discomfort.
Figure 22: Headlights mounted on the ceiling and on the copper wall panels.
Figure 24: Wall—washing lighting used in the color coded corridors
Figure 23: Graffiti murals in the corridors.
32
THE ZIG-ZAG CORRIDOR:
In collaboration with the Berlin Street artist Theirry Noir, he created 3 meter high graffiti-style
murals lining the spacious corridors on each floor which are colour coded. Also, the idea of a
zigzag corridor wall became a solution to some technical problems but making sure the
colour scheme suited the area and the wall-washing lighting used turned the corridors into
creative spaces. However, some potential problems could arise if the lighting patterns are
not designed correctly, such as poor balance in light when the wall or the floor is brighter
than each other and accent lighting is improperly located.
Figure 25: Diagrams of wall-washing lighting method. The wall-wash lights must be mounted at a sufficient distance from the wall to ensure a smooth graded wash of light.

33
Another example of optimizing natural lighting is the use of tall windows surrounding the
courtyard space bringing sufficient lighting into the café and the library:
Figure 26: Courtyard space for outdoor activities also used to optimize the daylighting.

34
SPATIAL QUALITY OF LIGHTING – NATURAL LIGHTING:
One of the lighting types which were used in the building is the sky lighting which is a type of
oculus that allows direct or indirect sunlight. Natural lighting falls evenly in the gallery area
thus, gives a spacious feeling and provides a visual connection to the outdoor environment
to the occupants in the interior. It is also a great way of exhibiting the artworks in the gallery
while reflecting the exposed brick walls and the exposed rustic finish that shows the
character of its original structures as one of the oldest building in the city.
CONCLUSION:
There are wide ranges of lighting initiatives that can be undertaken to achieve excellent lighting
qualities and integrating daylighting would work in any type of building. Adequate practices of
daylighting helps the building to save energy and provides good visual connection between
the spaces and the occupants. However, artificial accent lighting is also important to achieve
certain ambience of the spaces. The Generator Berlin is fairly similar to our case study Reggae
Mansion in that both make use of natural daylighting, both are renovated from a much older
building with some of the materials left exposed and both have an inner courtyard that relies
on sunlight throughout the day to light up the space.
Figure 27: Diagram showing light transmitted into the fixed skylight.
Figure 28: Natural lighting used to exhibit artworks in the gallery area.

35
3.3 SITE STUDY 3.3.1 ZONING OF SPACES
Fig. 29: Ground Floor Plan with grid lines and lighting points.

36
Fig. 30: Zone 1- Reception/ Lobby

37
Fig 31: Zone 2- Dining Room/ Bar

38
Fig 32: Zone 3- Courtyard

39
3.3.2 TABULATION OF DATA Each zone is separately tabled with different time frames and height readings. We recorded the reading of data tabulation LUX meter reading in the day time and night time with heights of 1.0 m (the average sitting eye-level height) and 1.5 m (the average standing eye-level height) using a grid system. The colors of data represent the spaces of each zone. Daytime Lux Readings: ZONE 1: Reception/ Lobby
ZONE 2: Dining Room/ Bar
ZONE 3: Courtyard
Reception/Lobby (10 LUX) Date: 28th April Time: 2:00 p.m. Weather: Slightly Cloudy
Grid F G H I J
Height 1.0m 1.5m 1.0m 1.5m 1.0m 1.5m 1.0m 1.5m 1.0m 1.5m
2 60 73 124 150 190 170 334 289 789 589
3 90 86 140 136 185 52 368 302 498 530
4 230 219 210 174 165 156 375 286 560 574
5 211 245 210 200 146 150 307 260 567 490
Dining Room /Bar (10 LUX) Date: 28th April Time: 2:00 p.m. Weather: Slightly Cloudy
Grid F G H I J
Height 1.0m 1.5m 1.0m 1.5m 1.0m 1.5m 1.0m 1.5m 1.0m 1.5m
6 100 82 120 140 185 110 250 130 730 535
7 30 22 55 45 160 110 230 160 558 476
8 70 48 70 40 135 102 225 165 400 260
9 42 31 52 36 120 100 260 174 634 438
10 50 36 53 28 123 95 264 213 600 462
Courtyard (10 LUX) Date: 28th April Time: 2:00 p.m. Weather: Slightly Cloudy
Grid B C D E
Height 1.0m 1.5m 1.0m 1.5m 1.0m 1.5m 1.0m 1.5m
4 315 525 1075 1525 1001 1325 262 275
5 395 400 710 880 675 762 262 275
6 220 285 495 550 230 259 124 132
Tables 1, 2 ,3: Tabulation of data for lighting day time.

40
Nighttime Lux Readings: ZONE 1: Reception/ Lobby
Reception/Lobby (10 LUX) Date: 5th May Time: 8:00 p.m.
Grid F G H I J
Height 1.0m 1.5m 1.0m 1.5m 1.0m 1.5m 1.0m 1.5m 1.0m 1.5m
2 37 33 72 99 66 75 66 85 31 30
3 35 36 72 78 64 61 53 71 35 36
4 28 36 92 120 55 68 52 72 33 38
5 30 31 94 125 69 72 64 89 36 37
ZONE 2: Dining Room/ Bar
Dining Room/Bar (10 LUX) Date: 5th May Time: 8:00 p.m.
Grid F G H I J
Height 1.0m 1.5m 1.0m 1.5m 1.0m 1.5m 1.0m 1.5m 1.0m 1.5m
6 10 8 92 20 20 15 13 12 90 8
7 5 4 11 11 20 28 12 11 8 9
8 30 32 24 13 12 13 9 98 18 18
9 12 2 4 3 20 12 53 38 8 7
10 13 13 3 5 5 6 5 7 11 10
ZONE 3: Courtyard
Courtyard (10 LUX) Date: 5th May Time: 8:00 p.m.
Grid B C D E
Height 1.0m 1.5m 1.0m 1.5m 1.0m 1.5m 1.0m 1.5m
4 3 3 7 5 18 18 25 20
5 3 4 4 7 51 82 20 20
6 4 4 6 6 28 19 11 11
Tables 4,5,6: Tabulation of data for lighting night time.

41
Based on the lux reading tables above, the following observations were made along with relevant discussions: Zone 1: Reception/ Lobby Observation 1: On average, the day time lux readings were much higher as compared to
the night time lux readings. Discussion 1: The reception/ lobby’s main façade, which also acts as an entrance, is a
glass curtain wall and predominantly faces the east. (Fig.33) This means that during the day
time, it receives a lot of natural lighting and the reception/ lobby will be flooded with sun light.
The space is furnished and painted in relatively light colors, contributing to light in the interior
space reflecting from these materials. Furthermore, opposite the main entrance is the
entrance to the central courtyard, which is also a glass door and will also contribute to its
natural day lighting (Fig. 34). When the sun sets, the space gets quite dim, with some main
lighting fixtures installed.
Fig. 33: The Reception/ Lobby area

42
Fig. 34: Opposite the main entrance is the entrance to the courtyard, which glass door helps contribute to more natural lighting in the reception.
Fig. 35: Artificial lighting fixtures help illuminate the space, besides the daylighting.

43
Fig.36: The walls are painted with a light coat, helping with the reflection rate of the light sources as well as contributing a higher Lux reading.
Fig. 37: The glass façade/ door of the hostel.
Fig. 38.- The light-coloured marble floors also help with the reflection rate of the light sources as well as contributing to a higher lux reading.

44
Zone 2: Dining Room/ Bar
Observation 2: The average day time lux readings were much higher compared to the night
time lux readings. Discussion 2: Similar to the reception/ lobby, the dining room/ bar’s main façade is a glass
curtain wall and predominantly faces the east. There is a high amount of natural lighting that
enters the space during the day time. However, another reason the dining room/ bar’s lux
readings are so low at night is due to the fact that the walls and floor of the space are black
in color. So, even in the daytime, even though the reception area is adjoined with the dining
room and is right next to it, there is a significant difference in the day time readings between
the two spaces. At night, the dining room has a few artificial lighting components which will
be listed further in this report. The lighting component’ ambience is very dim as they are
mostly LED lights and only a few areas have high emitting lamps. The designer may have
chosen to have the whole space black for a more elegant and sophisticated effect or they
might have been trying to convey a ‘night’ atmosphere. The black absorbs the natural
lighting entering the space, thus reducing the overall average day time lux readings as
compared to the reception/ lobby.
Fig. 40: The dining room/ bar.

45
Fig.41: The mirrored fixtures on the walls help to reflect light on the parallel spaces, contributing to a higher lux reading in that area of the room.
Fig.42: The dining room/ bar’s walls is painted in black, which has the lowest reflectance rate as a colour (5%- 10%).

46
Zone 3: Courtyard Observation 3: The average day time lux readings were much higher compared to the night
time lux readings. Discussion 3: The courtyard space is left in a sort of void and the roof is several stories
above. This means that a lot of natural lighting can enter the space, flooding the space with
light beautifully. The materials chosen for this space are light in color, allowing for the natural
sunlight to bounce of the surfaces. During the night, the courtyard is actually rather dark,
save for some artificial lightings located in some areas, which will be discussed later in this
report.
Fig. 43: The central courtyard has plenty of natural daylighting.
Fig. 44: White coloured brick wall.

47
Fig. 45: The courtyard is partially open and compromises of a roof 7 meters above the working plane.
Fig. 46: Above the 4- meter brick wall, the courtyard is exposed to the elements/ daylight.
Fig. 47: view from above the courtyard.

48
Fig. 48: The Courtyard from the end of the space
Fig.49: Materiality of the flooring. Fig.50: The courtyard from above.

49
3.3.3 DAYLIGHT FACTOR ANALYSIS After analyzing our site, we determined the light factors affecting the site during the day, as
shown in the diagrams below:
A) Natural Light (8 am to 12 pm):
The only natural lighting entering the building at this time is the natural light from the sun. As
a concept of green building, a lot of natural lighting enters to the inside of the space during
the day time from the sun. During 8am until 12 pm, there’s a lot of exposure in the spaces
from the sun and it increases as time passes by, since the sun changes its position, moving
closer to the west of the site. The natural daylight will tend to fall into the dining room/ bar,
leading it to be brighter than the reception.

50
B) Natural Light (12pm to 4pm):
During this time, 12pm – 4pm, the sun will be at its highest position at a 90-degree angle
above the building thus allowing more light to enter the reception/ lobby and dining room.
However, the natural sunlight will begin to reduce as it starts to set in the west.
C) Natural Light (4pm- 7pm):
During this time the sun will be closer to the west side of the restaurant. The sun light will
begin to dim and fade away and thus the natural light at the reception/ lobby and dining
room will be at its lowest.

51
3.3.4 OVERALL TYPES AND SPECIFICATIONS OF LIGHTING:
Types of bulb Types of light
Voltage Color Temp.
Color Rendering
Index
Wattage Placement
LED light bulb
Ceiling light
220 – 240V
3000K
90+
5.5W
Ceiling
Fluorescent light tube
Cove/ Recessed lighting
220V
2700K
80 - 89
80W
Ceiling
Compact Fluorescent light bulb (CFL)
Compound light
120V
2700K
82
14W
Courtyard
Incandescent light bulb
Standing lamp
130V
2400K
100
40 – 60W
Indoor
Incandescent light bulb
Chandelier
130V
2700K
90+
60W
Ceiling
Table 7- Types and specifications of lighting.

52
4.0 LIGHTING ANALYSIS AND CALCULATIONS: 4.1 ZONE 1: RECEPTION/LOBBY 4.1.1 TYPES AND SPECIFICATIONS OF LIGHTING FOR ZONE 1:
Incandescent light bulb (for Chandelier)
Types of lighting
Artificial light
Types of fixtures
Chandelier
Luminous flux
660 lm
Power consumption
60W
Colour Temperature
2700K
Colour Rendering Index
90+
Average life rate
20,000 hours
Florescent light tube
Types of lighting
Artificial light
Types of fixtures
Cove/ Recessed light
Luminous flux
1200 lm
Power consumption
14W
Colour Temperature
2700K
Colour Rendering Index
80 – 89+
Average life rate
24,000 hours

53
Fig.51: Render of the reception/ lobby in the daytime. 4.1.2 DAYLIGHT FACTOR: Illuminance Example 120,000lux Brightest sunlight 110,000lux Bright sunlight 20,000lux Shade illuminated by entries, clear blue
sky, midday 1,000-2,000lux Typical overcast day, midday <200lux Extreme of darkest storm clouds, midday 400lux Sunrise or sunset on a clear sky
(ambient illumination) 40lux Fully overcast, sunset/sunrise <1lux Extreme of darkest storm clouds,
sunset/rise Table: Daylight intensity at different condition Time Weather Luminance
At 1m (lx) Average (lx)
Luminance At 1.5m (lx)
Average (lx)
2:00 p.m. Slightly Cloudy
60-789 287.95 52-589 256.55
Average Lux reading Time (2:00 p.m.) At 1.0 walking plane (standing position) 287.95 At 1.5 walking plane (siting position) 256.55 Average Lux value 272.25
DF=Ei/Eo ×100%, Eo= direct sunlight= 20000
DF=272.25⁄20000 × 100%= 1.4%

54
4.1.3 DISCUSSION: Df, % Distribution >6 Very bright with thermal and glare problem 3-6 Bright 1-3 Average 0-1 Dark
Daylight factor table
The average Lux value around 2:00 to 3:00 p.m. is 272.95 lux. The courtyard space has a
daylight factor of 1.3% due to the lack of efficient lighting sources. According to MS1525, the
daylight factor of 1.4% is between the ranges of 1-3%, which is categorized under average
categories. This zone doesn’t have a good lighting distribution. Lighting used in this space is
more aesthetic rather than functional.
Fig 52;. Render of the reception at night- implementing artificial lighting.

55
4.1.4 ZONE 1: LUMEN METHOD CALCULATION: Location Reception Reception
Dimension L= 15m ,W=6 L= 15m ,W=6
Area 90sqm 90sqm
Height of ceiling 3.9m 3.9m
Height of luminaries 3m 3m
Height of work/sitting level
1m 1m
Vertical distance from work place to luminaries
2.9m 2.9m
luminance recommended by MS1525
100LUX 100LUX
Reflection factors Ceiling: White Plaster 40%-
45%
Walls: Polished concrete with
paint (White) 20%-30%
Floor: Marble 30%-50%
Ceiling: White Plaster 40%-
45%
Walls: Polished concrete with
paint (White) 20%-30%
Floor: Marble 30%-50%
Room Index Room Index
= L×W
(L+W) ×H
= 15 × 6
(15+6) × 2.9
= 1.5
Room Index
= L×W
(L+W) ×H
= 15 × 6
(15+6) × 2.9
= 1.5
Utilization factor (based on given utilization factor table
0.41 0.41
Maintenance factor 0.8 0.8
Type of light Incandescent bulb light Fluorescent Tube
Number of lighting fixture
8 12

56
Illuminance level required, lux
E= N×F×UF×MF
A
E= 8×660 ×0.41×0.8
90
E=19lux
E= N×F×UF×MF
A
E= 12×1200 ×0.41×0.8
90
E=52.48lux
19lux+52.48lux=71.48lux
100-71.48= 28.52lux
According to Ms1525, the area lacks of amount of luminance,
which is 28.52 lux
Number of lights required
N= E×A
F×UF×MF
N= 100 × 90
8×660×0.41×0.8
N= 5.2
N=5
5 Incandescent light bulbs
needed to meet the MS1525
standard illuminance
required in the reception
area.
N= E×A
F×UF×MF
N= 100 × 90
12×1200×0.41×0.8
N= 1.9
N=2
2 Fluorescent Tube needed to
meet the MS1525 standard
illuminance required in the
reception area.

57
4.1.5 LIGHTING CONTOUR DIAGRAMS:
Fig 53- Reception lighting with daylight and artificial lighting
Fig 54: The Reception’s lighting with artificial light

58
Fig 55: Reception’s lighting with daylight only. For the lighting contours, we analyzed it in three ways; overall lighting (daylight and artificial
lighting), artificial lighting and natural daylighting. This is to observe which element, artificial or
daylighting, is the most dominant and how they work together. For natural daylighting, light
source is emitting from the sector that has the glass façade installed. Based on the diagrams,
there is a higher level of light being distributed by artificial lighting rather than daylighting, with
some areas being relatively dark due to the lack of artificial fixtures. More artificial lightings
should be installed to improve the illuminance of the reception/ lobby.
Fig 56: Cross section of the reception/ lobby and the dining room

59
4.2 ZONE 2: DINNING ROOM/BAR 4.2.1 TYPES AND SPECIFICATIONS OF LIGHTING FOR ZONE 2:
Fig. 57; Render of the interior of the reception during the daytime, using natural daylight.
LED Light
Types of lighting
Artificial light
Types of fixtures
Ceiling fixtures
Luminous flux
350 lm
Power consumption
5.5W
Colour Temperature
3000K
Colour Rendering Index
90+
Average life rate
50,000 hours

60
4.2.2 DAYLIGHT FACTOR: Illuminance Example 120,000lux Brightest sunlight 110,000lux Bright sunlight 20,000lux Shade illuminated by entries, clear blue
sky, midday 1,000-2,000lux Typical overcast day, midday <200lux Extreme of darkest storm clouds, midday 400lux Sunrise or sunset on a clear sky
(ambient illumination) 40lux Fully overcast, sunset/sunrise <1lux Extreme of darkest storm clouds,
sunset/rise Table: Daylight intensity at different condition
Average Lux reading Time (2:00 p.m.)
At 1.0 walking plane (standing position) 220.64 At 1.5 walking plane (siting position) 161.52 Average Lux value 191.08
DF=Ei/Eo ×100%, Eo= direct sunlight= 20000
DF=191.08⁄20000 × 100%= 0.95%
4.2.3 DISCUSSION: Df, % Distribution >6 Very bright with thermal and glare problem 3-6 Bright 1-3 Average 0-1 Dark
Daylight factor table The average Lux value around 2:00 to 3:00 p.m. is 191.08 lux. The dining room space has a
daylight factor of 0.95% due to the lack of efficient lighting sources. According to MS1525, the
daylight factor of 0.95% is between the ranges of 0-1%, which is categorized under dark
categories. This zone doesn’t have a good lighting distribution. Lightings used in this space
are more for aesthetic rather than functional as well as curtains in the front screen facade are
used during the day, thus block natural lighting to penetrate inside the space. Another factor
is that the space is painted black, knowing that dark color has a low percentage of reflection.
Lightings Used in the dinning bar are mostly to illuminate furniture’s to showcase alcohol rather
than the whole space.
Time Weather Luminance At 1m (lx)
Average (lx)
Luminance At 1.5m (lx)
Average (lx)
2:00 p.m. Slightly Cloudy
30-730 220.64 22-476 161.52

61
4.2.4 ZONE 2: LUMEN METHOD CALCULATION Location Dinning/ Bar
Dimension L= 15m ,W=8.5
Area 127.5 sqm
Height of ceiling 3.9m
Height of luminaries 3m
Height of work/sitting level
1m
Vertical distance from work place to luminaries
2.9m
luminance recommended by MS1525
200LUX
Reflection factors Ceiling: black Plaster 2%-10%
Walls: black wall finishing 2%-10%
Floor: Black Marble 2%-10%
Room Index Room Index
= L×W
(L+W) ×H
= 15 × 6
(15+6) × 2.9
= 1.5
Utilization factor (based on given utilization factor table
0.41
Maintenance factor 0.8
Type of light Recessed down light LED
Number of lighting fixture
15

62
Illuminance level requires, lux
E= N×F×UF×MF
A
E= 15×350 ×0.41×0.8
127.5
E=14lux
100-14= 86lux
According to Ms1525, the area lacks of amount of luminance, which
is 86 lux
Number of light required
N= E×A
F×UF×MF
N= 200 × 127.5
15×350×0.41×0.8
N= 14.8
N=15
15 Incandescent light bulbs needed to meet the MS1525 standard
illuminance required in the reception area.
Fig. 58: Render of the dining room with artificial lighting.

63
4.2.5 LIGHTING CONTOUR DIAGRAM:
Figure. 59- Overall lighting for the dining room.
Fig.60- The dining room with artificial lighting

64
. Fig.61: The dining room with daylighting only.
Based on the diagrams above, daylighting occurs only in the sector where the glass façade
is installed, and predominantly eastwards. The artificial lighting by itself seems to illuminate
the central spaces, albeit dimly. In the diagram with overall lighting, it seems that when these
two lighting systems work in conjunction with one another, it lights up the space
appropriately, except for some corners of the room, where more artificial lighting fixtures
should be installed.
Fig.62: Cross section of the dining room.

65
4.3 ZONE 3: COURTYARD 4.3.1 TYPES AND SPECIFICATIONS OF LIGHTING FOR COURTYARD:
Fig. 63: Render of the courtyard in the day time.
Compact Florescent Light (CFL)
Types of lighting
Artificial light
Types of fixtures
Compound light
Luminous flux
900 lm
Power consumption
14W
Colour Temperature
3000K
Colour Rendering Index
82
Average life rate
10,000 hours

66
4.3.2 DAYLIGHT FACTOR: Illuminance Example 120,000lux Brightest sunlight 110,000lux Bright sunlight 20,000lux Shade illuminated by entries, clear blue
sky, midday 1,000-2,000lux Typical overcast day, midday <200lux Extreme of darkest storm clouds, midday 400lux Sunrise or sunset on a clear sky
(ambient illumination) 40lux Fully overcast, sunset/sunrise <1lux Extreme of darkest storm clouds,
sunset/rise Table: Daylight intensity at different condition
Average Lux reading Time (2:00 p.m.)
At 1.0 walking plane (standing position) 480.3 At 1.5 walking plane (siting position) 599.4 Average Lux value 539.5
DF=Ei/Eo ×100%, Eo= direct sunlight= 20000 DF=539.5⁄20000 × 100%= 2.7% 4.3.3 DISCUSSION: Df, % Distribution >6 Very bright with thermal and glare problem 3-6 Bright 1-3 Average 0-1 Dark
Daylight factor table The average Lux value around 2:00 to 3:00 p.m. is 539.5 lux. The courtyard space has a
daylight factor of 2.7% due to the cloudy weather. According to MS1525, the daylight factor of
2.7% is between the ranges of 1-3%, which is categorized under average categories. Thus
knowing that the courtyard has a high ceiling as well as being partially open ceiling, the
delighting factor would be between 3-6% under a clear sky.
Time Weather Luminance At 1m (lx)
Average (lx)
Luminance At 1.5m (lx)
Average (lx)
2:00 p.m. Slightly Cloudy
124-1075 480.3 132-1525 599.4

67
4.3.4 ZONE 3: LUMEN METHOD
Location Courtyard
Dimension L= 12m ,W=3.5m
Area 42 sqm
Height of lamp post 2.0 m
Height of work/sitting level
1m
Vertical distance from work place to luminaries
1.0 m
luminance recommended by MS1525
100LUX
Reflection factors Walls: brick 80%
Floor: ceramic tiles 30%
Room Index Room Index
= L×W
(L+W) ×H
= 12 × 3.5
(12+3.5) × 1.0
= 2.7
Utilization factor (based on given utilization factor table
0.62
Maintenance factor 0.8
Type of light Lamppost
Number of lighting fixture
3

68
Illuminance level required, lux
E= N×F×UF×MF
A
E= 3×470 ×0.62×0.8
42
E=17 lux
100-31.8= 68.2lux
According to Ms1525, the area lacks of amount of luminance,
which is 68.2 lux
Number of light required N= E×A
F×UF×MF
N= 100 × 42
3×470×0.62×0.8
N= 6
3 Incandescent light bulbs needed to meet the MS1525
standard illuminance required in the reception area.

69
4.3.5 LIGHTING CONTOUR DIAGRAM:
Fig.64- Overall lighting for the courtyard
Fig. 65- Artificial lighting in the courtyard.

70
Fig.66: Daylighting in the courtyard only. Based on the diagrams above, it is not surprising to see that the daylighting is the dominant light
source in this space, due to it being an open space with the absence of a ceiling, A high quantity
of light can penetrate the courtyard. However, as for the artificial lighting, it illuminates very little
of the space and causes a gloomy atmosphere at night as it gets dim. At night, that is the only
light source for that room and the lights from the other rooms are reflected into the courtyard,
lending it their light. A suggestion would be to definitely install more artificial lighting fixtures in
the courtyard as this could attract more people to stay there as it gets really empty at night.

71
5.0 CONCLUSION FOR LIGHTING: From the studies analysis, we conclude that the lighting in Reggae Mansion doesn’t suit its
function, based on the governing standards (MS1525) of a hostel. Reggae Mansion does make
use of the natural lighting during the day time, as can be observed during our site visits, as
minimal artificial lightings would be activated. The spaces we analyzed used the natural
daylighting to its fullest, such as the courtyard, where day light penetrates the space and also
with the reception/ lobby and dining room where the glass façade allows for easy day light
access. We also noticed that the artificial lightings illumination is relatively low than the regular
standard, due to the fact that the lighting is more for aesthetic purposes rather than functional,
plus the choice of dark color for the interior has a low reflectance percentage. However, it
doesn’t really affect the users as most of the tourists would prefer to stay out most of the time.

72
ACOUSTIC

73
6.0 ACOUSTICS 6.1 LITERATURE REVIEW
6.1.1 SOUND Sound may be defined as the vibrations or pressure changes in an ‘elastic’ medium which
are capable of being detected by the ear. Elastic means that the particules of the medium
return to its original position after the disturbance by the vibrational wave. These vibrations
travel through solids, liquids and gases by the normal process of hearing depends on the
ultimate transmission through air so that the ear drum is set in vibration and a sequence of
events we call hearing begins. The medium in which sound is produced when a vibration
occurs may be air, water, building materials and the earth. Sound produces pressure and
the unit is measured in force per unit area.
6.1.2 ARCHITECTURAL ACOUSTICS Acoustic is the branch of physics that deals with the production, control, transmission,
reception and effects of sound. Acoustic deals with the total effect of sound, especially
produced in an enclosed space, which could lead to factors such as reverberation. In
architecture, we are concerned with the control of sound in spaces, such as libraries,
preserving and enchancing a desired sound, like in a lecture theater or orchestra hall, as
well as aiming to eliminate or reduce sounds that interfere with our activities.
Architectural acousticians study how to design buildings and other spaces that have
pleasing sound qualities and safe, appropriate sound levels. Architecture acoustics includes
the design of concert halls, classrooms and even heating systems. Building acoustics is vital
in obtaining sound quality that is appropriate for the spaces within a building. From achieving
a good buffer from the building’s exterior envelope to the building’s interior spaces, acoustic
plays a vital role in realising the mood that is to be created in the spaces that reside the
building.

74
6.1.3 WAVELENGTH Wavelength is the distance between any two repeating points on a wave and is measured in
meters (m). For every vibration of the sound source, the waves moves forward by one wave
length. The number of vibrations per second therefore indicates the total distance moved in
1 second, which is the same as velocity.
6.1.4 SOUND PRESSURE LEVEL
Acoustic system design can be achieve through the study of sound pressure level (SPL).
Sound pressure level is the average sound level at a space caused by a sound wave. Sound
pressure in air can be measured with a microphone. SPL is a logarithmic measure in
decibels (dB) above a standard level.
Sound pressure formula :

75
6.1.5 REVERBERATION TIME
Reverberation, in terms of psychoacoustics, is the interpretation of the persistence of sound
after a sound is produces. A reverberation, or reverb, is created when a sound or signal is
reflected causing a large number of reflections to build up and then decau as the sound is
absorbed by the suraces of objects in the space – which could include furniture and people
and air. This is most noticeable when the sound source stop but the reflection continue,
decreasing in amplitude, until they reach zero amplitude.
Reverberation is frequency dependent. The length of the decay or reverberation time,
receives special consideration in the architectural design of spaces which need to have
specific reverberation times to achieve optimum performance to their intended activity
Reverberation Time formula :
RT= I.KLMN
Reverberation time is affected by the size of space and the amount of reflective or
absorptive surfaces within the space. A space with highly absorptive surfaces will absorb the
sound and stop it from reflecting back into the space. This would yield a space with a short
reverberation time. Reflective surfaces will reflect sound and will increase the reverberation
time within a space. In general, larger spaces have longer reverberation than smaller
spaces. Therefore, a large space will require more absorption to achieve the same
reverberation time as a smaller space.
Where, RT= reverberation time in seconds (s) V= is the room volume in m3 A= absorption coefficient

76
Figure : Reverberation Time Graph
The above diagram illustrates the reverberations time that is attributed to different rooms of
different specific volumes with different specific functions
6.1.6 SOUND REDUCTION INDEX (SRI)
The Sound Reduction Index (SRI) or Transmission Loss (TL) of a partition measures the
number of decibels lost when a sound of a given frequency is transmitted through the
partition. Sound reduction index is used to measure the level of sound insulation provided by
a structure such as a wall, window, door or ventilator. The understanding of a sound
reduction index is important to incorporate acoustic system design into a given space to
decrease the possibility of sound from permeating from a loud space to a quiet space.
Sound Reduction Index Formula :
TL=10*𝑙𝑜𝑔KIUKVWXY
𝑇[\=U
]^∗V̀ ^G]a∗V̀ aG...]b∗V̀ bVcd[e]fgh[ijNgj[
Y𝑇ikltheTransmissionCoefficientofaMaterial𝑆k =thesurfaceareaofamaterial(n)

77
6.1.7 ISSUES OF ACOUSTIC SYSTEM DESIGN Acoustic Comfort: Acoustic comfort is essential to attain an adequate level of satisfaction and moral health
amongst patrons that reside within the building. Indoor noise and outdoor noise are the two
main aspects that contribute to acoustical comfort (or discomfort). Main contributors for
indoor noise can generally be traced from human activity as well as machine operations.
External noise includes noise from traffic or activities that occur outside of the building.
Acoustic and Productivity: Spatial acoustics may contribute to productivity in a particular building. Inconducive acoustic
enviroments may dampen productivity. Productivity also depends on the building’s functions
as well as the type of patrons that occupy the building. “Acoustical comfort” is achieved
when the workplace provides appropriate acoustical support for interaction, confidentiality
and concentrative work.” (GSA, 2012) Spatial acoustics is of vital importance especially
where the worker’s’ productivity is being emphasized.
Impacts of Inappropriate Acoustic: For certain spaces such as in a functional music setting, proper sound insulation helps
create a musical “island” while inadequate sound isolation imprisons musicians in an
inhospitable, Alcatraz like setting. This thus is evident that improper acoustical measures
may backfire if design measures are not implemented properly.
Acoustical Discomfort and Health : Noise is an increasing public health problem according to World Health Organizations’s
Guidelines for Community Noise. Noise can have the following adverse health efects;
hearing loss; sleep disturbances; cardiovascular and psychophysiologic problems;
performance refluction, annoyance responses, and adverse social behavior. As such,
articulate measures have to be carried out so as to ensure that acoustical discomfort does
not exist in spaces where human occupation is kept at prolonged hours.

78
6.2 ACOUSTIC PRECEDENT STUDY: Precedent Study: Living lab for Pizza Express, in Richmond, London
Type of Space: Restaurant
Design team: Ab Rogers Design, in collaboration with DA. Studio
Acoustic Consultant: Sergio Luzzi, Vie En.Ro.Se
ABSTRACT: Roused by the spirit of the first ever Pizza Express, which opened in Soho, New York, in
1965, the company worked in collaboration with the architect Ab Rogers, Italian culinary
specialists, a theater chief, a designer and craftsmen to bring forth another era of Pizza
Express, this time to be located in Richmond, London. Their main goal was not to simply
serve extraordinary pizza, but also to provide an environment that could sustain great
conversations - a reasoning which is at the heart of their image. The outline brief was to
diminish the reverberant sound in the space and make a more casual, social and agreeable
environment. They needed music and discussion to prosper in parallel with each other. All
this represents the intended environment to captivate and fortify the senses.

79
BUILDING DESIGN OVERVIEW:
In summer 2010, Pizza Express Commissioned London design office Ab Rogers Design
(ARD) to reconstruct its Richmond restaurant into a 'Living Lab', marrying experiential plan,
imaginative development in eatery acoustics, and a reenergized way to deal with display and
service. With an inherent adoration for Italy and its inimitable cuisine – not to mention the
fond childhood memories of visiting his local branch of Pizza Express with his Italian
grandmother fresh in his mind – Rogers jumped at the chance.
Crucial to ARD's design for a new era of this restaurant is to make the delight of good
cuisine and the theater of pizza-production the primary focus, by setting an open kitchen at
the heart of the restaurant. The energetic drama of the pizzas being stretched, toast and
pummeled into life is circled by a red ribbon of movement, with seating booths, a bar and a
children's zone streaming around the open kitchen.
In a drastic new development put forward by ARD, who were inspired by the traditional open
food stalls found in Naples, the home of pizza, a new kiosk punches through the restaurant
wall, making the display of beautiful, freshly made food central to the overall theatre of the
restaurant. Further references to the culture of Naples permeate every inch of the new
restaurant, and can even be heard in the toilets, where atmospheric recordings of
Neapolitan life are played. Fresh energy is brought to the restaurant’s graphic scheme
following collaboration between ARD and Graphic Thought Facility, and a dynamic new color
palette; signage, uniforms and table settings enliven the environment yet further.
HOW ACOUSTIC DESIGN WAS TAKEN INTO CONSIDERATION:
With the primary pint of making an ideally equilibrium acoustic space where discussion is
feasible as well as a real delight, Rogers and his group worked in collaboration with
acoustician Sergio Luzzi to produce bespoken acoustic domes which hang over booths,
creating a sequence of personal private spaces inside a humming open spot. The domes
are fitted with iPod docks, dimmer switches and call button, so people can customize their
surroundings and set their own particular tone. Furthermore, the individual booths and
acoustic vaults, circular acoustic boards hang drastically from the roof, enlivening into the
space. The public has broadly commended the acoustic outline for successfully minimizing
noise.

80
ACOUSTIC DESIGN SOLUTIONS: The Armstrong Circle Optima Canopy was used for the project as it echoed the form of the
tables and is comparable to the shape of the pizzas being served. It has been effective in
diminishing the reverberation time of sound inside the booths by half. These multi- useful
canopies decrease the levels of noise flourishing around the area by engrossing sound on
both front and back of the canopy. Lights and speakers coordinated into the canopy allow
diners/clients to regulate their very own sound and lighting levels. The Optima canopies
were imprinted in pastel hues to match the color scheme of the restaurant. The canopies fly
over a red leather dining booths and by modifying the orientation, levels and installation
process, it was easy to distinguish services and makes a staggering eatery space.

81
ACOUSTIC PERFORMANCE ANALYSIS:
Figure 67: Diagram showing pioneering acoustic Design
Figure 68: The Booth and the Dome Dimensions

82
Figure 69: Dome Design Acoustic Modeling

83
Figure 70: Equivalent Sound pressure level at different position
Figure 71: Equivalent Sound pressure level with and without Dome

84
Figure 72: Reverberation time Measurement
Building Characteristics:
• No. 80 ceiling absorbing panels: Armstrong Optima Canopy, Circular Ø240 cm, 2.2 cm
thick (minimum height from ceiling: 50 cm).
• No 15 Ø80 cm mirrored disc lined with sound absorbing material on the back side ( e.g.
12 mm Echo panel)
• No 15 Ø60 cm mirrored disc lined with sound absorbing materials on the back side (e.g.
12 mm Echo panel)
• No.7 Booths with Dome with 10 mm acrylic on the external side and 12 mm Echo panel
on the internal side and a dedicated electroacoustic system
These systems are situated in the restaurant as shown in the following drawings:

85
Figure 74: 3D Model showing Dome position
Figure 73: Location of system in the floor plan

86
Figure 75: Comparison between Optimal and Simulated reverberation time
Conclusion:
The project represents a unique experience of acoustic sensitive restaurant design.
Particular attention has been paid to the different aspects, characterizing global comfort and
quality of space fruition. In particular, the contribution given by acoustic designers has been
considered in every phase, from the definition of spaces themselves to their
characterization, choosing furniture and introducing elements with acoustic and
electroacoustic properties.
The success of the project configuration is testified by the great and positive remarks
received by British media, and confirmed by the positive feedbacks and comments from
restaurants’ visitors, collected throughout questionnaires guestbook, websites and blog

87
6.3 SITE STUDY 6.3.1 EXTERNAL NOISE SOURCES
Fig.76 Annotated site plan to indicated noise sources- mostly from busy surrounding roads
and junctions combined with traffic.
Reggae Mansion is situated located along Jalan H.S. Lee, which is basically in the heart of
Kuala Lumpur. Due to its location, most of the noise is generated from vehicles that use
Jalan Tun Perak to enter Jalan H.S. Lee. Here, the amount of vehicles that use the
highlighted roads in the diagram above is high, especially during rush hour, in which most
roads have complete standstills and the sound of traffic will fill the air. Furthermore, opposite
Reggae Mansion are several shop lots, such as a used book store, convenience store etc.,
where trucks come to unload cargo very often, contributing to more traffic noise and sound
of human activity.
From our observation, the peak traffic hour has contributed to the most audible sound range
from 70 dB to 85 dB whereas the non peak time reading ranges from 55 dB to 60 dB.

88
6.3.2. TABULATION OF DATA Each zone is separately tabled with different time frames and height reading. We recorded the sound level reading for data tabulation in the day time and night time with height of 1.5 m (the average standing eye-level height) using a grid system. The colors of data represent the spaces of each zone. Daytime Sound Level Readings: Figures highlighted in yellow indicates the lowest recorded reading (Lux). Figures highlighted in green indicates the highest recorded reading (Lux). ZONE 1: Reception/ Lobby
ZONE 2: Dining Room/ Bar
ZONE 3: Courtyard `
Reception/ Lobby Date: 28th April Time: 3:00 p.m.
Grid F G H I J
Height 1.5m 1.5m 1.5m 1.5m 1.5m
2 63.3 51.8 50.9 49.9 49.9
3 50.0 54.1 54.3 50 57.4
4 54.4 50.9 48.4 50.6 49.9
5 50.7 54.0 55.1 72.2 52.2
Dining Room/Bar Date: 28th April Time: 3:00 p.m.
Grid F G H I J
Height 1.5m 1.5m 1.5m 1.5m 1.5m
6 59.9 60.1 58.5 58.7 65.0
7 63.8 74.4 72.0 58.4 56.4
8 76.01 62.1 65.2 59.2 59.5
9 62.3 71.6 60.3 76.3 59.4
10 68.0 63.8 59.6 66.3 57.4
Courtyard Date: 28th April Time: 3:00 p.m.
Grid B C D E
Height 1.5m 1.5m 1.5m 1.5m
4 63.8 72.5 65.7 63.6
5 65.4 76.6 67.2 66.1
6 62.7 62.2 62.3 66.8
Tables 8, 9, 10: Tabulation of acoustic data, daytime.

89
Night time Sound Level Readings: ZONE 1: Reception/ Lobby
ZONE 2: Dining Room/ Bar
ZONE 3: Courtyard
Reception/ Lobby Date: 28th April Time: 8:00 p.m.
Grid F G H I J
Height 1.5m 1.5m 1.5m 1.5m 1.5m
2 49.5 47.8 53.8 48.4 50.1
3 51.3 49.7 65.8 56.4 52.5
4 57.5 50.9 50.0 48.8 52.0
5 59.2 49.2 55.9 48.7 53.0
Dining/Bar Date: 28th April Time: 8:00 p.m.
Grid F G H I J
Height 1.5m 1.5m 1.5m 1.5m 1.5m
6 76.0 69.9 67.1 67.5 67.7
7 65.1 65.4 66.2 66.2 77.9
8 64.9 69.2 69.5 69.3 74.2
9 66.3 69.2 64.2 67.1 68.5
10 63.3 66.9 65.0 66.6 77.1
Courtyard Date: 28th April Time: 8:00 p.m.
Grid B C D E
Height 1.5m 1.5m 1.5m 1.5m
4 62.2 62.0 63.4 62.7
5 61.6 64.0 61.2 63.2
6 61.1 62.7 61.2 60.7
Tables: 11, 12, 13- Tabulation of acoustic data, night time.

90
Based on the sound level data tables above, the following observations were made along with relevant discussions: Zone 1: Reception/ Lobby Observation 1: The average sound level data collected during the day time was much
higher compared to the night time sound level readings.
Discussion 1: A lot of backpackers would check into the hostel around the afternoon time,
which could contribute to why there is more activity during this period. During the daytime,
there is obviously a lot more circulation of the interior spaces and human activity since
travelers are going through the reception/ lobby to leave the building so that they can
explore Kuala Lumpur. Also, external noise from the traffic outside the hostel is much louder
during the daytime and its emittance penetrates into the hostel regularly, contributing to the
overall acoustic levels during the daytime. Zone 2: Dining Room/ Bar Observation 2: On average, the sound level data collected during the night was much
higher compared to the day time sound level readings.
Discussion 2: Normally, more occupants of the hotel will use the dining room during dinner
time/ night time (around 7-9) as compared to them going there for breakfast, which will
contribute to the overall sound level difference. Perhaps they eat at other parts of the hostel
or they leave Reggae Mansion altogether to get a local Malaysian breakfast. In the night
time, there would be more activity from the occupant’s conversations, waiters taking orders
and especially music from the speakers in the space- Reggae Mansion tends to play louder
music at night than the daytime. There are two speakers in the dining room/ bar that
dominates the acoustic quality of the room, blaring popular music and setting the tone of the
interior space.
Zone 3: Courtyard Observation 3: The average sound level data collected during the day time was much
higher compared to the night time sound level readings. Discussion 3: During the daytime and afternoon, we noticed that more hostel guests will
come down and lounge about, have lunch or talk amongst each other in the courtyard. This
could probably be attributed to the fact that the courtyard is flooded beautifully with natural
lighting, creating an attractive atmosphere and would invite people to sit there. The higher

91
number of hotel guests in that space will also bring the waiters to serve them, contributing to
a higher sound average for the day time. Furthermore, the courtyard obviously does not
have a ceiling and is surrounded by the other stories of the Reggae Mansion as well as
outside traffic. The noise from traffic easily penetrates that space. During the night time, not
a lot of people will stay in the courtyard (except for infrequent events) because it is rather
dark and there isn’t much to do compared to the other spaces. Therefore, it is much more
vacant and quite, explaining the lower sound level at night.

92
7.0 SOUND COEFFICIENT ABSORPTION: ZONE 1:
Category &
Material
Image On site Color Surface Texture
Absorption Coefficient (Hz)
500 2000 4000
Ceiling Plaster
Broken
White Matt
Matte 0.3 0.1 0.04
Wall System
Wood White Smooth
0.1 0.07 0.07
Concrete Ivory Matt
Smooth
0.05 0.1 0.1
Concrete Usha Beige
Matte 0.05 0.1 0.1
Concrete Pearl White
Matte 0.05 0.1 0.1
Flooring
Ceramic Glossy White
Glossy 0.01
0.02 0.02

93
ZONE 2: Category & Material
Image On Site
Color Surface Texture
Absorption Coefficient (Hz)
500 2000 4000
Ceiling Plaster Classic
White Glossy Glossy 0.1 0.04 0.04
Wall System
Wood Black Matt Matte 0.15 0.3 0.3
Plaster Off White Matt
Smooth
0.02 0.04 0.04
Fiberglass Black Smooth
0.75 0.75 0.4
Wood White Pearl Smooth
0.1 0.07 0.07
Flooring Ceramic Shiny
Maroon Glossy 0.01 0.02 0.02

94
ZONE 3: Category & Material
Image On Site Color Surface Texture
Absorption Coefficient (Hz)
500 2000 4000
Ceiling Aluminum White Glossy Reflect 0.1 0.07 0.07
Wall System
Brick Golden Brown Matt & Beige Matt
Rough 0.02 0.05 005
Brick Bucket White Matt
Rough 0.02 0.05 0.05
Glass Transparent Smooth
0.01 0.07 0.07
Concrete Dark Cream Matt
Smooth
0.02 0.05 0.05
Flooring Ceramic Nut Brown
Matt Rough 0.01 0.02 0.02

95
8.0 INTERIOR NOISE SOURCES ANALYSIS AND CALCULATIONS:
Fig. 77- Positioning of the interior noise sources.

96
INDICATION PICTURE SPECIFICATION UNIT Product Name Yamaha DXR10 – 700 Watt
Active Speaker
2
Weight 14.6kg Power Supply 100V-240V
Dimension (W/H/D) 305mm/502mm/310mm
Sound Pressure Level
131dB
Colour Black Placement Ceiling
Product Name Pierro Alaskan
1
Weight 67kg
Power Supply 220V-240V
Dimension (W/H/D) 950mm/520mm/630mm
Sound Pressure Level
80dB
Colour Silver
Placement Counter top
Product Name Panasonic Oscillation Fan F-MQ409
4
Weight 5.2kg
Power Supply 120V
Dimension (W/H/D) 747mm/910mm
Sound Pressure Level
60dB
Colour White
Placement Ceiling
Product Name Fountain Soda Dispenser
1
Weight 65kg
Power Supply 220V
Dimension (W/H/D) 300mm/354mm/305mm
Sound Pressure Level
80dB
Colour Grey
Placement Counter top ProductName Daikin–EternityCeiling
ConcealedUnit
10 Weight 29kgPowerSupply 220V-240VDimension(W/H/D) 261mm/905mm/411mmSoundPressureLevel 36dB
Colour White/Greay
Placement Ceiling

97
8.1 ZONE 1: LOBBY AND RECEPTION
Within the hostel, one of the selected zones was the lobby and Reception, whereby groups
of visitors staying in the hostel will gather before adjourning into their respective rooms or
just passing through. From our observation, there is a noticeable amount of noise produced
through the waiting area and reception; from the backpackers talking amongst each other or
perhaps the receptionists/ staff talking to visitors. While the hotel is sitting along Jalan H.S.
Lee, we noticed that the street contributes to the highest noise level throughout the whole
space. Knowing that the reception/ lobby is air-conditioned, the sound is produced through
the vent is minuscule.

98
Fig.78 Render showing positions of air conditioners and ventilation ducts.
Reception/ Lobby Date: 28th April Time: 3:00 p.m.
Grid F G H I J
Height 1.5m 1.5m 1.5m 1.5m 1.5m
2 63.3 51.8 50.9 49.9 49.9
3 50.0 54.1 54.3 50 57.4
4 54.4 50.9 48.4 50.6 49.9
5 50.7 54.0 55.1 72.2 52.2
Reception/ Lobby Date: 28th April Time: 8:00 p.m.
Grid F G H I J
Height 1.5m 1.5m 1.5m 1.5m 1.5m
2 49.5 47.8 53.8 48.4 50.1
3 51.3 49.7 65.8 56.4 52.5
4 57.5 50.9 50.0 48.8 52.0
5 59.2 49.2 55.9 48.7 53.0
Table1,4:Tabulationofacousticdata.

99
8.1.1 ZONE 1: LOBBY AND RECEPTION I. REVERBERATION TIME, RT
500 Hz:
Building Elements Materials Color
Area A Absorption Sound Absorption
(Sa)
(m2)/Quantity Coefficient (500Hz)
Wall Brick White finishing 58.5 0.02 1.17
Wall Brick White finishing 54.99 0.02 1.0998
Wall Brick White finishing 14.04 0.02 0.2808
Wall Glass Transparent 23.4 0.18 4.212
Opening Glass Transparent 6.84 0.18 1.2312
Opening Glass Transparent 3.51 0.18 0.6318
Floor Marble White/Grey 90 0.01 0.9
Ceiling Plaster White 90 0.03 2.7
Furniture Wooden reception
desk White 3 0.05 0.15
Furniture Leather Sofa Brown 4.8 0.43 2.064
Humans - - 5 0.46 2.3
Absorption (A) Total 16.7396
RT= 0.16×V/A
=0.16×351⁄16.7396
= 3.35s
Reggae Mansion’s reverberation time for Zone 1 in 500Hz of absorption coefficient in 500Hz
is 3.35s. According to standard of reverberation time, the standard comfort reverberation for
a reception/ lobby is around 0.6-0.8s. Referring to the calculation above, the reverberation
time exceeds the comfort level.

100
2000 Hz:
RT= 0.16×V/A
=0.16×351⁄15.0471
= 3.72 s Reggae Mansion’s reverberation time for Zone 1 in 2000 Hz of absorption coefficient in
2000Hz is 3.72s. According to standard of reverberation time, the standard comfort
reverberation for a Lobby/reception is around 0.6-0.8s. Referring to the calculation above, the
reverberation time exceeds the comfort level.
Building Elements Materials Color
Area A Absorption Sound Absorption
(Sa)
(m2)/Quantity Coefficient
(2000Hz)
Wall Brick White finishing 58.5 0.02 1.17
Wall Brick White finishing 54.99 0.02 1.0998
Wall Brick White finishing 14.04 0.02 0.2808
Wall Glass Transparent 23.4 0.07 1.638
Opening Glass Transparent 6.84 0.07 0.4788
Opening Glass Transparent 3.51 0.07 0.2457
Floor Marble White/Grey 90 0.02 1.8
Ceiling Plaster White 90 0.04 3.6
Furniture Wooden reception
desk White 3 0.04 0.12
Furniture Leather Sofa Brown 4.8 0.43 2.064
Humans (seated) - - 5 0.51 2.55
Absorption (A) Total 15.0471

101
4000 Hz:
RT= 0.16×V/A
=0.16×351⁄14.1599
= 3.966s
Reggae Mansion’s reverberation time for Zone 1 in 4000 Hz of absorption coefficient in 4000
Hz is 3.966s. According to standard of reverberation time, the standard comfort reverberation
for a Lobby/reception is around 0.6-0.8s. Referring to the calculation above, the reverberation
time exceeds the comfort level.
Building Elements Materials Color
Area A Absorption Sound Absorption
(Sa)
(m2)/Quantity Coefficient (4000Hz)
Wall Brick White finishing 58.5 0.03 1.755
Wall Brick White finishing 54.99 0.03 1.6497
Wall Brick White finishing 14.04 0.03 0.4212
Wall Glass Transparent 23.4 0.04 0.936
Opening Glass Transparent 6.84 0.04 0.2736
Opening Glass Transparent 3.51 0.04 0.1404
Floor Marble White/Grey 90 0.02 1.8
Ceiling Plaster White 90 0.03 2.7
Furniture Wooden reception
desk White 3 0.04 0.12
Furniture Leather Sofa Brown 4.8 0.43 2.064
Humans (seated) - - 5 0.46 2.3
Absorption (A) Total 14.1599

102
II. SOUND PRESSURE LEVEL (SPL): Sound pressure level refers to the average sound level in an enclosed space. The sound
pressure level (SPL) at Zone 1 by means of Reception/Lobby is shown in the following table:
SPL = 10Log (I/Iref), Where Iref= 1×10¹² (Watts)
I = Sound power in (Watts)
Location ZONE 1: RECEPTION/LOBBY
Area(m2) 90 Height of Ceiling(m) 3.9 Time 3:00 p.m. 8:00 p.m. Highest sound level meter reading (dB)
63.3 65.8
Lowest sound level meter reading (dB)
48.4 47.8
Intensity for the Highest reading IH
SPL=10Log10 (I/Iref)
63.3= 10Log10 × IH/ 1.0×10⁻¹²
IH = 2.137× 10⁻⁶
SPL=10Log10 (I/Iref)
65.8 =10Log10×IH/1.0×10-12
IH = 3.801×10⁻⁶
Intensity for the Lowest reading IL
SPL=10Log10 (I/Iref)
48.4=10Log10 × IH/ 1.0×10⁻¹²
IL=6.918×10⁻⁸
SPL=10Log10 (I/Iref)
47.8=10Log10 ×IH/1.0×10-12
IL=6.025×10⁻⁸
Total intensities. I
I=2.137× 10⁻⁶+6.918×10-8
= 2.2×10⁻⁶
I= 3.801×10⁻⁶ +6.025×10-8
= 3.866×10⁻⁶
Sound pressure Level, SPL
SPL=10Log10 (I/Iref)
SLP=10Log10 × (2.2×10-6 ÷
1.0×10⁻¹²)
SLP= 63.242 dB
SPL=10Log10 (I/Iref)
SPL=10Log10×(3.86×10-6 ÷
= 1.0×10⁻¹² )
SLP = 65.872dB
At Zone 1, the average sound pressure level during the day from 1:00 p.m.-3p.m. and 8:00
p.m.- 10 p.m. are respectively 63.242dB and 65.872dB. The range of the noise level at Zone
1 is between the comforting levels. Conversation between customers and staffs are
exchanged easily.

103
8.1.2 ACOUSTIC RAY DIAGRAM:
Fig. 79: Acoustic ray diagram of Zone 1 made with Ecotect. According to the diagram above, it can be observed that there is reverberation and even
echo occurring within the space. The sound is bound to reverb from from one surface to
another in such a small room, especially from the glass façade so this Is not surprising.
Furthermore, the reflected surfaces on the walls of the reception/ lobby will aid to more
reverberation time, as reverb tends to happen the more similar a material is with air.

104
8.2 ZONE 2: DINING ROOM/ BAR
Within the hostel, one of the selected zones was the Dining Room and Bar, all of which in
zone 2. Through our observation, the highest number of users in this space is around dinner
time (7-9 pm). There is a noticeable amount of noise produced from human activity, such as
people talking, laughing or waiters communicating to customers. Also, like zone 1, the dining
room/ bar is near the street which contributes to a high noise level. The dining room is the
only room studied with speakers, which plays moderately loud music, especially at night. For
the calculation, we divided zone 2 into two; Zone 2-1 for the Dining Room and Zone 2-2 for
the bar. This is because different people will visit the dining room and the bar for different
reasons and the amount of human activity would be different.

105
Fig.80: Render of the interior of the dining room and the placement of the speakers.
Dining Room/Bar Date: 28th April Time: 3:00 p.m.
Grid F G H I J
Height 1.5m 1.5m 1.5m 1.5m 1.5m
6 59.9 60.1 58.5 58.7 65.0
7 63.8 74.4 72.0 58.4 56.4
8 76.01 62.1 65.2 59.2 59.5
9 62.3 71.6 60.3 76.3 59.4
10 68.0 63.8 59.6 66.3 57.4
Dining/Bar Date: 28th April Time: 8:00 p.m.
Grid F G H I J
Height 1.5m 1.5m 1.5m 1.5m 1.5m
6 76.0 69.9 67.1 67.5 67.7
7 65.1 65.4 66.2 66.2 77.9
8 64.9 69.2 69.5 69.3 74.2
9 66.3 69.2 64.2 67.1 68.5
10 63.3 66.9 65.0 66.6 77.1
Tables 2, 5: Tabulation of acoustic data.

106
8.2.1 ZONE 2-1: DINING ROOM I. Reverberation Time, RT
500 Hz:
Building Elements Materials Color
Area A Absorption Sound Absorption (Sa)
(m2)/Quantity Coefficient (500Hz)
Ceiling Decorative Plaster White / black 90 0.03 2.7
Floor Marble Black 90 0.01 0.9 Wall Glass Transparent 39 0.18 7.02 Wall Mirror - 27.495 0.04 1.0998 Wall Brick White Finishing 27.495 0.02 0.5499 Wall Plaster Black 9.75 0.04 0.39 Table Wood White 8 0.05 0.4 Chair Wood White/Brown 34 0.05 1.7 Opening Glass Transparent 3.51 0.04 0.1404 Opening Timber Black 2.25 0.1 0.225 Decorative screen Mirror Black 1 0.04 0.035
Showcase Glass
Transparent 1 0.18 0.18
Humans
(seated) -
-
16 0.46 7.36
Total absorption 22.7001
RT= 0.16×V/A
=0.16×351⁄22.7001
= 2.46s Reggae Mansion’s reverberation time for Zone 2-1 in 500 Hz of absorption coefficient in 500
Hz is 2.46s. According to standard of reverberation time, the standard comfort reverberation
for a Lobby/reception is around 0.6-0.8s. Referring to the calculation above, the reverberation
time exceeds the comfort level.

107
2000 Hz:
RT= 0.16×V/A
=0.16×351⁄24.882
= 2.25s Reggae Mansion’s reverberation time for Zone 2-1 in 2000 Hz of absorption coefficient in 2000
Hz is 2.25s. According to standard of reverberation time, the standard comfort reverberation
for a Lobby/reception is around 0.6-0.8s. Referring to the calculation above, the reverberation
time exceeds the comfort level.
Building Elements Materials Color
Area A Absorption Sound Absorption (Sa)
(m2)/Quantity Coefficient (2000Hz)
Ceiling Decorative Plaster White / black 90 0.04 3.6
Floor Marble Black 90 0.02 1.8 Wall Glass Transparent 39 0.07 7.73 Wall Mirror - 27.495 0.02 0.5499 Wall Brick White Finishing 27.495 0.02 0.5499 Wall Plaster Black 9.75 0.04 0.39 Table Wood White 8 0.04 0.32 Chair Wood White/Brown 34 0.04 1.36 Opening Glass Transparent 3.51 0.07 0.2457 Opening Timber Black 2.25 0.04 0.09 Decorative screen Mirror Black 1 0.02 0.02
Showcase Glass
Transparent 1 0.07 0.07
Humans -
-
16 0.51 8.16
Total absorption 24.882

108
4000 Hz:
RT= 0.16×V/A
=0.16×351⁄15.69
= 3.58s Reggae Mansion’s reverberation time for Zone 2-1 in 4000 Hz of absorption coefficient in 4000
Hz is 3.58s. According to standard of reverberation time, the standard comfort reverberation
for a Lobby/reception is around 0.6-0.8s. Referring to the calculation above, the reverberation
time exceeds the comfort level.
Building Elements Materials Color
Area A Absorption Sound Absorption (Sa)
(m2)/Quantity Coefficient (4000Hz)
Ceiling Decorative Plaster White / black 90 0.03 2.7
Floor Marble Black 90 0.02 1.8 Wall Glass Transparent 39 0.04 1.56 Wall Mirror - 27.495 0.02 0.5499 Wall Brick White Finishing 27.495 0.03 0.82485 Wall Plaster Black 9.75 0.03 0.2925 Table Wood White 8 0.04 0.32 Chair Wood White/Brown 34 0.04 1.36 Opening Glass Transparent 3.51 0.04 0.1404 Opening Timber Black 2.25 0.04 0.09 Decorative screen Mirror Black 1 0.02 0.02
Showcase Glass
Transparent 1 0.04 0.04
Humans -
-
16 0.46 7.36
Total absorption 15.69

109
II. SOUND PRESSURE LEVEL (SPL)
Sound pressure level refer to the average sound level in an enclose space. The sound
pressure level (SPL) at Zone 1 by mean Reception/Lobby is shown in the following table:
SLP= 10Log (I/Iref), Where Iref= 1×10¹² (Watts)
I = Sound power in (Watts)
Location ZONE 2-1: DINNING
Area (m2) 90 Height of Ceiling (m) 3.9 Time 3:00 p.m. 8:00 p.m. Highest sound level meter reading (dB)
76.01 77.9
Lowest sound level meter reading (dB)
56.4 66.2
Intensity for the Highest reading IH
SPL=10Log10 (I/Iref)
76.01= 10Log10 × IH/ 1.0×10⁻¹²
IH = 3.99× 10⁻⁵
SPL=10Log10 (I/Iref)
77.9= 10Log10 × IH/ 1.0×10⁻¹²
IH = 6.165× 10⁻⁵
Intensity for the Lowest reading IL
SPL=10Log10 (I/Iref)
56.4=10Log10 × IH/ 1.0×10⁻¹²
IL=4.365×10⁻⁷
SPL=10Log10 (I/Iref)
66.2=10Log10 ×IH/1.0×10-12
IL=4.168×10⁻⁶
Total intensities. I
3.99× 10⁻⁵+ 4.365×10⁻⁷
IH = 4.033× 10⁻⁵
6.165× 10⁻⁵+ 4.168×10⁻⁶
IH = 6.5818× 10⁻⁵
Sound pressure Level, SPL
SPL=10Log10 (I/Iref)
SLP=10Log10 × (4.033× 10-5÷
1.0×10⁻¹²)
SLP= 76.06 dB
SPL=10Log10 (I/Iref)
SLP=10Log10×(6.5818× 10-5÷
1.0×10⁻¹²
SLP= 78.183 dB
At Zone 2 part 1, the average sound pressure level during the day from 1:00 p.m.-3p.m. and
8:00 p.m.- 10 p.m. are respectively 76.06 dB and 78.183 dB. The range of the noise level at
Zone 3 part 1 is exceeding the comforting levels. Conversation between customers and staffs
can be exchanged easily.

110
ZONE 2-2: BAR I. Reverberation Time, RT
500 Hz:
Building Elements Materials Color
Area A Absorption Sound Absorption
(Sa)
(m2) Coefficient
(500Hz)
Wall Glass Transparent 9.75 0.18 1.755
Wall Plaster White 58.5 0.03 1.755
Table Metal Grey 2 0.15 0.3
Bar table Wood Transparent 1 0.05 0.05
Stool Leather Transparent 10 0.43 4.3
Decorative screen Glass Transparent 1 0.04 0.04
Floor Marble White/Grey 37.5 0.01 0.375
Ceiling Plaster White 37.5 0.04 1.5
Opening Timber White 2.25 0.05 0.12
Humans - - 5 0.46 2.3 Absorption (A) Total 12.495
RT= 0.16×V/A
=0.16×146.25⁄12.495
= 1.872s
Reggae Mansion’s reverberation time for Zone 2-2 in 500 Hz of absorption coefficient in 500
Hz is 1.872s. According to standard of reverberation time, the standard comfort reverberation
for a Lobby/reception is around 0.6-0.8s. Referring to the calculation above, the reverberation
time exceeds the comfort level.

111
2000 Hz:
RT= 0.16×V/A
=0.16×146.25⁄12.6025
= 1.85s
Reggae Mansion’s reverberation time for Zone 2-2 in 2000 Hz of absorption coefficient in 2000
Hz is 1.85s. According to standard of reverberation time, the standard comfort reverberation
for a Lobby/reception is around 0.6-0.8s. Referring to the calculation above, the reverberation
time exceeds the comfort level.
Building Elements Materials Color
Area A Absorption Sound Absorption
(Sa)
(m2) Coefficient
(2000Hz)
Wall Glass Transparent 9.75 0.07 0.6825
Wall Plaster White 58.5 0.04 2.34
Table Metal Grey 2 0.15 0.3
Bar table Wood Transparent 1 0.04 0.04
Stool Leather Transparent 10 0.43 4.3
Decorative screen Glass Transparent 1 0.02 0.02
Floor Marble White/Grey 37.5 0.02 0.75
Ceiling Plaster White 37.5 0.04 1.5
Opening Timber White 2.25 0.04 0.12
Humans - - 5 0.51 2.55 Absorption (A) Total 12.6025

112
4000 Hz:
RT= 0.16×V/A
=0.16×146.25⁄11.1
= 2.108s Reggae Mansion’s reverberation time for Zone 2-2 in 4000 Hz of absorption coefficient in 4000
Hz is 2.108s. According to standard of reverberation time, the standard comfort reverberation
for a Lobby/reception is around 0.6-0.8s. Referring to the calculation above, the reverberation
time exceeds the comfort level.
Building Elements Materials Color
Area A Absorption Sound Absorption
(Sa)
(m2) Coefficient
(4000Hz)
Wall Glass Transparent 9.75 0.04 0.39
Wall Plaster White 58.5 0.03 1.755
Table Metal Grey 2 0.15 0.3
Bar table Wood Transparent 1 0.04 0.04
Stool Leather Transparent 10 0.43 4.3
Decorative screen Glass Transparent 1 0.02 0.02
Floor Marble White/Grey 37.5 0.02 0.75
Ceiling Plaster White 37.5 0.03 1.125
Opening Timber White 2.25 0.04 0.12
Humans - - 5 0.46 2.3 Absorption (A) Total 11.1
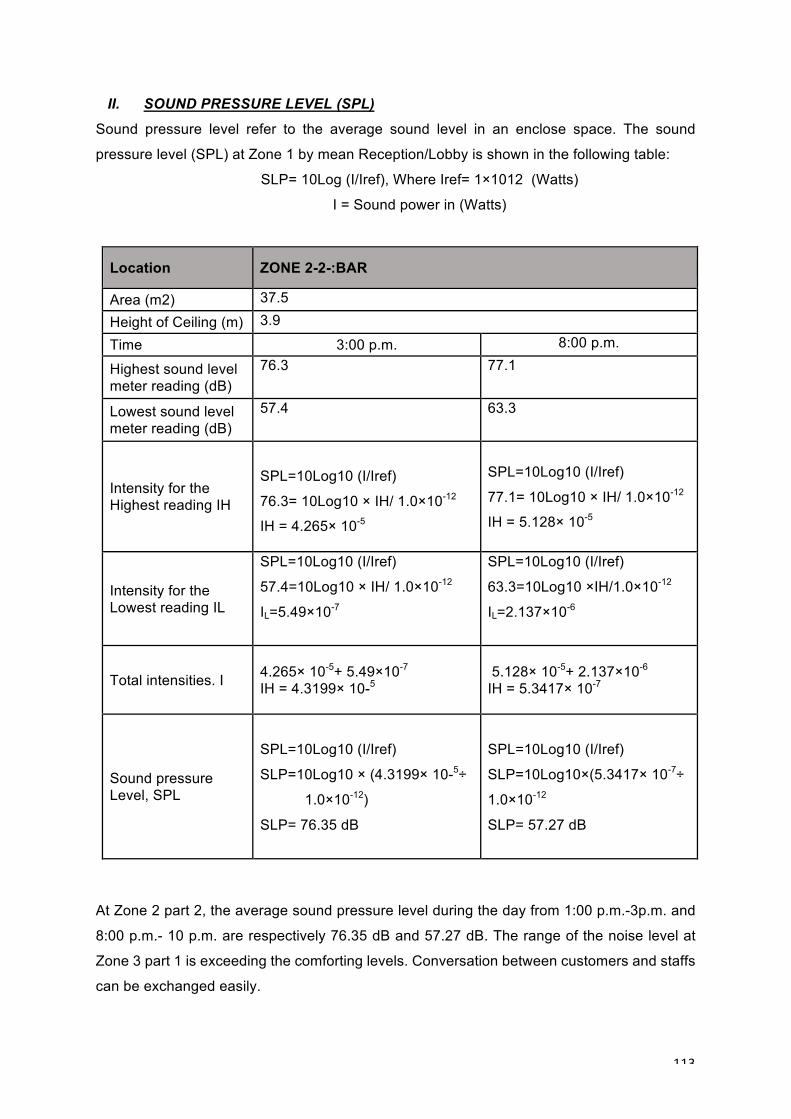
113
II. SOUND PRESSURE LEVEL (SPL)
Sound pressure level refer to the average sound level in an enclose space. The sound
pressure level (SPL) at Zone 1 by mean Reception/Lobby is shown in the following table:
SLP= 10Log (I/Iref), Where Iref= 1×10¹² (Watts)
I = Sound power in (Watts)
Location ZONE 2-2-:BAR
Area (m2) 37.5 Height of Ceiling (m) 3.9 Time 3:00 p.m. 8:00 p.m. Highest sound level meter reading (dB)
76.3 77.1
Lowest sound level meter reading (dB)
57.4 63.3
Intensity for the Highest reading IH
SPL=10Log10 (I/Iref)
76.3= 10Log10 × IH/ 1.0×10⁻¹²
IH = 4.265× 10⁻⁵
SPL=10Log10 (I/Iref)
77.1= 10Log10 × IH/ 1.0×10⁻¹²
IH = 5.128× 10⁻⁵
Intensity for the Lowest reading IL
SPL=10Log10 (I/Iref)
57.4=10Log10 × IH/ 1.0×10⁻¹²
IL=5.49×10⁻⁷
SPL=10Log10 (I/Iref)
63.3=10Log10 ×IH/1.0×10-12
IL=2.137×10⁻⁶
Total intensities. I
4.265× 10⁻⁵+ 5.49×10⁻⁷
IH = 4.3199× 10⁻⁵
5.128× 10⁻⁵+ 2.137×10⁻⁶
IH = 5.3417× 10⁻⁷
Sound pressure Level, SPL
SPL=10Log10 (I/Iref)
SLP=10Log10 × (4.3199× 10-5÷
1.0×10⁻¹²)
SLP= 76.35 dB
SPL=10Log10 (I/Iref)
SLP=10Log10×(5.3417× 10-7÷
1.0×10⁻¹²
SLP= 57.27 dB
At Zone 2 part 2, the average sound pressure level during the day from 1:00 p.m.-3p.m. and
8:00 p.m.- 10 p.m. are respectively 76.35 dB and 57.27 dB. The range of the noise level at
Zone 3 part 1 is exceeding the comforting levels. Conversation between customers and staffs
can be exchanged easily.

114
8.2.2 ACOUSTIC RAY DIAGRAM:
Fig.81: Acoustic ray diagram of Zone 2 made with Ecotect. Based on the diagram above, it can be seen that the most dominant sound source in this
room is from the first speaker. The speaker’s sound is reflected and bounced off around the
room through various reflective surfaces such as the glass façade, the mirrored wall and the
reflective wall behind the bar. This leads to an even spread of reverberation due to all the
reflective materials in this room.

115
8.3 ZONE 3: COURTYARD
The last zone we had analyzed was the central courtyard. Through observation, the highest
number of users in this space is around the morning to afternoon. This could be due to the
fact that around this time, there is ample natural daylighting occurring, attracting users to the
space. When its evening, the courtyard is rather dark with only one artificial light. There is a
noticeable amount of noise produced from human activity, such as backpackers socializing
and talking, around the afternoon, where people may rest there or eat some lunch. Most
noticeably, the noise sources from the roads outside are transmitted into the courtyard,
leading to most of the noise level.
Fig. 82 - Render of the courtyard showing the number of fans attached.

116
Table3,6:TabulationofCourtyardintheDaytimeandNighttime
I. Reverberation Time, RT
Within the hostel, the other selected part was the Courtyard, located behind both the
Reception/Lobby and the dinning/Bar. Whereby group of tourists gathered mostly during
afternoon until nighttime. From our observation, there is a noticeable amount of noise
produced through the courtyard. While the hostel is close to the main road, we noticed that
the courtyard is situated behind the main road, therefore outdoor movements from traffic
contributes the highest noise level throughout the courtyard. The courtyard being an open
space, the reverberation time cannot be calculated for this particular area due to the absence
of ceiling. As mentioned in class, room acoustic is the study of Acoustical Phenomena in
Enclosed Space.
Courtyard Date: 28th April Time: 3:00 p.m.
Grid B C D E
Height 1.5m 1.5m 1.5m 1.5m
4 63.8 72.5 65.7 63.6
5 65.4 76.6 67.2 66.1
6 62.7 62.2 62.3 66.8
Courtyard Date: 28th April Time: 8:00 p.m.
Grid B C D E
Height 1.5m 1.5m 1.5m 1.5m
4 62.2 62.0 63.4 62.7
5 61.6 64.0 61.2 63.2
6 61.1 62.7 61.2 60.7

117
II. SOUND PRESSURE LEVEL (SPL)
Sound pressure level refer to the average sound level in an enclose space. The sound
pressure level (SPL) at Zone 1 by mean Reception/Lobby is shown in the following table:
SLP= 10Log (I/Iref), Where Iref= 1×10¹² (Watts)
I = Sound power in (Watts)
Location ZONE 3- COURTYARD
Area (m2) 42 Height of Ceiling (m) 3.9 Time 3:00 p.m. 8:00 p.m. Highest sound level meter reading (dB)
76.6 64.0
Lowest sound level meter reading (dB)
62.2 60.7
Intensity for the Highest reading IH
SPL=10Log10 (I/Iref)
76.6= 10Log10 × IH/ 1.0×10⁻¹²
IH = 4.57× 10⁻⁵
SPL=10Log10 (I/Iref)
64= 10Log10 × IH/ 1.0×10⁻¹²
IH = 2.512× 10⁻⁶
Intensity for the Lowest reading IL
SPL=10Log10 (I/Iref)
62.2=10Log10 × IH/ 1.0×10⁻¹²
IL=1.659×10⁻⁶
SPL=10Log10 (I/Iref)
60.7=10Log10 ×IH/1.0×10-12
IL=1.174×10⁻⁶
Total intensities. I
4.57× 10⁻⁵ + 1.659×10⁻⁶
IH = 4.736× 10⁻⁵
2.512× 10⁻⁶ + 1.174×10⁻⁶
IH = 3.686× 10⁻⁶
Sound pressure Level, SPL
SPL=10Log10 (I/Iref)
SLP=10Log10 × (4.736× 10-5÷
1.0×10⁻¹²)
SLP= 76.7 dB
SPL=10Log10 (I/Iref)
SLP=10Log10×(3.686× 10-6 ÷
1.0×10⁻¹²
SLP= 65.66 dB
At Zone 2, the average sound pressure level during the day from 1:00 p.m.-3p.m. and 8:00
p.m.- 10 p.m. are respectively 76.7 dB and 65.66 dB. The range of the noise level at Zone 2
during the day is not between the comforting levels. Thus conversation between customers
and staffs during the day can be exchanged easily. While at night, communication is much
easier.

118
8.3.1 ACOUSTIC RAY DIAGRAM:
Fig. 83: Acoustic ray diagram of the courtyard made with Ecotect. As it can be seen from the above diagram, there is not much sound reverberation occurring
in this space. This is due to the fact that the courtyard is not an enclosed space, due to the
absence of a ceiling. The little sound that is reflected seems to be from a fan.
Fig 84: The roof is 7 meters above the courtyard.

119
9.0 CONCLUSION FOR ACOUSTIC: From the studied analysis, the acoustic condition in Reggae Mansion is average for a hostel
requirement, due to the fact that the hostel is located around a busy and congested street. The
hostel has an internal courtyard, which allows noise to easily infiltrate to the interior. The sound
reduction, however, allows for easy communication within the space. Furthermore, based on our
calculations, the noise pressure level shows that communication within the space can be done
easily. However, as for reverberation time, it exceeds the comfort levels. Therefore, the spaces
studied requires more absorption fixtures.

120
REFERENCES:
STC Chart (n.d). STC ratings for Brick and Concrete Block. Retrieved from http://www.sae.edu/reference_material/pages/STC%20Chart.htm on 1 October 2015
Paroc Group (2014). Sound Insulation. Retrieved from http://www.paroc.com/knowhow/sound/sound-insulation on 28 September 2015
ThomasNet (2014). Sound Absorption Coefficients. Retrieved from http://www.acousticalsurfaces.com/acoustic_IOI/101_13.htm on 28 September 2015
Absorption Coefficients of Common Building Material and Finishes. (2014) Retrieved fromhttp://www.sae.edy/reference_material/pages/Coefficient%20Chart.htm on 27
September 2015
Hong Kong Institute of Architects (2008) Wave Motion, Noise Control in Architecture
Harris, Cyril M. Noise Control in Buildings: A Practical Guide for Architects and Engineers. New York: Mcgraw-Hill, 1993
Neufert, Ernst and Peter. Neufert Architects’ Data. Oxford: Wiley-Blackwell, 2012
AZO Network (2014). Sound Transmission and Insulation in Brick and Masonry Walls. Retrieved fromHttp://www.azom.com/articles.aspx?ArticleID =1326 on 1 October 2015
Long, M. (2006). Architectural Acoustics, Amsterdam: Elsevier/Academic Pres
Barton C.K., & Construction Engineering Research Laboratory. (1987). Development of LITE—a graphic module for lighting analysis in the Computer-Aided Engineering and Architectural Design System (CAEADS), Champaign, IL:US Army Corps of Engineers, Construction Engineering Research Labaratory
Calculuc Indoor – Philips Lighting Singapore, (n.d). Retrieved from http://www.lighting.philips.com/pwc_li/cn_zh/connect/tools_literature/Assets/downloads/ manual_indoor.pdf
CIBSE, (2002). Code for Lighting, Burlington: Elsevier Coefficient Chart, (n.d). Retrieved from http://www.sae.edu/reference_material/pages/Coefficient%20Chart.htm
Daru, M.. Torcel, P., Sheffer, M,. & Lau, A (2005). Analysis of the Design and Energy Perfomance of the Pennysylvania Depart of Environmentak Protection Cambria Offiice Building, doi:10.2172/15016075

121
INTERIOR LIGHTING DESIGN A STUDENT’S GUIDE. (n.d). Retrieved from http://www.slideshare.net/nosuhaila/interior-lighting-design-a-students -guide
Malaysia. (2007). Code of practice on energy effieciency and use of renewable energy for non-residential buildings (first revision), Putrajaya: Department of Standard Malaysia
Subtle variations: The Uses of Artificial and Natural Light in the Menil Collection, Houston, Texas (n.d), Retrieved from http://www.arch.ced.berkeley.edy/vitalsigns/bld/toolkit_studies/menil%collecton%20-- %20Subtle%20Variations.pdf
Technical – Photometric Data Guide. (n.d), retrieved from http:lightsbylinea.com/index.php?route=information%2Finformation_id=10