BUILDING RESEARCH INSTITUTE The Great East Japan Earthquake Damage Report › english › contents...
6
A t 2:46 p.m. on March 11, 2011, what is formally known as the “2011 off the Pacific coast of Tohoku Earthquake” struck, with an epicenter off the coast of Sanriku. Casualties from the disaster stand at 15,839 fatalities and 3,642 miss- ing. Damage to buildings includes 120,241 buildings completely destroyed, 189,822 buildings partially destroyed and 598,587 buildings partially damaged (announced by the National Police Agency as of November 17, 2011). While the size of the earthquake was reported as magnitude 7.9 by the Japan Meteorological Agency immedi- ately after it struck, on March 13 this was revised to 9.0 (on the moment mag- nitude scale). An earthquake of this size was Japan’s largest in recorded history, and the scale of damage it caused was also greater than ever experienced. The tsunami waves that arrived along the coast shortly after the earth- quake hit reached far inland over a vast area from Aomori Prefecture in the north to Chiba Prefecture in the south, resulting in immense damage. To obtain technical data to be used in a re- view of technical stan- dards in light of the earthquake, after the earthquake struck the Building Research Institute (BRI) and the National Institute for Land and Infrastructure Management (NILIM) set about the task of collecting information on damages due to seis- mic movement and the tsunami waves, focus- ing primarily on build- ing structures. The shaking expe- rienced around the country is important information through which we can understand the structural damage caused by the earthquake. To look at this, we will introduce strong mo- tion seismograms recorded in the disas- ter-affected regions, which were obtained through the strong-motion earthquake observation project conducted by the BRI. The epicentral area of this earth- quake was extremely large, and regions experiencing strong motion occurred across the widest area ever seen. While buildings also suffered dam- age, buildings constructed according to the new earthquake resistance standards did not suffer major damage. In light of lessons learned from earthquake damage due to the 1978 Miyagi earthquake and others, Japan strengthened its seismic design standards in accordance with the Building Standards Law and related ordinances from June 1981. These stan- dards are known as the new earthquake resistance standards. Large Epicentral Area The earthquake was felt across a wide area from Hokkaido to western Japan. As the earthquake occurred along what is known as a plate boundary, the rup- tured epicentral area was large, and the resultant aftershock area is estimated to have been around 500 km to the north and south, and around 200 km to the east and west. The seismic rupture began around the area indicated by the symbol in Figure 1, and according to BRI analysis, the largest slip amount of about 48 meters occurred in the vicinity of the ocean trench where the plate boundary is located. It is also estimated that between 10 and 30 meters of slip amount occurred from off the coast of Miyagi Prefecture to the southern Sanriku Coast, approximately ten meters off the Fukushima coast and roughly two meters off the coast of Ibaraki Prefecture. Off the central Sanriku coast, slip amount of between five and eleven 22 The Japan Journal DECEMBER 2011 BUILDING RESEARCH INSTITUTE Figure 1: Distribution of slip amount on the fault estimated from tsunami measurements (Fujii et al:, 2011, Earth, Planets and Space) The Building Research Institute of Japan has conducted an extensive survey of the damage caused to buildings and homes by seismic motion and tsunami waves during the 2011 Great East Japan Earthquake, and offers this report. (Detailed data including damage due to tsunami: http://www.kenken.go.jp/english/ index.html) The Great East Japan Earthquake Damage Report The tsunami swept away all the wooden and low-rise build- ings in this coastal area of Onagawa, Miyagi Prefecture, except for a solitary reinforced concrete building.
Transcript of BUILDING RESEARCH INSTITUTE The Great East Japan Earthquake Damage Report › english › contents...
A t 2:46 p.m. on March 11, 2011, what is formally known as the “2011 off the Pacific coast of Tohoku Earthquake”
struck, with an epicenter off the coast of Sanriku. Casualties from the disaster stand at 15,839 fatalities and 3,642 miss-ing. Damage to buildings includes 120,241 buildings completely destroyed, 189,822 buildings partially destroyed and 598,587 buildings partially damaged (announced by the National Police Agency as of November 17, 2011).
While the size of the earthquake was reported as magnitude 7.9 by the Japan Meteorological Agency immedi-ately after it struck, on March 13 this was revised to 9.0 (on the moment mag-nitude scale). An earthquake of this size was Japan’s largest in recorded history, and the scale of damage it caused was also greater than ever experienced.
The tsunami waves that arrived along the coast shortly after the earth-quake hit reached far inland over a vast area from Aomori Prefecture in the north to Chiba Prefecture in the south, resulting in immense damage.
To obtain technical data to be used in a re-view of technical stan-dards in light of the earthquake, after the earthquake struck the Bui ld ing Research Institute (BRI) and the National Institute for Land and Infrastructure Management (NILIM) set about the task of collecting information on damages due to seis-mic movement and the tsunami waves, focus-ing primarily on build-ing structures.
The shaking expe-r ienced around the
country is important information through which we can understand the structural damage caused by the earthquake. To look at this, we will introduce strong mo-tion seismograms recorded in the disas-ter-affected regions, which were obtained through the strong-motion earthquake observation project conducted by the BRI. The epicentral area of this earth-quake was extremely large, and regions experiencing strong motion occurred across the widest area ever seen.
While buildings also suffered dam-age, buildings constructed according to the new earthquake resistance standards did not suffer major damage. In light of lessons learned from earthquake damage due to the 1978 Miyagi earthquake and others, Japan strengthened its seismic design standards in accordance with the Building Standards Law and related ordinances from June 1981. These stan-dards are known as the new earthquake resistance standards.
Large Epicentral Area
The earthquake was felt across a wide
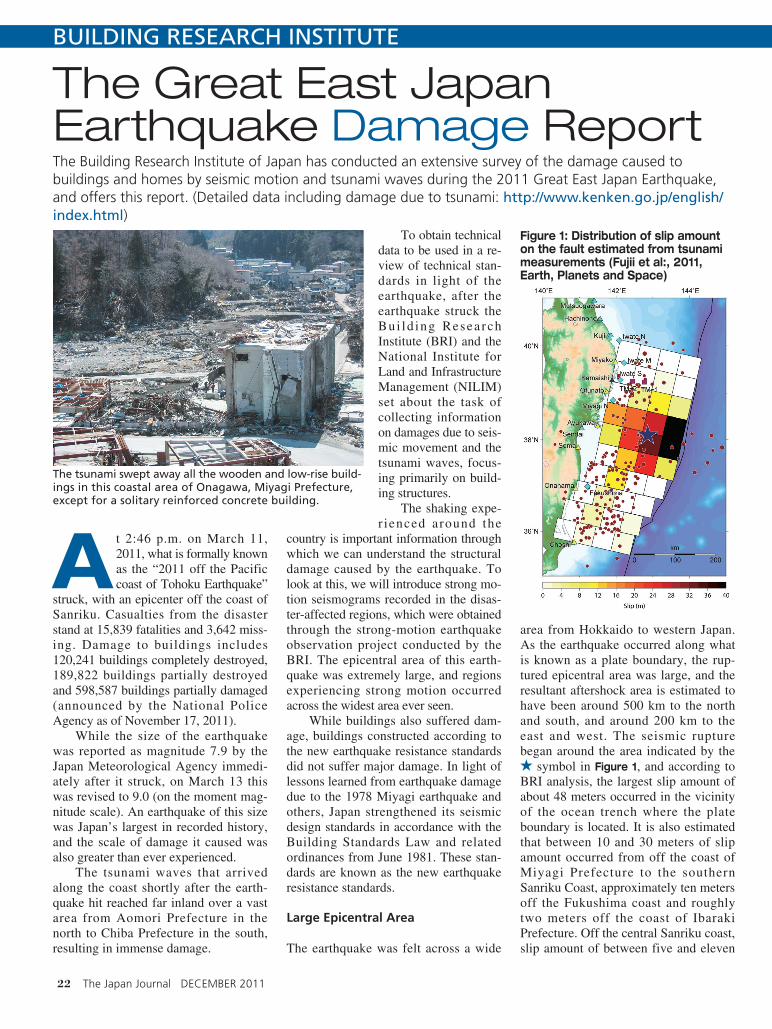
area from Hokkaido to western Japan. As the earthquake occurred along what is known as a plate boundary, the rup-tured epicentral area was large, and the resultant aftershock area is estimated to have been around 500 km to the north and south, and around 200 km to the east and west. The seismic rupture began around the area indicated by the
symbol in Figure 1, and according to BRI analysis, the largest slip amount of about 48 meters occurred in the vicinity of the ocean trench where the plate boundary is located. It is also estimated that between 10 and 30 meters of slip amount occurred from off the coast of Miyagi Prefecture to the southern Sanriku Coast, approximately ten meters off the Fukushima coast and roughly two meters off the coast of Ibaraki Prefecture. Off the central Sanriku coast, slip amount of between five and eleven
22 23The Japan Journal DECEMBER 2011 The Japan Journal DECEMBER 2011
BUILDING RESEARCH INSTITUTE
Figure 1: Distribution of slip amount on the fault estimated from tsunami measurements (Fujii et al:, 2011, Earth, Planets and Space)
The Building Research Institute of Japan has conducted an extensive survey of the damage caused to buildings and homes by seismic motion and tsunami waves during the 2011 Great East Japan Earthquake, and offers this report. (Detailed data including damage due to tsunami: http://www.kenken.go.jp/english/index.html)
The Great East Japan Earthquake Damage Report
The tsunami swept away all the wooden and low-rise build-ings in this coastal area of Onagawa, Miyagi Prefecture, except for a solitary reinforced concrete building.

meters is estimated in some areas. The symbol in Figure 1 indicates the starting point of the rupture which rep-resents the beginning of the earthquake. From this point the rupture widened as far as off the coast of Iwate Prefecture to the north and Ibaraki Prefecture to the south, resulting in a vast epicentral area.
Widespread Shaking
In Japan, the size of earthquake shocks is expressed in te rms of the Japan Meteorological Agency (JMA) Seismic Intensity Scale. The largest seismic inten-sity recorded during the 2011 earthquake was level 7 at the Tsukidate station in Kurihara, Miyagi Prefecture. No other areas recorded level 7 in tensi ty . However, in terms of peak ground accel-eration, which is an alternate indicator of shaking used by strong motion observa-tion networks operated by other agencies such as K-NET*1, this measurement sur-passed 1,000 Gal*2 at many observation stations. As Figure 2 shows, the shocks
were felt across almost all of Japan.
*1 K-NET: A ground-based strong-motion earthquake observation network installed across Japan by the National Research Institute for Earth Science and Disaster Prevention and the system which transmits strong-motion recording data via the Internet.
*2 Gal: Unit of acceleration (1 gal = 1 cm/s2)
The seismic intensity readings shown in Figure 2 are calculated from ground-based observation records. Seismic movements vary not only according to the size of an earthquake and the dis-tance from the epicenter, but also due to ground conditions at the observation point.
To determine whether a building is resistant to earth-quakes, it is important to de-termine not only the response of the building during an earthquake, but the seismic motions which acted upon
the building at the time. This is easy if seismic observations are conducted in buildings. The BRI conducts seismic observations targeting buildings at ap-proximately seventy locations nation-wide with the aim of measuring the earthquake resistance of buildings.
22 23The Japan Journal DECEMBER 2011 The Japan Journal DECEMBER 2011
Figure 2: Distribution of seismic intensity for each region during the main shock
Figure 4: BRI strong motion observation stations in the Tokyo metropolitan area
Figure 3: Records obtained from BRI strong motion observation stations
Vel
oci
ty (
cm/s
)
Time (seconds)
June 12, 1978 Off the Coast of Miyagi Prefecture Earthquake
March 11, 2011 Off the Pacific Coast of Tohoku Earthquake
Figure 5: Comparison of observed waveforms (velocity waveforms) for the same building during the 1978 Earthquake off the Coast of Miyagi Prefecture (blue) and the 2011 Earthquake off the Pacific coast of Tohoku (black)
Pseu
do
Vel
oci
ty R
esp
on
se (
cm/s
)
Period (seconds)
Damping Ratio: 5% Akita Prefectural Office B1FHachinohe City Hall GLIwaki City Hall B1FMiyako City Hall GLNiigata City Hall B1FSendai Government Office Building B2FDesign Level on Bedrock
Pseu
do
Vel
oci
ty R
esp
on
se (
cm/s
)
Period (seconds)
Damping Ratio: 5% Educational Center, Funabashi City GLGyotoku Library, Ichikawa City 01FCentral Government Building No. 6 01FSumida Ward Office B1F37-story High-rise Residential Building, Chuo Ward 01FShinagawa International House, Tokyo University of Marine Science and TechnologyDesign Level on Bedrock
Figure 6: Characteristics of seismic movements in disaster-affected regions (inside buildings). The stated level is exceeded at 2 and 3 seconds into the cycle, but this is not a problematic level.
Figure 7: Seismic motion characteristics at obser-vation stations in the Tokyo metropolitan area (first floors, basement floors or ground surface)

In Japan, strong-motion earthquake observations began in 1953. The BRI has also conducted building observa-tions over a long period that dates back to this time. Figure 3 shows which of the current BRI observation stations record-ed measurements during the 2011 earth-quake. As shown in Figure 4, the obser-vat ion s tat ions are more densely arranged in the Tokyo metropolitan area.
Table 1 shows the instrumental seis-mic intensity and directional peak acceler-ation for the main strong motion stations.
In terms of observed values, observa-tion stations such as Sendai Government
Office Bldg. No. 2 (SND), Tohoku University (THU) and Iwaki City Hall (IWK) show high levels. In particular, the reinforced concrete structure of the Civil Engineering and Architecture build-ing at Tohoku University was damaged and has been rendered unusable. At the time of the 1978 Miyagi earthquake that struck in June 1978, acceleration of more than 1G was recorded on the ninth floor of this building.
Long-lasting Shaking
As mentioned earlier the epicentral area
was large, and since there was a long time from the start to end of rupturing at the epicenter, the shocks felt in all regions continued for longer than ever before.
Table 1 shows the instrumental inten-sity, directional peak acceleration, etc. of the shocks recorded at major observation stations during the 2011 earthquake.
O f t h e s e s t a t i o n s , t h e C i v i l Engineering and Architecture building (ninth floor) at Tohoku University, which recorded a large velocity response during the 1978 off the coast of Miyagi Prefecture earthquake, also obtained a large recording this time. However, from the comparison of their respective velocity waveforms shown in Figure 5 we can see that the 2011 earthquake was much longer than the 1978 earthquake.
In Figure 6, we compared the pseudo velocity response spectra that indicates the cyclical size of seismic motions for buildings in the main disaster-affected regions of Sendai, Iwaki, Miyako and Hachinohe. The observations were re-corded at building ground level, base-ment level or on the ground. For be-tween two and three seconds of the cycle, the observations slightly exceeded the Building Standards Law design spectra level for engineering bedrock, but not by such a large margin. In addi-tion, observations in the long-period areas were not especially large.
Also note that at Miyako City Hall, the government building was inundated to the second floor. Since the recording device for seismological data was on the top floor of the government building, we were able to retrieve the data.
Figure 7 shows the pseudo velocity response spectra indicating the cycli-cal size of seismic motions for the ob-servational data obtained in buildings in the major areas of the Tokyo metro-politan area.
Even in the Kanto region, K-NET and other networks observed extremely strong shaking at some stations in the prefectures of Ibaraki, Tochigi and Chiba.
However, observation values in the Tokyo metropolitan area itself were not that large.
Long-period Seismic Motion
Based on the size of the 2011 earth-quake, strong long-period seismic mo-
24 25The Japan Journal DECEMBER 2011 The Japan Journal DECEMBER 2011
BUILDING RESEARCH INSTITUTE
Code Station Name _ (km) IJMA Loc.Max. Acc. (cm/s2)
H1 H2 V
SND Sendai Government Office Bldg. No. 2 (high-rise) 175 5.2
B2F* 163 259 147
15F 361 346 543
THU Tohoku University Civil Engineering and Architecture Bldg. 177 5.6
01F* 333 330 257
09F 908 728 640
MYK Miyako City Hall 188 4.8
01F 138 122 277
07F 246 197 359
GL* 174 174 240
IWK Iwaki City Hall 210 5.3B1F* 175 176 147
09F 579 449 260
ANX Building Research Institute 330 5.3
A01* 279 227 248
A89 142 153 102
BFE 194 191 136
8FE 597 506 344
MBC 203 206 152
M8C 682 585 311
SIT2 Saitama Shintoshin Government Office Building No.2 Annex (high-rise) 378 4.4
B3F* 74 63 42
10FS 119 138 62
27FS 248 503 107
SITASaitama ShintoshinGovernment Office Building, Public Welfare Building
378 4.5 01F* 90 105 47
NMW National Museum of Western Art (base-isolation) 382 4.8
GL* 265 194 150
B1FW 100 79 84
01FW 76 89 87
04F 100 77 90
CGC Central Government Office Bldg. No.6 (high-rise) 386 4.4
01F* 90 86 45
20B 208 148 173
19C 179 133 130
CG2 Central Government Office Bldg. No.2 (high-rise) 386 4.2
B4F* 75 71 49
13F 137 113 72
21F 121 131 104
CG3 Central Government Office Bldg. No.3 (base-isolation) 386 4.5
B2F* 104 91 58
B1F 55 41 62
12F 94 82 104
NDLA Annex, National Diet Library 387 4.5
B8F 61 88 53
B4F 68 101 56
01F* 76 104 84
04F 125 192 94
SKS Sakishima Office, Osaka Prefecture (high-rise) 770 3.0
01F* 35 33 80
18F 41 38 61
38F 85 57 18
52FN 127 88 13
52FS 129 85 12
Table 1: Main strong motion records obtained by BRI
Note: _: epicentral distance; IJMA : instrumental seismic intensity (calculated from records of acceleration of three components according to JMA method using asterisked sensor); Installation azimuth: clockwise direction from North; H1, H2, V: maximum accelerations in horizontal #1 (Azimuth), horizontal #2 (Azimuth + 90°) and vertical directions. A01: Ground surface A89: 89m underground

tion was predicted, but in fact, this was not seen to a great extent in the Tokyo metropolitan area. In the Osaka Bay area, however, despite being about 770 km from the epicenter, high-rise buildings resonated at an approximate 7-second cycle due to the long-period shaking, and in one case a sway of 260 centimeters was recorded near the top of a building on the fifty-second floor. Note that even in the Tokyo metropoli-tan region, more than a little elevator and non-structural damage in high-rise buildings has been reported.
Damage to Buildings and Homes Due to Seismic Motion
While the 2011 earthquake was of a scale that Japan has never before experi-enced, buildings designed according to the new earthquake resistance standards (earthquake resistance standards intro-duced since June 1981) are believed to have suffered little structural damage. On the other hand, some problems have become clear. Among them the falling of non-structural materials such as ceil-ings was seen even in buildings de-signed according to the new earthquake resistance standards, and many buildings suffered damage in the form of tilting due to widespread ground liquefaction. Investigating the causes and finding so-lutions to these types of damage will be a major challenge in the future.
Damage to Wooden Buildings
BRI conducted a survey of damage to wooden buildings in Miyagi, Fukushima, Tochigi and Ibaraki prefectures, includ-ing in the city of Kurihara, Miyagi Prefecture, where intensity level 7 on the
seismic intensity scale was recorded. As a result, BRI confirmed significant damage in areas such as the cities of Osaki in Miyagi P r e f e c t u r e a n d S u k a g a w a i n Fukushima Prefecture, the town of Nasu in Nasu-gun, Tochigi Prefecture and the cities of Hitachiota and Naka in Ibaraki Prefecture. On the o t h e r h a n d , i n Kur iha ra , Miyag i Prefecture, which re-corded level 7 on the s e i s m i c i n t e n s i t y scale, the damage was not so great compared with the instrumental seismic intensity that was recorded.
T h e t y p e s o f d a m a g e o b s e r v e d due to seismic move-ment of the 2011 earthquake can be broadly categorized as either “damage attributable to shaking due to seismic motion” and “damage attributable to ground deformation.”
As forms of damage due to seismic
motion, this includes roofing tile dam-age such as falling bricks or tiles, dam-age to interior materials and exterior walls (Photo 2), tilted buildings and story collapses (Photo 3). These forms of damage are largely consistent with the damage seen in past earthquakes.
As for damage due to ground defor-mation, multiple cases of damage to foundations and wall surfaces associated with the breaking up of the ground or re-taining walls and the tilting or collapse of buildings were observed. In addition, since we observed many cases of signifi-cant damage on residential land built upon lowland swamp or filled-in rice paddies, we believe it is possible that the soft ground amplified the seismic motion.
Damage to Buildings of Steel Frame Construction
BRI conducted an exterior survey of damage to general buildings of steel frame construction such as office build-ings in Miyagi, Fukushima and Ibaraki Prefectures. In addition, BRI conducted damage surveys of structures such as school gymnasiums designed according to the old earthquake resistance standards
24 25The Japan Journal DECEMBER 2011 The Japan Journal DECEMBER 2011
Miyako City
Yamada Town
Tono City
Kurihara City
Nasu Town
Urayasu City
Sakae Town
Shimotsuma City
Furukawa City
Bando City
Joso City
Tsuchiura City
Ryugasaki City
Yaita City
Shirosato Town
Kasama City
Chikusei City
Hiraizumi Town
Kitakami City
Otsuchi Town
Kamaishi City
Ofunato City
Rikuzentakata City
Kesennuma City
Minamisanriku Town
Ishinomaki City
Onagawa Town
Higashi Matsushima City
Matsushima Town
Shiogama CityShichigahama Town
Tagajo City
Sendai City
Natori City
Iwanuma CityWatari Town
Yamamoto Town
Shiroishi CityFukushima City
Nihonmatsu City
Miharu TownKoriyama CitySukagawa CityShirakawa City
Hitachiota City
Hitachi City
Naka City
Hitachinaka City
Mito City
Oarai Town
Omitama City
Hokota CityKashima City
Itako City
Kamisu City
Inashiki City Surveyed cities and towns
Figure 8: Location of surveyed cities and towns
Photo 1: Mid-story collapse in a low-rise building
Photo 2: Fallen parts of exterior walls
Photo 3: First-floor story collapse

across a widespread area in Ibaraki Prefecture where intensity 5-upper to 6-upper shocks were observed.
In the exterior survey damage to general buildings of steel frame con-struction, we observed several cases of damage to the bracing structures of buildings such as parking lots, such as buckling of the bracing materials or damage to the bracing joints. Damage to the exposed column bases of parking lots was also observed (Photo 4). In the scope of this survey, no cases of critical damage such as fracture of major struc-tural components like columns and beams were observed.
In the damage survey of school gym-nasiums, etc. in Ibaraki Prefecture, we observed (i) buckling and fracture of ver-tical braces and fracture of joints (Photo 5); (ii) buckling in the diagonal bracing of lattice columns (Photo 6); (iii) damage to the joints between reinforced concrete columns and the roof (bearing support parts); (iv) curvature, buckling and frac-
ture of roof horizontal bracing; (v) crack-ing of column base concrete; and (vi) other damage (overturning of floor strut, etc.). However, the proportion of struc-tures that suffered significant structural damage such as fractured vertical bracing or joint fractures can be considered low compared with the results*1 of a similar survey conducted at the time of the 2004 Mid-Niigata Prefecture Earthquake.
Damage to Reinforced Concrete Buildings, etc.
We conducted a damage survey of reinforced concrete (RC) buildings and steel reinforced concrete (SRC) buildings, mainly in the urban areas of regions where stations recorded seismic intensities of 6-lower and over in Iwate, Miyagi, Fukushima and Ibaraki Prefectures.
Considering the large seismic in-tensities observed in each area, we gen-erally found that structural damage was not so heavy. However, in areas such as Wakabayashi Ward in Sendai and the city of Sukagawa on land that was once rice paddies and moats, a relative-ly higher concentration of structural damage was seen. Based on this, we believe it is possible that ground condi-tions had something to do with the damage that occurred.
Most of the structural damage seen in this survey was largely consistent with earthquake damage observed in the past. For instance, major damage such as mid-floor collapses in low-rise buildings (Photo 1), first-floor collapses (Photo 7) of soft first-story piloti structures and column shear failure due to loss of verti-cal load carrying capacity (Photo 8) also occurred, but most of the structures
which suffered damage were buildings designed according to the old earthquake resistance standards. On the other hand, very few buildings designed according to the current earthquake resistance stan-dards suffered damage, although in some SRC buildings, damage such as buckling in the main reinforcements near base plates at the bottom of columns, shear cracks at the beam-column joints or hori-zontal cracks at the concrete placing joints were seen. At housing complexes in particular, we also observed many cases where shear failure occurred with non-structural walls around entrances and veranda-side mullion walls (Photo 9), and this occurred irrespective of whether old or current earthquake resistance stan-dards had been adopted.
In the 2011 earthquake, despite the fact that there was relatively less major structural damage, we did see cases where public buildings such as city halls constructed according to the old earth-quake resistance standards had suffered damage to the extent that they could not
26 27The Japan Journal DECEMBER 2011 The Japan Journal DECEMBER 2011
BUILDING RESEARCH INSTITUTE
Photo 4: Damage to exposed column bases
Photo 7: Floor collapse on the first floor of a piloti structure
Photo 5: Buckling of bracing materials and joint fracture
Fracture
Buckling
Photo 8: Shear failure
Photo 6: Buckling of diagonal bracing of lattice columns (part shown with yellow dotted line)
Buckling

be used. These buildings are supposed to function as bases of operation during an emergency, and the loss of those functions may serve to again highlight the need for earthquake retrofitting.
Damage to Residential Land and Ground
In the 2011 earthquake, building dam-age due to ground liquefaction occurred mainly in the bay area of the Kanto re-gion. In our survey, we observed the widespread occurrence of damage such as sand boiling and ground deformation associated with liquefaction in the allu-vial plain area along the Tone river on the border between Ibaraki and Chiba Prefectures and in the city of Urayasu, Chiba Prefecture. Buildings with severe tilting (Photo 10) were also seen, but within the scope of our survey, we did not observe cracked or damaged founda-tions from the exterior.
In Miyagi, Fukushima and Tochigi Prefectures, significant damage (Photo 11) associated with sliding of the soil oc-curred mainly in developed housing areas (at their periphery in particular). In some areas we saw that deformation occurred again on developed land that had been damaged by past earthquakes. There was also a case on residential land which suffered significant damage where the soil under the foundations had slid away, but where the foundations were still holding together.
Damage to Nonstructural Components
In buildings which did not suffer major
structural damage such as story collapse, damage to exterior walls, curtain wall structures, openings and other non-structural materials was observed.
We observed extensive damage as-sociated with exterior walls and curtain wall structures, including the shedding of exterior tiles from RC walls and the dropping of things like outer wall panels (Photo 12). We observed many buildings in which the glass from glass openings had broken. In gymnasiums, interior materials had been damaged or had fall-en from the interior walls of the arena, and from the interior materials above the stage. The ceilings of gymnasiums built using a variety of construction tech-niques were also damaged, with the se-verity of damage ranging from small-scale damage along the edges to large-scale damage where entire ceilings fell down. At an airport terminal building where the lobby ceiling had fallen down (Photo 13), we observed that the layout of the roof and ground below was un-even and complicated.
As for damage to non-structural components, those built with relatively old construction methods suffered the most damage, and we also observed that non-structural components placed
higher suffered relatively more damage and falling.
Concluding Remarks
Considering the size of the earthquake and the instrumental seismic intensity recorded at various locations, the damage to building structures due to seismic movement was relatively little. However, the degree of damage to buildings designed according to the old earthquake resistance standards was greater. Looking ahead, it will be neces-sary to review technical standards, in-cluding measures to deal with ceiling collapses and ground liquefaction, which became significant problems in the 2011 earthquake.
Finally, we would like to express our deepest condolences to those who lost their lives in the tsunami and earth-quake and to their families, and offer our heartfelt sympathies to everyone affected by the disaster.
Note: *1 NILIM/BRI: Report on the Damage Investigation of Buildings Due to the Mid Niigata Prefecture Earthquake in 2004, pp.305–353, October, 2006 (in Japanese)
26 27The Japan Journal DECEMBER 2011 The Japan Journal DECEMBER 2011
Photo 10: Tilting due to liquefaction
Photo 12: Fallen exterior wall panels
Photo 8: Shear failurePhoto 11: Damage due to a landslide from a sloped edge
Photo 13: Fallen ceiling at an airport departure lobby (yellow dotted line indicates where the ceiling droppage occurred)
Photo 9: Non-structural shear failure