BUILDING QUALITY PAVEMENTS Smoothness - … · · 2008-11-26measure pavement profile (IRI),...
46
BUILDING QUALITY PAVEMENTS Smoothness
Transcript of BUILDING QUALITY PAVEMENTS Smoothness - … · · 2008-11-26measure pavement profile (IRI),...

BUILDING QUALITY PAVEMENTS
Smoothness
ASTM Definition of Roughness
“The deviations of a pavement surface from a true planar surface with characteristic dimensions that affect vehicle dynamics……”

Pavement Smoothness is a lack of roughness

National Customer Survey
Pavement Condition (smoothness) 36%
Safety 22%
Traffic Flow 16%
Visual Appeal 11%
Bridge Condition 6%
Maintenance Response Time 6%
Travel Amenities 3%

SMOOTHNESS AND PAVEMENT SERVICE RATING
NHI Model (1993 AASHTO)PSR= K e (-0.0041*IRI)
0
1
2
3
4
5
0 50 100 150 200 250 300
IRI
PSR
GOOD
POOR

CONDITION INTERSTATES NHS RHS AND SHS
Excellent IRI 70 IRI 75 IRI 75
Good IRI = 71 – 100 IRI = 76 –110 IRI = 76 –125
Fair IRI = 101 – 170 IRI = 111 – 200 IRI = 126 – 225
Poor IRI = 171 – 225 IRI = 201 – 250 IRI = 226 – 300
Very Poor IRI 226 IRI 251 IRI 301
CLASSIFICATION OF HIGHWAYS
BASED ON IRI
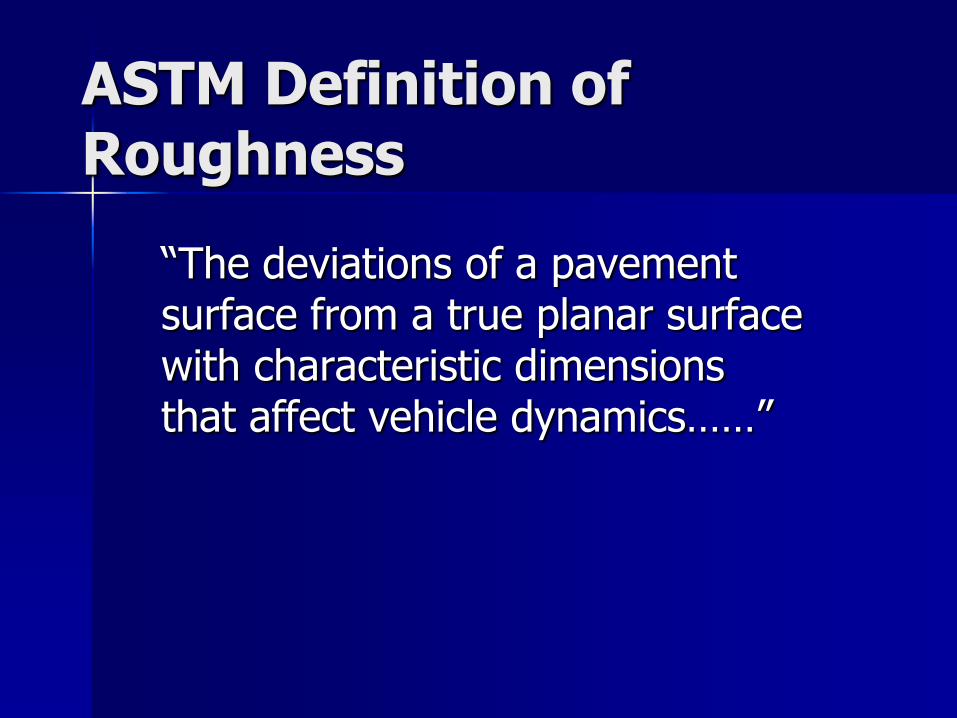
Roughness Condition Statewide From1995 To 2007
0
2000
4000
6000
8000
10000
12000
14000
16000
18000
Cen
terl
ine M
iles
1995
1998
2000
2003
2005
2007
Year
EXCELLENT
GOOD
FAIR
POOR TOV.POOR

Current ROUGHNESS DISTRIBUTION
0
200
400
600
800
1000
1200
1400
1600
1800
0-7
5
75-1
00
100-1
25
125-1
50
150-1
75
175-2
00
200-2
25
225-2
50
250-2
75
275-3
00
300-3
25
325-3
50
350-3
75
375-4
00
400-4
25
425-4
50
450-4
75
475-5
00
500-5
25
525-5
50
Roughness (IRI)
Cen
terl
ine m
iles
SHS RHS NHS 'INTERSTATE
Note: Distribution calculated from tenth of a mile records with no invalid IRI readings
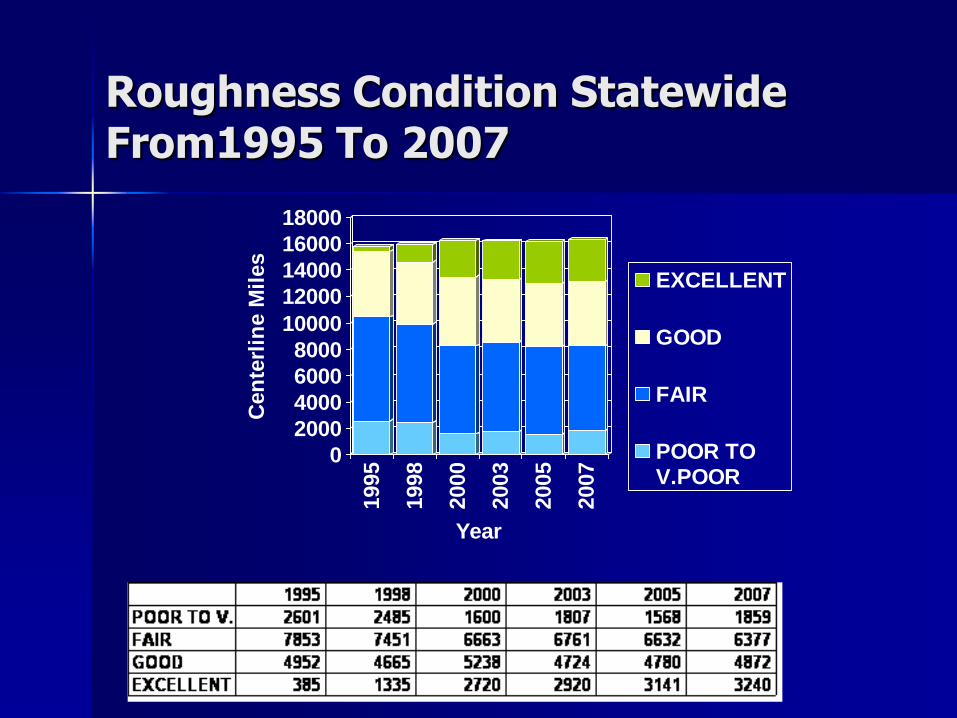
Purposes for Smoothness Measurements
Maintain construction quality
Locating abnormal changes in the highway
– subsurface problems, drainage,construction deficiencies
Allocation of road maintenance resources
Pavement serviceability performance and design
Smoothness Measurements
History

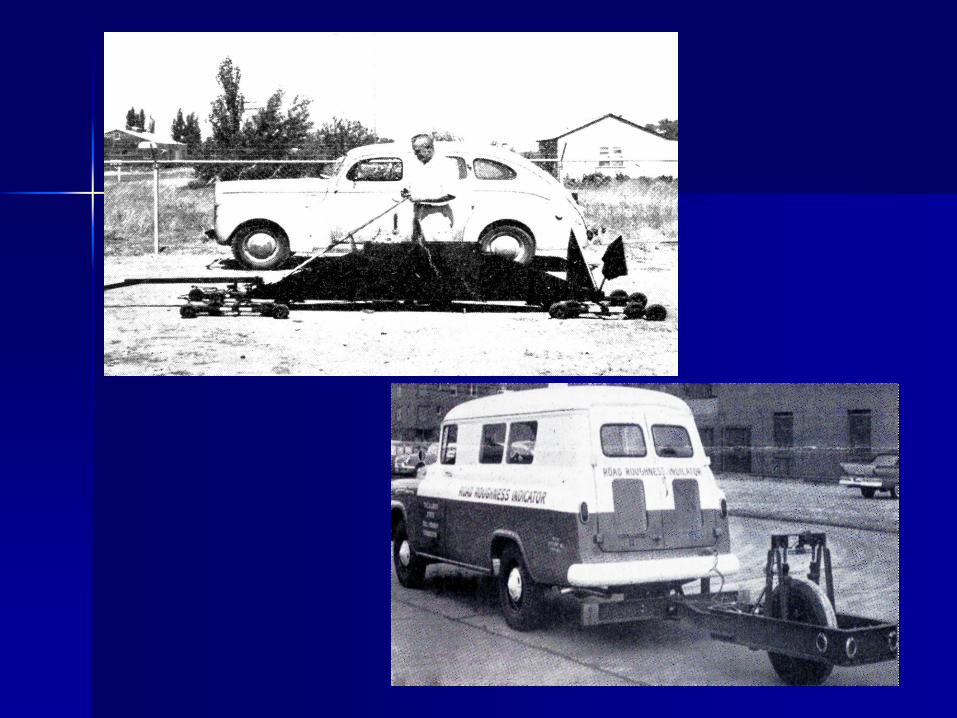
Methods
Rolling Straightedge
Ride Number (AASHO Road Test)
BPR Roughometers
Mays Ride Meter
California Type Profiler (PI), La Specs since early eighties
Inertial type Profilers (RN,PI, IRI)
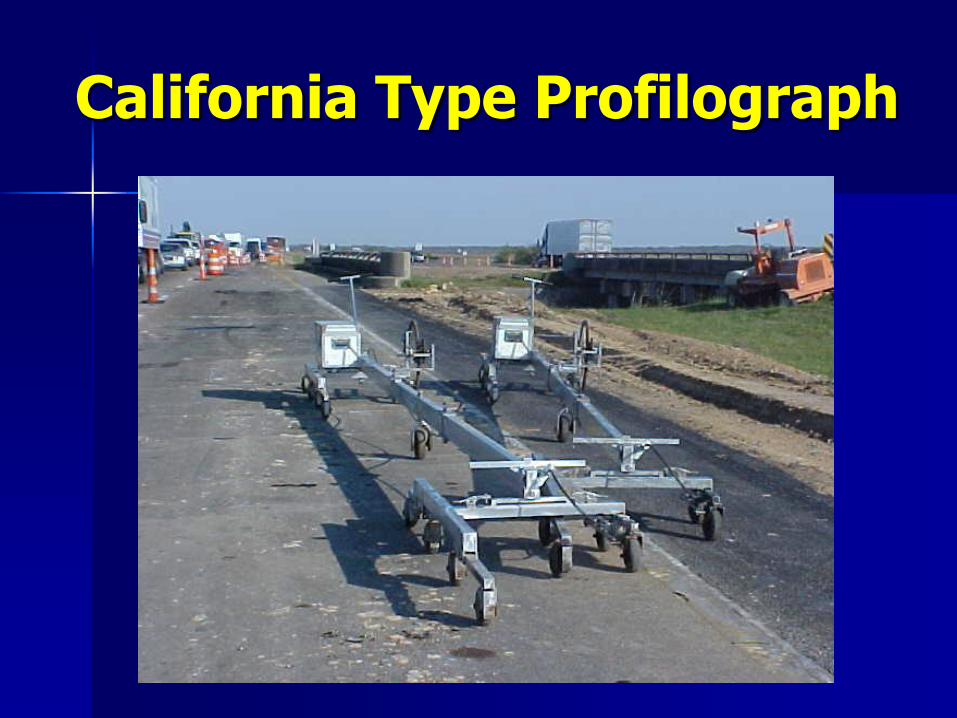
California Type Profilograph
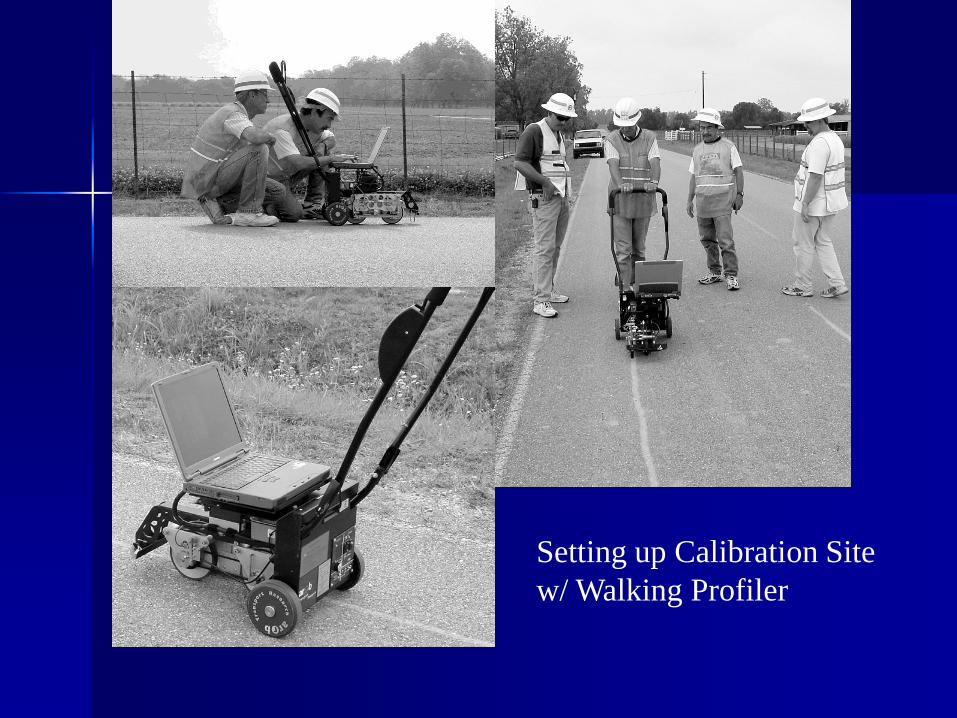
Setting up Calibration Site
w/ Walking Profiler

Smoothness Specifications
(PI) Profile Index w/0.2” Blanking Band
(IRI) International Roughness Index
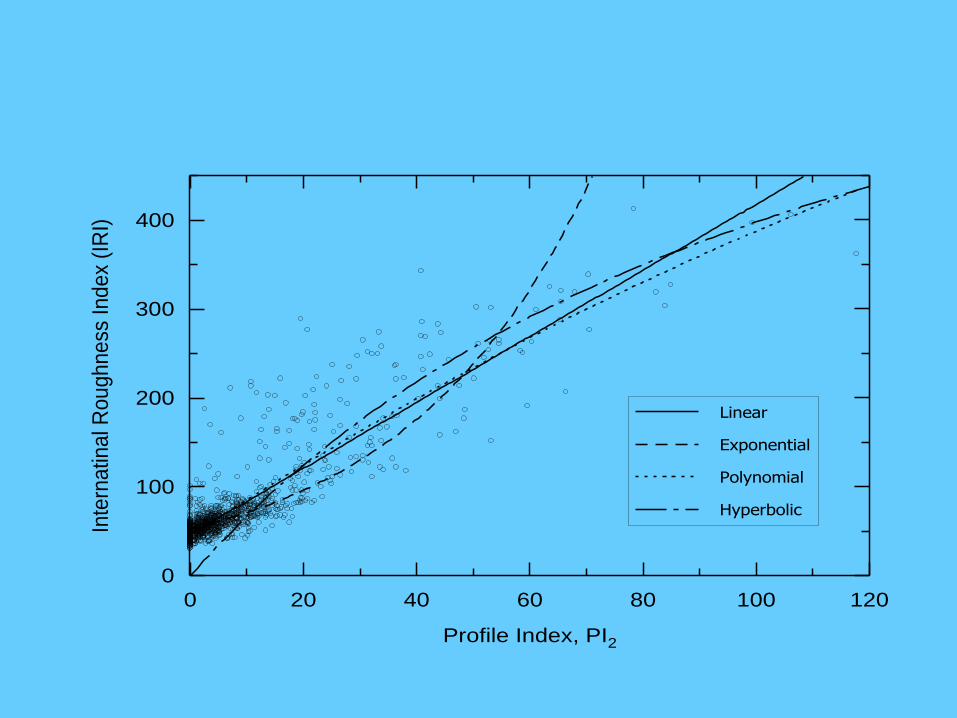
0 20 40 60 80 100 120
Profile Index, PI2
0
100
200
300
400
Inte
rna
tina
l Ro
ug
hn
ess
In
de
x (I
RI)
Linear
Exponential
Polynomial
Hyperbolic

(IRI) + (IRI)
Linear function: IRI = 52.8+5.51(PI2) (R2= 0.94)
Polynomial function: IRI =61.18+2.61(PI2)+ 0.151(PI2)2 (R2= 0.96)
Exponential function: IRI = 60.19 e0.0531(PI2) (R2= 0.96)
0 2 4 6 8 10 12 14 16 18 20
Profile Index with 0.2 in Blanking Bandwidth, PI2
40
60
80
100
120
140
160
180
200In
tern
atio
na
l R
ou
gh
ne
ss I
nd
ex,
IRI
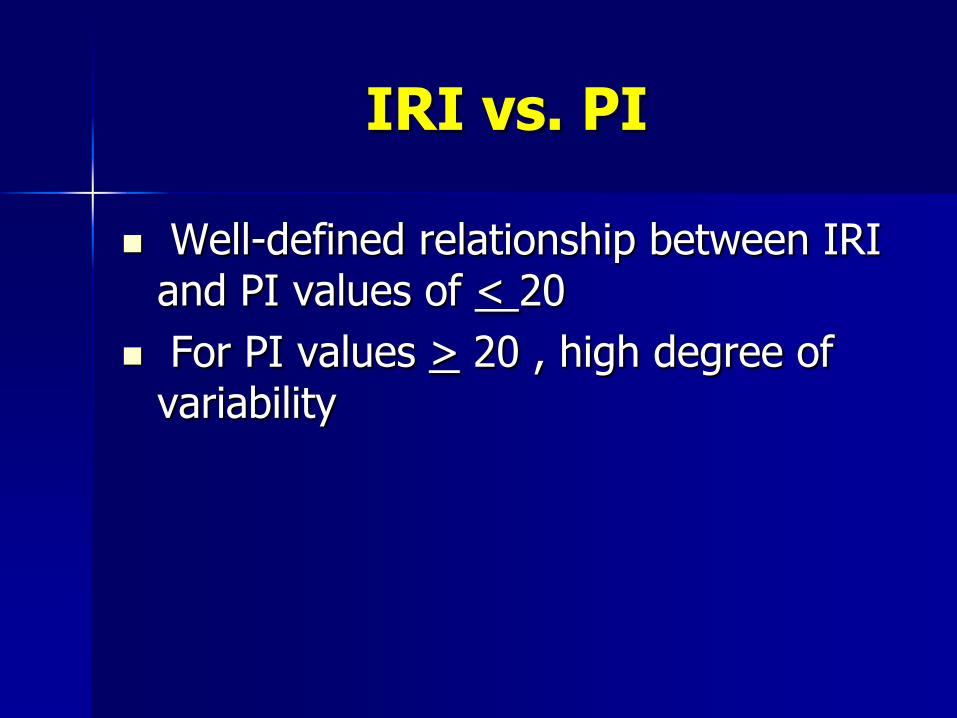
IRI vs. PI
Well-defined relationship between IRI and PI values of < 20
For PI values > 20 , high degree of variability

IRI = 97 in./mile
PI = 0.0 in./mile
Old Spec (PI) vs. New Spec (IRI)

Deficiencies with PI System (Manual)
Labor Intensive, Slow, Safety?
Blanking Band Filtering out Roughness
PI does not represent the “ride” of the Roadway
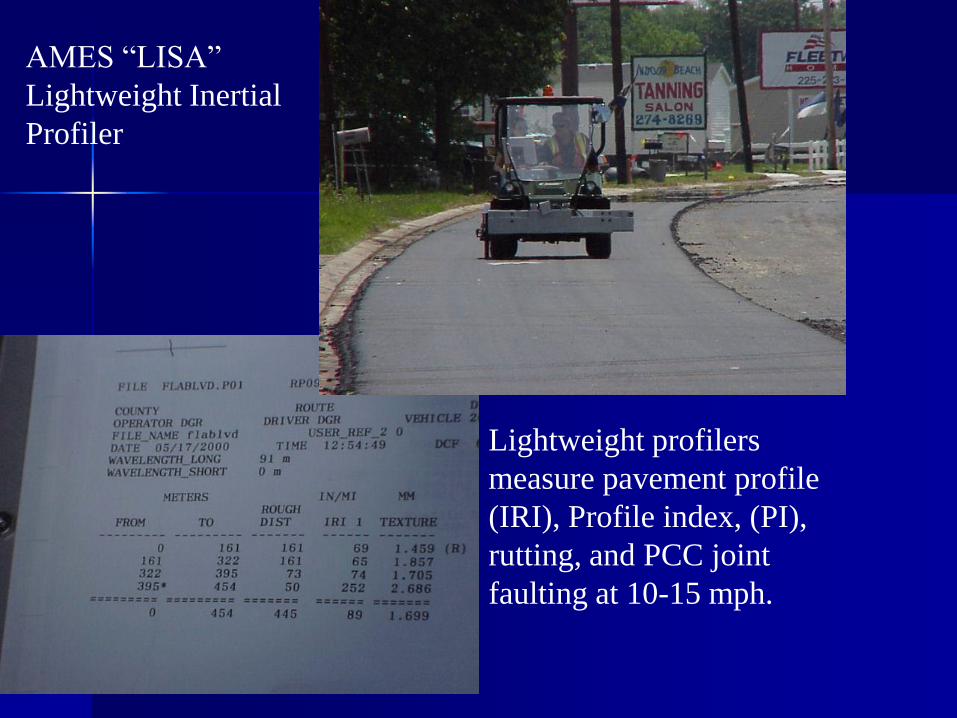
AMES “LISA”
Lightweight Inertial
Profiler
Lightweight profilers
measure pavement profile
(IRI), Profile index, (PI),
rutting, and PCC joint
faulting at 10-15 mph.
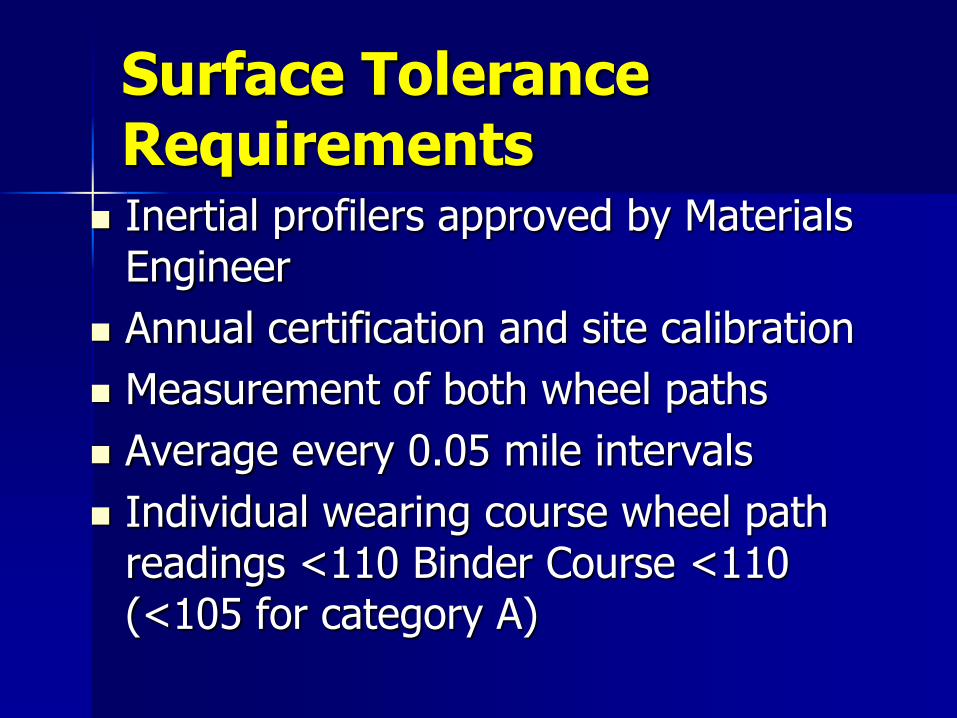
Surface Tolerance Requirements
Inertial profilers approved by Materials Engineer
Annual certification and site calibration
Measurement of both wheel paths
Average every 0.05 mile intervals
Individual wearing course wheel path readings <110 Binder Course <110 (<105 for category A)
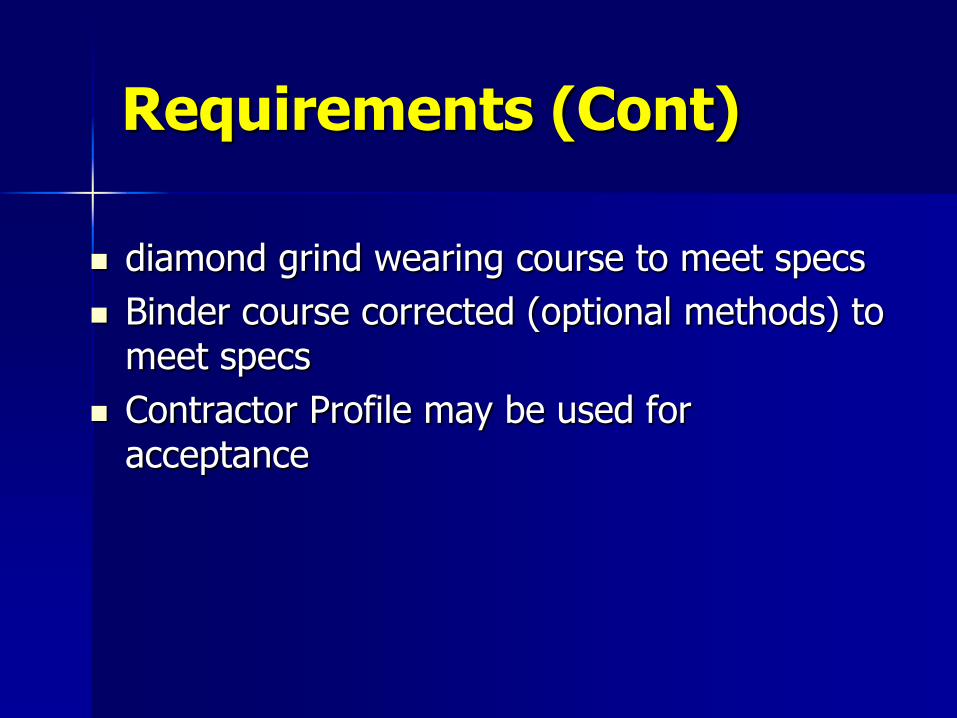
Requirements (Cont)
diamond grind wearing course to meet specs
Binder course corrected (optional methods) to meet specs
Contractor Profile may be used for acceptance

IRI = 195 In. / Mile
IRI = 100 In. / Mile
Project IRI = 53 In. / Mile
Example of Louisiana Bump Specification
Sublot IRI = 60 In. / Mile

Louisiana Specifications, Flexible Pavements
Percent of Contract Unit
Price (by Sublot)1
103%2 100% 90% 80% 50%
or Remove3
Category A Multi-Lift New Construction and Overlays of
More than two Lifts and all Interstates
<55
(<870)
<65
(<1030)
65-75
(1030-
1180)
NA>75
(>1180)
Category B One or Two Lift Overlays Over Cold Planed
Surfaces, and Two-Lift Overlays Over
Existing Surfaces4
<65
(1030)
<75
(<1180)
75-89
(1180-
1400)
NA>89
(>1400)
Category C Single-Lift Overlays Over Existing Surfaces
<75
(<1180)
<85
(<1340)
85-95
(1340-
1500)
>95-110
(>1500-
1740)
>110
(>1740)
Incentive Pay, Final Completion, Average of
All Travel Lanes5 ≤45 (≤710)
1or portion of sublot placed on the project.2Maximum payment for sublots with exception areas, exclusions or grinding is 100 percent.3At the option of the engineer.4Also applies to two-lift overlays on reconstructed bases without profile grade control.5Only Category A projects with no grinding are eligible for incentive.
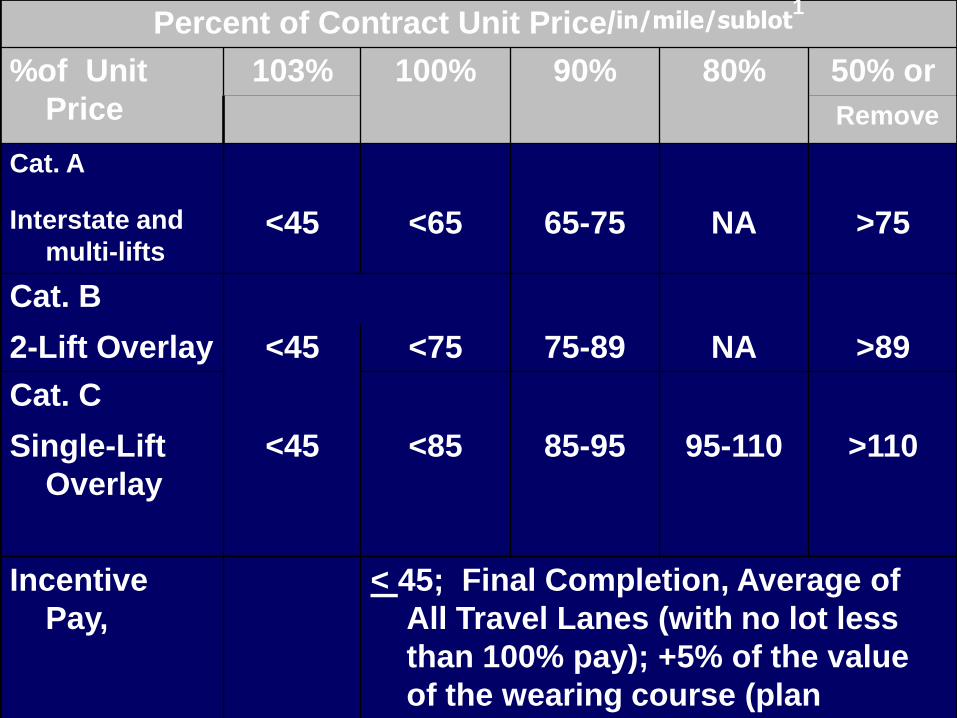
Percent of Contract Unit Price/in/mile/sublot1
%of Unit
Price
103% 100% 90% 80% 50% or
Remove
Cat. A
Interstate and
multi-lifts<45 <65 65-75 NA >75
Cat. B
2-Lift Overlay <45 <75 75-89 NA >89
Cat. C
Single-Lift
Overlay
<45 <85 85-95 95-110 >110
Incentive
Pay,
< 45; Final Completion, Average of
All Travel Lanes (with no lot less
than 100% pay); +5% of the value
of the wearing course (plan
quantities)

Development of IRI Specifications forPCCP
LTRC Pavement Group
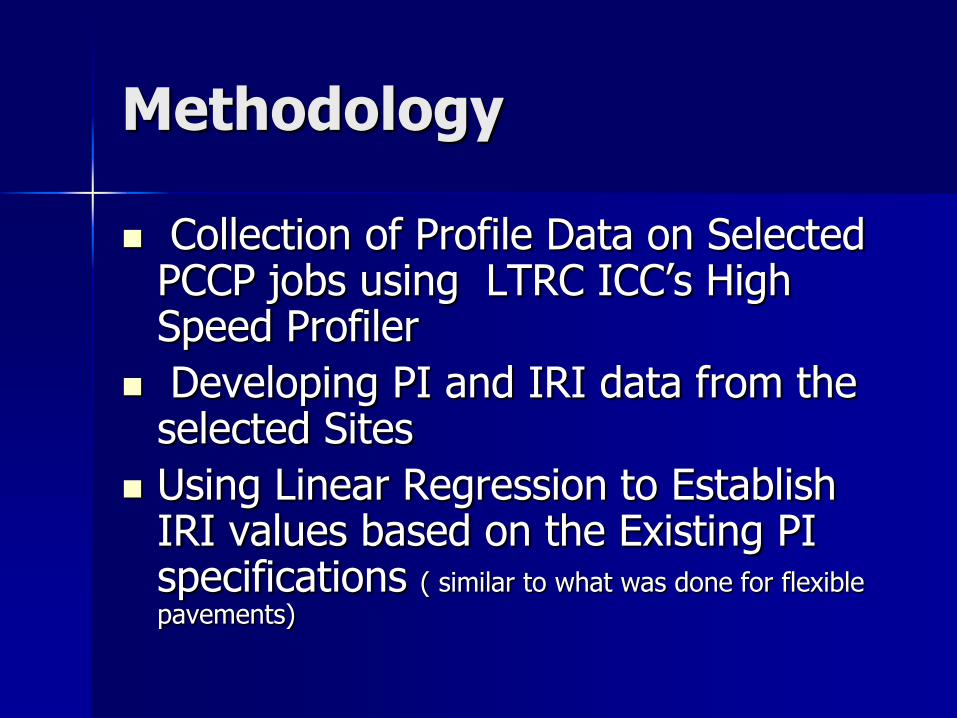
Methodology
Collection of Profile Data on Selected PCCP jobs using LTRC ICC’s High Speed Profiler
Developing PI and IRI data from the selected Sites
Using Linear Regression to Establish IRI values based on the Existing PI specifications ( similar to what was done for flexible pavements)

PCC Sample Projects
Project Description IRI PI
LA 14, ERATH-DELCAMBRE, SP# 056-06-0049
70 6
I-12, TANGIPAHOA PARISH, SP# 45403-0028 (WB-OWP)
58 1
LA 447, SP# 26801-0012, WALKER 113 18
NORTHLINE ROAD (ALF RD) 64 4

IRI & PI (each 0.05 mi. seg)
IRI & PI
y = 2.5104x + 64.124
40
60
80
100
120
140
160
180
200
0 10 20 30 40 50 60
PI ( in/mile)
IRI (i
n/m
ile
)

Initial JCP IRI; In/mile
0
50
100
150
200
250
300
350
Fre
q.
(0.0
5 m
i. s
eg
.)
60 80 100 120 140 160 180 200
IRI
20%
38%
24%
12%
5%
1% 0%

PCC Smoothness Index Category
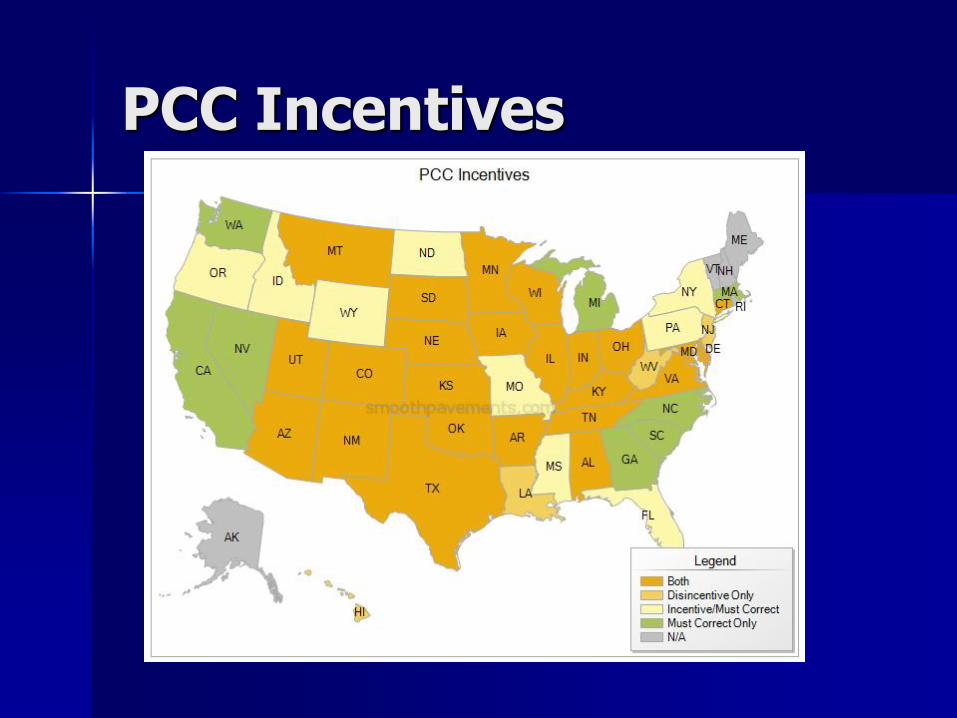
PCC Incentives
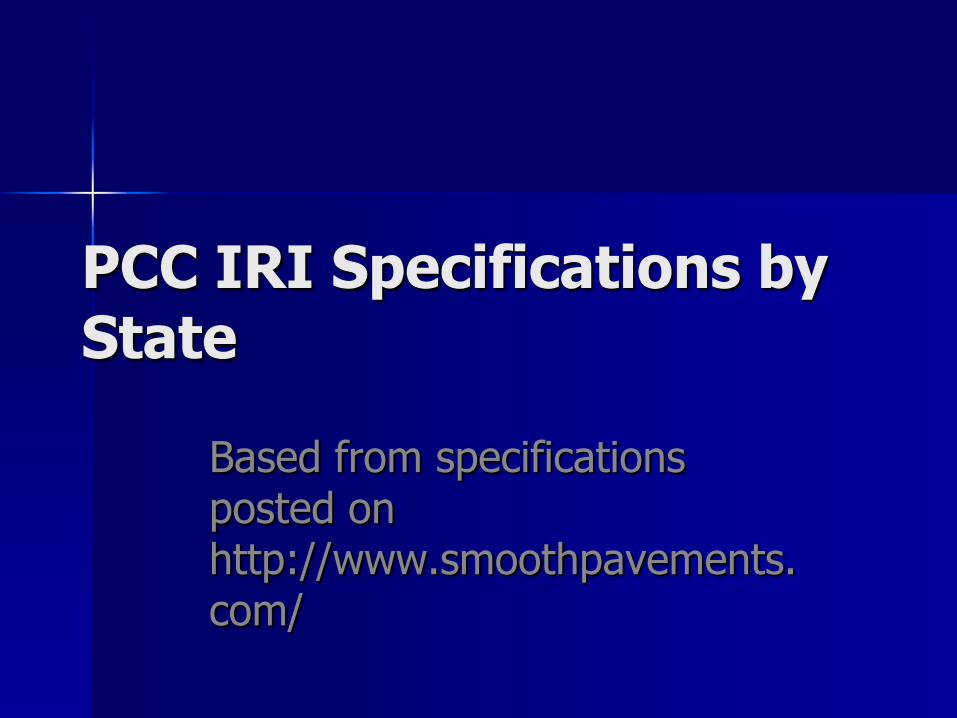
PCC IRI Specifications by State
Based from specifications posted on http://www.smoothpavements.com/
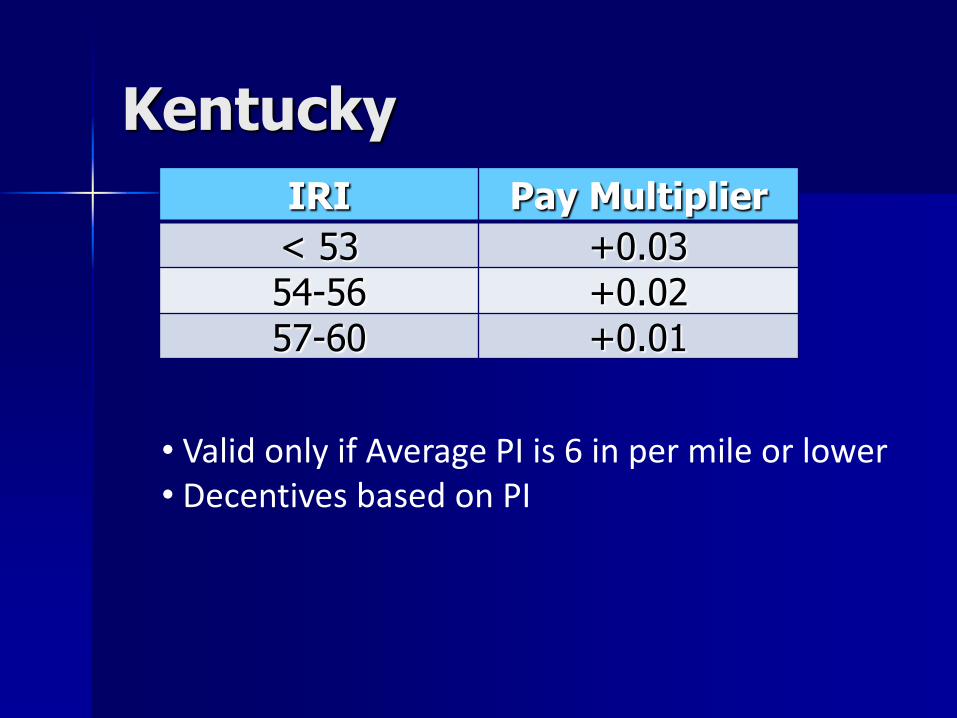
Kentucky
IRI Pay Multiplier
< 53 +0.03
54-56 +0.02
57-60 +0.01
• Valid only if Average PI is 6 in per mile or lower• Decentives based on PI

Maryland
Rating InterstatesPrincipal Arterials
Very good < 60 < 60
Good 60 - 94 60 - 94
Fair 95 - 119 95 - 170
Mediocre 120 - 170 171 - 220
Poor > 170 > 220
•Pay increase and decrease based on IRI rating through multiple equations

Michigan
Speeds greater than
50 mphSpeeds 30 -
50 mph
Condition
0 - 75 0 - 125 Acceptable
> 75 > 125 Correction

New Mexico Interstate &
NH non-NHPay
Multiplier
< 52.2 < 49.6 110%
52.3 - 53.2 49.6 - 50.9 109%
… … …
60.3 - 61.3 59.9 - 61.1 101%
61.4 - 62.3 61.2 - 62.4 100%
62.4 - 63.2 62.5 - 63.8 99%
… … …
71.8 - 72.8 74.7 - 76 90%
> 72.8 > 76 Correction
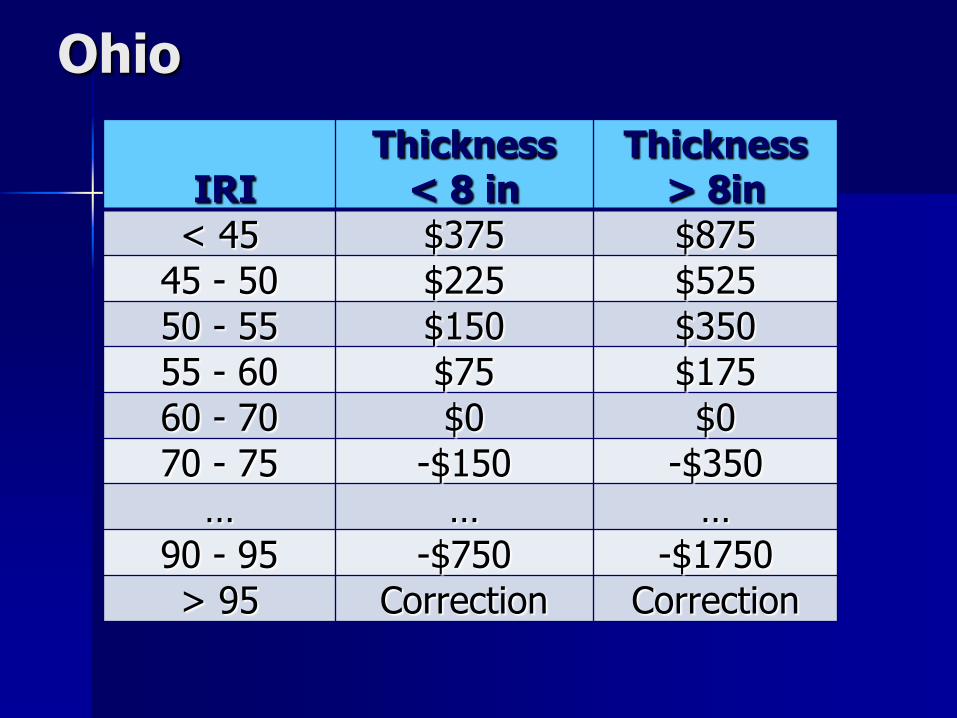
Ohio
IRIThickness
< 8 inThickness
> 8in
< 45 $375 $875
45 - 50 $225 $525
50 - 55 $150 $350
55 - 60 $75 $175
60 - 70 $0 $0
70 - 75 -$150 -$350
… … …
90 - 95 -$750 -$1750
> 95 Correction Correction
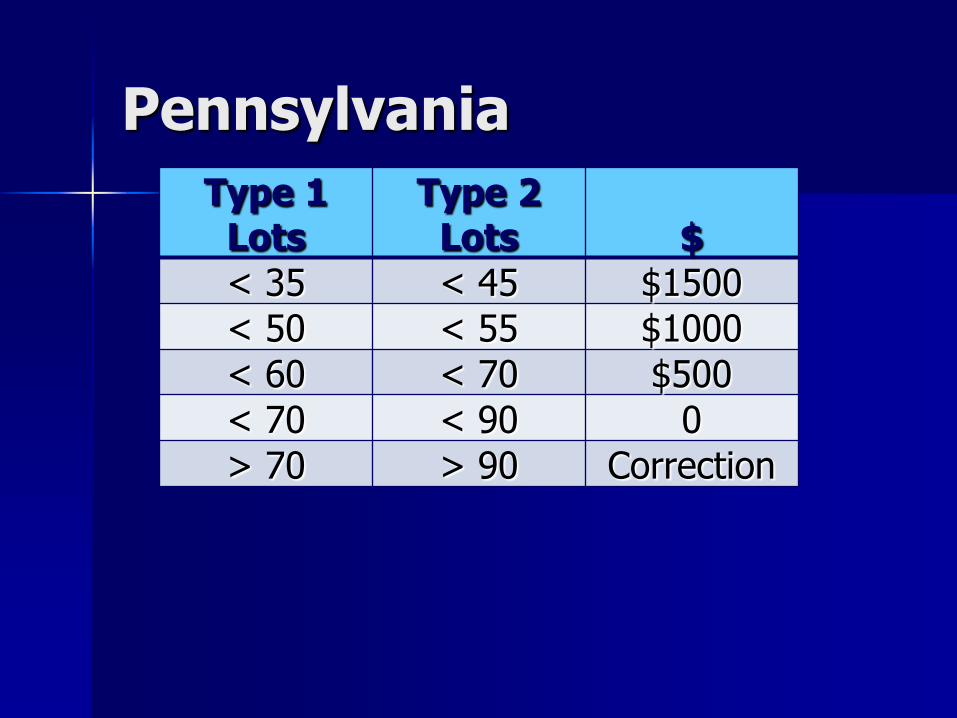
Pennsylvania
Type 1 Lots
Type 2 Lots $
< 35 < 45 $1500
< 50 < 55 $1000
< 60 < 70 $500
< 70 < 90 0
> 70 > 90 Correction
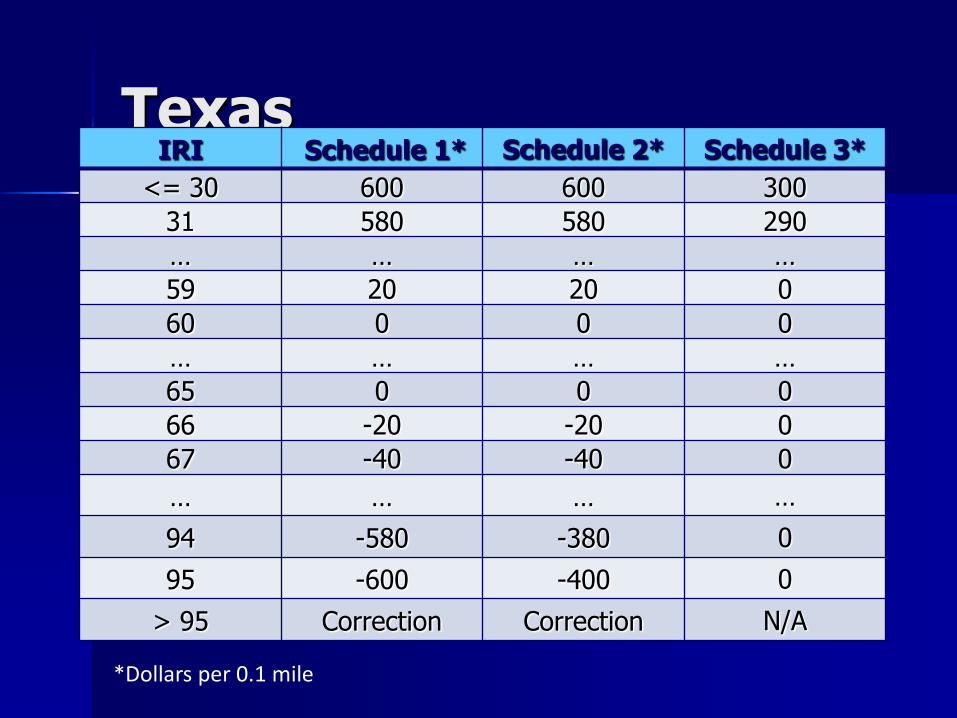
TexasIRI Schedule 1* Schedule 2* Schedule 3*
<= 30 600 600 300
31 580 580 290
… … … …
59 20 20 0
60 0 0 0
… … … …
65 0 0 0
66 -20 -20 0
67 -40 -40 0
… … … …
94 -580 -380 0
95 -600 -400 0
> 95 Correction Correction N/A
*Dollars per 0.1 mile

WisconsinCategory I $ Category II $
< 25 250 < 50 250
25 - 35875 - (25 x
IRI) 50 - 653250/3 –
(50/3 x IRI)
35 - 55 0 65 - 105 0
55 - 1205500/13 –
(100/13 x IRI) 105 - 1203500 –
(100/3 x IRI)
> 120 -500 > 120 -500
Category III $
< 50 250
50 - 653250/3 –
(50/3 x IRI)
> 65 0

VirginiaIRI Pay Multiplier
< 45 105%
45.1 - 55 103%
55.1 - 70 100%
70.1 - 80 90%
80.1 - 90 80%
90.1 - 100 70%
> 100 Correction
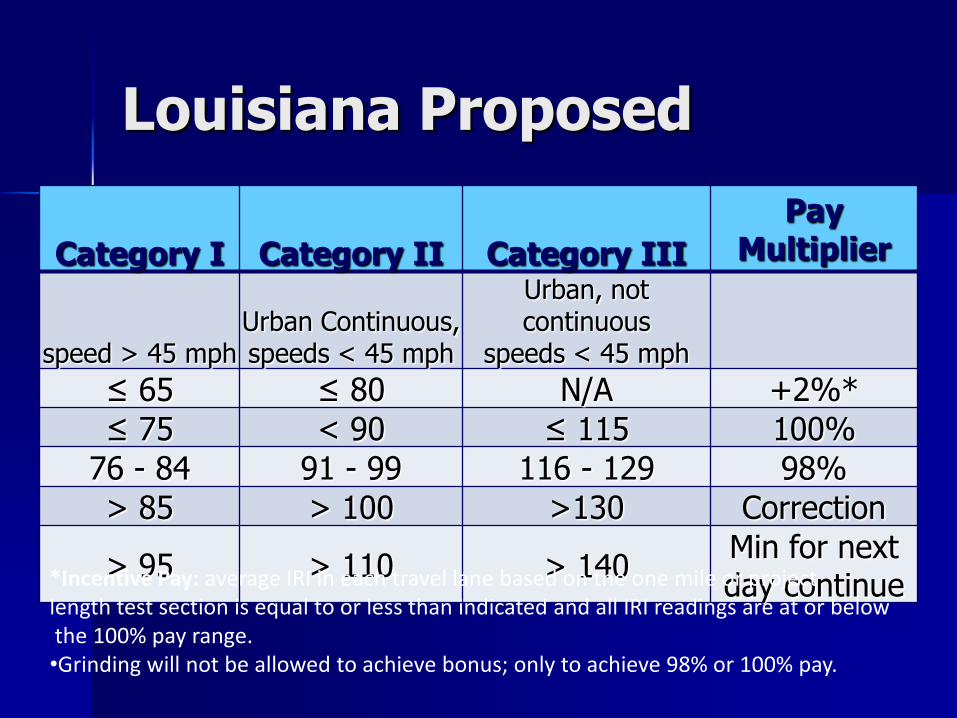
Louisiana Proposed
Category I Category II Category III
Pay Multiplier
speed > 45 mphUrban Continuous, speeds < 45 mph
Urban, not continuous
speeds < 45 mph
≤ 65 ≤ 80 N/A +2%*
≤ 75 < 90 ≤ 115 100%
76 - 84 91 - 99 116 - 129 98%
> 85 > 100 >130 Correction
> 95 > 110 > 140Min for next day continue*Incentive Pay: average IRI in each travel lane based on the one mile or project
length test section is equal to or less than indicated and all IRI readings are at or belowthe 100% pay range. •Grinding will not be allowed to achieve bonus; only to achieve 98% or 100% pay.
The Bottom Line
Every phase of construction is a new opportunity to achieve a smoother and flatter road.build smoother bases.
Roadway maintenance will decline
Our customers get what they asked for, a smooth ride.
The Bottom Line is a Straight Line
Every phase of construction is a new opportunity to achieve a smoother road
Roadway maintenance will decline
Our customers get what they asked for, a smooth ride.