Locational Carbon Footprint and Renewable Portfolio Standards

Building Performance Standards: Lessons from Carbon Policy A
Building Performance Standards: Lessons from Carbon PolicyVéronique Bugnion and Karen Palmer
Report 20-13October 2020

Building Performance Standards: Lessons from Carbon Policy i
About the Authors Véronique Bugnion has a PhD in Climate Physics and an MSc in Technology and Policy from MIT, she teaches Climate Finance at Johns Hopkins. Dr. Bugnion is the CEO ClearlyEnergy, provider of energy and climate data solutions to the real-estate and finance industries. ClearlyEnergy develops software solutions to help municipalities, home and building owners understand the energy and climate footprint of its building stock and find the smartest savings opportunities. ClearlyEnergy also analyzes the greenhouse gas impacts of corporate, municipal, sovereign and multinational green bonds. Prior to ClearlyEnergy, Dr. Bugnion founded PointCarbon North America, which was acquired by Thomson Reuters.
Karen Palmer is a senior fellow and the director of the Future of Power Initiative at Resources for the Future. Dr. Palmer specializes in the economics of environmental regulation and public utility regulation, particularly on issues at the intersection of climate policy and the electricity sector. Her work seeks to improve the design of incentive-based environmental and technology regulations that influence the electric utility sector and to help inform the ongoing transition of the electricity sector. To these ends, she explores new designs for policies targeting carbon emissions, analyzes efficient ways to promote use of renewable sources of electricity and energy efficiency and investigates market and regulatory reforms to pave the way for long-term de-carbonization of electricity supply and electrification of the energy economy. She is co-author of the book, Alternating Currents: Electricity Markets and Public Policy, published by RFF Press.
Acknowledgements The authors would like to thank Kristian Hoffland (District of Columbia), Kevin Keene (PNNL), David Hsu (MIT), Amir Roth (DOE), Benjamin Silverman (City of Boston), Burcin Unel (NYU IPU), Margaret Walls (RFF), and Kathryne Cleary (RFF) for helpful insight and feedback on this report. Any remaining errors or omissions are the exclusive responsibility of the authors.
Cover photo: taka1022 / Shutterstock

Resources for the Future ii
About RFFResources for the Future (RFF) is an independent, nonprofit research institution in Washington, DC. Its mission is to improve environmental, energy, and natural resource decisions through impartial economic research and policy engagement. RFF is committed to being the most widely trusted source of research insights and policy solutions leading to a healthy environment and a thriving economy.
The views expressed here are those of the individual authors and may differ from those of other RFF experts, its officers, or its directors.
Sharing Our WorkOur work is available for sharing and adaptation under an Attribution-NonCommercial-NoDerivatives 4.0 International (CC BY-NC-ND 4.0) license. You can copy and redistribute our material in any medium or format; you must give appropriate credit, provide a link to the license, and indicate if changes were made, and you may not apply additional restrictions. You may do so in any reasonable manner, but not in any way that suggests the licensor endorses you or your use. You may not use the material for commercial purposes. If you remix, transform, or build upon the material, you may not distribute the modified material. For more information, visit https://creativecommons.org/licenses/by-nc-nd/4.0/.

Building Performance Standards: Lessons from Carbon Policy iii
ContentsBackground 1
Scope 4
Price Formation 8
Targets and Timetables 15
Term 15
Type 16
Stringency 17
Flexibility Mechanisms 19
Banking 19
Offsets 19
Linking 20
Alternative Compliance: Prescriptive Pathways 20
Interactions with Existing Policies and Markets 22
Renewable Portfolio Standards 22
Regional Greenhouse Gas Initiative 22
Electricity Markets 24
Discussion 25

Building Performance Standards: Lessons from Carbon Policy 1
1. BackgroundRoughly 70 percent of worldwide energy consumption and a comparable share of global greenhouse gas emissions are attributable to cities, according to the World Bank.1 In recognition of their contribution and of the need to address global warming, more than 170 US cities have made commitments to reduce their greenhouse gas emissions.2 In urban areas, buildings represent 50 to 80 percent of energy consumption and greenhouse gas emissions, with variations in buildings’ contributions across major cities: 64 percent of emissions in Tokyo,3 66 percent in New York,4 72 percent in Boston.5 Cities that aim to reduce their carbon footprint must therefore engage with the building stock and its owners to achieve their climate goals. As cities, states, and countries design and implement programs to mitigate building-level emissions, this paper examines lessons from three decades of experience with flexible approaches to carbon policy and their applicability to building program design. The success of this new class of programs will depend on interactions with existing climate regulation.
Strategies to engage the building sector in reducing emissions have historically been largely voluntary or prescriptive or both. Architects and developers often follow green certification standards that go well beyond local building code requirements and thus are not mandatory. The subsidy programs operated by utilities encourage specific types of improvements including lighting, window, or HVAC upgrades. Neither approach focuses on observed performance of the building after construction or upgrades. Some cities have recently begun requiring the disclosure of energy consumption by commercial buildings and benchmarking building performance relative to other buildings. This benchmarking and disclosure effort helps city officials understand buildings’ consumption and energy efficiency, complementing efforts to track building code compliance.6 The typical metrics for benchmarking are total
1 World Bank Group. 2018. Low Carbon Cities: Exploring New Crediting Approaches to Deliver Carbon and Climate Finance. World Bank, Washington, DC. © World Bank. https://openknowledge.worldbank.org/handle/10986/30611 License: CC BY 3.0 IGO.
2 McCoy, C. (2019) U.S. City Climate Commitments: Obstacles and Opportunities in the Building Sector Post-Paris Agreement Retrieved from http://eelp.law.harvard.edu/wp-content/uploads/McCoy-City-Climate-Commitments-and-Buildings-Final.pdf.
3 Bureau of Environment, Tokyo Metropolitan Government (TMG), (2007). Retrieved from https://www.kankyo.metro.tokyo.lg.jp/en/climate/cap_and_trade/index.html
4 Inventory of New York City Greenhouse Gas Emissions in 2016 (2017) New York City. https://www1.nyc.gov/assets/sustainability/downloads/pdf/publications/GHG%20Inventory%20Report%20Emission%20Year%202016.pdf.
5 Inventory of New York City Greenhouse Gas Emissions in 2016 (2017). Retrieved from https://www.boston.gov/sites/default/files/embed/file/2019-10/city_of_boston_2019_climate_action_plan_update_4.pdf.
6 Another rationale for benchmarking and disclosure programs has been to make energy use and costs more transparent in private real estate transactions. For more information about these programs, see K. Palmer and M. Walls, “Using Information to Close the Energy Efficiency Gap: A Review of Benchmarking and Disclosure Ordinances,” Energy Efficiency 10: 671–91 (2017).

Resources for the Future 2
consumption, energy use intensity (EUI, measured as consumption per square foot), and the ENERGY STAR score (an EUI metric mapped on a 100-point scale); this last metric was devised by the US Environmental Protection Agency (EPA).7 Benchmarking forms the basis for the regulation of the energy use or emissions of buildings. These building performance standards (BPS) or building energy performance standards (BEPS) programs target building energy (and sometimes water) consumption, as opposed to compliance with construction standards.
The city of Tokyo pioneered the BPS concept in 2010. By 2018, the program had achieved a 27 percent reduction in annual emissions for the covered buildings relative to base-year emissions,8 with 99 percent compliance. Every five years, the buildings’ emissions reduction target, measured in tons of greenhouse gas emitted, is tightened, thereby lowering emissions. Building owners have flexibility in compliance: excess compliance can be banked for future use, buildings can use low-carbon energy sources, allowances can be traded, and smaller buildings, not subject to the cap, can contribute reductions created through their own investments. More recently, New York City and the District of Columbia have passed BPS-enacting legislation, and Boston, Cambridge (Massachusetts), and Seattle are among the cities studying BPS designs. The programs can be tailored to local objectives. For example, New York City’s program sets increasingly stringent limits on carbon emissions per square foot of building space over time, with targets varying by building category, and it plans a suite of flexibility measures to help building owners comply.9 In contrast, the DC program uses the ENERGY STAR score as the program baseline, with a goal of bringing all buildings up to the city-wide average energy performance; it does not create tradable units.
Intentionally or not, these programs share many design elements with the carbon and environmental markets, including increasingly stringent compliance targets, program scope targeting buildings of a certain size, differentiated targets or incentives for specific building categories, and compliance flexibility for building owners. BPS programs can be designed as cap-and-trade or baseline-and-credit schemes. Whereas cap-and-trade programs issue or auction allowances ex ante in the amount of the carbon cap and require entities to turn in enough allowances to cover their emissions, baseline-and-credit schemes issue compliance units ex post to the entities that emit less than the baseline or outperform an energy target. The Tokyo program is a cap-and-trade program10: buildings receive allowances in proportion to their base-
7 More information about ENERGY STAR scores can be found at https://www.energystar.gov/buildings/facility-owners-and-managers/existing-buildings/use-portfolio-manager/interpret-your-results/what.
8 Tokyo Metropolitan Government Bureau of Environment (2020). Results of Tokyo Cap-and-Trade Program in the 9th Fiscal Year. Retrieved from https://www.kankyo.metro.tokyo.lg.jp/en/climate/index.files/9thYearResult.pdf.
9 https://www.urbangreencouncil.org/sites/default/files/trading_report_urban_green_2020.pdf.
10 Tokyo: An Emissions Trading Case Study, EDF, IETA, CDC Climate Research (May 2015): Retrieved from https://www.edf.org/sites/default/files/tokyo-case-study-may2015.pdf.

Building Performance Standards: Lessons from Carbon Policy 3
year emissions, with the covered fraction decreasing with each compliance period. In a baseline-and-credit scheme, the entities emitting less than the baseline can be credited that difference. Those emitting above the baseline typically must make up the shortfall by improving their performance, paying a penalty, or if a market exists, purchasing credits from entities that overcomplied. The baseline itself can be in absolute units, consumption or emissions per building, or intensity units for consumption or emissions per square foot of building space.
This paper reviews the relevant design elements of carbon and environmental markets and explores how they could influence the design of BPS programs. Carbon and environmental markets have existed for more than three decades, giving policymakers experience with scope and target setting and the design of flexibility provisions. The paper also sketches out how the sector-specific BPS programs overlap and interact with existing cross-sectoral programs—state-level clean energy and renewable portfolio standards (RPS), the Regional Greenhouse Gas Initiative (RGGI), electricity markets, and transport electrification.

Resources for the Future 4
2. ScopeThe first carbon market design question is, Which entities should be covered? The answer must balance two goals: capturing as much of the sector’s emissions as possible while keeping the number of compliance entities reasonable. Carbon markets therefore do not cover individual homes or vehicles but set the point of compliance at the power plant, refinery, or point of fuel distribution. BPS program designers must choose whether to regulate entities based on their size or based on their consumption or emissions level.
The DC building benchmarking data11 illustrate how the distribution of building size and emissions can affect market design choices (Table 1).
Table 1. DC BPS Program Design Options and Emissions Coverage
>50,000 sq.ft. >100,000 sq.ft.
Number of buildings 1,657 1,052
Building emissions (tCO2e) 2,181,665 1,822,335
Number of buildings emitting >500t/yr. 1,134 957
Emissions from buildings emitting >500t/yr. 2,022,254 1,792,053
According to DC’s greenhouse gas inventory, 73 percent of the city’s 5.28 metric tons of carbon dioxide equivalent (CO
2e) emissions are from buildings, and 70 percent of
building emissions are from commercial buildings. Buildings larger than 50,000 square feet that are subject to the Building Emissions Performance Standard program in 2021 represent 58 percent of all commercial buildings’ emissions. Setting the threshold building size at 100,000 square feet would have reduced the number of covered entities by 36 percent for a 17 percent loss in emissions coverage. Restricting the program to buildings larger than 50,000 square feet that had historical emissions greater than 500 tCO
2e reduces the number of compliance entities by almost a third
for a 7 percent loss in emissions coverage.
11 https://opendata.dc.gov/datasets/building-energy-benchmarks.

Building Performance Standards: Lessons from Carbon Policy 5
To date, carbon markets and BPS programs have used both size and output thresholds. The Tokyo buildings policy is limited to entities that emitted the equivalent of 1,500,000 liters of oil (4,078tCO
2e) during the baseline period, yielding a relatively small
number, around 1,200, of covered entities. In contrast, the New York City design has a size threshold for inclusion of 25,000 square feet and covers an estimated 50,000 buildings. The DC program gradually lowers the threshold for inclusion, from 50,000 square feet in 2021 to 10,000 square feet in 2026.
Both size and output thresholds have their benefits and drawbacks (Table 2), but emissions-based thresholds are by design targeted at the highest emitters, thereby reducing program implementation and management costs. For market-based programs, experience from the European Union Emissions Trading System (EU ETS) has also shown that small entities can be reluctant market participants, thus leading to market inefficiencies and potentially higher compliance costs.12 The first phase of the EU ETS was substantially overallocated, and those initial allowances could not be used for compliance in subsequent periods. The design should have caused allowance prices to fall to zero, yet market prices stayed above zero during most of the compliance period because sellers, especially small entities, were reluctant to participate in the market. The Tokyo market allows smaller buildings to play a role by creating an incentive program for small and mid-size efficient buildings to voluntarily sell credits into the primary buildings’ allowance market, effectively creating a baseline-and-credit program within the broader cap-and-trade market.
Both size and output threshold approaches are likely to have a moderate leakage risk if compliance costs are a large portion of the building’s operating costs and tenants are exposed to and not indifferent to cost increases13: buildings with a very high emissions density, such as data centers or industrial sites, will have an incentive to move out of the covered area. If a program is city-wide, migrating emissions-intensive activities out of town to a nearby location is an easier proposition than in markets with broad geographic scope.
12 A. Denny Ellerman, Barbara K. Buchner, The European Union Emissions Trading Scheme: Origins, Allocation, and Early Results, Review of Environmental Economics and Policy, Volume 1, Issue 1, Winter 2007, Pages 66–87, https://doi.org/10.1093/reep/rem003
13 Institute for Market Transformation: Understanding the Business of Real Estate (2020). Retrieved from https://www.imt.org/resources/understanding-the-business-of-real-estate-information-for-the-successful-implementation-of-a-building-performance-policy/.

Resources for the Future 6
Table 2. Trade-Offs in Setting BPS Coverage Thresholds
Size-based threshold Emissions-based threshold
Pros
Transparent threshold applies to building stock equally
Once included, covered entities remain same throughout compliance periods as new buildings are added
Captures only high emitters
Creates incentives to keep emissions below program threshold
Cons
Captures many low-emitting buildings
At small size thresholds, high number of covered buildings increases program management costs
Can be biased by choice of baseline years
Covered entities vary across compliance periods
Requires baseline methodology to assess new buildings
RisksCreates incentive for high emitters to move out of area or migrate to small spaces: moderate leakage risk
Creates incentive for high emitters to move to new location: moderate leakage risk
The prerequisite for establishing a BPS program is having quality historical data in the appropriate units of compliance. These “calibration” data must be collected in the same way that program compliance data are gathered. The first phase of the EU ETS, for example, ended up overallocated because the data and models used to estimate baseline industrial sector emissions, especially for small facilities, vastly overestimated actual measured emissions.
Buildings data in the United States are generally reported via EPA’s ENERGY STAR Portfolio Manager®, which raises several questions:
• Data are generally self-reported by building owners. Although Portfolio Manager checks and reports anomalies and the BPS programs validate incoming data, the process should require supporting documentation or third-party validation to meet compliance data standards.
• Portfolio Manager has its own algorithm to adjust consumption to standard weather conditions. This process can be useful for setting BPS program baselines, but weather-normalized data create compliance uncertainty: compliance can be calculated from the consumption data only after the full year’s weather has been experienced, making progress toward meeting the building goals over the course of the year more difficult to track.

Building Performance Standards: Lessons from Carbon Policy 7
• Programs can use site or source energy use as metrics. Site energy is the onsite consumption of fuels and electricity; source energy adds transmission, delivery, and production losses and represents the total amount of energy produced to supply the energy used by the building. With either metric, emissions are divided into direct and indirect emissions. Direct emissions are fuel consumption (heating oil, natural gas) on site multiplied by a constant national emissions factor. Indirect emissions, typically associated with the production of electricity, are calculated with regional emissions factors.14
• Programs using ENERGY STAR scores as the baseline have additional compliance uncertainty. The 1-to-100 ENERGY STAR scale is calibrated to a reference data set, the Commercial Building Energy Consumption Survey data, which is updated every four or five years by the US Energy Information Administration. The same consumption could translate into different scores as the underlying data are updated, an issue highlighted in past studies.15
14 ENERGY STAR Portfolio Manager Technical Reference: Greenhouse Gas Emissions (2020). Retrieved from https://portfoliomanager.energystar.gov/pdf/reference/Emissions.pdf.
15 Scofield, J. H. (2014) ENERGY STAR Building Benchmarking Scores: Good Idea, Bad Science in ACEEE Summer Study on Energy Efficiency in Buildings. Retrieved from https://www.aceee.org/files/proceedings/2014/data/papers/3-725.pdf; also see C. E. Kontokosta, “A Market-Specific Methodology for a Commercial Building Energy Performance Index,” Journal of Real Estate Finance and Economics 51 (2): 288–316 (2015); D. Hsu, “Improving Energy Benchmarking with Self-Reported Data,” Building Research & Information 42 (5): 641–56 (2014).

Resources for the Future 8
3. Price FormationRegulatory programs entail compliance costs that can be expressed as cost per unit of emissions or energy consumption reduced. These compliance costs are reasonably transparent in tradable programs, which have transactable prices, and they are implicit in nontrading programs. This section uses a very simple conceptual model to illustrate price formation and trading dynamics in BPS programs.
Our hypothetical program targets energy reductions, which can be translated into carbon reductions. It has five buildings and two owners. All buildings face a 10 percent reduction target in the first phase of compliance. Each building has three abatement options: a lighting retrofit, the addition of window films, and an HVAC retrofit; not all options are available to all buildings (Table 3).
Table 3. Building Retrofit Options and Costs
Owner Lighting retrofit Window film HVAC upgrade
Cost ($/sq.ft.) 0.9 0.5 8.5
Savings (%) 12 5 25
Abatement cost ($/kBtu) 0.10 0.13 0.44
A
Building 1 ✓ ✓ ✓
Building 2 ✓ ✓
Building 3 ✓
B
Building 4 ✓
Building 5 ✓ ✓ ✓

Building Performance Standards: Lessons from Carbon Policy 9
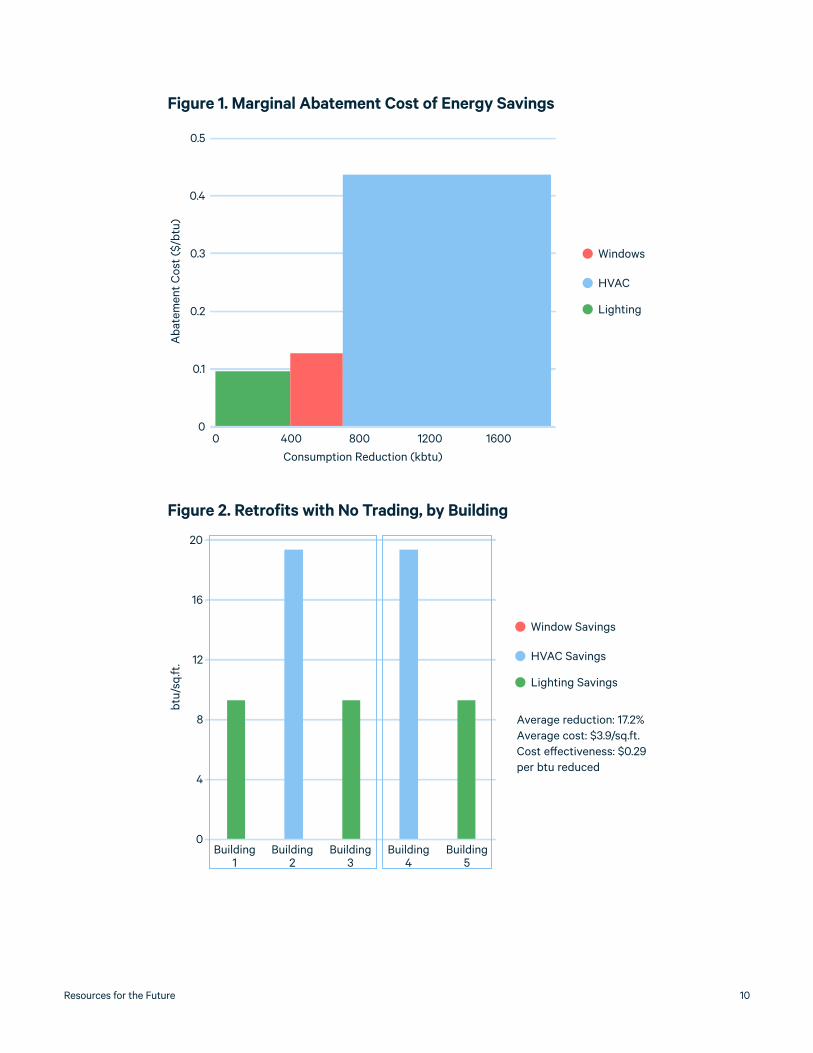
In reality, buildings have many options to reduce consumption and emissions. The Department of Energy’s Scout16 building efficiency software has close to 30 built-in commercial energy efficiency measures. The Tokyo program lists 20 distinct measures that span demand-side management and operational measures, appliance and lighting efficiency, heating and cooling systems, software, and sensors.17 Organized from lowest to highest cost per unit of avoided consumption or cost per unit of avoided emissions, these measures form the buildings’ marginal abatement cost (MAC) curve. In our conceptual example, lighting retrofits cost $0.90 per square foot for an assumed 12 percent reduction in building consumption. Using average office building consumption data,18 this represents a cost of $0.10 per Btu reduced: it is the most cost-effective option. Window film abatement costs are $0.13 per Btu, and HVAC upgrades’ cost-effectiveness is $0.44 per Btu. Our example builds an abatement cost curve in units of dollars per thousand Btu reduced; however, it could also be translated into dollars per ton of greenhouse gas reduced, given information on emissions rates and time of use for various energy forms, electricity in particular. The MAC curve is built by aggregating the effectiveness of the available measures over the building stock (Figure 1). For the five buildings at hand, the three measures can reduce consumption by almost 2 mmBtu, which represents 30.2 percent of the total consumption.
A real-world MAC curve has several complexities:
• The sum of savings from individual retrofit measures will not be same as the savings from a combined retrofit program. For example, adding insulation will reduce the savings of an HVAC replacement.
• Each building is unique. Without building-level audit information and a modeling tool to estimate the savings from a package of retrofit measures, the resulting MAC curve will have significant uncertainties.
16 https://scout.energy.gov/home.html.17 Tokyo Metropolitan Government Bureau of Environment (2020). Results of Tokyo
Cap-and-Trade Program in the 9th Fiscal Year. Retrieved from https://www.kankyo.metro.tokyo.lg.jp/en/climate/index.files/9thYearResult.pdf. https://ecfr.io/Title-49/pt49.6.531
18 Department of Energy, Commercial Energy Buildings Survey, 2012.
Resources for the Future 10
Figure 1. Marginal Abatement Cost of Energy Savings
Figure 2. Retrofits with No Trading, by Building
Aba
tem
ent C
ost (
$/bt
u)
Windows
HVAC
Lighting
0.5
0.4
0.3
0.2
0.1
00 400 800
Consumption Reduction (kbtu)
1200 1600
btu/
sq.ft
.
Window Savings
HVAC Savings
Lighting Savings
Average reduction: 17.2%Average cost: $3.9/sq.ft.Cost effectiveness: $0.29per btu reduced
20
16
12
8
4
0Building
1Building
2Building
3Building
4Building
5

Building Performance Standards: Lessons from Carbon Policy 11
With no trading, each building must meet the reduction target individually (Figure 2). This means buildings 1, 3, and 5 will invest in a lighting retrofit because that is the most cost-effective option. However, buildings 2 and 4 will have to upgrade their HVAC systems to meet the requirement because a window treatment, by itself, is insufficient to meet the reduction target. The average cost per square foot of the combined treatments is $3.90 per square foot, and the total reduction far exceeds the phase’s 10 percent target, since consumption is reduced by 17.2 percent. The program’s average cost-effectiveness is calculated as the cost per Btu reduced, and it stands at $0.29 per Btu. The DC program does not plan to include trading between covered entities. It does, however, have a baseline in ENERGY STAR units, which means that buildings that are already efficient may not have to go through upgrades in the initial compliance periods.
Figure 3. Company-Level Compliance
The corporate “bubble” approach to compliance is often used in environmental programs, most notably in the Corporate Average Fuel Efficiency Standards (CAFE)19 for motor vehicles. Although existing BPS programs have not explored this design option, it represents an intermediate solution for giving building owners more compliance flexibility. In our example (Figure 3), owner A chooses to add window treatments to buildings 1 and 2 and defers the HVAC upgrade. Owner B realizes that the HVAC upgrade to building 4 is sufficient to meet compliance for both buildings. As a result, the actual consumption reduction is closer to the mandated reduction, 11.8 percent, and the cost of compliance per square foot has dropped by 44 percent. Company-level compliance allows building owners to optimize investment decisions across a portfolio of assets.
19 Passenger Automobile Average Fuel Economy Standards 49 C.F.R. Part 531 (1977).
btu/
sq.ft
.
Window Savings
HVAC Savings
Lighting Savings
Average reduction: 11.8%Average cost: $2.2/sq.ft.Cost effectiveness: $0.25per btu reduced
20
16
12
8
4
0Building
1Building
2Building
3Building
4Building
5

Resources for the Future 12
Figure 4. Building Compliance with Market Trading
In a tradable market, building owners can use the market price to inform their efficiency investment decisions. Our MAC curve tells us that the building stock can achieve an average 10.2 percent consumption reduction across all buildings by applying the two most cost-effective measures: lighting and windows. The marginal cost, or cost of the last measure applied, is $0.13 per Btu, which is the cost of the window treatment. In a well-functioning market, that market price is available to building owners to inform their decisions: buildings 1, 3, and 5 would receive a lighting retrofit and buildings 1, 2, 4, and 5 would get window films. Two buildings apply both measures, one retrofits the lighting only, one applies the window treatment only, and one building does neither. The cost of these measures averaged over the building stock is $0.08 per square foot. This solution is about three times more cost-effective than the no-trading approach. To come into compliance, building owner B, who is undercomplying, would buy the compliance units she needs to meet her obligations from building owner A, who is overcomplying. That transaction would take place at the marginal cost of $0.13 per Btu. In a transparent market, all building owners who have abatement options below $0.13 per Btu have an incentive to apply them. More expensive mitigation options are delayed to later compliance phases. This flexibility gives building managers time to plan efficiency improvement projects that match the lifetime of existing equipment. If a building owner needs to replace an HVAC system, thereby achieving emissions reductions greater than the target, she can use the allowance market to help fund the upgrades by selling excess compliance units.
4.
btu/
sq.ft
.
Window Savings
HVAC Savings
Lighting Savings
Average reduction: 10.2%Average cost: $0.8/sq.ft.Cost effectiveness: $0.11per btu reduced
20
16
12
8
4
0Building
1Building
2Building
3Building
4Building
5

Building Performance Standards: Lessons from Carbon Policy 13
5. Targets and TimetablesSetting appropriate targets is something designers of carbon markets have struggled with, and policymakers have learned several lessons along the way.
5.1. Term
If targets are set on a short-term basis, such as one compliance period ahead, covered entities will lack the information necessary to make an informed prediction of long-term prices that would create the proper incentives for energy efficiency investments. For an illustrative example, assume that the energy savings of investing $120,000 in a high-efficiency air-conditioning system are $10,000 per year for a payback period of 12 years (undiscounted). In a BPS program with a single three-year compliance period, the compliance value of the investment is $30,000 if the building saves 100tCO
2 per year
with the installation of the new system, and the expected BPS price is $100 per tCO2.
The presence of a trading market shortens the payback period to nine years. However, if the program has defined ambitious targets for several compliance periods beyond the three-year window and the market allows the building owner to monetize future savings, the compliance value of the investment increases and the payback period goes down accordingly.
Carbon markets have often been criticized for not setting 20- or 30-year targets.20 In their absence, low prices reflect success in meeting short-term objectives but not long-term climate goals. Long-term targets solve the incentive problem, but they are in turn subject to political uncertainty, since governments lack the ability to commit to specific targets into the future.21
The Tokyo BPS program defines detailed objectives one five-year compliance period at a time. However, the city has a medium-term program goal of 30 percent reduction below the 2000 baseline year by 2030 and long-term aspirations to be a net-zero city.22 DC has a similar breakdown of medium-term goals (50 percent reduction by 2030) and long-term carbon neutrality. For buildings that do not meet the initially targeted ENERGY STAR score, the program effectively sets long-term objectives by requiring a 20 percent efficiency improvement every five years. New York’s local law 97 sets targets through 2034 and will set specific objectives for 2050 and beyond by 2023, effectively providing long-term targets for building owners to meet.
20 E. Tvinnereim and M. Mehling, “Carbon Pricing and Deep Decarbonisation,” Energy Policy 121: 185–89 (2018).
21 R. Schmalensee and R. N. Stavins, “Lessons Learned from Three Decades of Experience with Cap and Trade,” Review of Environmental Economics and Policy 11 (1): 59–79 (Winter 2017).
22 Tokyo Metropolitan Government Bureau of Environment (2019). TMG finalizes the cap for Tokyo Cap-and-Trade Program after 2020. Retrieved from https://www.kankyo.metro.tokyo.lg.jp/en/climate/index.files/TCaT_after2020.pdf.

Resources for the Future 14
5.2. Type
Carbon markets have developed different types of targets, all of which have been adopted in BPS policies (Table 5).
Table 5. Target Setting in BPS Policies
Target type Description BPS example
AbsoluteFacility-level reduction from historical consumption or emissions
Tokyo (tCO2)
Benchmark (or intensity standard)
Sector-specific efficiency target, typically emissions or consumption per unit of production or output
DC (EUI in mmBtu/sq.ft.)
NYC (emissions/sq.ft.)
Absolute targets require some type of compliance action by all covered entities. They are, however, inherently unfair to the most efficient entities that have low historical emissions. This consideration often pushes programs to credit early action or to create carve-out provisions for the best performers. For example, best performers in Tokyo program can apply for “top-level facility” status, which reduces their compliance burden.23 Absolute targets give the program host the flexibility to decide how allowances are allocated to participants: they can be auctioned or given to covered buildings for free.24 An allowance auction creates a source of revenue, which can help support retrofit programs.
Benchmarking sets an even playing field. However, facilities that are initially in compliance can delay action, even if investing in building improvements early in the program might be the most cost-effective approach.
5.3. Stringency
Another consideration is how stringent to make the targets. If the targets are too stringent, compliance costs will spiral upward, threatening the political viability of the program and the competitiveness of the least efficient technologies. If they are
23 Tokyo: An Emissions Trading Case Study, EDF, IETA, CDC Climate Research, May 2015. Retrieved from https://www.edf.org/sites/default/files/tokyo-case-study-may2015.pdf.
24 Freely allocated allowances can also be sold at auction as a mechanism of revealing allow-ance prices through a consignment auction, which returns allowance auction revenues to compliance entities in proportion to their allotted share. See D. Burtraw and K. McCormack, “Consignment Auctions of Free Emission Allowances,” Energy Policy 107: 337–44 (2017).

Building Performance Standards: Lessons from Carbon Policy 15
not stringent enough, the environmental goals are undermined. Carbon markets have devised several ways to moderate prices or abatement requirements. These mechanisms all seek to keep prices within a reasonable range by adjusting the supply of compliance units or allowances. If prices are deemed too low, the supply is withheld to boost prices and increase environmental stringency. Price floors, allowance discounting, and allowance claw-back mechanisms are all designed to boost prices. If prices are deemed too high, the supply of allowances is increased. Backup allowance auctions, price containment reserves, and alternative compliance payments boost supply at the expense of environmental integrity. Some of these strategies could work better than others in BPS programs (Table 6).25
Table 6. Stringency Flexibility Measures
Measure Description Applicability to BPS
Price floorSets minimum price level below which allowances are not auctioned; creates guaranteed price level to facilitate investment
Works only if most allowances are auctioned
Automatic intensity target adjustment
Automatically adjusts program intensity targets if prices drop below trigger minimum
Yes
Allowance discounting
Reduces value of allowances from earlier compliance periods by forcing entities to turn in more than one earlier allowance for each newer vintage
Can be used if allowance surplus held by participants is deemed excessive or to
induce more investment
Allowance claw-back
Government-held allowances are withheld from auctions
Works only if most allowances are auctioned
Backup allowance auction or price containment reserve
At set price levels, new allowances are injected into market to increase supply
Creates “soft” price cap; compromises integrity of target
Alternative compliance payment
Sets effective price cap by allowing compliance at alternative compliance payment level
Equivalent to compliance penalty without having to make up allowance shortfall;
compromises integrity of target
Program reviewBuilds in regular review of targets in program design; effectively creates market “central bank” allowed to adjust targets
Yes
25 Urban Green Council (2020). Trading: A New Climate Solution for Buildings. Retrieved from https://www.urbangreencouncil.org/sites/default/files/trading_report_urban_green_2020.pdf

Resources for the Future 16
6. Flexibility MechanismsFlexibility mechanisms facilitate compliance with the program, ideally without compromising its environmental objectives. Banking, offsets, and linking are used in carbon markets; prescriptive pathways are new to BPS programs.
6.1. Banking
Banking allows buildings that exceed their compliance target for energy or emissions reductions to keep that excess for future use. By rewarding proactive and early action, this mechanism creates a strong incentive for efficiency investment. Banking is a feature of most carbon markets. It has, however, led to persistently low prices in the RGGI, EU ETS, and sulfur dioxide and nitrogen oxides clean air markets. Successful compliance in the early phases of these programs led to a large allowance bank buildup. In response, these programs added regulatory measures to claw back some of the surplus (see Table 6).
6.2. Offsets
Offsets are the baseline-and-credit companions to many cap-and-trade programs; they are generated from specific types of projects using protocols to determine eligibility. They are designed to give credit for emissions reductions by entities in sectors excluded from the program or entities smaller than the covered thresholds. For example, in the Tokyo BPS program, buildings smaller than the 1500kl oil consumption equivalent threshold that reduce emissions below their baseline can apply for crediting for a period of five years. These credits can be sold to the program for large buildings.
What types of projects make sense to complement BPS programs? It’s unlikely that a sector-specific program such as a BPS would allow offsets from other sectors. This consideration leaves small buildings or buildings in other regions as potential offsets candidates. Small buildings are a natural complement, but New York City’s and DC’s programs target buildings of just 25,000 and 10,000 square feet, respectively, leaving little volume to aggregate in the small-building category.
Renewable energy, whether generated onsite or purchased, can also play an offsetting role in BPS programs. Distributed renewable energy directly tied to the building can and should be credited against the building’s electricity consumption, especially to the extent that the timing matches the building’s consumption. New York City’s program is also considering compensating battery storage systems for enabling greater penetration of renewable resources.

Building Performance Standards: Lessons from Carbon Policy 17
The purchase of renewable energy or low-carbon sources of heat is another effective offset mechanism. In the Tokyo program, 8.5 percent of the facilities have purchased low-carbon electricity and 11 percent have purchased low-carbon heat, effectively replacing fossil fuel energy use with sources having lower emissions factors. In the New York City program, renewable energy certificates (RECs) can be used to offset emissions so long as the source of the RECs is “located in or directly deliverable” into the program area (New York Zone J), a restriction that limits supply. These purchases would come out of the set-aside for voluntary renewable energy purchases prescribed by the state’s Clean Energy Standard26 and thus be supplemental to the RPS requirements. By creating supplemental demand for local New York City RECs, these would likely sell at a premium over RECs from elsewhere in the state used for compliance with the Clean Energy Standard.
6.3. Linking
Linking two or more BPS programs makes sense only if trading is allowed within each individual program. Linking programs causes their MAC curves to merge, and the lowest-cost reductions then flow from the more expensive programs to the less expensive ones until prices equilibrate. The total emissions reductions from linked programs remain the same, but the origin of the emissions reductions is not guaranteed. Because BPS programs are designed to help meet municipal climate targets, exporting or importing emissions reductions can interfere with the integrity of the goal. The benefit, however, is greater cost-effectiveness for all in the reduction of a global pollutant.
6.4. Alternative Compliance: Prescriptive Pathways
The New York and DC programs are more expansive than the Tokyo market, which by design is limited to the largest emitters. Tokyo makes exceptions for the most efficient buildings but does not offer alternative compliance pathways. New York City excludes from the program entire categories of buildings, notably religious structures, municipal buildings, housing developments on land owned by the New York Housing Authority, and rent-controlled accommodations. City and New York Housing Authority buildings have their own targets but are not subject to the program’s penalties and enforcement. The DC program creates a true alternative compliance track by allowing “a prescriptive pathway for buildings to achieve compliance by implementing cost-effective energy efficiency measures with savings comparable to the performance pathway.”27 This prescriptive pathway raises two issues.
26 2015 New York State Energy Plan and amendments. https://energyplan.ny.gov/Plans/2015.aspx.
27 D.C. Act 22-583, January 18, 2019, Title III.

Resources for the Future 18
First, authorization to go down this alternative path will likely have to be granted, based on building modeling, before construction. If the model results provide, on average, a fair estimate of actual energy savings, the overall program reductions would remain approximately unchanged.28 However, if the model overpredicts actual savings, there will be a disparity.
And second, the prescriptive pathway eliminates compliance uncertainty for approved building owners for one five-year compliance period. After that, buildings will be in compliance, need a new authorization to stay on the prescriptive path, or return to the consumption data “performance” pathway. This future status determination, in turn, increases compliance uncertainty for the building owner: if the prescriptive pathway does not achieve the modeled reductions, would the building have to catch up in the following compliance period to remain in compliance?
28 Consumption reductions modeled with the flagship EnergyPlus building model have, to date, not been benchmarked against actual building consumption reductions. A. Roth, Department of Energy, personal communication, June 2020.

Building Performance Standards: Lessons from Carbon Policy 19
7. Interactions with Existing Policies and MarketsSeveral of the cities that have adopted or are considering BPS policies already have other regulations to address carbon emissions from their electricity sectors, such as renewable portfolio standards, broader and increasingly aggressive clean energy standards, or a CO
2 emissions cap-and-trade program under the Regional Greenhouse
Gas Initiative. Some RGGI states face or are proposing additional restrictions on CO2
emissions from electricity producers, including the existing Massachusetts cap on emissions from fossil-fueled electricity generators and the additional carbon price for wholesale electricity transactions proposed by the New York Independent System Operator. How will these regulations affect BPS programs?
7.1. Renewable Portfolio Standards
Portfolio standards to encourage greater use of renewables to supply electricity have been adopted in 29 states and the District of Columbia. Recently, New York, Washington, California, and DC have dramatically increased their renewable and broader clean energy goals and accelerated the mandated timelines for achievement, with DC being among the most aggressive. The calculation of buildings’ indirect emissions by ENERGY STAR Portfolio Manager29 is, however, not necessarily consistent with state-level renewable energy program targets. In DC, the RPS requirement for electricity sales rises to 100 percent by 2032. Under this requirement, beginning in 2032, a building with an electric heat pump and no gas appliances should have no emissions associated with it.30 However, in Portfolio Manager the building’s emissions would be determined using a regional emissions factor that deviates from the trajectory of the DC RPS. The design of the BPS policy should take into account how it relates to the local RPS, in terms of timing, the implications for emissions from electricity produced to serve the city, and the potential differences with emissions calculated through the compliance
7.2. Regional Greenhouse Gas Initiative
For cities in the RGGI states, the greenhouse gas emissions consequences of their BPS policies will depend on the level of the RGGI allowance price and in particular its proximity to price points on the allowance supply curve. If RGGI were structured like
29 U.E. Environmental Protection Agency: Emissions & Generation Resource Integrated Database (eGRID). https://www.epa.gov/energy/emissions-generation-resource-integrated-database-egrid.
30 This assertion ignores the variable output from renewable generators and assumes that the portfolio of renewable resources can supply electricity in all hours of the day when an electric heat pump would be operating.

Resources for the Future 20
the textbook version of a strict cap-and-trade program, lowering demand for electricity in buildings might reduce emissions from the generators that serve the city but also free up allowances to cover emissions from other generators in another part of the capped region. Under a strict cap-and-trade approach, the emissions cap is also an emissions floor, and 100 percent of the emissions reductions due to building owners’ efforts to reduce electricity use would leak to other locations in the capped region, yielding zero net emissions reductions, albeit at a lower allowance price. As a result of this “waterbed” effect of cap-and-trade, in such a setting the BPS has no beneficial effect on CO
2 emissions.
However, the design of RGGI and other North American cap-and-trade programs moderates this waterbed effect by limiting the number of allowances introduced into the market at certain price points, including the price floor (roughly $2.05 per ton) and the emissions containment reserve (roughly $6.00, to be introduced in RGGI beginning in 2021). These policy features mean that when city’s BPS reduces demand for electricity and associated CO
2 emissions allowances, driving prices to the emissions
containment price step or to the floor, it is possible that the supply of allowances across the RGGI market will fall as well, giving the BPS policy greater environmental potency.
Emissions reductions from BPS programs in RGGI states could also be ensured by expanding the voluntary renewable energy allowance setaside provision in the RGGI Model rule, adopted by New York State, Massachusetts and five other states31. Under this provision, a setaside of RGGI allowances is created that approximates the size of emissions displaced by voluntary renewable purchases; these allowances can be used to retire allowances for the implicit CO
2 emissions reductions associated with
documented voluntary renewable purchases. In New York State, this setaside includes renewables and eligible biomass and will rise from 700,000 to 900,000 allowances beginning in 2021. This provision of the various state rules used to implement RGGI participation could be expanded to include the CO
2 emissions reductions from
reduced electricity production expected from compliance with a municipal BPS and thereby ensure the environmental efficacy of the BPS in the presence of the RGGI cap. In addition to the required state-level regulatory changes, this would require BPS program managers to quantify the program’s annual greenhouse gas reduction and have an equivalent amount withdrawn from the voluntary setaside. In the absence of such a provision, building owners or the city itself could shore up the environmental efficacy of the BPS program by purchasing and voluntarily retiring the RGGI allowances required to cover the emissions reductions resulting from the program.
31 The Regional Greenhouse Gas Initiative. https://www.rggi.org/sites/default/files/Uploads/Allowance-Tracking/States_Set-Aside_Accounts.pdf.

Building Performance Standards: Lessons from Carbon Policy 21
7.3. Electricity Markets
The potential to reduce both energy use and emissions as electricity generation decarbonizes suggests that BPS regulations will lead to a greater push away from heating with fossil fuels toward use of electric heat pumps, which in turn will increase electric loads. This shift, combined with a growing penetration of electric vehicles (which may be charged at BPS-covered buildings), raises questions about how BPS policies might be designed to help accommodate these changes. For example, might a BPS be used to influence load shapes in a way that limits the need for high-emitting peak-period generators and aligns operation of heat pumps and car chargers with times when renewable generation is abundant? Such a design would have to accurately capture the intertemporal variations in grid emissions and raise the value of additional energy in hours when renewables are available. In the longer run, as states and other jurisdictions look to decarbonize their economies more broadly, the role of electricity as a source of end-use energy in buildings and for transport is expected to grow, especially as the grid decarbonizes. Transport electrification programs and the installation of charging stations on building premises should be structured to avoid conflict with BPS programs. Until the grid substantially decarbonizes, electric vehicle charging stations metered with a building risk increasing the building’s electricity consumption and carbon footprint.

Resources for the Future 22
8. DiscussionBPS programs can use several design options pioneered in the carbon markets—multiyear compliance periods, absolute or benchmarked targets, and various flexibility mechanisms—to provide flexibility, help balance environmental goals and compliance costs, and even generate revenues to fund related building efficiency programs. Initially focusing on the largest buildings or largest emitters allows a program to capture the bulk of the relevant emissions or energy consumption while lowering the administrative burden. Because BPS programs have a small geographic scope, leakage is a risk: the highest emitters, notably data centers and industrial sites, would have an incentive to exit the city if compliance costs become significant. This risk can be mitigated with tailored baselines, special allocation provisions, or a broader geographic scope—all strategies that have been used in carbon markets.
Understanding how trading of compliance obligations affects building owners’ retrofit decisions, compliance costs, and savings opportunities requires knowledge of the building sector’s abatement options and costs. Including tradable markets in a BPS design increases compliance flexibility, both across entities and across time when allowance banking is permitted. However, for a market to work effectively, building owners must have a clear understanding of the cost and the energy or emissions savings of various retrofit packages for their properties. The benefits of trading within a corporate bubble versus across all covered entities is difficult to gauge without an in-depth understanding of the ownership structure of the city’s covered building stock.
BPS policies target both electricity and energy consumption and thus interact with other environmental programs. These interactions can take different forms, which are not always intuitive:
• The environmental benefits can be additive. For example, the New York City BPS should create demand for local renewable energy that is supplemental to the state’s Clean Energy Standard since New York State RECs can be sold only to compliance entities.32
• Program-related emissions reductions could be offsetting. That might be the case with RGGI if emissions reductions tied to a BPS reduce the compliance burden for RGGI generators but not the RGGI cap.
• Buildings might be subject to conflicting measures if, for example, the state RPS drives emissions reductions that are not fully factored into a city BPS program’s algorithms used to calculate emissions, or if electric car charging stations increase electricity consumption covered by the program.
Although that list reveals potential policy and market interactions with BPS policies, further quantitative analysis is required to understand the magnitude of these interactions and their effects on emissions. As they develop future policies and modify current designs, municipal officials should recognize these interactions and adapt policy designs as necessary to counter or limit adverse consequences.
32 Renewable energy credits used for compliance with the BPS program would presumably not be available for compliance with the state RPS, to avoid double counting.

Building Performance Standards: Lessons from Carbon Policy 23