Building on the accounting equation - Microsoft...
28
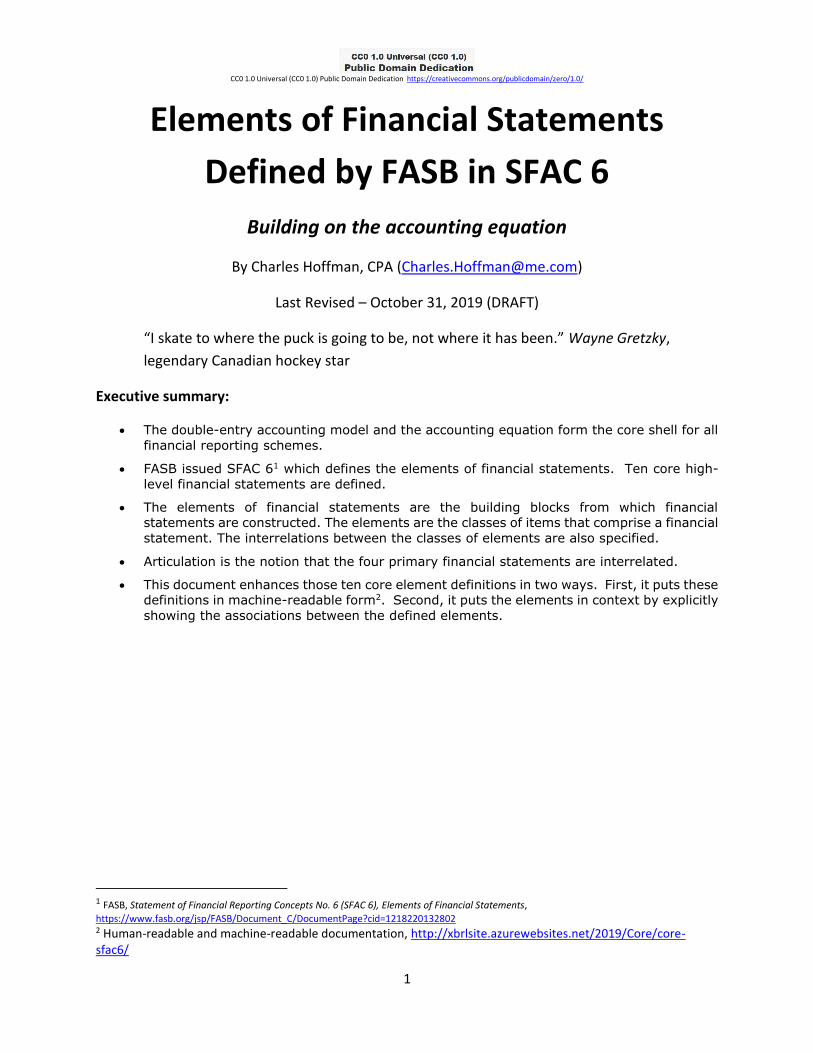
CC0 1.0 Universal (CC0 1.0) Public Domain Dedication https://creativecommons.org/publicdomain/zero/1.0/ 1 Elements of Financial Statements Defined by FASB in SFAC 6 Building on the accounting equation By Charles Hoffman, CPA ([email protected]) Last Revised – October 31, 2019 (DRAFT) “I skate to where the puck is going to be, not where it has been.” Wayne Gretzky, legendary Canadian hockey star Executive summary: • The double-entry accounting model and the accounting equation form the core shell for all financial reporting schemes. • FASB issued SFAC 6 1 which defines the elements of financial statements. Ten core high- level financial statements are defined. • The elements of financial statements are the building blocks from which financial statements are constructed. The elements are the classes of items that comprise a financial statement. The interrelations between the classes of elements are also specified. • Articulation is the notion that the four primary financial statements are interrelated. • This document enhances those ten core element definitions in two ways. First, it puts these definitions in machine-readable form 2 . Second, it puts the elements in context by explicitly showing the associations between the defined elements. 1 FASB, Statement of Financial Reporting Concepts No. 6 (SFAC 6), Elements of Financial Statements, https://www.fasb.org/jsp/FASB/Document_C/DocumentPage?cid=1218220132802 2 Human-readable and machine-readable documentation, http://xbrlsite.azurewebsites.net/2019/Core/core- sfac6/
Transcript of Building on the accounting equation - Microsoft...
CC0 1.0 Universal (CC0 1.0) Public Domain Dedication https://creativecommons.org/publicdomain/zero/1.0/
1
Elements of Financial Statements
Defined by FASB in SFAC 6
Building on the accounting equation
By Charles Hoffman, CPA ([email protected])
Last Revised – October 31, 2019 (DRAFT)
“I skate to where the puck is going to be, not where it has been.” Wayne Gretzky,
legendary Canadian hockey star
Executive summary:
• The double-entry accounting model and the accounting equation form the core shell for all
financial reporting schemes.
• FASB issued SFAC 61 which defines the elements of financial statements. Ten core high-
level financial statements are defined.
• The elements of financial statements are the building blocks from which financial
statements are constructed. The elements are the classes of items that comprise a financial
statement. The interrelations between the classes of elements are also specified.
• Articulation is the notion that the four primary financial statements are interrelated.
• This document enhances those ten core element definitions in two ways. First, it puts these
definitions in machine-readable form2. Second, it puts the elements in context by explicitly
showing the associations between the defined elements.
1 FASB, Statement of Financial Reporting Concepts No. 6 (SFAC 6), Elements of Financial Statements,
https://www.fasb.org/jsp/FASB/Document_C/DocumentPage?cid=1218220132802 2 Human-readable and machine-readable documentation, http://xbrlsite.azurewebsites.net/2019/Core/core-sfac6/
CC0 1.0 Universal (CC0 1.0) Public Domain Dedication https://creativecommons.org/publicdomain/zero/1.0/
2
Copyright (full and complete release of copyright)
All content of this document is placed in the public domain. I hereby waive all claim of copyright in this
work. This work may be used, altered or unaltered, in any manner by anyone without attribution or
notice to me. To be clear, I am granting full permission to use any content in this work in any way you
like. I fully and completely release all my rights to any copyright on this content. If you feel like
distributing a copy of this work, you may do so without attribution or payment of any kind. All that said,
attribution is appreciated should one feel so compelled. The copyrights of other works referenced by
this document are established by the referenced work.
ACKNOWLEDGEMENTS
I would like to thank the following people for enabling me to understand and get my head
around all of this information. Thomas Egan is likely the best professional accountant that I
know. He has expertise in both US GAAP and IFRS. Thomas McKinney has expertise with US
GAAP and creating XBRL-based financial reports that are submitted to the U.S. Securities and
Exchange Commission. Rene van Egmond has the unique skill of understanding my “business
speak” and then being able to convert that to terms that are understandable to computer
science professionals. Dean Ritz and Timothy Randle have been thinking about XBRL-based
digital financial reporting, along with Rene and myself, while we worked together at UBmatrix.
Andrew Noble is an accountant and a true visionary in Australia who created the LODGEiT
system for submitting XBRL information to Australian regulators and the AccFx accounting
software system which is built using Wolfram’s Mathematica. He is focused on leveraging XBRL
for transaction processing. Hamed Mousavi is a software engineer with a very good
background in accounting. Hamed and I have been collaborating to create the Pesseract
application for five years. David Eichner, CPA ([email protected]) sells and installs
accounting software and has been a long-time collaborator and colleague and has worked to
implement what amounts to a fact ledger in Microsoft Dynamics and Acumatica. Pete Rivett
and Elisa Kendall are both experts in knowledge engineering and I learned about that important
topic while working with them to create the OMG Standard Business Report Model (SBRM).
Rajib Doogar is an accounting professor at the University of Washington Bothell Campus. His
ideas about looking at the general ledger as “trees”, “branches”, and “leaves” and explaining
the matrix algebra behind these relations was very helpful. Ghislain Fourny is a data scientist
who I met when doing a database project relating to XBRL for a company he used to work for,
28msec. Finally, all of the editors and contributors of the XBRL 2.1 technical specification that
helped me get my head around the technical aspects of XBRL. Thanks to everyone!
CC0 1.0 Universal (CC0 1.0) Public Domain Dedication https://creativecommons.org/publicdomain/zero/1.0/
3
FASB SFAC 63 explicitly defines 10 elements of a financial statement. Those elements are:
assets, liabilities, equity, investments by owners, distributions to owners, comprehensive
income, revenues, expenses, gains, losses.
The elements of financial statements are the building blocks from which financial statements
are constructed. The elements are the classes of items that comprise a financial statement.
This document enhances those ten core element definitions in three ways. First, it puts these
definitions in machine-readable form. Second, it puts the elements in context by showing the
associations between the concepts. Third, it adds additional important concepts that are
ultimately defined implicitly or explicitly by the FASB to provide a complete set of core high-
level financial report elements.
Double-entry Accounting. Single-entry accounting is how ‘everyone’ would do accounting. In fact, that is how accounting
was done for about 4,000 years before double-entry accounting was invented. Double-entry
accounting was the invention of medieval merchants and was first documented by the Italian
mathematician and Franciscan Friar Luca Piccioli4 in 1494. The section related to double-entry
accounting was translated into English in 19145.
Double-entry accounting adds an additional important property to the accounting system, that
of a clear strategy to identify errors and to remove the errors from the system. Even better,
double-entry accounting has a side effect of clearly firewalling errors as either accident or
fraud. This then leads to an audit strategy. Double-entry accounting is how professional
accountants do accounting.
Which came first, double-entry accounting or the enterprise? It is hard to overstate the impact
of double-entry accounting on the evolution of the complex global enterprise6.
3 FASB, Statement of Financial Reporting Concepts No. 6 (SFAC 6), Elements of Financial Statements, https://www.fasb.org/jsp/FASB/Document_C/DocumentPage?cid=1218220132802 4 Wikipedia, Luca Pacioli, https://en.wikipedia.org/wiki/Luca_Pacioli 5 J. B. Geijsbeek, Ancient Double-Entry Bookkeeping, https://archive.org/details/ancientdoubleent00geij/page/n3 6 Ian Grigg, Triple Entry Accounting, https://iang.org/papers/triple_entry.html
CC0 1.0 Universal (CC0 1.0) Public Domain Dedication https://creativecommons.org/publicdomain/zero/1.0/
4
Foundational Mathematical Equation for Double-Entry
Accounting The foundational basis of double-entry accounting is straightforward. Quoting David Ellerman
from his paper The Math of Double-Entry Bookkeeping: Part I (scalars)7:
“Given an equation w + … + x = y + … + z, it is not possible to change just one term in the
equation and have it still hold. Two or more terms must be changed.”
And so, the left-hand side of the equation “w + … + x” (the DEBIT side) must always equal the
right-hand side of the equation “y + … + z” (the CREDIT side) in double-entry accounting. The
reason that double-entry accounting is used, as contrast to single-entry accounting, is double-
entry accounting’s capability to detect errors and to distinguish an error from fraud.
Of course, there are a lot of details associated with setting up and operating an accounting
system appropriately, but the fundamental feature is that DEBITS must equal CREDITS and if
they don’t, then something is up which needs to be investigated and corrected.
If you desire to learn more about double-entry accounting, see Colin Dodd’s rap song, Debit
Credit Theory (Accounting Rap Song)8.
The Accounting Equation: Framework for Financial
Accounting While the model “Debits = Credits” or the notion of basically using two single entry ledgers and
synchronizing them to detect errors or fraud is useful; additional power is provided to double-
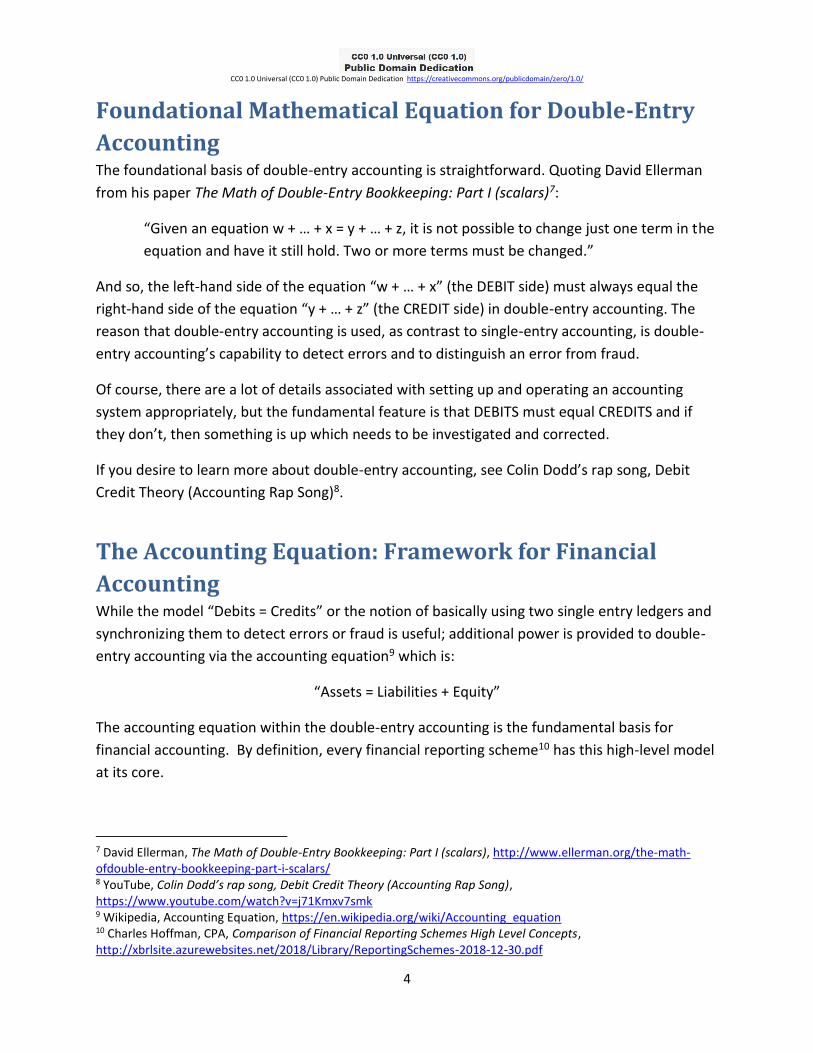
entry accounting via the accounting equation9 which is:
“Assets = Liabilities + Equity”
The accounting equation within the double-entry accounting is the fundamental basis for
financial accounting. By definition, every financial reporting scheme10 has this high-level model
at its core.
7 David Ellerman, The Math of Double-Entry Bookkeeping: Part I (scalars), http://www.ellerman.org/the-math-ofdouble-entry-bookkeeping-part-i-scalars/ 8 YouTube, Colin Dodd’s rap song, Debit Credit Theory (Accounting Rap Song), https://www.youtube.com/watch?v=j71Kmxv7smk 9 Wikipedia, Accounting Equation, https://en.wikipedia.org/wiki/Accounting_equation 10 Charles Hoffman, CPA, Comparison of Financial Reporting Schemes High Level Concepts, http://xbrlsite.azurewebsites.net/2018/Library/ReportingSchemes-2018-12-30.pdf
CC0 1.0 Universal (CC0 1.0) Public Domain Dedication https://creativecommons.org/publicdomain/zero/1.0/
5
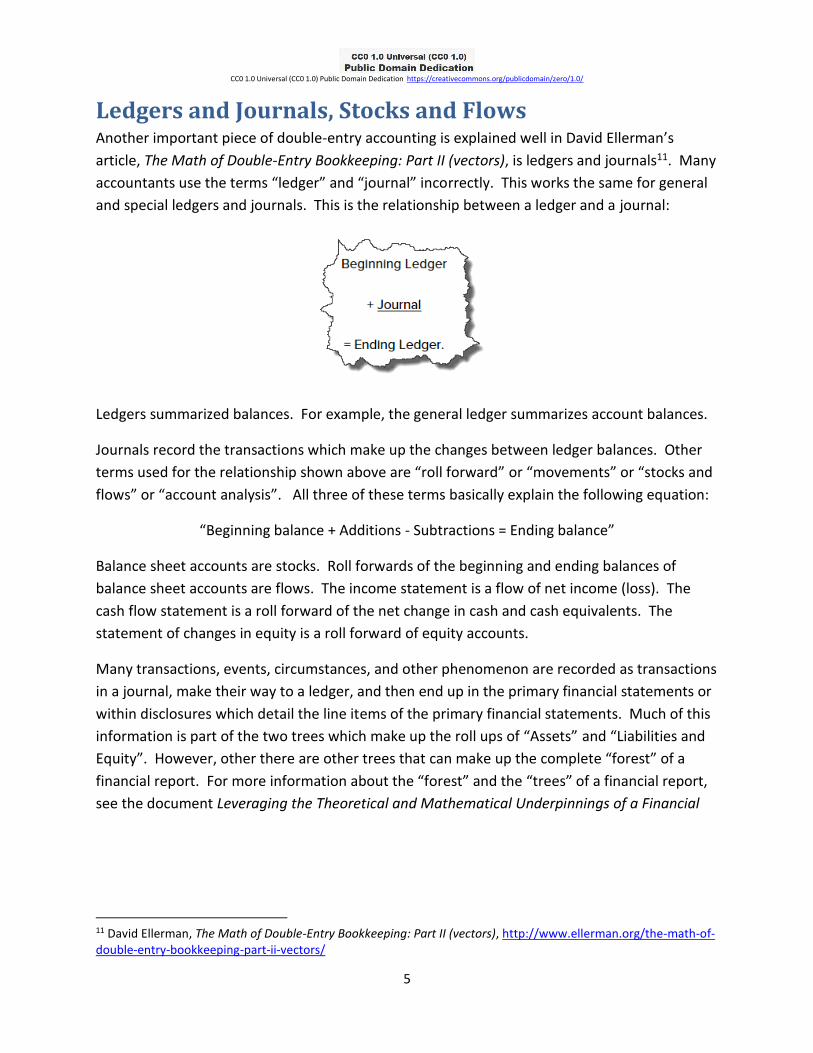
Ledgers and Journals, Stocks and Flows Another important piece of double-entry accounting is explained well in David Ellerman’s
article, The Math of Double-Entry Bookkeeping: Part II (vectors), is ledgers and journals11. Many
accountants use the terms “ledger” and “journal” incorrectly. This works the same for general
and special ledgers and journals. This is the relationship between a ledger and a journal:
Ledgers summarized balances. For example, the general ledger summarizes account balances.
Journals record the transactions which make up the changes between ledger balances. Other
terms used for the relationship shown above are “roll forward” or “movements” or “stocks and
flows” or “account analysis”. All three of these terms basically explain the following equation:
“Beginning balance + Additions - Subtractions = Ending balance”
Balance sheet accounts are stocks. Roll forwards of the beginning and ending balances of
balance sheet accounts are flows. The income statement is a flow of net income (loss). The
cash flow statement is a roll forward of the net change in cash and cash equivalents. The
statement of changes in equity is a roll forward of equity accounts.
Many transactions, events, circumstances, and other phenomenon are recorded as transactions
in a journal, make their way to a ledger, and then end up in the primary financial statements or
within disclosures which detail the line items of the primary financial statements. Much of this
information is part of the two trees which make up the roll ups of “Assets” and “Liabilities and
Equity”. However, other there are other trees that can make up the complete “forest” of a
financial report. For more information about the “forest” and the “trees” of a financial report,
see the document Leveraging the Theoretical and Mathematical Underpinnings of a Financial
11 David Ellerman, The Math of Double-Entry Bookkeeping: Part II (vectors), http://www.ellerman.org/the-math-of-double-entry-bookkeeping-part-ii-vectors/
CC0 1.0 Universal (CC0 1.0) Public Domain Dedication https://creativecommons.org/publicdomain/zero/1.0/
6
Report12. That document also has some good information related to triple-entry accounting
which I am not going to get into here.
As pointed out in the document General Ledger Trial Balance to External Financial Report13,
each balance sheet line item has a roll forward. While perhaps not reported externally, these
roll forwards can be quite helpful internally to verify that a financial report has been created
correctly.
Elements of a Financial Report Defined by SFAC 6 The FASB defines the following ten interrelated elements of a financial report:
• Assets
• Liabilities
• Equity
• Investments by Owners
• Distributions to Owners
• Comprehensive Income
• Revenues
• Expenses
• Gains
• Losses
The FASB uses the analogy of a “photograph” and a “motion picture” to differentiate the two
types of elements14. Three elements that are like a photograph are “assets”, “liabilities” and
“equity” and are for a point in time. In XBRL terms, they are instants or “as of” a specific point
in time. The others are like “motion pictures”, over a period of time, in XBRL terms they are
durations or “for period”.
The FASB explicitly states the components of comprehensive income which include: revenues,
expenses, gains, and losses15.
Note that the balance types, “debit” or “credit”, of each of the ten core elements of a financial
statement are not articulated by the FASB. However, professional accountants understand the
12 Charles Hoffman, CPA, Leveraging the Theoretical and Mathematical Underpinnings of a Financial Report, http://xbrlsite.azurewebsites.net/2018/Library/TheoreticalAndMathematicalUnderpinningsOfFinancialReport.pdf#page=6 13 Charles Hoffman, CPA, General Ledger Trial Balance to External Financial Report, http://xbrlsite.azurewebsites.net/2018/RoboticFinance/TrialBalanceToReport.pdf 14 FASB, SFAC 6, page 21, paragraph 20 15 FASB, SFAC 6, page 21, paragraph 20
CC0 1.0 Universal (CC0 1.0) Public Domain Dedication https://creativecommons.org/publicdomain/zero/1.0/
7
balance type of the ten elements which are the building blocks of a financial report. As such,
these balance types can be implied. However, I am explicitly specifying the balance types
explicitly in my XBRL representation which makes this crystal clear.
Note the term “interrelated”. If you read the definitions you can implicitly understand the
specific interrelations. The FASB uses the term “articulation” to describe the notion that
financial statements are fundamentally interrelated16. They result in financial statements that
are fundamentally interrelated and connected mathematically.
The following two equations articulate the fundamental relationships between all these
elements of a financial report defined by the FASB in SFAC 6. First, as the FASB stated;
“Comprehensive Income = Revenues - Expenses + Gains - Losses”
The equation above defines the relationship between comprehensive income and its
components. The equation below defines the relations between the other concepts and uses
the term “Comprehensive Income” as defined above.
0 = (EquityT0 + RevenueP1 - ExpensesP1 + GainsP1 - LossesP1 + InvestmentsByOwnersP1 -
DistributionsToOwnersP1) + LiabilitiesT1 - AssetsT1
And so, using both equations, the relations between each of the concepts is crystal clear as long
as you understand the balance type (debit, credit) of each of the core elements.
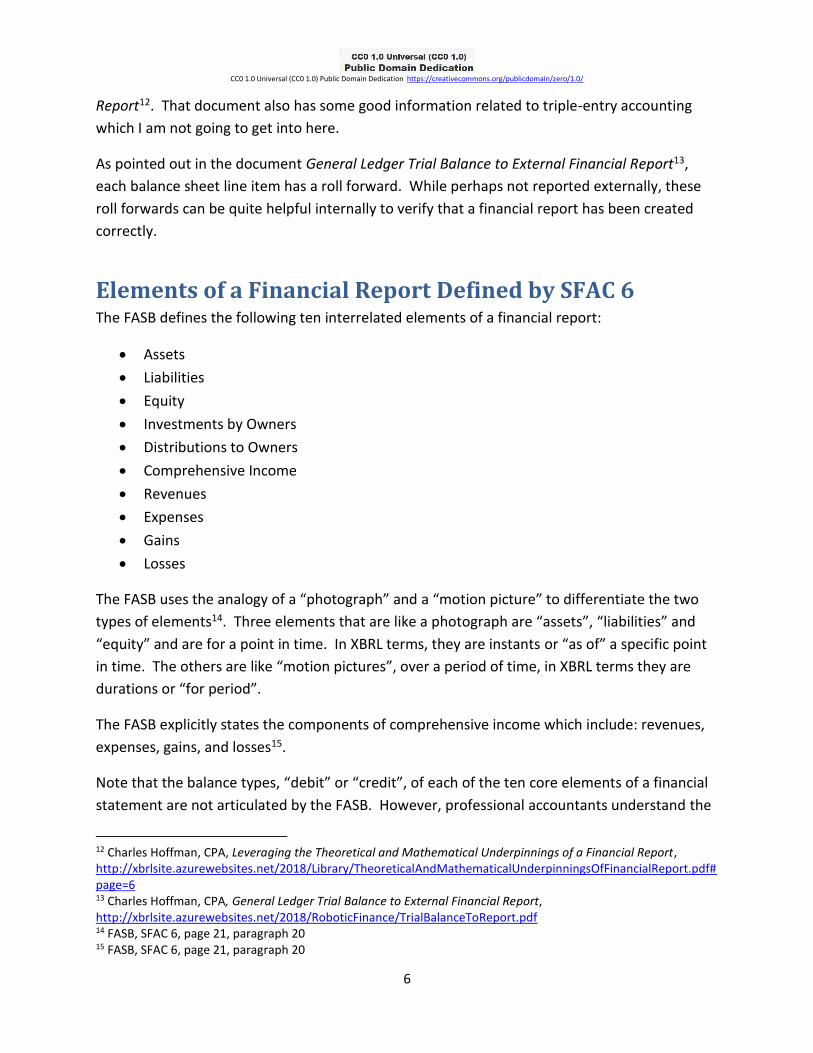
As such, in more visual terms you have the following:
Shell of a statement of financial position (balance sheet)17:
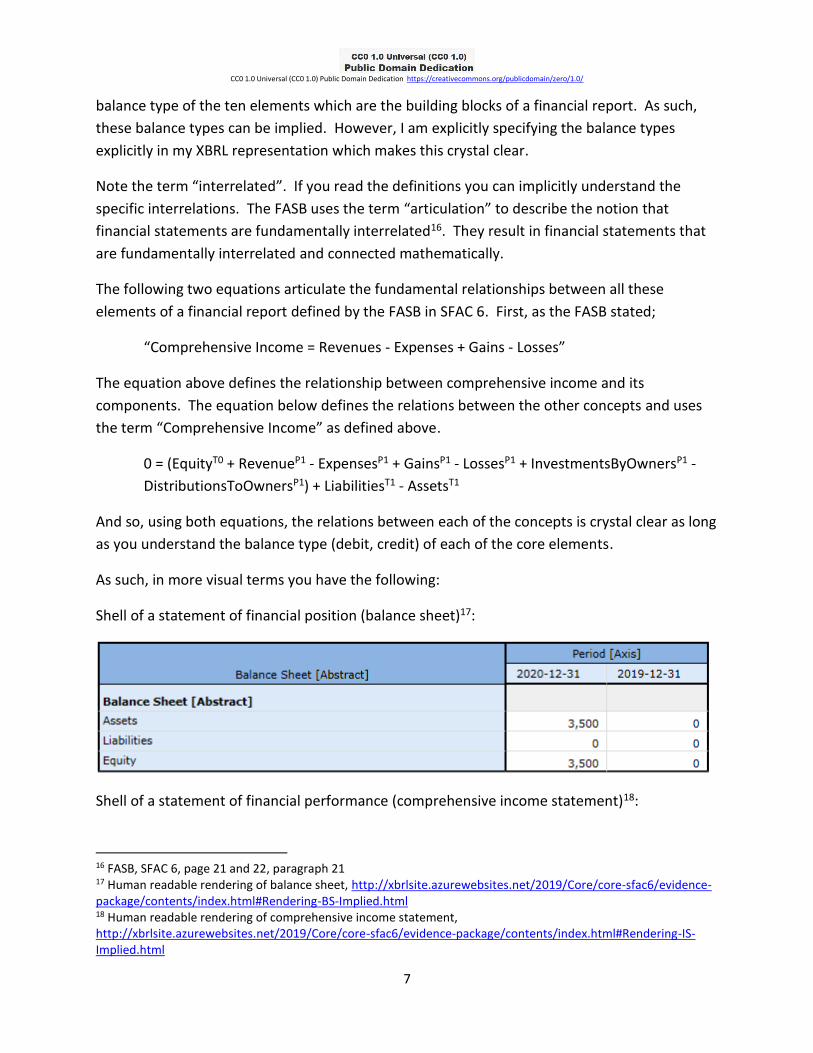
Shell of a statement of financial performance (comprehensive income statement)18:
16 FASB, SFAC 6, page 21 and 22, paragraph 21 17 Human readable rendering of balance sheet, http://xbrlsite.azurewebsites.net/2019/Core/core-sfac6/evidence-package/contents/index.html#Rendering-BS-Implied.html 18 Human readable rendering of comprehensive income statement, http://xbrlsite.azurewebsites.net/2019/Core/core-sfac6/evidence-package/contents/index.html#Rendering-IS-Implied.html
CC0 1.0 Universal (CC0 1.0) Public Domain Dedication https://creativecommons.org/publicdomain/zero/1.0/
8
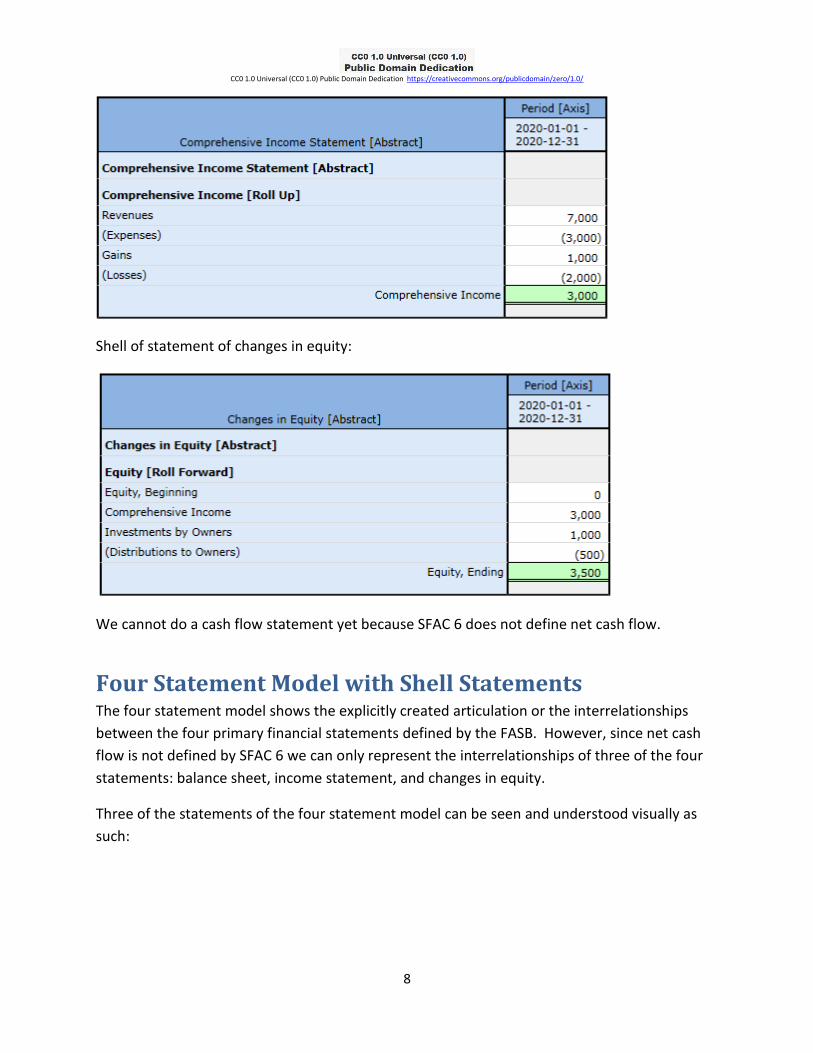
Shell of statement of changes in equity:
We cannot do a cash flow statement yet because SFAC 6 does not define net cash flow.
Four Statement Model with Shell Statements The four statement model shows the explicitly created articulation or the interrelationships
between the four primary financial statements defined by the FASB. However, since net cash
flow is not defined by SFAC 6 we can only represent the interrelationships of three of the four
statements: balance sheet, income statement, and changes in equity.
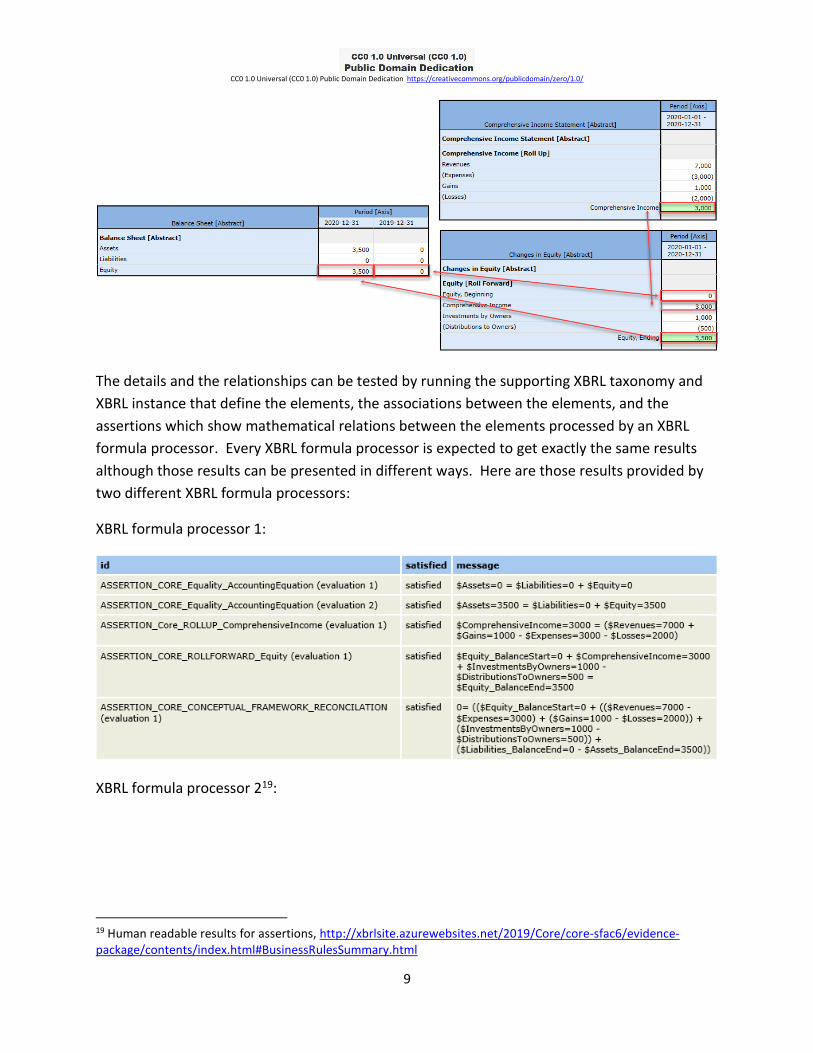
Three of the statements of the four statement model can be seen and understood visually as
such:
CC0 1.0 Universal (CC0 1.0) Public Domain Dedication https://creativecommons.org/publicdomain/zero/1.0/
9
The details and the relationships can be tested by running the supporting XBRL taxonomy and
XBRL instance that define the elements, the associations between the elements, and the
assertions which show mathematical relations between the elements processed by an XBRL
formula processor. Every XBRL formula processor is expected to get exactly the same results
although those results can be presented in different ways. Here are those results provided by
two different XBRL formula processors:
XBRL formula processor 1:
XBRL formula processor 219:
19 Human readable results for assertions, http://xbrlsite.azurewebsites.net/2019/Core/core-sfac6/evidence-package/contents/index.html#BusinessRulesSummary.html
CC0 1.0 Universal (CC0 1.0) Public Domain Dedication https://creativecommons.org/publicdomain/zero/1.0/
10
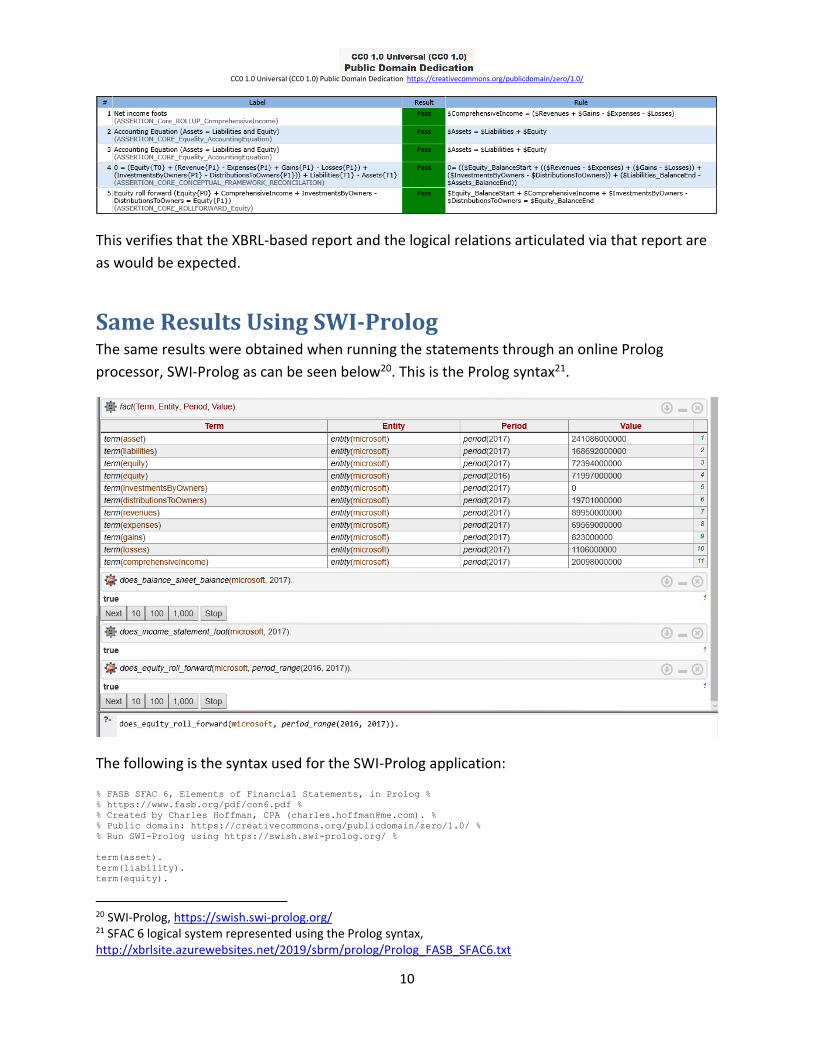
This verifies that the XBRL-based report and the logical relations articulated via that report are
as would be expected.
Same Results Using SWI-Prolog The same results were obtained when running the statements through an online Prolog
processor, SWI-Prolog as can be seen below20. This is the Prolog syntax21.
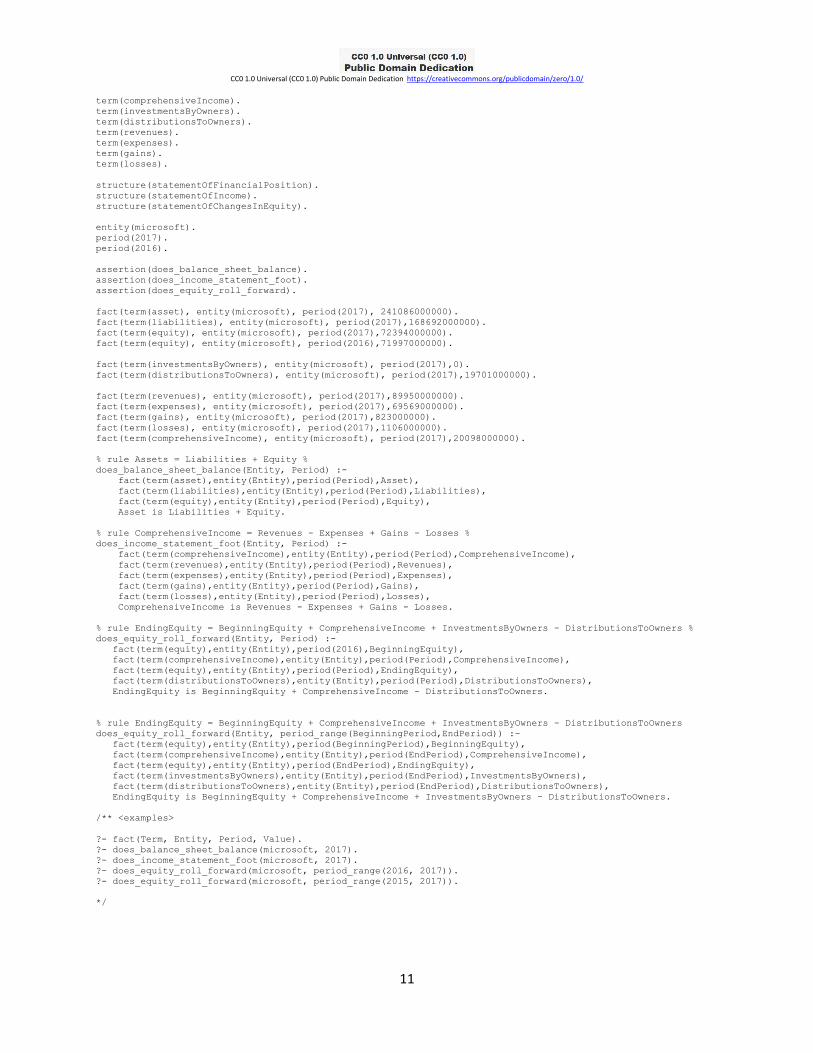
The following is the syntax used for the SWI-Prolog application:
% FASB SFAC 6, Elements of Financial Statements, in Prolog %
% https://www.fasb.org/pdf/con6.pdf %
% Created by Charles Hoffman, CPA ([email protected]). %
% Public domain: https://creativecommons.org/publicdomain/zero/1.0/ %
% Run SWI-Prolog using https://swish.swi-prolog.org/ %
term(asset).
term(liability).
term(equity).
20 SWI-Prolog, https://swish.swi-prolog.org/ 21 SFAC 6 logical system represented using the Prolog syntax, http://xbrlsite.azurewebsites.net/2019/sbrm/prolog/Prolog_FASB_SFAC6.txt
CC0 1.0 Universal (CC0 1.0) Public Domain Dedication https://creativecommons.org/publicdomain/zero/1.0/
11
term(comprehensiveIncome).
term(investmentsByOwners).
term(distributionsToOwners).
term(revenues).
term(expenses).
term(gains).
term(losses).
structure(statementOfFinancialPosition).
structure(statementOfIncome).
structure(statementOfChangesInEquity).
entity(microsoft).
period(2017).
period(2016).
assertion(does_balance_sheet_balance).
assertion(does_income_statement_foot).
assertion(does_equity_roll_forward).
fact(term(asset), entity(microsoft), period(2017), 241086000000).
fact(term(liabilities), entity(microsoft), period(2017),168692000000).
fact(term(equity), entity(microsoft), period(2017),72394000000).
fact(term(equity), entity(microsoft), period(2016),71997000000).
fact(term(investmentsByOwners), entity(microsoft), period(2017),0).
fact(term(distributionsToOwners), entity(microsoft), period(2017),19701000000).
fact(term(revenues), entity(microsoft), period(2017),89950000000).
fact(term(expenses), entity(microsoft), period(2017),69569000000).
fact(term(gains), entity(microsoft), period(2017),823000000).
fact(term(losses), entity(microsoft), period(2017),1106000000).
fact(term(comprehensiveIncome), entity(microsoft), period(2017),20098000000).
% rule Assets = Liabilities + Equity %
does_balance_sheet_balance(Entity, Period) :-
fact(term(asset),entity(Entity),period(Period),Asset),
fact(term(liabilities),entity(Entity),period(Period),Liabilities),
fact(term(equity),entity(Entity),period(Period),Equity),
Asset is Liabilities + Equity.
% rule ComprehensiveIncome = Revenues - Expenses + Gains - Losses %
does_income_statement_foot(Entity, Period) :-
fact(term(comprehensiveIncome),entity(Entity),period(Period),ComprehensiveIncome),
fact(term(revenues),entity(Entity),period(Period),Revenues),
fact(term(expenses),entity(Entity),period(Period),Expenses),
fact(term(gains),entity(Entity),period(Period),Gains),
fact(term(losses),entity(Entity),period(Period),Losses),
ComprehensiveIncome is Revenues - Expenses + Gains - Losses.
% rule EndingEquity = BeginningEquity + ComprehensiveIncome + InvestmentsByOwners - DistributionsToOwners %
does_equity_roll_forward(Entity, Period) :-
fact(term(equity),entity(Entity),period(2016),BeginningEquity),
fact(term(comprehensiveIncome),entity(Entity),period(Period),ComprehensiveIncome),
fact(term(equity),entity(Entity),period(Period),EndingEquity),
fact(term(distributionsToOwners),entity(Entity),period(Period),DistributionsToOwners),
EndingEquity is BeginningEquity + ComprehensiveIncome - DistributionsToOwners.
% rule EndingEquity = BeginningEquity + ComprehensiveIncome + InvestmentsByOwners - DistributionsToOwners
does_equity_roll_forward(Entity, period_range(BeginningPeriod,EndPeriod)) :-
fact(term(equity),entity(Entity),period(BeginningPeriod),BeginningEquity),
fact(term(comprehensiveIncome),entity(Entity),period(EndPeriod),ComprehensiveIncome),
fact(term(equity),entity(Entity),period(EndPeriod),EndingEquity),
fact(term(investmentsByOwners),entity(Entity),period(EndPeriod),InvestmentsByOwners),
fact(term(distributionsToOwners),entity(Entity),period(EndPeriod),DistributionsToOwners),
EndingEquity is BeginningEquity + ComprehensiveIncome + InvestmentsByOwners - DistributionsToOwners.
/** <examples>
?- fact(Term, Entity, Period, Value).
?- does_balance_sheet_balance(microsoft, 2017).
?- does_income_statement_foot(microsoft, 2017).
?- does_equity_roll_forward(microsoft, period_range(2016, 2017)).
?- does_equity_roll_forward(microsoft, period_range(2015, 2017)).
*/
CC0 1.0 Universal (CC0 1.0) Public Domain Dedication https://creativecommons.org/publicdomain/zero/1.0/
12
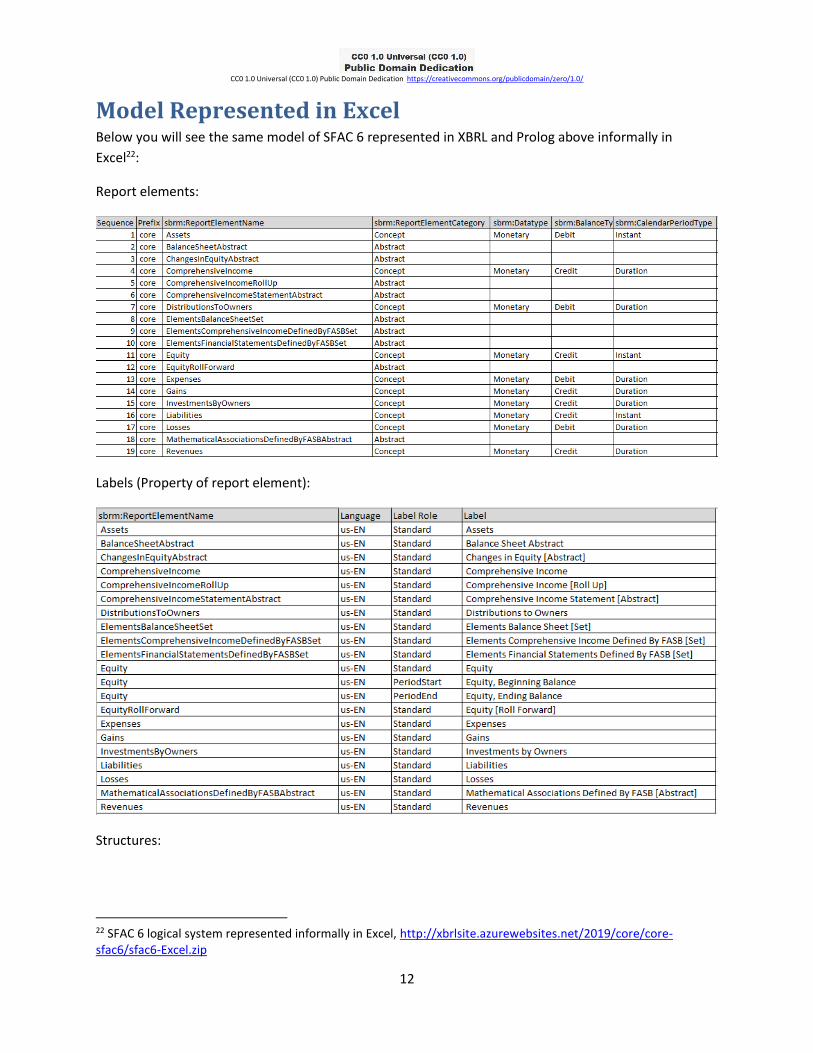
Model Represented in Excel Below you will see the same model of SFAC 6 represented in XBRL and Prolog above informally in
Excel22:
Report elements:
Labels (Property of report element):
Structures:
22 SFAC 6 logical system represented informally in Excel, http://xbrlsite.azurewebsites.net/2019/core/core-sfac6/sfac6-Excel.zip
CC0 1.0 Universal (CC0 1.0) Public Domain Dedication https://creativecommons.org/publicdomain/zero/1.0/
13
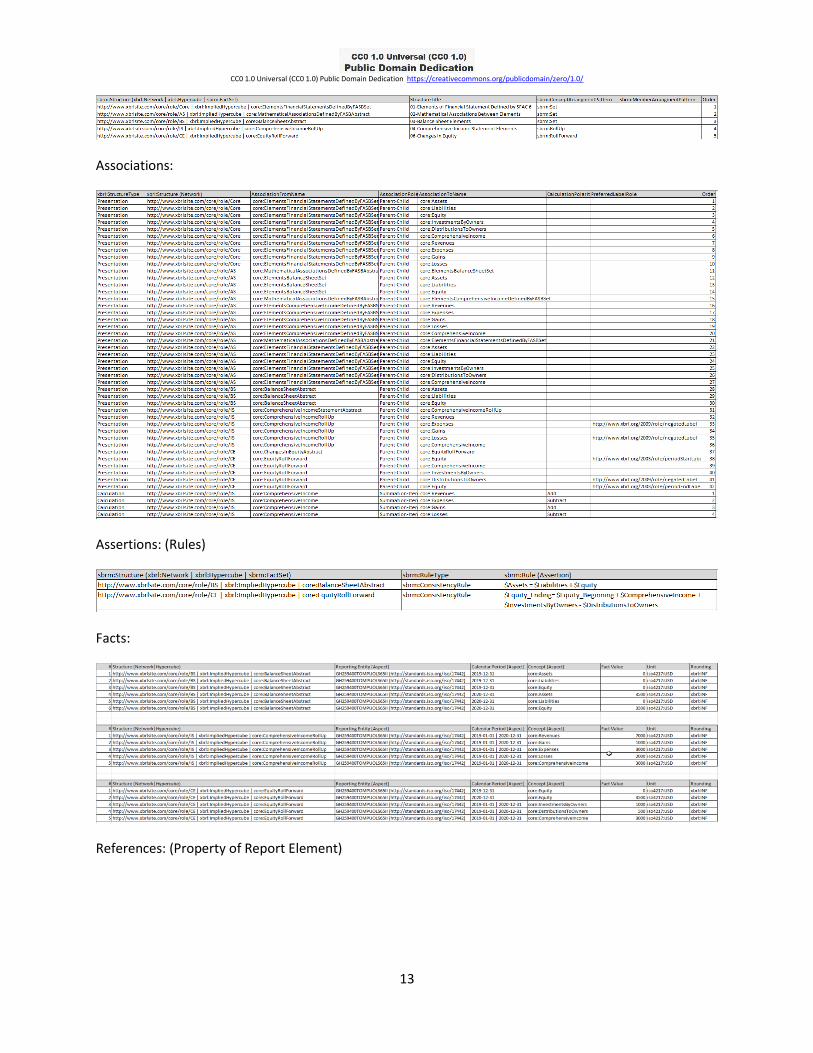
Associations:
Assertions: (Rules)
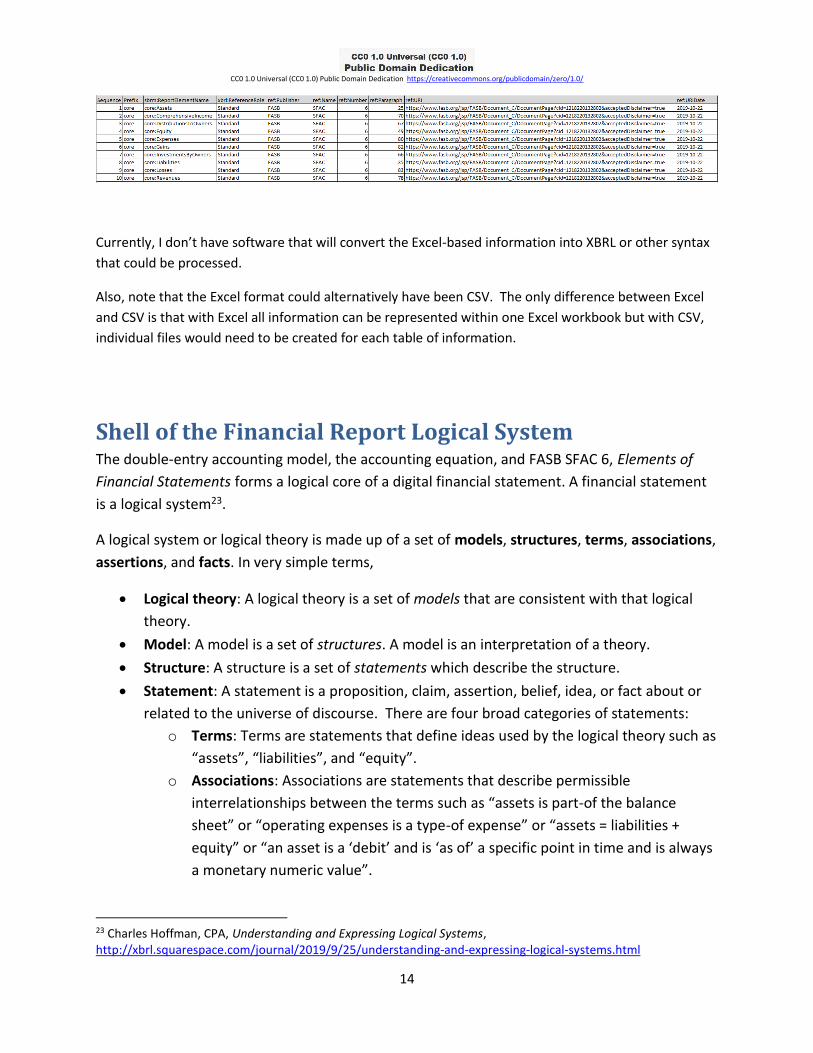
Facts:
References: (Property of Report Element)
CC0 1.0 Universal (CC0 1.0) Public Domain Dedication https://creativecommons.org/publicdomain/zero/1.0/
14
Currently, I don’t have software that will convert the Excel-based information into XBRL or other syntax
that could be processed.
Also, note that the Excel format could alternatively have been CSV. The only difference between Excel
and CSV is that with Excel all information can be represented within one Excel workbook but with CSV,
individual files would need to be created for each table of information.
Shell of the Financial Report Logical System The double-entry accounting model, the accounting equation, and FASB SFAC 6, Elements of
Financial Statements forms a logical core of a digital financial statement. A financial statement
is a logical system23.
A logical system or logical theory is made up of a set of models, structures, terms, associations,
assertions, and facts. In very simple terms,
• Logical theory: A logical theory is a set of models that are consistent with that logical
theory.
• Model: A model is a set of structures. A model is an interpretation of a theory.
• Structure: A structure is a set of statements which describe the structure.
• Statement: A statement is a proposition, claim, assertion, belief, idea, or fact about or
related to the universe of discourse. There are four broad categories of statements:
o Terms: Terms are statements that define ideas used by the logical theory such as
“assets”, “liabilities”, and “equity”.
o Associations: Associations are statements that describe permissible
interrelationships between the terms such as “assets is part-of the balance
sheet” or “operating expenses is a type-of expense” or “assets = liabilities +
equity” or “an asset is a ‘debit’ and is ‘as of’ a specific point in time and is always
a monetary numeric value”.
23 Charles Hoffman, CPA, Understanding and Expressing Logical Systems, http://xbrl.squarespace.com/journal/2019/9/25/understanding-and-expressing-logical-systems.html
CC0 1.0 Universal (CC0 1.0) Public Domain Dedication https://creativecommons.org/publicdomain/zero/1.0/
15
o Assertions: Assertions are statements that describe what tend to be
IF…THEN…ELSE types of relationships such as “IF the economic entity is a not-
for-profit THEN net assets = assets - liabilities; ELSE assets = liabilities + equity”
o Facts: Facts are statements about the numbers and words that are provided by
an economic entity within their financial report. For example, “assets for the
consolidated legal entity Microsoft as of June 20, 2017 was $241,086,000,000
expressed in US dollars and rounded to the nearest millions of dollars.
A logical system can have high to low precision and high to low coverage. Precision is a
measure of how precisely the information within a logical system has been represented as
contrast to reality for the universe of discourse. Coverage is a measure of how completely
information in a logical system has been represented relative to the reality for a universe of
discourse.
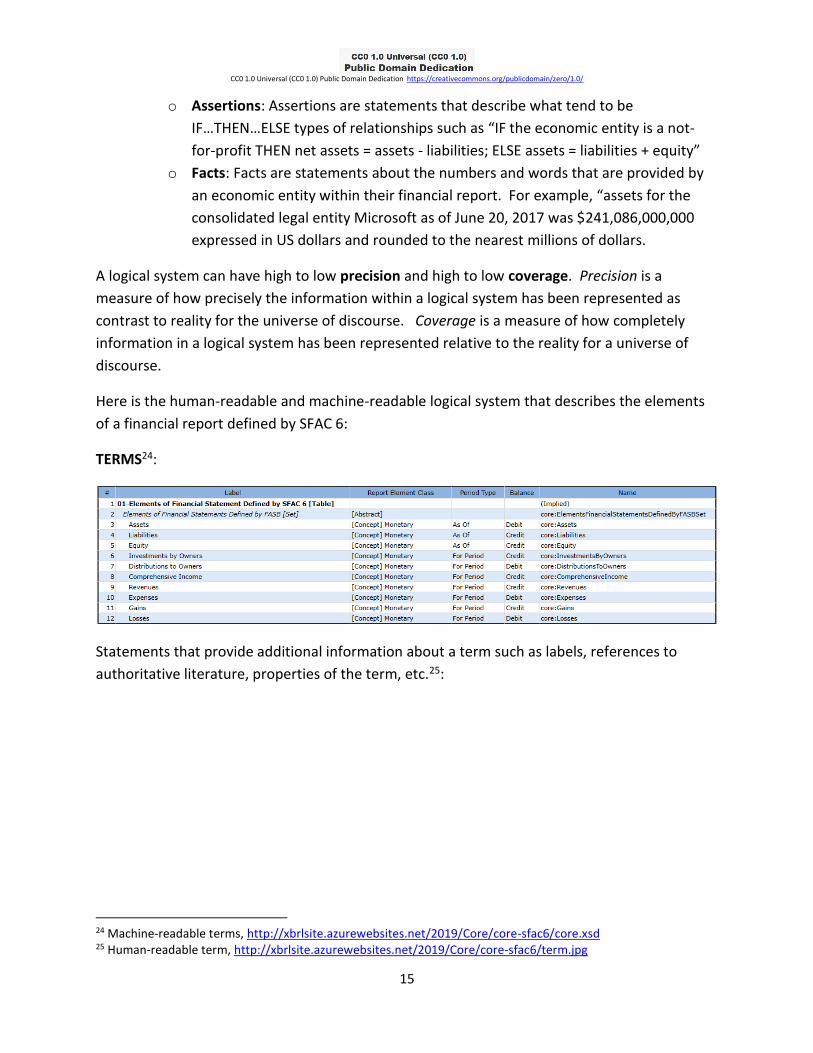
Here is the human-readable and machine-readable logical system that describes the elements
of a financial report defined by SFAC 6:
TERMS24:
Statements that provide additional information about a term such as labels, references to
authoritative literature, properties of the term, etc.25:
24 Machine-readable terms, http://xbrlsite.azurewebsites.net/2019/Core/core-sfac6/core.xsd 25 Human-readable term, http://xbrlsite.azurewebsites.net/2019/Core/core-sfac6/term.jpg
CC0 1.0 Universal (CC0 1.0) Public Domain Dedication https://creativecommons.org/publicdomain/zero/1.0/
16
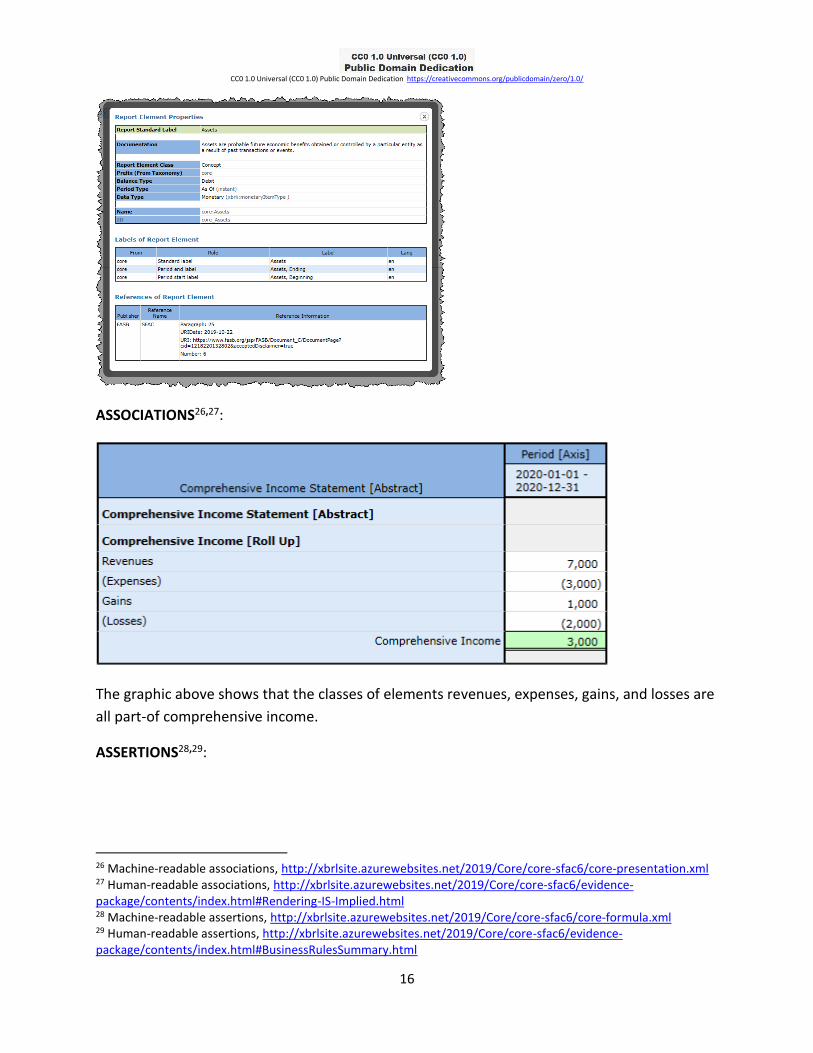
ASSOCIATIONS26,27:
The graphic above shows that the classes of elements revenues, expenses, gains, and losses are
all part-of comprehensive income.
ASSERTIONS28,29:
26 Machine-readable associations, http://xbrlsite.azurewebsites.net/2019/Core/core-sfac6/core-presentation.xml 27 Human-readable associations, http://xbrlsite.azurewebsites.net/2019/Core/core-sfac6/evidence-package/contents/index.html#Rendering-IS-Implied.html 28 Machine-readable assertions, http://xbrlsite.azurewebsites.net/2019/Core/core-sfac6/core-formula.xml 29 Human-readable assertions, http://xbrlsite.azurewebsites.net/2019/Core/core-sfac6/evidence-package/contents/index.html#BusinessRulesSummary.html
CC0 1.0 Universal (CC0 1.0) Public Domain Dedication https://creativecommons.org/publicdomain/zero/1.0/
17
The statements above are assertions that are applicable if an economic entity is a for-profit
entity.
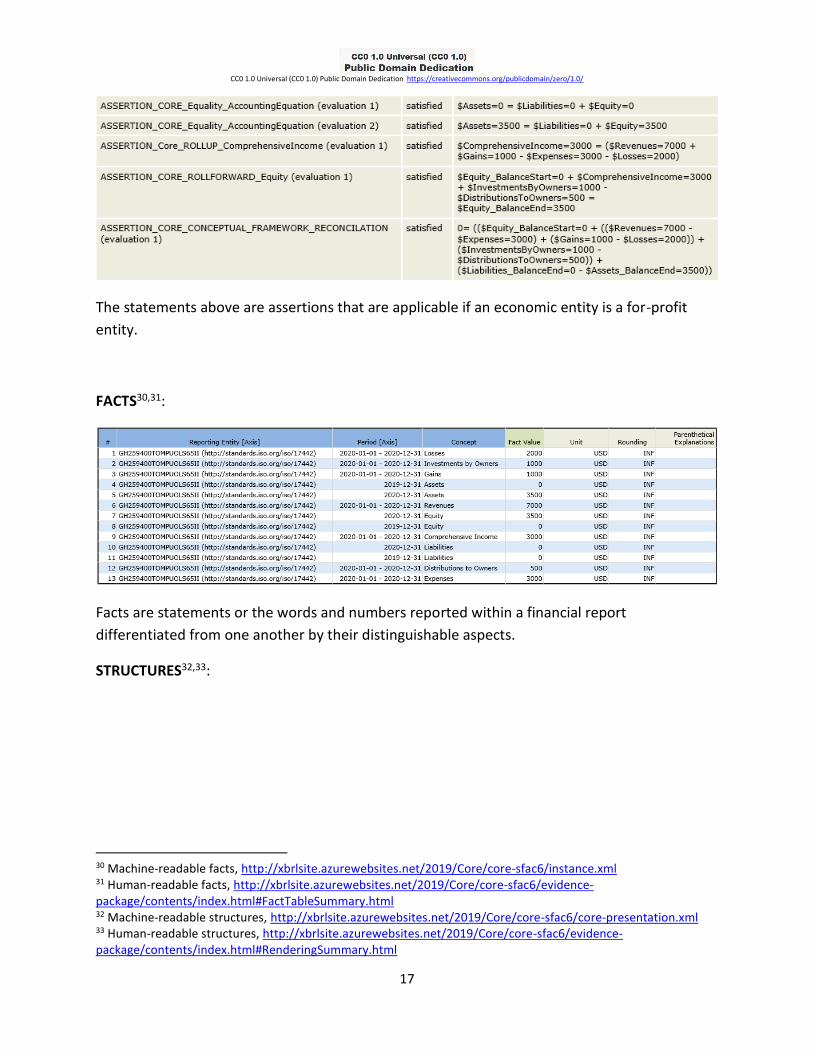
FACTS30,31:
Facts are statements or the words and numbers reported within a financial report
differentiated from one another by their distinguishable aspects.
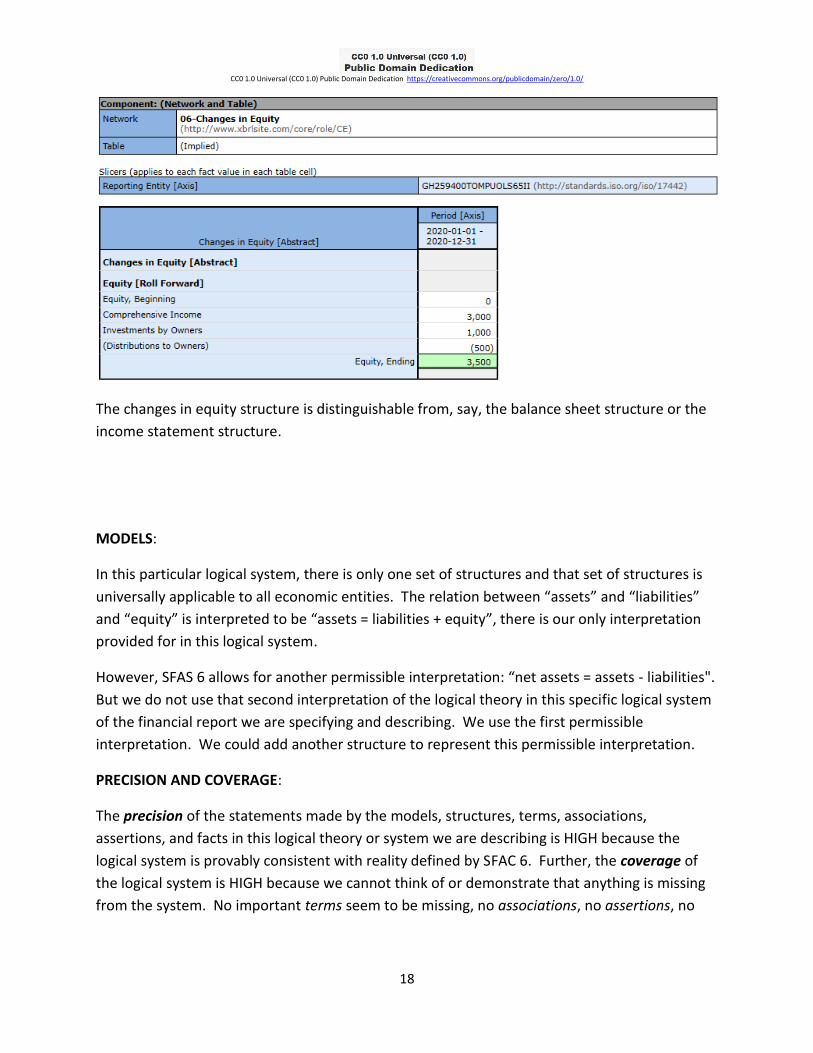
STRUCTURES32,33:
30 Machine-readable facts, http://xbrlsite.azurewebsites.net/2019/Core/core-sfac6/instance.xml 31 Human-readable facts, http://xbrlsite.azurewebsites.net/2019/Core/core-sfac6/evidence-package/contents/index.html#FactTableSummary.html 32 Machine-readable structures, http://xbrlsite.azurewebsites.net/2019/Core/core-sfac6/core-presentation.xml 33 Human-readable structures, http://xbrlsite.azurewebsites.net/2019/Core/core-sfac6/evidence-package/contents/index.html#RenderingSummary.html
CC0 1.0 Universal (CC0 1.0) Public Domain Dedication https://creativecommons.org/publicdomain/zero/1.0/
18
The changes in equity structure is distinguishable from, say, the balance sheet structure or the
income statement structure.
MODELS:
In this particular logical system, there is only one set of structures and that set of structures is
universally applicable to all economic entities. The relation between “assets” and “liabilities”
and “equity” is interpreted to be “assets = liabilities + equity”, there is our only interpretation
provided for in this logical system.
However, SFAS 6 allows for another permissible interpretation: “net assets = assets - liabilities".
But we do not use that second interpretation of the logical theory in this specific logical system
of the financial report we are specifying and describing. We use the first permissible
interpretation. We could add another structure to represent this permissible interpretation.
PRECISION AND COVERAGE:
The precision of the statements made by the models, structures, terms, associations,
assertions, and facts in this logical theory or system we are describing is HIGH because the
logical system is provably consistent with reality defined by SFAC 6. Further, the coverage of
the logical system is HIGH because we cannot think of or demonstrate that anything is missing
from the system. No important terms seem to be missing, no associations, no assertions, no
CC0 1.0 Universal (CC0 1.0) Public Domain Dedication https://creativecommons.org/publicdomain/zero/1.0/
19
models seem to be causing logical problems such as errors, inconsistencies, contradictions, etc.
Therefore, this logical system can be deemed to be properly functioning.
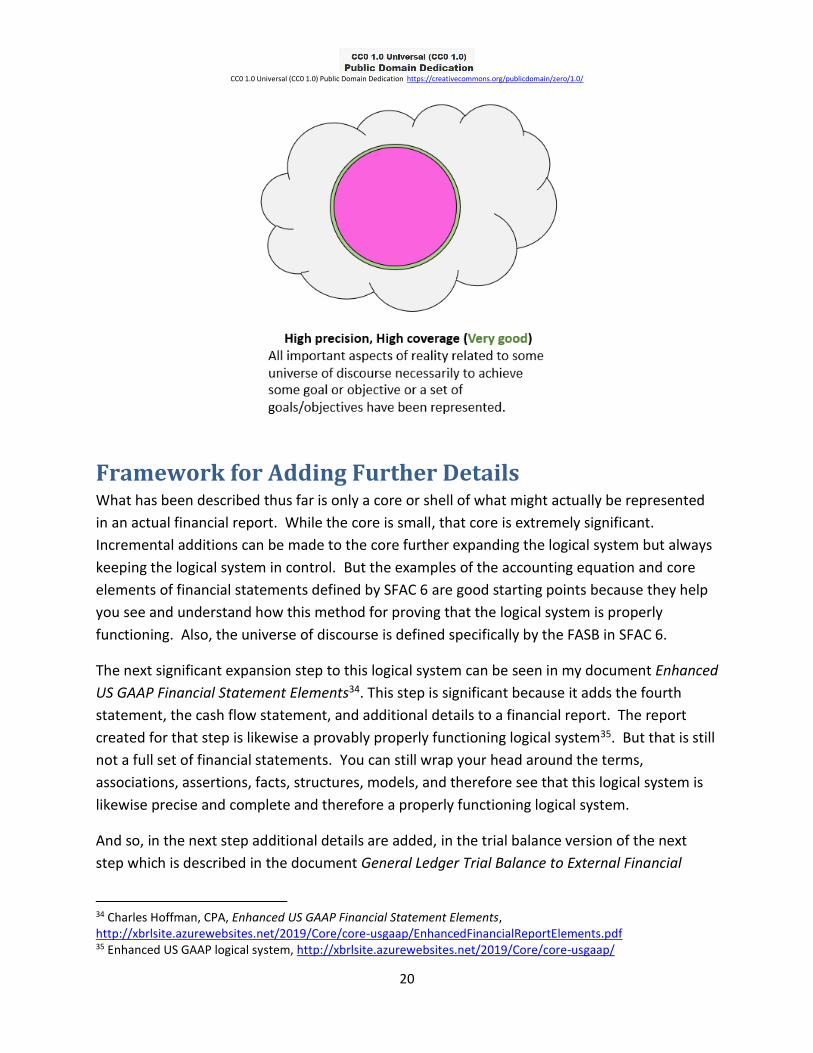
Showing this graphically below, the universe of discourse we are concerned with at the
moment is only SFAC 6. That is represented by the GREEN circle. Because the logical
representation has high precision, the representation in PINK is essentially the same size as
GREEN showing that the coverage is appropriate. The description is precise because no one
really can demonstrate or prove that anything in the system is imprecise. Further, the facts
reported, the terms used, the assertions, the associations, the structures that make up the
model are all consistent with expectations of all stakeholders that are concerned with this
system.
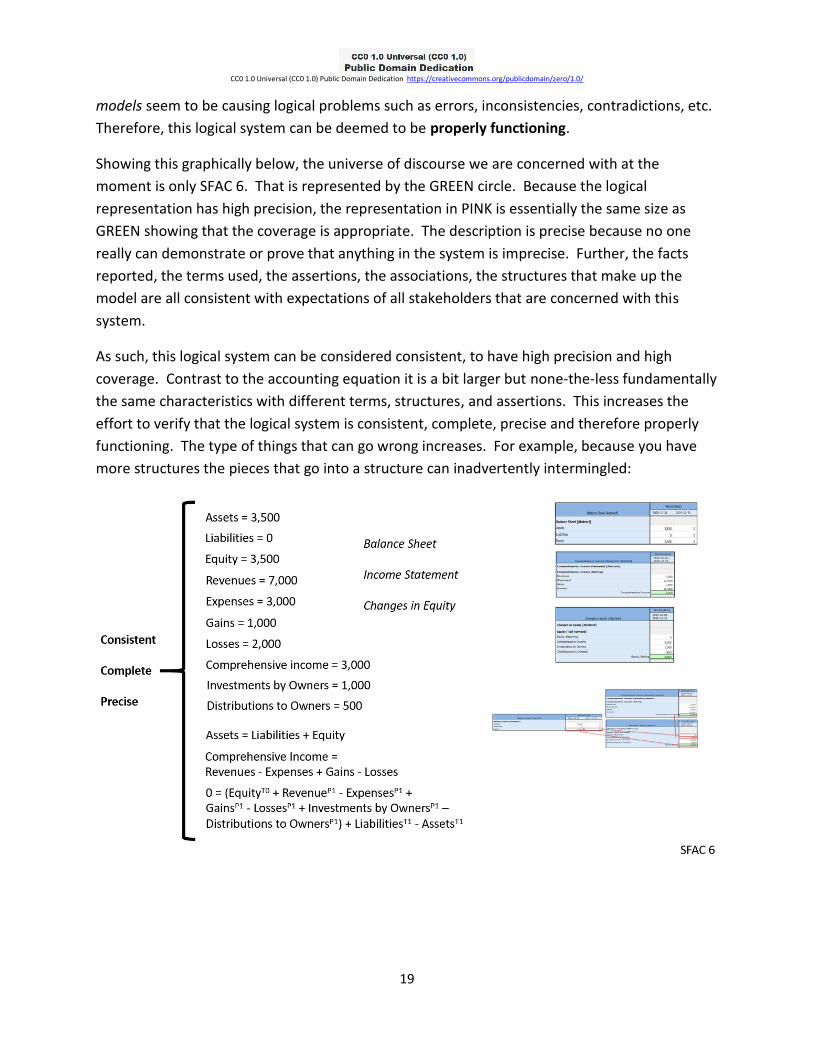
As such, this logical system can be considered consistent, to have high precision and high
coverage. Contrast to the accounting equation it is a bit larger but none-the-less fundamentally
the same characteristics with different terms, structures, and assertions. This increases the
effort to verify that the logical system is consistent, complete, precise and therefore properly
functioning. The type of things that can go wrong increases. For example, because you have
more structures the pieces that go into a structure can inadvertently intermingled:
CC0 1.0 Universal (CC0 1.0) Public Domain Dedication https://creativecommons.org/publicdomain/zero/1.0/
20
Framework for Adding Further Details What has been described thus far is only a core or shell of what might actually be represented
in an actual financial report. While the core is small, that core is extremely significant.
Incremental additions can be made to the core further expanding the logical system but always
keeping the logical system in control. But the examples of the accounting equation and core
elements of financial statements defined by SFAC 6 are good starting points because they help
you see and understand how this method for proving that the logical system is properly
functioning. Also, the universe of discourse is defined specifically by the FASB in SFAC 6.
The next significant expansion step to this logical system can be seen in my document Enhanced
US GAAP Financial Statement Elements34. This step is significant because it adds the fourth
statement, the cash flow statement, and additional details to a financial report. The report
created for that step is likewise a provably properly functioning logical system35. But that is still
not a full set of financial statements. You can still wrap your head around the terms,
associations, assertions, facts, structures, models, and therefore see that this logical system is
likewise precise and complete and therefore a properly functioning logical system.
And so, in the next step additional details are added, in the trial balance version of the next
step which is described in the document General Ledger Trial Balance to External Financial
34 Charles Hoffman, CPA, Enhanced US GAAP Financial Statement Elements, http://xbrlsite.azurewebsites.net/2019/Core/core-usgaap/EnhancedFinancialReportElements.pdf 35 Enhanced US GAAP logical system, http://xbrlsite.azurewebsites.net/2019/Core/core-usgaap/
CC0 1.0 Universal (CC0 1.0) Public Domain Dedication https://creativecommons.org/publicdomain/zero/1.0/
21
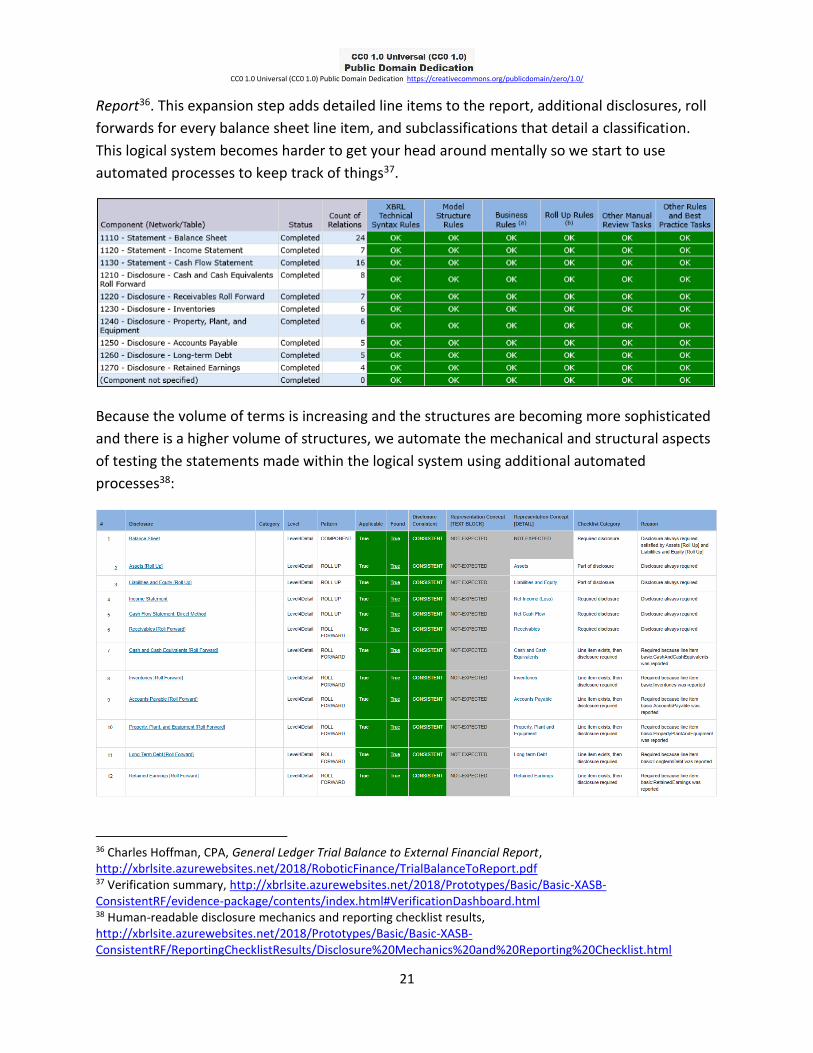
Report36. This expansion step adds detailed line items to the report, additional disclosures, roll
forwards for every balance sheet line item, and subclassifications that detail a classification.
This logical system becomes harder to get your head around mentally so we start to use
automated processes to keep track of things37.
Because the volume of terms is increasing and the structures are becoming more sophisticated
and there is a higher volume of structures, we automate the mechanical and structural aspects
of testing the statements made within the logical system using additional automated
processes38:
36 Charles Hoffman, CPA, General Ledger Trial Balance to External Financial Report, http://xbrlsite.azurewebsites.net/2018/RoboticFinance/TrialBalanceToReport.pdf 37 Verification summary, http://xbrlsite.azurewebsites.net/2018/Prototypes/Basic/Basic-XASB-ConsistentRF/evidence-package/contents/index.html#VerificationDashboard.html 38 Human-readable disclosure mechanics and reporting checklist results, http://xbrlsite.azurewebsites.net/2018/Prototypes/Basic/Basic-XASB-ConsistentRF/ReportingChecklistResults/Disclosure%20Mechanics%20and%20Reporting%20Checklist.html
CC0 1.0 Universal (CC0 1.0) Public Domain Dedication https://creativecommons.org/publicdomain/zero/1.0/
22
At this step you can begin to see specific types of errors that can, and do, creep into the logical
system. The document Proving Accounting, Structural, Mathematical, and Other Logic of XBRL-
based Financial Reports39 details and describes nine specific types of errors that I tend to see in
XBRL-based digital financial reports that must be controlled and prevented in order to maintain
high report quality.
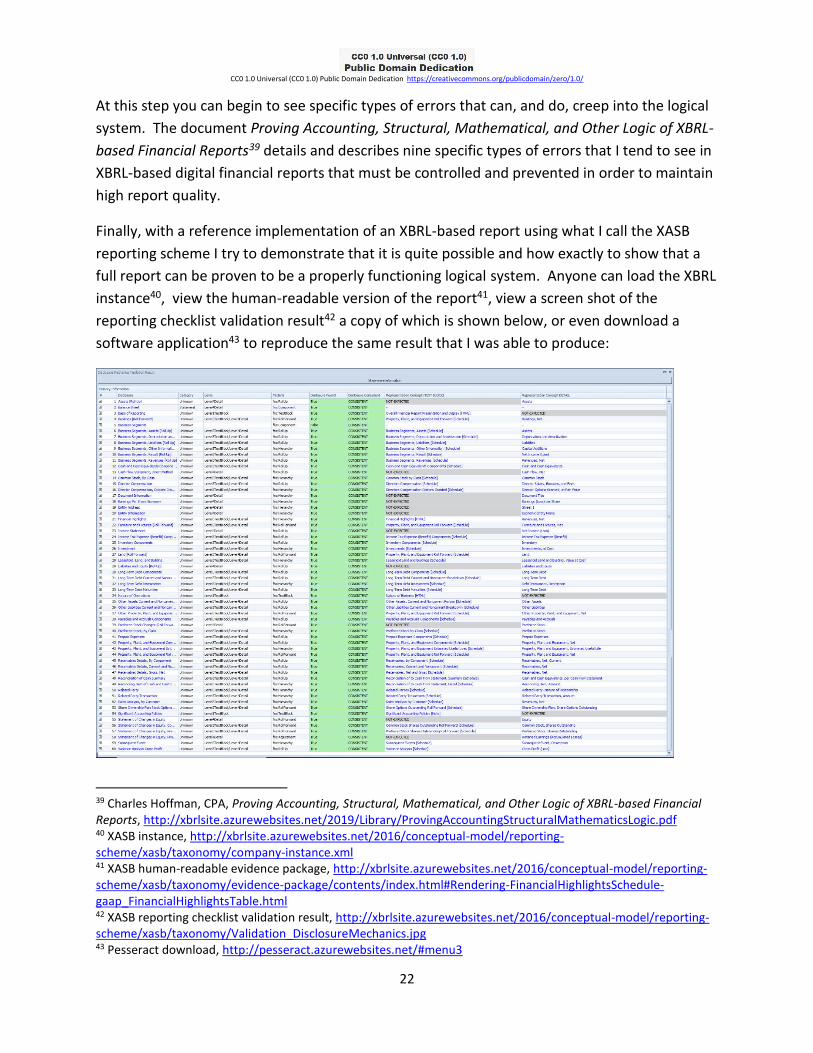
Finally, with a reference implementation of an XBRL-based report using what I call the XASB
reporting scheme I try to demonstrate that it is quite possible and how exactly to show that a
full report can be proven to be a properly functioning logical system. Anyone can load the XBRL
instance40, view the human-readable version of the report41, view a screen shot of the
reporting checklist validation result42 a copy of which is shown below, or even download a
software application43 to reproduce the same result that I was able to produce:
39 Charles Hoffman, CPA, Proving Accounting, Structural, Mathematical, and Other Logic of XBRL-based Financial Reports, http://xbrlsite.azurewebsites.net/2019/Library/ProvingAccountingStructuralMathematicsLogic.pdf 40 XASB instance, http://xbrlsite.azurewebsites.net/2016/conceptual-model/reporting-scheme/xasb/taxonomy/company-instance.xml 41 XASB human-readable evidence package, http://xbrlsite.azurewebsites.net/2016/conceptual-model/reporting-scheme/xasb/taxonomy/evidence-package/contents/index.html#Rendering-FinancialHighlightsSchedule-gaap_FinancialHighlightsTable.html 42 XASB reporting checklist validation result, http://xbrlsite.azurewebsites.net/2016/conceptual-model/reporting-scheme/xasb/taxonomy/Validation_DisclosureMechanics.jpg 43 Pesseract download, http://pesseract.azurewebsites.net/#menu3
CC0 1.0 Universal (CC0 1.0) Public Domain Dedication https://creativecommons.org/publicdomain/zero/1.0/
23
What the screen shot above is intended to communicate is that the same basic techniques used
to prove that the SFAC 6 logical system is properly functioning can be used to verify that any
XBRL-based financial report can be proven to be properly functioning or specify specifically
where it is not properly functioning.
The key is simple: the facts, assertions, associations, terms, structures, and models that make
statements about the logical system MUST be in a state of equilibrium where no, say, assertion
is missing that would have proven that a fact is misrepresented, inconsistent with, or
contradicts some other fact and a quality problem can therefore slip into the logical system
undetected.
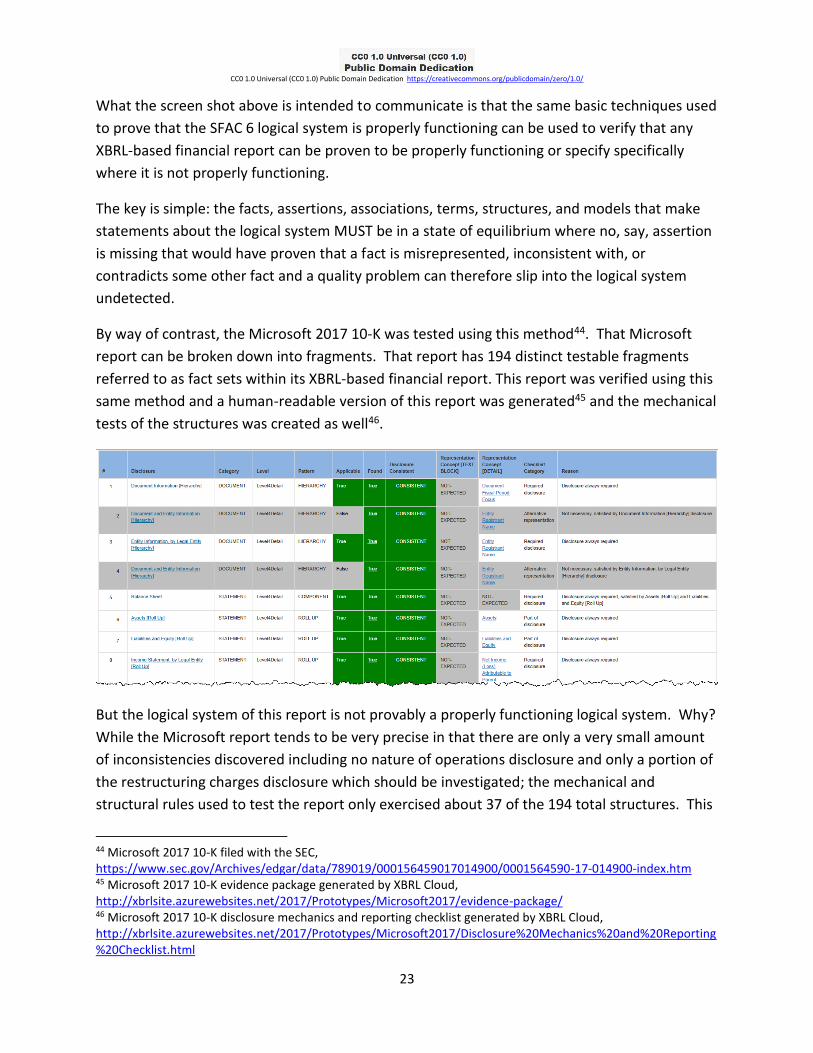
By way of contrast, the Microsoft 2017 10-K was tested using this method44. That Microsoft
report can be broken down into fragments. That report has 194 distinct testable fragments
referred to as fact sets within its XBRL-based financial report. This report was verified using this
same method and a human-readable version of this report was generated45 and the mechanical
tests of the structures was created as well46.
But the logical system of this report is not provably a properly functioning logical system. Why?
While the Microsoft report tends to be very precise in that there are only a very small amount
of inconsistencies discovered including no nature of operations disclosure and only a portion of
the restructuring charges disclosure which should be investigated; the mechanical and
structural rules used to test the report only exercised about 37 of the 194 total structures. This
44 Microsoft 2017 10-K filed with the SEC, https://www.sec.gov/Archives/edgar/data/789019/000156459017014900/0001564590-17-014900-index.htm 45 Microsoft 2017 10-K evidence package generated by XBRL Cloud, http://xbrlsite.azurewebsites.net/2017/Prototypes/Microsoft2017/evidence-package/ 46 Microsoft 2017 10-K disclosure mechanics and reporting checklist generated by XBRL Cloud, http://xbrlsite.azurewebsites.net/2017/Prototypes/Microsoft2017/Disclosure%20Mechanics%20and%20Reporting%20Checklist.html
CC0 1.0 Universal (CC0 1.0) Public Domain Dedication https://creativecommons.org/publicdomain/zero/1.0/
24
is because the set of machine-readable rules used to exercise the report is not complete.
Because of the missing rules the logical system of the report is not provably properly
functioning because (a) facts could have been reported incorrectly and (b) there are no rules to
discover the error.
The financial report logical system can be made more complete by adding the additional rules
that are currently missing and then the report can then be proven to be a properly functioning
logical system.
This method is the audit strategy for XBRL-based reports described in the document Auditing
XBRL-based Financial Reports47.
Variability Caused by Alternative Intermediate
Components of Comprehensive Income While financial reports must fit within the elements of a financial report defined by a financial reporting
scheme; financial reports are not forms. Specific variability is anticipated and allowed by financial
reporting schemes such as US GAAP, IFRS, IPSAS, GAS, FAS, etc.48 By far, the most variability that exists
within a set of financial statements exists on the income statement. SFAC 6 discusses the notion of
intermediate components49 of comprehensive income:
“Examples of intermediate components in business enterprises are gross margin, income from
continuing operations before taxes, income from continuing operations, and operating income.
Those intermediate components are, in effect, subtotals of comprehensive income and often of
one another in the sense that they can be combined with each other or with the basic
components to obtain other intermediate measures of comprehensive income.”
Basically, variability can be caused by choosing to report different common subtotals or by choosing to
report specific line items rather than others. I refer to these different subtotals and specific line items as
the notion of reporting styles50. This variability is not random or completely arbitrary. There are
common reporting style patterns.
Of the four concepts “revenues”, “expenses”, “gains”, and “losses” there are themes in the definitions
of the terms. One theme is the notion of something related to an “entity’s ongoing major or central
47 Charles Hoffman, CPA, Auditing XBRL-based Financial Reports, http://xbrlsite.azurewebsites.net/2019/Library/AudtingXBRLBasedFinancialReports.pdf 48 Charles Hoffman, CPA, Comparison of Elements of Financial Statements, http://xbrlsite.azurewebsites.net/2019/Core/ElementsOfFinancialStatements.pdf 49 FASB, SFAC 6, page 47, paragraph 77. 50 Open Framework for Implementing XBRL-based Financial Reporting, Reporting Styles, http://xbrlsite.azurewebsites.net/2019/Framework/Details/ReportingStyle.html
CC0 1.0 Universal (CC0 1.0) Public Domain Dedication https://creativecommons.org/publicdomain/zero/1.0/
25
operations” (i.e. revenues, expenses) and something “from peripheral or incidental transactions” (i.e.
gains, losses). This notion is discussed in SFAC 6.
Of the approximately 6,000 public companies that report to the SEC, 87% of those companies using one
of only nine different sets of intermediate components, i.e. subtotals, to report their income
statements. About 89.1% of public companies are completely consistent with the patterns of alternative
intermediate component organization schemes (i.e. reporting styles) and approximately 99.24% of total
relations are consistent with expectation51. This is all measurable.
Measurements can be used to establish the assertions and associations necessary and therefore the
structures and models necessary in order to both explain and verify reported facts within XBRL-based
financial reports.
This approach works for every financial reporting scheme52. This is a fundamental feature of financial
reporting. All of this is provable using mathematics, the double-entry accounting model, the accounting
equation, the elements of financial statements defined by standards setters, and the actual financial
reports created by economic entities.
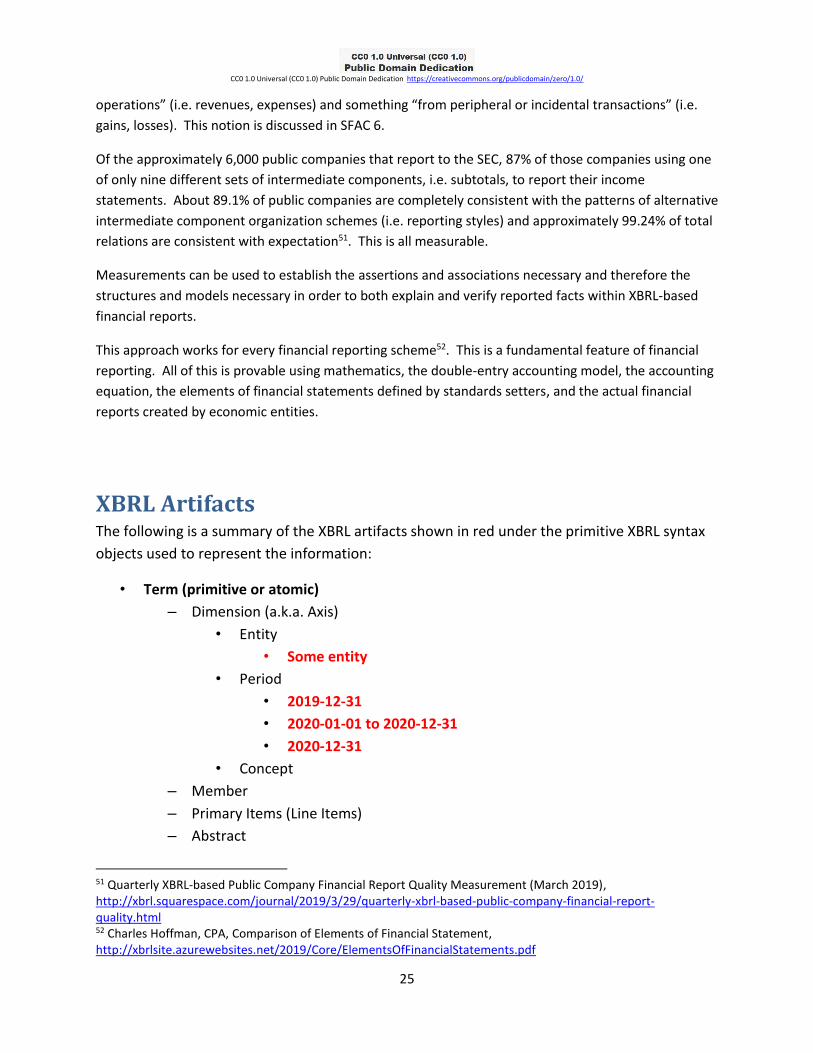
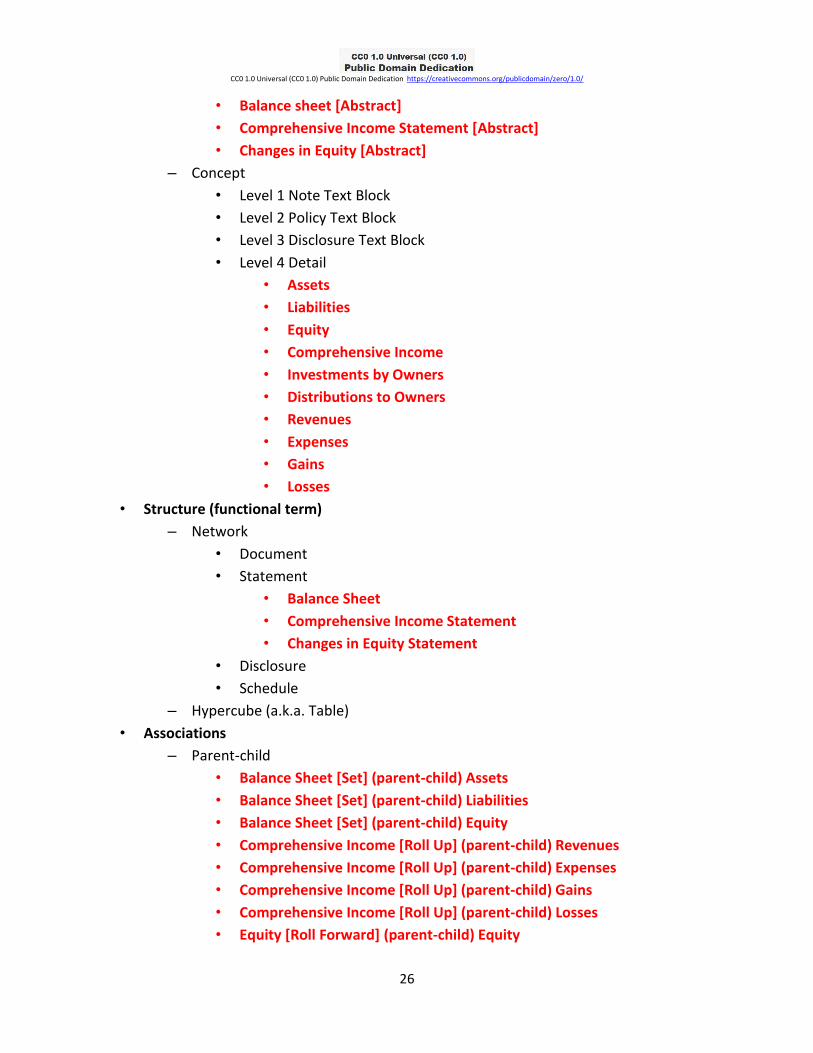
XBRL Artifacts The following is a summary of the XBRL artifacts shown in red under the primitive XBRL syntax
objects used to represent the information:
• Term (primitive or atomic)
– Dimension (a.k.a. Axis)
• Entity
• Some entity
• Period
• 2019-12-31
• 2020-01-01 to 2020-12-31
• 2020-12-31
• Concept
– Member
– Primary Items (Line Items)
– Abstract
51 Quarterly XBRL-based Public Company Financial Report Quality Measurement (March 2019), http://xbrl.squarespace.com/journal/2019/3/29/quarterly-xbrl-based-public-company-financial-report-quality.html 52 Charles Hoffman, CPA, Comparison of Elements of Financial Statement, http://xbrlsite.azurewebsites.net/2019/Core/ElementsOfFinancialStatements.pdf
CC0 1.0 Universal (CC0 1.0) Public Domain Dedication https://creativecommons.org/publicdomain/zero/1.0/
26
• Balance sheet [Abstract]
• Comprehensive Income Statement [Abstract]
• Changes in Equity [Abstract]
– Concept
• Level 1 Note Text Block
• Level 2 Policy Text Block
• Level 3 Disclosure Text Block
• Level 4 Detail
• Assets
• Liabilities
• Equity
• Comprehensive Income
• Investments by Owners
• Distributions to Owners
• Revenues
• Expenses
• Gains
• Losses
• Structure (functional term)
– Network
• Document
• Statement
• Balance Sheet
• Comprehensive Income Statement
• Changes in Equity Statement
• Disclosure
• Schedule
– Hypercube (a.k.a. Table)
• Associations
– Parent-child
• Balance Sheet [Set] (parent-child) Assets
• Balance Sheet [Set] (parent-child) Liabilities
• Balance Sheet [Set] (parent-child) Equity
• Comprehensive Income [Roll Up] (parent-child) Revenues
• Comprehensive Income [Roll Up] (parent-child) Expenses
• Comprehensive Income [Roll Up] (parent-child) Gains
• Comprehensive Income [Roll Up] (parent-child) Losses
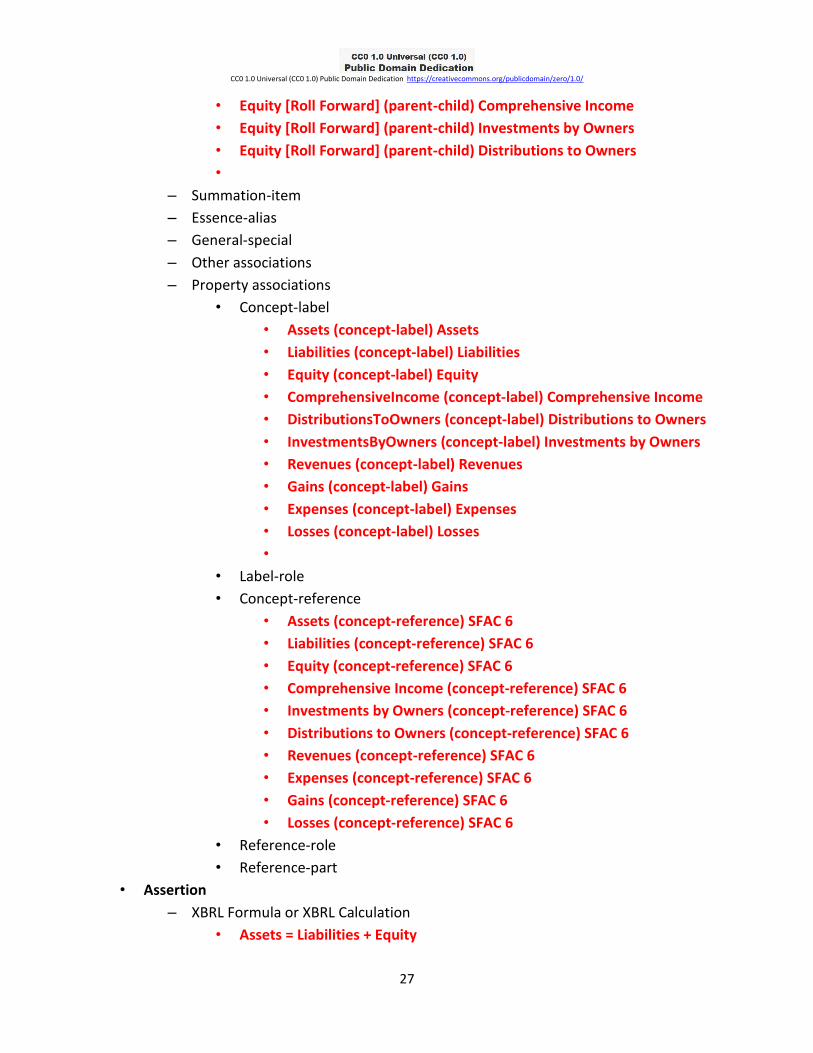
• Equity [Roll Forward] (parent-child) Equity
CC0 1.0 Universal (CC0 1.0) Public Domain Dedication https://creativecommons.org/publicdomain/zero/1.0/
27
• Equity [Roll Forward] (parent-child) Comprehensive Income
• Equity [Roll Forward] (parent-child) Investments by Owners
• Equity [Roll Forward] (parent-child) Distributions to Owners
•
– Summation-item
– Essence-alias
– General-special
– Other associations
– Property associations
• Concept-label
• Assets (concept-label) Assets
• Liabilities (concept-label) Liabilities
• Equity (concept-label) Equity
• ComprehensiveIncome (concept-label) Comprehensive Income
• DistributionsToOwners (concept-label) Distributions to Owners
• InvestmentsByOwners (concept-label) Investments by Owners
• Revenues (concept-label) Revenues
• Gains (concept-label) Gains
• Expenses (concept-label) Expenses
• Losses (concept-label) Losses
•
• Label-role
• Concept-reference
• Assets (concept-reference) SFAC 6
• Liabilities (concept-reference) SFAC 6
• Equity (concept-reference) SFAC 6
• Comprehensive Income (concept-reference) SFAC 6
• Investments by Owners (concept-reference) SFAC 6
• Distributions to Owners (concept-reference) SFAC 6
• Revenues (concept-reference) SFAC 6
• Expenses (concept-reference) SFAC 6
• Gains (concept-reference) SFAC 6
• Losses (concept-reference) SFAC 6
• Reference-role
• Reference-part
• Assertion
– XBRL Formula or XBRL Calculation
• Assets = Liabilities + Equity
CC0 1.0 Universal (CC0 1.0) Public Domain Dedication https://creativecommons.org/publicdomain/zero/1.0/
28
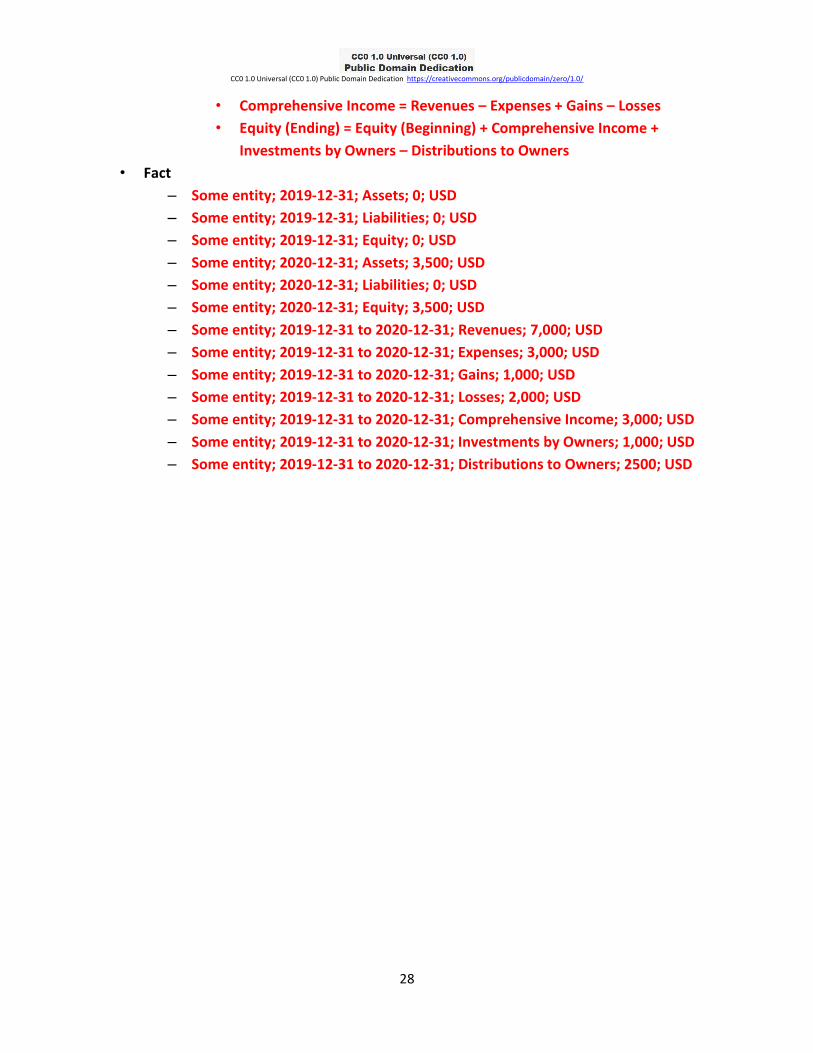
• Comprehensive Income = Revenues – Expenses + Gains – Losses
• Equity (Ending) = Equity (Beginning) + Comprehensive Income +
Investments by Owners – Distributions to Owners
• Fact
– Some entity; 2019-12-31; Assets; 0; USD
– Some entity; 2019-12-31; Liabilities; 0; USD
– Some entity; 2019-12-31; Equity; 0; USD
– Some entity; 2020-12-31; Assets; 3,500; USD
– Some entity; 2020-12-31; Liabilities; 0; USD
– Some entity; 2020-12-31; Equity; 3,500; USD
– Some entity; 2019-12-31 to 2020-12-31; Revenues; 7,000; USD
– Some entity; 2019-12-31 to 2020-12-31; Expenses; 3,000; USD
– Some entity; 2019-12-31 to 2020-12-31; Gains; 1,000; USD
– Some entity; 2019-12-31 to 2020-12-31; Losses; 2,000; USD
– Some entity; 2019-12-31 to 2020-12-31; Comprehensive Income; 3,000; USD
– Some entity; 2019-12-31 to 2020-12-31; Investments by Owners; 1,000; USD
– Some entity; 2019-12-31 to 2020-12-31; Distributions to Owners; 2500; USD