Building on LEED Improving the evaluation of ‘green bulidings’ Erika Larsen Kathryn King Likwan...
22
Building on LEED Building on LEED Improving the evaluation of ‘green bulidings’ Improving the evaluation of ‘green bulidings’ Erika Larsen Erika Larsen Kathryn King Kathryn King Likwan Cheng Likwan Cheng Alp Esener Alp Esener
-
date post
20-Dec-2015 -
Category
Documents
-
view
215 -
download
1
Transcript of Building on LEED Improving the evaluation of ‘green bulidings’ Erika Larsen Kathryn King Likwan...

Building on LEEDBuilding on LEEDImproving the evaluation of ‘green bulidings’ Improving the evaluation of ‘green bulidings’
Erika LarsenErika Larsen
Kathryn KingKathryn King
Likwan ChengLikwan Cheng
Alp EsenerAlp Esener
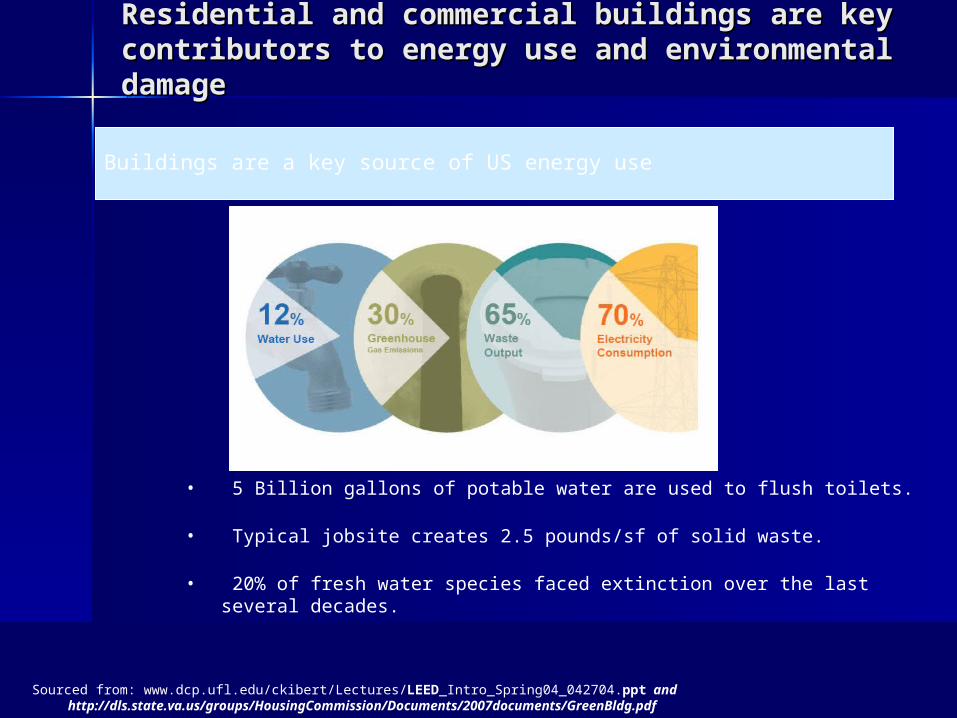
Buildings are a key source of US energy use
Residential and commercial buildings are key Residential and commercial buildings are key contributors to energy use and environmental contributors to energy use and environmental damagedamage
• 5 Billion gallons of potable water are used to flush toilets.
• Typical jobsite creates 2.5 pounds/sf of solid waste.
• 20% of fresh water species faced extinction over the last several decades.
Sourced from: www.dcp.ufl.edu/ckibert/Lectures/LEED_Intro_Spring04_042704.ppt and http://dls.state.va.us/groups/HousingCommission/Documents/2007documents/GreenBldg.pdf
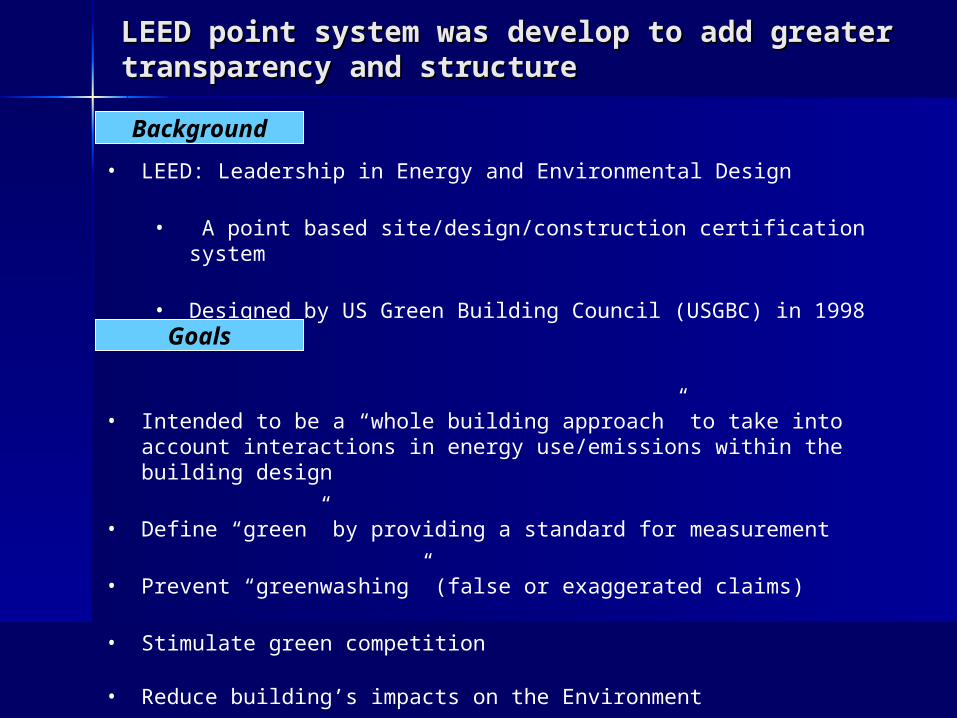
LEED point system was develop to add greater LEED point system was develop to add greater transparency and structuretransparency and structure
• LEED: Leadership in Energy and Environmental Design
• A point based site/design/construction certification system
• Designed by US Green Building Council (USGBC) in 1998
• Intended to be a “whole building approach” to take into account interactions in energy use/emissions within the building design
• Define “green” by providing a standard for measurement
• Prevent “greenwashing” (false or exaggerated claims)
• Stimulate green competition
• Reduce building’s impacts on the Environment
• Raise consumer awareness
Background
Goals
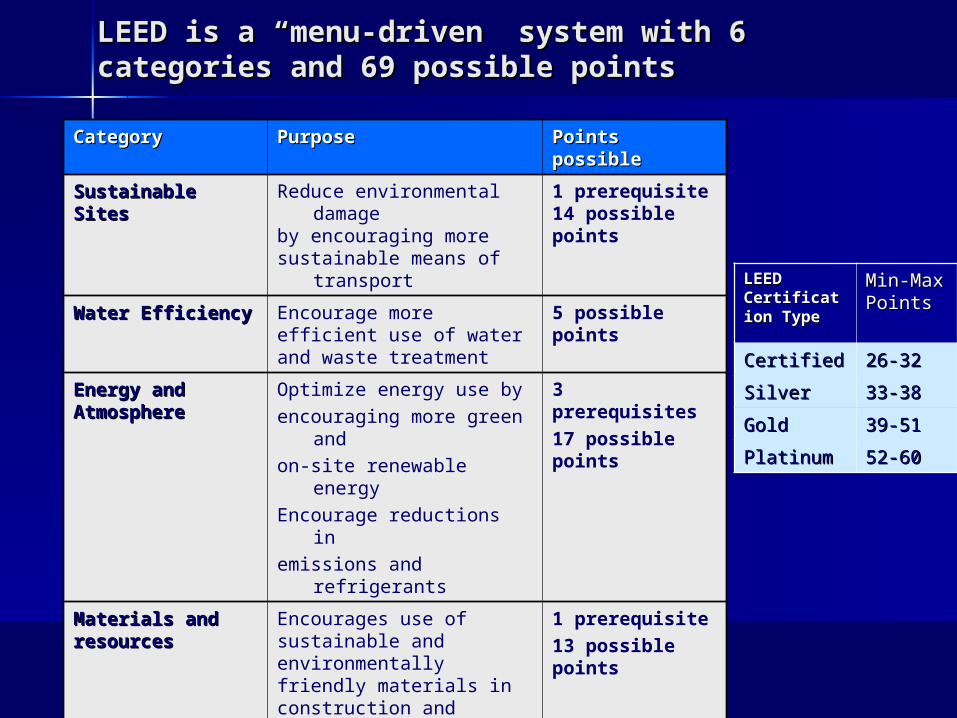
LEED is a “menu-driven” system with 6 LEED is a “menu-driven” system with 6 categories and 69 possible points categories and 69 possible points
CategoryCategory PurposePurpose Points possiblePoints possible
Sustainable SitesSustainable Sites Reduce environmental damage
by encouraging moresustainable means of
transport
1 prerequisite 14 possible points
Water EfficiencyWater Efficiency Encourage more efficient use of water and waste treatment
5 possible points
Energy and Energy and AtmosphereAtmosphere
Optimize energy use byencouraging more green
andon-site renewable energyEncourage reductions inemissions and refrigerants
3 prerequisites17 possible points
Materials and Materials and resourcesresources
Encourages use of sustainable and environmentally friendly materials in construction and renovation.
1 prerequisite 13 possible points
Indoor Indoor Environmental Environmental QualityQuality
Encourage standards and products that reduce health risks to occupants
2 prerequisites 15 possible points
Innovation and Innovation and DesignDesign
Incentivize adherence to LEED design code, e.g., including LEED certified member in process
5 possible points
LEED LEED CertificatioCertification Typen Type
Min-Max Min-Max PointsPoints
CertifiedCertified 26-3226-32
SilverSilver 33-3833-38
GoldGold 39-5139-51
PlatinumPlatinum 52-6052-60

There are several benefits of the LEED modelThere are several benefits of the LEED model
Overall (across building types)
Economic
Health & Safety
• Initial premium is estimated under 5%, less with proper education• In one case study, market value increased $4 for every $1 invested in
green improvements• In another case study, waste management and cleaning costs
decreased from $1.87 to $1.16/sq. ft• Also linked to retail sales and workplace productivity increases (2-
16%)
• People on average spend 90% of time indoors• Contaminants indoors can be 2 to 5x worse than outdoors• Sickness as a result of improper cleaning estimated to cause more than
$60-400 bn annually in productivity losses
Sourced from: http://www.rose-hulman.edu/users/groups/Facilities/HTML/departments/custodial/Sustainability-01-15-2007.ppt#273,10,Examples of Customer Value

As a result, LEED projects and USGBC As a result, LEED projects and USGBC memberships have steadily increasedmemberships have steadily increased
LEED Projects have increased steadily across all type of buildings
And USGBC membership growth has reflected this expansion
Sourced from: http://dls.state.va.us/groups/HousingCommission/Documents/2007documents/GreenBldg.pdf

CurrentCurrent CritiquesCritiques of LEED 2.2 of LEED 2.2
LEED was initially designed to be a helpful tool, not a mandate
Inequitable points:•The LEED point system awards 1 point for most project items.
•Does not weigh more cost-effective or energy efficient schemes more heavily.
Administrative drawbacks:•Can take up to 300 days to become certified.
•Documentation can take up to 225 hours to fully complete and be verified.

• A new version has been released for A new version has been released for public comment. public comment.
• Our project will evaluate the energy Our project will evaluate the energy and atmosphere section looking at :and atmosphere section looking at :
• Point distribution Point distribution
• LabsLabs
LEED 3.0

LEED 3.0LEED 3.0
Energy and Energy and AtmosphereAtmosphere
Energy Section is 24% of Energy Section is 24% of total pointstotal points
Energy section is 35% of Energy section is 35% of total pointstotal points
Minimum Energy Minimum Energy Performance 14%Performance 14%
Minimum Energy Minimum Energy PerformancePerformance
10%10%
Need to increase energy Need to increase energy performance by 3.5% to performance by 3.5% to receive additional pointsreceive additional points
Need to increase energy Need to increase energy performance by 4.0 % to performance by 4.0 % to receive additional pointsreceive additional points
LEED 2.2 LEED 3.0

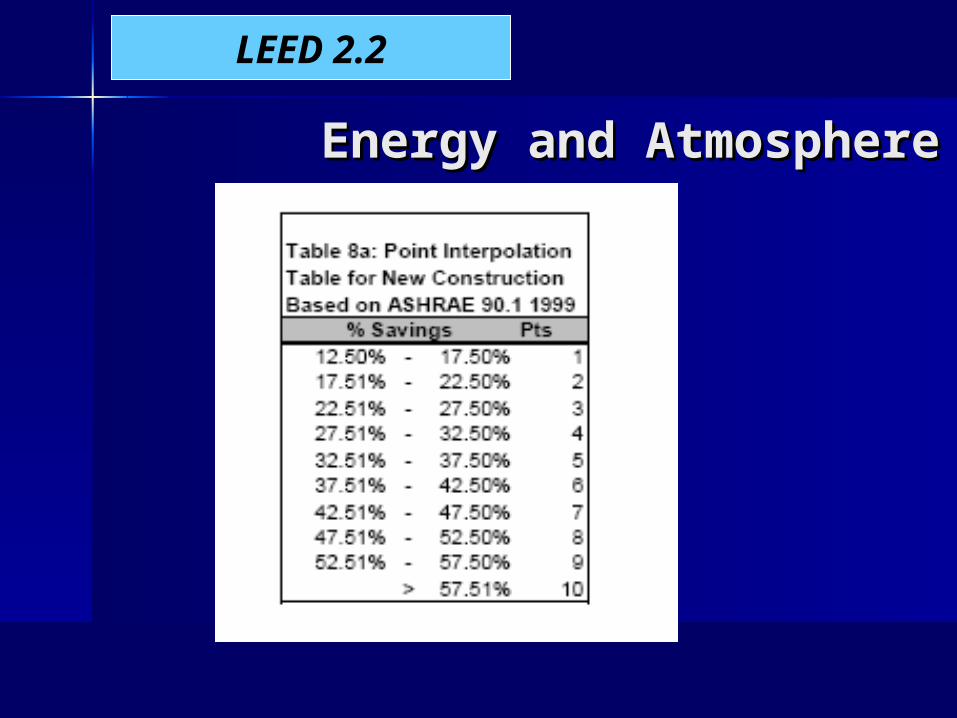
Energy and Energy and AtmosphereAtmosphere
LEED 2.2
Percent Energy Savings =
Performance Baseline – Predicted Performance
100 x –––––––––––––––––––––––––––
Performance Baseline
Energy and Energy and AtmosphereAtmosphere
LEED 2.2
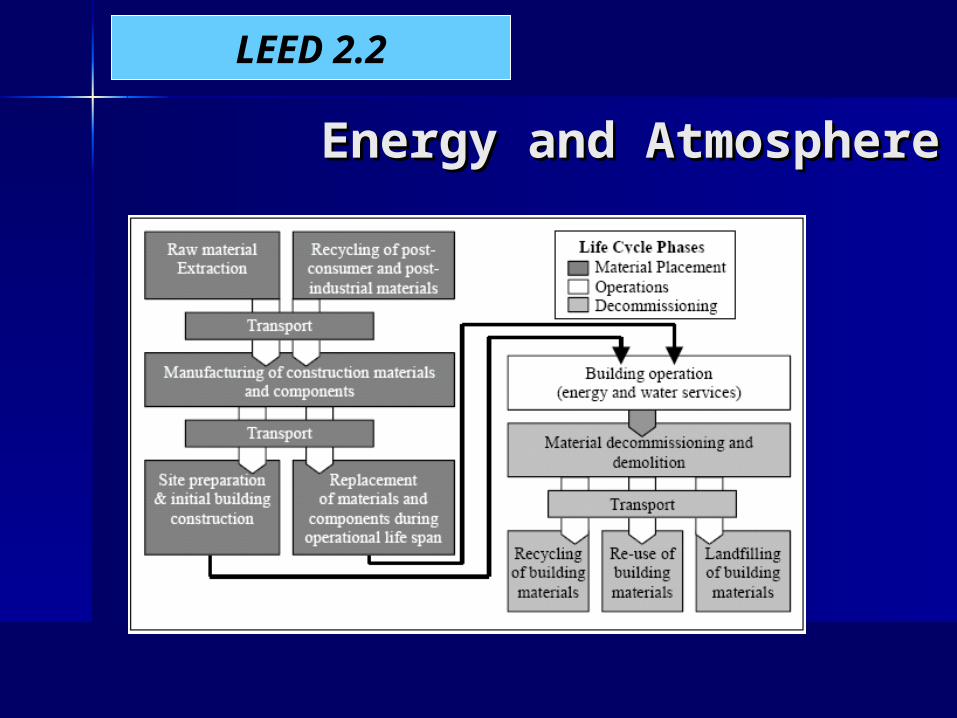
Energy and Energy and AtmosphereAtmosphere
LEED 2.2
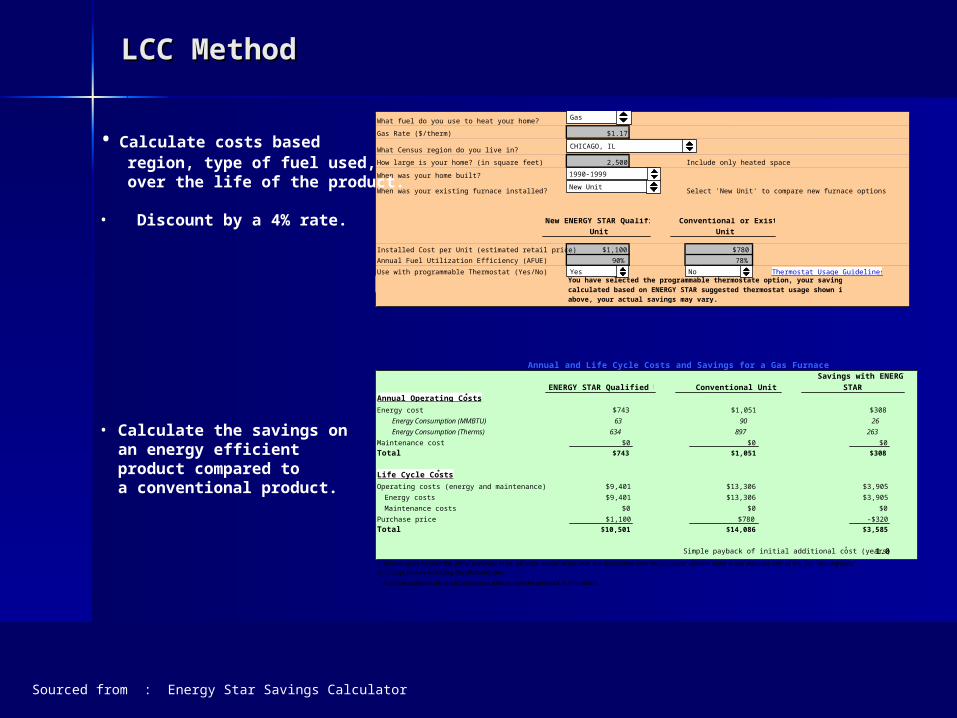
LCC MethodLCC Method
Sourced from : Energy Star Savings Calculator
Annual Operating Costs*
Energy cost $743 $1,051 $308
Energy Consumption (MMBTU) 63 90 26
Energy Consumption (Therms) 634 897 263
Maintenance cost $0 $0 $0Total $743 $1,051 $308
Life Cycle Costs*
Operating costs (energy and maintenance) $9,401 $13,306 $3,905
Energy costs $9,401 $13,306 $3,905
Maintenance costs $0 $0 $0
Purchase price $1,100 $780 -$320Total $10,501 $14,086 $3,585
Simple payback of initial additional cost (years)† 1.0
Annual and Life Cycle Costs and Savings for a Gas Furnace
† A simple payback period of zero years means that the payback is immediate.
ENERGY STAR Qualified Unit Conventional Unit
Savings with ENERGY
STAR
* Annual costs exclude the initial purchase price. All costs, except initial cost, are discounted over the products' lifetime using a real discount rate of 4%. See "Assumptions" to change factors including the discount rate.
What fuel do you use to heat your home?
Gas Rate ($/therm) $1.17
What Census region do you live in?
How large is your home? (in square feet) 2,500 Include only heated space
When was your home built?
When was your existing furnace installed? Select 'New Unit' to compare new furnace options
Installed Cost per Unit (estimated retail price) $1,100 $780
Annual Fuel Utilization Efficiency (AFUE) 90% 78%
Use with programmable Thermostat (Yes/No)You have selected the programmable thermostate option, your savings are calculated based on ENERGY STAR suggested thermostat usage shown in the link above, your actual savings may vary.
Thermostat Usage Guidelines
New ENERGY STAR Qualified
Unit
Conventional or Existing
Unit
CHICAGO, IL
Gas
Yes No
New Unit
1990-1999
• Calculate costs based region, type of fuel used, over the life of the product.
• Discount by a 4% rate.
• Calculate the savings on an energy efficient product compared to a conventional product.

LCC comparison LCC comparison
Sourced from : Energy Star Savings Calculator
Initial cost difference $320Life cycle savings $3,905Net life cycle savings (life cycle savings - additional cost) $3,585Simple payback of additional cost (years) 1.0Life cycle energy saved (MMBtu) 474Life cycle air pollution reduction (lbs of CO2) 55,456
Air pollution reduction equivalence (number of cars removed from the road for a year) 5Air pollution reduction equivalence (acres of forest) 7Savings as a percent of retail price 326%
Summary of Benefits for a Gas Furnace
Initial cost difference $19Life cycle savings $2,519Net life cycle savings (life cycle savings - additional cost) $2,500Life cycle energy saved (MBTU)-includes both Heating and Cooling 236Simple payback of additional cost (years) 0.1Life cycle air pollution reduction (lbs of CO2) 30,297
Air pollution reduction equivalence (number of cars removed from the road for a year) 3Air pollution reduction equivalence (acres of forest) 4Savings as a percent of retail price 2718%
Summary of Benefits for 1 Programmable Thermostat(s)
• Two products that are both designed to provide an 18% energy efficiency.
• However have very different economic impacts.

LCA MethodLCA Method
Sourced from : BEES software. NOTE: A lower score is better
• The LCA method is calculated by looking at the all necessary inputs during the life of a product.
• This number can is calculated by different software such as BEES TRACI or GABI.
• The software is able to trace out different areas of interest such as energy input or GHG emissions over the life of the product.

LCA Case study: PV solar panel LCA Case study: PV solar panel
Sourced from : GABI software
QuickTime™ and aTIFF (Uncompressed) decompressor
are needed to see this picture.
• The energy used during the life cycle of the BOS is not included in the current LEED point structure.

LCA Case Study: PC solar system LCA Case Study: PC solar system
Sourced from : BEES software
QuickTime™ and aTIFF (Uncompressed) decompressor
are needed to see this picture.•The GHG emission created during the life cycle of the BOS is not included in the current LEED point structure.

LCA LEED point LCA LEED point
Sourced from : BEES software
• The most sustainable LEED point system would weight according to the LCC (economic Impact) and the LCA (environmental impact)

Costs and Benefits of LCC and LCACosts and Benefits of LCC and LCA
Costs Benefits
Complexity Accurate Environmental Impact
Building Data BasesBuilding Data Bases Fully Sustainable Fully Sustainable ApproachApproach
Training Training

LEED For Laboratory Buildings? LEED For Laboratory Buildings?
Electricity Usage by Building Types (kWh/sf)
Sch
ool
1414 1616
8585
Offi
ce
Lab
Laboratory buildings ––Energy intensive–More complex–Greater variability in operation schedules
LEED-Application Guide for Laboratories…under development.
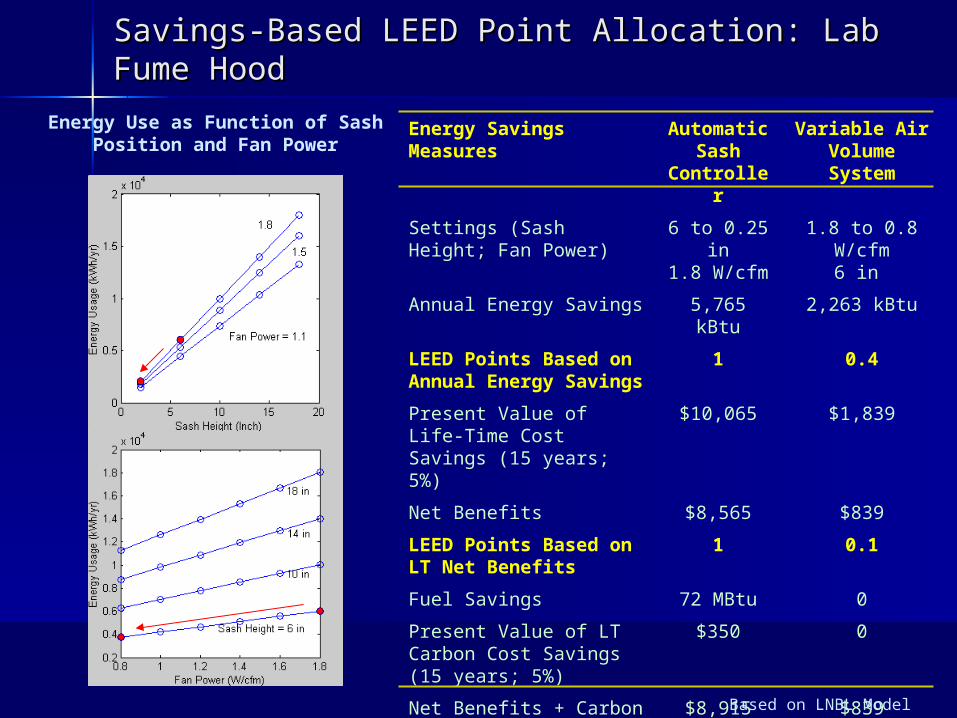
Energy Savings Measures
Automatic Sash
Controller
Variable Air Volume System
Settings (Sash Height; Fan Power)
6 to 0.25 in1.8 W/cfm
1.8 to 0.8 W/cfm6 in
Annual Energy Savings 5,765 kBtu 2,263 kBtu
LEED Points Based on Annual Energy Savings
1 0.4
Present Value of Life-Time Cost Savings (15 years; 5%)
$10,065 $1,839
Net Benefits $8,565 $839
LEED Points Based on LT Net Benefits
1 0.1
Fuel Savings 72 MBtu 0
Present Value of LT Carbon Cost Savings (15 years; 5%)
$350 0
Net Benefits + Carbon Cost Savings
$8,915 $839
LEED Points Based on LT Net Benefits + Carbon Cost Savings
1 0.1
Savings-Based LEED Point Allocation: Lab Fume Savings-Based LEED Point Allocation: Lab Fume HoodHood
Energy Use as Function of Sash Position and Fan Power
Based on LNBL Model
QUESTIONS?QUESTIONS?