Building large trees by combining phylogenetic - CiteSeer
33
Biol. Rev. (1999), 74, pp. 143–175 Printed in the United Kingdom # Cambridge Philosophical Society 143 Building large trees by combining phylogenetic information : a complete phylogeny of the extant Carnivora (Mammalia) OLAF R. P. BININDA-EMONDS"*, JOHN L. GITTLEMAN#† and ANDY PURVIS$ " Department of Zoology, University of Oxford, Oxford OX13PS, U.K. # Department of Ecology and Evolutionary Biology, University of Tennessee, Knoxville, Tennessee, 37996–1610, U.S.A. $ Department of Biology, Imperial College at Silwood Park, Ascot, Berks SL57PY, U.K. E-mail : a.purvis!ic.ac.uk (Received 2 June 1998 ; revised 27 November 1998 ; accepted 16 December 1998) ABSTRACT One way to build larger, more comprehensive phylogenies is to combine the vast amount of phylogenetic information already available. We review the two main strategies for accomplishing this (combining raw data versus combining trees), but employ a relatively new variant of the latter : supertree construction. The utility of one supertree technique, matrix representation using parsimony analysis (MRP), is demonstrated by deriving a complete phylogeny for all 271 extant species of the Carnivora from 177 literature sources. Beyond providing a ‘ consensus ’ estimate of carnivore phylogeny, the tree also indicates taxa for which the relationships remain controversial (e.g. the red panda ; within canids, felids, and hyaenids) or have not been studied in any great detail (e.g. herpestids, viverrids, and intrageneric relationships in the procyonids). Times of divergence throughout the tree were also estimated from 74 literature sources based on both fossil and molecular data. We use the phylogeny to show that some lineages within the Mustelinae and Canidae contain significantly more species than expected for their age, illustrating the tree’s utility for studies of macroevolution. It will also provide a useful foundation for comparative and conservational studies involving the carnivores. Key words : Carnivora, character congruence, taxonomic congruence, supertree, matrix representation, parsimony, divergence times, fossil dates, molecular clock, macroevolution. CONTENTS I. Introduction ............................................................................................................................ 144 II. Combining phylogenetic information ...................................................................................... 145 III. Methodology............................................................................................................................ 146 (1) Mechanics and limitations of matrix representation ......................................................... 146 (2) Determination of the composite phylogeny ....................................................................... 147 (3) Establishing times of divergence........................................................................................ 148 IV. Results and discussion.............................................................................................................. 149 (1) Distribution of taxonomic coverage .................................................................................. 149 * Present address : Section of Evolution and Ecology, One Shields Avenue, University of California at Davis, Davis, CA 95616, U.S.A. E-mail : orbininda!ucdavis.edu. † Present address : Department of Biology, Gilmer Hall, University of Virginia, Charlottesville, VA 22903, U.S.A. E-mail : JLGittleman!virginia.edu.
Transcript of Building large trees by combining phylogenetic - CiteSeer

Biol. Rev. (1999), 74, pp. 143–175 Printed in the United Kingdom # Cambridge Philosophical Society 143
Building large trees by combining phylogenetic
information: a complete phylogeny of the extant
Carnivora (Mammalia)
OLAF R. P. BININDA-EMONDS"*, JOHN L. GITTLEMAN#†and ANDY PURVIS$
"Department of Zoology, University of Oxford, Oxford OX1 3PS, U.K.#Department of Ecology and Evolutionary Biology, University of Tennessee, Knoxville, Tennessee, 37996–1610, U.S.A.$Department of Biology, Imperial College at Silwood Park, Ascot, Berks SL5 7PY, U.K. E-mail : a.purvis!ic.ac.uk
(Received 2 June 1998; revised 27 November 1998; accepted 16 December 1998)
ABSTRACT
One way to build larger, more comprehensive phylogenies is to combine the vast amount of phylogeneticinformation already available. We review the two main strategies for accomplishing this (combining rawdata versus combining trees), but employ a relatively new variant of the latter : supertree construction. Theutility of one supertree technique, matrix representation using parsimony analysis (MRP), is demonstratedby deriving a complete phylogeny for all 271 extant species of the Carnivora from 177 literature sources.Beyond providing a ‘consensus ’ estimate of carnivore phylogeny, the tree also indicates taxa for which therelationships remain controversial (e.g. the red panda; within canids, felids, and hyaenids) or have not beenstudied in any great detail (e.g. herpestids, viverrids, and intrageneric relationships in the procyonids). Timesof divergence throughout the tree were also estimated from 74 literature sources based on both fossil andmolecular data. We use the phylogeny to show that some lineages within the Mustelinae and Canidaecontain significantly more species than expected for their age, illustrating the tree’s utility for studies ofmacroevolution. It will also provide a useful foundation for comparative and conservational studies involvingthe carnivores.
Key words : Carnivora, character congruence, taxonomic congruence, supertree, matrix representation,parsimony, divergence times, fossil dates, molecular clock, macroevolution.
CONTENTS
I. Introduction ............................................................................................................................ 144II. Combining phylogenetic information ...................................................................................... 145
III. Methodology............................................................................................................................ 146(1) Mechanics and limitations of matrix representation ......................................................... 146(2) Determination of the composite phylogeny....................................................................... 147(3) Establishing times of divergence........................................................................................ 148
IV. Results and discussion.............................................................................................................. 149(1) Distribution of taxonomic coverage .................................................................................. 149
* Present address : Section of Evolution and Ecology, One Shields Avenue, University of California at Davis, Davis,CA 95616, U.S.A. E-mail : orbininda!ucdavis.edu.
† Present address : Department of Biology, Gilmer Hall, University of Virginia, Charlottesville, VA 22903, U.S.A.E-mail : JLGittleman!virginia.edu.

144 Olaf R. P. Bininda-Emonds, John L. Gittleman and Andy Purvis
(2) Resolution and robustness................................................................................................. 150(3) Times of divergence .......................................................................................................... 153(4) Fossil versus molecular dates .............................................................................................. 156(5) Systematic implications ..................................................................................................... 160(6) Macroevolutionary............................................................................................................ 164
V. Conclusions .............................................................................................................................. 165VI. Acknowledgements .................................................................................................................. 165
VII. References................................................................................................................................ 165VIII. Appendix ................................................................................................................................. 173
I. INTRODUCTION
The benefits of a complete phylogeny for a giventaxon (beyond the systematic ones) are clear.Phylogenies underpin comparative biology (Felsen-stein, 1985b ; Harvey et al., 1996), and trees that arewell-resolved, complete, and include estimates ofdivergence dates allow more powerful tests of a widerrange of hypotheses (Harvey & Pagel, 1991). Inaddition to facilitating general studies of adaptation,complete phylogenies are critical for testing macro-evolutionary hypotheses (Purvis, 1996; Mooers &Heard, 1997). For instance, have rates of diversi-fication varied over time or among lineages? Arethere any recurring correlates of diversity (e.g. keyinnovations, environmental or ecological factors,biogeographic events)? Finally, complete phylo-genies may have implications for conservation efforts(Humphries, Williams & Vane-Wright, 1995;Va! zquez & Gittleman, 1998).
Attempts to generate complete phylogenies fromprimary data face two size-related limitations : (1)obtaining sufficient data that are informative for allsets of relationships spanning the history of the groupin question and (2) the inability of current computeralgorithms to find optimal trees for more thanapproximately 20 taxa (Swofford, 1993). The firstlimitation is perhaps the more serious. Althoughoptimal solutions cannot be guaranteed for analyseswith large numbers of taxa, heuristic searchalgorithms appear to be remarkably powerful(Swofford, 1993), particularly when prefaced by thecombination of compartmentalization (Mishler,1994) whereby large data sets are broken down intomore manageable nested subsets, and parsimonyjackknifing (Farris et al., 1996), which is a fastprocedure for detecting well-supported clades.
Despite the recent explosion in phylogeneticstudies, the uneven distribution of research effortacross taxa and of the resulting phylogenetic in-formation into many individual studies means thathomologous data (e.g. the same gene sequences ormorphological characters) for all members of a
group often do not exist. Furthermore, when suchdata exist, they frequently cannot resolve relation-ships throughout the tree, particularly for groupswith long evolutionary histories. One solution is acoordinated effort to fill in the missing information.A simpler and more cost-effective solution might beto combine the vast amount of phylogenetic in-formation that already exists, and this is the strategywe employ herein for the carnivores.
The mammalian order Carnivora is a diversecollection of 271 extant species (followingWozencraft, 1993) found on every continent andoccupying habitats ranging from oceans to rainforestand deserts. Carnivores range in body size over fourorders of magnitude – more than any other mam-malian order – and are also notably diverse in theirphysiology, social structure, and, despite theirordinal name, their feeding ecology. Furthermore,there are marked differences in the current speciesrichness among high-level taxa (e.g. there are 65mustelids and only four hyaenids).
Recent comparative studies of adaptation in theCarnivora include the evolution of life histories(e.g. Gittleman, 1994a), colour patterns (e.g.Ortolani & Caro, 1996), body, brain, and skull size(e.g. Gittleman, 1994b ; Gittleman & Van Valken-burgh, 1997), home-range size (e.g. Garland et al.,1993), energetics and physiology (e.g. Lee, Majluf &Gordon, 1991; McNab, 1995), and social structure(e.g. Creel & Macdonald, 1995; Geffen et al., 1996).Yet, despite its utility for studying carnivore evolu-tion, no complete species-level phylogeny has everbeen assembled for this diverse and varied order. Allthe above studies were limited by having only apartial or poorly resolved phylogeny of the carni-vores available that included only a number of keytaxa (rarely more than 30) spread throughout theorder (e.g. Wayne et al., 1989a ; Garland et al., 1993;Wyss & Flynn, 1993; Vrana et al., 1994; Ledje &Arnason, 1996).
We initially introduce methods of combiningphylogenetic information, focusing particularly onconstructing a phylogenetic supertree (Sanderson,
145Carnivoran phylogeny
Purvis & Henze, 1998) by matrix representationwith parsimony analysis (MRP; Baum, 1992;Ragan, 1992). We then illustrate the utility of MRPfor building larger, more comprehensive phylogeniesby deriving the first complete species-level phylogenyof extant carnivores based on a thorough survey ofthe systematic literature from the past 25 years. Wealso date the nodes in the resulting cladogram asfully as possible, following methods in Purvis(1995a). The carnivore ‘ supertree ’ will facilitatetests of comparative hypotheses as we demonstratewith some preliminary macroevolutionary analyses.We stress, however, that our tree is not intended tobe the final word in carnivoran phylogeny, but isintended more to provide a working hypothesis, toprovoke alternative hypotheses, and to direct moresystematic attention to groups that have so farreceived little or none.
II. COMBINING PHYLOGENETIC
INFORMATION
As mentioned above, existing information can bereexamined to provide more complete estimates ofphylogeny. Historically, two approaches have domi-nated, both of which were initially devised to assessthe degree of congruence between independent datasets. ‘Character congruence’ (sensu Kluge, 1989)operates by combining and re-analysing the raw(primary) data to derive the most consistent, unifiedstatement regarding relationships among a set oftaxa (Swofford, 1991). With ‘ taxonomic congru-ence’ (sensu Mickevich, 1978), the data sets areanalysed individually and the resultant trees arecombined using consensus techniques to indicatethose clades supported by the most independent linesof evidence (Swofford, 1991). We discuss theadvantages and limitations of each approach in turnbefore introducing a recently developed technique:constructing phylogenetic supertrees (sensu Sander-son et al., 1998) using MRP (Baum, 1992; Ragan,1992).
Character congruence has been promoted largelyon the principle of ‘ total evidence’ (sensu Kluge,1989): the best phylogenetic hypothesis is the onethat uses all the available data and then as muchinformation within those data as possible. Its appealto many derives from the advantages of combiningthe raw data. First, signals and subsignals within thedata can interact to support one another, yieldingrelationships that were not indicated by any singlesource study (‘signal enhancement ’, de Queiroz,Donoghue & Kim, 1995; also Nixon & Carpenter,
1996). Second, studies are easily differentiallyweighted to reflect confidence levels and samplesizes. Finally, using the raw data means that thedescriptive and explanatory power of the solution ismaximized (Kluge & Wolf, 1993; Nixon &Carpenter, 1996). For instance, the solution can beused to infer processes such as character evolutionand support for it can be summarized using standardmetrics such as goodness-of-fit indices (Swofford,1991), bootstrapping (Felsenstein, 1985a), or Bremersupport (Ka$ llersjo$ et al., 1992).
Disadvantages of character congruence includethe necessity of a single clustering or tree-buildingtechnique (typically parsimony), which limits its useto compatible data types only. Another potentialproblem is whether data pointing to vastly differentsolutions should be combined. This statistical ar-gument takes its lead from ecology where oneroutinely tests for data heterogeneity prior toprospective pooling. Many have argued againstcombining phylogenetic data lacking a single under-lying distribution (e.g. Bull et al., 1993; de Queirozet al., 1995), but some remain unconvinced (e.g.Nixon & Carpenter, 1996).
Taxonomic congruence instead combines treesand thus is one step removed from the primary data.To many, this is a less desirable approach, such thattaxonomic congruence is advocated more as a fall-back option when character congruence cannot beapplied (e.g. data heterogeneity or incompatibility)(Bull et al., 1993; Rodrigo et al., 1993; de Querioz et
al., 1995). This dual strategy has been referred to aseither ‘prior agreement ’ (Chippindale & Wiens,1994) or the ‘conditional combination approach’(Huelsenbeck, Bull & Cunningham, 1996). Taxo-nomic congruence has also been criticized becausethe choice of consensus technique used to combinethe source trees is essentially arbitrary (Kluge, 1989).
However, the strategy of combining trees presentscertain advantages. Methodologically, consensustechniques find solutions in polynomial time asopposed to the less efficient non-polynomial time ofoptimization-based tree-building techniques(Graham & Foulds, 1982). Therefore, taxonomiccongruence is less prone to size limitations than ischaracter congruence. Data sets are also combinedequally, preventing smaller ones from being‘swamped’. Concerns about swamping have beenstrongest for combining morphological and mol-ecular data sets as the latter tend to be much larger(Kluge, 1983; Miyamoto, 1985; Barrett, Donoghue& Sober, 1991). However, swamping may be less ofa problem than formerly thought : most molecular
146 Olaf R. P. Bininda-Emonds, John L. Gittleman and Andy Purvis
characters are not phylogenetically informative (i.e.they are invariant or the changes do not cluster taxa)and so the two sources are often more equal in sizethan they might first appear. Finally, it is easier tovisualize conflict between data sets using taxonomiccongruence because conflicting regions contain poly-tomies (although this depends on the consensustechnique used to some degree). This becomesimportant philosophically because many hold thebest hypothesis to be the one that has the mostindependent lines of evidence supporting it(Mickevich, 1978; Farris, 1983; Penny & Hendy,1986; Novacek, 1992b).
A new solution for combining phylogenetic in-formation is constructing phylogenetic supertrees.Building supertrees, for which MRP is one method,resembles taxonomic congruence methodologicallyin that trees are combined rather than raw data.Thus, supertrees can combine heterogeneous orincompatible data. However, because the algorithmsdo not use (conventional) consensus techniques to doso, a distinguishing feature of supertrees is that thesource trees can possess different sets of terminaltaxa. [Except for Lanyon’s (1993) modified semi-strict consensus algorithm, all consensus techniquesrequire source trees to have the same set of taxa.]
Due to its mechanics, MRP also possesses proper-ties reminiscent of character congruence. Briefly,MRP represents the pattern of relationships within asource tree as a series of binary elements(‘characters ’) describing each node in turn.Descendants of a node are scored as ‘1 ’, all others(except taxa missing from that source tree whichreceive ‘? ’) as ‘0 ’ (Baum, 1992; Ragan, 1992). Anall-zero hypothetical outgroup is used to polarize theelements. A parsimony algorithm perfectly recon-structs any single tree coded in this manner and isthe ‘most efficient ’ means (Baum & Ragan, 1993, p.638) of deriving a composite tree from many sourcetrees (Baum, 1992; Ragan, 1992).
Because trees are a graphical representation of thesignal within a data set, MRP is essentially aparsimony analysis of the different phylogeneticsignals within each data set stripped of any con-founding noise (i.e. homoplasy). Thus, it obtainscharacter congruence-like properties such asoccasionally indicating clades not found among anyof the source trees (analogous to signal enhancement)and is less sensitive to conflict among source trees inthat the composite tree is usually well resolved(Barrett et al., 1991; Purvis, 1995b ; Bininda-Emonds& Bryant, 1998). Furthermore, differential levels ofsupport, both within and among source trees, can be
accounted for by weighting (Purvis, 1995b ;Ronquist, 1996). Unfortunately, MRP faces sizelimitations like any parsimony analysis, althoughMRP analyses tend to be relatively ‘clean’, allowingmore taxa than usual to be analysed using exactsearch algorithms.
An important distinction between MRP andcharacter congruence techniques is that the matrixelements generated by MRP’s coding procedure foreach source tree are not independent, forming cliquesof elements that support one another. Because ofthis, support for MRP analyses should not besummarized by techniques like bootstrapping thatassume character independence (Purvis, 1995b).Moreover, it means that MRP has a size bias.Bigger, more resolved source trees contribute moreelements to the overall matrix and so tend to havegreater impact on the composite tree (Ronquist,1996; Bininda-Emonds & Bryant, 1998). Attemptsto correct for the size bias using differential weighting(Ronquist, 1996) or a modified coding procedure(Purvis, 1995b) have been unsuccessful or shown tobe theoretically flawed (Ronquist, 1996; Bininda-Emonds & Bryant, 1998). It is debatable whetherthe bias is a shortcoming, but it does not appear tobe correctable and, at the very least, will causeMRP to ‘combine trees ’ in a way we might not beaccustomed to. However, the bias is most apparentwhen very limited numbers of source trees arecombined; with increasing numbers (as herein),differences arising because of the bias appear to besmall (for a more complete discussion of this issue seeBininda-Emonds & Bryant, 1998).
The full potential of MRP to combine phylo-genetic information has yet to be fully explored;however, it has already been used to produce acomposite tree for all extant primate species (Purvis,1995a) and ones for bats, insectivores, andmarsupials are currently under construction.
III. METHODOLOGY
(1) Mechanics and limitations of matrixrepresentation
In addition to its potential shortcomings mentionedabove, MRP as applied here also has some his-torically-based limitations. To some degree, themethod amounts to a majority rule summary of pastand present systematic opinion, and so will beheavily biased against new, non-traditional hypoth-eses, even if they are now widely accepted. A case inpoint is the recent contention by Wyss (1987) of a

147Carnivoran phylogeny
walrus–phocid pairing to the exclusion of the otariids.Although currently accepted by many pinnipedsystematists (e.g. Flynn, 1988; Berta, 1991; Cozzuol,1992; Wyss & Flynn, 1993; Berta & Wyss, 1994;Vrana et al., 1994), this hypothesis has not yetaccumulated sufficient support to outweigh themore traditional view of a walrus–otariid pairing.Results from molecular studies would be expected tosuffer the most from this bias due to the relativelyrecent origin of the field.
Additionally, our analyses do not provide a strongtest of the monophyly of some taxa because many ofour sources tacitly assume the monophyly of taxaabove the species level. We have minimized thisproblem whenever possible by identifying the speciesbeing referred to; however, this was often notpossible with older references, particularly those thatlisted groups in a taxonomic fashion (therebyimplicitly including all species).
(2) Determination of the compositephylogeny
Potential source trees were identified from on-linesearches of the Science Citation Index (1981–95; via
Bath Information and Data Services), BiologicalAbstracts (1990–5), and Zoological Record (1978–95) for any of the key words cladistic*, clado*,classif*, phylogen*, systematic*, or taxonom* incombination with any major carnivoran taxon name(scientific or common). Additional sources wereobtained from references within previously foundarticles. We restricted the search to between theyears 1970 and 1995 inclusive. Exceptions weremade only for ‘ landmark’ articles (e.g. Gregory &Hellman, 1939; Leone & Wiens, 1956), ‘ in press ’articles of which we were aware of by the end of1995, and articles for groups (notably the herpestidsand viverrids) that otherwise yielded too few sourcetrees. Species assignments followed Wozencraft(1993).
Our phylogeny explicitly details relationshipsamong extant carnivorans, for which we havefollowed a recent and widely accepted species list(Wozencraft, 1993). To our knowledge, this listexcludes only two putative carnivore species (besidesthe domestic cat and dog): the Iriomote cat (Felis
iriomotensis) and a newly described viverrid (Viverra
tainguensis ; Sokolov, Rozhnov & Anh, 1997). How-ever, the Iriomote cat was held to be an islandsubspecies of the leopard cat (Felis bengalensis) byWozencraft (1993) and the taxonomic status of V.tainguensis requires verification. Additionally, recog-
nizing that fossil information can overturn phylo-genetic hypotheses based on extant forms alone(Gauthier, Kluge & Rowe, 1988; Donoghue et al.,1989; Novacek, 1992a), we included source treeswith fossil and extant species whenever possible.
Source trees were obtained from a total of 177publications (see Appendix and Table 1 for abreakdown according to family). Only that in-formation which the author(s) indicated to havephylogenetic relevance was used. Where a researcheror group has published a series of papers usingvirtually the same methodology and data source,only the most recent and complete study was used.However, when different researchers analysed thesame data source, we used each tree becausedifferences in the analyses (e.g. assumptions, use ofdifferent segments of the same gene) might changethe results between the studies. Finally, when asource contained multiple analyses of a given dataset, we combined the results of these analyses into asingle source tree using MRP.
Unlike Purvis (1995a), we drew no distinctionbetween source trees based on the type of analysisused to obtain them. Hence, all elements from allsource trees received equal weight in the finalanalysis. Because any choice of weights, includingequal weighting, is inevitably subjective (Barrett et
al., 1991), we also examine the effects of a differentialweighting scheme (see Purvis, 1995a).
The size of the problem precluded an efficientsingle analysis of all species, so composite estimateswere made for the following taxa: Canidae, Felidae,Herpestidae, Hyaenidae, Mustelidae (and Lutrinaeand Mephitinae therein), Otariidae, Phocidae,Procyonidae, Ursidae (including the giant panda,Ailuropoda melanoleuca), and Viverridae, and onelinking these taxa plus the monotypic walrus(Odobenus rosmarus) and red panda (Ailurus fulgens)together (‘higher groups ’). The nested estimateswere combined into a single tree in a process akin tocompartmentalization. Most of these groups arewidely, if not universally, accepted as monophyletic.The only substantive objections that might be raisedlie with grouping Ailuropoda melanoleuca with theursids, and the assumed monophyly of procyonids,mustelids and viverrids. Despite the historical con-troversy surrounding the relationships of Ailuropoda
melanoleuca, the clear majority now hold it to be aprimitive ursid (O’Brien et al., 1985; see Mayr, 1986for a summary). Among recent studies, only Peters(1982) and Tagle et al. (1986; but see Czelusniak et
al., 1991) dissent from this view. Support for amonophyletic Procyonidae comes from Seal, Phillips

148 Olaf R. P. Bininda-Emonds, John L. Gittleman and Andy Purvis
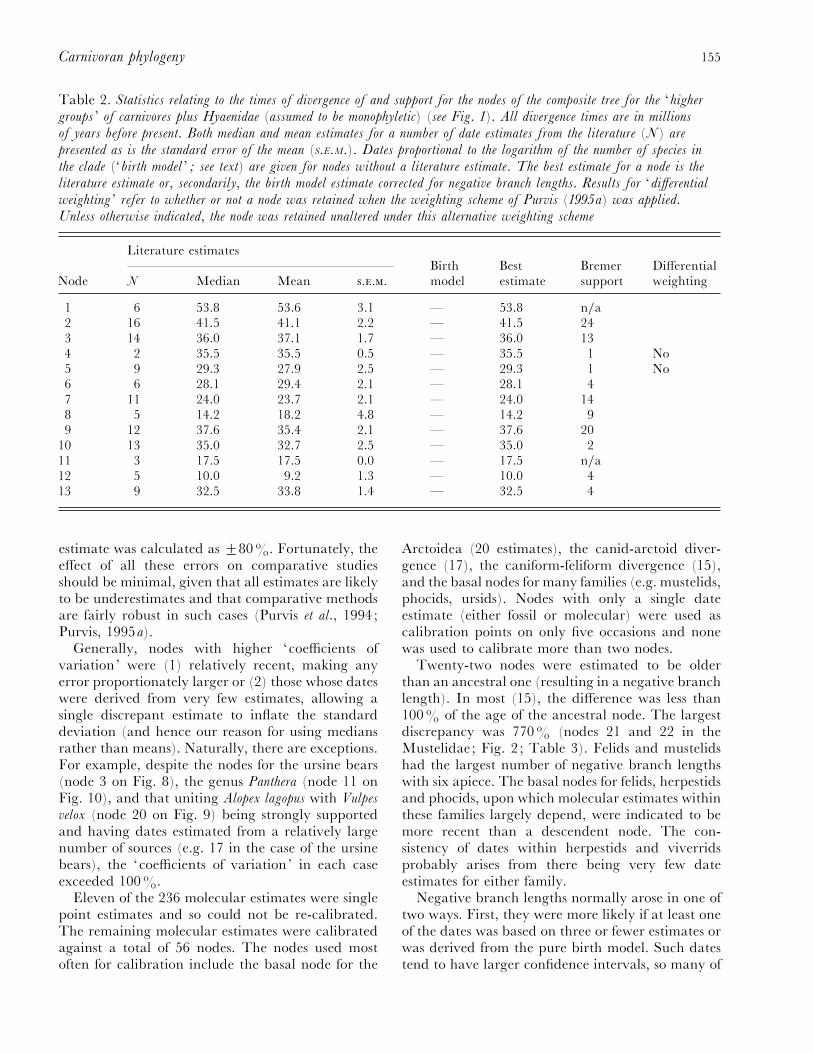
& Erickson (1970), Baskin (1982, 1989), Wozencraft(1989), and Decker & Wozencraft (1991). Whilegrowing evidence exists that the mephitines are onlydistantly related to the remaining mustelids(Arnason & Widegren, 1986; Wayne et al., 1989a ;Arnason & Ledje, 1993; Vrana et al., 1994; Ledje &Arnason, 1996), this claim still requires furthersubstantiation. There is also speculation that theAfrican palm civet (Nandinia binotata) may be aprimitive feloid, and not a viverrid, based on theprimitive morphology of its auditory bulla (Hunt,1974; Wiig, 1985; Flynn, Neff & Tedford, 1988;Hunt & Tedford, 1993; Flynn, 1996), but we couldnot adequately test this hypothesis because thetopological disparity of the two hypotheses wasdifficult to accommodate under the constraints of thenested analysis. Therefore, we assumed Nandinia
binotata to be a viverrid.Matrices were constructed using the data editor of
MacClade 3.05 (Maddison & Maddison, 1992). Ahypothetical all-zero outgroup was added to each topolarize the elements. All matrices were analysedwith PAUP 3.1.1 (Swofford, 1993). The exactbranch-and-bound algorithm was used for matriceswith fewer than 20 taxa. For larger matrices, we usedthe approximate heuristic algorithm with a randomaddition sequence (25 repetitions), TBR branchswapping on minimal trees only (steepest descenton), collapsed zero length branches, and unlimitedMAXTREES. Equally most parsimonious solutionswere summarized using strict consensus.
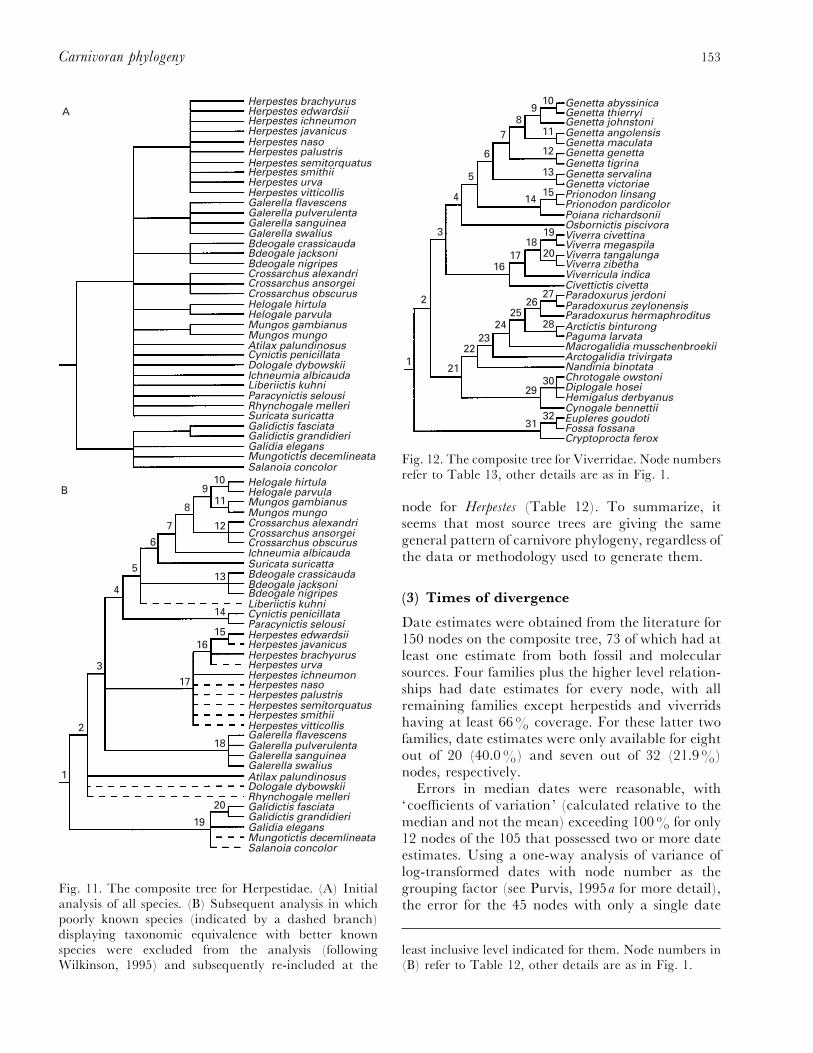
Only one search could not be completed due tomemory limitations. Initial results for the herpestidswere highly unresolved (see Fig. 11A), with at least30000 most parsimonious solutions, because manyherpestid species have scarcely been investigatedsystematically. Because the phylogenetic position ofmany species is unknown beyond a certain level (e.g.subfamilial or generic assessment), MRP indicatesall placements within that clade to be equallyparsimonious, collapsing the clade to a bush understrict consensus. To improve resolution within thisfamily, we applied safe taxonomic reduction(Wilkinson, 1995) to identify poorly known taxawhose (few) matrix elements were identical withthose of one or more of the more completely knownspecies and provided no novel clustering infor-mation. Twelve species were identified in thismanner and removed from the analysis. However,contra Wilkinson (1995), these species were reinsertedinto the tree at the most basal position indicated forthem in the literature (dashed branches in Fig. 11B).For example, both Dologale dybowskii and Rhynchogale
melleri are known to be herpestines, but no study hasplaced them any more precisely, so both taxa wereadded to the basal node of this subfamily. Suchplacements do not strictly reflect phylogeny(although weak membership statements can be madefrom them), but rather identify poorly studied taxa,much like Adams consensus (Adams, 1972) identifies‘rogue’ taxa among many competing source trees.Although the same lack of information applied to theintrageneric relationships of the procyonids (see Fig.5), safe taxonomic reduction could not improve theresolution there.
We use Bremer support (Bremer, 1988; Ka$ llersjo$et al., 1992) to estimate the robustness of each nodein the composite tree. Bremer support indicates howmuch less parsimonious the tree would have to bebefore the clade in question disappears. Bremersupport depends on how many characters orelements there are (Novacek, 1991) and how wellthey agree, so values may be low because of smallnumbers of source trees or conflict among them (see‘Results and Discussion’).
(3) Establishing times of divergence
Following Purvis (1995a), a combination of absolute(fossil and point molecular estimates) and relative(molecular) dates from the literature were used todate the composite tree (see Appendix). Both kindsof data present inherent difficulties.
No clear guidelines have emerged for estimatingtimes of divergence from the fossil record. Wefollowed Wayne, Van Valkenburgh & O’Brien(1991) in using the time of first occurrence of eitherdescendant lineage, unless there was good phylo-genetic or biogeographic evidence to the contrary.One problem with fossil information is the greaterinstability of fossil systematics (e.g. see McKenna &Bell, 1997). This reflects (1) changes in phylogeneticopinion caused by the discovery of new species or ofadditional material for poorly known species, and(2) that, historically, fossil species were frequentlygrouped taxonomically rather than phylo-genetically. (Similar problems affect analyses ofextant forms, but are generally less severe and fossilsystematics is becoming increasingly based on morerobust, cladistic methodology.) Taxonomic group-ings tend to be unstable at many levels (e.g. tribe,subfamily), something also arising from shifts inphylogenetic opinion. Thus, the context of a taxonmight have changed since a fossil species was assignedto it. For example, Viverridae long includedmongooses and kin as the subfamily Herpestinae
149Carnivoran phylogeny
(despite the lack of any derived features unitingthem; see Wozencraft, 1989). However, sinceWozencraft (1989), the elevation of mongooses (asHerpestidae) to equivalent status as viverrids hasbeen increasingly accepted. Thus, when using fossilinformation that predates this taxonomic change,one must ensure that the fossil ‘viverrid’ is what wewould recognize as a viverrid today.
Furthermore, not all fossil information is usablein the current context. The absence of fossil species inour phylogeny means the divergence estimated bymany fossils will not be present, particularly thosethat predate the most recent common ancestry of theextant taxa. For example, Hesperocyon is widelyregarded as the oldest known canid, but since it isnot a member of the clade including extant forms(Savage & Russell, 1983; Wang, 1994), its time offirst occurrence cannot be used to date theirradiation. Information from Hesperocyon would, how-ever, be appropriate for dating the divergence of allcanids from the remaining caniforms.
Altogether, these problems necessitate care to beexercised when using fossil dates. Our generalstrategy was to use information from relatively wellknown and stable fossil species only and then to useit to establish divergence times for nodes equivalentto the more robust taxonomic levels (generallyfamilies and genera). This strategy provided datesfor 129 nodes.
The use of molecular data to derive times ofdivergence is hampered by different lineages evolv-ing at different rates (Gillespie, 1991; Wayne et al.,1991; Flynn, 1996) and evidence of a decrease in therate of change with increasing divergence times(Wayne et al., 1991; Gittleman et al., 1996). As such,calibrating molecular information to a few widelyspaced nodes of known age will likely lead tocorrelated errors (and typically underestimates ;Wayne et al., 1991) throughout the tree. As in Purvis(1995a), the concept of a local molecular clock(Bailey et al., 1991) was employed to minimizepotential errors. Briefly, this method estimates thedate of a node relative to some (not necessarilyimmediately) ancestral node based on relativebranch lengths (see Purvis, 1995a for more detailand a worked example). Whenever possible, thebranch lengths we used for this were derived fromthe original pairwise matrices in the source paper.
A total of 74 studies yielded 545 point estimates(293 fossil, 236 molecular and 16 from a studyassimilating both types) for 150 nodes throughoutthe tree. To minimize the effect of outliers, thedivergence time for a node was calculated as the
median of available estimates. Whatever theirsource, estimates of divergence time are likely to beunderestimates. Fossil dates will consistently be sobecause the first appearance in the fossil record neednot correspond with the origin of a taxon (Marshall,1990; Flynn, 1996). This bias will, in turn, affect therelative molecular estimates, as we calibrated suchestimates against fossil dates. The negative cor-relation between divergence time and the rate ofmolecular change further compounds this problemfor molecular estimates, particularly when cali-brations are based on only a few nodes. We thereforeincorporated fossil dates throughout the tree (unlikePurvis, 1995a).
Finally, dates for those nodes that did not possessan estimate in the literature were interpolated usinga pure birth model, under which a clade’s age isproportional to the logarithm of the number ofspecies it contains (see Purvis, 1995a, p. 416).Estimates were calibrated relative to dated ancestraland, unlike Purvis (1995a), from dated descendentnodes whenever possible. The use of more than onecalibration point should reduce errors associatedwith erroneous dating of calibration points. Ourinterpolations are intended more to accommodatethose comparative methods requiring a complete setof branch lengths than as precise estimates ofdivergence times. Factors such as extinction maydifferentially reduce the representation of some ofthe older lineages and other related biases also exist.Fortunately, comparative methods are reasonablyrobust to errors in branch length information(Purvis, Gittleman & Luh, 1994) and the majority ofnodes (150 of 211) had divergence times derivedfrom literature estimates.
IV. RESULTS AND DISCUSSION
(1) Distribution of taxonomic coverage
Prior systematic effort has not been distributedevenly throughout the carnivores (Table 1). Thegroups for which there are most source trees includecanids, felids, mustelids, phocids, ursids, and theinterfamilial relationships of the carnivores. Thisuneven distribution of effort has many causes.Geographic distribution (largely Africa and southernAsia) and cryptic habits both count againstherpestids and viverrids, whereas some families havebeen targeted by particular research groups (e.g.U. Arnason & colleagues for phocids, S. J. O’Brien& colleagues for felids, R. K. Wayne & colleaguesfor canids), often with conservation in mind. Ad-

150 Olaf R. P. Bininda-Emonds, John L. Gittleman and Andy Purvis
Table 1. Indices relating to the distribution of taxonomic coverage for and the resolution on the composite tree of various
carnivoran taxa. The parenthetical value of per cent resolution for herpestids refers to when safe taxonomic reduction
(Wilkinson 1995) was used to improve the resolution of this family (see Fig. 11B). We refer to the index elements per
source tree per taxon as the ‘ coverage index ’ in the text
TaxonNumber ofsource trees
Number ofelements Per cent resolution
Elements pertaxon
Elements persource treeper taxon
‘Higher groups’ 62 202 100±0 16±8 0±27Mustelidae 30 155 72±7 3±4 0±11Lutrinae 6 37 75±0 2±8 0±47Mephitinae 5 18 87±5 2±0 0±40Procyonidae 7 27 52±9 1±5 0±21Otariidae 15 46 69±2 3±3 0±22Phocidae 21 120 94±4 6±3 0±30Ursidae 28 50 85±7 6±2 0±22Canidae 36 180 69±7 5±3 0±15Felidae 40 282 97±1 7±8 0±20Hyaenidae 6 8 66±7 2±0 0±33Herpestidae 9 53 27±8 (55±6) 1±4 0±16Viverridae 9 90 97±0 2±6 0±29
ditionally, researchers have been attracted to groupswhose relationships are controversial. Finally, manyspecies that are poorly known systematically are alsounstudied with respect to other biological character-istics. It is unsurprising that most of these species arenocturnal, solitary, fast, and have large home ranges,often in poorly inhabited or remote regions (seeGittleman, 1989, 1996).
The groups that have been studied the most oftenalso tend to have the most binary elements pertaxon. However, this latter measure does distinguishamong the more poorly studied groups, with theherpestids and procyonids lagging behind the rest.
A final measure, the ‘coverage index’ (i.e.elements per source tree per taxon), reveals howthoroughly a group has been investigated in eachstudy. High values indicate that individual studieshave on average examined a large proportion of theconstituent taxa (although the number of elements isalso determined by the resolution of the source tree).Hyaenids, lutrines, mephitines, and phocids havehigh coverage indices. Except for the phocids, thesegroups did not have many source trees. Groups withlow coverage indices include the canids, felids,herpestids, and mustelids. Note that a low coverageindex does not necessarily imply that only the samefew taxa have been examined in each tree (althoughthis is true of herpestids). Given the inherentdifficulties in examining a larger number of taxa, itis unsurprising that smaller groups tend to have
higher coverage indices than do the larger ones(r#¯ 0±43, P¯ 0±01).
The numbers for the viverrids are deceptive. Thisfamily has generally been poorly studied; however,the complete species-level phylogeny of Wozencraft(1984) obscures this. Without this study, the numberof elements for viverrids would drop by over a thirdand the two ratios would fall to the levels found inother poorly studied taxa. The exclusion would alsoimprove the correlation between the coverage indexand the size of the group (r#¯ 0±51, P¯ 0±006).
(2) Resolution and robustness
The composite tree (divided among Figs 1–12;presented as a whole in Fig. 13) contains 211 nodes,making it 78±1% resolved compared to a fullybifurcating solution. Resolution varies amonggroups, ranging between 27±8% (herpestids) and100% (higher groups) (Table 1). Removing thepoorly known herpestid species (see ‘Methodology’)improves the resolution for this family to 55±6%.Apart from the herpestids, the poorest resolution wasfor the Procyonidae (52.9%). Most groups were atleast 70% resolved, and three (felids, phocids andviverrids) were more than 90% resolved. However,for the viverrids, the resolution is again due toWozencraft’s (1984) full species-level analysis. If thisstudy were excluded, resolution for the family wouldfall to 69±7%.
151Carnivoran phylogeny
65
4
32
1
87
1211
109
13
MUSTELIDAEPROCYONIDAEAilurus fulgensOdobenus rosmarusOTARIIDAEPHOCIDAEURSIDAECANIDAEParahyaena brunneaHyaena hyaenaCrocuta crocutaProteles cristatusFELIDAEHERPESTIDAEVIVERRIDAE
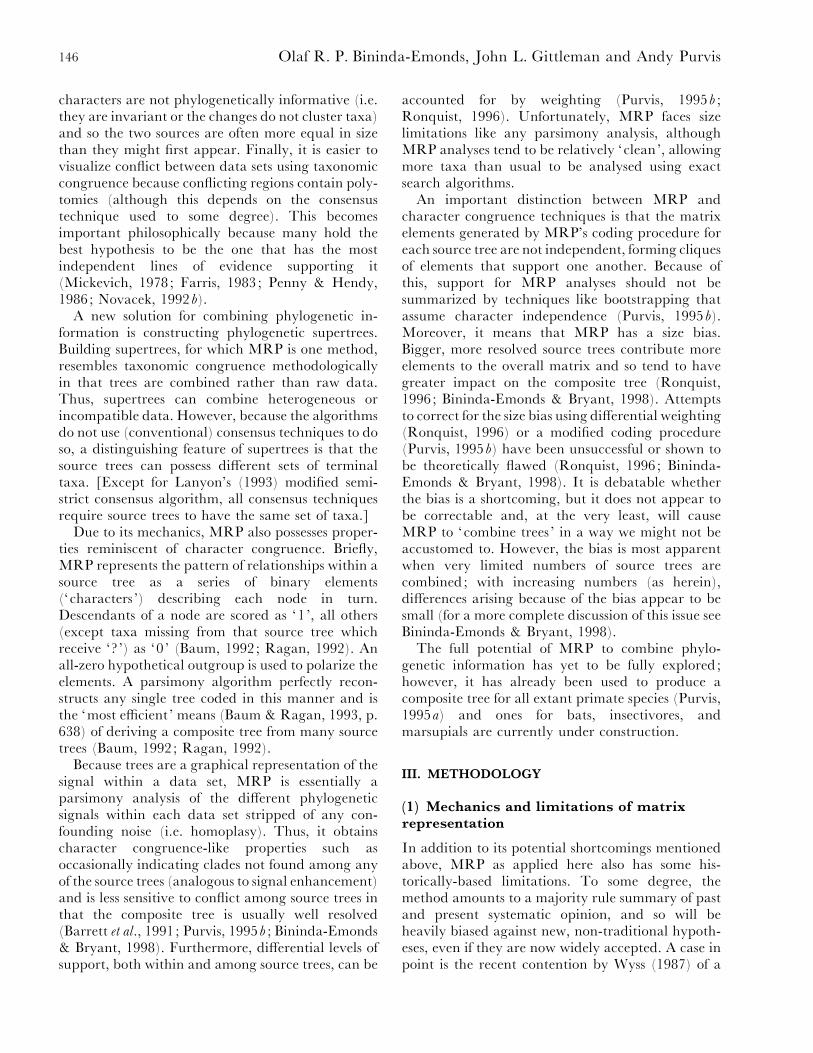
Fig. 1. The composite tree for the higher groups ofcarnivores plus Hyaenidae (which were assumed to bemonophyletic as denoted by the solid circle). Nodenumbers refer to Table 2. In this and Figs 2–12, branchlengths are not proportional to time. References used assource trees are given in the Appendix.
24
Mustela lutreolaMustela lutreolinaMustela nudipesMustela sibiricaMustela strigidorsaMustela eversmanniiMustela nigripesMustela putoriusMustela altaicaMustela ermineaMustela frenataMustela nivalisMustela africanaMustela felipeiMustela kathiahMustela visonMartes americanaMartes melampusMartes zibellinaMartes martesMartes foinaMartes flavigula
Lyncodon patagonicus
Martes gwatkinsiiMartes pennantiGulo guloEira barbaraGalictis cujaGalictis vittata
Ictonyx libycaIctonyx striatusVormela peregusnaPoecilogale albinuchaMellivora capensisArctonyx collarisMeles melesMydaus javanensisMydaus marcheiMelogale everettiMelogale moschataMelogale orientalisMelogale personataLUTRINAEMEPHITINAETaxidea taxus
32
31
301
29
2
3
2627
1516
1718
19
2021
2223
1011
1213
14
89
7
6
5
4
25
28
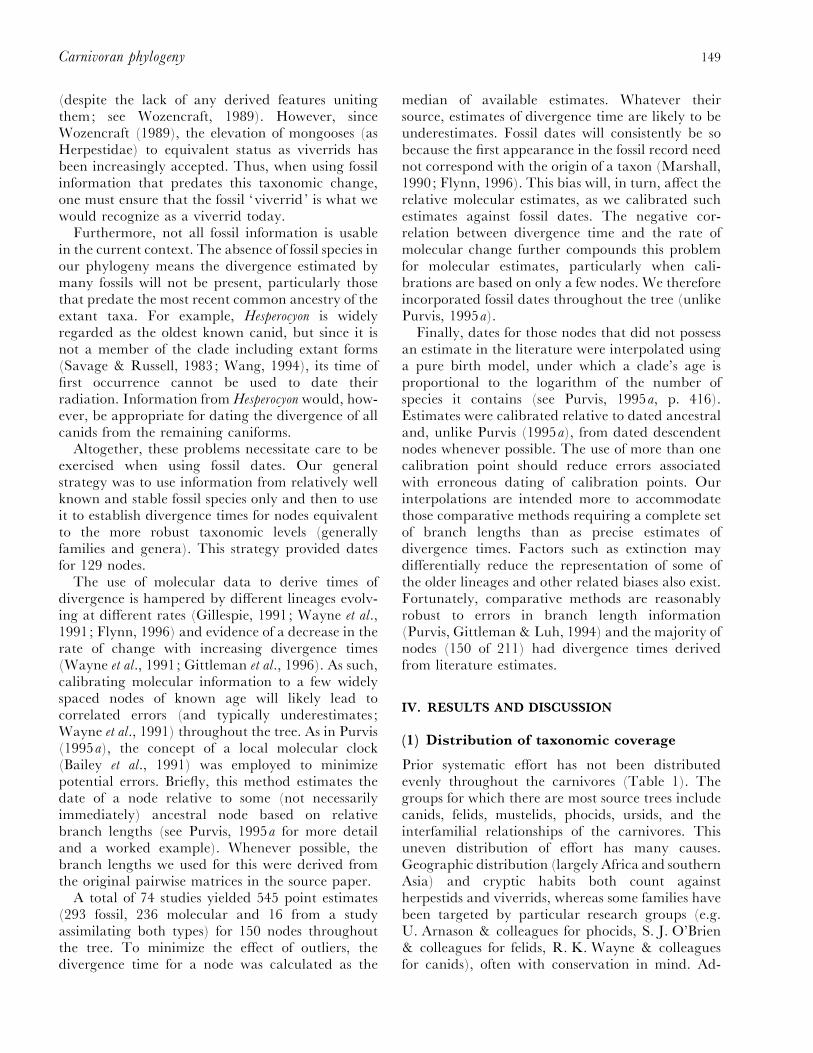
Fig. 2. The composite tree for Mustelidae (exclusive ofLutrinae and Mephitinae). Node numbers refer to Table3, other details are as in Fig. 1.
The poor resolution for the procyonids is restrictedto within the genera Bassaricyon and Procyon andarises not from conflict between the source trees but
1
23
45
6
8
9
7
Lontra felinaLontra provocaxLontra longicaudisLontra canadensisLutra lutraLutra sumatranaAonyx capensisAonyx congicusAmblonyx cinereusLutra maculicollisLutrogale perspicillataPteronura brasiliensisEnhydra lutris
Fig. 3. The composite tree for Lutrinae. Node numbersrefer to Table 4, other details are as in Fig. 1.
1
2
5
3
4
6
7
Conepatus chingaConepatus leuconotusConepatus mesoleucusConepatus humboldtiiConepatus semistriatusMephitis macrouraMephitis mephitisSpilogale putoriusSpilogale pygmaea
Fig. 4. The composite tree for Mephitinae. Node numbersrefer to Table 5, other details are as in Fig. 1.
4
6
7
98
5
3
2
1
Procyon cancrivorusProcyon gloveralleniProcyon insularisProcyon lotorProcyon maynardiProcyon minorProcyon pygmaeusNasua naricaNasua nusuaNasuella olivaceaBassariscus astutusBassariscus sumichrastiBassaricyon alleniBassaricyon beddardiBassaricyon gabbiiBassaricyon lasiusBassaricyon pauliPotos flavus
Fig. 5. The composite tree for Procyonidae. Node numbersrefer to Table 6, other details are as in Fig. 1.
Arctocephalus australisArctocephalus forsteriArctocephalus galapagoensisArctocephalus philippiiArctocephalus townsendiArctocephalus gazellaArctocephalus tropicalisArctocephalus pusillusNeophoca cinereaPhocarctos hookeriOtaria byroniaEumetopias jubatusZalophus californianusCallorhinus ursinus
54
32
19
87
6
Fig. 6. The composite tree for Otariidae. Node numbersrefer to Table 7, other details are as in Fig. 1.
from a complete lack of information. This mayreflect suggestions that there are fewer legitimatespecies than are currently recognized (e.g. Poglayen-Neuwall & Poglayen-Neuwall, 1965; Lotze &Anderson, 1979; Hall, 1981; Olson & Pregill, 1982).
152 Olaf R. P. Bininda-Emonds, John L. Gittleman and Andy Purvis
76
54
32
1
8
9
13
14
15
1716
1211
10
Phoca caspicaPhoca hispidaPhoca sibiricaPhoca larghaPhoca vitulinaHalichoerus grypusPhoca fasciataPhoca groenlandicaCystophora cristataErignathus barbatusHydrurga leptonyxLobodon carcinophagusLeptonychotes weddelliOmmatophoca rossiMirounga angustirostrisMirounga leoninaMonachus schauinslandiMonachus tropicalisMonachus monachus
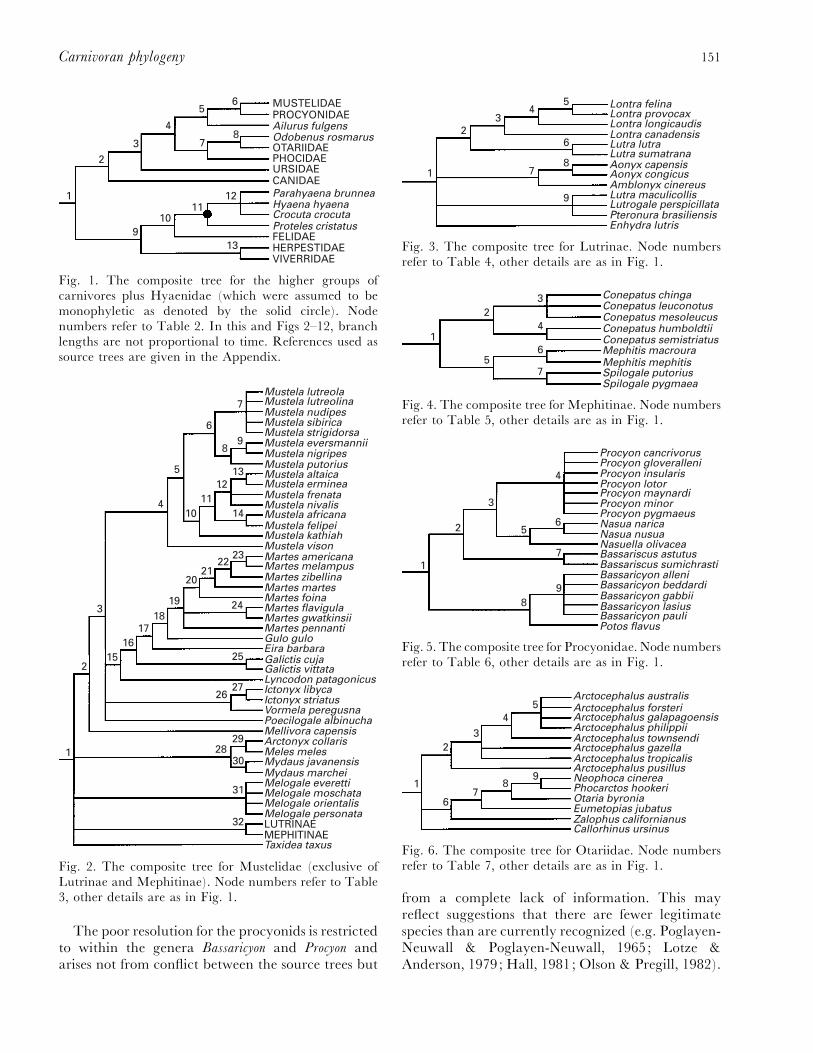
Fig. 7. The composite tree for Phocidae. Node numbersrefer to Table 8, other details are as in Fig. 1.
6
54
32
1
Ursus arctosUrsus maritimusUrsus thibetanusHelarctos malayanusMelursus ursinusUrsus americanusTremarctos ornatusAiluropoda melanoleuca
Fig. 8. The composite tree for Ursidae. Node numbersrefer to Table 9, other details are as in Fig. 1.
Canis lupusCanis rufusCanis latransCanis simensisCanis adustusCanis aureusCanis mesomelasPseudalopex culpaeusPseudalopex griseusPseudalopex gymnocercusPseudalopex sechuraePseudalopex vetulusDusicyon australisAtelocynus microtisCerdocyon thousChrysocyon brachyurusCuon alpinusLycaon pictusSpeothos venaticusNyctereutes procyonoidesVulpes corsacVulpes ferrilataVulpes rueppelliVulpes vulpesAlopex lagopusVulpes veloxVulpes canaVulpes zerdaVulpes bengalensisVulpes chamaVulpes pallidaUrocyon cinereoargenteusUrocyon littoralisOtocyon megalotis
65
48
7
11
93
2
1
1817
16
15
14
13
12
19
20
21
22
23
10
Fig. 9. The composite tree for Canidae. Node numbersrefer to Table 10, other details are as in Fig. 1.
Bremer support values differed significantly amonggroups (Kruskal–Wallis H¯ 48±4, P! 0±0001;see Tables 2–13). Taxa with large values are thehigher groups, hyaenids, phocids, and ursids ;only the herpestids display low values. Older nodes
Panthera leoPanthera pardusPanthera oncaPanthera tigrisUncia unciaNeofelis nebulosaPardofelis marmorataLynx canadensisLynx lynxLynx pardinusLynx rufusCatopuma badiaCatopuma temminckiiProfelis aurataLeopardus tigrinusOncifelis geoffroyiOncifelis guignaOncifelis colocoloOreailurus jacobitaLeopardus pardalisLeopardus wiediiFelis margaritaFelis nigripesFelis silvestrisFelis bietiFelis chausOtocolobus manulCaracal caracalLeptailurus servalPrionailurus bengalensisPrionailurus viverrinusPrionailurus rubiginosusPrionailurus planicepsHerpailurus yaguaroundiPuma concolorAcinonyx jubatus
34
3132
33
1
3
2
2425
2627
2829
23
22
2120
19
4
5
6
7
89
1011
1213
1415
16
1817
30
Fig. 10. The composite tree for Felidae. Node numbersrefer to Table 11, other details are as in Fig. 1.
tend to show higher Bremer support values(r#¯ 0±17, P! 0±0001) because relationships atthese levels are more agreed upon and better studied.Many phylogenies, particularly molecular ones,detail relationships among somewhat distantly re-lated species. This provides information at the older,higher levels, but none for the more closely relatedsister species that are missing from the analysis.
The differential weighting of source trees ac-cording to the data and}or methodology used toobtain them had little impact on the composite tree(Tables 2–13). When more robust source trees(following Purvis, 1995a) were weighted four timesas heavily, only 10 of the 211 nodes of the compositetree were contradicted, most often due to a slightlyaltered position for a single clade (which auto-matically results in two, non-independent contra-dictions). Differential weighting also resolved sixpolytomies within the composite tree. This extraresolution is not surprising given that weightingcertain elements essentially amounts to increasingtheir number within the matrix, which has beendemonstrated to increase resolution (Hillis &Huelsenbeck, 1992; Wheeler, 1992). However, threenodes within the herpestids collapsed under thedifferential weighting scheme, including the basal
153Carnivoran phylogeny
Herpestes brachyurusHerpestes edwardsiiHerpestes ichneumonHerpestes javanicusHerpestes nasoHerpestes palustrisHerpestes semitorquatusHerpestes smithiiHerpestes urvaHerpestes vitticollisGalerella flavescensGalerella pulverulentaGalerella sanguineaGalerella swaliusBdeogale crassicaudaBdeogale jacksoniBdeogale nigripesCrossarchus alexandriCrossarchus ansorgeiCrossarchus obscurusHelogale hirtulaHelogale parvulaMungos gambianusMungos mungoAtilax palundinosusCynictis penicillataDologale dybowskiiIchneumia albicaudaLiberiictis kuhniParacynictis selousiRhynchogale melleriSuricata suricattaGalidictis fasciataGalidictis grandidieriGalidia elegansMungotictis decemlineataSalanoia concolorHelogale hirtulaHelogale parvulaMungos gambianusMungos mungoCrossarchus alexandriCrossarchus ansorgeiCrossarchus obscurusIchneumia albicaudaSuricata suricattaBdeogale crassicaudaBdeogale jacksoniBdeogale nigripesLiberiictis kuhniCynictis penicillataParacynictis selousiHerpestes edwardsiiHerpestes javanicusHerpestes brachyurusHerpestes urvaHerpestes ichneumonHerpestes nasoHerpestes palustrisHerpestes semitorquatusHerpestes smithiiHerpestes vitticollisGalerella flavescensGalerella pulverulentaGalerella sanguineaGalerella swaliusAtilax palundinosusDologale dybowskiiRhynchogale melleriGalidictis fasciataGalidictis grandidieriGalidia elegansMungotictis decemlineataSalanoia concolor
1
2
3
19
20
18
17
1615
14
134
5
6
7
8
910
12
11
A
B
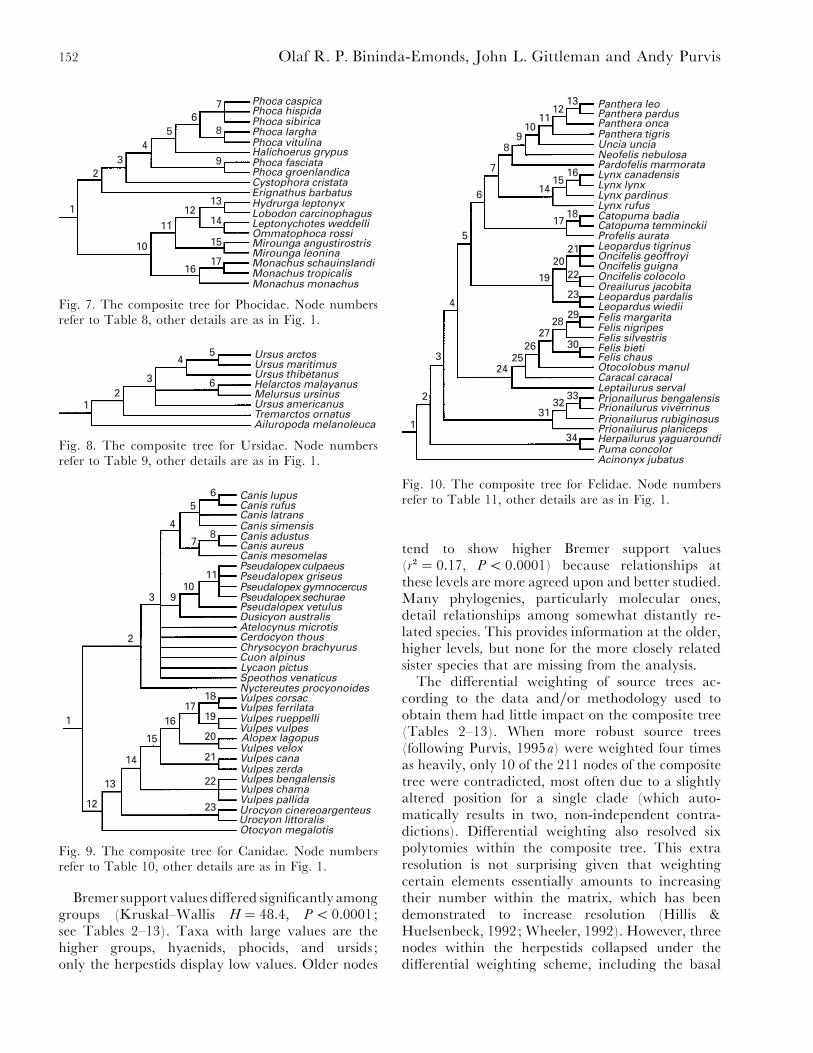
Fig. 11. The composite tree for Herpestidae. (A) Initialanalysis of all species. (B) Subsequent analysis in whichpoorly known species (indicated by a dashed branch)displaying taxonomic equivalence with better knownspecies were excluded from the analysis (followingWilkinson, 1995) and subsequently re-included at the
Genetta abyssinicaGenetta thierryiGenetta johnstoniGenetta angolensisGenetta maculataGenetta genettaGenetta tigrinaGenetta servalinaGenetta victoriaePrionodon linsangPrionodon pardicolorPoiana richardsoniiOsbornictis piscivoraViverra civettinaViverra megaspilaViverra tangalungaViverra zibethaViverricula indicaCivettictis civettaParadoxurus jerdoniParadoxurus zeylonensisParadoxurus hermaphroditusArctictis binturongPaguma larvataMacrogalidia musschenbroekiiArctogalidia trivirgataNandinia binotataChrotogale owstoniDiplogale hoseiHemigalus derbyanusCynogale bennettii
Fossa fossanaEupleres goudoti
Cryptoprocta ferox
121
2223
2425
2627
28
3029
3231
2
3
1617
1819
20
4
5
6
78
910
11
12
13
1514
Fig. 12. The composite tree for Viverridae. Node numbersrefer to Table 13, other details are as in Fig. 1.
node for Herpestes (Table 12). To summarize, itseems that most source trees are giving the samegeneral pattern of carnivore phylogeny, regardless ofthe data or methodology used to generate them.
(3) Times of divergence
Date estimates were obtained from the literature for150 nodes on the composite tree, 73 of which had atleast one estimate from both fossil and molecularsources. Four families plus the higher level relation-ships had date estimates for every node, with allremaining families except herpestids and viverridshaving at least 66% coverage. For these latter twofamilies, date estimates were only available for eightout of 20 (40±0%) and seven out of 32 (21±9%)nodes, respectively.
Errors in median dates were reasonable, with‘coefficients of variation’ (calculated relative to themedian and not the mean) exceeding 100% for only12 nodes of the 105 that possessed two or more dateestimates. Using a one-way analysis of variance oflog-transformed dates with node number as thegrouping factor (see Purvis, 1995a for more detail),the error for the 45 nodes with only a single date
least inclusive level indicated for them. Node numbers in(B) refer to Table 12, other details are as in Fig. 1.

154 Olaf R. P. Bininda-Emonds, John L. Gittleman and Andy Purvis
P < 0.05
P < 0.01 Mustelidae
Lutrinae
Mephitinae
Procyonidae
Otariidae
Phocidae
Ursidae
Canidae
Hyaenidae
Felidae
Herpestidae
Viverridae
60 40 20 0
Millions of years before present
Fig. 13. The composite tree for all 271 extant species of carnivore, including estimated times of divergence and showingwhich lineages have given rise to significantly more extant descendants than expected (hatched squares : P! 0±05;filled squares : P! 0±01). Within major taxa, species are presented in the same order as in Figs 1–12. Dates wereestimated either from the literature (see Tables 2–13) or via a pure birth model. Negative branch lengths are drawnas having zero length. See text for further details.
155Carnivoran phylogeny
Table 2. Statistics relating to the times of divergence of and support for the nodes of the composite tree for the ‘highergroups ’ of carnivores plus Hyaenidae (assumed to be monophyletic) (see Fig. 1). All divergence times are in millions
of years before present. Both median and mean estimates for a number of date estimates from the literature (N) are
presented as is the standard error of the mean (S.E.M.). Dates proportional to the logarithm of the number of species in
the clade (‘birth model ’; see text) are given for nodes without a literature estimate. The best estimate for a node is the
literature estimate or, secondarily, the birth model estimate corrected for negative branch lengths. Results for ‘differential
weighting ’ refer to whether or not a node was retained when the weighting scheme of Purvis (1995a) was applied.Unless otherwise indicated, the node was retained unaltered under this alternative weighting scheme
Literature estimatesBirth Best Bremer Differential
Node N Median Mean ... model estimate support weighting
1 6 53±8 53±6 3±1 — 53±8 n}a2 16 41±5 41±1 2±2 — 41±5 243 14 36±0 37±1 1±7 — 36±0 134 2 35±5 35±5 0±5 — 35±5 1 No5 9 29±3 27±9 2±5 — 29±3 1 No6 6 28±1 29±4 2±1 — 28±1 47 11 24±0 23±7 2±1 — 24±0 148 5 14±2 18±2 4±8 — 14±2 99 12 37±6 35±4 2±1 — 37±6 20
10 13 35±0 32±7 2±5 — 35±0 211 3 17±5 17±5 0±0 — 17±5 n}a12 5 10±0 9±2 1±3 — 10±0 413 9 32±5 33±8 1±4 — 32±5 4
estimate was calculated as ³80%. Fortunately, theeffect of all these errors on comparative studiesshould be minimal, given that all estimates are likelyto be underestimates and that comparative methodsare fairly robust in such cases (Purvis et al., 1994;Purvis, 1995a).
Generally, nodes with higher ‘coefficients ofvariation’ were (1) relatively recent, making anyerror proportionately larger or (2) those whose dateswere derived from very few estimates, allowing asingle discrepant estimate to inflate the standarddeviation (and hence our reason for using mediansrather than means). Naturally, there are exceptions.For example, despite the nodes for the ursine bears(node 3 on Fig. 8), the genus Panthera (node 11 onFig. 10), and that uniting Alopex lagopus with Vulpes
velox (node 20 on Fig. 9) being strongly supportedand having dates estimated from a relatively largenumber of sources (e.g. 17 in the case of the ursinebears), the ‘coefficients of variation’ in each caseexceeded 100%.
Eleven of the 236 molecular estimates were singlepoint estimates and so could not be re-calibrated.The remaining molecular estimates were calibratedagainst a total of 56 nodes. The nodes used mostoften for calibration include the basal node for the
Arctoidea (20 estimates), the canid-arctoid diver-gence (17), the caniform-feliform divergence (15),and the basal nodes for many families (e.g. mustelids,phocids, ursids). Nodes with only a single dateestimate (either fossil or molecular) were used ascalibration points on only five occasions and nonewas used to calibrate more than two nodes.
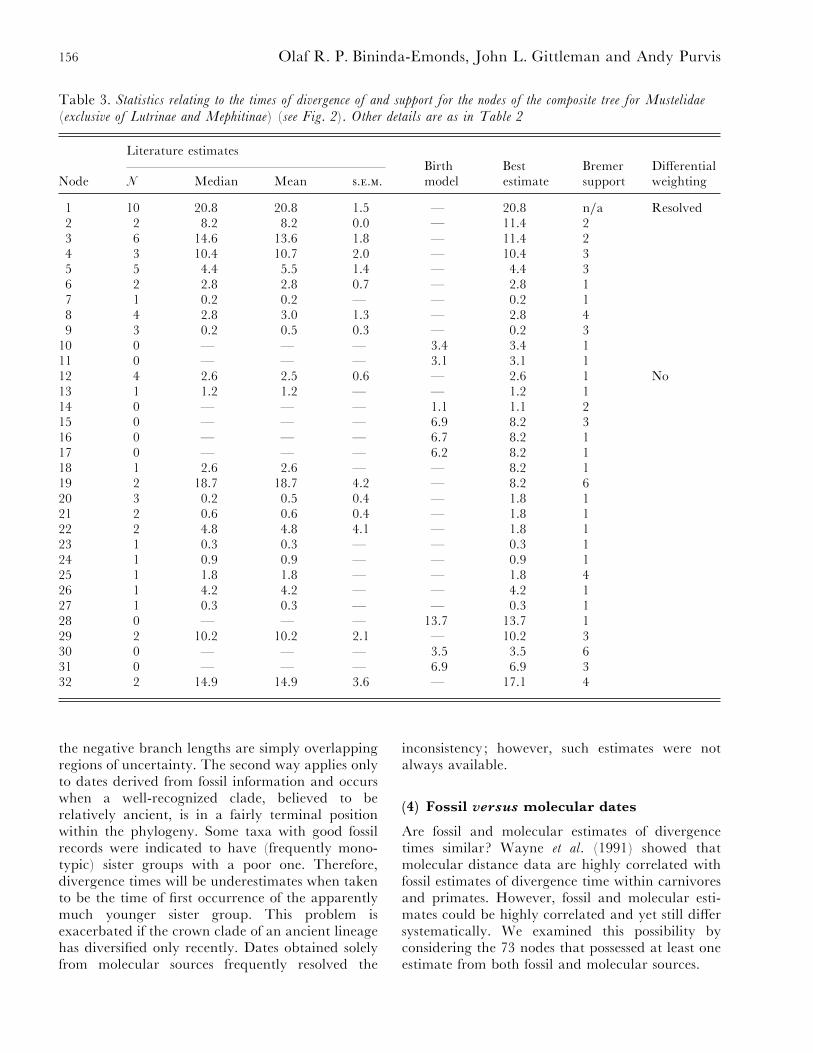
Twenty-two nodes were estimated to be olderthan an ancestral one (resulting in a negative branchlength). In most (15), the difference was less than100% of the age of the ancestral node. The largestdiscrepancy was 770% (nodes 21 and 22 in theMustelidae; Fig. 2; Table 3). Felids and mustelidshad the largest number of negative branch lengthswith six apiece. The basal nodes for felids, herpestidsand phocids, upon which molecular estimates withinthese families largely depend, were indicated to bemore recent than a descendent node. The con-sistency of dates within herpestids and viverridsprobably arises from there being very few dateestimates for either family.
Negative branch lengths normally arose in one oftwo ways. First, they were more likely if at least oneof the dates was based on three or fewer estimates orwas derived from the pure birth model. Such datestend to have larger confidence intervals, so many of
156 Olaf R. P. Bininda-Emonds, John L. Gittleman and Andy Purvis
Table 3. Statistics relating to the times of divergence of and support for the nodes of the composite tree for Mustelidae
(exclusive of Lutrinae and Mephitinae) (see Fig. 2). Other details are as in Table 2
Literature estimatesBirth Best Bremer Differential
Node N Median Mean ... model estimate support weighting
1 10 20±8 20±8 1±5 — 20±8 n}a Resolved2 2 8±2 8±2 0±0 — 11±4 23 6 14±6 13±6 1±8 — 11±4 24 3 10±4 10±7 2±0 — 10±4 35 5 4±4 5±5 1±4 — 4±4 36 2 2±8 2±8 0±7 — 2±8 17 1 0±2 0±2 — — 0±2 18 4 2±8 3±0 1±3 — 2±8 49 3 0±2 0±5 0±3 — 0±2 3
10 0 — — — 3±4 3±4 111 0 — — — 3±1 3±1 112 4 2±6 2±5 0±6 — 2±6 1 No13 1 1±2 1±2 — — 1±2 114 0 — — — 1±1 1±1 215 0 — — — 6±9 8±2 316 0 — — — 6±7 8±2 117 0 — — — 6±2 8±2 118 1 2±6 2±6 — — 8±2 119 2 18±7 18±7 4±2 — 8±2 620 3 0±2 0±5 0±4 — 1±8 121 2 0±6 0±6 0±4 — 1±8 122 2 4±8 4±8 4±1 — 1±8 123 1 0±3 0±3 — — 0±3 124 1 0±9 0±9 — — 0±9 125 1 1±8 1±8 — — 1±8 426 1 4±2 4±2 — — 4±2 127 1 0±3 0±3 — — 0±3 128 0 — — — 13±7 13±7 129 2 10±2 10±2 2±1 — 10±2 330 0 — — — 3±5 3±5 631 0 — — — 6±9 6±9 332 2 14±9 14±9 3±6 — 17±1 4
the negative branch lengths are simply overlappingregions of uncertainty. The second way applies onlyto dates derived from fossil information and occurswhen a well-recognized clade, believed to berelatively ancient, is in a fairly terminal positionwithin the phylogeny. Some taxa with good fossilrecords were indicated to have (frequently mono-typic) sister groups with a poor one. Therefore,divergence times will be underestimates when takento be the time of first occurrence of the apparentlymuch younger sister group. This problem isexacerbated if the crown clade of an ancient lineagehas diversified only recently. Dates obtained solelyfrom molecular sources frequently resolved the
inconsistency; however, such estimates were notalways available.
(4) Fossil versus molecular dates
Are fossil and molecular estimates of divergencetimes similar? Wayne et al. (1991) showed thatmolecular distance data are highly correlated withfossil estimates of divergence time within carnivoresand primates. However, fossil and molecular esti-mates could be highly correlated and yet still differsystematically. We examined this possibility byconsidering the 73 nodes that possessed at least oneestimate from both fossil and molecular sources.
157Carnivoran phylogeny
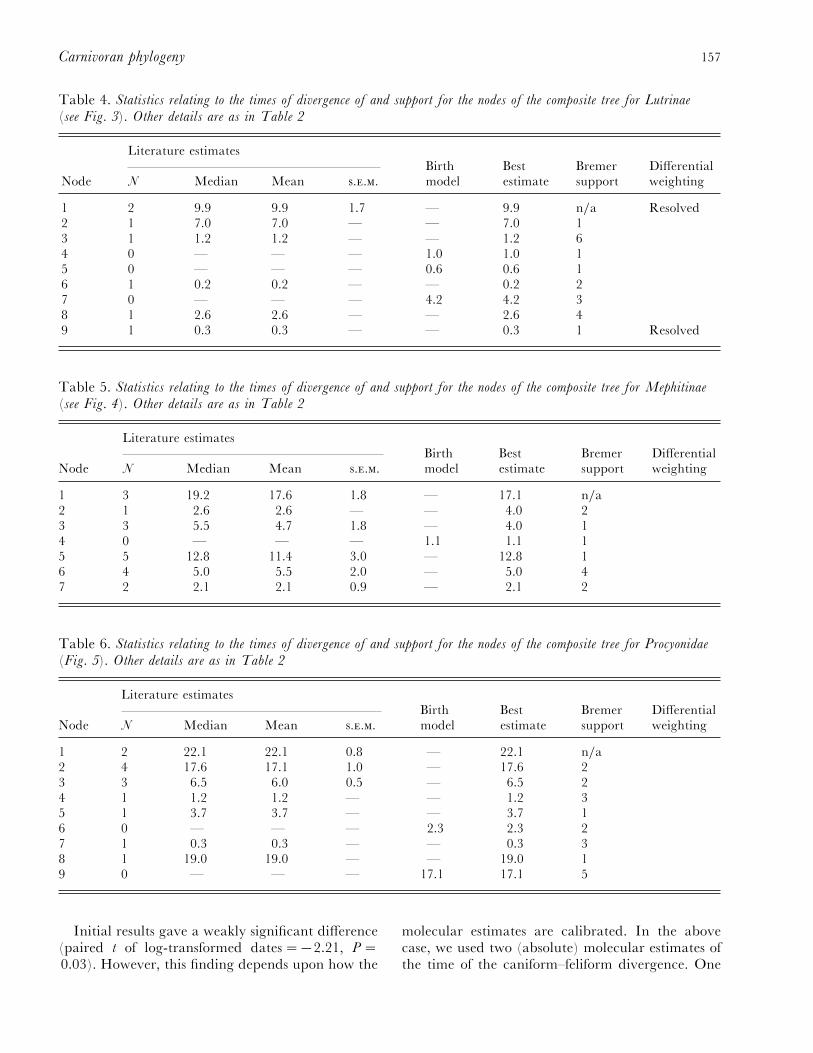
Table 4. Statistics relating to the times of divergence of and support for the nodes of the composite tree for Lutrinae
(see Fig. 3). Other details are as in Table 2
Literature estimatesBirth Best Bremer Differential
Node N Median Mean ... model estimate support weighting
1 2 9±9 9±9 1±7 — 9±9 n}a Resolved2 1 7±0 7±0 — — 7±0 13 1 1±2 1±2 — — 1±2 64 0 — — — 1±0 1±0 15 0 — — — 0±6 0±6 16 1 0±2 0±2 — — 0±2 27 0 — — — 4±2 4±2 38 1 2±6 2±6 — — 2±6 49 1 0±3 0±3 — — 0±3 1 Resolved
Table 5. Statistics relating to the times of divergence of and support for the nodes of the composite tree for Mephitinae
(see Fig. 4). Other details are as in Table 2
Literature estimatesBirth Best Bremer Differential
Node N Median Mean ... model estimate support weighting
1 3 19±2 17±6 1±8 — 17±1 n}a2 1 2±6 2±6 — — 4±0 23 3 5±5 4±7 1±8 — 4±0 14 0 — — — 1±1 1±1 15 5 12±8 11±4 3±0 — 12±8 16 4 5±0 5±5 2±0 — 5±0 47 2 2±1 2±1 0±9 — 2±1 2
Table 6. Statistics relating to the times of divergence of and support for the nodes of the composite tree for Procyonidae
(Fig. 5). Other details are as in Table 2
Literature estimatesBirth Best Bremer Differential
Node N Median Mean ... model estimate support weighting
1 2 22±1 22±1 0±8 — 22±1 n}a2 4 17±6 17±1 1±0 — 17±6 23 3 6±5 6±0 0±5 — 6±5 24 1 1±2 1±2 — — 1±2 35 1 3±7 3±7 — — 3±7 16 0 — — — 2±3 2±3 27 1 0±3 0±3 — — 0±3 38 1 19±0 19±0 — — 19±0 19 0 — — — 17±1 17±1 5
Initial results gave a weakly significant difference(paired t of log-transformed dates¯®2±21, P¯0±03). However, this finding depends upon how the
molecular estimates are calibrated. In the abovecase, we used two (absolute) molecular estimates ofthe time of the caniform–feliform divergence. One

158 Olaf R. P. Bininda-Emonds, John L. Gittleman and Andy Purvis
Table 7. Statistics relating to the times of divergence of and support for the nodes of the composite tree for Otariidae
(see Fig. 6). Other details are as in Table 2
Literature estimatesBirth Best Bremer Differential
Node N Median Mean ... model estimate support weighting
1 7 11±5 11±5 1±1 — 11±5 n}a2 3 3±4 3±8 0±6 — 6±1 53 1 8±1 8±1 — — 6±1 14 0 — — — 6±7 6±1 15 0 — — — 5±8 5±8 16 6 3±2 4±7 1±1 — 3±2 87 3 3±0 3±0 0±3 — 3±0 58 2 1±6 1.6 0±2 — 1±6 39 2 0±9 0±9 0±4 — 0±9 1 No
Table 8. Statistics relating to the times of divergence of and support for the nodes of the composite tree for Phocidae
(see Fig. 7). Other details are as in Table 2
Literature estimatesBirth Best Bremer Differential
Node N Median Mean ... model estimate support weighting
1 11 15±0 14±4 0±7 — 16±0 n}a2 4 17±0 17±7 2±2 — 16±0 63 2 12±9 12±9 0±1 — 12±9 34 3 12±4 11±8 0±7 — 12±4 65 4 5±6 5±8 0±3 — 7±1 36 4 8±6 8±0 2±6 — 7±1 17 1 2±8 2±8 — — 2±8 4 Resolved8 2 3±9 3±9 0±5 — 3±9 49 1 9±9 9±9 — — 9±9 9
10 5 14±7 14±7 0±1 — 14±7 411 7 8±8 8±7 1±6 — 8±8 112 5 6±7 7±2 1±3 — 6±7 713 1 4±9 4±9 — — 4±9 114 2 3±8 3±8 0±7 — 3±8 215 3 3±1 3±0 0±3 — 3±1 816 1 4±8 4±8 — — 4±8 817 1 2±8 2±8 — — 2±8 2
estimate [52±0 million years before present (MYBP);Sarich, 1969b] was derived from an albumin clockcalibrated with primate data while the other (40±6MYBP; Goodman et al., 1982) used a molecularclock of many different proteins calibrated using anestimate of 90 MYBP for the common ancestor of allextant eutherian mammals. Thus, the averagecalibration point (46±3 MYBP) was independent ofthe carnivore fossil record. This does not seemappropriate given that different lineages evolve atdifferent rates (Gillespie, 1991; Wayne et al., 1991;
Flynn, 1996) and any rate anomalies peculiar to thecarnivores would therefore likely be missed.
When the molecular estimates are calibratedagainst the carnivore fossil record (using the medianestimate of 55±0 MYBP obtained from the fossilsources), they now clearly provide significantly olderestimates (paired t of log-transformed dates¯®3±71,P¯ 0±0004). This seems reasonable given that fossilestimates will nearly always be underestimates of thetrue time of divergence (Marshall, 1990; Flynn,1996). We add that although both differences are

159Carnivoran phylogeny
Table 9. Statistics relating to the times of divergence of and support for the nodes of the composite tree for Ursidae
(see Fig. 8). Other details are as in Table 2
Literature estimatesBirth Best Bremer Differential
Node N Median Mean ... model estimate support weighting
1 13 21±8 21±5 2±5 — 21±8 n}a2 17 14±5 13±1 1±1 — 14±5 133 17 5±7 8±6 1±7 — 5±7 9 Resolved4 6 3±3 3±4 0±7 — 3±3 25 12 1±0 1±2 0±3 — 1±0 36 3 1±0 4±7 3±8 — 1±0 1
Table 10. Statistics relating to the times of divergence of and support for the nodes of the composite tree for Canidae
(see Fig. 9). Other details are as in Table 2
Literature estimatesBirth Best Bremer Differential
Node N Median Mean ... model estimate support weighting
1 5 12±5 15±1 3±5 — 12±5 n}a2 2 9±3 9±3 2±3 — 9±3 13 6 7±6 7±3 0±6 — 7±6 34 8 6±1 6±5 0±9 — 6±1 105 11 2±5 2±5 0±3 — 2±5 26 4 1±1 1±0 0±3 — 1±1 27 3 2±5 2±6 0±4 — 2±5 28 3 2±5 2±2 1±0 — 2±5 19 3 2±5 2±1 0±4 — 2±5 1
10 1 2±5 2±5 — — 2±5 111 2 0±8 0±8 0±4 — 0±8 112 2 7±0 7±0 4±4 — 8±4 313 1 8±2 8±2 — — 8±4 114 2 10±1 10±1 0±2 — 8±4 615 3 6±8 6±8 2±3 — 6±8 116 3 2±0 3±2 1±6 — 2±0 117 1 1±9 1±9 — — 1±9 118 1 0±2 0±2 — — 0±2 119 4 1±1 2±4 1±7 — 1±1 120 6 1±1 1±8 0±7 — 1±1 121 4 2±9 3±4 1±7 — 2±9 122 2 1±5 1±5 0±0 — 1±5 123 4 4±7 4±5 1±3 — 4±7 7
significant, they are small. Back-transforming showsthe mean difference in dates between the two sourcesto be either 1±3 or 1±5 million years, depending onthe calibration point used. In approximately a thirdof the cases, these values are smaller than thestandard errors associated with either data source fora given node (results not shown).
The discrepancy between the two tests stems from
Goodman et al.’s (1982) date for the divergence ofthe (extant) carnivores being substantially morerecent than both Sarich’s (1969b) and the fossilestimate. This arises from their use of a calibrationpoint of 90 MYBP for the origin of the extanteutherians, a figure now held to be at least 30 millionyears too recent (Graur, 1993; U. Arnason, per-sonal communication). Although we used the orig-
160 Olaf R. P. Bininda-Emonds, John L. Gittleman and Andy Purvis
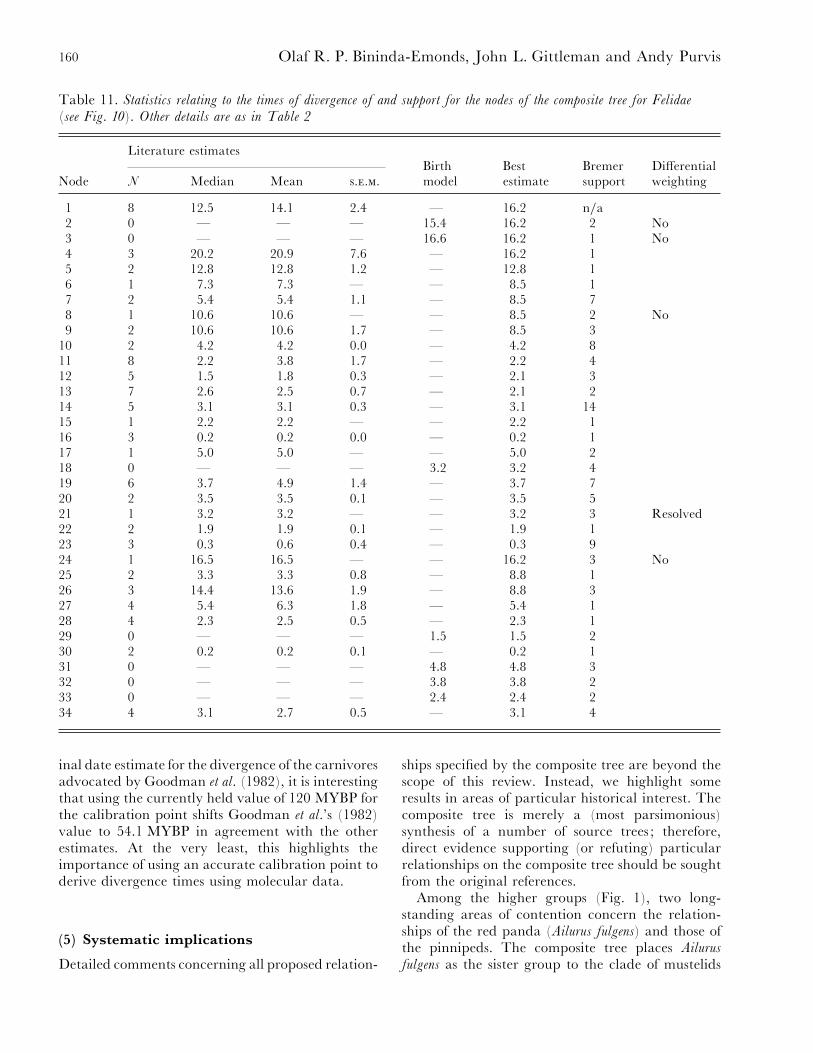
Table 11. Statistics relating to the times of divergence of and support for the nodes of the composite tree for Felidae
(see Fig. 10). Other details are as in Table 2
Literature estimatesBirth Best Bremer Differential
Node N Median Mean ... model estimate support weighting
1 8 12±5 14±1 2±4 — 16±2 n}a2 0 — — — 15±4 16±2 2 No3 0 — — — 16±6 16±2 1 No4 3 20±2 20±9 7±6 — 16±2 15 2 12±8 12±8 1±2 — 12±8 16 1 7±3 7±3 — — 8±5 17 2 5±4 5±4 1±1 — 8±5 78 1 10±6 10±6 — — 8±5 2 No9 2 10±6 10±6 1±7 — 8±5 3
10 2 4±2 4±2 0±0 — 4±2 811 8 2±2 3±8 1±7 — 2±2 412 5 1±5 1±8 0±3 — 2±1 313 7 2±6 2±5 0±7 — 2±1 214 5 3±1 3±1 0±3 — 3±1 1415 1 2±2 2±2 — — 2±2 116 3 0±2 0±2 0±0 — 0±2 117 1 5±0 5±0 — — 5±0 218 0 — — — 3±2 3±2 419 6 3±7 4±9 1±4 — 3±7 720 2 3±5 3±5 0±1 — 3±5 521 1 3±2 3±2 — — 3±2 3 Resolved22 2 1±9 1±9 0±1 — 1±9 123 3 0±3 0±6 0±4 — 0±3 924 1 16±5 16±5 — — 16±2 3 No25 2 3±3 3±3 0±8 — 8±8 126 3 14±4 13±6 1±9 — 8±8 327 4 5±4 6±3 1±8 — 5±4 128 4 2±3 2±5 0±5 — 2±3 129 0 — — — 1±5 1±5 230 2 0±2 0±2 0±1 — 0±2 131 0 — — — 4±8 4±8 332 0 — — — 3±8 3±8 233 0 — — — 2±4 2±4 234 4 3±1 2±7 0±5 — 3±1 4
inal date estimate for the divergence of the carnivoresadvocated by Goodman et al. (1982), it is interestingthat using the currently held value of 120 MYBP forthe calibration point shifts Goodman et al.’s (1982)value to 54±1 MYBP in agreement with the otherestimates. At the very least, this highlights theimportance of using an accurate calibration point toderive divergence times using molecular data.
(5) Systematic implications
Detailed comments concerning all proposed relation-
ships specified by the composite tree are beyond thescope of this review. Instead, we highlight someresults in areas of particular historical interest. Thecomposite tree is merely a (most parsimonious)synthesis of a number of source trees ; therefore,direct evidence supporting (or refuting) particularrelationships on the composite tree should be soughtfrom the original references.
Among the higher groups (Fig. 1), two long-standing areas of contention concern the relation-ships of the red panda (Ailurus fulgens) and those ofthe pinnipeds. The composite tree places Ailurus
fulgens as the sister group to the clade of mustelids

161Carnivoran phylogeny
Table 12. Statistics relating to the times of divergence of and support for the nodes of the composite tree for Herpestidae
(see Fig. 11B). Other details are as in Table 2
Literature estimatesBirth Best Bremer Differential
Node N Median Mean ... model estimate support weighting
1 1 18±5 18±5 — — 19±0 n}a2 1 19±6 19±6 — — 19±0 23 2 17±6 17±6 0±1 — 17±7 0 Collapsed4 0 — — — 17±8 17±7 0 Collapsed5 0 — — — 16±9 16±9 06 0 — — — 14±5 15±5 07 1 16±5 16±5 — — 15±5 08 1 2±6 2±6 — — 2±6 09 1 2±6 2±6 — — 2±6 0
10 0 — — — 1±3 1±3 111 0 — — — 1±3 1±3 112 0 — — — 1±5 1±5 113 0 — — — 5±8 5±8 114 1 2±6 2±6 — — 2±6 015 0 — — — 12±1 12±1 116 0 — — — 7±3 7±3 0 Collapsed17 0 — — — 3±6 3±6 018 1 11±4 11±4 — — 11±4 119 0 — — — 8±2 8±2 220 0 — — — 3±6 3±6 1
plus procyonids, a relationship advocated directly byonly Braunitzer & Hofmann (1987). In part, thisunusual placement reflects the support for an Ailurus
fulgens–procyonid clade (four source trees), but onethat is outweighed by 10 source trees linkingmustelids and procyonids with no statement re-garding Ailurus fulgens. Interestingly, more sourcetrees (11) advocate allying Ailurus fulgens with theursids, but this solution is not globally mostparsimonious. It should be noted that support for theplacement of the red panda in the composite tree isexceptionally weak compared to the remainingnodes at this level (Table 2). The pinnipeds are heldto be monophyletic in agreement with currentopinion, but with an unusual sister group: theMusteloidea (plus Ailurus fulgens) in place of the morecommonly suggested ursids. The composite tree alsoshows strong support for the traditional Otarioidea(odobenids plus otariids), in contrast to Wyss’s(1987) recent assertion of an odobenid–phocidpairing.
Within mustelids (Fig. 2), the monophyly of theclassic Simpsonian subfamilies (Lutrinae, Melinae,Mellivorinae, Mephitinae, Mustelinae; Simpson,1945) are upheld with the possible exception of thebadgers (Melinae) and ignoring the monotypic
Mellivorinae. Although no definite statement can bemade regarding the cladistic status of the formersubfamily, the position of the meline taxa at the baseof the tree suggests that it might have been originallyerected on the basis of shared primitive features(symplesiomorphies). In our analyses, the mephi-tines (skunks) were constrained to be mustelids ;however, the large negative branch length aroundthis region (Tables 3 and 5) suggests a more ancientorigin of this group and may support the paraphylyof the Mustelidae (e.g. Arnason & Widegren, 1986;Wayne et al., 1989a ; Arnason & Ledje, 1993; Vranaet al., 1994; Ledje & Arnason, 1996). Relationshipswithin the mustelids are generally not stronglysupported (Tables 3–5). All subgenera of Mustela
(see Youngman, 1982; Nowak, 1991) are indicatedto be monophyletic except the nominal subgenus(species altaica, erminea, frenata, kathiah and nivalis)(Fig. 2). Within otters (Fig. 3), Lutra is polyphyleticand there is much uncertainty regarding the relation-ships among the major lineages. Among mephitines(Fig. 4), the South American species of Conepatus
(chinga, humboldtii and semistriatus) do not form asingle clade.
The procyonids are divided into their two recog-nized subfamilies with all relationships receiving
162 Olaf R. P. Bininda-Emonds, John L. Gittleman and Andy Purvis
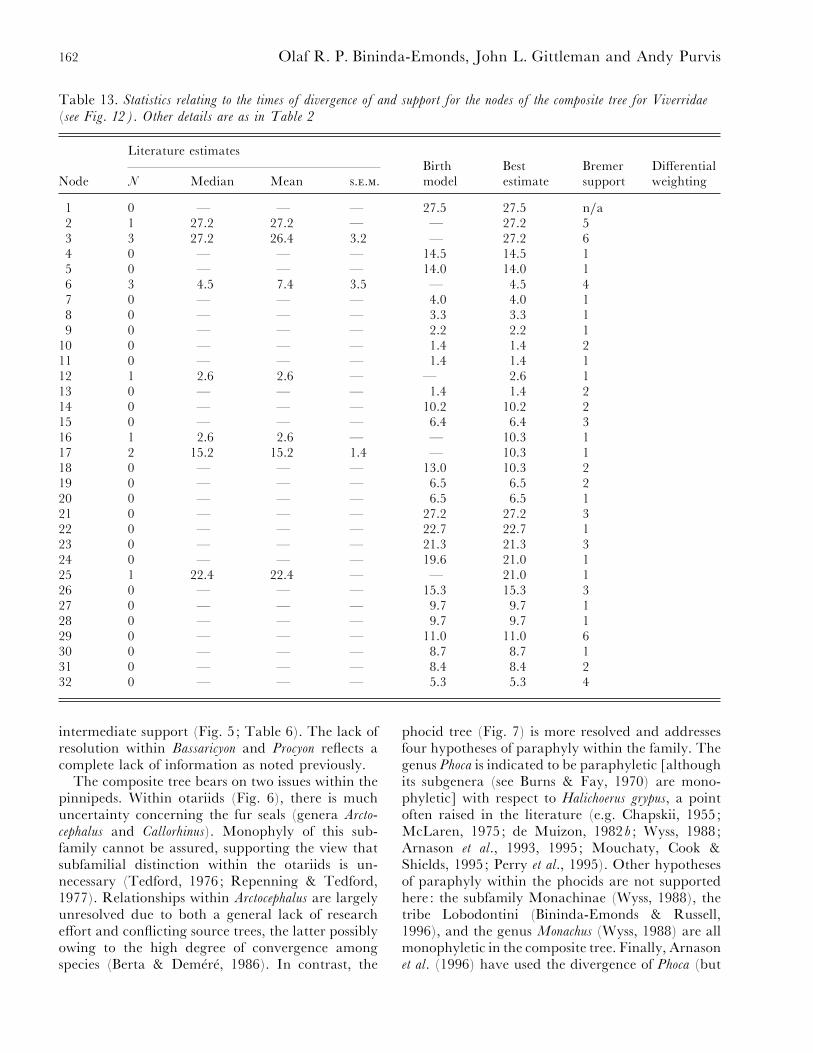
Table 13. Statistics relating to the times of divergence of and support for the nodes of the composite tree for Viverridae
(see Fig. 12). Other details are as in Table 2
Literature estimatesBirth Best Bremer Differential
Node N Median Mean ... model estimate support weighting
1 0 — — — 27±5 27±5 n}a2 1 27±2 27±2 — — 27±2 53 3 27±2 26±4 3±2 — 27±2 64 0 — — — 14±5 14±5 15 0 — — — 14±0 14±0 16 3 4±5 7±4 3±5 — 4±5 47 0 — — — 4±0 4±0 18 0 — — — 3±3 3±3 19 0 — — — 2±2 2±2 1
10 0 — — — 1±4 1±4 211 0 — — — 1±4 1±4 112 1 2±6 2±6 — — 2±6 113 0 — — — 1±4 1±4 214 0 — — — 10±2 10±2 215 0 — — — 6±4 6±4 316 1 2±6 2±6 — — 10±3 117 2 15±2 15±2 1±4 — 10±3 118 0 — — — 13±0 10±3 219 0 — — — 6±5 6±5 220 0 — — — 6±5 6±5 121 0 — — — 27±2 27±2 322 0 — — — 22±7 22±7 123 0 — — — 21±3 21±3 324 0 — — — 19±6 21±0 125 1 22±4 22±4 — — 21±0 126 0 — — — 15±3 15±3 327 0 — — — 9±7 9±7 128 0 — — — 9±7 9±7 129 0 — — — 11±0 11±0 630 0 — — — 8±7 8±7 131 0 — — — 8±4 8±4 232 0 — — — 5±3 5±3 4
intermediate support (Fig. 5; Table 6). The lack ofresolution within Bassaricyon and Procyon reflects acomplete lack of information as noted previously.
The composite tree bears on two issues within thepinnipeds. Within otariids (Fig. 6), there is muchuncertainty concerning the fur seals (genera Arcto-cephalus and Callorhinus). Monophyly of this sub-family cannot be assured, supporting the view thatsubfamilial distinction within the otariids is un-necessary (Tedford, 1976; Repenning & Tedford,1977). Relationships within Arctocephalus are largelyunresolved due to both a general lack of researcheffort and conflicting source trees, the latter possiblyowing to the high degree of convergence amongspecies (Berta & Deme! re! , 1986). In contrast, the
phocid tree (Fig. 7) is more resolved and addressesfour hypotheses of paraphyly within the family. Thegenus Phoca is indicated to be paraphyletic [althoughits subgenera (see Burns & Fay, 1970) are mono-phyletic] with respect to Halichoerus grypus, a pointoften raised in the literature (e.g. Chapskii, 1955;McLaren, 1975; de Muizon, 1982b ; Wyss, 1988;Arnason et al., 1993, 1995; Mouchaty, Cook &Shields, 1995; Perry et al., 1995). Other hypothesesof paraphyly within the phocids are not supportedhere: the subfamily Monachinae (Wyss, 1988), thetribe Lobodontini (Bininda-Emonds & Russell,1996), and the genus Monachus (Wyss, 1988) are allmonophyletic in the composite tree. Finally, Arnasonet al. (1996) have used the divergence of Phoca (but
163Carnivoran phylogeny
actually equivalent to node 5 on Fig. 7) as astandard reference for calibrating recent mammaliandivergence events (the ‘Phoca standard’) ; however,Table 8 indicates their estimate of 2±7 MYBP to betoo recent.
The giant panda (Ailuropoda melanoleuca), whichwas constrained in our analyses to be an ursid (see‘Methodology’), is very clearly the sister group tothe other bears in the composite tree (Fig. 8; Table9). The position of the American black bear (Ursus
americanus) remains contentious and merits furtherinvestigation; the polytomy in this region agreeswith recent, independent molecular findings(L. Waits, personal communication). At present, themonophyly of Ursus is not assured, which supportscontinuing calls for a revision of the genus-leveltaxonomy of ursids (see Goldman, Giri & O’Brien,1989; Zhang & Ryder, 1994). The close associationbetween the brown and polar bears (U. arctos and U.maritimus, respectively) is upheld, reflecting sugges-tions that the two might be conspecific (e.g. Croninet al., 1991; Talbot & Shields, 1996). The elevationof the polar bear to its own genus (Thalarctos ; Corbet& Hill, 1991) is clearly not appropriate withoutadditional taxonomic alterations.
Canids are divided into two main clades (Fig. 9),corresponding roughly to the ‘dog-like ’ and ‘ fox-like ’ forms of many authors (¯Canini and Vulpini,respectively, of Tedford, Taylor & Wang, 1995).The problematic genera Nyctereutes and Otocyon
cluster with the dog-like and fox-like clades, re-spectively, although Nyctereutes could almost equallywell be placed with Otocyon (results not shown). Ofthe monotypic dog-like genera, only the FalklandIsland wolf (Dusicyon australis) is placed un-ambiguously, forming the sister group to the SouthAmerican ‘ foxes ’ (Pseudalopex spp.), which havefrequently been considered to belong in the samegenus as it. Canis forms a well-defined clade dividedinto ‘wolf-like ’ and ‘ jackal-like ’ forms. The Simienjackal (C. simensis) clearly clusters with the wolf-likeforms and so justifies its less frequently used commonname of the Ethiopian wolf (see Gottelli et al., 1994;Geffen et al., 1996). The red wolf (C. rufus) forms thesister taxon to the grey wolf (C. lupus), although thesupport for this placement is overestimated in Table10. Several authors (e.g. Wayne & Jenks, 1991; Royet al., 1994; possibly Lawrence & Bossert, 1967) holdC. rufus to be a hybrid between the coyote and thegrey wolf, which we coded as a polytomy betweenthe three species. However, in our analyses, apolytomy is always outweighed by any fully resolvedanswer. Two studies advocated a hybrid origin while
four clustered C. rufus with C. lupus as on thecomposite tree. With the exception of the SouthAmerican ‘ foxes ’, the fox-like canids form a distinctcluster with Otocyon and Urocyon in basal positions.Vulpes is indicated to be paraphyletic with respect tothe Arctic fox (Alopex lagopus), an outcome sup-porting those arguing against the generic distinctionof the latter (e.g. Tedford et al., 1995).
The composite tree for felids is largely resolved(Fig. 10), but the backbone is weakly supported(Table 11), reflecting the historical controversy overfelid phylogeny. Three of the better supported clades(nodes 7, 19 and 26) correspond to major clades inrecent molecular phylogenies from S. J. O’Brien’sresearch group: the Panthera group, the ocelotlineage, and the domestic cat lineage, respectively(see O’Brien et al., 1996). Most of the extant specieswithin the ocelot lineage radiated between 3±7 and3±0 MYBP (Table 11). Although this time scaleaccords with some estimates of the earliest formationof the Panamanian land bridge (e.g. White, 1986;Martin, 1989), it predates others (e.g. Stehli &Webb, 1985; Wayne et al., 1991) as well as the firstappearance of fossil felids in South America (1±9–2±4MYBP; Hunt, 1996) and the time of the greatestfaunal exchange between North and South America(Plio-Pleistocene; Hunt, 1996). If our dates areaccurate, they suggest that much of the diversi-fication within the ocelot lineage may have occurredbefore it reached South America (contra PeconSlattery et al., 1994) or shortly thereafter. Thepantherine lineage of O’Brien et al. (1996) is notmonophyletic in our tree, being split into a majorterminal clade (node 6) and numerous smallerlineages in the basal portion of the composite tree.The cheetah (Acinonyx jubatus) occupies its traditionalposition as sister taxon to the remaining felids (Kra! l& Zima, 1980; Martin, 1980) rather than to Puma
(contra O’Brien et al., 1996). Within the terminalclade, the golden cats (Catopuma temminckii andProfelis aurata) are paraphyletic with respect to thebay cat (Catopuma badia), rather than polyphyletic asfound by O’Brien et al. (1996). Despite the lack ofrobustness of many nodes, all but two of the generarecognized by Wozencraft (1993), Leopardus andOncifelis, are monophyletic. Altogether, the patternwe found of well-supported groups of uncertaininterrelationships (i.e. the weak backbone) reflectscurrent opinion of felid phylogeny (S. J. O’Brien,personal communication).
In hyaenids (Fig. 1), the only point of consensus isthe sister group status of the aardwolf (Proteles
cristatus) to the remaining species. The traditional
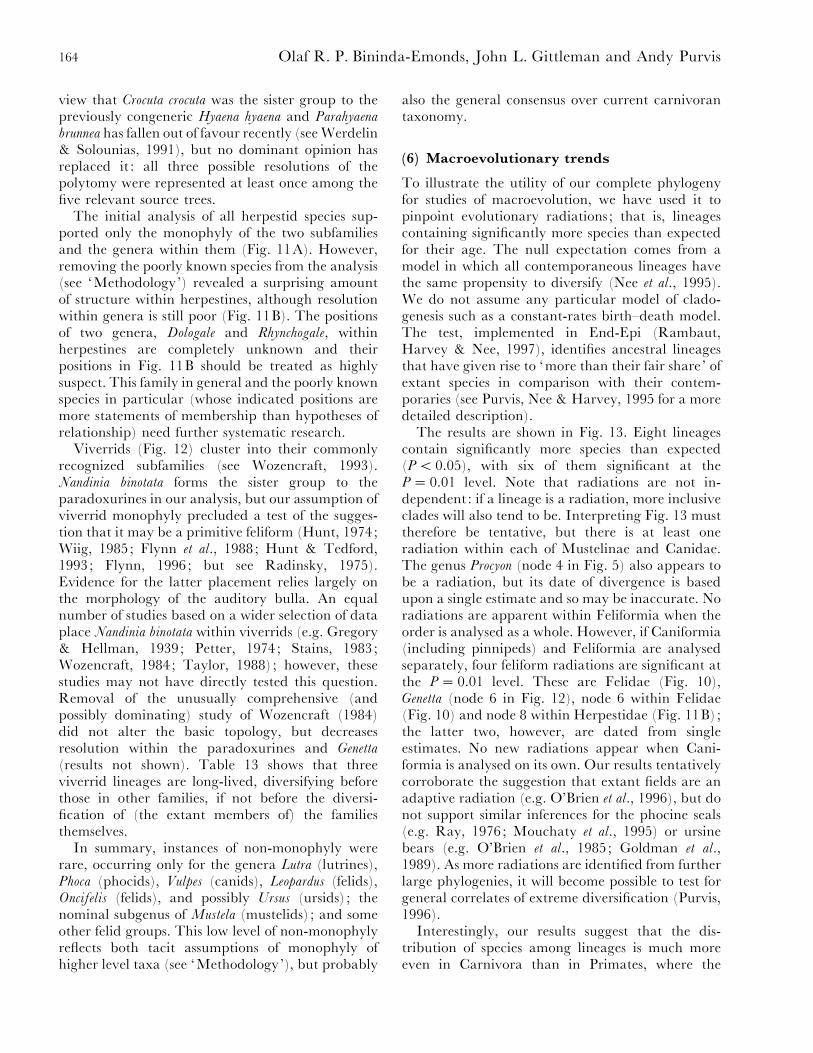
164 Olaf R. P. Bininda-Emonds, John L. Gittleman and Andy Purvis
view that Crocuta crocuta was the sister group to thepreviously congeneric Hyaena hyaena and Parahyaena
brunnea has fallen out of favour recently (see Werdelin& Solounias, 1991), but no dominant opinion hasreplaced it : all three possible resolutions of thepolytomy were represented at least once among thefive relevant source trees.
The initial analysis of all herpestid species sup-ported only the monophyly of the two subfamiliesand the genera within them (Fig. 11A). However,removing the poorly known species from the analysis(see ‘Methodology’) revealed a surprising amountof structure within herpestines, although resolutionwithin genera is still poor (Fig. 11B). The positionsof two genera, Dologale and Rhynchogale, withinherpestines are completely unknown and theirpositions in Fig. 11B should be treated as highlysuspect. This family in general and the poorly knownspecies in particular (whose indicated positions aremore statements of membership than hypotheses ofrelationship) need further systematic research.
Viverrids (Fig. 12) cluster into their commonlyrecognized subfamilies (see Wozencraft, 1993).Nandinia binotata forms the sister group to theparadoxurines in our analysis, but our assumption ofviverrid monophyly precluded a test of the sugges-tion that it may be a primitive feliform (Hunt, 1974;Wiig, 1985; Flynn et al., 1988; Hunt & Tedford,1993; Flynn, 1996; but see Radinsky, 1975).Evidence for the latter placement relies largely onthe morphology of the auditory bulla. An equalnumber of studies based on a wider selection of dataplace Nandinia binotata within viverrids (e.g. Gregory& Hellman, 1939; Petter, 1974; Stains, 1983;Wozencraft, 1984; Taylor, 1988); however, thesestudies may not have directly tested this question.Removal of the unusually comprehensive (andpossibly dominating) study of Wozencraft (1984)did not alter the basic topology, but decreasesresolution within the paradoxurines and Genetta
(results not shown). Table 13 shows that threeviverrid lineages are long-lived, diversifying beforethose in other families, if not before the diversi-fication of (the extant members of) the familiesthemselves.
In summary, instances of non-monophyly wererare, occurring only for the genera Lutra (lutrines),Phoca (phocids), Vulpes (canids), Leopardus (felids),Oncifelis (felids), and possibly Ursus (ursids) ; thenominal subgenus of Mustela (mustelids) ; and someother felid groups. This low level of non-monophylyreflects both tacit assumptions of monophyly ofhigher level taxa (see ‘Methodology’), but probably
also the general consensus over current carnivorantaxonomy.
(6) Macroevolutionary trends
To illustrate the utility of our complete phylogenyfor studies of macroevolution, we have used it topinpoint evolutionary radiations ; that is, lineagescontaining significantly more species than expectedfor their age. The null expectation comes from amodel in which all contemporaneous lineages havethe same propensity to diversify (Nee et al., 1995).We do not assume any particular model of clado-genesis such as a constant-rates birth–death model.The test, implemented in End-Epi (Rambaut,Harvey & Nee, 1997), identifies ancestral lineagesthat have given rise to ‘more than their fair share ’ ofextant species in comparison with their contem-poraries (see Purvis, Nee & Harvey, 1995 for a moredetailed description).
The results are shown in Fig. 13. Eight lineagescontain significantly more species than expected(P! 0±05), with six of them significant at theP¯ 0±01 level. Note that radiations are not in-dependent : if a lineage is a radiation, more inclusiveclades will also tend to be. Interpreting Fig. 13 musttherefore be tentative, but there is at least oneradiation within each of Mustelinae and Canidae.The genus Procyon (node 4 in Fig. 5) also appears tobe a radiation, but its date of divergence is basedupon a single estimate and so may be inaccurate. Noradiations are apparent within Feliformia when theorder is analysed as a whole. However, if Caniformia(including pinnipeds) and Feliformia are analysedseparately, four feliform radiations are significant atthe P¯ 0±01 level. These are Felidae (Fig. 10),Genetta (node 6 in Fig. 12), node 6 within Felidae(Fig. 10) and node 8 within Herpestidae (Fig. 11B);the latter two, however, are dated from singleestimates. No new radiations appear when Cani-formia is analysed on its own. Our results tentativelycorroborate the suggestion that extant fields are anadaptive radiation (e.g. O’Brien et al., 1996), but donot support similar inferences for the phocine seals(e.g. Ray, 1976; Mouchaty et al., 1995) or ursinebears (e.g. O’Brien et al., 1985; Goldman et al.,1989). As more radiations are identified from furtherlarge phylogenies, it will become possible to test forgeneral correlates of extreme diversification (Purvis,1996).
Interestingly, our results suggest that the dis-tribution of species among lineages is much moreeven in Carnivora than in Primates, where the

165Carnivoran phylogeny
Cercopithecidae (Old World monkeys) constitute amassive radiation (Purvis et al., 1995). There is alsoa marked difference in the distribution of species-poor lineages. According to Tables 2–13, 19 car-nivore species last shared a common ancestor withany other extant species more than 15 MYBP. Bycomparison, only three primate species are soisolated (Purvis, 1995a). Even allowing for un-certainties in the dates, these differences betweencarnivores and primates clearly merit further investi-gation.
V. CONCLUSIONS
(1) Supertree construction is a powerful new tool forbuilding larger and more comprehensive phylo-genies. MRP in particular combines positive aspectsof both character and taxonomic congruenceapproaches.
(2) By using MRP, we have constructed the firstfull species-level phylogeny for all extant species ofCarnivora from a wide variety of data sourcesspanning 25 years of systematic research into thismammalian order. The incompatibility and po-tential heterogeneity in signal among some of thesedata sets would preclude obtaining an answer usingcharacter congruence, and taxonomic congruence’sreliance on consensus techniques would result in amuch less resolved answer.
(3) Our composite tree shows that disparatestudies of carnivoran phylogeny agree to a surprisingextent : poorly resolved taxa are generally those thathave been studied least. More research is clearlymerited for herpestids and viverrids as a whole andwithin the procyonid genera Bassaricyon and Procyon.For some other questions (e.g. relationships amongfelid genera and among hyaenines, and the positionsof the red panda and of the monotypic ‘dog-like ’canid genera), no clear answers have emerged despiteconsiderable effort. Additional data may help resolvethese issues ; however, it may be that they areinherently difficult because they involve successivesplitting events that were close together in time, andlong ago.
(4) The tree we present is the largest completespecies-level phylogeny for any group. It will providea touchstone for many kinds of comparative studywithin carnivores (e.g. character evolution, macro-evolutionary studies, conservation studies) and hasalready been used to test for correlations betweenpopulation size and geographic range in Britishmammals (Blackburn et al., 1997), between body size
and species richness in all carnivores (Gittleman &Purvis, 1998), between foraging strategy and theextent of stereotypic behaviour displayed by captivecarnivores (Clubb & Mason, 1998), and to examinefor edge effects with respect to the conservationbiology of large carnivores (Woodroffe & Ginsberg,1998). Our tree also serves as a strawman for furthersystematic research into this fascinating order.
VI. ACKNOWLEDGEMENTS
We thank Paul Harvey, Steve O’Brien, David Penny andespecially Harold Bryant for helpful discussion, comments,and ideas. Additional constructive comments were pro-vided by several anonymous referees and Phyllis Lee.Greg Anderson, David Bininda and Kevin Seymourhelped to track down some of the more obscure or elusivereferences. Financial support was provided by AlbertaHeritage, the United Kingdom’s Overseas ResearchScholarship plan, and an NSERC postgraduate scholar-ship (O.R.P.B.-E.) ; a Professional Leave Award fromthe Graduate School of the University of Tennessee, theDepartment of Zoology of the University of Oxford, andthe NERC Centre for Population Biology at SilwoodPark, Imperial College (J.L.G.) ; and the Royal Society,the NERC (GR3}8515) and the Department of Ecologyand Evolutionary Biology at the University of Tennessee(A.P.).
VII. REFERENCES
(References marked with * and}or † were used, respectively, as
sources of phylogenies or date estimates for the composite
phylogeny.)
A, E. M. III. (1972). Consensus techniques and the
comparison of taxonomic trees. Systematic Zoology 21, 390–397.
*A, A., J, M. & B, G. (1990). Carnivora:
the primary structure of hemoglobin from adult coati (Nasua
nasua rufa, Procyonidae). Journal of Protein Chemistry 9, 23–29.
*A, A., J, M. & B, G. (1992). Carnivora:
the primary structure of the major haemoglobin component
from adult European lynx (Lynx lynx, Felidae). Journal of
Protein Chemistry 11, 39–43.
*A, E. M. (1971). Chromosomal sets of the Greenland,
Caspian and Baikal seals and some problems of the evolution
of true seals (Phocidae). Tsitologiya 13, 341–347.
*†A, E. (1970). Quaternary evolution of the Genus
Martes (Carnivora, Mustelidae). Acta Zoologica Fennica 130,
1–132.
*†A, E. (1989). The phylogeny of mustelids and the
systematics of ferrets. In Conservation Biology and the Black-footed
Ferret (ed. U. S. Seal, E. T. Thorne, M. A. Bogan and S. H.
Anderson), pp. 10–20. Yale University Press, New Haven,
Connecticut.
†A, E., F, S. C., C, T. W. & R,
L. (1986). Paleobiology, biogeography, and systematics of the
black-footed ferret, Mustela nigripes (Audubon and Bachman),
1851. Great Basin Naturalist Memoirs 8, 11–62.
166 Olaf R. P. Bininda-Emonds, John L. Gittleman and Andy Purvis
*A, U. (1977). The relationship between the four
principal pinniped karyotypes. Hereditas 87, 227–242.
*†A, U., B, K., G, A., L, C. &
M, S. (1995). A molecular view of pinniped
relationships with particular emphasis on the true seals.
Journal of Molecular Evolution 40, 78–85.
†A, U., G, A., J, E. & L, C. (1993).
The nucleotide sequence of the mitochondrial DNA molecule
of the grey seal, Halichoerus grypus, and a comparison with
mitochondrial sequences of other true seals. Journal of
Molecular Evolution 37, 323–330.
*A, U. & L, C. (1993). The use of highly repetitive
DNA for resolving cetacean and pinniped phylogenies. In
Mammalian Phylogeny: Placentals, vol. 3 (ed. F. S. Szalay, M. J.
Novacek and M. C. McKenna), pp. 74–80. Springer-Verlag,
New York.
*A, U. & W, B. (1986). Pinniped phylogeny
enlightened by molecular hybridizations using highly repeti-
tive DNA. Molecular Biology and Evolution 3, 356–365.
A, U., X, X., G, A. & G, D. (1996). The
‘Phoca standard’ : an external molecular reference for cali-
brating recent evolutionary divergences. Journal of Molecular
Evolution 43, 41–45.
*A, D. L. (1978). Evolution and morphology of the coyote
brain. In Coyotes: Biology, Behavior, and Management (ed.
M. Bekoff), pp. 17–35. Academic Press, New York.
*A, D. L. & D, L. S. (1971). Evolution of the
cerebellum in the genus Canis. Journal of Mammalogy 52,
96–107.
*A, P. K. (1996). Systematic relationships of the
Herpestidae (Mammalia: Carnivora). M.Sc. thesis, Uni-
versity of Illinois, Chicago.
B, W. J., F, D. H. A., T, D. A., C, J.,
S, J. A. & G, M. (1991). Molecular evo-
lution of the η-globin gene locus : gibbon phylogeny and the
hominoid slowdown. Molecular Biology and Evolution 8, 155–184.
*†B, L. G., D, D. P. & R, C. E. (1985). Status
of studies on fossil marine mammals. Marine Mammal Science 1,
15–53.
B, M., D, M. J. & S, E. (1991). Against
consensus. Systematic Zoology 40, 486–493.
*†B, J. A. (1982). Tertiary Procyonidae (Mammalia:
Carnivora) of North America. Journal of Vertebrate Paleontology
2, 71–93.
B, J. A. (1989). Comments on New World Tertiary
Procyonidae (Mammalia: Carnivora). Journal of Vertebrate
Paleontology 9, 110–117.
B, B. R. (1992). Combining trees as a way of combining
data sets for phylogenetic inference, and the desirability of
combining gene trees. Taxon 41, 3–10.
B, B. R. & R, M. A. (1993). Reply to A. G. Rodrigo’s
‘A comment on Baum’s method for combining phylogenetic
trees ’. Taxon 42, 637–640.
*B, M. P. (1990). Comparative terrestrial locomotion of
the Hooker’s sea lion (Phocarctos hookeri) and the New Zealand
fur seal (Arctocephalus forsteri) : evolutionary and ecological
implications. Zoological Journal of the Linnean Society 98,
307–325.
*B, D. K., B, O. K., F, I. I.,
S, S. I., T, D. V. & T, J. G.
(1984). Interspecific antigenic variation of serum proteins in
the family Mustelidae (Carnivora). Zoologicheskii Zhurnal 63,
912–922.
*†B, R. E. (1985). The contributions of retroviruses
to the study of mammalian evolution. In Molecular Evolutionary
Genetics (ed. R. J. MacIntyre), pp. 359–417. Plenum Press,
New York.
*†B, A. (1987). Origin, diversification, and zoogeography
of the South American Canidae. Fieldiana Zoology 39, 455–471.
B, A. (1991). New Enaliarctos* (Pinnipedimorpha) from the
Oligocene and Miocene of Oregon and the role of
‘enaliarctids ’ in pinniped phylogeny. Smithsonian Contributions
to Paleobiology 69, 1–33.
*B, A. & D! ! , T. (1986). Callorhinus gilmorei n. sp.
(Carnivora: Otariidae) from the San Diego Formation
(Blancan) and its implications for otariid phylogeny. Trans-
actions of the San Diego Society of Natural History 21, 111–126.
*B, A. & W, A. R. (1994). Pinniped phylogeny. In
Contributions in Marine Mammal Paleontology Honoring Frank
C. Whitmore, Jr., vol. 29 (ed. A. Berta and T. A. Deme! re! ), pp.
33–56. Proceedings of the San Diego Society of Natural
History, San Diego.
B-E, O. R. P. & B, H. N. (1998). Properties
of matrix representation with parsimony analyses. Systematic
Biology 47, 497–508.
*B-E, O. R. P. & R, A. P. (1996). A mor-
phological perspective on the phylogenetic relationships of the
extant phocid seals (Mammalia: Carnivora: Phocidae).
Bonner zoologische Monographien 41, 1–256.
B, T. M., G, K. J., Q, R. M., A, H.
& G, R. D. (1997). Of mice and wrens : the relation
between abundance and geographic range size in British
mammals and birds. Philosophical Transactions of the Royal
Society of London B 352, 419–427.
*†B, L. V. & P, V. D. (1982). [New data on
the taxonomic position of the Baikal seal Phoca (Pusa) sibirica
Gmel.]. In [Morpho-Physiological and Ecological Studies of the
Baikal Seal] (ed. V. D. Pastukhov), pp. 7–12. Nauka,
Novosibirsk.
*B, G. & H, O. (1987). Les he!moglobins des
pandas. Comptes Rendus des SeUances de la SocieU teU de Biologie et de
ses Filiales 181, 116–121.
B, K. (1988). The limits of amino acid sequence data in
angiosperm phylogenetic reconstruction. Evolution 42,
795–803.
*†B, H. N., R, A. P. & F, W. D. (1993).
Phylogenetic relationships within the extant Mustelidae
(Carnivora) : appraisal of the cladistic status of the
Simpsonian subfamilies. Zoological Journal of the Linnean Society
108, 301–334.
*B, J. (1978). The cephalic arterial system in carnivores,
with special reference to the systematic classification. Acta
Anatomica 101, 45–61.
B, J. J., H, J. P., C, C. W.,
S, D. L. & W, P. J. (1993). Partitioning and
combining data in phylogenetic analysis. Systematic Biology 42,
384–397.
*B, J. J. & F, F. H. (1970). Comparative morphology of
the skull of the Ribbon seal, Histriophoca fasciata, with remarks
on the systematics of Phocidae. Journal of Zoology 161, 363–394.
†C, W. R., W-H, D. H. & B,
R. E. (1985). Cytogenetic evolution of the world’s felines.
Clinical Research 33, A117.
*C, K. K. (1955). An attempt at revision of the
systematics and diagnostics of seals of the subfamily Phocinae.
Trudy Zoologicheskovo Instituta Akademii Nauk SSSR 17, 160–199.

167Carnivoran phylogeny
[In Russian. English translation by Jeletzky, T. F. 1957.
Fisheries Research Board of Canada Translation Series 114.]
*C, A. B. (1975). The chromosomes of the Canidae. In
The Wild Canids: their Systematics, Behavioral Ecology and Evolution
(ed. M. W. Fox), pp. 40–53. Van Nostrand Reinhold
Company, New York.
C, P. T. & W, J. J. (1994). Weighting, par-
titioning, and combining characters in phylogenetic analysis.
Systematic Biology 43, 278–287.
C, R. & M, G. (1998). Foraging niche and stereotypic
behaviour. In Proceedings of the 32nd Congress of the International
Society for Applied Ethology, 21–25 July 1998, Clermont-Ferrand,
France (ed. I. Veissier and A. Boissy), pp. 174. Institut
National de la Recherche! Agronomique, France.
*C-B, J., C, G. B. & H, M. (1976). A
review of the family Canidae, with a classification by
numerical methods. Bulletin of the British Museum of Natural
History 29, 120–199.
*†C, G. E. & O’B, S. J. (1985). A molecular
phylogeny of the Felidae: immunological distance. Evolution
39, 473–487.
C, G. B. & H, J. E. (1991). A World List of Mammalian
Species. Oxford University Press, Oxford.
*C, J. & D, B. (1985). Evolution chromo-
somique chez les Carnivores. Mammalia 50A, 124–162.
C, M. A. (1992). The oldest seal of the southern
hemisphere : implications to phocid phylogeny and dispersal.
Journal of Vertebrate Paleontology 12, 25A–26A.
*C-C, J. (1982 (intended 1980–1981)). The
classification of the genets (Carnivora, Viverridae, genus
Genetta). Boletim da Sociedade Portuguesa de Ciencias Naturais 20,
97–114.
C, S. & M, D. (1995). Sociality, group size, and
reproductive suppression in carnivores. Advances in the Study of
Behavior 24, 203–257.
*†C, M. A., A, S. C., G, G. W. & V,
E. R. (1991). Interspecific and intraspecific mitochondrial
DNA variation in North American bears (Ursus). Canadian
Journal of Zoology 69, 2985–2992.
*C, J., G, M., K, B. F., T, D. A.,
S, J., B, G., K, T. K.,
J, W. W. & M, G. (1991). Perspectives from
amino acid and nucleotide sequences on cladistic relationships
among higher taxa of eutheria. In Current Mammalogy, vol. 2
(ed. H. H. Genoways), pp. 545–572. Plenum Press, New
York.
*C, J., G, M., M, N. D. & K,
S. M. (1990). Maximum parsimony approach to construction
of evolutionary trees from aligned homologous sequences.
Methods in Enzymology 183, 601–615.
*D, P. D. & L, H. (1976). Comparison of the
myoglobin of the bat-eared fox (Otocyon megalotis) with that of
the domestic dog (Canis familiaris). Biochimica et Biophysica Acta
453, 285–288.
*D, J. A. (1978). A classification of the otters. In Otters –
Proceedings of the first working meeting of the otter specialist group of
the survival service commission (ed. N. Duplaix), pp. 14–33.
IUCN (International Union for Conservation of Nature and
Natural Resources) Publication. New Series.
* J, W. W. (1986). Protein sequence evidence for
monophyly of the carnivore families Procyonidae and
Mustelidae. Molecular Biology And Evolution 3, 276–281.
* M, C. (1982a). Les relations phyloge!ne! tiques des
Lutrinae (Mustelidae, Mammalia). Geobios MeUmoires SpeU cial 6,
259–277.
* M, C. (1982b). Phocid phylogeny and dispersal.
Annals of the South African Museum 89, 175–213.
Q, A., D, M. J. & K, J. (1995). Separate
versus combined analysis of phylogenetic evidence. Annual
Review of Ecology and Systematics 26, 657–681.
*D, D. M. (1996). The utility of chemical signals as
characters in phylogenetic studies : examples from the Felidae.
Ph.D. thesis, University of Knoxville, Tennessee.
*D, D. M. & W, W. C. (1991). Phylogenetic
analysis of Recent procyonid genera. Journal of Mammalogy 72,
42–55.
D, M. J., D, J. A., G, J., K, A. G. &
R, T. (1989). The importance of fossils in phylogeny
reconstruction. Annual Review of Ecology and Systematics 20,
431–460.
*†D, J. W., B, R. D., H, R. L. &
T, J. W. (1993). Phylogenetic relationships among
the skunks : a molecular perspective. Journal of Mammalian
Evolution 1, 255–267.
*D, B., C, J. & C, G. (1982). Notes
et discussions sur ‘E! dentes ’, Carnivores, ‘Pinnipe' des ’ et leurs
parasites. 3. – Les Pinnipe' des, monophyle! tiques, sont issus de
Procyonidae ancestraux, et non d’Ursidae ni de Mustelidae.
MeUmoires du MuseUum National d’Histoire Naturelle SeU rie A Zoologie
123, 141–143.
*†E, M. F., E, M. & H, E. H. (1988).
Mitochondrial DNA analyses for the molecular taxonomy of
South African mammals. Transactions of the Royal Society of
South Africa 46, 291–293.
F, J. S. (1983). The logical basis of phylogenetic analysis.
In Advances in Cladistics, vol. 2 (ed. N. I. Platnick and V. A.
Funk), pp. 7–36. Columbia University Press, New York.
F, J. S., A, V. A., K$ $ , M., L, D. &
K, A. G. (1996). Parsimony jackknifing outperforms
neighbor-joining. Cladistics 12, 99–124.
F, J. (1985a). Confidence limits on phylogenies : an
approach using the bootstrap. Evolution 39, 783–791.
F, J. (1985b). Phylogenies and the comparative
method. American Naturalist 125, 1–15.
*†F, G. (1979). Osservazione sull’evoluzione del
genere Ursus. Bollettino della Societa[ Paleontologica Italiana 18,
166–172.
F, J. J. (1988). Ancestry of sea mammals. Nature 334,
383–384.
F, J. J. (1996). Carnivoran phylogeny and rates of
evolution: morphological, taxic, and molecular. In Carnivore
Behavior, Ecology, and Evolution, vol. 2 (ed. J. L. Gittleman), pp.
542–581. Cornell University Press, Ithaca, New York.
*F, J. J. & G, H. (1982). Phylogeny of the early
Tertiary Carnivora, with a description of a new species of
Protictis from the middle Eocene of northwestern Wyoming.
American Museum Novitates 2725, 1–64.
*F, J. J., N, N. A. & T, R. H. (1988). Phylogeny
of the Carnivora. In The Phylogeny and Classification of the
Tetrapods, vol. 2 – Mammals (ed. M. J. Benton), pp. 73–116.
Clarendon Press, Oxford.
*F, M. W. (1971). The Behavior of Wolves, Dogs and Related
Canids. Harper and Row, New York.
*F, K. (1972). Comparative chromosome studies in
mongooses (Carnivora, Viverridae). Hereditas 71, 1–74.
*G, H. & F, D. (1977). Chasmaporthetes kani, new
168 Olaf R. P. Bininda-Emonds, John L. Gittleman and Andy Purvis
species from China, with remarks on phylogenetic relation-
ships of genera within the Hyaenidae (Mammalia, Car-
nivora). American Museum Novitates 2632, 1–16.
*†G, T. J., D, A. W., J, C. M. & J,
J. A. (1993). Phylogenetic analysis of covariance by computer
simulation. Systematic Biology 42, 265–292.
G, J., K, A. G. & R, T. (1988). Amniote
phylogeny and the importance of fossils. Cladistics 4, 105–209.
*†G, E., G, M. E., G, J. L., L, H.-W.,
M, D. W. & W, R. K. (1996). Size, life-
history traits, and social organization in the Canidae: a
reevaluation. American Naturalist 147, 140–160.
*†G, E., M, A., G, D. J., M,
D. W. & W, R. K. (1992). Phylogenetic relationships of
the fox-like canids : mitochondrial DNA restriction fragment,
site and cytochrome b sequence analyses. Journal of Zoology
228, 27–39.
G, J. (1991). The Causes of Molecular Evolution. Oxford
University Press, Oxford.
*G, L. (1982). Sur la position syste!matique du petit
panda, Ailurus fulgens (Carnivora, Mammalia). GeU obiosMeUmoires SpeU cial 6, 247–258.
*G, D. J., K, P. W., M, M. G. L., G, J. R.,
B, M., W, V., F, J. H., F, C.,
L, L. M. & W, R. K. (1993). Molecular genetic and
morphological analyses of the African wild dog (Lycaon pictus).
Journal of Heredity 84, 450–459.
†G, J. L. (1986). Carnivore brain size, behavioral
ecology, and phylogeny. Journal of Mammalogy 67, 23–36.
G, J. L. (ed.) (1989). Carnivore Behavior, Ecology,
and Evolution. Cornell University Press, Ithaca, New York.
G, J. L. (1994a). Are the pandas successful specialists
or evolutionary failures? BioScience 44, 456–464.
G, J. L. (1994b). Female brain size and parental care
in carnivores. Proceedings of the National Academy of Sciences of the
United States of America 91, 5495–5497.
G, J. L. (ed.) (1996). Carnivore Behavior, Ecology, and
Evolution, vol. 2. Cornell University Press, Ithaca, New York.
G, J. L., A, C. G., K, M. & L, H.-K.
(1996). Comparative tests of evolutionary lability and rates
using molecular phylogenies. In New Uses for New Phylogenies
(ed. P. H. Harvey, A. J. Leigh Brown, J. Maynard Smith and
S. Nee), pp. 289–307. Oxford University Press, Oxford.
G, J. L. & P, A. (1998). Body size and species-
richness in carnivores and primates. Proceedings of the Royal
Society of London B 265, 113–119.
G, J. L. & V V, B. (1997). Sexual
dimorphism in the canines and skulls of carnivores : the effects
of size, phylogeny, and behavioural ecology. Journal of Zoology
242, 97–117.
*G, G. E. & M, L. D. (1978). A multivariate
comparison of some extant and fossil Felidae. Carnivore 1,
80–87.
*†G, D., G, P. R. & O’B, S. J. (1989). Molecular
genetic-distance estimates among the Ursidae as indicated by
one- and two-dimensional protein electrophoresis. Evolution
43, 282–295.
*†G, M., R-H, A. E., D, H.,
C, J. & T, R. E. (1982). Amino acid
sequence evidence on the phylogeny of primates and other
eutherians. In Macromolecular Sequences in Systematics and
Evolutionary Biology (ed. M. Goodman), pp. 115–191. Plenum
Press, New York.
*†G, D., S-Z, C., A, G. D., R,
M. S., G, D. J., G-M, J., O,
E. A. & W, R. K. (1994). Molecular genetics of the most
endangered canid: the Ethiopian wolf Canis simensis. Molecular
Ecology 3, 301–312.
G, R. L. & F, L. R. (1982). Unlikelihood that
minimal phylogenies for a realistic biological study can be
constructed in reasonable computational time. Mathematical
Biosciences 60, 133–142.
*G, A. S., S, A. A., T, D. V. &
T, Y. G. (1989). Comparative cytogenesis of
Mustelidae (Carnivora). Zoologicheskii Zhurnal 68, 96–106.
*G, A. S., V, V. T., T, D. V. &
R, S. I. (1976). G-banding of the chromosomes in
seven species of Mustelidae (Carnivora). Zoologischeskii Zhurnal
55, 1704–1709.
G, D. (1993). Molecular phylogeny and the higher
classification of eutherian mammals. Trends in Ecology and
Evolution 8, 141–147.
*G, W. K. & H, M. (1939). On the evolution
and major classification of the civets (Viverridae) and allied
fossil and recent Carnivora: a phylogenetic study of the skull
and dentition. Proceedings of the American Philosophical Society 81,
309–392.
*G, C. (1982). Cranial and dental characteristics in the
systematics of Old World Felidae. Carnivore 5, 28–39.
H, E. R. (1981). The Mammals of North America. John Wiley
& Sons, New York.
*†H, G. B., W, R., G, M. & K, E.
(1988). Biochemical variation in Mustelidae: are carnivores
genetically less variable than other mammals. Zoologischer
Anzeiger 221, 81–90.
H, P. H., L B, A. J., M S, J. &
N, S. (ed.) (1996). New Uses for New Phylogenies. Oxford
University Press, Oxford.
H, P. H. & P, M. D. (1991). The Comparative Method
in Evolutionary Biology. Oxford University Press, Oxford.
*†H, T., O, E., A, J., M, K. &
H, M. (1993). The giant panda is closer to a bear,
judged by α- and β-hemoglobin sequences. Journal of Molecular
Evolution 36, 282–289.
*H, H. (1978). The evolutionary systematics of the living
Felidae: present status and current problems. Carnivore 1,
71–79.
*H, H. (1981). Die Evolution der Pantherkatzen. Modell
zur U$ berpru$ fung der Brauchbarkeit der HENNIGschen
Prinzipien der phylogenetischen Systematik fu$ r wirbeltier-
pala$ ontologische Studien. PalaX ontologische Zeitschrift 55,
109–116.
*†H, Q. B. (1972). The evolution and dispersal of the
Monachinae (Mammalia: Pinnipedia). Annals of the South
African Museum 59, 99–113.
*H, Q. B. (1978). Late Tertiary Hyaenidae from
Langebaanweg, South Africa, and their relevance to the
phylogeny of the family. Annals of the South African Museum 76,
265–297.
*H, S. J. (1983). Systematics of the Felidae: a
quantitative analysis. M.Sc. thesis, University of Oklahoma,
Norman.
*H, S. J. (1986). Phylogenetic relationships of the
wild cats of the world. Ph.D. thesis, University of Kansas,
Lawrence.
H, D. M. & H, J. P. (1992). Signal, noise, and

169Carnivoran phylogeny
reliability in molecular phylogenetic analyses. Journal of
Heredity 83, 189–195.
*H, K. S. B. (1994). Approaches to reconstruct Japanese
sea lions (5). Phylogeny of the Otariidae. 2 : Zalophus fossils
from Japan and their phylogenetic problems. Aquabiology 16,
49–53.
†H, E. P. & A, A. M. (1992). Phylogeny, historical
biogeography, and ecology of Anophryocephalus spp.
(Eucestoda: Tetrabothriidae) among pinnipeds of the
Holarctic during the late Tertiary and Pleistocene. Canadian
Journal of Zoology 70, 703–719.
*†H, O. & B, G. (1987). The primary
structure of the hemoglobin of spectacled bear (Tremarctos
ornatus, Carnivora). Biological Chemistry Hoppe-Seyler 368,
949–954.
*H, T. J. (1988). Sexual dimorphism in North American
weasels with a phylogeny of the Mustelidae. Ph.D. thesis,
University of Kansas, Lawrence.
*†H, T., S, H., Y, T. & T, K. (1993).
Restriction site polymorphism in the ribosomal DNA of eight
species of Canidae and Mustelidae. Cytologia 58, 223–230.
*H, F. C. & P, G. (1980). The Pachycrocuta and
Hyaena lineages (Plio-Pleistocene and extant species of the
Hyaenidae). Their relationships with Miocene ictitheres :
Palhyaena and Hyaenictitherium. GeU obios 13, 579–623.
H, J. P., B, J. J. & C, C. W. (1996).
Combining data in phylogenetic analysis. Trends in Ecology and
Evolution 11, 152–158.
H, C. J., W, P. H. & V-W, R. I.
(1995). Measuring biodiversity value for conservation. Annual
Review of Ecology and Systematics 26, 93–111.
*H, R. M. J. (1974). The auditory bulla in Carnivora: an
anatomical basis for reapparaisal of carnivore evolution.
Journal of Morphology 143, 21–76.
†H, R. M. J. (1996). Biogeography of the order Carnivora.
In Carnivore Behavior, Ecology, and Evolution, vol. 2 (ed. J. L.
Gittleman), pp. 485–541. Cornell University Press, Ithaca,
New York.
*H, R. M. J. & B, L. G. (1994). Basicranial evidence
for ursid affinity of the oldest pinnipeds. In Contributions in
Marine Mammal Paleontology Honoring Frank C. Whitmore, Jr.,
vol. 29 (ed. A. Berta and T. A. Deme! re! ), pp. 57–67.
Proceedings of the San Diego Society of Natural History, San
Diego.
*†H, R. M. J. & T, R. H. (1993). Phylogenetic
relationships within the aeluroid Carnivora and implications
of their temporal and geographic distribution. In Mammalian
Phylogeny: Placentals (ed. F. S. Szalay, M. J. Novacek and
M. C. McKenna), pp. 53–73. Springer-Verlag, New York.
*†J, D. N., M, W. S., S, J. C. & O’B,
S. J. (1995). Molecular evolution of mitochondrial 12S RNA
and cytochrome b sequences in the pantherine lineage of
Felidae. Molecular Biology and Evolution 12, 690–707.
*†J, D. N., Y, N., G, D. A., J,
G. T. & O’B, S. J. (1992). Molecular phylogenetic
inference from saber-toothed cat fossils of Rancho La Brea.
Proceedings of the National Academy of Sciences of the United States
of America 89, 9769–9773.
†J, H. (1990). The history and evolution of the giant
panda. In The Secret World of Pandas (ed. B. Preiss and
G. Xueyu), pp. 8–13. Harry N. Abrams, New York.
K$ $ , M., F, J. S., K, A. G. & B, C. (1992).
Skewness and permutation. Cladistics 8, 275–287.
*†K, K. C., R, C. A. & M, G. V. (1975).
Specific antiquity of the sucking lice and evolution of otariid
seals. Rapports et ProceU s-verbaux des ReUunions Conseil International
pour l’Exploration de la Mer 169, 544–549.
†K, A. (1991). The Natural History of the Wild Cats.
Christopher Helm, London.
*K, D. G. (1967). Some aspects of social behavior in the
Canidae. American Zoologist 7, 365–372.
K, A. G. (1983). Cladistics and the classification of the
great apes. In New Interpretations of Ape and Human Ancestry (ed.
R. L. Ciochon and R. S. Corruccini), pp. 151–177. Plenum
Press, New York.
K, A. G. (1989). A concern for evidence and a phylogenetic
hypothesis of relationships among Epicrates (Boidae,
Serpentes). Systematic Zoology 38, 7–25.
K, A. G. & W, A. J. (1993). Cladistics : what’s in a
word? Cladistics 9, 183–199.
*K! , B. & Z, J. (1980). Karyosystematika celedi Felidae.
Gazella 2/3, 45–53.
*K!, J. (1976). Os penis der Gattung Panthera und das
System der Felidae (Mammalia). ZoologickeU Listy 25, 289–302.
*K!, J. (1982). Karyotyp und System der Familie
Felidae (Carnivora, Mammalia). Folio Zoologica 31, 289–304.
*L, A. (1969). Die su$ damerikanischen Canidae unter
besonderer Beru$ ckischigung des Ma$ hnenwolfes Chrysocyon
brachyurus Illiger (Morphologische, systematische, und
phylogenetische Untersuchungen). Zeitschrift fuX r Wissen-
schaftliche Zoologie 179, 1–188.
*L, A. (1975). Ecology and evolution in the South
American canids. In The Wild Canids: their Systematics,
Behavioral Ecology and Evolution (ed. M. W. Fox), pp. 192–206.
Van Nostrand Reinhold Company, New York.
L, S. M. (1993). Phylogenetic frameworks : towards a
firmer foundation for the comparative approach. Biological
Journal of the Linnean Society 49, 45–61.
L, B. & B, W. H. (1967). Multiple character
analysis of Canis lupus, latrans, and familiaris, with a discussion
of the relationships of Canis niger. American Zoologist 7, 223–232.
L, C. & A, U. (1996). Phylogenetic analyses of
complete cytochrome b genes of the order Carnivora with
particular emphasis on the Caniformia. Journal of Molecular
Evolution 42, 135–144.
L, P. C., M, P. & G, I. J. (1991). Growth,
weaning and maternal investment from a comparative
perspective. Journal of Zoology 225, 99–114.
†L, N., E, A., H, K., M, L. D.,
P, R. O., G, P. J. P. & W, R. K. (1991).
Introgression of coyote mitochondrial DNA into sympatric
North American gray wolf populations. Evolution 45, 104–119.
*L, G. M., H, R. E., C, G. K. & P, D.
(1995). Use of spectral analysis to test hypotheses on the origin
of pinnipeds. Molecular Biology and Evolution 12, 28–52.
*L, C. A. & W, A. L. (1956). Comparative serology of
carnivores. Journal of Mammalogy 37, 11–23.
*L, J. K. (1978). Pelage characteristics and systematic
relationships in the Pinnipedia. Mammalia 42, 305–313.
*L, C. A. (1981). Provisional classification and evolution of
the badgers. Proceedings of the Worldwide Furbearer Conference 1,
55–85.
L, J.-H. & A, S. (1979). Procyon lotor. Mammalian
Species 119, 1–8.
*L, T. P., O, L. V., G,
A. S., R, S. I., T, Y. G. & T,
170 Olaf R. P. Bininda-Emonds, John L. Gittleman and Andy Purvis
D. V. (1989). Phylogenetic relationships of closely related
species (Mustelidae). Interspecific variability of blot-
hybridization patterns of BamHI repeats. Genetika 25, 1089–
1094.
M, W. P. & M, D. R. (1992). MacClade: Analysis
of Phylogeny and Character Evolution. Version 3.0. Sinauer
Associates, Sunderland, Massachusetts.
M, C. R. (1990). Confidence intervals on stratigraphic
ranges. Paleobiology 16, 1–10.
*†M, L. D. (1980). Functional morphology and the
evolution of cats. Transactions of the Nebraska Academy of Sciences
8, 141–154.
M, L. D. (1989). Fossil history of the terrestrial Carnivora.
In Carnivore Behavior, Ecology, and Evolution (ed. J. L.
Gittleman), pp. 536–568. Cornell University Press, Ithaca,
New York.
*†M, R. & Y, M. C. (1994a). A molecular
phylogeny of the family Mustelidae (Mammalia, Carnivora),
based on comparison of mitochondrial cytochrome b nucleo-
tide sequences. Zoological Science 11, 605–612.
†M, R. & Y, M. C. (1994b). Nucleotide sequence
variation of cytochrome b genes in three species of weasels
Mustela itatsi, Mustela sibirica, and Mustela nivalis, detected by
improved PCR product-direct sequencing technique. Journal
of the Mammalogical Society of Japan 19, 33–43.
*M, R., Y, M. C., S, F. & B, G.
(1994). Molecular phylogenetic status of the Iriomote cat Felis
iriomotensis, inferred from mitochondrial DNA sequence
analysis. Zoological Science 11, 597–604.
M, E. (1986). Uncertainty in science: is the giant panda a
bear or a raccoon? Nature 323, 769–771.
*M, P. & R, M. (1994). On the phylogeny of
Eurasian bears. Palaeontographica Abteilung A Palaeozoologie
Stratigraphie 230, 1–38.
*MK, M. C. (1991). The alpha crystallin A chain of the
eye lens and mammalian phylogeny. Annales Zoologici Fennici
28, 349–360.
MK, M. C. & B, S. K. (1997). Classification of Mammals
Above the Species Level. Columbia University Press, New York.
ML, I. A. (1975). A speculative overview of phocid
evolution. Rapports et ProceU s-verbaux des ReUunions Conseil In-
ternational pour l’Exploration de la Mer 169, 43–48.
MN, B. K. (1995). Energy expenditure and conservation in
frugivorous and mixed-diet carnivorans. Journals of Mam-
malogy 76, 206–222.
M, M. F. (1978). Taxonomic congruence. Systematic
Zoology 27, 143–158.
M, B. D. (1994). Cladistic analysis of molecular and
morphological data. American Journal of Physical Anthropology
94, 143–156.
M, M. M. (1985). Consensus cladograms and general
classifications. Cladistics 1, 186–189.
*M, W. S. & O’B, S. J. (1988). Quantitative cladistic
analysis of chromosome banding among species in three
orders of mammals : hominoid primates, felids and arvicolid
rodents. In Chromosome Structure and Function: Impact of New
Concepts (ed. J. P. Gustafson and R. Appels), pp. 215–242.
Plenum Press, New York.
M, A. Ø. & H, S. J. (1997). Evolutionary process
from phylogenetic tree shape. Quarterly Review of Biology 72,
31–54.
*M, G. V. (1975). A phylogeny of otariid seals based
on morphology of the baculum. Rapports et ProceU s-verbaux des
ReUunions Conseil International pour l’Exploration de la Mer 169,
49–56.
*M, S., C, J. A. & S, G. F. (1995). Phylo-
genetic analysis of northern hair seals based on nucleotide
sequences of the mitochondrial cytochrome b gene. Journal of
Mammalogy 76, 1178–1185.
*N, W. G. & O’B, S. J. (1987). A comparative
chromosome banding analysis of the Ursidae and their
relationship to other carnivores. Cytogenetics and Cell Genetics 45,
206–212.
N, S., H, E. C., R, A. & H, P. H. (1995).
Inferring population history from molecular phylogenies.
Philosophical Transactions of the Royal Society of London B 344,
25–31.
N, K. C. & C, J. M. (1996). On simultaneous
analysis. Cladistics 12, 221–241.
*N, T. (1990). A morphological consideration of the
relationships of Pinnipedia to other carnivorans based on the
bony tentorium and bony falx. Marine Mammal Science 6,
54–74.
N, M. J. (1991). ‘All tree histograms’ and the evaluation
of cladistic evidence: some ambiguities. Cladistics 7, 345–349.
N, M. J. (1992a). Fossils as critical data for phylogeny.
In Extinction and Phylogeny (ed. M. J. Novacek and Q. D.
Wheeler), pp. 46–88. Columbia University Press, New York.
N, M. J. (1992b). Mammalian phylogeny: shaking the
tree. Nature 356, 121–125.
*N, R. M. (1978). Evolution and taxonomy of coyotes and
related Canis. In Coyotes: Biology, Behavior, and Management
(ed. M. Bekoff), pp. 3–16. Academic Press, New York.
*†N, R. M. (1979). North American Quaternary Canis.
Monograph of the Museum of Natural History, University of Kansas
6, 1–154.
N, R. M. (1991). Walker’s Mammals of the World. Fifth
edition. The Johns Hopkins University Press, Baltimore.
*†O’B, S. J., C, G. E., B, R. E., N,
W. G., N, A. K., S, J. M., E,
M. A., S, U. S., J, D., B, M. & W, D. E.
(1987). Setting the molecular clock in Felidae: the great cats,
Panthera. In Tigers of the World: Biology, Biopolitics, Management
and Conservation of an Endangered Species (ed. R. L. Tilson and
U. S. Seal), pp. 10–27. Noyes Publications, Parkridge, New
Jersey.
*†O’B, S. J., M, J. S., E, M. A.,
T, E. T. & W, F. (1989). Genetic variation and
molecular systematics of the black-footed ferret. In Conservation
Biology and the Black-Footed Ferret (ed. U. S. Seal, E. T. Thorne,
M. A. Bogan and S. H. Anderson), pp. 21–33. Yale Uni-
versity Press, New Haven, Connecticut.
O’B, S. J., M, J. S., M, S.,
J, D., P-S, J., J, W., G,
D. A., R, M., P, C., B, M. & W, D. E.
(1996). Conservation genetics of the Felidae. In Case Histories
from Nature (ed. J. C. Avise and J. L. Hamrick), pp. 50–74.
Chapman and Hall, New York.
*†O’B, S. J., N, W. G., W, D. E., B, M. E. &
B, R. E. (1985). A molecular solution to the riddle
of the giant panda’s phylogeny. Nature 317, 140–144.
*O, Y. (1991). Karyosystematics of the mustelid carnivores
of Japan. Honyurui Kagaku 30, 197–220.
171Carnivoran phylogeny
O, S. L. & P, G. K. (1982). Introduction to the
paleontology of Bahaman vertebrates. In Fossil Vertebrates from
the Bahamas, vol. 48 (ed. S. L. Olson), pp. 1–7. Smithsonian
Contributions to Paleobiology, Washington.
O, A. & C, T. M. (1996). The adaptive significance
of color patterns in carnivores : phylogenetic tests of classic
hypotheses. In Carnivore Behavior, Ecology, and Evolution, vol. 2
(ed. J. L. Gittleman), pp. 132–188. Cornell University Press,
Ithaca, New York.
*†P S, J., J, W. E., G, D. &
O’B, S. J. (1994). Phylogenetic reconstruction of South
American felids defined by protein electrophoresis. Journal of
Molecular Evolution 39, 296–305.
*†P S, J. & O’B, S. J. (1995). Molecular
phylogeny of the red panda (Ailurus fulgens). Journal of Heredity
86, 413–422.
P, D. & H, M. D. (1986). Estimating the reliability of
evolutionary trees. Molecular Biology and Evolution 3, 403–417.
*†P, E. A., C, S. M., B, S. E. & D,
W. S. (1995). A phylogenetic perspective on the evolution of
reproductive behavior in pagophilic seals of the northwest
Atlantic as indicated by mitochondrial DNA sequences.
Journal of Mammalogy 76, 22–31.
P, G. (1982). A note on the vocal behaviour of the giant
panda, Ailuropoda melanoleuca (David, 1869). Zeitschrift fuX rSaX ugetierkunde 47, 236–246.
*P, G. (1987). Acoustic communication in the genus Lynx
(Mammalia: Felidae) – comparative survey and phylogenetic
interpretation. Bonner zoologische BeitraX ge 38, 315–330.
*P, G. (1971). Origine, phylogenie et syste!matique des
blaireaux. Mammalia 35, 567–597.
*P, G. (1974). Rapports phyle! tiques des Viverride! s(Carnivores Fissipe' des). Les formes de Madagascar. Mammalia
38, 605–636.
*P, M. K. & H, V. G. (1992). Comments on red
wolf taxonomy. Conservation Biology 6, 596–599.
P-N, I. & P-N, I. (1965).
Gefangenschaftsbeobachtungen an Makiba$ ren (Bassaricyon
Allen, 1876). Zeitschrift fuX r SaX ugetierkunde 30, 321–366.
P, A. (1995a). A composite estimate of primate phylogeny.
Philosophical Transactions of the Royal Society of London B 348,
405–421.
P, A. (1995b). A modification to Baum and Ragan’s
method for combining phylogenetic trees. Systematic Biology 44,
251–255.
P, A. (1996). Using interspecies phylogenies to test
macroevolutionary hypotheses. In New Uses for New Phylogenies
(ed. P. H. Harvey, A. J. Leigh Brown, J. Maynard Smith and
S. Nee), pp. 153–168. Oxford University Press, Oxford.
P, A., G, J. L. & L, H.-K. (1994). Truth or
consequences : effects of phylogenetic accuracy on two
comparative methods. Journal of Theoretical Biology 167,
293–300.
P, A., N, S. & H, P. H. (1995). Macro-
evolutionary inferences from primate phylogeny. Proceedings of
the Royal Society of London B 260, 329–333.
*Q, Z.-X. (1987). Die Hyaeniden aus dem Ruscinium und
Villafranchium Chinas. MuX nchner Geowissenschaftliche Abhand-
lungen Reihe A Geologie und PalaX notologie 9, 1–110.
*†R, L. (1975). Viverrid neuroanatomy: phylogenetic
and behavioral implications. Journal of Mammalogy 56,
130–150.
†R, L. B. (1982). Evolution of skull shape in carnivores.
3. The origin and early radiation of the modern carnivore
families. Paleobiology 8, 177–195.
R, M. A. (1992). Phylogenetic inference based on matrix
representation of trees. Molecular Phylogenetics and Evolution 1,
53–58.
R, A., H, P. H. & N, S. (1997). End-Epi : an
application for inferring phylogenetic and population dy-
namical processes from molecular sequences. Computer Appli-
cations in the Biosciences 13, 303–306.
†R, E. & R, B. (1991). Genetic variability and
biochemical systematics of domestic and wild cat populations
(Felis silvestris : Felidae). Journal of Mammalogy 72, 79–88.
R, C. E. (1976). Geography of phocid evolution. Systematic
Zoology 25, 391–406.
†R, C. A., R, C. E. & G, D. (1979).
Pinniped biogeography. In Historical Biogeography, Plate Tec-
tonics, and the Changing Environment (ed. J. Gray and A. J.
Boucot). Oregon State University Press, Corvallis, Oregon.
R, C. A. & T, R. H. (1977). Otarioid seals of
the Neogene: classification, historical zoogeography, and
temporal correlation of the sea lions and walruses from the
North Pacific region. U.S. Geological Survey Professional Paper
992, 1–93.
*R, R. (1979). Cytogenetics of the Felidae. Carnivore 2,
63–68.
*R, K., B, G. & G$ , R. (1988).
Carnivora: primary structure of the hemoglobins from Ratel
(Mellivora capensis). Biological Chemistry Hoppe-Seyler 369, 1137–
1142.
R, A. G., K-B, M., B, P. R. &
B, P. L. (1993). A randomisation test of the null
hypothesis that two cladograms are sample estimates of a
parametric phylogenetic tree. New Zealand Journal of Botany
31, 257–268.
R, F. (1996). Matrix representation of trees, redun-
dancy, and weighting. Systematic Biology 45, 247–253.
*R, M. S., G, E., S, D., O, E. A. &
W, R. K. (1994). Patterns of differentiation and
hybridization in North American wolflike canids, revealed by
analysis of microsatellite data. Molecular Biology and Evolution
11, 553–570.
*R, A. P., B, H. N., P, G. L. & L, R.
(1995). Scaling relationships within the maxillary tooth row
of the Felidae, and the absence of the second upper premolar
in Lynx. Journal of Zoology 236, 161–182.
*S, L. O. (1992). Felid phylogenetics : extant taxa and
skull morphology (Felidae, Aeluroidae). American Museum
Novitates 3047, 1–67.
S, M. J., D, M. J., P, W. & E, T.
(1994). TreeBASE: a prototype database of phylogenetic
analyses and an interactive tool for browsing the phylogeny of
life. American Journal of Botany 81, 183.
S, M. J., P, A. & H, C. (1998). Phylogenetic
supertrees : assembling the trees of life. Trends in Ecology and
Evolution 13, 105–109.
*†S, V. M. (1969a). Pinniped origins and the rate of
evolution of carnivore albumins. Systematic Zoology 18, 286–
295.
*†S, V. M. (1969b). Pinniped phylogeny. Systematic
Zoology 18, 416–422.
S, V. M. (1975). Pinniped systematics : immunological
172 Olaf R. P. Bininda-Emonds, John L. Gittleman and Andy Purvis
comparisons of their albumins and transferrins. American
Zoologist 15, 826.
*†S, V. M. (1976). Transferrin. Transactions of the Zo-
ological Society of London 33, 165–171.
†S, D. E. & R, D. E. (1983). Mammalian Paleofaunas
of the World. Addison-Wesley, London.
*S-K, V. (1981). Zur Stammesgeschichte der
marderverwandten Raubtiergruppen (Musteloidea, Carni-
vora). Eclogae Geologicae Helvetiae 74, 753–801.
*S, A., P, W. & T, H. (1993). On the
taxonomy of Amur cat (Felis bengalensis euptilura). Zeitschrift fuX rSaX ugetierkunde 58, 13–17.
*†S, U. S., P, N. I. & E, A. W. (1970).
Carnivora systematics : immunological relationships of bear
serum albumin. Comparative Biochemistry and Physiology 32,
33–48.
*†S, G. F. & K, T. D. (1991). Phylogenetic
relationships of North American ursids based on analysis of
mitochondrial DNA. Evolution 45, 218–221.
*†S, V. (1982). Electrophoretic variation in large
mammals. II. The red fox, Vulpes vulpes, the stoat, Mustela
erminea, the weasel, Mustela nivalis, the pole cat, Mustela
putorius, the pine marten, Martes martes, the beech marten,
Martes foina, and the badger, Meles meles. Hereditas 96, 299–305.
S, G. G. (1945). The principles of classification and a
classification of mammals. Bulletin of the American Museum of
Natural History 85, 1–350.
*†S, R. W., M, C. & H, A. (1994). Multiple
nuclear-gene phylogenies : application to pinnipeds and
comparison with a mitochondrial DNA gene phylogeny.
Molecular Biology and Evolution 11, 341–356.
S, V. E., R, V. V. & A, P. T. (1997). New
species of viverrids of the genus Viverra (Mammalia, Car-
nivora) from Vietnam. Zoologischeskii Zhurnal 76, 585–589.
*S, H. (1976). Calcanea of members of the Mustelidae.
Part I. Mustelinae. Bulletin of the Southern California Academy of
Science 75, 237–248.
*S, H. J. (1975). Distribution and taxonomy of the
Canidae. In The Wild Canids: their Systematics, Behavioral
Ecology and Evolution (ed. M. W. Fox), pp. 3–26. Van Nostrand
Reinhold Company, New York.
*S, H. J. (1983). Calcanea of members of the Viverridae.
Bulletin of the Southern California Academy of Sciences 82, 17–38.
S, F. G. & W, S. D. (1985). The Great American Biotic
Interchange. Plenum Press, New York.
*S, I. & W, R. M. (1971). Implications of a
comparison of the airborne vocalizations and some aspects of
the behaviour of the two Australian fur seals, Arctocephalus
spp., on the evolution and present taxonomy of the genus.
Australian Journal of Zoology 19, 227–241.
S, D. L. (1991). When are phylogeny estimates from
molecular and morphological data incongruent? In Phylo-
genetic Analysis of DNA Sequences (ed. M. M. Miyamoto and
J. Cracraft), pp. 295–333. Oxford University Press, Oxford.
S, D. L. (1993). PAUP: Phylogenetic Analysis Using
Parsimony, Version 3.1.1. Computer program distributed by the
Illinois Natural History Survey, Champaign, Illinois.
*T, P. & B, J. (1992). Ge!ne! tique de l’Ours brun
des Pyre!ne! es (Ursus arctos) : premiers re! sultats. Comptes Rendus
de l’AcadeUmie des Sciences SeU rie III Sciences de la Vie 314, 15–21.
*T, D. A., M, M. M., G, M., H,
O., B, G., G$ , R. & J, H. (1986).
Hemoglobin of pandas : phylogenetic relationships of carni-
vores as ascertained with protein sequence data. Natur-
wissenschaften 73, 512–514.
T, S. L. & S, G. F. (1996). Phylogeography of
brown bears (Ursus arctos) of Alaska and paraphyly within the
Ursidae. Molecular Phylogenetics and Evolution 5, 477–494.
*T, M. E. (1988). Foot structure and phylogeny in the
Viverridae (Carnivora). Journal of Zoology 216, 131–139.
*†T, P. J., C, G. K., M, J. A. J. & V
D, D. (1991). A study of allozyme evolution in African
mongooses (Viverridae: Herpestinae). Zeitschrift fuX r SaX uge-tierkunde 56, 135–145.
*T, R. H. (1976). Relationships of pinnipeds to other
carnivores (Mammalia). Systematic Zoology 25, 363–374.
*T, R. H., T, B. E. & W, X. (1995). Phy-
logeny of the Caninae (Carnivora: Canidae) : the living taxa.
American Museum Novitates 3146, 1–37.
*†T, E. (1976). Zur stammegeschichtlichen herkunft von
Tremarctos (Ursidae, Mammalia). Zeitschrift fuX r SaX ugetierkunde41, 109–114.
*†T, E. (1979). Zur systematischen und phylogenetischen
Stellung des Bambusba$ ren: Ailuropoda melanoleuca David
(Carnivora, Mammalia). Zeitschrift fuX r SaX ugetierkunde 44,
286–305.
*T, N. B. (1970). Karyotypic fissioning and canid phy-
logeny. Journal of Theoretical Biology 26, 445–480.
*T, E. & F, H. (1994). A fossil bear from
northeastern Brazil, with a phylogenetic analysis of the South
American extinct Tremarctinae (Ursidae). Journal of Vertebrate
Paleontology 14, 552–561.
*T, F. & M, P. (1981). First observations on
colony structure, behavior, and vocal repertoire of the South
American fur seal (Arctocephalus australis Zimmermann, 1783)
in Peru. Zeitschrift fuX r SaX ugetierkunde 46, 310–322.
*T, R. & MD, V. R. (1984). A description of the
baculum of the bobcat (Felis rufus), with comments on its
development and taxonomic implications. Canadian Journal of
Zoology 62, 1172–1176.
*V G, R. G. (1978). A review of canid classification.
American Museum Novitates 2646, 1–10.
* Z J, C. G. (1987). A phylogenetic study of the
Lutrinae (Carnivora; Mustelidae) using morphological data.
Canadian Journal of Zoology 65, 2536–2544.
V! , D. P. & G, J. L. (1998). Biodiversity
conservation: does phylogeny matter? Current Biology 8,
R379–R381.
*†V, G. & C, F. M. (1993). Phylogenetic
relationships of the endemic Malagasy carnivore Cryptoprocta
ferox (Aeluroideae) : DNA}DNA hybridization experiments.
Journal of Mammalian Evolution 1, 169–185.
*V, P. B., M, M. C., P, J. R. &
W, W. C. (1994). Higher level relationships of the
arctoid Carnivora based on sequence data and ‘total evi-
dence’. Molecular Phylogenetics and Evolution 3, 47–58.
W, X. (1994). Phylogenetic systematics of the Hespero-
cyoninae (Carnivora: Canidae). Bulletin of the American Museum
of Natural History 221, 1–207.
*†W, R. K., B, R. E., J, D. N. &
O’B, S. J. (1989a). Molecular and biochemical evolution
of the Carnivora. In Carnivore Behavior, Ecology, and Evolution
(ed. J. L. Gittleman), pp. 465–494. Cornell University Press,
Ithaca, New York.

173Carnivoran phylogeny
*W, R. K. & J, S. M. (1991). Mitochondrial DNA
analysis implying extensive hybridization of the endangered
red wolf Canis rufus. Nature 351, 565–568.
*W, R. K., M, A., L, N., V V,
B., K, P. W., F, T. K., G, D. J. & O’B,
S. J. (1990). Large sequence divergence among mitochondrial
DNA genotypes within populations of eastern African black-
backed jackals. Proceedings of the National Academy of Sciences of
the United States of America 87, 1772–1776.
*†W, R. K., N, W. G. & O’B, S. J. (1987a).
Chromosomal evolution of the Canidae: I. Species with high
diploid numbers. Cytogenetics and Cell Genetics 44, 123–133.
*†W, R. K., N, W. G. & O’B, S. J. (1987b).
Chromosomal evolution of the Canidae: II. Divergence from
the primitive carnivoran karyotype. Cytogenetics and Cell Genetics
44, 134–141.
*†W, R. K. & O’B, S. J. (1987). Allozyme divergence
within the Canidae. Systematic Zoology 36, 339–355.
†W, R. K., V V, B., K, P. W., F,
T. K., J, W. E. & O’B, S. J. (1989b). Genetic and
morphological divergence among sympatric canids. Journal of
Heredity 80, 447–454.
†W, R. K., V V, B. & O’B, S. J.
(1991). Molecular distance and divergence time in carnivores
and primates. Molecular Biology and Evolution 8, 297–319.
*†W, L. (1981). The evolution of lynxes. Annales
Zoologici Fennici 18, 37–71.
*W, L. (1983). Morphological patterns in the skulls of
cats. Biological Journal of the Linnean Society 19, 375–391.
*W, L. (1996). Carnivoran ecomorphology: a phylo-
genetic perspective. In Carnivore Behavior, Ecology, and Evolution,
vol. 2 (ed. J. L. Gittleman), pp. 582–624. Cornell University
Press, Ithaca, New York.
*†W, L. & S, N. (1991). The Hyaenidae:
taxonomy, systematics and evolution. Fossils and Strata 30,
1–104.
W, W. C. (1992). Extinction, sampling, and molecular
phylogenetics. In Extinction and Phylogeny (ed. M. J. Novacek
and Q. D. Wheeler), pp. 205–215. Columbia University Press,
New York.
W, B. N. (1986). The isthmian link, antitropicality and
American biogeography: distributional history of the
Atherinopsinae (Pisces : Atherinidae). Systematic Zoology 35,
176–194.
W, Ø. (1985). Relationship of Nandinia binotata (Gray) to
the superfamily Feloidea (Mammalia, Carnivora). Zoologica
Scripta 14, 155–159.
W, M. (1995). Coping with abundant missing entries in
phylogenetic inference using parsimony. Systematic Biology 44,
501–514.
*W, M. (1993). Phylogeny and classification of early
European Mustelida (Mammalia: Carnivora). Acta Therio-
logica 38, 345–384.
W, R. & G, J. R. (1998). Edge effects and the
extinction of populations inside protected areas. Science 280,
2126–2128.
*W, W. C. (1984). A phylogenetic reappraisal of the
Viverridae and its relationship to other Carnivora. Ph.D.
thesis, University of Kansas, Lawrence.
*W, W. C. (1989). The phylogeny of the Recent
Carnivora. In Carnivore Behavior, Ecology, and Evolution (ed.
J. L. Gittleman), pp. 495–535. Cornell University Press,
Ithaca, New York.
*W, W. C. (1993). Order Carnivora. In Mammal
Species of the World: a Taxonomic and Geographic Reference (ed.
D. E. Wilson and D. A. Reeder), pp. 279–348. Smithsonian
Institution Press, Washington.
*W, D. H. (1969). Cytogenetic and phylogenetic studies
in Carnivora. In Comparative Mammalian Cytogenetics (ed.
K. Benirschke), pp. 310–329. Springer-Verlag, New York.
*W-H, D. H. & C, W. R. (1982). The
interrelationships of chromosome banding patterns in canids,
mustelids, hyena, and felids. Cytogenetics and Cell Genetics 34,
178–192.
*W, A. R. (1987). The walrus auditory region and the
monophyly of pinnipeds. American Museum Novitates 2871,
1–31.
*W, A. R. (1988). On ‘retrogression’ in the evolution of the
Phocinae and phylogenetic affinities of the monk seals.
American Museum Novitates 2924, 1–38.
*W, A. R. & F, J. J. (1993). A phylogenetic analysis
and definition of the Carnivora. In Mammalian Phylogeny:
Placentals (ed. F. S. Szalay, M. J. Novacek and M. C.
McKenna), pp. 32–52. Springer-Verlag, New York.
*Y, P. M. (1982). Distribution and systematics of the
European mink Mustela lutreola Linnaeus 1761. Acta Zoologica
Fennica 166, 1–48.
*†Z, Y.-P. & R, O. A. (1993). Mitochondrial DNA
sequence evolution in the Arctoidea. Proceedings of the National
Academy of Sciences of the United States of America 90, 9557–9561.
*†Z, Y.-P. & R, O. A. (1994). Phylogenetic relation-
ships of bears (the Ursidae) inferred from mitochondrial DNA
sequences. Molecular Phylogenetics and Evolution 3, 351–359.
*Z, Y.-P. & S, L.-M. (1991). Riddle of the giant panda.
Nature 352, 573.
VIII. APPENDIX
The following references were used as source trees and}orto provide date estimates for the composite phylogeny.References are divided according to the various matricesthey contributed to and so may appear more than once.The matrices and composite trees have been deposited onTreeBASE (see Sanderson et al., 1994; study accessionnumber 5355; matrix accession numbers M472–484;http:}}www.herbaria.harvard.edu}treebase}) and arealso available from O.R.P.B.-E. on request.
Higher groups (excluding Hyaenidae) (Fig. 1, Table 2)
Source trees : Gregory & Hellman, 1939; Leone & Wiens,1956; Wurster, 1969; Hunt, 1974; Sarich, 1975;Tedford, 1976; Arnason, 1977; Bugge, 1978; Hendey,1978; Ling, 1978; Schmidt-Kittler, 1981; Dutrillaux,Couturier & Chauvier, 1982; Flynn & Galiano, 1982;Ginsburg, 1982; Wozencraft, 1984, 1989; Couturier &Dutrillaux, 1985; de Jong, 1986; Braunitzer &Hofmann, 1987; Wyss, 1987; Flynn et al., 1988;Holmes, 1988; Rodewald, Braunitzer & Go$ ltenboth,1988; Ahmed, Jahan & Braunitzer, 1990; Czelusniak et
al., 1990, 1991; Nojima, 1990; McKenna, 1991;
174 Olaf R. P. Bininda-Emonds, John L. Gittleman and Andy Purvis
Arnason & Ledje, 1993; Wolsan, 1993; Wyss & Flynn,1993; Berta & Wyss, 1994; Hunt & Barnes, 1994;Vrana et al., 1994; Lento et al., 1995; Austin, 1996;Bininda-Emonds & Russell, 1996; Werdelin, 1996
Date estimates : Repenning, Ray & Grigorescu, 1979;Martin, 1980; Radinsky, 1982; Savage & Russell,1983; Barnes, Domning & Ray, 1985; Gittleman,1986; Anderson, 1989; Jinchu, 1990; Wayne et al.,1991; Werdelin & Solounias, 1991; Janczewski et al.,1995; Hunt, 1996
Both : Sarich, 1969a, b, 1976; Seal et al., 1970; Radinsky,1975; Thenius, 1979; Goodman et al., 1982; O’Brien et
al., 1985; Goldman et al., 1989; Wayne et al., 1989a ;Janczewski et al., 1992; Garland et al., 1993; Hashimotoet al., 1993; Hunt & Tedford, 1993; Veron & Catzeflis,1993; Masuda & Yoshida, 1994a ; Slade, Moritz &Heideman, 1994; Arnason et al., 1995; Pecon Slattery& O’Brien, 1995
Mustelidae (excluding Lutrinae and Mephitinae) (Fig.2, Table 3)
Source trees : Petter, 1971; Graphodatsky et al., 1976, 1989;Stains, 1976; Long, 1981; Schmidt-Kittler, 1981; deMuizon, 1982a ; Youngman, 1982; Belyaev et al., 1984;Wozencraft, 1984, 1989, 1993; Couturier & Dutrillaux,1985; Arnason & Widegren, 1986; Holmes, 1988;Lushnikova et al., 1989; Obara, 1991; Vrana et al., 1994
Date estimates : Sarich, 1976; Savage & Russell, 1983;Anderson et al., 1986; Wayne et al., 1991; Garland et al.,1993; Masuda & Yoshida, 1994b ; Hunt, 1996
Both : Anderson, 1970, 1989; Simonsen, 1982; Hartl et al.,1988; O’Brien et al., 1989; Wayne et al., 1989a ; Bryant,Russell & Fitch, 1993; Hashimoto et al., 1993; Hosodaet al., 1993; Masuda & Yoshida, 1994a
Lutrinae (Fig. 3, Table 4)
Source trees : Davis, 1978; de Muizon, 1982a ; van Zyll deJong, 1987; Holmes, 1988; Bryant et al., 1993;Wozencraft, 1993
Date estimates : Savage & Russell, 1983; Wayne et al., 1991;Masuda & Yoshida, 1994a
Mephitinae (Fig. 4, Table 5)
Source trees : Holmes, 1988; Bryant et al., 1993; Wozencraft,1993
Date estimates : Savage & Russell, 1983; O’Brien et al.,1989; Wayne et al., 1989a, 1991
Both : Dragoo et al., 1993
Procyonidae (Fig. 5, Table 6)
Source trees : Couturier & Dutrillaux, 1985; Decker &Wozencraft, 1991; Wozencraft, 1993
Date estimates : Sarich, 1976; Savage & Russell, 1983;
Wayne et al., 1989a ; Garland et al., 1993; Hunt, 1996Both : Baskin, 1982; Zhang & Ryder, 1993; Pecon Slattery
& O’Brien, 1995
Otariidae (Fig. 6, Table 7)
Source trees : Sarich, 1969b, 1975; Stirling & Warneke,1971; Morejohn, 1975; Ling, 1978; Trillmich &Majluf, 1981; Berta & Deme! re! , 1986; Beentjes, 1990;Wozencraft, 1993; Berta & Wyss, 1994; Hirota, 1994;Lento et al., 1995
Date estimates : Repenning et al., 1979; Bogdanov &Pastukhov, 1982; Savage & Russell, 1983; Hoberg &Adams, 1992
Both : Kim, Repenning & Morejohn, 1975; Sarich, 1976;Barnes et al., 1985; Arnason et al., 1995
Phocidae (Fig. 7, Table 8)
Source trees : Chapskii, 1955; Burns & Fay, 1970; Anbinder,1971; Sarich, 1975; Ling, 1978; de Muizon, 1982b ;Couturier & Dutrillaux, 1985; Wyss, 1988; Nojima,1990; Wozencraft, 1993; Berta & Wyss, 1994; Lento et
al., 1995; Mouchaty et al., 1995; Bininda-Emonds &Russell, 1996
Date estimates : Repenning et al., 1979; Savage & Russell,1983; Hoberg & Adams, 1992; Arnason et al., 1993
Both : Sarich, 1969b, 1976; Hendey, 1972; Bogdanov &Pastukhov, 1982; Slade et al., 1994; Arnason et al.,1995; Perry et al., 1995
Ursidae (Fig. 8, Table 9)
Source trees : Wurster, 1969; Seal et al., 1970; Nash &O’Brien, 1987; Czelusniak et al., 1990, 1991; Zhang &Shi, 1991; Taberlet & Bouvet, 1992; Wozencraft, 1993;Mazza & Rustioni, 1994; Trajano & Ferrarezzi, 1994;Vrana et al., 1994
Date estimates : Sarich, 1976; Savage & Russell, 1983;Jinchu, 1990; Wayne et al., 1991; Janczewski et al.,1992, 1995; Zhang & Ryder, 1993; Hunt, 1996
Both : Thenius, 1976, 1979; Ficcarelli, 1979; O’Brien et al.,1985; Hofmann & Braunitzer, 1987; Goldman et al.,1989; Wayne et al., 1989a ; Cronin et al., 1991; Shields& Kocher, 1991; Garland et al., 1993; Hashimoto et al.,1993; Zhang & Ryder, 1994; Arnason et al., 1995;Pecon Slattery & O’Brien, 1995
Canidae (Fig. 9, Table 10)
Source trees : Kleiman, 1967; Langguth, 1969, 1975; Todd,1970; Atkins & Dillon, 1971; Fox, 1971; Chiarelli,1975; Stains, 1975; Clutton-Brock, Corbet & Hills,1976; Darbre & Lehmann, 1976; Atkins, 1978; Nowak,1978; Van Gelder, 1978; Tagle et al., 1986; Braunitzer& Hofmann, 1987; Czelusniak et al., 1990; Wayne et al.,1990; Wayne & Jenks, 1991; Phillips & Henry, 1992;
175Carnivoran phylogeny
Girman et al., 1993; Wozencraft, 1993; Roy et al., 1994;Vrana et al., 1994; Tedford et al., 1995
Date estimates : Savage & Russell, 1983; Wayne et al.,1989b, 1991; Lehman et al., 1991; Janczewski et al.,1992; Hunt, 1996
Both : Nowak, 1979; Berta, 1987; Wayne, Nash & O’Brien,1987 a, b ; Wayne & O’Brien, 1987; Wayne et al.,1989a ; Geffen et al., 1992, 1996; Garland et al., 1993;Hosoda et al., 1993; Gottelli et al., 1994
Hyaenidae (Fig. 1, Table 2)
Source trees : Gregory & Hellman, 1939; Galiano & Frailey,1977; Howell & Petter, 1980; Qui, 1987; Wozencraft,1993
Date estimates : Savage & Russell, 1983; Wayne et al.,1989a, 1991; Garland et al., 1993; Veron & Catzeflis,1993
Both : Werdelin & Solounias, 1991
Felidae (Fig. 10, Table 11)
Source trees : Kratochvı!l, 1976, 1982; Glass & Martin,1978; Hemmer, 1978, 1981; Robinson, 1979; Kra! l &Zima, 1980; Grove, 1982; Wurster-Hill & Centerwall,1982; Herrington, 1983, 1986; Werdelin, 1983;Tumlison & McDaniel, 1984; Couturier & Dutrillaux,1985; Tagle et al., 1986; Peters, 1987; Modi & O’Brien,1988; Czelusniak et al., 1990; Ahmed, Jahan &Braunitzer, 1992; Salles, 1992; Schreiber, Puschmann
& Tichy, 1993; Wozencraft, 1993; Masuda et al., 1994;Vrana et al., 1994; Russell et al., 1995; Decker, 1996
Date estimates : Savage & Russell, 1983; Centerwall,Wurster-Hill & Benveniste, 1985; Kitchener, 1991;Randi & Ragni, 1991; Wayne et al., 1991; Arnason et
al., 1995; Hunt, 1996Both : Martin, 1980; Werdelin, 1981; Benveniste, 1985;
Collier & O’Brien, 1985; O’Brien et al., 1987; Essop,Emmanuel & Harley, 1988; Wayne et al., 1989a ;Janczewski et al., 1992, 1995; Garland et al., 1993;Veron & Catzeflis, 1993; Pecon Slattery et al., 1994
Herpestidae (Fig. 11, Table 12)
Source trees : Gregory & Hellman, 1939; Fredga, 1972;Petter, 1974; Stains, 1983; Couturier & Dutrillaux,1985; Taylor, 1988; Wozencraft, 1993; Austin, 1996
Date estimates : Savage & Russell, 1983; Wayne et al., 1991;Veron & Catzeflis, 1993
Both : Taylor et al., 1991
Viverridae (Fig. 12, Table 13)
Source trees : Gregory & Hellman, 1939; Petter, 1974;Crawford-Cabral, 1982; Stains, 1983; Wozencraft,1984, 1993; Couturier & Dutrillaux, 1985; Taylor,1988
Date estimates : Savage & Russell, 1983; Wayne et al.,1989a ; Hunt, 1996
Both : Veron & Catzeflis, 1993