Building Basic and Advanced Model Scenarios in WetBud
64
Building Basic and Advanced Model Scenarios in WetBud Kerby Dobbs
Transcript of Building Basic and Advanced Model Scenarios in WetBud

Building Basic and Advanced Model
Scenarios in WetBud
Kerby Dobbs

1. Intro2. Building weather station data set3. Basic Scenarios4. Advanced Scenarios
Overview
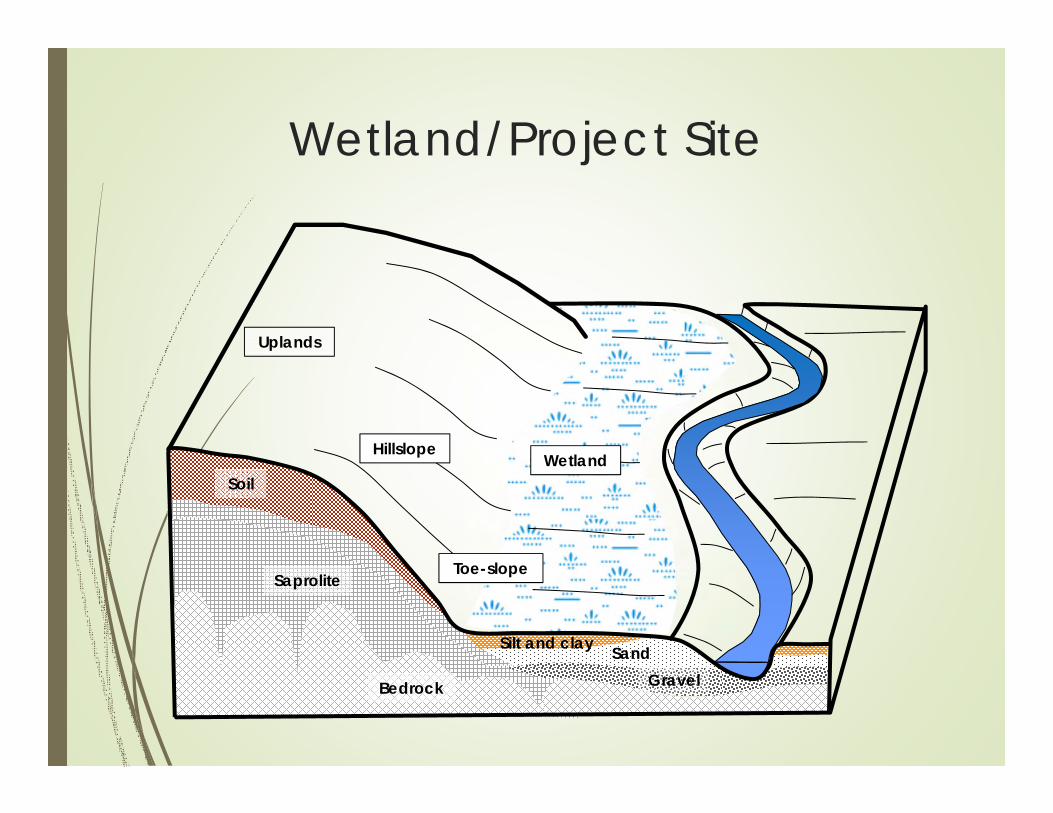
Wetland/Project Site
Soil
Saprolite
Bedrock
Silt and clay SandGravel
Uplands
Hillslope
Toe-slope
Wetland

Wetland/Project Site
Stream in
SW in
GW in
GW out
SW out
Precip in ET out

WetBud Basic Model – Mass Balance
Stream in
SWin
GWin
GWout
Soil Perm.
SWout
Precip in ETout

Stream
GWinGWout
PptSWin
E T
WetBud Advanced Model –Finite-difference Grid

WetBud – Advanced Version
Outlet
Stream channel
Compacted subsoil/bermStream gravel
Vegetation Loose surface soil w/ added OM
Saprolite rotted bedrock
Setup for a Piedmont
valley bottom mitigation site
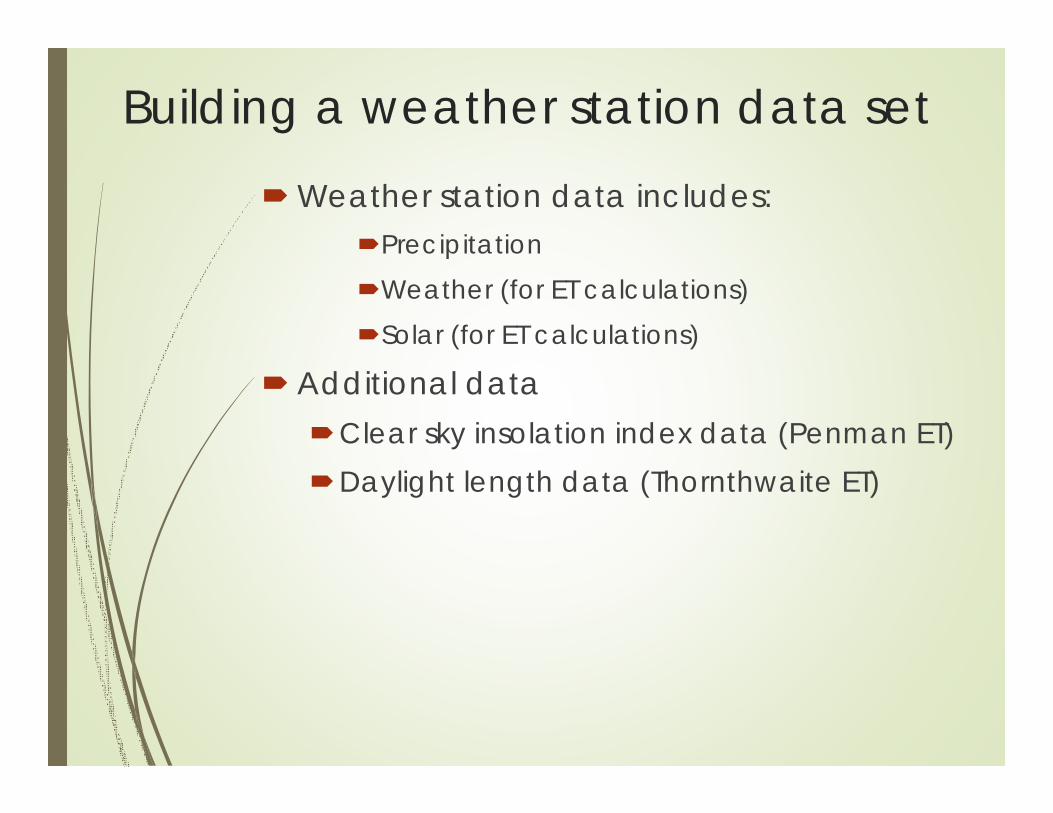
Building a weather station data set
Weather station data includes:PrecipitationWeather (for ET calculations)Solar (for ET calculations)
Additional dataClear sky insolation index data (Penman ET)Daylight length data (Thornthwaite ET)

Building a weather station data set
Locate nearest weather station - http://www.ncdc.noaa.gov/cdo-web/

Building a weather station data set Create weather station record

Precipitation data Download and import from web or manually import data:
If your station does not have complete data set:
- Create record for next nearest station
- Download data for that station
- Copy data to your station record

Weather data Used in ET calculations
If your station does not have complete data set:
- Create record for next nearest station
- Download data for that station
- Copy data to your station record

Solar data Used in ET calculations
If your station does not have solar data:
- Create record for nearest station that does have solar data
- Download solar data for that station
- Copy solar data to your station record

Building a weather station data setIMPORTANT: QAQC of climatological data is WetBuduser’s responsibility. Make sure to review the data before including in water budget analysis.

Additional data for ET calculationsIn addition to weather and solar data:Clear sky insolation index (Penman ET)Daylight length (Thornthwaite ET)

Building a weather station data set Parameters for ET
Clear sky insolation index (Penman ET)

Building a weather station data set Parameters for ET
Daylight length (Thornthwaite ET)

Additional inputs and outputs
Water budget inputs:
Groundwater in (quantified by user/manual import or calculated by Wem)
Surface runoff (calculated by WetBud)
Channelized flow (manual import)
Stream overbank (quantified by user/manual import or calculated by WetBud)
Water budget outputs:
Groundwater out (quantified by user/manual import)
Surface flow (leaves site by overtopping ‘weir’ height assigned by user)
Channelized flow (quantified by user/manual import)
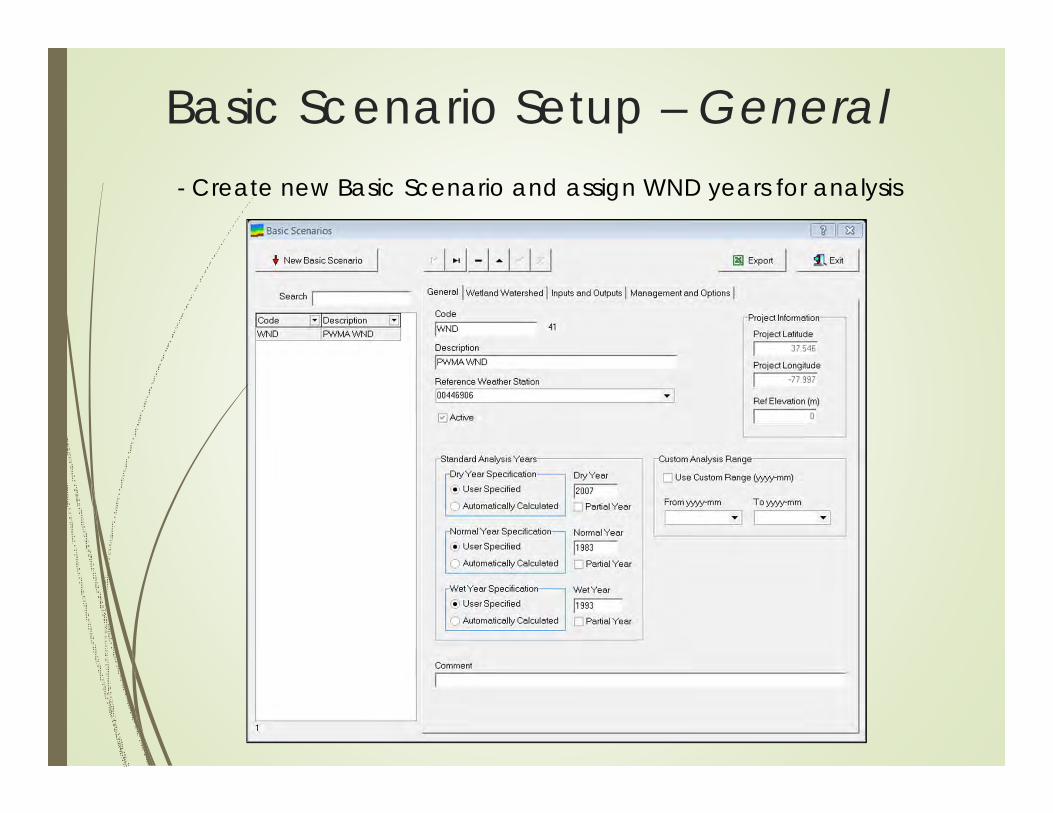
Basic Scenario Setup – General- Create new Basic Scenario and assign WND years for analysis

Basic Scenario Setup – Wetland and Watershed
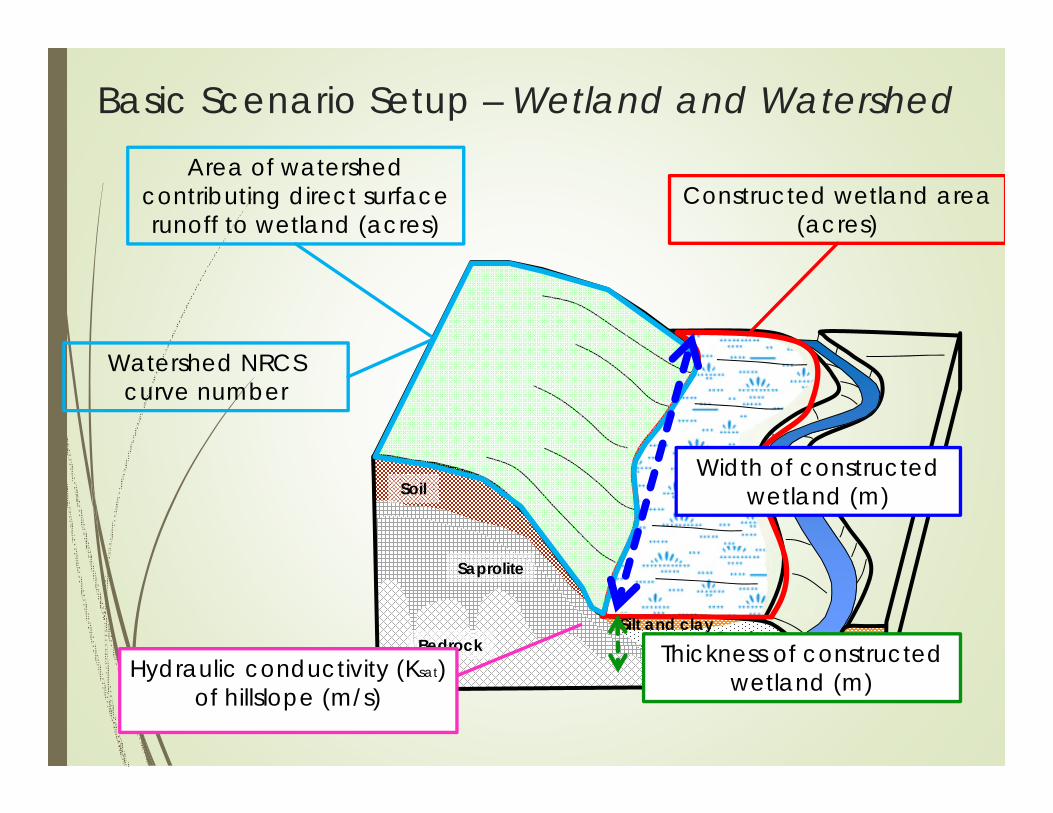
Basic Scenario Setup – Wetland and Watershed
Constructed wetland area (acres)
Area of watershed contributing direct surface runoff to wetland (acres)
Watershed NRCS curve number
Width of constructed wetland (m)Soil
Saprolite
BedrockSilt and clay
SandGravelHydraulic conductivity (Ksat)
of hillslope (m/s)
Thickness of constructed wetland (m)
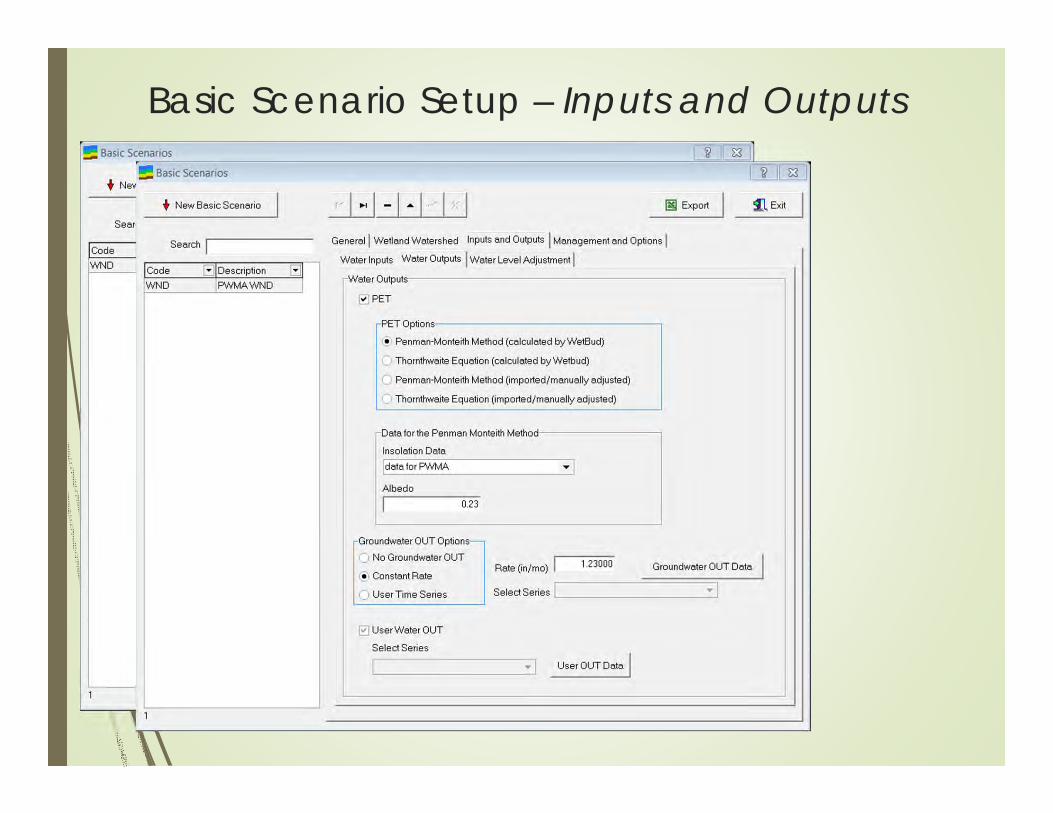
Basic Scenario Setup – Inputs and Outputs

Basic Scenario Setup – Inputs and Outputs
0.0
2.0
4.0
6.0
8.0
10.0
12.0
14.0
16.0
Jan Feb Mar Apr May Jun Jul Aug Sep Oct Nov Dec
Pote
ntia
l ev
apot
rans
pira
tion
(cm
)
Total monthly potential evapotranspiration
ThornthwaitePenman

Basic Scenario Setup – Inputs and Outputs

Basic Scenario Analysis and Output

Wet, Normal, and Dry Years
-100.0-90.0-80.0-70.0-60.0-50.0-40.0-30.0-20.0-10.0
0.010.0
Jan Feb Mar Apr May Jun Jul Aug Sep Oct Nov Dec
Wat
er le
vel (
cm)
Pocahontas State Park Predicted Average Monthly Water Level
1991 (D)2012 (D)1999 (N)2000 (N)1983 (W)1984 (W)
-280.0-260.0-240.0-220.0-200.0-180.0-160.0-140.0-120.0-100.0-80.0-60.0-40.0-20.0
0.020.0
Jan Feb Mar Apr May Jun Jul Aug Sep Oct Nov Dec
Wat
er le
vel (
cm)
Powhatan WMA Predicted Water Level
1980 (D)2007 (D)1983 (N)2002 (N)1993 (W)2003 (W)
Run water budget analyses for multiple WND years

Advanced Scenarios
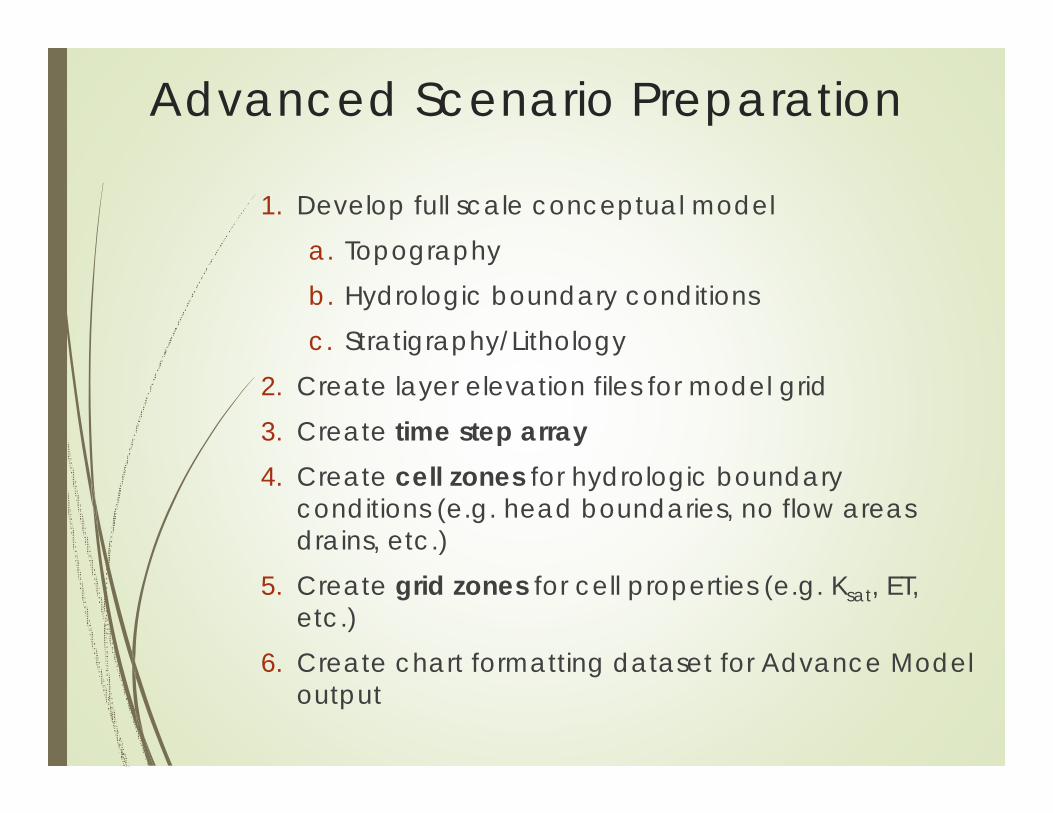
Advanced Scenario Preparation
1. Develop full scale conceptual modela. Topographyb. Hydrologic boundary conditionsc. Stratigraphy/Lithology
2. Create layer elevation files for model grid3. Create time step array4. Create cell zones for hydrologic boundary
conditions (e.g. head boundaries, no flow areas drains, etc.)
5. Create grid zones for cell properties (e.g. Ksat, ET, etc.)
6. Create chart formatting dataset for Advance Model output

1. Conceptual ModelCedar Run Wetland Mitigation Bank Hydrologic boundaries
- Mainly surface water driven system with compacted clay berm and subsoil
- Inlet and outlet weirs
Stratigraphy and Lithology
- 3 layers- Surface veg- Topsoil- Compacted clay
Areal Extent and Topography
- What size model grid?- Flat layers?- Topography?

1. Conceptual ModelHydrologic boundaries
- Mainly surface water driven system with compacted clay berm and subsoil
- Inlet and outlet weirs
Stratigraphy and Lithology
- 3 layers- Surface veg- Topsoil- Compacted clay
Areal Extent and Topography
- What size model grid?- Model units?- Flat layers?- Topography?
from Dahl, 2000 (US Fish and Wildlife)
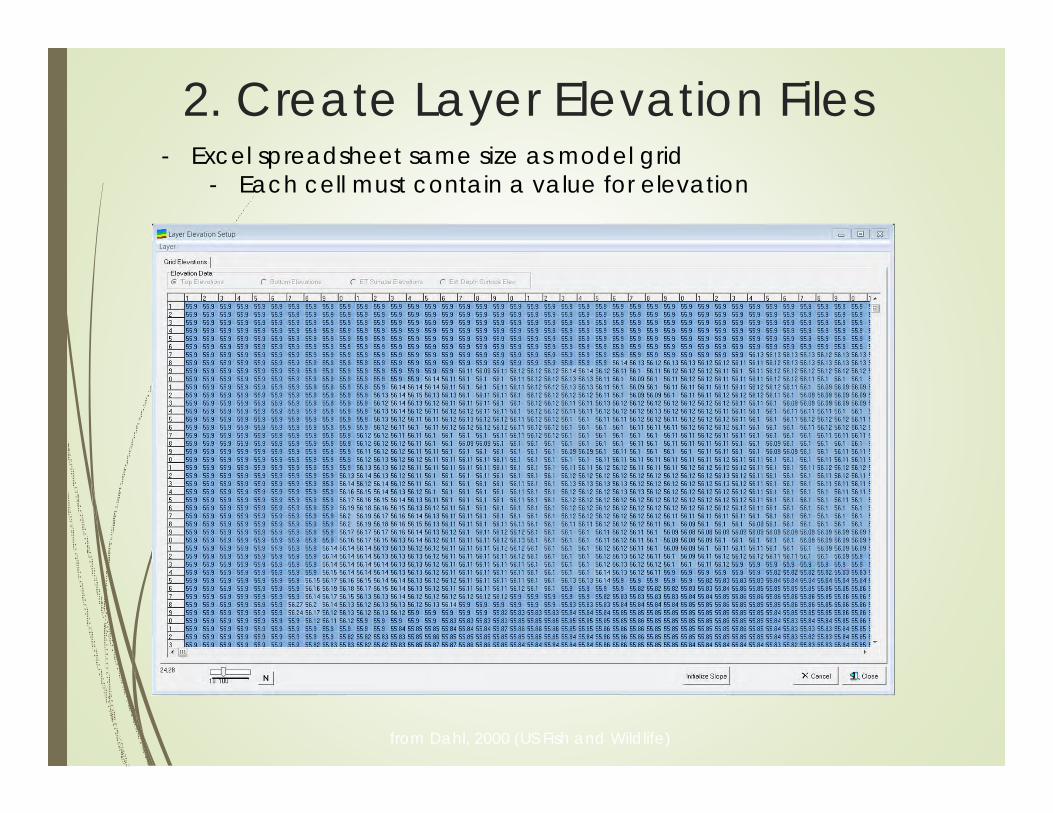
2. Create Layer Elevation Files- Excel spreadsheet same size as model grid
- Each cell must contain a value for elevation
from Dahl, 2000 (US Fish and Wildlife)
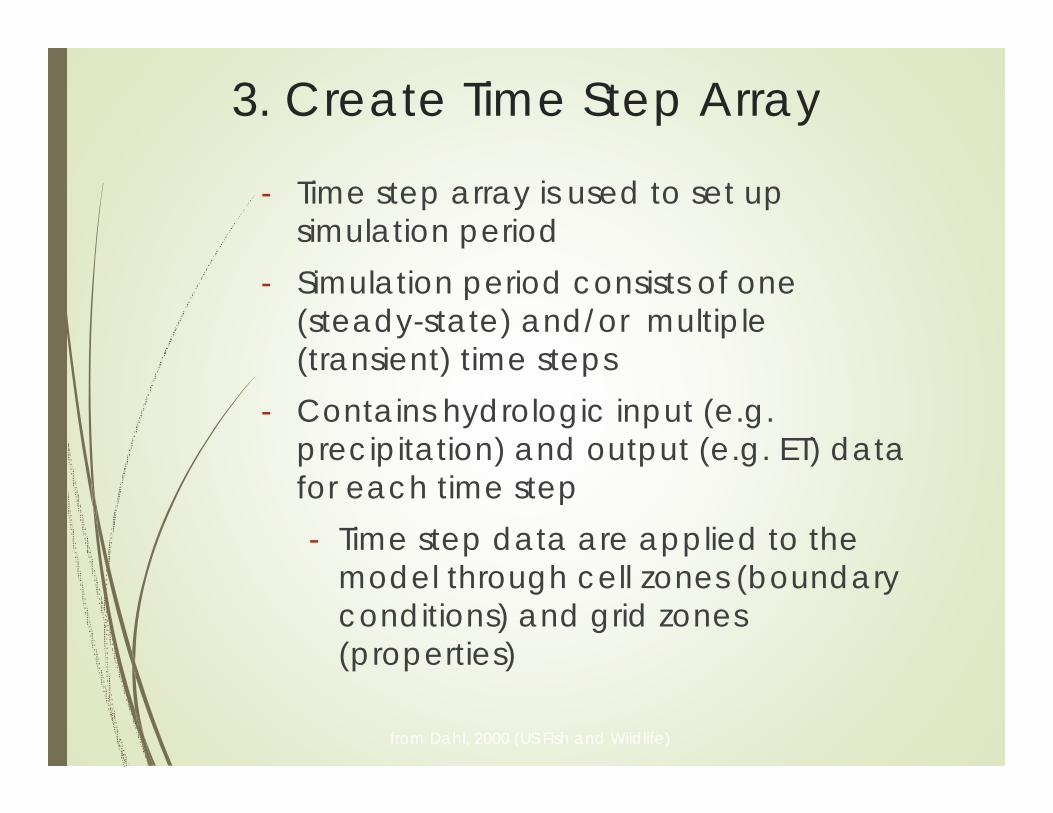
3. Create Time Step Array
- Time step array is used to set up simulation period
- Simulation period consists of one (steady-state) and/or multiple (transient) time steps
- Contains hydrologic input (e.g. precipitation) and output (e.g. ET) data for each time step- Time step data are applied to the
model through cell zones (boundary conditions) and grid zones (properties)

from Dahl, 2000 (US Fish and Wildlife)
Creating a Time Step Array- 1-year simulation period with daily time steps- All rates/values entered in model units (e.g. m/s)

Note: Precipitation data must exist in station record and ET rates must be calculated in Basic Scenario prior to import into time step array.from Dahl, 2000 (US Fish and Wildlife)
Importing Precip, ET, and Runoff into Time Step Array
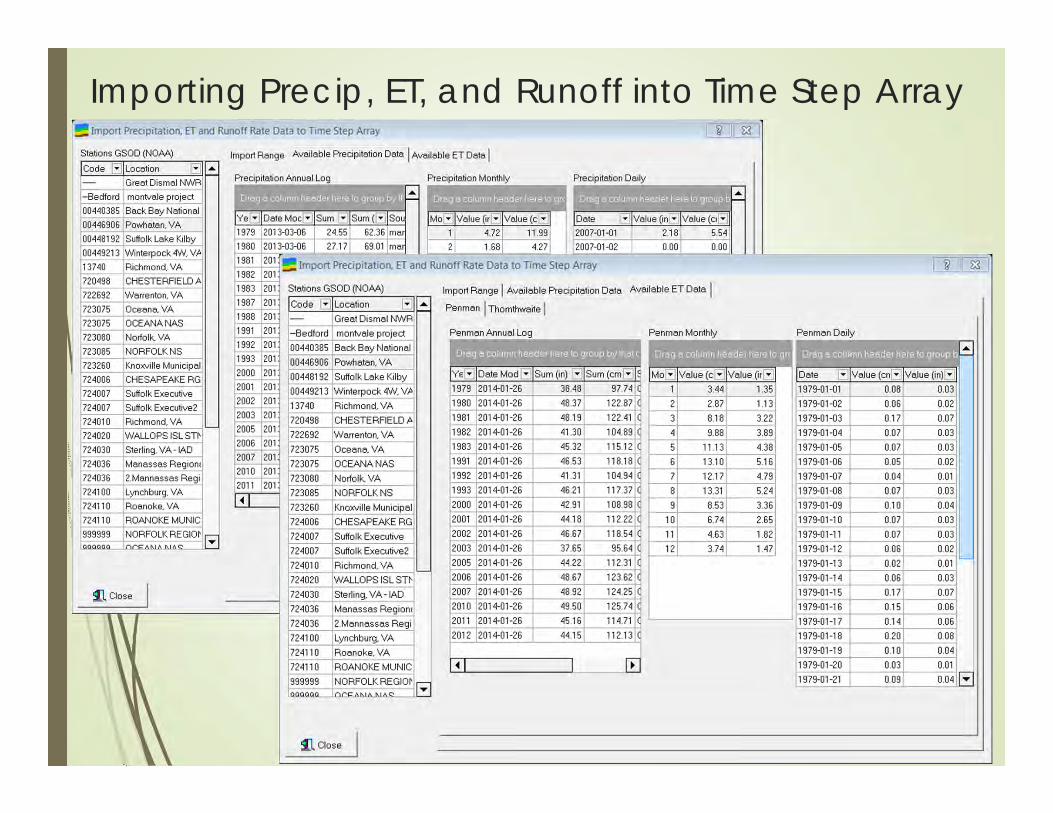
from Dahl, 2000 (US Fish and Wildlife)
Importing Precip, ET, and Runoff into Time Step Array

Importing Precip, ET, and Runoff into Time Step Array

from Dahl, 2000 (US Fish and Wildlife)
4. Create Cell Zones (Boundary Conditions)
For Cedar Run example:- No Flow Areas to delineate irregular-shaped wetland around surrounded
by compacted clay berm- Drain(s) and Drain Returns to represent weirs
Types of Cell Zones: Drains, General Head Boundaries, Monitoring Pts., No Flow Areas, Wells, and Drain Returns

from Dahl, 2000 (US Fish and Wildlife)
5. Create Grid Zones (Properties)Types of Grid Zones: Hydraulic Conductivity, Specific Storage, PrecipRate, and ET Rate
For Cedar Run example:- Create Hydraulic Conductivity and Specific Storage Zones for surface
veg., topsoil, and compacted clay.
from Dahl, 2000 (US Fish and Wildlife)
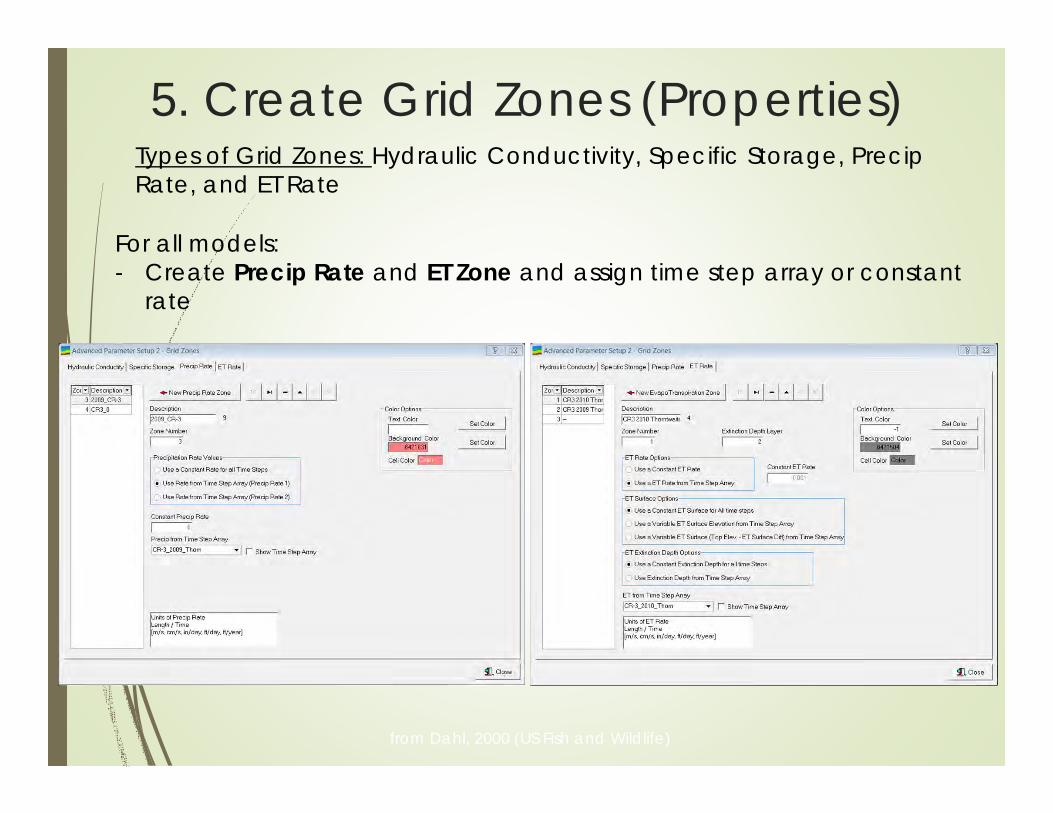
5. Create Grid Zones (Properties)Types of Grid Zones: Hydraulic Conductivity, Specific Storage, PrecipRate, and ET Rate
For all models:- Create Precip Rate and ET Zone and assign time step array or constant
rate

from Dahl, 2000 (US Fish and Wildlife)
6. Create Chart Formatting Dataset

Advanced Model Setup – General tab Create new Advanced Scenario, specify units of time and length, size
of the model grid, and select a Time Step Array.

Advanced Model Setup – General tab Create new Advanced Scenario, specify units of time and length, size
of the model grid, and select a Time Step Array.

Advanced Model Setup – General tab Create new Advanced Scenario, specify units of time and length, size
of the model grid, and select a Time Step Array.

Advanced Model Setup Create new Advanced Scenario, specify units of time and length,
size of the model grid, and select a Time Step Array.

Create new Advanced Scenario, specify units of time and length, size of the model grid, and select a Time Step Array.
Advanced Model Setup – General tab
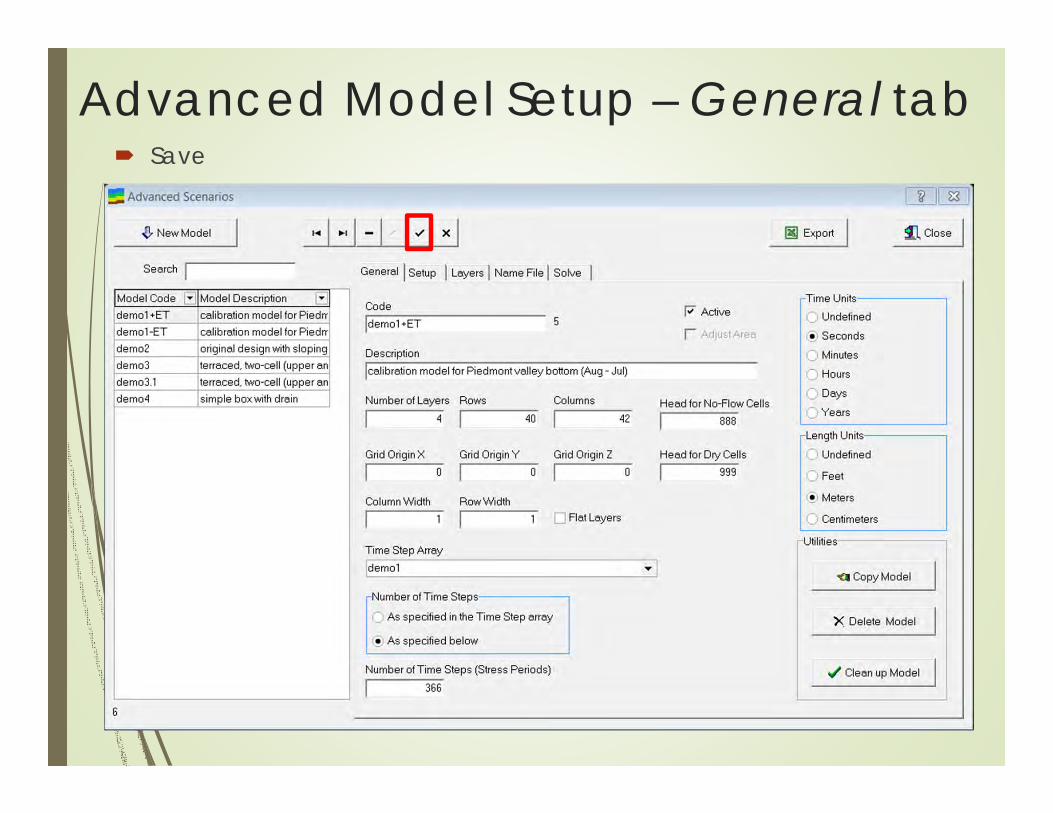
Save
Advanced Model Setup – General tab

Advanced Model Setup – Setup tab Select a precipitation option, ET option, chart settings file, and assign
the path for storing MODFLOW Input and Output files.

Advanced Model Setup – Layers tab Create all layers, import elevation data, and select layer
parameters.

Advanced Model Setup – Layers tab Importing elevation data

Advanced Model Setup – Layers tab
Initial headET surface elevationET extinction depth

Advanced Model Grid Setup – Cell Zones Assign Cell Zones(Boundary Conditions) to cells in the model grid.

Advanced Model Grid Setup – Grid Zones Assign Grid Zones(Properties)to every cell in each layer of the model
grid.

Advanced Model Grid Setup – Grid Zones Assign Grid Zones(Properties)to every cell in each layer of the model
grid.

Advanced Model Output Once grid setup is complete, return to Advanced Scenarios window.
In the Name File tab, generate name files for the current scenario. Save and proceed to the Solve tab.

Advanced Model Output In the Solve tab, create MODFLOW input files, execute MODFLOW,
and show Model results (see Section 4.7. Advanced Model Output for more information).
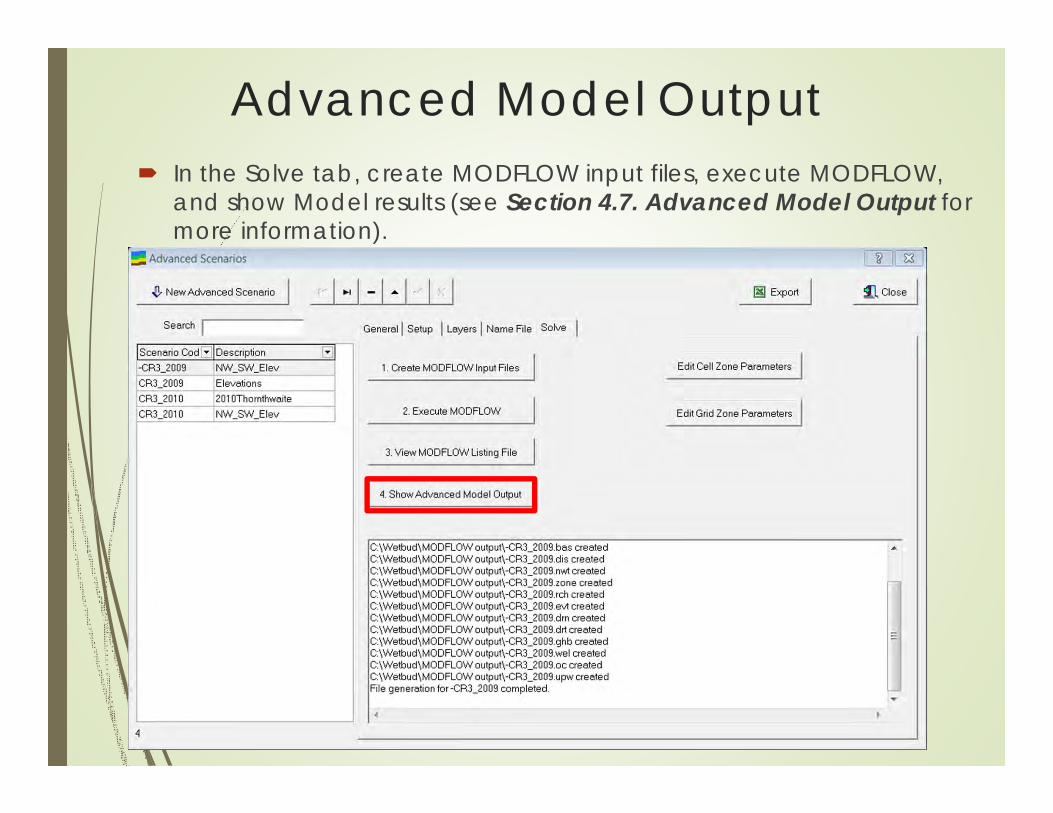
Advanced Model Output In the Solve tab, create MODFLOW input files, execute MODFLOW,
and show Model results (see Section 4.7. Advanced Model Output for more information).
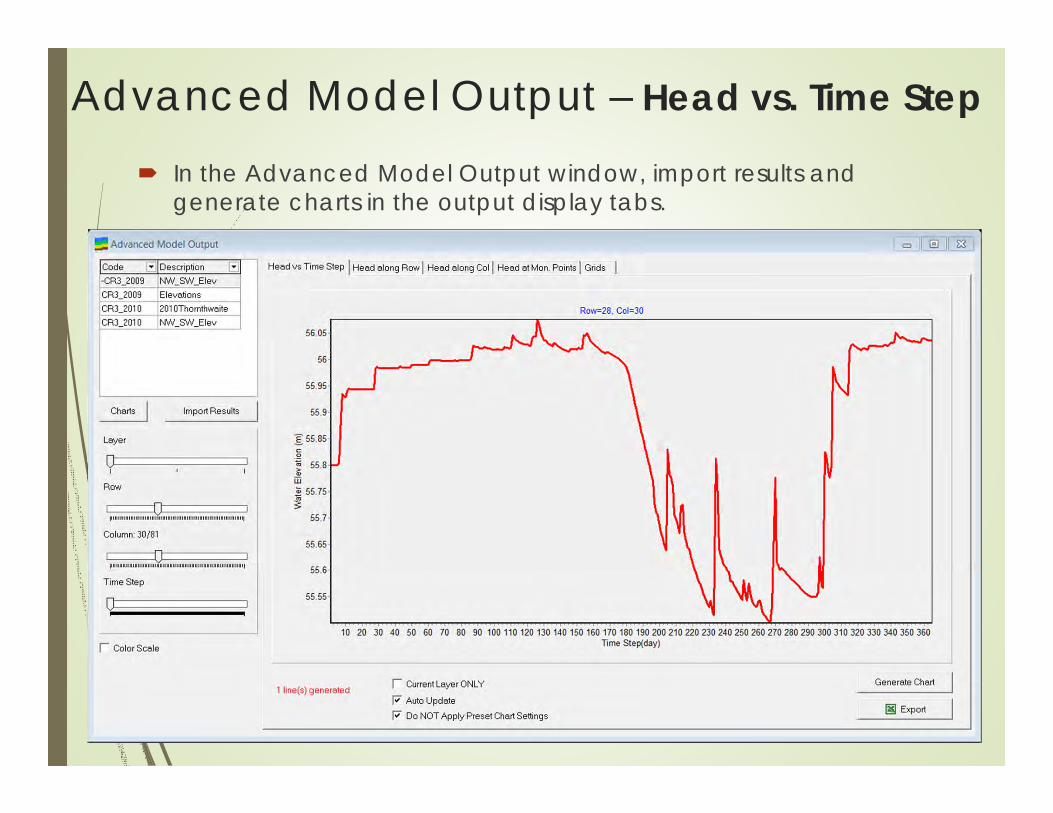
Advanced Model Output – Head vs. Time Step
In the Advanced Model Output window, import results and generate charts in the output display tabs.
In the Advanced Model Output window, import results and generate charts in the output display tabs.
Output shown here not from CR3
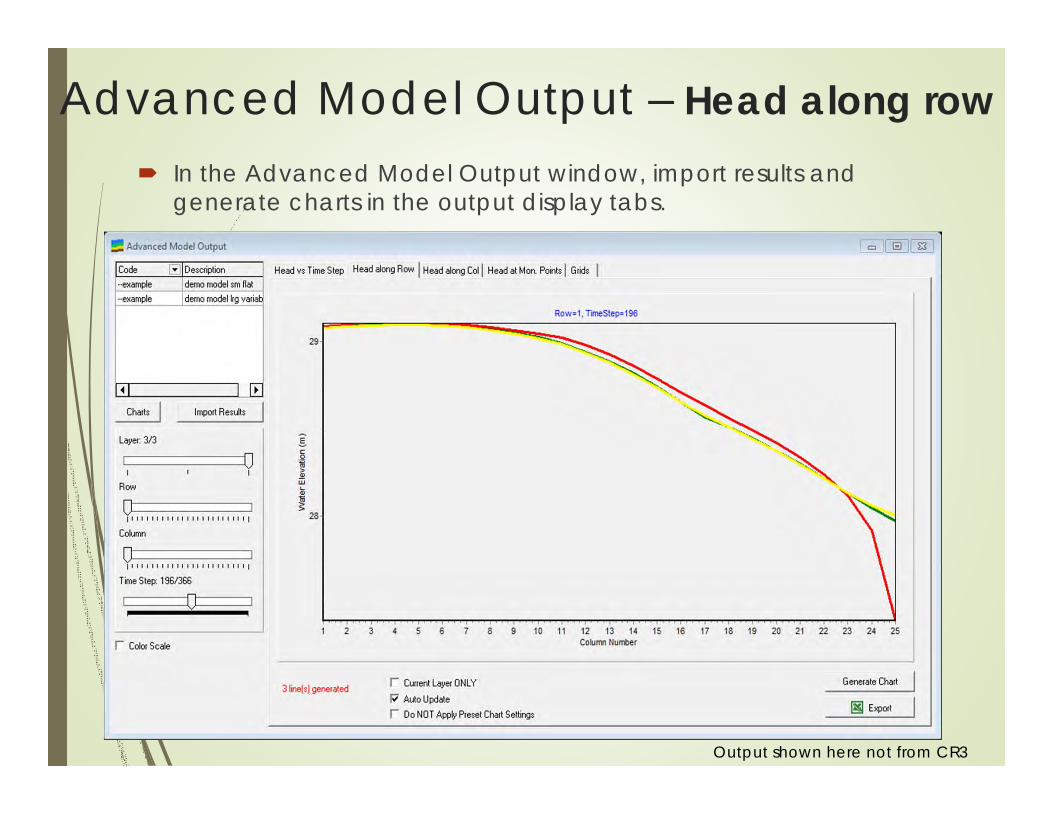
Advanced Model Output – Head along row

In the Advanced Model Output window, import results and generate charts in the output display tabs.
Output shown here not from CR3
Advanced Model Output – Head along col

In the Advanced Model Output window, import results and generate charts in the output display tabs.
Output shown here not from CR3
Advanced Model Output – Mon. points

Advanced Model Output - Grids In the Advanced Model Output window, import results and
generate charts in the output display tabs.

Advanced Model Output - Grids In the Advanced Model Output window, import results and
generate charts in the output display tabs.
Advanced Model Output - Grids

More to come after lunch…
…questions?