Building Armenia’s - Proactiveinvestors UK€¦ · 3 NI 43-101 Disclosure Information concerning...
41
Building Armenia’s Largest Gold Mine Analysts Feasibility Study Presentation TSX:LYD September 2012 www.lydianinternational.co.uk
Transcript of Building Armenia’s - Proactiveinvestors UK€¦ · 3 NI 43-101 Disclosure Information concerning...

Building Armenia’s
Largest Gold Mine
Analysts Feasibility Study Presentation
TSX:LYD
September 2012 www.lydianinternational.co.uk
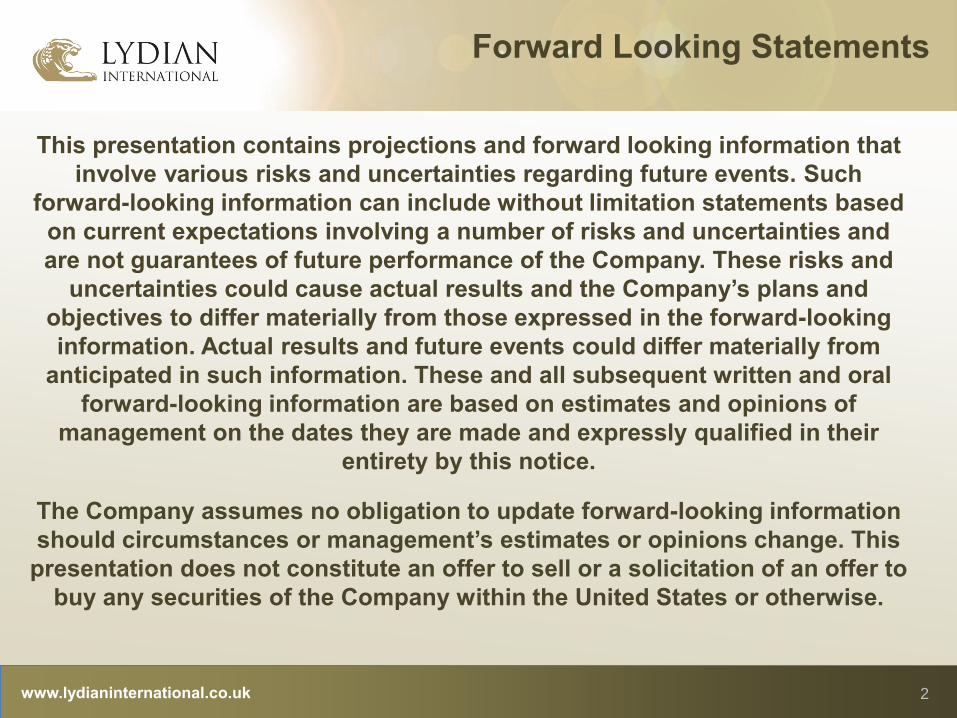
Forward Looking Statements
This presentation contains projections and forward looking information that
involve various risks and uncertainties regarding future events. Such
forward-looking information can include without limitation statements based
on current expectations involving a number of risks and uncertainties and
are not guarantees of future performance of the Company. These risks and
uncertainties could cause actual results and the Company’s plans and
objectives to differ materially from those expressed in the forward-looking
information. Actual results and future events could differ materially from
anticipated in such information. These and all subsequent written and oral
forward-looking information are based on estimates and opinions of
management on the dates they are made and expressly qualified in their
entirety by this notice.
The Company assumes no obligation to update forward-looking information
should circumstances or management’s estimates or opinions change. This
presentation does not constitute an offer to sell or a solicitation of an offer to
buy any securities of the Company within the United States or otherwise.
www.lydianinternational.co.uk 2

3
NI 43-101 Disclosure
www.lydianinternational.co.uk
Information concerning estimates of minerals reserves and resources
The mineral reserve and resource estimates reported in this presentation were prepared in accordance with Canadian National Instrument 43-101
standards of disclosure for mineral projects (‘NI 43-101’), as required by Canadian Securities Regulatory Authorities. For United States reporting
purposes, the United States Securities and Exchange Commission (‘SEC’) applies different standards in order to classify mineralization as a reserve. In
particular, while the terms ‘measured’, ‘indicated’ and ‘inferred’ mineral resources are required pursuant to NI 43-101, the SEC does not recognize such
terms. Canadian standards differ significantly from the requirements of the SEC. Investors are cautioned not to assume that any part or all of the
mineral deposits in these categories constitute or will ever be converted into reserves. In addition, ‘inferred’ mineral resources have a greater amount of
uncertainty as to their existence and great uncertainty as to their economic and legal feasibility. It cannot be assumed that all or any part of any inferred
mineral resource will ever be upgraded to a higher category. Under Canadian Securities laws, issuers must not make any disclosure of results of an
economic analysis that included inferred mineral resources, except in rare cases.
Under the guidelines of NI 43-101, the following qualified persons participated in a feasibility project for the Amulsar project.
The following individuals are Qualified Persons as defined by the CIM Definition Standards November 22, 2005 and Section 5.1 of National Instrument
43-101 Standards of Disclosure for Mineral Projects, Form 43-101F1 and Companion Policy 43-101CP.
Mr. Joseph M. Keane, P.E. of KD Engineering has responsibility for the report contents and preparation and all matters relating to the design and costs
of the processing facility. Mr. Keane visited the property May 2011. He has relied upon other experts for specific information in the Feasibility Study.
Mr. Richard Kiel, P.E. of Golder Associates, has responsibility for all matters relating to the HLF and WDF, the introduction, the geotechnical and the
update extracted from the NI-43-101 Preliminary Economic Assessment entitled “Development of Amulsar Heap Leach Facility”. Mr. Kiel visited the
property in June, September and October, 2011 and again in July, 2012.
Mr. Pete Lemke, P.E. of Golder Associates has responsibility for all matters relating to the Wastewater Treatment Plant design.
Mr. Herb Welhner, MMSA-QPM, of Independent Mining Consultants, has responsibility for all matters relating to geology, drilling, open pit and mine
design.
Mr. John Eyre, FRICS MIMMM MIQ Cenv of Wardell Armstrong International, has responsibility for all matters relating to the Environmental and Social
Impact Assessment and visited the property in June 2010 and 2011.
The NI 43-101 compliant Technical Report for the feasibility study of the Amulsar project will be filed on SEDAR within 45 days of September 5, 2012
press release announcing the results of the Feasibility Study.

www.lydianinternational.co.uk 4
Feasibility Study
Armenia and Amulsar

Armenia and Amulsar
www.lydianinternational.co.uk 5
• Armenia is a Democratic
presidential republic
• Member of WTO since
2003
• Mineral resources 60%
by value of exports
• New World Bank guided
Mining Law, effective
January 2012
• Located 170km from the
capital, Yerevan
• 4km from the nearest
town - Gorayk

Geology and Licence Outline
6 www.lydianinternational.co.uk
• High-Sulfidation
Epithermal Gold Deposit
• Volcaniclastic rocks of
dominantly dacitic
composition
• Entirely oxide
• Mineralization
dominantly fault and
fracture controlled with
some lithological/
stratbound control
• Two exploration licenses
• Mining license over main
Tigranes/Artavasdes pit

Drilling 2007 - 2011
www.lydianinternational.co.uk 7
Summary of Amulsar Geochemistry Samples
Project Year
Diamond Drilling RC Drilling Total
# of holes meters # of holes meters # of holes meters
Amulsar 2007 5 593 0 0 5 593
Amulsar 2008 18 2679.3 74 10363 92 13042.3
Amulsar 2009 8 1089.8 101 12446 109 13535.8
Amulsar 2010 52 7575.9 129 17036 181 24611.9
Amulsar 2011 198 16113.2 154 23099 352 39212.2
Total 2007-2011 281 28051.2 458 62944 739 90995.2
• A total of 739 holes have been drilled at Amulsar between 2007 and the end of 2011,
including, exploration, geotechnical, metallurgical, and sterilization holes
• Drilling continues in 2012 with exploration, step-out and infill

Drilling 2007-2011
8 www.lydianinternational.co.uk
Like many
development projects
drilling at Amulsar has
been focused by the
timeline on infill and
resource definition.
Limited exploration
drilling along the ridge
top has identified
other gold mineralized
zones that require
significant further
drilling and resource
definition work in the
coming years. These
zones include Orontes,
Erato North, Arshak
South and Tigranes
Northeast.

www.lydianinternational.co.uk 9
Feasibility Study
Mineral Resource Estimation

Mineral Resources January 2012
www.lydianinternational.co.uk
Resource Category Cut-off Grade Tonnes
(millions) Grade (g/t Au)
Gold Ounces
('000) Grade (g/t Ag)
Silver Ounces
('000)
Measured (M) 0.75 15.4 1.64 812 4.97 2459
0.5 27.7 1.18 1053 4.18 3720
0.4 36.5 1 1180 3.82 4489
0.3 50.2 0.83 1332 3.45 5574
0.2 70.7 0.66 1496 3.11 7065
Indicated (I) 0.75 13 1.57 655 4.78 1995
0.5 23.9 1.13 866 4.14 3178
0.4 32.2 0.95 986 3.84 3977
0.3 46.4 0.77 1143 3.48 5189
0.2 71.1 0.59 1339 3.13 7155
Total (M&I) 0.75 28.4 1.61 1467 4.88 4454
0.5 51.6 1.16 1919 4.16 6898
0.4 68.8 0.98 2166 3.83 8466
0.3 96.6 0.8 2475 3.47 10763
0.2 141.9 0.62 2835 3.12 14220
Inferred 0.75 15 1.45 696 4.56 2196
0.5 26.8 1.08 927 4.39 3779
0.4 35.5 0.92 1052 4.01 4580
0.3 48.1 0.77 1192 3.65 5645
0.2 73.9 0.59 1395 3.12 7410
10
The mineral resource is based on drilling completed through the 2011 drill season and includes a total of 665 core and reserve
circulation (RC) holes. The mineral resource was originally reported in the IMC report “2012 Mineral Resource Estimate, Amulsar
Gold Project, NI 43-101 Technical Report”, dated January 22, 2012. The mineral resource is summarized at several cut-off grades,
with the resource at a 0.40 g/t gold cut-off being the tonnage and grade that was selected to be reported.

Block Model and Floating Cone Resource
www.lydianinternational.co.uk 11
The mineral resource is based on drilling
completed up to and through the 2011 drill
season and includes a total of 665 core and
reserve circulation (RC) holes. Gold and silver
grades in the Amulsar model were estimated
using inverse distance to the eighth power
(ID8), spherical search ellipsoids of 50 meters
in Tigranes and Artavasdes and 100 meters in
Erato and no internal domain boundaries.
The mineral resource is summarized in slide
10 at several cutoff grades, with the resource
at a 0.40 g/t gold cutoff being the tonnage and
grade that was selected to be reported. Higher
and lower cutoff grades are presented to show
the distribution of tonnage and grades. The
mineral resource is within a floating cone
geometry based on US$ 1300/oz gold price (no
credit for silver) and preliminary estimates of
gold recovery and operating costs provided in
January 2012. Additional definition of these
estimates were subsequently done and used
for the definition of the mineral reserve. The
reported mineral resource represents about 98
percent of the model contained mineralization.

www.lydianinternational.co.uk 12
Measured and Indicated Mineral Resource
0.20-0.75 g/t cut-off
0.00
0.20
0.40
0.60
0.80
1.00
1.20
1.40
1.60
1.80
0
20
40
60
80
100
120
140
160
0.75 0.5 0.4 0.3 0.2
Au
(g
/t)
To
nn
ag
e (
Mt)
Tonnes
Gold g/t
Cut-off Grade (g/t)

13 www.lydianinternational.co.uk
Feasibility Study
Mineral Reserve and
Mine Plan
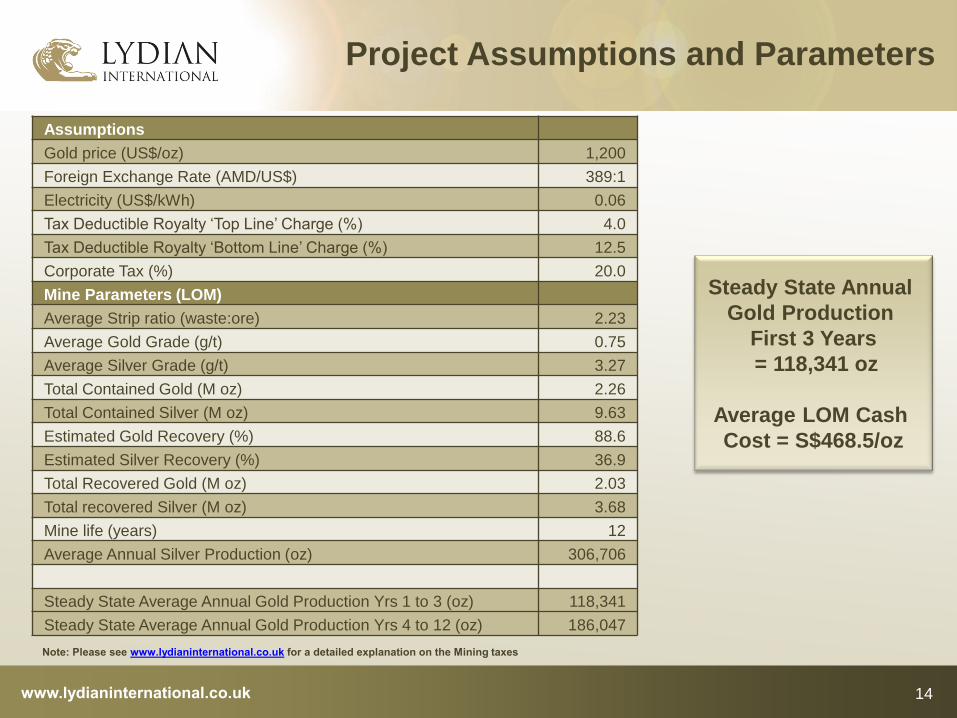
Project Assumptions and Parameters
14 www.lydianinternational.co.uk
Steady State Annual
Gold Production
First 3 Years
= 118,341 oz
Average LOM Cash
Cost = S$468.5/oz
Assumptions
Gold price (US$/oz) 1,200
Foreign Exchange Rate (AMD/US$) 389:1
Electricity (US$/kWh) 0.06
Tax Deductible Royalty ‘Top Line’ Charge (%) 4.0
Tax Deductible Royalty ‘Bottom Line’ Charge (%) 12.5
Corporate Tax (%) 20.0
Mine Parameters (LOM)
Average Strip ratio (waste:ore) 2.23
Average Gold Grade (g/t) 0.75
Average Silver Grade (g/t) 3.27
Total Contained Gold (M oz) 2.26
Total Contained Silver (M oz) 9.63
Estimated Gold Recovery (%) 88.6
Estimated Silver Recovery (%) 36.9
Total Recovered Gold (M oz) 2.03
Total recovered Silver (M oz) 3.68
Mine life (years) 12
Average Annual Silver Production (oz) 306,706
Steady State Average Annual Gold Production Yrs 1 to 3 (oz) 118,341
Steady State Average Annual Gold Production Yrs 4 to 12 (oz) 186,047
Note: Please see www.lydianinternational.co.uk for a detailed explanation on the Mining taxes

www.lydianinternational.co.uk
Mineral Reserves
Mineral Reserves at US$1200/oz and a variable cut-off grade by year
Reserve
category
Ore
(‘000s)
Gold Grade
(g/t)
Silver Grade
(g/t) Gold oz Silver oz
Proven 51,143 0.801 3.37 1,317,000 5,541,000
Probable 37,106 0.789 3.43 941,000 4,092,000
Total (P&P) 88,249 0.796 3.40 2,258,000 9,633,000
• Some material in year two above 0.3g/t recoverable gold stockpiled
• The gold and silver recoveries vary by deposit area based on the metallurgical test
work. A recoverable grade for gold and silver is assigned in the block model and
used for tabulations
15

Mine Schedule
16 www.lydianinternational.co.uk
Waste tonnes mined, ore tonnes sent to the crusher and
recoverable ounces of gold put on to the heap leach.
0
50,000
100,000
150,000
200,000
250,000
300,000
0
5,000,000
10,000,000
15,000,000
20,000,000
25,000,000
Yr1 Yr2 Yr3 Yr4 Yr5 Yr6 Yr7 Yr8 Yr9 Yr10 Yr11 Yr12
Dilu
ted
Rec
ove
rab
le O
un
ce
s p
ut
on
Hea
p o
z.
To
nn
es
Mo
ve
d i
n P
eri
od
Waste Mined
Ore to Crusher
OZ. Au to Heap
. The drop in ounce
production in Years 7 to 10
is a result of the
commencement of mining in
the early stages at Erato. As
the drill density at Erato is
less, a larger proportion of
the material inside the
ultimate pit shell is in the
inferred category and hence
cannot be included in this
study. It is expected that as
exploration activities
continue in 2012 and 2013,
more material will be
upgraded from inferred and
this drop in ounces
produced can be reduced.
Increased understanding of
the Erato ore body will also
lead to more optimized stage
designs which will also
improve the production
schedule in the later years.

Pit Reserve
17 www.lydianinternational.co.uk
Erato
Tigranes/ Artavasdes
Au Grade g/t
Green 0.1 - 0.5
Yellow 0.5 - 1.0
Red >1.0

www.lydianinternational.co.uk 18
Feasibility Study
Infrastructure and
Process Plant

Mine Layout Plan
19 www.lydianinternational.co.uk
Waste Dump
Truck Shop
Maintenance
Shop
Waste Water Treatment Plant
Open
Pit
Crushing
Plant
Hydro Plant
Rom
Stockpile
Heap
Leach
Pad
Mine Access Road
Solution
Ponds
Mine
Camp
ADR Plant
Water Tank
ERATO
TIGRANES
ARTAVASDES
ARSHAK
Topsoil Stockpile
Mine
Offices
GORAYK
Phase 4 – Allows
expansion from
90Mt to 120 Mt
(not costed in FS)
Haulage Road

Crushing Plant Flow Diagram
www.lydianinternational.co.uk 20

www.lydianinternational.co.uk
ADR Plant and Heap Leach
21
Pad Capacity
Process water sourced from river
CELL 1 + CELL 2 = +/- 17.8Mt
CELL 3 + CELL 4 = +/- 27.8Mt
CELL 5 + CELL 6 = +/- 49.4Mt
TOTAL CAPACITY = 95.1Mt
• Total Capacity of Cells 1 - 6 = 95.1Mt as per the
FS mine schedule
• Construction of Cells is staged to optimise
capital spend
• Extra Capacity of 30Mt (+/- 3 yrs production) to
give total heap capacity of 125Mt as pits increase
• Leach ponds designed for a 1 in 100 year event
• ADR Plant standard design, carbon columns,
gold room etc
• Water sourced from Vorotan River
• Potential for water to be sourced from Waste
Dump reducing requirement for Waste Water
Treatment Plant
• Heap Leach Height 72m, lifts of 8m at a time
• Stacking completed with portable stacker
conveyors
• No agglomeration required
• Low lime and cyanide consumption
• Short recovery time

Overall Flowsheet
www.lydianinternational.co.uk 22

www.lydianinternational.co.uk
MINE MANAGER Tim Richards
HR MANAGER
LOGISTICS &
SUPPORT
MANAGER
FINANCE
MANAGER
PRODUCTION
MANAGER PROCESS
MANAGER ENGINEERING
MANAGER SECURITY
MANAGER
ENVIRONMENTAL
MANAGER CONSTRUCTION
MANAGER OH&S
MANAGER Tony Nicotra Murray Wright Stephen Ainsworth
CONSTRUCTION
MANAGER CHIEF
ACCOUNTANT
MAINTENANCE
SUPERINTENDENT
TECHNICAL
SERVICES
SUPERINTENDENT
PRODUCTION
SUPERINTENDENT
CRUSHER &
CONVEYOR
SUPERINTENDENT
ADR & HEAP
SUPERINTENDENT
METALLURGIST
ELECTRICAL
SUPERINTENDENT
MECHANICAL
SUPERINTENDENT
CAMP
SUPERINTENDENT
WAREHOUSE
SUPERINTENDENT
I.T
SUPERINTENDENT
TRAINING
SUPERINTENDENT
DOCTOR
SECURITY
CONTRACTOR
COMMUNITY
LIAISON
Carl Nicholas
ENVIRONMENTAL
OFFICER
EPCM
FIRM
HLF & WASTE
DUMP
CONSULTANTS
ARMENIAN
CIVILS
CONTRACTOR
CONSTRUCTION &
OPERATIONS
CONSTRUCTION
ONLY
OPERATIONS ONLY
KEY
Construction and Production
Senior Team
The total workforce during operation is
estimated at around 550 employees. The
total workforce during construction is
estimated at 600.
23

www.lydianinternational.co.uk
Upcoming Engineering and Construction
Events
24
• Construction due to start end of 2012
• Engineering contract to be awarded Q4 2012
• Detailed Engineering Studies to be
completed by the end of Q2 2013
• PCM contract to be awarded H1 2013

www.lydianinternational.co.uk 25
Feasibility Study
Capital Expenditures
Capital Expenditures
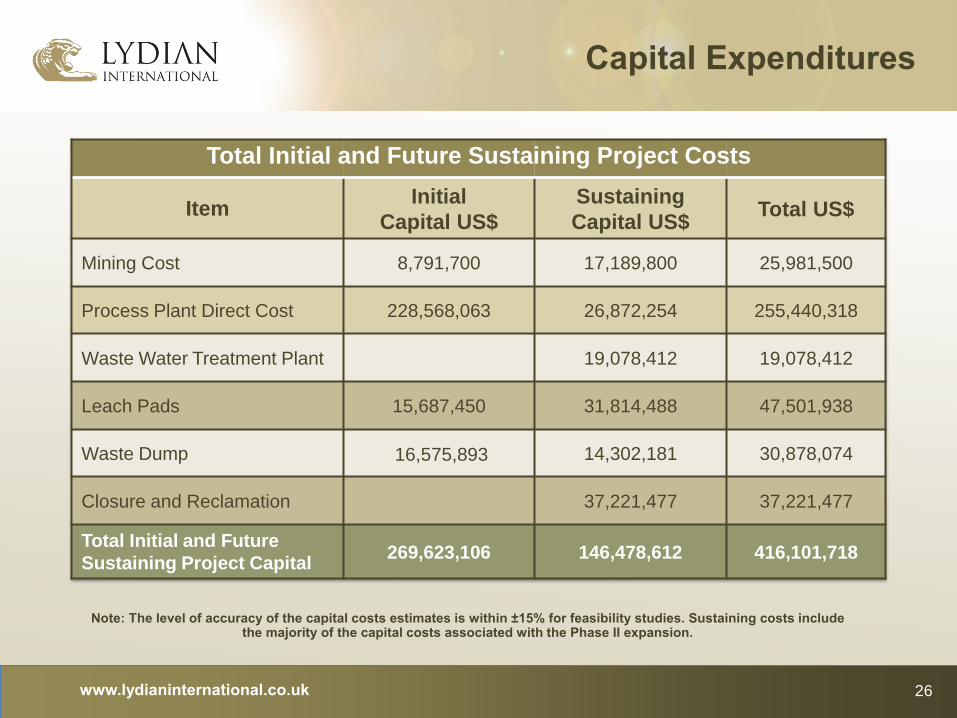
Note: The level of accuracy of the capital costs estimates is within ±15% for feasibility studies. Sustaining costs include the majority of the capital costs associated with the Phase II expansion.
www.lydianinternational.co.uk
Item Initial
Capital US$
Sustaining
Capital US$ Total US$
Mining Cost 8,791,700 17,189,800 25,981,500
Process Plant Direct Cost 228,568,063 26,872,254 255,440,318
Waste Water Treatment Plant 19,078,412 19,078,412
Leach Pads 15,687,450 31,814,488 47,501,938
Waste Dump 16,575,893 14,302,181 30,878,074
Closure and Reclamation 37,221,477 37,221,477
Total Initial and Future
Sustaining Project Capital 269,623,106 146,478,612 416,101,718
Total Initial and Future Sustaining Project Costs
26

www.lydianinternational.co.uk 27
Feasibility Study
Operating Costs

Cash Operating Expenses
LOM Average First 3yrs
Item US$/Tonne Ore Mined US$/oz US$/oz
Mining 5.50 257.11 241.18
Mining Equipment Lease Cost 0.79 37.04 91.18
Processing 2.92 136.55 140.59
Waste Water Treatment Plant 0.13 6.05 9.43
G & A 0.47 21.88 31.37
Cash Operating Costs 9.81 458.63 513.75
Newmont Payment 0.21 9.85 33.80
Total Cash Operating Costs 10.02 468.48 547.55
www.lydianinternational.co.uk
Note: Mining and Mine Lease costs also fall in Year -2 and Year -1. See table 22.3 in the Feasibility Study report. First 3 years are years 1, 2 and 3.
28

www.lydianinternational.co.uk
Mine Operating Cost Profile
29
Note: Mine Operating costs also fall in Year -1. See table 22.3 in the Feasibility Study report.
The average stripping ratio in the first 3 years of mining is 1.8:1 waste:ore. Beginning in
year 4, the stripping ratio increases to 2.35:1 and continues at that ratio to year 10. Average
Mining Cost per tonne mined is US$1.66 and average Leasing Cost per tonne mined is
US$0.29
0
0.5
1
1.5
2
2.5
3
$0
$1
$2
$3
Yr1 Yr2 Yr3 Yr4 Yr5 Yr6 Yr7 Yr8 Yr9 Yr10 Yr11 Yr12
Stri
p R
atio
Co
st p
er
ton
ne
Min
ed
(U
S$)
Mining Cost per tonne Mined (US$)
Strip Ratio
LOM Strip Ratio 2.23
Leasing Cost per tonne Mined (US$)

www.lydianinternational.co.uk
Major Mining Fleet
Equipment type Yr -1 Yr 1 Yr 2 Yr 3 Yr 4 Yr 5 Yr 6 Yr 7 Yr 8 Yr 9 Yr 10 Yr 11 Yr 12
Sandvik DP1500 Drill 0 3 2 3 7 7 7 7 7 7 7 6 1
10 cu m Excavator 0 1 1 1 2 2 2 2 2 2 2 2 2
17 cu m Excavator 0 1 1 1 2 2 2 2 2 2 2 2 2
Cat 777 Haul Truck 0 19 19 20 37 37 37 37 34 25 24 24 18
Cat D10 Tractor Dozer 1 3 3 3 3 3 3 3 3 3 3 2 2
Cat 824G Wheel Dozer 1 1 1 1 1 1 1 1 1 1 1 1 1
Cat 16M Motor Grader 1 1 1 1 1 1 1 1 1 1 1 1 1
Cat 777 Water Truck 1 1 1 1 1 1 1 1 1 1 1 1 1
Cat 992G Wheel Loader 1 1 1 1 1 1 1 1 1 1 1 1 1
Cat 336DL Excavator 1 1 1 1 1 1 1 1 1 1 1 1 1
Total 6 32 31 33 56 56 56 56 53 44 43 41 30
30

www.lydianinternational.co.uk 31
Feasibility Study
Project Economics
www.lydianinternational.co.uk
Gold Production Profile
32
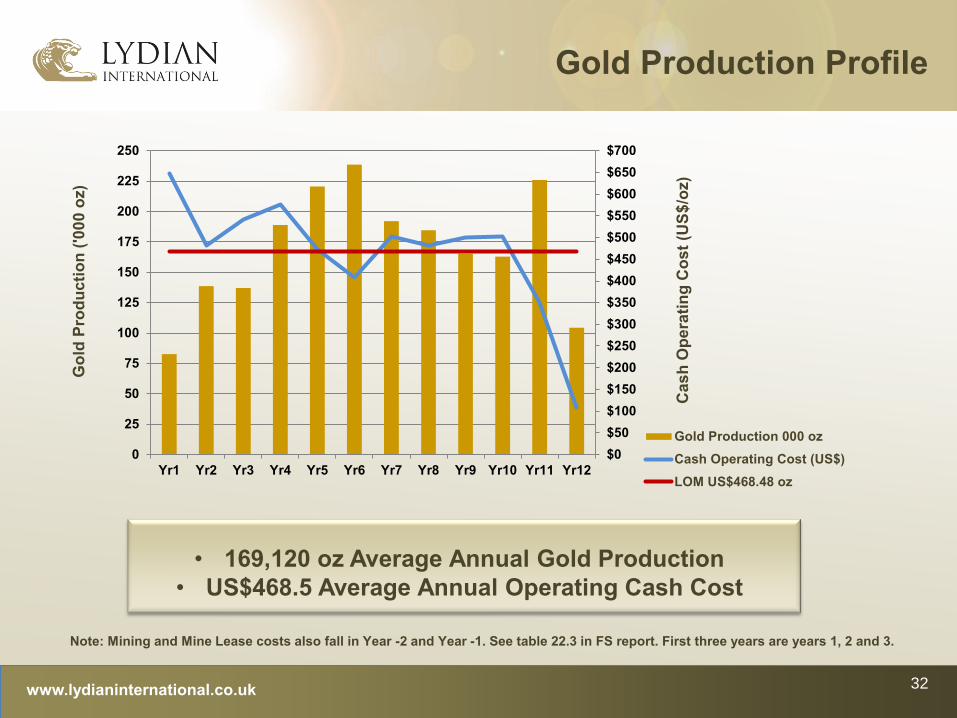
Note: Mining and Mine Lease costs also fall in Year -2 and Year -1. See table 22.3 in FS report. First three years are years 1, 2 and 3.
$0
$50
$100
$150
$200
$250
$300
$350
$400
$450
$500
$550
$600
$650
$700
0
25
50
75
100
125
150
175
200
225
250
Yr1 Yr2 Yr3 Yr4 Yr5 Yr6 Yr7 Yr8 Yr9 Yr10 Yr11 Yr12
Cas
h O
pe
rati
ng
Co
st
(US
$/o
z)
Go
ld P
rod
ucti
on
('0
00
oz)
Gold Production 000 oz
Cash Operating Cost (US$)
LOM US$468.48 oz
• 169,120 oz Average Annual Gold Production
• US$468.5 Average Annual Operating Cash Cost

www.lydianinternational.co.uk
Financial Analysis
33
Base Case
Discount Rate Undiscounted 5% 10%
NPV pre-tax (US$M) 1121.6 646.0 366.8
Payback (yrs) 4
Net Cash Flow (US$B) 1.17
Gold Price, US$/oz US$1100 US$1200 US$1300 US$1400 US$1500
NPV @5% (US$M) 513 646 779 913 1,046
IRR (%) 23.8 27.7 31.3 34.8 38.1
Payback (yrs) 4.5 4.0 3.7 3.4 3.1
At a gold price of $1,500, pre-tax NPV is in excess of $1.05 billion, the IRR is
robust at 38.1% and the pre-tax operating cash flow is expected to be
around $1.73 billion.

www.lydianinternational.co.uk
Financial Analysis - Sensitivities
34
Capex change +10% Base Case -10%
NPV @ 5% ($M) 611 646 681
IRR (%) 25.2 27.7 30.5
Operating Cost change +10% -10%
NPV @ 5% ($M) 582 646 681
IRR (%) 25.7 27.7 29.7
Gold Recovery change +10% -10%
NPV @ 5% ($M) 806 646 486
IRR (%) 32.0 27.7 23.0
The Project is not very sensitive to changes in capital costs nor operating
costs. A 10% improvement in gold recovery can improve IRR to 32% (an
increase of nearly 16%).

www.lydianinternational.co.uk 35
Feasibility Study
Permitting

www.lydianinternational.co.uk
Current ML,
CA & RAA
(2009)
New
Resources
& ML
EIA Approved
HLF
& Processing
EIA Approval
Pit and
Waste
Mining License
Concession
Agreement and
RAA
Plant EIA after
Detailed Engineering
and EIA on
new resources
March 2009 Nov 2011 Feb 2012 Estimated Date H1 2013
Pit approved over
approximately
600k oz gold.
Rock Allocation
Area (RAA, or
mine footprint)
over pit and
prospect areas.
Under Concession
Agreement (CA)
must mine at least
2.25Mt ore before
March 2015.
New
resources,
pit-outline
and
Mining
License
approved.
EIA
approved
for Heap
Leach Facility,
crushing,
conveying
and ADR
Plant
EIA approval
for open-pit
mining and
location of
waste dump
facility
Outline new Rock Allocation Area (RAA) to cover complete mine layout Execute new Mining License Concession Agreement
EIA approval once all
detailed engineering is
submitted and new
resources EIA for areas
that warrant pit
extensions e.g. Erato.
Mine Closure Plan
EIA to be submitted
minimum of two years
before mine closure
Independent
Review of
International
ESIA
July 2012 Sept 2012
Independent
review of the
International
ESIA
requested by
the Ministry
of Nature
Protection
Q4 2012
Permits and Licenses
36

www.lydianinternational.co.uk 37
Feasibility Study
Opportunities
www.lydianinternational.co.uk
Opportunities – Expansion
38
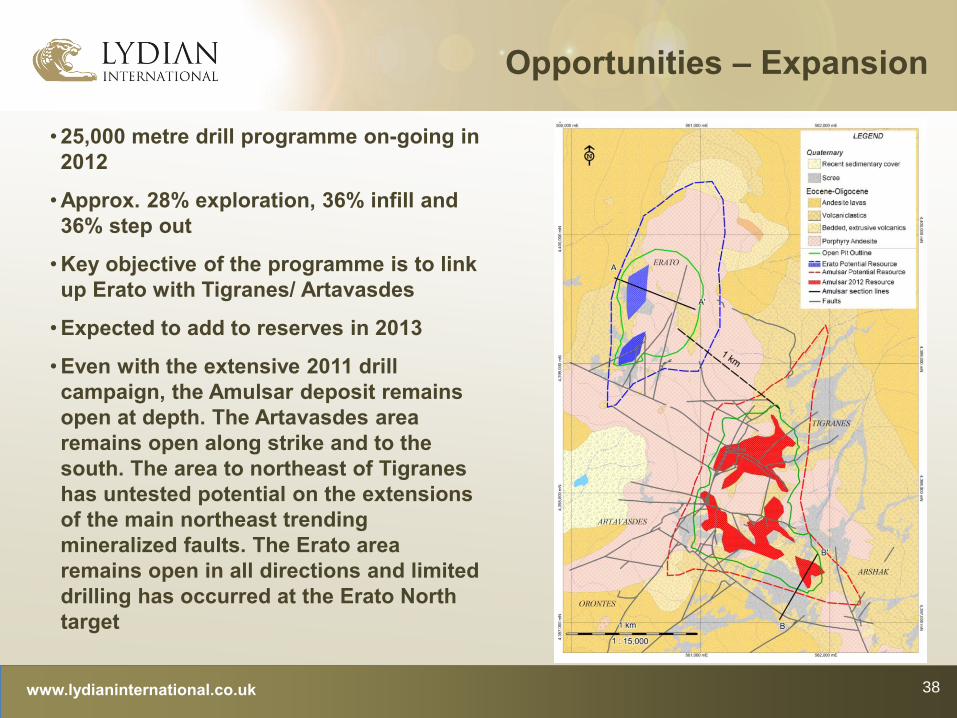
• 25,000 metre drill programme on-going in
2012
• Approx. 28% exploration, 36% infill and
36% step out
• Key objective of the programme is to link
up Erato with Tigranes/ Artavasdes
• Expected to add to reserves in 2013
• Even with the extensive 2011 drill
campaign, the Amulsar deposit remains
open at depth. The Artavasdes area
remains open along strike and to the
south. The area to northeast of Tigranes
has untested potential on the extensions
of the main northeast trending
mineralized faults. The Erato area
remains open in all directions and limited
drilling has occurred at the Erato North
target

www.lydianinternational.co.uk
Opportunities – Increasing Resource
at Erato
www.lydianinternational.co.uk
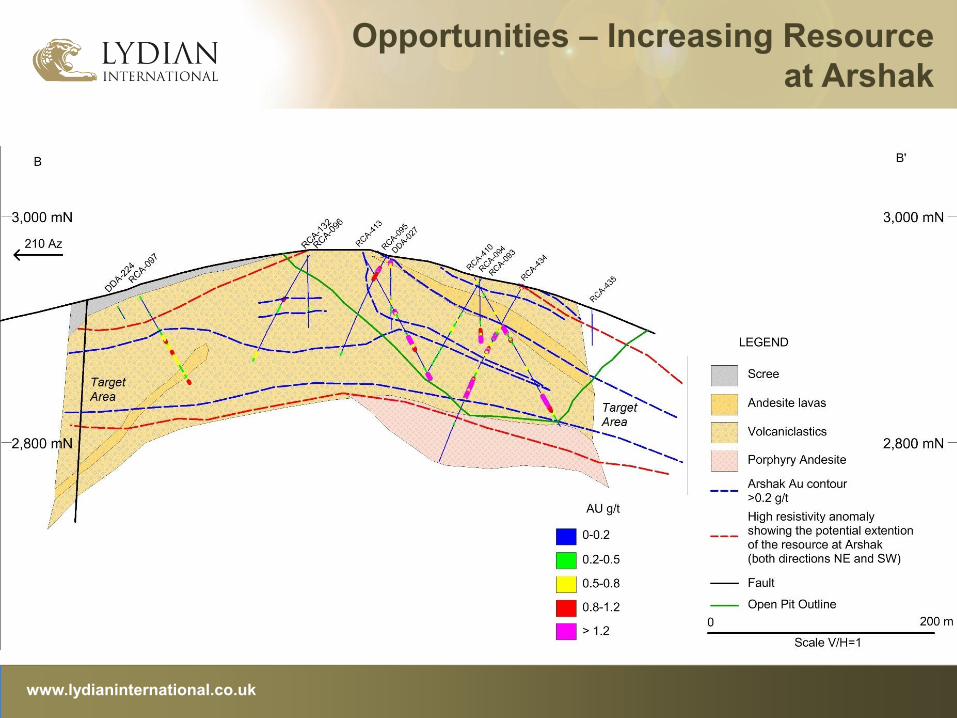
Opportunities – Increasing Resource
at Arshak

www.lydianinternational.co.uk
Opportunities
41
The Company intends to carry out additional studies with a view
to further optimising project economics, including:
• Adding new reserve ounces
• Eliminating the Phase II ramp up and commencing initial
production at 10 Mtpa
• Comparing the installation of a single gyratory versus two
jaw crushers
• Reviewing key infrastructure layout and configuration