Build Physician Relationships that Drive Business Results; Part 2
13
1) Physician Relationship Database • Analyst reports to VP, Strategic Planning & Business Development • Provide database training, data reporting and analytics support 2) Office of Physician Referral Management • Director reports to Chief Physician Executive for high-level issue resolution and 2.0 FTEs responding to calls 3) Physician Relations Liaisons • 2 FTEs report to VP, Marketing & Public Affairs to ensure integration of growth and retention efforts • Each has a territory with a maximum of 300 physicians • Springfield and Northern Region (BJ) • Springfield and Eastern Region (Kevin) • Hand offs to other sales reps (BRL, BRI, BVNA&H, IR&S, HNE, etc) 13 3 Pronged Structure
-
Upload
baystate-health -
Category
Marketing
-
view
261 -
download
1
Transcript of Build Physician Relationships that Drive Business Results; Part 2

1) Physician Relationship Database • Analyst reports to VP, Strategic Planning & Business Development • Provide database training, data reporting and analytics support
2) Office of Physician Referral Management• Director reports to Chief Physician Executive for high-level issue resolution
and 2.0 FTEs responding to calls
3) Physician Relations Liaisons • 2 FTEs report to VP, Marketing & Public Affairs to ensure integration of
growth and retention efforts• Each has a territory with a maximum of 300 physicians
• Springfield and Northern Region (BJ)• Springfield and Eastern Region (Kevin)• Hand offs to other sales reps (BRL, BRI, BVNA&H, IR&S, HNE, etc)
13
3 Pronged Structure

1) Physician Relationship Database
Source: Crimson Market Advantage.
Competitor Hospitals
“Splitters”
PCP/ Referring Physician
Baystate Health
“Loyalist”
1) There is a 4 month lag associated with claims data, due to the timing of when our vendor gets the claims
Network Data MD to MD
Medical claims across all sites of care: professional and facility claims
Updated Quarterly1
Member Data MD to Your Hospital
Physician roster, patient encounters, expected reimbursement, and direct cost data
Updated Monthly
Splitter (Leakage) Data MD to Competitor Hospitals
Primary Hospital-based, IP & OP Claims
Updated Annually1
Roster Data Best-in-class physician roster
State licensure boards, pharmacies, syndicated sources
Updated Quarterly1
BH Vice President Strategic Planning & Business Development
Data Analytics

17
Triage concerns to Identified
“Go To People” For Resolution
Clinical Services
Operation s
Others
“Go To People”
Warm hand off
Pathways for complex patients
2) Office of Physician Referral Management
Issues/Concerns
Issues/ConcernsKey Information
Office of Physician Referral Management
“Always says yes!”
Physician Liaisons
Interfaces with Field Reps
Referrals
CrimsonData
Analytics

3) Physician Relations Liaisons
2 Physician Liaisons Existing Entity-Based
Representatives
Col
labo
ratio
n
ServiceRecovery/
Access LineField
IntelligenceData
Analytics
~ Primary Duties ~• 2.0 FTEs are solution shop
for referring physicians (300 each)
• Spend 70% of time with physicians in the field for growth/ retention
• Ensure thorough understanding, match needs with specialists and clinical services, effectively triage issues/concerns
• Develop relationships with internal stakeholders to further support growth of referrals from physicians, practices
Vice President Marketing & Public Affairs
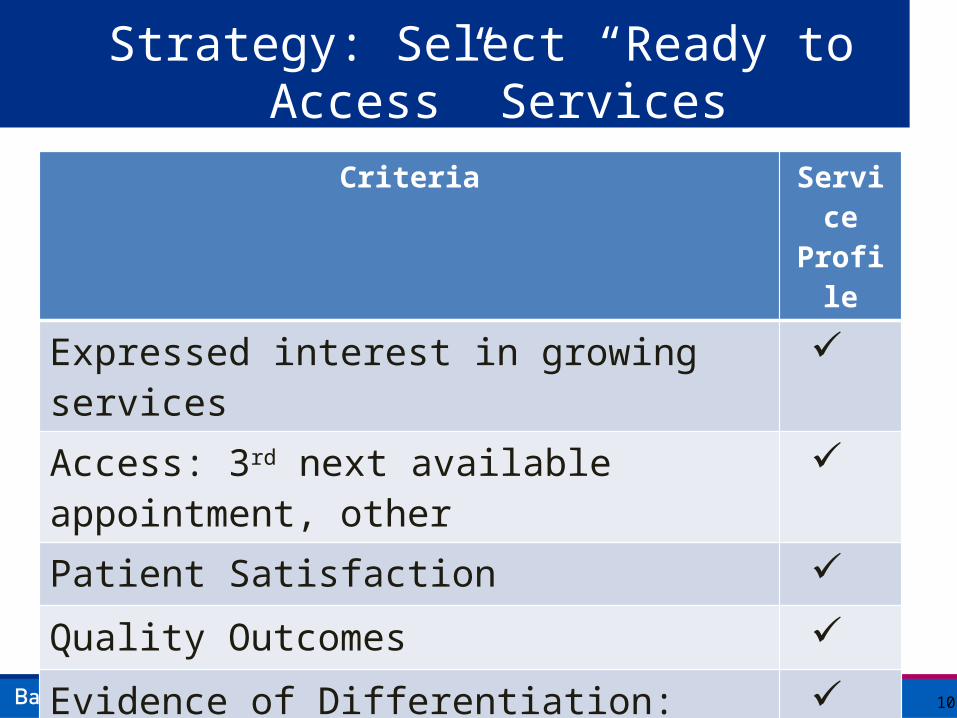
Criteria Service Profile
Expressed interest in growing services Access: 3rd next available appointment, other Patient Satisfaction Quality Outcomes Evidence of Differentiation: e.g., highly skilled/trained providers, state/professional organization recognition or certifications, etc.
Strategy: Select “Ready to Access” Services
10

8 “Ready to Grow” Areas of Focus*• Thoracic Surgery• Colon & Rectal Surgery• Baystate Regional Cancer Program• Oncology Surgery• BH Northampton Outpatient Center• BH East Longmeadow Outpatient Center• Baystate Children’s Specialty Center• Baystate Franklin Wound Center*Expressed interest in growing services, Access: 3rd next available appointment, Patient Satisfaction, Quality Outcomes, Evidence of Differentiation

Clinical & Marketing Partnership
Service Providers/Service Lines agree to: Ensure ongoing operational readiness Collaborate on challenging scheduling requests, issue resolution Collaborate with Physician Liaisons Support messaging Provide quality data
Physician Leaders agree to: Endorse the concept Build awareness of the program Respond to referring physician concerns Meet with providers/referring physicians as needed Join the Physician Liaison staff in the field Assign “Go To People” to serve as contacts for Liaisons
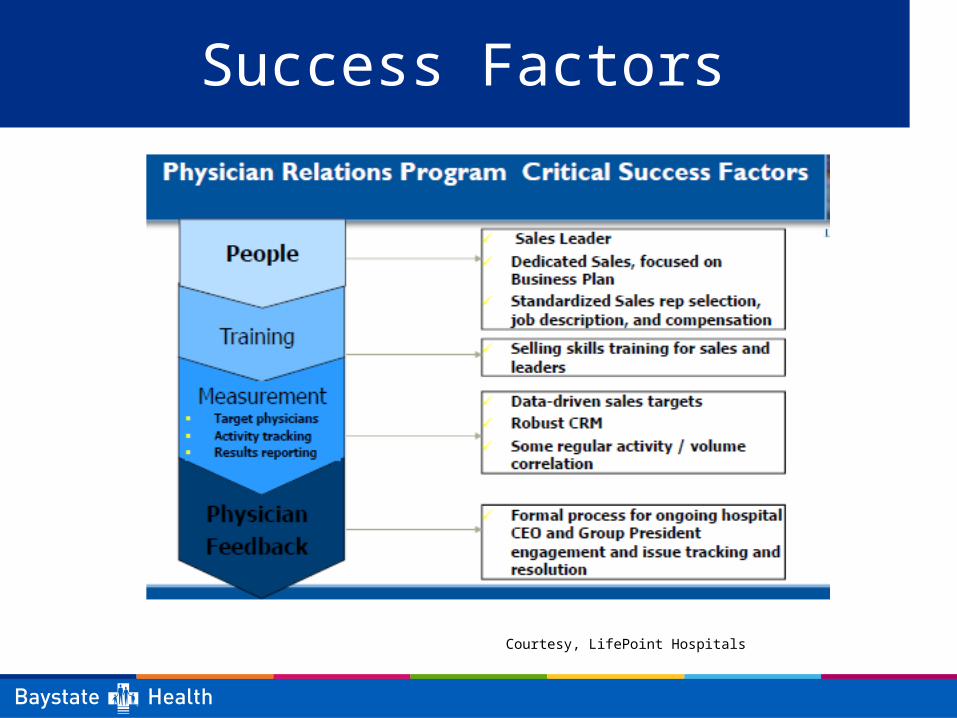
Success Factors
Courtesy, LifePoint Hospitals

Results, Year 1
•Year Over Year (YOY), Physician Liaison Program– +$8M (total adjusted new revenue) Year 1. –Annual budget: $316K; $25 to $1 investment or 2500% ROI
•Other Direct Referral Business • Contacts: 1,400 face to face visits (20+ per week) to 600 referring
physicians/staff by 2 liaisons. • Fill panels of new specialists 50% faster. • “Gold Card” service: since 11/13, 1039 visits have been scheduled for
BMP Specialty Practices, allowing new/urgent patients to be booked 4x sooner, exceeding goal of 14 days.
• Contract and fax numbers updated for 1000 to improve communications.• In Oncology, visits to referring providers increased referrals by over 25%.

10
Measurement: Overview

11
Measurement: Very Specific

Liaison Incentive CompensationFORM B
FY-2015 Variable Compensation Assessment
BJ (Elizabeth) Goodwin
Objective Name: Activity & Volume– Physician Liaison Team (shared with Kevin Garvin) Final Graded Version, S. Hendery, 10/19/15 Goal area: Growth & Financial Stewardship
Complete =
Not Complete = X Comments
Threshold: Activity Metrics
o Face to face meetings with area physicians and referral staff to include at least 15 visits per week.
Average 22.21 Visits per week
Volume Metrics o Increase patient visits to one Top Priority Area (as defined in
Crimson Initiatives) by at least 2% from FY14 baseline.
As of 3Q, BJ helped to increase patient visits by 173 in Medical Oncology (a Top Priority Area) from 2,072 in FY14 to 2,245 in FY15, or an increase of 8.3%, which exceeds the 2% level.
50 points of 50 possible points 50
Target: Activity Metrics
o Face to face meetings with area physicians and referral staff to include at least 18 visits per week.
Average 22.21 Visits per week
Volume Metrics o Increase patient visits to two Top Priority areas (as defined by in
Crimson Initiatives) by at least 2% from FY14 baseline.
As of 3Q, BJ helped to increase patient visits by 672 in Heart & Vascular (a Top Priority Area) from 18,075 in FY14 to 18,747 in FY15, or an increase of 3.71% which exceeds the 2% level.
50 points of 50 possible points 50 Max: Activity Metrics
o Face to face meetings with 5 Physicians and 16 referral staff for a total of 21 visits per week.
Average 22.21 Visits per week
Volume Metrics o Increase patient visits to three or more Top Priority areas (defined
by in Crimson Initiatives) by at least 3% from FY14 baseline.
As of 3Q, BJ helped to increase patient visits by 41 in BH’s Northern Region (a Top Priority Area) from 313 in FY14 to 354 in FY15, or an increase of 40% which exceeds the 2% level.
50 of 50 possible points 50
Overall Rating: 150%

What’s Next?