Build an AM Radio Receiver
12
J OHNS HOPKINS UNIVERSITY,PHYSICS AND A STRONOMY AS.173.116 – ELECTRICITY &MAGNETISM L ABORATORY Build an AM Radio Receiver 1 I NTRODUCTION In this lab we will investigate AM radio and build a simple radio receiver. 2 L EARNING OBJECTIVES At the conclusion of this activity you should be able to: • Describe how an amplitude modulated radio signal works. • Design and build an inductor. • Build an LC resonator circuit. • Build a working AM radio. 3 B ACKGROUND 3.1 F OURIER S ERIES Fourier Series are a mathematical tool that can be used to describe any periodic function[2]. A Fourier series that models a function f (t ) can be written as an infinite sum of sines and cosines: f (t ) ’ a o + a 1 cos(ωt ) + a 2 cos(2ωt ) + ... + b 1 sin(ωt ) + b 2 sin(2ωt ) + ... (3.1) Let’s give a simple example: Suppose the periodic function we want describe is simply f (t ) = sin(ωt ). The Fourier transform then is: sin(ωt ) = 0 + 0 cos(ωt ) + 0 cos(2ωt ) + ... + 1 sin(ωt ) + 0 sin(2ωt ) + 0 sin(3ωt ) + ... (3.2) Notice that the coefficients a n and b n tell us which frequencies are present in the periodic wave. In our trivial example, only b 1 is non-zero. This tells us that the only frequency present in the signal is ω. In this case, the Fourier series is a perfect model of the function. The sine wave and the resulting Fourier transform are shown in Figures 3.1 and 3.2. A more complicated example is a square wave. The Fourier series that models a given square wave is given by: f (t ) square wave = 4 π sin(ωt ) + 4 3π sin(3ωt ) + 4 5π sin(5ωt ) + ... (3.3) The first several terms of the Fourier series of the square wave are shown in Figure 3.3. Revised: Thursday 8 th April, 2021 14:54 ©2014 J. Reid Mumford
Transcript of Build an AM Radio Receiver

JOHNS HOPKINS UNIVERSITY, PHYSICS AND ASTRONOMYAS.173.116 – ELECTRICITY & MAGNETISM LABORATORY
Build an AM Radio Receiver
1 INTRODUCTION
In this lab we will investigate AM radio and build a simple radio receiver.
2 LEARNING OBJECTIVES
At the conclusion of this activity you should be able to:
• Describe how an amplitude modulated radio signal works.
• Design and build an inductor.
• Build an LC resonator circuit.
• Build a working AM radio.
3 BACKGROUND
3.1 FOURIER SERIES
Fourier Series are a mathematical tool that can be used to describe any periodic function[2]. A Fourierseries that models a function f (t ) can be written as an infinite sum of sines and cosines:
f (t ) ' ao +a1 cos(ωt )+a2 cos(2ωt )+ ...+b1 sin(ωt )+b2 sin(2ωt )+ ... (3.1)
Let’s give a simple example: Suppose the periodic function we want describe is simply f (t ) = sin(ωt ).The Fourier transform then is:
sin(ωt ) = 0+0cos(ωt )+0cos(2ωt )+ ...+1sin(ωt )+0sin(2ωt )+0sin(3ωt )+ ... (3.2)
Notice that the coefficients an and bn tell us which frequencies are present in the periodic wave. In ourtrivial example, only b1 is non-zero. This tells us that the only frequency present in the signal isω. In thiscase, the Fourier series is a perfect model of the function.
The sine wave and the resulting Fourier transform are shown in Figures 3.1 and 3.2.
A more complicated example is a square wave. The Fourier series that models a given square wave isgiven by:
f (t )square wave = 4
πsin(ωt )+ 4
3πsin(3ωt )+ 4
5πsin(5ωt )+ ... (3.3)
The first several terms of the Fourier series of the square wave are shown in Figure 3.3.
Revised: Thursday 8th April, 2021 14:54 ©2014 J. Reid Mumford

Figure 3.1: An example of a Fourier series for a sine wave (plotted in black). With only oneterm, the Fourier series is a perfect description of the original sine wave.
Figure 3.2: A plot of the coefficients bn from Equation 3.2 as a function of frequency. Apractical method to produce this type of plot is called a Fast Fourier Transform or FFT.
2
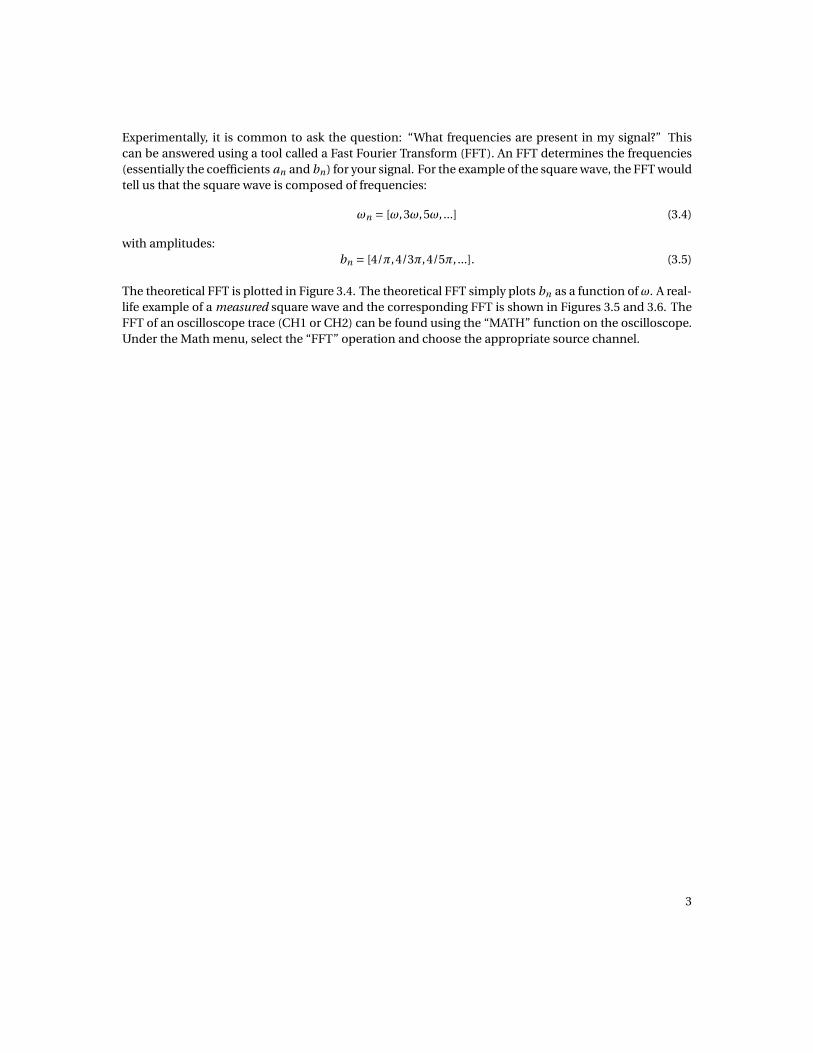
Experimentally, it is common to ask the question: “What frequencies are present in my signal?” Thiscan be answered using a tool called a Fast Fourier Transform (FFT). An FFT determines the frequencies(essentially the coefficients an and bn) for your signal. For the example of the square wave, the FFT wouldtell us that the square wave is composed of frequencies:
ωn = [ω,3ω,5ω, ...] (3.4)
with amplitudes:bn = [4/π,4/3π,4/5π, ...]. (3.5)
The theoretical FFT is plotted in Figure 3.4. The theoretical FFT simply plots bn as a function ofω. A real-life example of a measured square wave and the corresponding FFT is shown in Figures 3.5 and 3.6. TheFFT of an oscilloscope trace (CH1 or CH2) can be found using the “MATH” function on the oscilloscope.Under the Math menu, select the “FFT” operation and choose the appropriate source channel.
3

Figure 3.3: An example of a Fourier series approximation for a square wave (plotted inblack). With only one term, the Fourier series is simply a sine wave. With the additionof more terms, the Fourier series does a better and better job modeling the square wave.
Figure 3.4: A plot of the coefficients bn from Equation 3.3 as a function of frequency. Apractical method to produce this type of plot is called a Fast Fourier Transform or FFT.
4

Figure 3.5: A 1kHz square wave as measured by an oscilloscope.
Figure 3.6: The FFT of the square wave shown in Figure 3.5. The vertical axis indicatesthe relative size of the Fourier coefficients (an and bn). The horizontal axis is frequency.The largest peak is at a frequency of 1kHz. The next peak is at 3kHz, then 5kHz, etc. Onthe oscilloscope, the frequency of each peak can be accurately measured using the cursorfunction.
5

3.2 AMPLITUDE MODULATED (AM) RADIO
Watch this short YouTube video as an introduction to how AM and FM radio signals work. Note that inthis lab we will only be focusing on amplitude modulated (AM) radio signals.
https://www.youtube.com/watch?v=w3M4cqAMWQs
The frequency band for AM radio transmission has been reserved by the Federal Communication Commission[4]to be between 530 kHz and 1700 kHz.
3.3 INDUCTORS
Inductance L is defined as the magnetic flux linkage between loops of a conductor. One specific typeof inductor is a solenoid. The inductance of a solenoid[1] depends on several quantities including: thenumber of turns N , the length l , and the cross-sectional area A.
L(N , l , A)solenoid = µo N 2 A
l. (3.6)
Suppose we want to build a solenoid with a specific inductance L. We will wrap thin wire with diameterd around a cylinder of diameter D (where the wire diameter is much smaller than the cylinder diameter:d ¿ D).
The cross-sectional area of the solenoid is given by:
A =π(
D
2
)2
. (3.7)
If we are careful to wrap the coil tightly so that each of the wire loops are tight and next to one anotheralong the cylinder, the length of the solenoid will be given by the number of turns in the solenoid multi-plied by the wire diameter:
l = N d (3.8)
Combining Equations 3.6, 3.7, and 3.8 we get an expression that is more practical experimentally:
Lsolenoid = µoπN D2
4d(3.9)
The S.I. unit for inductance is the Henry. One Henry is equal to a Tesla-square meter per ampere:
1H = 1T ·m2
A. (3.10)
3.4 TUNING TO A RADIO STATION: LC CIRCUIT AS A RESONATOR
The resonant frequency ωo of an LC circuit is given by:
ωo = 1pLC
. (3.11)
6

Recall that the angular frequency (measured in radians/second) is related to period and frequency (mea-sured in cycles/second or Hertz) by:
ω= 2π
T= 2π f . (3.12)
Chapter 8.1 in your textbook [5] has a nice treatment of an RLC resonator. In particular, see Figure 8.3[6]that shows the relationship between the electric field in the capacitor and the magnetic field in the in-ductor as a function of time.
Tuning to a radio station can be accomplished by adjusting an LC circuit so that it resonates at the samefrequency as the desired radio station.
3.5 DEMODULATING THE AM SIGNAL
Watch this short YouTube video to learn about how an AM radio signal can be demodulated to producean audio signal using a diode.
https://www.youtube.com/watch?v=e_gTCU2fnD8
3.6 CRUDE AM RADIO RECEIVER
The simple radio circuit that we will be building is shown in Figure 3.7. There are three distinct pieces ofthis radio circuit:
1. The Antenna: The antenna is a long piece of wire that is connected to ground. Radio waves in theair induce currents in the wire at many different frequencies at once. The antenna is coupled to theradio circuit by means of a small loop of wire (10-20 turns). Equally important, is that the antennais well grounded.
2. The Resonator: The LC resonator is used to pick out a specific frequency from all of the signalspresent in the antenna. The resonator consists of the inductor LR and variable capacitor CR . Theresonator is tuned by changing the capacitance, CR . The resonator is coupled to the antenna in-ductively where the resonator inductor LR is near the loops of the antenna L A .
3. The Demodulator: The demodulator separates the amplitude modulated signal from the carrierwave to produce sound. The diode only allows currents to flow in one direction. The output fromthe diode is sent to the speaker that converts the electrical oscillations into pressure oscillationsthat we can hear. The signal from this circuit is very faint so an amplified speaker is used to increasethe volume.
For a slightly more advanced circuit, and a nice explanation of what is happening here see Reference [7].
7

Antenna
Ground
LA LR CR
Diode
Speaker
Figure 3.7: A crude AM radio circuit. The antenna is coupled to the radio circuit onlythrough mutual induction between L A and LR . The LC resonator (LR and CR ) is tuned withthe adjustable capacitor CR . The resulting signal is demodulated by the diode and sent outto the speaker to produce sound.
8

4 PROCEDURE
4.1 FIND A RADIO STATION
Long wires have been strung to act as antennas. Using the oscilloscope, look at the Fourier transform(FFT) of the signal on the antenna. The peaks in the FFT indicate AM radio stations that are being re-ceived by the antenna.
4.2 BUILD AN INDUCTOR
For this activity, you have a variable capacitor that can be set between 40 and 220 pF.
Design an inductor LR that will be used to tune to an AM radio station that you found in your FFT. Useyour answers to the Pre-lab and Section 3.3 to help you with this process.
After building your inductor, measure the inductance using an LCR meter to confirm that its inductanceis close to your design specification.
4.3 BUILD AN ANTENNA PICK-UP COIL
Wrap a small coil of wire to act as L A . This coil only needs 10-15 turns. Wrap the antenna coil at one endof your inductor LR . Secure the turns with tape. Again, strip the insulation from the loose ends of thewire so that you can connect to the coil.
Connect one end of the coil to the long antenna wire. Connect the other end to ground.
4.4 BUILD AN AM RADIO RECEIVER
Using your home-made inductor LR , build the circuit shown in Figure 3.7. When you are ready, turn onthe speaker and vary the capacitor to tune. If everything is connected correctly, you should hear somenoise as you vary the capacitance.
Connect an oscilloscope across the speaker. Using an FFT, you should be able to see the resonant fre-quency of the channel you are tuned to. See Figures 4.1 and 4.2.
9

Figure 4.1: The frequency spectrum, measured across the speaker, when the receiver is nottuned to any particular frequency. The dotted-line cursor (Cursor 2) is set to 1260 kHz toprovide a reference frequency. Notice how there are no prominent peaks.
Figure 4.2: The frequency spectrum, measured across the speaker, when the receiver istuned to 1230 kHz. Notice how the FFT shows a large peak. This is indicative of the LCcircuit being driven at resonance.
10
5 LAB NOTEBOOK (IN THE FORM OF A POSTER)Create a poster to summarize and present your work. Your poster should be clean, easy to read, andorganized. Your poster should address the following general ideas in an order that seems the most logicalfor you.
• Poster Design (4 points)
– The poster draws attention to the most important and most interesting pieces of the analysis.
– The poster is well organized and easy to read.
– Relevant information (e.g. your name, your lab partner’s name, date, etc.) is present.
• Data Analysis & Plots (4 points)
– The poster tells a scientific story; it is an accurate record of the work that you did.
– The notebook should show evidence of trial and error. Keep a good record of your work –recording mistakes is useful.
– Final versions of plots should be well formatted and meet the plotting guidelines for thecourse.
– Use models to identify trends that your data exhibit or other apparent relationships betweenyour independent and dependent variables.
• Results and Comparison (4 points)
– Clearly state the final result(s) of your experiment. Remember to quote your result with unitsand appropriate significant digits.
– Final result plots are well formatted and meet the standards described in the Figure Format-ting reference.
– A useful comparison is made to a known/expected value or another similar result.
– Choose the best available tools for your comparison (e.g. plots, pictures, discrepancy, signifi-cance of discrepancy, etc).
• Uncertainty and Error Propagation (4 points)
– Identify the dominant source(s) of error in your experiment.
– Support your conclusions with appropriate error estimates and error propagation calcula-tions.
• Physical Interpretation (4 points)
– Throughout the poster, interpret the data, , and final results in terms of the underlying physics.
– What are you able to conclude from your data? Clearly explain how you arrived at your con-clusions from your experimental observations.
– Reflect on how your experiments connects with the physics concepts you are studying.
11

6 HOW TO CREATE A POSTER
Microsoft Powerpoint makes it easy to create a scientific poster. Here are some general instructions:
1. Open a “Blank Presentation” in Powerpoint.
2. Edit the size of the page using the File Page Setup... menu. Your poster can be either landscape orportrait, but should be 24” x 36”.
3. Your poster will be a single Powerpoint slide. Add text, plots, photographs, equations, etc. to yourposter.
4. When you are finished, save the file as a .PDF using either the File Export... or File Print...Save as PDF... menu options.
5. Printing your poster: The poster can be set to print over multiple pages that can be taped together.This is called “tiled printing”. Be sure to print single-sided pages.
One way to print a large version of your poster uses Adobe’s free Acrobat Reader DC PDF reader:
(a) Use Acrobat Reader DC to open the .PDF file you created using Powerpoint.
(b) Under File Print... , set the “Page Sizing & Handling” to “Poster”.
(c) Adjust the “Tile Scale:” value until the poster is the size that you want. A preview of the printedposter should appear in the Print dialogue box showing the overall size and number of sheetsof paper across which your poster will be tiled.
REFERENCES
[1] Inductance of a Solenoidhttp://hyperphysics.phy-astr.gsu.edu/hbase/electric/indsol.html.
[2] Swartz, Clifford E. Used Math, Englewood Cliffs: AAPT, 1993. See Chapter 14.4, Fourier Series (pp.195-200).
[3] There are several nice online tools for investigating Fourier transforms. A couple of examples are:
• http://www.falstad.com/fourier/
• http://mjtruiz.com/ped/fourier/
[4] Federal Communication Commission Radio Spectrum Allocation page:https://www.fcc.gov/engineering-technology/policy-and-rules-division/general/radio-spectrum-allocationSee also the FCC AM Radio Resources:https://www.fcc.gov/media/radio/broadcast-radio-links#AM
[5] Purcell, E. M., Morin, D. J. (2013) Electricity and Magnetism, 3rd Edition. Cambridge, United King-dom: Cambridge University Press. See Chapter 8.1 (pp. 388-394).
[6] Purcell, E. M., Morin, D. J. (2013) Electricity and Magnetism, 3rd Edition. Cambridge, United King-dom: Cambridge University Press. See page 393.
[7] http://www.netzener.net/index.php/project-articles/15-3-transistor-short-wave-radio
12