Budget Support in Mozambique Final Report Volume I 2014€¦ · Budget Support in Mozambique Final...
218
Independent Evaluation of Budget Support in Mozambique Final Report Volume I 2014 Evaluation jointly managed by the European Commission, the Ministry of Planning and Development of Mozambique, and the evaluation departments of Ireland, Germany, Belgium, Italy, Finland, the Netherlands and France
Transcript of Budget Support in Mozambique Final Report Volume I 2014€¦ · Budget Support in Mozambique Final...

Independent Evaluation of Budget Support in Mozambique
Final Report Volume I 2014
Evaluation jointly managed by the European Commission, the Ministry of Planning and Development of Mozambique, and the evaluation
departments of Ireland, Germany, Belgium, Italy, Finland, the Netherlands and France

ii
Independent Evaluation of Budget Support to Mozambique, 2005 -2012

iii
Independent Evaluation of Budget Support to Mozambique, 2005 -2012
Evaluation Team Andrew Lawson Team Leader Ann Bartholomew Deputy Team Leader
Mariam Bibi PFM Specialist
Hermes Sueia Agriculture Specialist
Padil Salimo Governance Specialist
Tim Cammack Health Specialist Muriel Visser Education Specialist
Andy McKay Senior Econometrician
Giulia Mascagni Econometrician
Edgar Salgado Econometrician
Gonzalo Contreras Economist/Statistician Giorgia Giambi Research Assistant
Evildo Semo Research Assistant
Tim Ruffer Quality Assurance/Project Manager
Karolyn Thunnissen Quality Assurance
Jodie Ellis Project Officer

iv
Independent Evaluation of Budget Support to Mozambique, 2005 -2012
Table of Contents
FIGURES ........................................................................................................................................................................ VI TABLES ......................................................................................................................................................................... VII TEXT BOXES................................................................................................................................................................ VIII ACRONYMS AND ABBREVIATIONS .............................................................................................................................. X
EXECUTIVE SUMMARY..................................................................................................... XIII 1. INTRODUCTION .......................................................................................................... 21
1.1. SCOPE AND OBJECTIVES OF THE EVALUATION........................................................................................... 21 1.2. THE EVALUATION FRAMEWORK AND PROCESS ......................................................................................... 23 1.3. EVALUATION QUESTIONS ............................................................................................................................. 27 1.4. STRUCTURE OF THE REPORT ........................................................................................................................ 30
2. THE CONTEXT FOR BUDGET SUPPORT IN MOZAMBIQUE: HELP OR HINDRANCE? . 32 2.1. THE EVOLVING SOCIO-ECONOMIC CONTEXT OF MOZAMBIQUE .............................................................. 32 2.2. THE EVOLVING FRAMEWORK OF DEMOCRATIC ACCOUNTABILITY ............................................................ 38 2.3. FLUCTUATIONS IN THE POLICIES, PRIORITIES AND ATTITUDES OF THE DEVELOPMENT PARTNERS ....... 45 2.4. IMPLICATIONS FOR THE EVALUATION AND FOR FUTURE BUDGET SUPPORT ........................................... 47
3. PROVIDING THE MEANS TO IMPLEMENT POLICY: BUDGET SUPPORT INPUTS AND DIRECT OUTPUTS ............................................................................................................... 51
3.1. SCALE & PREDICTABILITY OF BUDGET SUPPORT, AND ITS EFFECTS ON AGGREGATE AID FLOWS ......... 52 3.2. INFLUENCE OF BUDGET SUPPORT ON POLICY DIALOGUE PROCESSES ..................................................... 63 3.3. CONTRIBUTIONS TO CAPACITY BUILDING ................................................................................................... 80 3.4. ADAPTING THE BUDGET SUPPORT DESIGN TO THE CHANGING CONTEXT............................................... 83
4. FACILITATING IMPROVEMENTS IN GOVERNMENT POLICIES: INDUCED OUTPUTS OF BUDGET SUPPORT ............................................................................................................. 95
4.1. MACROECONOMIC MANAGEMENT & REVENUE GENERATION ................................................................. 95 4.2. THE QUALITY OF PUBLIC FINANCIAL MANAGEMENT .............................................................................. 105 4.3. CHANGES IN THE COMPOSITION OF PUBLIC SPENDING .......................................................................... 115 4.4. CHANGES INDUCED IN SECTORAL POLICIES .............................................................................................. 123 4.5. GOVERNANCE AND THE FIGHT AGAINST CORRUPTION .......................................................................... 138
5. GROWTH & POVERTY REDUCTION .......................................................................... 153 5.1. GROWTH DATA AND TRENDS BY ECONOMIC SECTOR AND PROVINCE .................................................. 153 5.2. TRENDS IN CONSUMPTION POVERTY BY PROVINCE ................................................................................ 158 5.3. CONCLUSIONS ON INCOME POVERTY IN MOZAMBIQUE ....................................................................... 161 5.4. TRENDS IN NON-INCOME POVERTY .......................................................................................................... 162 5.5. CONCLUSIONS ON GROWTH & POVERTY IN MOZAMBIQUE................................................................. 167
6. AGRICULTURAL SECTOR OUTCOMES AND THEIR DETERMINANTS ....................... 169 6.1. TRENDS IN AGRICULTURAL PERFORMANCE .............................................................................................. 169 6.2. REGRESSION ANALYSIS: PRODUCTIVITY AND INPUT USE ......................................................................... 174 6.3. CONCLUSIONS ON DETERMINANTS OF AGRICULTURAL PRODUCTIVITY................................................. 177

v
Independent Evaluation of Budget Support to Mozambique, 2005 -2012 7. EDUCATION SECTOR OUTCOMES AND THEIR DETERMINANTS ............................. 178
7.1. OVERVIEW OF ENROLMENT & OTHER KEY DATA ..................................................................................... 178 7.2. ANALYSIS OF THE DETERMINANTS OF EDUCATIONAL OUTCOMES ......................................................... 184 7.3. CONCLUSIONS: KEY DETERMINANTS OF EDUCATION OUTCOMES .......................................................... 190
8. CONCLUSIONS AND RECOMMENDATIONS ............................................................. 192 8.1. OVERALL FINDINGS ..................................................................................................................................... 192 8.2. STEP THREE: CONCLUSIONS ON IMPACT OF BUDGET SUPPORT............................................................ 201 8.3. RECOMMENDATIONS .................................................................................................................................. 208

vi
Independent Evaluation of Budget Support to Mozambique, 2005 -2012
ANNEXES (IN VOLUME 2) ANNEX 1: SUMMARY OF BUDGET SUPPORT OPERATIONS EVALUATED ANNEX 2: SUMMARY OF RESPONSES TO EVALUATION QUESTIONS AND CORRESPONDING DATA SOURCES ANNEX 3: DATA TABLES ON AID, FISCAL FLOWS AND PUBLIC EXPENDITURES ANNEX 4: BIBLIOGRAPHY ANNEX 5: PEOPLE MET
Figures
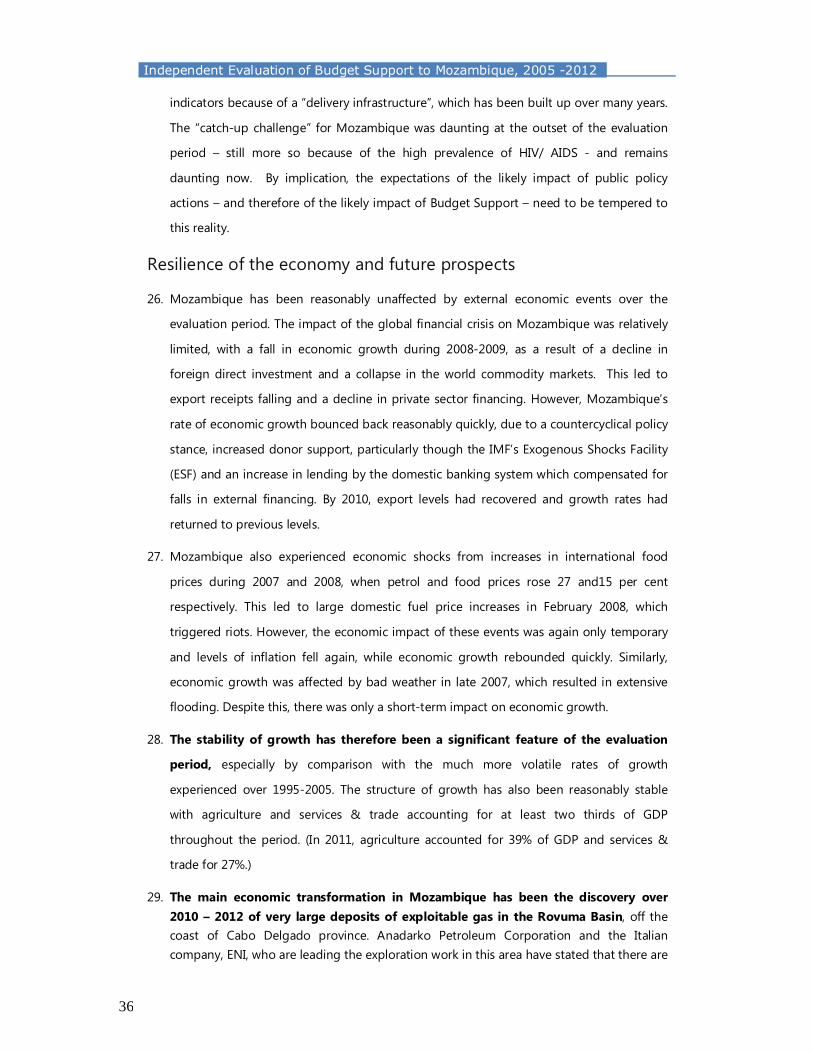
Figure 1: The 5 levels and the 3 Steps of the Evaluation methodology .............................................. 25 Figure 2: Budget Support Intervention Logic in Mozambique and proposed Evaluation Questions...................................................................................................................................................................... 26 Figure 3: Map of Mozambique ............................................................................................................................ 31 Figure 4: Real GDP for Mozambique in comparison with other ‘frontier economies’ .................. 34 Figure 5: Voter turn-out and invalid votes in Mozambique & neighbouring countries ............... 42 Figure 6: Importance in public spending of Budget Support and other aid modalities.............. 54 Figure 7: Actual annual disbursements as a percentage of the planned disbursements: Overall predictability of aid (left); Individual detail for each modality (right)................................................... 55 Figure 8: The “lost” expenditure due to low execution rates of Common Basket Funds and externally financed Projects .................................................................................................................................. 56 Figure 9: Budget support disbursements “front-loaded” in the first two quarters........................ 56 Figure 10: Differences between scheduled & actual GBS disbursements by Quarter (Millions of MZM) .............................................................................................................................................................................. 57 Figure 11: Results of PAPs’ indicators within the PAF over 2005 – 2012 ........................................... 60 Figure 12: Aggregate assessment of PAPs’ performance indicators, 2005-212 ............................... 60 Figure 13: Budget Support Coordination and Dialogue Mechanisms ................................................. 64 Figure 14: Performance of Government PAF indicators, 2005 - 2012 .................................................. 68 Figure 15: Performance of Government PAF indicators by sector/ theme ........................................ 69 Figure 16: Assessment of Performance to determine EU MDG tranche for 2012-2014 ............... 89 Figure 17: Revenue Collections 2006-2012 (% of GDP) ............................................................................. 96 Figure 18: Mozambique : Coal and LNG Contribution to Fiscal Revenue, 2011-2032 .................. 97 Figure 19: Consumer Price Index 2000-2012, compared with SSA and frontier economies..... 100 Figure 20: Global Competitiveness, 2012-2013: Mozambique & neighbouring countries ....... 101 Figure 21: Comparison of PEFA Scores for Mozambique - 2006, 2008 and 2010 ........................ 111 Figure 22: The contribution of Budget Support to the funding of discretionary spending ...... 118 Figure 23: Actual allocations to priority sectors compared with estimated allocations of Domestic Revenue, showing the funding gap filled by Budget Support (MZM Trillions) ......... 121 Figure 24: Estimates of Per Capita Health spending by Province, 2010 in Meticais ..................... 133 Figure 25: Allocations to Tribunal Administrativo compared with estimated allocation of Domestic Revenue, showing the funding gap filled by Budget Support (MZM Trillions) ......... 145 Figure 26: Allocations to Good Governance compared with estimated allocation of Domestic Revenue, showing the funding gap filled by Budget Support (MZM Trillions) .............................. 149 Figure 27: Good Governance indicators in the PAF (left) and overall performance (right) ....... 150

vii
Independent Evaluation of Budget Support to Mozambique, 2005 -2012
Figure 28: GDP growth (constant prices) ....................................................................................................... 154 Figure 29: Growth in selected sectors ............................................................................................................. 154 Figure 30: Growth incidence curve at the national level, 2002/03 – 2008/09 ................................. 160 Figure 31: Trends in median agricultural productivity, 2002-08........................................................... 170 Figure 32: Regional pattern in Primary and Secondary Enrolment rates, 2008/09 ....................... 180 Figure 33: Primary and Secondary Net Enrolment rates by sex and by year, 1997 - 2009 ........ 181 Figure 34: Extent of training of teachers in Primary Education, 2004 - 2012 .................................. 183 Figure 35: Index of availability of books per pupil in Primary schools, 2004=1.00 ..................... 184 Figure 36: Classroom construction material; Primary Schools, 2004-2012 ...................................... 184 Figure 37: Step Three – Summary of analysis of aggregate impact of Budget Support in Mozambique ............................................................................................................................................................. 203 Figure 38: Diagrammatic Overview of Budget Support impacts and transmission mechanisms in Mozambique ........................................................................................................................................................ 204
Tables
Table 1: Criteria for ranking of quality of Evidence for each Evaluation Question ......................... 27 Table 2: Economic & Social Indicators for Mozambique and Tanzania, 2005 and 2012 .............. 34 Table 3: Parliamentary Election results 1994 – 2009 (% of valid votes cast) ..................................... 39 Table 4: Voter turn-out and invalid votes cast in Mozambique & neighbouring countries ....... 41 Table 5: Indicators of Political Openness and Perceptions of Corruption, 2005 & 2012 ............. 43 Table 6: Worldwide Governance Indicators for Voice & Accountability, 2006 & 2012................. 44 Table 7: Budget Support Disbursements by Development Partner, 2004 - 2012 ........................... 52 Table 8: Disbursements of Budget Support and their significance ....................................................... 53 Table 9: Trends reported in use of Country systems: Paris Declaration Monitoring Surveys and indicators in PAPs’ Performance Assessment Framework ........................................................................ 59 Table 10: Trends in PAPs performance indicators related to aid transaction costs ........................ 63 Table 11: Pillars & Working Groups for PARPA/ Budget Support monitoring, 2004-2009 ......... 65 Table 12: PARP/ Budget Support Working group structure 2011-2014 ............................................. 66 Table 13: Total numbers of PAF indicators per year by Sector/ Thematic Area ............................... 67 Table 14: Variable tranche disbursements, 2012 - 2014 ............................................................................ 86 Table 15: Minerals Sector Fiscal Frameworks for Mozambique & competing countries ............. 97 Table 16: Overview of Central Government Fiscal Operations 2005-2012 (% of GDP) ................. 98 Table 17: Real effective exchange rate and Budget Support receipts (2005-2011): ................... 103 Table 18: Summary of PFM annual performance assessments in the Annual Reviews ............... 106 Table 19: Key Events & Developments in PFM (including the IFMIS) ................................................ 107 Table 20: Composition of Budget Funding (excluding non-concessional borrowing) ................ 118 Table 21: Evolution of Spending within Priority Sectors during evaluation period ..................... 119 Table 22: Government Budget Allocations to the Agricultural Sector, 2005-2012 ....................... 126 Table 23: Aggregate Health spending by source of funds, 2005 and 2011..................................... 134 Table 24: Legislative scrutiny of the Budget - PEFA scores, 2006 - 2011.......................................... 138 Table 25: Legislative Scrutiny of Audit Reports - PEFA scores, 2006 - 2011.................................... 141 Table 26: Scope, nature & follow-up of External Audit - PEFA scores, 2006 - 2011 ................... 143

viii
Independent Evaluation of Budget Support to Mozambique, 2005 -2012
Table 27: Audit Performance of the Tribunal Administrativo, 2003 -2013 ....................................... 144 Table 28 : Processing of Corruption Cases & Cases of Misuse of State Funds or Property: 2005-2012 .............................................................................................................................................................................. 148 Table 29: Performance and relevance of PAF indicators for Governance, 2005 -2012 ............... 151 Table 30: Average growth in macro-sectors at the national level ....................................................... 155 Table 31: Mozambique - Average growth rates by province ................................................................ 156 Table 32: Consumption, GDP and agriculture growth between survey years ................................. 157 Table 33: Percentage Changes in poverty headcount (P0), poverty gap (P1) and squared poverty gap (P2), 1996/97 – 2008/ 09 ............................................................................................................ 158 Table 34: Growth-redistribution decomposition of changes in poverty from 2002/03 to 2008/09 ....................................................................................................................................................................... 160 Table 35: Rate of pro-poor growth by Province, 2002/03 – 2008/09................................................. 161 Table 36: Percentage of households owning durable goods, 2002/ 03 and 2008/ 09 ............... 163 Table 37: Percentage of Households with Housing, sanitation and electricity .............................. 164 Table 38: Literacy rates (percentage of 15-30 age group) and Education (percentage of children attending school at right age), 2002/ 03 and 2008/ 09 ......................................................... 164 Table 39: Child malnutrition (% of children two standard deviations from WHO international reference value) ....................................................................................................................................................... 165 Table 40: Median Area cultivated in Hectares ............................................................................................. 172 Table 41: Percentage of farmers using different inputs ........................................................................... 172 Table 42: Proportion of output sold, by crop type and year ................................................................. 172 Table 43: Use of improved seeds and fertilizer and impact on productivity ................................... 173 Table 44: Productivity and use of inputs by productivity percentile .................................................. 174 Table 45: Regression Analysis for determinants of productivity at the farm level ........................ 174 Table 46: Regression Analysis of determinants of Productivity and Input use at the Community level ............................................................................................................................................................................... 175 Table 47: Quantile regression for correlates of total productivity in crop cultivation ................. 176 Table 48: Key indicators for primary and secondary education in Mozambique, 2004-12 ....... 182 Table 49: Results for absolute enrolment ...................................................................................................... 185 Table 50: Results for Progression Rates ......................................................................................................... 186 Table 51: Results for Repetition ......................................................................................................................... 188 Table 52: Results for approval into Secondary School ............................................................................. 189 Text Boxes
Box 1 Evaluation Questions ................................................................................................................................. 29 Box 2: Stakeholder’s feedback on the Incentive effects of Variable Tranches................................. 88 Box 3: Why PROSAUDE is not SBS and how GBS/ SBS could be diferent ....................................... 207

ix
Independent Evaluation of Budget Support to Mozambique, 2005 -2012
This Report and Annexes (Volume 2) will be published on the EuropeAid webiste and will be accesible at the following page: http://ec.europa.eu/europeaid/how/evaluation/evaluation_reports/reports_by_year_en.htm
It will also be available on the Itad website at the following address: http://itad.com/knowledge-and-resources/reports/

x
Independent Evaluation of Budget Support to Mozambique, 2005 -2012
Acronyms and Abbreviations
ADE Apoio Direito as Escolas Direct Grants to Schools
AFDB African Development Bank APRM Africa Peer Review Mechanism
AR National Assembly Assembleia da República
ATM Autoridade Tributária de Moçambique Mozambique Tax Authority
CAADP Comprehensive Africa Agriculture Development Programme
CEDSIF Centro de Desenvolvimento de Sistemas de Informação de Finanças Centre for Development of IT Finance Systems
CESC Centro de Aprendizagem e Capacitação da Sociedade Civil Centre for Civil Society Learning & Capacity-building
CGE Conta Geral do Estado General State Accounts
CIP Centro de Integridade Publica Centre for Public Integrity
CPD Centro de Processamento de Dados Data Processing Centre
CPO Comissão Parlamentar do Plano e Orçamento Parliamentary Commission for Planning & the Budget
CRS Creditor Reporting System (OECD-DAC)
CUT Conta Única do Tesouro Single Treasury Account
DAC Development Assistance Committee (of OECD) Comité de Assistência ao Desenvolvimento (da OCDE)
DAF Directorate of Administration and Finance (in line ministries) Direcção de Administração e Finanças
DNCP Direcção Nacional de Contabilidade Pública National Directorate of Public Accounts
DNIC Direcção Nacional de Investimento e Cooperação National Directorate of Investment and Cooperation
DNO Direcção Nacional do Orçamento National Budget Directorate
DNT Direcção Nacional do Tesouro National Treasury Directorate
DPs Development Partners
EC European Commission Comissão Europeia
EMATUM Empresa Moçambicana de Atum Mozambican Tuna Company
EQs Evaluation Questions
FASE Fundo de Apoio ao Sector de Educação Education Sector Support Fund
FDI Foreign Direct Investment
FRELIMO Frente de Libertação de Moçambique Mozambique Liberation Front

xi
Independent Evaluation of Budget Support to Mozambique, 2005 -2012
G-19 Group of General Budget Support Donors Grupo de Doadores de Apoio Directo ao Orçamento
GBS General Budget Support Apoio Geral ao Orçamento
GCCC Gabinete Central de Combate a Corrupção Central Office for Combating of Corruption
GDP Gross Domestic Product
GFS Government Financial Statistics Estatísticas Financeiras do Governo
GoM Government of Mozambique Governo de Moçambique
IAF Inquérito aos Agregados Familiares Household Survey
IESE Instituto de Estudos Sociais e Económicos Institute of Social and Economic Studies
IMF International Monetary Fund Fundo Monetário Internacional
IOF Inquérito ao Orçamento Familiar Household Budget Survey
JAR Joint Annual Review Revisão Conjunta
LNG Liquefied Natural Gas
MDA Ministries, Departments and Agencies (Budget-holding entities) Ministérios, Departamentos e Instituições
MDM Democratic Movement of Mozambique (political party) Movimento Democrático de Moçambique
MEC Ministry of Education and Culture Ministério de Educação e Cultura
MISAU Ministry of Health Ministério da Saúde
MoF Ministry of Finance Ministério das Finanças
MoU Memorandum of Understanding Memorando de Entendimento
MPD Ministry of Plan and Development Ministério do Plano e Desenvolvimento
MTFF Medium-Term Fiscal Framework Cenário Fiscal de Médio Prazo
ODAMOZ Official Development Assistance – Mozambique (Database in MPD)
OECD Organisation for Economic Co-operation and Development Organização para a Cooperação Económica e Desenvolvimento
O(G)E (General) State Budget Orçamento (Geral) do Estado
PAF Performance Assessment Framework Quadro de Avaliação de Desempenho
PAPs Programme Aid Partners Parceiros Ajuda aos Programas
PARPA Plan for the Reduction of Absolute Poverty

xii
Independent Evaluation of Budget Support to Mozambique, 2005 -2012
Plano de Acção para a Redução da Pobreza Absoluta
PARP Plan for the Reduction of Poverty Plano de Acção para a Redução da Pobreza
PEFA Public Expenditure and Financial Accountability Despesa Pública e Contabilidade Financeira
PER Public Expenditure Review Revisão das Despesas Públicas
PESS Sectoral Social and Economic Plan Plano Económico e Social Sectorial
PES Social and Economic Plan Plano Económico e Social
PNISA Programa Nacional de Investimento do Sector Agrário National Agriculture Sector Investment Plan
PFM Public Finance Management Gestão das Finanças Públicas
PRSC Poverty Reduction Support Credit (World Bank) Crédito para Apoio à Redução da Pobreza (Banco Mundial)
RENAMO Resistência Nacional Moçambicana Mozambican National Resistance
SAI Supreme Audit Institution Instituição de Auditoria Suprema
SBS Sector Budget Support
SISTAFE Sistema de Administração Financeira do Estado State Financial Administration System
SSA Sub-Saharan Africa
SWAP Sector-Wide Approach Programme Programa de Abordagem dos Sectores
TA Mozambique Supreme Audit Institution / Administrative Court Tribunal Administrativo
TIA Trabalho de Inquérito Agrícola Agriculture Survey
TNPA Third National Poverty Assessment
WB World Bank Banco Mundial

xiii
Independent Evaluation of Budget Support to Mozambique, 2005 -2012
Executive Summary This study has evaluated all of the Budget Support operations undertaken in Mozambique
from 2005 to 2012. These operations amount to a resource transfer of US $ 3,354 million - an
annual average disbursement in excess of US $ 400 million, some $16 per annum per head of
the Mozambican population, provided by 19 Development Partners.
In evaluating these operations, our study has addressed three questions:
i. How successful has Budget Support been in providing the means to the
Government of Mozambique to implement its national and sectoral
strategies?
ii. How successful has Budget Support been in facilitating improvements in the
efficiency and effectiveness of these national and sectoral strategies?
iii. As a consequence, how successful has Budget Support been in attaining
successful outcomes and impacts on growth and poverty reduction?
Overview of Findings
The primary contribution of Budget support has been in the form of increased funding.
In relation to financial inputs, Budget Support inputs have been important and
efficiently delivered. Disbursements during the 8-year evaluation period were substantial
both in fiscal terms – where they represented on average 15 % of public spending, and as a
proportion of total ODA, where they comprised an average of 30 %. Annual predictability of
budget support has been significantly better than other other aid modalities. The objectives of
in-year predictability and of “front-loading” of disbursements were also largely fulfilled during
the evaluation period.
Budget Support is no longer exerting a significant influence on the overall effectiveness
of aid. In the early years of the evaluation period and in the preceding years, the Budget
Support process was instrumental in generating support for aid effectiveness principles. A key
aspect of this was the commitment by the Programme Aid Partners to monitor their own
performance through the PAPs’ Performance Assessment Framework, which was widely
heralded as major step towards mutual accountability and highly valued by the Government
of Mozambique. However, since 2009, performance against these indicators has plummeted.
A firm renewal of the commitment to these objectives and a re-investment by the

xiv
Independent Evaluation of Budget Support to Mozambique, 2005 -2012
Government of Mozambique and its Development Partners in the aid effectiveness principles,
will be required for performance to improve again.
The inputs provided by the four common funds supporting PFM & Governance
functions, alongside funding lines linked more directly to Budget Support operations,
amounted to a significant TA/ capacity-building input within the Budget Support
package. Government stakeholders were positive in their appreciation of these inputs, both
with regard to their relevance and the relative efficiency with which they were provided.
Moreover, there is evidence that these inputs facilitated the production of the “induced
outputs” targeted by Budget Support, notably with regard to PFM reforms and the
strengthening of the capacities of the Autoridade Tributária de Moçambique (ATM), the
Tribunal Administrativo and the Inspeção Geral de Finanças.
Budget Support has supported the creation of an effective structure for dialogue, based
upon the definition of policy targets and a framework of annual monitoring, comprising sector
reviews and a national level policy dialogue..
The Government Performance Assessment Framework (PAF) fulfils its intended purpose
reasonably effectively and compares well with the PAFs used in other Budget Support
recipient countries. It provides a relatively strategic set of measureable targets, which have
worked as a focus for dialogue. The number of targets is broadly appropriate and the process
of assessment does not entail excessive transaction costs. However, the PAF has inherent
limitations, and requires complementary frameworks in order to work effectively: these
complementary dialogue frameworks are in need of further development.
The main structural weakness of the policy dialogue process lies precisely within the
policy development process, which should be situated at the sector and thematic level.
There are several problems of strategic importance to the PARP agenda – such as low
productivity in agriculture, high levels of malnutrition, a poor enabling environment for doing
business - where effective policy responses have not been generated. GBS has had only a
limited influence on policy development processes at this level
Through its funding contribution, Budget Support had an important influence on
macroeconomic management. Good macroeconomic management, combined with
increased allocations to the priority sectors, allowed Budget Support to have an important
influence on overall growth. GDP growth remained high throughout the evaluation period,
averaging 7.3 % annual growth.

xv
Independent Evaluation of Budget Support to Mozambique, 2005 -2012
Budget Support funds have enabled the government to increase development spending
without recourse to domestic borrowing, and in this way has supported economic
growth. Budget Support facilitated an expansion in domestically financed development
spending from 3.2 % of GDP in 2005 to 6.1 % in 2012. By avoiding recourse to borrowing, the
Government restrained its demands on the domestic banking sector and facilitated the
increase in the ratio of private sector credit to GDP.
Total spending on the priority sectors designated in PARPA & PARP has more than
quadrupled in nominal Meticais terms over the evaluation period, increasing by slightly
more than 7 percentage points of GDP. As a percentage of total expenditure, these priority
sectors have increased their share from 61 % to just over 67 % of total spending.
The major contribution of GBS funding has been to support the expansion of public
spending in the education and good governance sectors, alongside a lesser contribution
to the agriculture sector. We draw this conclusion from an analysis of trends in funding
sources and sector expenditure shares, making assumptions that reflect the processes of
budgetary negotiation and decision-making in Mozambique.
There has been continued progress made in PFM reform and, to a lesser extent, in
governance. The fact that PFM reform and improvements in governance, especially the fight
against corruption, were systematically discussed and reviewed on an annual basis through
the Budget Support dialogue is likely to have been moderately important to the continued
progress made in these areas.
There is strong evidence that the combination of GBS funding through the budget with
targeted support to institutions of accountability such as the NAO, the Parliament, CSOs
and the media has created more transparency. Targeted support through common funds
has been fundamental to this achievement but Good Governance is one of two sectors that
appear as the primary beneficiaries of Budget Support funds
Education was designated as a ‘priority sector’ in PARPA/ PARP and has throughout the
evaluation period commanded the highest share of the national budget. This has permitted
dramatic improvements in education provision during the evaluation period:
§ The net enrolment rate at the primary level in 2008/09 was 75.7%, markedly
higher than the corresponding rates in 1996/97 (42.4%) and 2002/2003 (65.9%).
40 % more children were in school in 2012 in comparison with 2004.

xvi
Independent Evaluation of Budget Support to Mozambique, 2005 -2012
§ The largest gains in the observed increase in primary enrolment were for poorer
households.
§ 17.3% of children of the relevant age group were in secondary education in
2008/09, compared with a rate of 3.1% in 1996/97 and 6.1% in 2002/03. Pupil
numbers were 65 % higher in 2012 as compared with 2004.
§ In terms of provincial trends, progress was made across all provinces both in
primary and secondary enrolment.
§ The primary enrolment rate for boys in 2008/9 was only 4% higher than for girls,
indicating a small and gradually reducing gender gap at this level of schooling,
although at secondary level the gender gap is much larger, at 40%.
Funding through Budget Support has played a key role in funding the expansion of the
education sector. The expanded levels of provision could not have been financed in the
absence of General Budget Support. Funding through the FASE common basket funding also
contributed, and FASE processes were instrumantal in setting the policy framework for this
expansion.
Our overall conclusion is that Budget Support has been fundamentally successful. It has
made possible a major expansion in education provision, whilst also supporting economic
growth and macroeconomic stability and facilitating steady improvements in the quality of
public financial management and, to a lesser extent, in governance.. These are major
achievements, which fully justify the risks which have been taken in providing Budget Support.
These are still more impressive if one considers the difficult context for Budget Support in
Mozambique.
Recommendations
The challenge for Mozambique and its Development Partners is to find ways of
achieving more with Budget Support in the future – in particular to find ways of making a
greater impact on poverty. There has been no statistically significant change in poverty
between the early and the late 2000s, with 54.1% of the population reported below the
poverty line in 2003 and 54.7% in 2009, according to the official poverty figures.
With this as the overarching goal, we make a set of recommendations for the joint
consideration of the Mozambican authorities and its Development Partners. These
recommendations need further refinement and development: their implementation will
therefore require a shared dialogue between the Mozambican Authorities and the G-19, in

xvii
Independent Evaluation of Budget Support to Mozambique, 2005 -2012
which analysis and ideas are exchanged and a set of concrete actions is agreed and
implemented. We recommend that this dialogue, and the resulting action plan, should be
clustered around four objectives:
§ Renewing the commitment to the Budget Support process and the related
aid effectiveness agenda based upon realistic expectations not only of what it
may achieve but also of the investment of time and effort, which is required to
make it work.
§ Revitalising the Budget Support policy dialogue, establishing a more
streamlined central process for assessing and reviewing performance, and
creating a stronger framework for sectoral policy analysis and dialogue, aimed at
stimulating good policy ideas and actions in the areas where they are currently
lacking.
§ Consolidating the progress achieved in education, in macroeconomic
management, in PFM reform and in the improvement of transparency and
accountability.
§ Focussing attention on poverty reduction through targeted programmes to
reduce the incidence of childhood malnutrition, increase the access of small
farmers to fertiliser and other inputs, and to create a conducive climate for
business and employment growth.
Renewing the commitment to the Budget Support process
Within this objective, the basic goal would be to first stop and then reverse the
disinvestment in the Budget Support process, identified by so many stakeholders in
Mozambique. A potential way forward to obtain a renewal of the political commitment to
Budget Support by the GoM and the G-19 members would be a structured campaign at the
technical level by the GoM and the G-19 to present a more realistic message to their political
leaders and supporting constituencies about what Budget Support can and cannot achieve.
An obvious problem in the past has been that the expectations held for Budget Support have
been unrealistically high. What Budget Support can do is firstly to provide funding for areas,
which are clear shared priorities and where tried and tested service delivery strategies exist –
such as expansion of education coverage and quality – and secondly to support and guide
those institutional reforms for which there is a government commitment.

xviii
Independent Evaluation of Budget Support to Mozambique, 2005 -2012
Awareness also needs to be re-established regarding the commitments which Budget Support
entails both for GoM – in terms of transparency, exchange of information, an openness to
dialogue – and for the G-19 – in terms of a commitment to predictable funding, to
consistency in expectations, consistency in the treatment of problems, and to aid effectiveness
principles. The on-going revision of the MoU for Budget Support provides an excellent
opportunity to lay down common rules, regulations and procedures more carefully.
As a part of this process, there will also need to be a commitment – and a related set of
actions – to revitalise the processes of coordination across the G-19. The evaluation team
were unable to determine why there has been deterioration in the quality of coordination
across the G-19. An internal examination of the reasons for the deterioration in the
effectiveness of coordination is therefore recommended, based on a participatory process –
potentially managed by an external facilitator.
Revitalising the Policy Dialogue process
Policy dialogue lies at the heart of Budget Support. It is essential that it should be
structured to be strategic, problem-solving and efficient. At present, the combined
structure of central-level, sectoral and thematic groups within the dialogue structure is not
achieving these three objectives as effectively as it might. Again, we would recommend an
internally led, participatory diagnostic process, focused at two levels:
§ At the sectoral level, mechanisms need to be found to support effective
processes of research, debate and policy development. These mechanisms
need to be structured so as to strengthen policy development processes in the
strategic areas, where they appear to be weak – such as in the design and
implementation of agricultural policy. A structured, multi-annual programme of
research and evaluation guided through the Budget Support process should
probably be created as part of this mechanism. In addition, some facility could be
created for bringing into problematic sectors external facilitators, who might help
to bring a greater problem-focus into debate. Tanzania’s “Big Fast Results”
initiative, led by the President’s Office provides a good example of such a facility.
§ At the central level, efforts need to be made to streamline processes and
increase efficiency. Attention should be given to correcting the three areas of
inefficiency in the current arrangements, which relate to (i) the annual review
framework created to mirror the PARP structure, which has inadvertently
introduced new transaction costs and over-complicated the dialogue structures;

xix
Independent Evaluation of Budget Support to Mozambique, 2005 -2012
(ii) the continued lack of precision in the definition of underlying principles and
the methods to be used to assess and monitor them; and (iii) the size of the PAPs’
PAF and the overly ambitious targets established in the recent past for these
indicators..
Consolidating gains
Continued attention must be given to the success areas identified by this evaluation, while
adapting to the new challenges with regard to macroeconomic management, PFM reform,
governance and education.
§ For macroeconomic management, it will mean greater attention to the framework
for investment selection and management and to the creation of the legal and
institutional framework for managing future revenues from the extractive
industries.
§ In relation to governance, the challenge is to convert gains in transparency into
tangible gains in accountability.
§ For PFM reform, the challenge is both to strengthen the design of the PFM
Reform Vision and to reinforce the institutional arrangements for the coordination
of reforms and for the provision of support to reforms.
§ In relation to education, the challenge is to strengthen the degree of attention
given to education quality issues and to dedicate more attention to poor-
performing schools.
Focussing on targeted programmes to reduce poverty
Finally, we recommend an expanded programme of Budget Support focused on specific
expenditure programmes and policies that might impact on poverty in the short to
medium term. The main shortcoming of Budget Support in the evaluation period has been
the failure to reduce income poverty. However, this is not just a failing of Budget Support but
of government policy as a whole.
§ Steady economic growth and fast increases in domestic revenue have
created a degree of fiscal space, which Mozambique has never experienced
before. This permits Mozambique to contemplate an ambitious programme of
public spending targeted on poverty reduction. Expanded provision of Budget
Support could allow such a programme to be quickly scaled up, without serious

xx
Independent Evaluation of Budget Support to Mozambique, 2005 -2012
risk to long-term fiscal sustainability. In addition to expanded social spending and
investment in physical infrastructure as in the past, we would recommend new
programmes of spending and policy reform focused on three areas:
§ A programme of social transfers and educational inputs targeted to address
malnutrition.
§ A programme to improve availability of fertilisers and inputs for small and
medium farmers.
§ A programme of policy measures, conducted in close collaboration with the
private sector, aimed at improving the business environment and promoting
employment growth.

21
Independent Evaluation of Budget Support to Mozambique, 2005 -2012
1. Introduction 1. This Final Report is submitted on behalf of the ADE Consortium by a team led by ITAD, UK
in association with Fiscus Limited, UK and MB Consulting, Mozambique. It draws on an
extensive documentary review, detailed data analysis – including econometric analysis –
and a wide range of interviews and focus group discussions undertaken during field work
in Maputo, and in Gaza and Zambezia provinces over October - November 2013. The
Evaluation Management Committee, comprising representatives of the Government of
Mozambique (GoM) and of the Programme Aid Partners (PAPs), reviewed the first draft of
this report and circulated it for wider comments from the Reference Group and the full set
of Development Partners (DPs) providing Budget Support to Mozambique. Where
appropriate, the comments received have been addressed by the evaluation team,
through relevant corrections and additions – notably through the addition of further
sectoral analysis for agriculture, education and health and through fuller development of
the recommendations of the evaluation. With these corrections now incorporated, this
now comprises the final version of the Evalution Report.
2. This assignment has formed part of a wider process of evaluation of the effects of budget
support at the international level. It has built upon evaluations of budget support in Mali,
Tunisia, Zambia, Tanzania and South Africa, completed over 2011 - 2013, and an
evaluation of budget support to Morocco, due to be finalised in 2014. In common with
these evaluations, it has applied the OECD-DAC methodology for the evaluation of
budget support.
1.1. Scope and Objectives of the Evaluation
3. The principal objective of the evaluation has been to assess to what extent budget
support in Mozambique has contributed to sustainable results on growth and
poverty reduction. The evaluation has assessed the causal linkages between general and
sector budget support and changes at the outcome and the impact level, considering the
effects of the fund flows but also those of the related policy dialogue processes, and the
associated technical assistance and capacity-building support. The evaluation thus
provides answers to three related questions:
i. How successful have GBS and SBS been in providing the means to the
Government of Mozambique to implement its national and sectoral strategies?

22
Independent Evaluation of Budget Support to Mozambique, 2005 -2012
ii. How successful have GBS and SBS been in facilitating improvements in the
efficiency and effectiveness of these national and sectoral strategies?
iii. As a consequence, how successful have GBS and SBS been in attaining successful
outcomes and impacts on growth and poverty reduction?
4. This has been an independent evaluation, undertaken on behalf of the Government
of Mozambique and the 19 Development Partners who have provided General or
Sector Budget Support over 2005-2012. In particular, the evaluation has covered all
General and Sector Budget Support1 operations over the period 2005-2012, provided by
the 19 Development Partners who were signatories of the March 2009 Memorandum of
Understanding on Budget Support – namely, the African Development Bank (AfDB),
Austria, Belgium, Canada, Denmark, the European Commission, Finland, France, Germany,
Ireland, Italy, the Netherlands, Norway, Portugal, Spain, Sweden, Switzerland, the UK and
the World Bank2.
5. In aggregate, Budget Support disbursements over financial years 2005 to 2012 have
comprised some US $ 3,354 million - that is an annual average disbursement of
more than US $ 400 million, approximately equivalent to US $ 16 per capita. Thus,
Budget Support has been of major importance for Mozambique, comprising an average
of 15 % of public spending throughout the 8-year period, reaching a peak of 18.8 % in
2006. Despite the fact that, with the growth of domestic revenue and the fall in Budget
Support disbursements, its significance declined to 8.2 % of public spending in 2012,
these figures place Mozambique amongst a select group of 4 countries3 for which Budget
Support has represented an annual average of over 10 % of public spending in the period
2004 -2010.
6. Given the continuing importance of Budget Support, a key objective of the
evaluation has been to provide a forward-looking agenda. It has taken stock of what
has been achieved, whilst also explicitly identifying the shortcomings, in the design and
1 The definitions of General and Sector Budget Support are provided in OECD-DAC (2006): ‘Budget
Support is defined as a method of financing a partner country’s budget through a transfer of resources from an external financing agency to the partner government’s national treasury. The funds thus transferred are managed in accordance with the recipient’s budgetary procedures. […..] In the case of general budget support, the dialogue between donors and partner governments focuses on overall policy and budget priorities, whereas for sector budget support the focus is on sector specific concerns.’
2 Volume Two provides summary details for each of the Budget Support operations, for which detailed documentation was available (Financing Agreements, etc).
3 These are Burkina Faso, Mozambique, Rwanda, and Tanzania. (IOB, 2012)

23
Independent Evaluation of Budget Support to Mozambique, 2005 -2012
implementation of Budget Support. The objective has been to draw out lessons for the
future: thus, the final chapters present the conclusions and recommendations which have
been developed relating to:
§ The conditions under which GBS or SBS are likely to have positive effects in
Mozambique, and the probable intensity and nature of those effects;
§ The improvements which should be made in the policies and practices of the
Development Partners (DPs), so as to maximise the impact of future Budget
Support operations in Mozambique and elsewhere;
§ The actions which might be taken by the Government of Mozambique (GoM) in
order to address the constraints arising from its policies, institutional structures
and administrative arrangements, and thus lift the impediments limiting the
effectiveness and impact of the public policy and spending actions financed by
Budget Support and by Mozambican tax-payers, via the national Budget.
1.2. The Evaluation Framework and Process
7. The evaluation has followed the “three-step” methodology, established by the
OECD-DAC’s evaluation network for the evaluation of Budget Support. This
methodology is described in the OECD-DAC’s methodological approach paper,4, and
presented in more detail in the Revised Inception Report for this evaluation (September,
2013).
The Intervention Logic
8. The evaluation methodology proposes an Intervention Logic, in which the outputs,
outcomes and impacts of Budget Support are generated via the policies, budgetary
measures and institutional actions implemented by the recipient government, as a
consequence of Budget Support:
‘…Budget Support is not a development programme per se, but an aid modality that
supports the development strategy of the beneficiary government. …..it produces a number
of direct or immediate outputs, which, under certain conditions, contribute to changes in
government policies and government budgets. The changes thus induced in government
outputs should, in turn, contribute to development outcomes and impacts’.
4 OECD-DAC Evaluation Network (2012), Evaluating Budget Support: Methodological Approach, OECD-
DAC, Paris..

24
Independent Evaluation of Budget Support to Mozambique, 2005 -2012
9. The Intervention Logic is thus based on a set of structured relationships at five levels as
follows:
§ Level One, which assesses the Inputs of GBS and SBS, including policy dialogue
and capacity-building inputs as well as fund flows.
§ Level Two, which details the Direct Outputs generated by the interaction of
budget support with other aid modalities.
§ Level Three, which documents the Induced Outputs produced by Government
as a consequence of the interaction of budget support (in complement with other
modalities) with the national policy, budgetary and service delivery processes.
§ Level Four, which records the Outcomes of Government policies and spending
actions, in terms of changes in the utilisation of public services by the public and
changes in private sector behaviour (such as investment) due to government
regulatory actions. At this level, government actions are interacting with wider
social and economic forces.
§ Level Five, which records the wider Impacts of these processes, in terms of
societal and economic processes, notably increased economic growth, reduced
income poverty, and diminished non-income poverty (reduced social exclusion,
improved education, health and social welfare).
The “Three Step” Approach
10. In order to avoid any implicit assumption of causality between Budget Support inputs and
final outcomes, the methodology separates the analysis into three steps, as illustrated in
Figure 1:
§ Step One covers levels 1-3. It provides the basis for understanding how Budget
Support has been inserted into the public spending and policy making process
and with what effects (direct and induced outputs), given the influence of other
aid modalities and internal government processes working alongside Budget
Support.
§ Step Two begins from an identification of the most significant outcomes and
impacts related to the implementation of the Government’s national and sectoral
development strategies (levels 4 & 5) and then examines – through a

25
Independent Evaluation of Budget Support to Mozambique, 2005 -2012
combination of econometric and qualitative analysis – what have been the
primary determinants of those outcomes and impacts.
§ Step Three brings together the findings from Steps One and Two, identifying
which of the “induced outputs” of Budget Support identified in Step One also
feature amongst the primary determinants of outcomes and impacts identified
through Step Two. In this way, it permits an assessment of the contribution of
Budget Support to final outcomes and impacts and an identification of the key
links and gaps in the Intervention Logic. Hence, Step 3 asks whether Budget
Support has succeeded in inducing the expected outputs and to what extent
those induced outputs have generated positive changes in outcomes and
impacts.
Figure 1: The 5 levels and the 3 Steps of the Evaluation methodology

26
Independent Evaluation of Budget Support to Mozambique, 2005 -2012
Figu
re 2
: Bud
get
Supp
ort
Inte
rven
tion
Log
ic in
Moz
ambi
que
and
prop
osed
Eva
luat
ion
Que
stio
ns

27
Independent Evaluation of Budget Support to Mozambique, 2005 -2012
11. In adapting the Intervention Logic (IL) to the Mozambican case, the evaluation team have considered the relevance and applicability of the range of inputs, direct outputs, induced outputs, outcomes and impacts identified in the standardised IL. The results of these considerations are captured in Figure 2, which presents the adapted version of the IL. Specifically, we have concluded:
§ That the scale of Budget Support and the range of inputs provided in Mozambique (funds, policy dialogue, and related support to capacity-building) are consistent with the inputs foreseen in the standardised framework at Level 1;
§ That the scale of external assistance in Mozambique justifies the analysis of the interactions between Budget Support and other modalities foreseen at Level 2;
§ That the range of issues covered by the PAF and the associated dialogue framework justifies a focus on the four core induced outputs identified at Level 3.
§ That detailed attention should be directed, at Levels 4 & 5, to growth and income poverty (including the influence of the agriculture sector) and to non-income poverty, as captured in final outcomes and impacts within health and education.
1.3. Evaluation questions
12. The Evaluation framework is broken down into 12 Evaluation Questions (EQs). These are
presented in Box 1 below. Volume Two presents these EQs, together with the proposed
Judgement Criteria for each EQ, as well as the summary answers we have reached and the
sources of evidence for these answers, and an assessment of the robustness of that
evidence. It also includes a four-way classification of the quality of the evidence, explained
in Table 1 below.
Table 1: Criteria for ranking of quality of Evidence for each Evaluation Question
Ranking of Evidence
Explanation of ranking of quality of evidence
Strong The finding is consistently supported by a range of evidence sources, including documentary sources, quantitative analysis and qualitative evidence (i.e. there is very good triangulation); or the evidence sources, while not comprehensive, are of high quality and reliable to draw a conclusion (e.g. strong quantitative evidence with adequate sample sizes and no major data quality or reliability issues; or a wide range of reliable qualitative sources, across which there is good triangulation).
More than satisfactory
There are at least two different sources of evidence with good triangulation, but the coverage of the evidence is not complete.
Indicative but not conclusive
There is only one evidence source of good quality, and no triangulation with other sources of evidence.
Weak There is no triangulation and/ or evidence is limited to a single source.

28
Independent Evaluation of Budget Support to Mozambique, 2005 -2012
13. A number of judgements were made in the choice of Evaluation Questions, so as to capture the specifics of the Mozambican situation, whilst remaining true to the overall methodology:
§ The number of Evaluation Questions was restricted to 12 so as to keep within a manageable magnitude, avoiding dispersion of evaluation efforts.
§ Following discussions with the Evaluation Management Group, an explicit question was incorporated at Level One (EQ 1.2) to capture the relevance of the evolving context for Budget Support, and to consider whether the design changes made to budget support operations have been appropriate to this evolving context.
§ With regard to policy dialogue, the Issue Paper (Caputo et al, 2008) proposes two evaluation questions – one situated at Level 2 relating to the establishment of a framework for policy dialogue linked to Budget Support and another under Level 3, relating to overall improvements in policy processes and structures. While conceptually it is useful to distinguish between the policy structures created for budget support and the wider structures used by Government, in practice these can more easily be dealt with as a single EQ, which we have here located at Level 2 (EQ 2.3.).
§ Reforms to promote governance and democratic accountability have been essential elements of the policy dialogue. Moreover, ‘the active fight against corruption’ is monitored as one of the underlying principles for Budget Support included in both the 2004 and 2009 Memoranda of Understanding. Therefore, improvements in the quality of governance and accountability are addressed as ‘induced outputs’ in EQ 3.4.
§ In order to ensure an integrated and holistic analysis, the issues to be examined under Step Two have been grouped in two EQs, one focused on income poverty (and including attention to the agriculture sector) and one focused on non-income poverty (with a primary focus on education outcomes).
§ Gender issues have been dealt with explicitly within these two outcome/ impact questions, (EQs 4.1 & 4.2) rather than as a special “cross-cutting theme”. A similar approach has been adopted in respect of equity issues.
§ Although all the information necessary for Step Three is generated by the EQs related to Steps One and Two, an additional evaluation question was added for Step Three (EQ 5.1) in order to ensure a clear structure for the synthesis process.

29
Independent Evaluation of Budget Support to Mozambique, 2005 -2012
Box 1 Evaluation Questions
A. Step One
EQ. 1.1: What was the scale of Budget Support over the period and the mix between GBS & SBS? What was the mix of inputs provided (funds, TA & capacity-building, policy dialogue) and was it consistent with those envisaged in the Budget Support agreements, and in the 2004 & 2009 Memoranda of Understanding?
EQ 1.2: How has the context for Budget Support evolved in terms of economic and political developments, as well as trends in international development policies? Have the changes made in the scale and in the design and implementation arrangements for Budget Support operations, including the definition of underlying principles, been relevant to the evolving context?
EQ 2.1: To what extent has Budget Support contributed to increasing the value and the proportion of external funds managed through the national budget process? How far has this contributed in turn to increasing the overall predictability of external resource funding for government activities?
EQ 2.2: To what extent has Budget Support contributed to increased harmonisation of external aid as a whole and to the reduction of transaction costs per unit of aid provided? Has Budget Support contributed more or less than other modalities in these respects?
EQ 2.3: To what extent has Budget Support contributed to sustainable improvements in the processes & methods of policy development and monitoring, in terms of institutionalising efficient frameworks, which involve relevant stakeholders, focus on strategy and results, and help to resolve policy dilemmas?
EQ 3.1: To what extent has Budget Support contributed to improvements in the quality of macroeconomic management and in the effectiveness of domestic revenue mobilisation?
EQ 3.2: To what extent has Budget Support contributed to improvements in the quality of Public Finance Management (PFM)?
EQ 3.3: To what extent has Budget Support contributed to changes in sector policies and in public expenditure allocations and with what consequences for the composition of outputs?
EQ 3.4: To what extent has Budget Support contributed to improvements in the quality of governance and accountability, particularly with regard to the roles of Parliament, Civil Society, the Tribunal Administrativo and the Anti-Corruption agencies as “watch-dogs” of the Executive.
B. Step Two EQ 4.1: How has the economy performed in terms of investment and growth and what have been the effects on income poverty and income distribution? What have been the main determinants of such changes? In particular, what has been the contribution of the Agriculture sector?
EQ 4.2: How has non-income poverty evolved over the period? In particular, how have the key outcome and impact indicators evolved in the education and health sectors in aggregate, by gender and by province? What have been the main determinants of the changes identified?
C. Step Three EQ 5.1: To what extent have the direct or induced outputs of Budget Support contributed to the results identified at the outcome and impact levels? To what extent have Budget Support operations in Mozambique over 2005 to 2012 been effective and have they generated sustainable impacts?

30
Independent Evaluation of Budget Support to Mozambique, 2005 -2012
1.4. Structure of the Report
14. This introductory chapter has aimed to provide essential background information on the
objectives and methodology of the evaluation. Subsequent chapters follow the structure
of the Intervention Logic underlying the evaluation framework:
§ Chapter Two examines the context for Budget Support in Mozambique (EQ 1.2).
It considers the economic and political situation at the outset and as it has
evolved over the period of the evaluation, assessing how this may have
influenced the effectiveness of Budget Support. Consideration is also given to the
evolution of Development Partners’ policies on Budget Support and their
influence on the Mozambican case.
§ Chapter Three addresses levels 1 and 2 of the evaluation framework, asking how
successful Budget Support has been in providing the Government with the
necessary means to implement the national poverty reduction strategy.
§ Chapter Four completes Step One of the analysis, considering how far Budget
Support has facilitated improvements in Government policies and practices. It
thus considers the “induced outputs” of Budget Support, which comprise level 3
of the framework.
§ Chapters Five, Six and Seven report on Step Two of the analysis. They examine
the potential outcomes and impacts of Budget Support, in terms of growth,
income poverty and non-income poverty, analyse how growth and poverty trends
relate to developments in the agriculture sector, and finally consider the
relationship of education sector outcomes to corresponding sector outputs,
drawing on a detailed econometric analysis.
§ Chapter Eight then reports on Step Three of the analysis, summarising the
overall conclusions on the contribution of Budget Support within the period, and
presents the recommendations of the evaluation team.
§ The Annexes in Volume Two provide complementary information, including
notably a matrix of responses to the Evaluation Questions and a Summary of the
Budget Support operations evaluated, as well as a statistical appendix, a
bibliography, and a list of persons met.

31
Independent Evaluation of Budget Support to Mozambique, 2005 -2012
Figure 3: Map of Mozambique

32
Independent Evaluation of Budget Support to Mozambique, 2005 -2012
2. The Context for Budget Support in
Mozambique: help or hindrance? 15. This chapter addresses a specific aspect of Level One of the evaluation framework, ,which
is considered within Evaluation Question 1.2. It examines the nature of the political and
economic context for Budget Support in Mozambique, at the outset and as it has evolved
over the evaluation period.. It considers the key aspects of the Mozambican context and
also the relevant aspects of the international context – notably the changing priorities and
interests of Mozambique’s Development Partners. The key question asked is to what
extent the context may be judged to have been a help or a hindrance to the effective
implementation of Budget Support, considering how that balance may have changed over
the course of the evaluation period.
16. Therefore, in this chapter, we consider four aspects:
§ The socio-economic context and how it has changed over the evaluation period.
§ The evolving framework of democratic accountability.
§ The fluctuations in the policies, priorities and attitudes of the Development
Partners.
§ Implications for the evaluation and for the future of Budget Support in
Mozambique.
2.1. The evolving socio-economic context of Mozambique
17. From the beginning of the liberation war in 1964, Mozambique experienced nearly 30
years of violent strife, social and political disruption, and economic crisis. The signing of
the General Peace Accords (GPA) in 1992 heralded a period of almost uninterrupted
growth in excess of 8 % per annum (World Bank & IMF, 2005). At the same time, the point
of departure was not a favourable one: in the early 1990s, Mozambique faced among the
deepest problems of absolute poverty, in a largely subsistence economy, with a long
history of bitter civil war, during which the rudimentary public services which had existed
had been eroded and debt had mounted. (Batley et al, 2006).
18. Supported by high volumes of foreign aid, debt forgiveness under HIPC and new
investments in mega-projects (notably the Mozal aluminium smelting plant), Mozambique

33
Independent Evaluation of Budget Support to Mozambique, 2005 -2012
managed a remarkable recovery. The combination of the return to peace, the re-
establishment of government services and fast economic growth led to an impressive
reduction in the level of absolute poverty, from 69% of the population in 1996-97 to 54%
in 2002-03, thus bringing almost 3 million people above the poverty line. This
achievement, together with the signing of the Memorandum of Understanding for Budget
Support in 2004 and other positive developments in policy making - notably the
publication of the 2001-2005 poverty reduction strategy, PARPA I, created a highly
favourable context for Budget Support. In particular, the government enjoyed, at the time,
a close and supportive relationship with its Development Partners, and an apparently
positive outlook, not only for growth but also for poverty reduction.
19. A first evaluation of General Budget Support to Mozambique was undertaken during 2005
and published in May 2006, utilising an early version of the OECD-DAC methodology5. Its
conclusions were, indeed, positive:
‘Our broad conclusion is that this has been a very successful case of donor-government
collaboration, and that GBS has contributed positively to conditions for economic growth
and poverty reduction.’
20. Nevertheless, this first evaluation did stress that, in 2004, there persisted high rates of
poverty, poor health indicators and high rates of illiteracy, and that ‘indicators of access to
education and health services show a poor situation even by comparison with other less
developed countries. The main reason for declining life expectancy is the onset of HIV/ AIDS:
Mozambique now has the eighth highest prevalence rate in the world.’ (Ibid, p.7.) In short, a
more careful interpretation of socio-economic trends in 2004-05 might have highlighted
that 12 years of fast growth in the post-war recovery period had still not been enough to
address in a significant way the indicators of social deprivation prevailing at the time of
the Peace Accords. Moreover, the continuing deficit in physical and human capital
investment, combined with the new threat of HIV/ AIDS, did not bode well for a
continuation of the remarkable reduction in income poverty achieved over 1996-97 to
2002-03, particularly given the challenge of reaching the predominantly rural poor within
a country as vast as Mozambique (approximately 800,000 square kilometres), with an
average population density of only 29 inhabitants per square kilometre (2012).
5 Batley, R., Bjornestad, L. & A. Cumbi (2006), Joint evaluation of General Budget Support, 1994 – 2004:
Mozambique Country Report, IDD: Birmingham.

34
Independent Evaluation of Budget Support to Mozambique, 2005 -2012
Evolution of growth and poverty trends during the evaluation period
21. Mozambique has experienced high and sustained growth during the evaluation period at an average rate of 7.3%. This is illustrated in Figure 4 below that shows that Mozambique’s economic growth rates have compared favourably with other Sub Saharan African (SSA) countries, including those ‘frontier economies’ within SSA.
Figure 4: Real GDP for Mozambique in comparison with other ‘frontier economies’
Mozambique
Sub-Saharan Africa
Frontier economies 1
0
2
4
6
8
10
12
14
2000 2001 2002 2003 2004 2005 2006 2007 2008 2009 2010 2011 2012
Real GDP(Percent change from previous year)
Proj.
.1 Frontier economies: Angola, Ghana, Kenya, Mauritius, Mozambique, Senegal, Tanzania, Uganda, Zambia and Zimbabwe. Source: IMF Country Report No. 12/148, June 2012
22. Despite the fast growth achieved, Mozambique’s progress in poverty reduction has been less impressive. Although two different methodologies have been applied in measuring and analysing poverty (the official poverty figures, presented in the Third National Poverty Assessment and by the World Bank in Alfani et al 2012), both tell a consistent story at the national level: there has been no statistically significant change in poverty between the early and the late 2000s.
Table 2: Economic & Social Indicators for Mozambique and Tanzania, 2005 and 2012 Mozambique Tanzania Indicator 2005* 2012* 2005* 2012* GNI per Capita, Atlas Method (current USA $) a 290 510 380 570 Population, million a 21,01 25,20 38,8 47,7 % Poverty headcount ratio at national poverty line (% of population) a
54.1 (2003)
54.7 (2009)
35.7 (2001)
33.41
(2007) Life Expectancy at Birth b 48.1 50.7 53.8 60.1 HDI (Score) b 0.287 0.327 0.420 0.446 HDI (Ranking) b 168 185 159 152
Literacy Rate a 48.16 (2003)
50.58 (2009)
69.4 (2002)
67.8 (2010)
Prevalence of undernourishment (% of population) a 40.3 39.2 (2011) 35.1 38.8
(2011) Depth of the food deficit (kilocalories per person per day) a 310 292 248 274 Prevalence of HIV, total (% of population ages 15-49) a 11.3 11.1 6.3 5.1 * Where 2005 or 2012 data were not available, the most proximate year has been used.
Sources a World Development Indicators 2013; b Human Development Report 2013.

35
Independent Evaluation of Budget Support to Mozambique, 2005 -2012
23. Growth and poverty trends and their probable determinants have been analysed as part
of Step Two of the evaluation and our results are presented in Chapter 5. However, an
overview of the trends in socio-economic indicators is provided by a reading of Table 2
above, which presents summary statistics for 2005 and 2012 for key economic and social
indicators. We have provided comparative data for Tanzania, which has quite a number of
similarities with Mozambique, notably in terms of its natural resource endowments, per
capita incomes, fast recent growth rates, and the predominantly rural structure of the
population. However, the two major differences relate to population density (28.7 per
square kilometre in Mozambique vs. 47.5 in Tanzania) and, more importantly, to the
record of 50 years of peace since Independence in Tanzania, as compared with
Mozambique’s legacy of civil war.
24. The comparison with Tanzania is, to put it simply, not flattering for Mozambique. Across
every social indicator, performance in 2005 is worse in Mozambique and remains worse in
2012. Only in relation to literacy and prevalence of under-nourishment6 has the
performance of Mozambique been better than Tanzania within the evaluation period.
25. How are we to interpret this? Clearly, there are likely to have been weaknesses in the
strategic allocation of resources and in the design and implementation of policy in
Mozambique. This is a question we examine in more detail in Chapter 4, considering in
particular whether there is evidence of Budget Support having positive or negative effects
on these processes. Nevertheless, Tanzania is not a particularly good performer amongst
its SSA peers in the design and implementation of policy and in the efficiency of its public
administration systems7. Fundamentally, the explanation is that, in any low income
country, the legacy of civil war leaves a long foot-print in terms of deficiencies in human
capital, in physical infrastructure and in the administrative capacity to deliver services8.
Tanzania is able to perform better than Mozambique across most socio-economic 6 World Development Indicators 2013 reports a second indicator, measuring the % of children under 5
determined as malnourished in terms of their weight for age. Data for Mozambique are reported as 18.3 % in 2008 and 11.6% in 2011. If correct, these data suggest a dramatic improvement (for example for the same indicator, prevalence in Tanzania fell from 16.7% in 2004 to 16.2% in 2010), but these data are not consistent with the other indicators for malnourishment shown in Table 2 and show an unusually fast rate of change for such an indicator, suggesting some methodological inconsistency or some inaccuracy.
7 A recent evaluation of Budget Support to Tanzania over 2006 -2012 identified several examples of weaknesses in the design and implementation of public policies. (See Lawson et al, 2013).
8 For example, see Collier (2007), The Bottom Billion, on the long-term costs of civil war in low income countries.
36
Independent Evaluation of Budget Support to Mozambique, 2005 -2012
indicators because of a “delivery infrastructure”, which has been built up over many years.
The “catch-up challenge” for Mozambique was daunting at the outset of the evaluation
period – still more so because of the high prevalence of HIV/ AIDS - and remains
daunting now. By implication, the expectations of the likely impact of public policy
actions – and therefore of the likely impact of Budget Support – need to be tempered to
this reality.
Resilience of the economy and future prospects
26. Mozambique has been reasonably unaffected by external economic events over the
evaluation period. The impact of the global financial crisis on Mozambique was relatively
limited, with a fall in economic growth during 2008-2009, as a result of a decline in
foreign direct investment and a collapse in the world commodity markets. This led to
export receipts falling and a decline in private sector financing. However, Mozambique’s
rate of economic growth bounced back reasonably quickly, due to a countercyclical policy
stance, increased donor support, particularly though the IMF’s Exogenous Shocks Facility
(ESF) and an increase in lending by the domestic banking system which compensated for
falls in external financing. By 2010, export levels had recovered and growth rates had
returned to previous levels.
27. Mozambique also experienced economic shocks from increases in international food
prices during 2007 and 2008, when petrol and food prices rose 27 and15 per cent
respectively. This led to large domestic fuel price increases in February 2008, which
triggered riots. However, the economic impact of these events was again only temporary
and levels of inflation fell again, while economic growth rebounded quickly. Similarly,
economic growth was affected by bad weather in late 2007, which resulted in extensive
flooding. Despite this, there was only a short-term impact on economic growth.
28. The stability of growth has therefore been a significant feature of the evaluation
period, especially by comparison with the much more volatile rates of growth
experienced over 1995-2005. The structure of growth has also been reasonably stable
with agriculture and services & trade accounting for at least two thirds of GDP
throughout the period. (In 2011, agriculture accounted for 39% of GDP and services &
trade for 27%.)
29. The main economic transformation in Mozambique has been the discovery over 2010 – 2012 of very large deposits of exploitable gas in the Rovuma Basin, off the coast of Cabo Delgado province. Anadarko Petroleum Corporation and the Italian company, ENI, who are leading the exploration work in this area have stated that there are

37
Independent Evaluation of Budget Support to Mozambique, 2005 -2012
known reserves in the Rovuma Basin alone in excess of 100 trillion cubic feet9, which would justify the construction of a Liquefied Natural Gas (LNG) facility on the coast. Although it has long been known that Mozambique has rich and varied resources of minerals (titanium, gold, heavy sands) and energy (coal, gas, hydropower, and probably oil), and exploitation of some of these had already begun [hydropower from Cahora Bassa, coal in Tete, gas exported to South Africa by pipeline from the Pande and Temane fields in the Mozambique Basin (Inhambane/ Sofala)], it is these new discoveries that are considered a real “game-changer”.
30. The planned investments in the Rovuma basin, combined with the requirements for the increased exploitation of the gas reserves in the Mozambique Basin, and of coal and heavy sands amount to total Foreign Direct Investment (FDI) of some US $88 billion over the next ten years10, more than six times the current GDP. Clearly, this “mining boom” has the potential to raise per capita income levels dramatically and to provide a major new source of domestic revenue. Already in 2013, the Mozambican government received significant revenues from the taxation of capital gains on the re-sale of exploration contracts within the Rovuma Basin (equivalent to 4.2 % of GDP).
31. However, these are very preliminary estimates, subject to a high margin of uncertainty, in particular in relation to the timing of investments and the start of the exploitation process. At present, the earliest estimate for the start of gas extraction from the Rovuma Basin is 2018 but, given the complexity of the infrastructure works which will need to be completed before extraction may begin (railway lines, ports, LNG installations), this estimate seems optimistic. Moreover, the flow of domestic revenues resulting from extraction will arrive with a significant lag. This is because these revenue flows will derive primarily from production royalties, which, are payable only after the beginning of production, and from dividend and profit shares due to the Government’s shareholdings in these developments, which will be depleted by amortisation of investment costs. Moreover, these shareholdings will themselves need to be paid for from the production royalties, so positive net flows to Government will only kick in some time after production has commenced.
32. Therefore, significant domestic revenue flows from resource exploitation are
unlikely to occur before 2020 and the Bank of Mozambique, when interviewed, stated
that external funding is likely to be needed at least until then. Nevertheless, the move
away from aid-dependence has been lauded by the President himself11, as well as other
commentators, as one of the important expected benefits of the “mining boom” and any
9 The Empresa Nacional de Hidrocarbonetos (ENH) have stated that Mozambique as a whole may have
as much as 250 trillion cubic feet (t.c.f) of reserves. These figures compare with the known reserves of 40 t.c.f and estimated total reserves of 100 t.c.f in Tanzania.
10 This estimate is based on the announced plans of Anadarko, ENI, SASOL and Statol in Gas, Kenmare in heavy sands and Vale and Rio Tinto in coal. (Internal document of the EU Delegation, June 2012).
11 As reported in Gqada, I. (August, 2013), A boom for whom? Mozambique’s natural gas and the new development opportunity, South African Institute of International Affairs Occasional Paper No. 151; Capetown.

38
Independent Evaluation of Budget Support to Mozambique, 2005 -2012
suggestion in the short-term of a perceived increase in aid dependence through the
application of tighter conditionality will certainly be resisted. This has important
implications for the design of Budget Support and of delivery strategies for aid as a
whole.
33. Within the evaluation period, developments in resource extraction have not been of
significant importance either as a source of domestic revenue or as a source of economic
growth, where the sector still only accounted for less than 2% of GDP in 2011 (INE).
However, the design of the future fiscal and institutional framework for natural resource
exploitation has been an aspect of the dialogue within the Budget Support arena and
more widely. In October 2012, after 3 years as a candidate country, Mozambique was
granted the status of a fully compliant member of the Extractive Industries Transparency
Initiative (EITI). This was widely seen as an important step towards the establishment of
transparent contractual and taxation arrangements. Nevertheless, many aspects of the
fiscal and institutional framework remain to be decided.
2.2. The evolving framework of democratic accountability
34. The quality of underlying processes of democratic accountability is an essential
aspect of the context for Budget Support. Where the ‘core’ level of democratic
accountability is high from the outset, then the modest changes which Budget Support
might be able to induce are more likely to have a significant and lasting effect; where this
is low, then Budget Support processes are less likely to be influential. 12
35. What can we say about the nature of democratic accountability within the evaluation
period? We examine three potential indicators of the vitality of the systems of democratic
accountability:
§ The fairness and competitiveness of the electoral system;
§ The degree of popular support for the ruling party or coalition;
§ The existence of a civil society with an active voice. 12 We acknowledge the relevance of the debate about the apparently limited role of democratic
accountability within the “Developmental State”, as discussed by Mustaq Khan and Ha-Jong Chang, amongst others. (See also Fritz and Menocal, 2006 for an excellent summary of this literature.) However, within the constitutional framework of Mozambique, it is the institutions of democratic accountability which are intended to provide the checks and balances to control the abuse of power and to guide public decision-making towards efficient and effective solutions. Our objective is simply to provide an indication of the vitality of the systems of democratic accountability during the evaluation period, while recognizing that this analysis is open to a range of interpretations with regard to the implications for politics, and for economic and social policy.

39
Independent Evaluation of Budget Support to Mozambique, 2005 -2012
Fairness and competitiveness in the electoral system
36. Mozambique promulgated a new democratic constitution in November 1990, and
following the peace accords of 1992 has celebrated general elections for the Presidency
and the parliament every five years since the first multi-party election in 1994. Frelimo
have been the consistent winners of these elections, initially under Joaquim Chissano, who
was president for18 years (including 10 under a democratic mandate) and since 2004,
under the presidency of Armando Guebuza who won the 2004 and 2009 elections. Having
completed his statutory two terms, President Guebuza has announced that he will step
down, and in February the Frelimo Central Committee voted for Filipe Nyussi, the current
Defence Minister, as their candidate for the October 2014 presidential elections. .
Table 3: Parliamentary Election results 1994 – 2009 (% of valid votes cast)
1994 1999 2004 2009
Seats Votes % Seats Votes % Seats Votes % Seats Votes % Mozambique Liberation Front (FRELIMO) 129 44.3% 133 48.5% 160 62.0% 191 74.6%
Mozambican National Resistance (RENAMO) 112 37.8% 117 38.8% 90 29.7% 51 17.6%
Third most voted party
9 (UD) 5.2% 0 - 0 - 8
(MDM) 3.9%
Total 250 87.3% 250 87.3% 250 91.7% 250 96.1% Source: AIM – Mozambique News Agency
37. As may be seen from Table 3, in the 1994 and 1999 elections, Renamo achieved a
relatively high percentage of the votes in the parliamentary elections, and still higher
percentages of the presidential vote13, where in 1999, the Renamo candidate, Afonso
Dhlakama, obtained 47.7% of the valid votes cast to Chissano’s 52.3%. The strong
performance of Renamo in each of these elections came as a surprise to many observers
but suggested clearly that there were significant groups in society, who did not support
Frelimo policies. Some commentators observed that right through the transition from a
one-party to a multiparty political system, the Frelimo state had always remained
‘suspended above society’ (Saul, 1993.) However, in subsequent elections, led by
Armando Guebuza, Frelimo were able to win a dominant share of the votes cast, and thus
of the Parliamentary seats, which are decided by proportional representation.
38. Renamo criticised the results of each of these elections for not having been conducted in
a fair and transparent manner by the National Electoral Commission (CNE). In respect of
the 1994, 1999 and 2004 elections, observers from the Carter Centre and from the
13 Apart from the 1999 elections, the results for the parliamentary and presidential votes have been
very similar. See AIM - Mozambique News Agency or International IDEA.

40
Independent Evaluation of Budget Support to Mozambique, 2005 -2012
European Union Election Observation Missions identified several cases of electoral fraud
but they concluded that the electoral shortcomings would not have affected the final
result in the presidential election, and would only have had a minor impact on the
distribution of parliamentary seats.
39. In the 2009 elections, the two opposition parties – Renamo and MDM (Movimento
Democrático de Moçambique) alleged fraud. The EU and other observer groups reported
that voting was conducted in a peaceful and orderly manner but they were highly critical
of many pre-election day processes. In particular, it was pointed out that the CNE’s
disqualification, for ostensibly technical reasons, of MDM candidates’ nomination papers
in 9 of the 13 parliamentary constituencies had substantially restricted voter choice14.
Observers also documented election day irregularities, including ballot stuffing and
tabulation fraud at some polling stations, although these distortions were considered
insufficient to have affected the overall result of the election. (Freedom House, 2010).
40. The reported electoral irregularities, combined with on going concerns about slow
progress in the fight against corruption, prompted the G-19 Budget Support group to
report to Government that it felt that a breach of the underlying principles for Budget
Support might have occurred. This led to the suspension of Budget Support
disbursements by 4 DPs and an intense process of dialogue between Government and the
G-19, which became known as the period of “crispação” (“political tension”). As a result,
Government agreed to implement a Governance Action Plan, whose key elements
included the preparation of revisions to the electoral law, certain measures to promote
political inclusivity, and a package of Anti-Corruption legislation.
41. Notwithstanding the improvements to electoral processes, which may result from the
Governance Action Plan, it is clear that the period of the evaluation has been
characterised by a sharp reduction in the level of political competition. With the
2009 elections, Frelimo was able to assume a position of real dominance over political
institutions. Within a presidential system, where many judicial and other appointments are
made by the President, this has led to a major centralisation of power. The hierarchical
structure of Frelimo and the strong internal party discipline have reinforced this
centralisation.
14 As a rough indication of the impact this might have had, if MDM had won the same percentage of
parliamentary as presidential votes (8.59 %), they would have won some 15-20 seats, as opposed to the 8, they actually won. Whether this would have been at the expense of Frelimo or Renamo is difficult to judge.

41
Independent Evaluation of Budget Support to Mozambique, 2005 -2012
The degree of popular support for the ruling party
42. Over successive elections, Frelimo has been able to assume a position of political
dominance. This may have been helped in a small way by electoral irregularities. Yet, it is
likely that it would have happened anyway, simply by virtue of the better organisation of
Frelimo in comparison with the opposition, and by virtue of the advantages bestowed by
being the incumbent party in power. However to what extent does it reflect an increasing
level of popular support for Frelimo?
43. In this respect, the data on voter turn-out and numbers of invalid votes over the course of
the four general elections are revealing. These are presented in Table 4 and Figure 5. They
show a sharp decline in voter turn-out from 87.9 % of registered voters in 1994 to only
36.3 % in 2004, rising modestly to 44.4 % in 2009. Simultaneously, there was first a decline
in the number of invalid votes to 8.3 % in 2004 from the 1994 high of 11.7 %, probably
attributable to the learning process following the nation’s first multiparty election.
However, this was then followed by a sharp rise in numbers of invalid votes in the 2009
election to 11.25 %. Casting invalid votes is a classic form of voter protest, and the 2009
outcomes could be interpreted in such a way. High numbers of invalid votes is also
frequently associated with electoral fraud (through the invalidation of votes for
opposition candidates). Certainly, the proportion of invalid votes is higher and, in most
years, the voter turn-out lower than other countries within the region, which are also
dominated by large majority parties.
Table 4: Voter turn-out and invalid votes cast in Mozambique & neighbouring countries Parliamentary Electi
1994 87.89%1999 68.09%2004 36.34%2009 44.44%
Source: The International In
MozambiqueYear of
e lect ionVot er
Turn- out
ctions' Results
11.70% 1996 59.30% 1995 76.51% 5.50% 1994 86.87% 0.98%9.60% 2001 70.31% 2.70% 2000 72.77% 4.60% 1999 89.28% 1.50%8.30% 2006 68.00% 3% 2005 72.52% 5% 2004 76.73% 2%
11.25% 2011 59.29% 0.0405 2010 39.49% 2009 77.30% 1.3%nstitute for Democracy and Electoral Assistance (International IDEA)
Year of e lect ion
Voter Turn- out
I nvalid vot es
e Uganda Tanzania South AfricaYear of elect ion
Voter Turn- out
I nvalid vot es
Year of e lect ion
Vot er Turn- out
I nvalid votes
I nvalid vot es

42
Independent Evaluation of Budget Support to Mozambique, 2005 -2012
Figure 5: Voter turn-out and invalid votes in Mozambique & neighbouring countries
44. Clearly, these data are open to a range of different interpretations. However, the fact is
that in 2009, Frelimo received the votes of only 2.9 million adults, 29.5 % of the
registered voters, as compared with the 34.4 % who had voted for them in 1994 (2.1
million). In short, Frelimo now has more political power but less popular support, which
opens up questions about its legitimacy and the degree of respect in which it is held by
Mozambican citizens.
45. It is possible that these data simply reflect dissatisfaction with the political process and
with the political alternatives on offer, rather than dissatisfaction with Frelimo as such.
However, there are other indicators and developments, which suggest a degree of citizen
dissatisfaction with the governing party and perhaps a sense of disenfranchisement:
§ The violent popular protests that followed the rise in fuel prices and public
transport fees in February 2008 and the combination of food and fuel price rises
in September 2010 suggest firstly a willingness to engage in popular protest
which has not been seen in the past. Secondly, the failure to anticipate this
reaction in advance suggests an increasing distance between the leadership and
the people: in 2008 a 50 % increase in public transport fees was imposed, and the
ensuing riots left 4 people dead and more than 100 injured. (Freedom House,
2010.)
§ The popular perception of corruption has remained consistently high as reported
by Transparency International (See Table 5). More significantly, it is the Police,
who are identified by Mozambicans as the most corrupt public institution.
(Transparency International, 2011).
0%
2%
4%
6%
8%
10%
12%
14%
('94-'96)
('99-'01)
('04-'06)
('09-'11)
Invalid votes
Mozambique
Uganda
Tanzania
South Africa

43
Independent Evaluation of Budget Support to Mozambique, 2005 -2012
§ The report of the Africa Peer Review Mechanism (APRM 2010) points out
problems of social and economic inequalities, and very limited access to
resources and economic opportunities by the majority of the population.
§ The report on the State of the Union prepared by CESC in 2013 indicates
problems of political intolerance and a strong aversion to criticism on matters of
governance by the government15.
§ Finally, several important personalities from the political, academic and religious
arena have publicly voiced their concerns about the state of affairs in the country,
particularly regarding governance and the model of wealth distribution in
Mozambique16.
Table 5: Indicators of Political Openness and Perceptions of Corruption, 2005 & 2012 Mozambique Tanzania Indicator 2005* 2012* 2005* 2012* Political Openness 2005 & 2012 a (indication of the general state of freedom in a country)
Political Rights (1=high freedom; 7=low) 1 3 4 4 3
Civil Liberties (1=high freedom; 7=low) 2 4 3 3 3
Corruption Perceptions Index Score b (0 = highly corrupt; 10 = no corruption)3 2.8 3.1 2.9 3.5 Notes: 1 The ratings process is based on a checklist of 10 political rights questions. Scores are awarded to each of these questions from which a rating of 1 to 7 is derived, with 1 representing the highest and 7 the lowest level of freedom. 2 The ratings process is based on a checklist of 15 civil rights questions. Again, a rating of 1 to 7 is derived, with 1 representing the highest and 7 the lowest level of freedom. 3 The CPI measures the degree to which public sector corruption is perceived to exist within a country on a scale of 0 (highly corrupt) to 10 (very clean). Sources:
a Freedom In the World 2012, Freedom House; b Corruption Perceptions Index 2012, Transparency International.
The existence of a civil society with an active voice
46. The fact that there are commentators from civil society able and willing to stand up
and voice their concerns over the state of governance is a positive sign. The
importance of these groups has been noted by a number of researchers. Shikhani (2012)
states that ‘Mozambique’s socio-cultural system is characterised by the existence of many
pressure groups. They constitute a growing critical mass and play a fundamental role in
helping to deepen democracy in the country.’ Freedom House (2010) reports that
15 CESC (2013) gives examples of destruction of flags of opposition parties in the provinces of Manica
and Gaza, the closure of three community radios with programmes focused on monitoring governance, a coordinator of the civil society platform of Barue threatened by the district administrator with expulsion from the district.
16 We refer in particular to Prof. Lourenço do Rosário, Rector of Apolitécnica; Dinis Sengulane, Bishop of Lebombo; Francisco Chimoio, Archbishop of the Catholic Church in Maputo; and Prof. Carlos Nuno Castel Branco of the Institute of Social and Economic Studies (IESE).

44
Independent Evaluation of Budget Support to Mozambique, 2005 -2012
‘religious freedoms are well respected, and academic freedoms are generally upheld’. It
also notes that ‘local journalists and non-governmental organisations such as the Centre
for Public Integrity have played a crucial monitoring role by investigating and exposing
high-profile corruption cases.’
47. Since the introduction of multiparty democracy in 1994, new independent media sources
have proliferated. These include several weeklies and the daily, O Pais, a number of
independent and community radio stations, and, more recently, news websites. (Freedom
House, 2010) There is also political debate on issues like the national and municipal
elections on social networking sites such as Facebook. Shikhani (2012) also reports that
‘mobile phones were crucial in the preparations for the events of 5 February 2008 and 1-2
September 2010, with the youth who participated in these events being mobilised by SMS
days before’. In short, there is an active process of circulation of information, ideas and
analysis and significant capacity for social mobilisation.
Table 6: Worldwide Governance Indicators for Voice & Accountability, 2006 & 2012 Country Year Score
(-2.5 to + 2.5) Percentile Ranking
(0 to 100)
Standard Error (for scores)
Lesotho 2006 0.15 52.9 % 0.17 2012 0.04 51.7 % 0.14 Mozambique 2006 -0.08 45.7 % 0.11 2012 -0.18 43.1 % 0.12 Tanzania 2006 -0.20 40.4 % 0.11 2012 -0.22 41.7 % 0.11 Malawi 2006 -0.26 38.9 % 0.12 2012 -0.23 41.2 % 0.11 Source: Worldwide Governance Indicators, 2013
48. As a reflection of these developments, Mozambique scores relatively well on the
Worldwide Governance indicators for Voice and Accountability. As shown in Table 6,
its percentile ranking in 2012 was 43.1 %, which compared well with similar neighbouring
countries, as well as with the average ranking for low income countries (22.5%) and for
Sub-Saharan Africa (31.6 %). There has been a minimal decline in Mozambique’s score
against this indicator between 2006 and 2012 but this falls within the bounds of the
standard error. As reflected in Table 5 above, Freedom House show a modest
improvement (from 4 to 3) between 2005 and 2012 in the ranking for civil liberties, which
measures a similar set of issues.

45
Independent Evaluation of Budget Support to Mozambique, 2005 -2012
49. Notwithstanding the Freedom House and WGI rankings, there continue to be
shortcomings in the quality of voice and accountability. While press freedoms are
legally protected, journalists are sometimes harassed or threatened and often practise
self-censorship (Freedom House, 2010). The campaign periods leading up to the 2009
national elections and the 2013 municipal elections were both marred by a significant
level of partisan violence. Some commentators (CESC, 2013) suggest that the level of
harassment and intimidation of civil society has increased in recent years. This view is
supported by a number of survey-based indices and, overall, we would conclude that the
quality of voice and accountability during the evaluation period has probably declined. As
an illustration of this, we note the following:
§ In the 2012 Global Index of Freedom of Expression Mozambique dropped seven
places in the ranking, from 66th in 2005 to 73rd in 2012.
§ Afrobarometer showed that the number of people who think that they are
completely free to say what they think fell to 41% in 2012, compared to 47% in
200817.
§ The World Press Freedom Index ranked Mozambique as 73 out of 180 countries
in 2013 a considerable fall from a ranking of 49 out of 167 in 2005, with its overall
score falling from 10.5 out of 100 in 2005 to 28.0 in 2013, where zero indicates
the best score and 100 the worst18.
2.3. Fluctuations in the policies, priorities and attitudes of the Development Partners
50. The relative shift in European opinion at public and official levels regarding the
desirability of Budget Support has also represented an important change in the
context for Budget Support during the evaluation period. This is evidenced in the
international withdrawal from budget support operations by the Netherlands, and also in
the explicit changes in policies introduced by the European Commission, Sida, the State
Secretariat for Economic Affairs of Switzerland (SECO) and the Department for
17 http://www.afrobarometer.org/data/data-by-country/mozambique 18 https://rsf.org/index2014/en-africa.php

46
Independent Evaluation of Budget Support to Mozambique, 2005 -2012
International Development (DFID)19. These changes in official policies have promoted
more rigorous assessments of the fiduciary risks of budget support and attempts to
develop more explicit links between disbursement modalities and the results of Budget
Support.
51. Neither the requirement for more rigorous fiduciary risk assessment nor the desire for
more results-based disbursement methodologies need have been problematic for the
implementation of Budget Support in Mozambique. Indeed, greater thoroughness in the
fiduciary risk assessment process and in the monitoring and communication of results
should lead to a better informed dialogue around Budget Support. However, in
interviews, several senior Development Agency staff attributed these policy changes to
the desire of domestic politicians to see more immediate and more tangible results. It was
reported that, as a consequence, these policy changes had often been accompanied by a
declining interest in longer term institutional development processes (including those
linked to the aid effectiveness agenda), by a greater risk aversion, and by increasingly
“knee jerk” reactions to unfavourable events, such as corruption scandals. The evaluation
of Budget Support to Tanzania (Lawson et al, 2013) identified increased evidence of these
phenomena within the Tanzanian Budget Support process in the post 2007 period. Our
analysis in Chapter 3 examines whether these phenomena were present in the
Mozambican case.
52. Finally, it is worth noting that the global financial crisis has put pressure on public
finances in many OECD countries, and that in some cases this has had a knock-on
effect on aid budgets. The OECD DAC reported in April 2012 that there had been a 3%
drop in total ODA disbursements between 2010 and 2011. As the aid modality which is
easiest to “turn off”, Budget Support may have been disproportionately affected by this.
Four of the G-19 members providing Budget Support to Mozambique – Italy, Ireland,
Portugal and Spain – have formally announced cuts in their aid budgets. Two of these –
Spain and Portugal – have temporarily suspended payments of Budget Support, while
Ireland and Italy have both reduced the value of their disbursements. On the other hand,
these are relatively small Budget Support contributors and the three largest contributors
to Budget Support in Mozambique – the World Bank, the EU and DFID – have expanding
aid envelopes (through IDA and EDF) or explicit political commitments to protect aid
19 New policy statements on Budget Support have been produced by each of these agencies since
2008. The broader shift in the fashion for Budget Support is documented in IOB (2012) and Tavakoli & Hedger (2011).

47
Independent Evaluation of Budget Support to Mozambique, 2005 -2012
diisbursements - in the case of the UK through a commitment to achieving a target of 0.7
% GDP for total ODA. In short, within the evaluation period, the more relevant factors
would appear to be the shift in Budget Support policies and in political attitudes towards
the use of Budget Support. .
2.4. Implications for the evaluation and for future Budget Support
53. Any evaluation of an aid intervention mechanism must consider both the quality and
relative efficiency of the mechanism itself and the nature of its interaction with the
operating context. The outcomes of Budget Support are the consequence of the
combination of the mechanism and the context20.
Implications for the evaluation
54. The first evaluation of Budget Support in Mozambique (Batley et el, 2006), which covered
the period up to 2004, saw this new mechanism operating in a relatively favourable
context. By comparison, the period here evaluated – 2005-2012, presented a significantly
more challenging context in, at least, four respects21:
§ This has been a period of increasing scepticism over Budget Support from
the side of the Development Partners and increasing disappointment with the
aspirations of the Paris Declaration, with which Budget Support was associated.
This has reflected itself in pressures from headquarters to obtain quick results, to
reduce investment in institutional development and aid effectiveness work not
immediately related to quick results, and to be increasingly risk averse22.
§ It has been a period of increasing concentration of political power in
Mozambique, which has distanced government from citizens and reduced the
need (and perhaps the willingness) to listen to criticism and to alternative policy
voices.
20 See Pawson and Tilley (1997) and Pawson (2008) for a fuller exposition of this argument, which
underlies the ‘realist’ approach to the synthesis of evaluation results. 21 The need to respond to the global financial crisis which broke in 2008 might also be mentioned here
but, as we have stated, the economic impact was less than expected and the policy response relatively swift and decisive. (See Section 2.1 above and Sections 4.1 and 5.1.)
22 This was confirmed to us both in the focus group discussion with Heads of Cooperation, and by most of the HoCs who were interviewed individually.

48
Independent Evaluation of Budget Support to Mozambique, 2005 -2012
§ These factors are likely to have made more difficult the dialogue between
government and the Budget Support providers by reducing the commitment –
on both sides – to the joint process enshrined in the MoU for Budget Support.
§ Finally, the public policy agenda has become more technically and politically
demanding. Attention has had to focus not just on the attainment of economic
growth, the initiation of reforms, and the expansion of service coverage but also
on the stimulation of poverty reduction, the implementation and “roll-out” of
reforms, and the achievement of increased quality in service provision. At the
same time, the inherent constraints to effective public policy have been relatively
unchanged since the 2000-2005 period, notably the continuing high levels of
social deprivation, the inaccessibility of the poor and the low human resource and
capacity endowments within the public sector.
55. Taken together, these factors point to the need to moderate expectations regarding
the likely impact of Budget Support in the evaluation period. They constitute a
context likely to complicate the process of dialogue and constrain the ability to design
and implement good public policies and spending strategies. In short, they add up to a
challenging context for the successful implementation of Budget Support.
Prospects for the future
56. This evaluation seeks not only to assess the past but also to lay down recommendations
for the future. The assessment of future prospects will depend critically on political
developments during the 2014 election year but there are reasons to believe that the
future context for Budget Support should be better than it has been over 2005 to 2012,
although there remains at least one significant threat on the horizon:
§ Steady economic growth and fast increases in domestic revenue have created a
degree of fiscal space, which Mozambique has never experienced before. While
economic growth has averaged 7.3 % per annum throughout the evaluation period,
the revenue to GDP ratio has increased from 15.3 % in 2006 to 23.3 % in 2012 (IMF,
2014). If projections for continued economic and revenue growth are fulfilled, then
domestic revenue should exceed 25 % of GDP by 2018. This will permit Mozambique
to contemplate, from 2015 onwards, an ambitious programme of public spending
targeted on poverty reduction. In addition to expanded social spending and
investment in physical infrastructure as in the past, it will for the first time allow scope
for social transfers, targeted to directly address malnutrition, and other similar

49
Independent Evaluation of Budget Support to Mozambique, 2005 -2012
problems of social deprivation. Continued or even expanded provision of Budget
Support could allow such a programme to be quickly scaled up, without serious risk
to long-term fiscal sustainability.
§ Due to the rise of the MDM as a viable third party, the 2014 elections promise to
be more tightly contested than in the past, potentially heralding a period of
more responsive government. Although Renamo refused to participate in the
November 2013 municipal elections, MDM were able to compete with Frelimo in all
53 municipalities, winning the elections in three important cities – Beira, Quelimane
and Nampula, and securing a significant number of assembly seats in the key cities of
Maputo and Matola. With a further 9 months of preparation available, the October
2014 presidential and parliamentary elections promise to be more competitive than
the 2009 election. Frelimo as the incumbent government and the most established
party will clearly hold the upper hand but it will need to be more mindful of voters’
concerns than it has been in the past.
§ The increasing demand for evidence-based aid strategies, combined with the
availability of this evaluation creates a better framework for the design of
effective Budget Support to Mozambique. Led in large part by the efforts of
research based organisations like CGD and 3-i-e, DPs have been compelled to make
increasing use of evaluation studies, and in particular of impact evaluations. Different
agencies have responded to differing degrees to this trend but, in general, it has led
to a higher level of accountability and to a more careful use of evaluation evidence.
Notwithstanding the inevitable limitations of this evaluation, the mere existence of an
up to date evaluation should assist in the design of a more effective future Budget
Support package for Mozambique.
§ Mozambique’s forthcoming resource boom remains the biggest threat, opening
possibilities for unsustainable foreign borrowing, and creating a potential
incentive for less accountable and less transparent government. Resource
extraction will not bring significant domestic revenues to Mozambique before 2020
but it has already opened up the opportunity for borrowing against these future
earnings. The $850 million recently borrowed by the Government for tuna fishing
vessels for EMATUM and for naval patrol vessels is an indication of the sort of
commercial loans potentially available, where a government guarantee is provided.
However, at an interest rate of 8.5 %, this is relatively expensive financing and further

50
Independent Evaluation of Budget Support to Mozambique, 2005 -2012
borrowing at these levels could generate an unsustainable debt burden, particularly if
the resulting investments did not themselves serve to generate income. At the same
time, the investments associated with the resource boom will generate significant
opportunities for Mozambican businesses in the construction industry and in the
service activities, needed to support these large-scale investments. There are powerful
incentives for the political elite to secure preferential access to these opportunities,
and to design institutional arrangements which avoid transparency and public
accountability. To date, the work on the design of the legal and fiscal infrastructure
for the extraction industries has been undertaken in close partnership with the IMF
and has drawn on a wide range of international advice. Efforts have also been made
to reach EITI compliance. It is to be hoped that this approach continues and that
government leaders, officials, CSOs and citizens can work together with their
international partners to establish a mutually beneficial set of arrangements for
managing the resource boom.

51
Independent Evaluation of Budget Support to Mozambique, 2005 -2012
3. Providing the means to implement policy: Budget Support inputs and direct outputs
57. This chapter addresses levels 1 and 2 of the evaluation framework, covering Budget
Support inputs and their direct outputs. Thus, it brings together the responses to EQs 1.1,
1.2, 2.1, 2.2 and 2.3,, which are also presented in tabular form with details of data sources
and their quality in Volume Two. Here, we synthesise these responses in order to address
the crosscutting question: “how successful has Budget Support been in providing the
Government with the necessary means to implement the national poverty reduction
strategy?” We consider four aspects:
§ What has been the scale of Budget Support, the relative predictability of its
disbursements, and its effects on the harmonisation and alignment of aid as a
whole?
§ What mechanisms for policy dialogue have been established through the Budget
Support framework at the aggregate and sector levels and how successful have
these been in promoting sustainable and effective processes of policy analysis
and development?
§ What technical assistance and capacity-building inputs have been provided?
§ How has the design of the Budget Support process been adapted to the
changing context, and with what effects?
58. The definition of budget support used by the evaluation follows the 2006 OECD-DAC
criteria which defines Budget Support as follows: “budget support is a method of financing
a partner country’s budget through a transfer of resources from an external financing
agency to the partner government’s national treasury. The funds thus transferred are
managed in accordance with the recipient’s budgetary procedures”.
59. Arrangements that do not rely entirely on government procedures for management of funds are not considered budget support. During the evaluation period, Sector Budget Support arrangements have been put in place by the EU to support the agriculture and health sectors but these have not been managed by the government as Budget Support. The SBS resources transferred to the treasury account have been assigned to the project accounts, used for the management of the PROSAUDE and PROAGRI common basket funds. Once in these project accounts, the management of these resources follows procedures, which differ from national budgetary procedures in three important respects:

52
Independent Evaluation of Budget Support to Mozambique, 2005 -2012
§ The detailed budget for the use of these resources – that is the breakdown of spending by economic classifications and, where appropriate, programme classifications – is not submitted to the National Assembly for approval but rather to common basket fund committees, where external donors have a majority representation.
§ The use of resources during budget execution does not follow the rules of internal control laid down in the SISTAFE procedures: in particular, significant reallocations of resources are made without approval of the Ministry of Finance or the National Assembly, and substantial resources are used for the payment of salaries and salary supplements, which would not be permissible under these rules.
§ The balances in these project accounts remain available for spending after the close of the year, without their use having to be re-approved by the National Assembly.
60. Given these significant differences, the evaluation team has classified these resources as common basket funds (CBF) and not as sector budget support. However, the three major CBF arrangements - PROAGRI, PROSAUDE and FASE - have provided substantial sector funding, while contributing to capacity buidling and to policy dialogue at the sectoral level. The relative influence of these arrangements in comparison with Budget Support has therefore been a relevant question for the evaluation.
3.1. Scale & Predictability of Budget Support, and its effects on aggregate Aid flows
Table 7: Budget Support Disbursements by Development Partner, 2004 - 2012 AGENCY
(Millions of USD) 23 2004 2005 2006 2007 2008 2009 2010 2011 2012
GRANTS - - - - - - - - - Germany 3.99 4.34 11.93 13.49 16.74 18.67 18.98 18.08 11.62 Austria - - - - 2.47 4.33 3.90 4.62 3.10 Belgium 3.67 2.04 3.54 4.08 4.67 - - - - European Union 58.04 53.75 46.45 58.38 68.57 86.59 83.06 71.91 74.84 Canada - 2.03 1.90 4.26 7.57 9.89 14.21 16.03 14.84 Denmark - 9.54 2.49 19.20 10.55 8.51 7.34 12.96 10.69 Spain - 3.78 3.59 4.23 6.22 9.87 9.71 9.47 - Finland 4.55 4.91 5.85 6.79 10.39 8.76 8.43 10.31 9.27 France 3.77 3.19 3.24 2.65 3.04 3.10 2.72 2.90 2.52 The Netherlands 17.16 14.01 21.24 24.16 26.23 25.15 21.68 25.83 11.24 Ireland 7.01 6.03 6.80 12.28 15.17 14.82 14.72 16.12 11.55 Italy 3.78 3.32 3.55 5.35 5.86 5.27 5.68 5.28 5.14 Norway 8.12 15.04 17.01 22.61 29.70 23.82 27.74 29.58 23.44 Portugal 1.48 1.53 1.41 1.49 1.51 1.60 1.93 - 3.90 United Kingdom 27.53 46.37 55.69 69.81 81.71 58.30 54.16 136.44 77.65 Sweden 12.53 17.95 23.92 44.45 56.50 40.12 44.42 51.35 43.40 Switzerland 7.20 7.88 6.33 6.95 7.08 6.64 6.91 4.18 7.30 SUB TOTAL 158.84 195.73 214.95 300.19 353.98 325.43 325.59 415.06 310.48 LOANS - - - - - - - - - AfDB - - 58.08 30.29 32.31 30.28 30.05 28.20 30.32 World Bank - 65.91 56.48 69.37 72.09 78.72 88.77 92.90 108.07 SUB TOTAL - 65.91 114.55 99.66 104.40 109.00 118.82 121.10 138.39 TOTAL 158.84 261.64 329.50 399.84 458.38 434.44 444.40 536.16 448.86
Source: Direcção Nacional do Tesouro – Ministry of Finance.
23 Mid-year exchange rate MZM-USD for every June 1: 23.12 (2004): 23.75 (2005): 26.78 (2006); 25.92
(2007); 24.10 (2008); 26.50 (2009); 33.75 (2010); 29.53 (2011); 27.93 (2012)

53
Independent Evaluation of Budget Support to Mozambique, 2005 -2012
61. In nominal US dollar terms, budget support has increased almost three-fold from
2004 to 2012: from just under US $ 160 million to just under US $ 450 million24.
Budget Support flows peaked in 2011 with total disbursements of US $ 536 million25
(Table 7).
62. In terms of fiscal significance, Budget Support has had considerable importance,
comprising some 18.8 % of public spending at its peak in 2006 (Table 8). Since then, it
has decreased steadily, reaching 9.4 % in 2012. However, within this period the growth of
domestic revenue was dramatic, from 11.22 % of GDP in 2004 to 23.3 % in 2012. With
GDP itself also expanding rapidly, the relative significance of Budget Support has been
less in recent years than in the period 2006 to 2010.
Table 8: Disbursements of Budget Support and their significance 2004 2005 2006 2007 2008 2009 2010 2011 2012
Total Budget Support (Mill USD) 158.84 261.64 329.50 399.84 458.38 434.44 444.40 536.16 448.86
Budget Support as % GDP 2.9% 4.1% 4.9% 5.0% 4.6% 4.3% 4.8% 4.3% 3.1%
Budget Support as % Total Revenue 22.2% 30.5% 32.7% 31.4% 28.9% 24.3% 23.6% 19.6% 13.2%
BS as % Public Spending 11.2% 17.4% 18.8% 18.1% 16.6% 13.3% 15.0% 12.0% 9.4%
BS as % External resources (excluding
debt relief) 16.5% 30.5% 25.8% 34.2% 29.1% 21.4% 28.7% 24.4% 23.7%
Source: Ministry of Finance and BoM fiscal tables.
63. Over the 2005 – 2012 period, the proportion of Budget Support within total ODA
has represented on average just over 27 %, excluding debt relief, although this has
declined in 2012 to 23.7 %. Thus, as a consequence of Budget Support, and the fact that
most common basket funds are on budget, a large proportion of total aid has been
channeled through the national budget. However, the proportion of aid on budget
probably declined in 2012. Moreover, projects – virtually all of which are managed off-
budget - have represented a high proportion of ODA flows throughout the period (34%
on average).
24 Figures presented here and in Table 7 have been calculated based on actual disbursements in MZM
multiplied by its mid-year exchange rate (1st of June for each year). 25 This figure includes three payments by DFID which comprised part of a DFID BS operation for 2012,
but whose transfers were made in 2011: 540,153,108.40 MZM on July 7, 2011; 507,750,428.91 MZM on September 21, 2011: and 501,217,718.40 on December 13, 2011. If these disbursements had been registered by the DNT within 2012, total disbursements for 2011 would have been US $ 483 million.
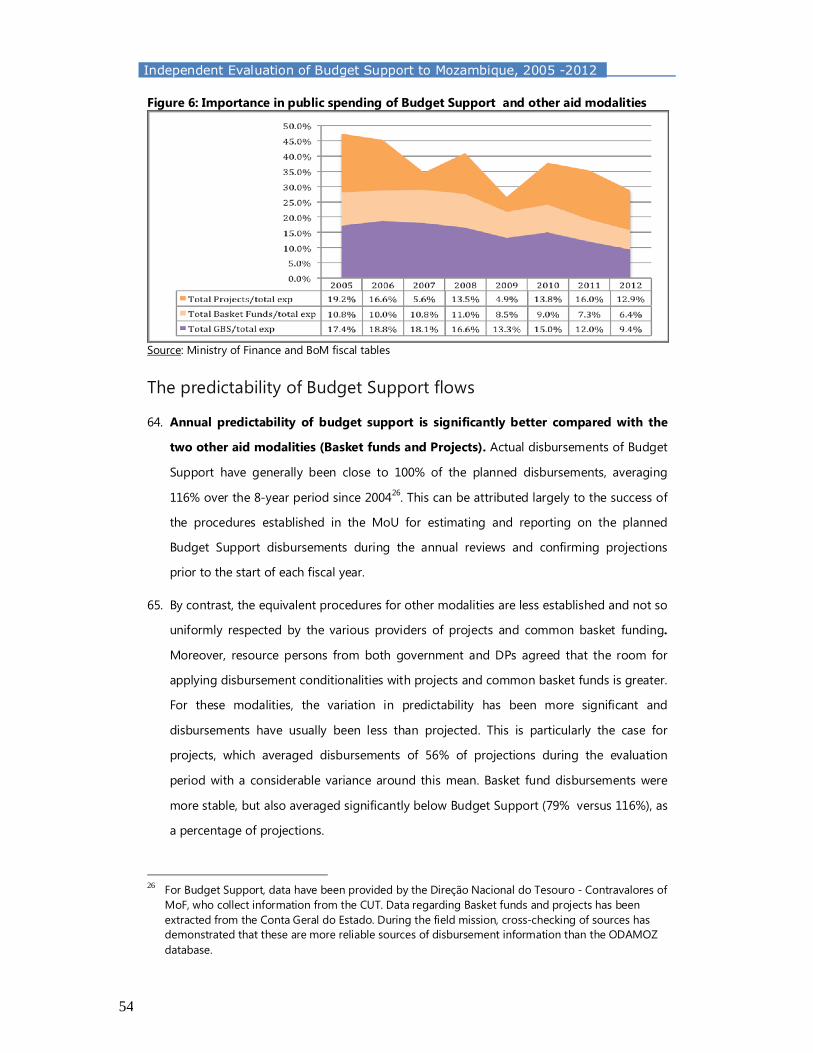
54
Independent Evaluation of Budget Support to Mozambique, 2005 -2012
Figure 6: Importance in public spending of Budget Support and other aid modalities
Source: Ministry of Finance and BoM fiscal tables The predictability of Budget Support flows
64. Annual predictability of budget support is significantly better compared with the
two other aid modalities (Basket funds and Projects). Actual disbursements of Budget
Support have generally been close to 100% of the planned disbursements, averaging
116% over the 8-year period since 200426. This can be attributed largely to the success of
the procedures established in the MoU for estimating and reporting on the planned
Budget Support disbursements during the annual reviews and confirming projections
prior to the start of each fiscal year.
65. By contrast, the equivalent procedures for other modalities are less established and not so
uniformly respected by the various providers of projects and common basket funding.
Moreover, resource persons from both government and DPs agreed that the room for
applying disbursement conditionalities with projects and common basket funds is greater.
For these modalities, the variation in predictability has been more significant and
disbursements have usually been less than projected. This is particularly the case for
projects, which averaged disbursements of 56% of projections during the evaluation
period with a considerable variance around this mean. Basket fund disbursements were
more stable, but also averaged significantly below Budget Support (79% versus 116%), as
a percentage of projections.
26 For Budget Support, data have been provided by the Direção Nacional do Tesouro - Contravalores of
MoF, who collect information from the CUT. Data regarding Basket funds and projects has been extracted from the Conta Geral do Estado. During the field mission, cross-checking of sources has demonstrated that these are more reliable sources of disbursement information than the ODAMOZ database.

55
Independent Evaluation of Budget Support to Mozambique, 2005 -2012
66. The relative importance of Budget Support has decreased during the period in
comparison with the other two modalities. Thus, if we consider the overall predictability of
the three modalities together, it can be observed that although Budget support serves to
make total aid more predictable, its declining relative weight limits that influence (Figure
7).
Figure 7: Actual annual disbursements as a percentage of the planned disbursements: Overall predictability of aid (left); Individual detail for each modality (right)
Source: CGE (2005-2012) and REO (2012)
67. The lack of predictability of projects and common basket funds has seriously
affected the execution of the budget. The levels of execution of the external
component of the development budget (i.e. basket funds and projects) are dramatically
lower than the internal component and also much lower than average disbursement rates
for Budget Support. Running a projection scenario, in which external projects and basket
funds are executed at the same rate as internally funded development spending, the
potential increment in public spending would have been equivalent to 5% of GDP in 2008
and 3% of GDP in 2012 (sky blue area in the figure below).

56
Independent Evaluation of Budget Support to Mozambique, 2005 -2012
Figure 8: The “lost” expenditure due to low execution rates of Common Basket Funds and externally financed Projects
Source: Fiscal tables from the Bank of Mozambique for years (2004-2011), fiscal table for 2012 from the IMF. Percentage execution of internal and external components from the CGE and REO for 2008 and 2012.
68. Budget Support disbursements are also projected by month. The timeliness of
disbursements within the year represents an important influence on treasury
management processes. For this reason, the MoU and many individual Budget Support
agreements emphasise that disbursements should be predictable, and ideally “front-
loaded” within the year. Over the evaluation period, an increasingly higher proportion of
BS funds were disbursed in the first two quarters. (Figure 9.)
Figure 9: Budget support disbursements “front-loaded” in the first two quarters
Source: CGE (2005-2011) and REO (2012)
69. From 2005 to 2009, the gap between quarterly projections and actual disbursements was
close to zero. Since 2010, differences have been higher, meaning that a greater
proportion of Budget Support disbursements are being delayed. Figure 10 shows the
difference between the projected Budget Support disbursements by quarter (as recorded
by MoF - DNT) and the actual disbursements in each quarter. When the difference is

57
Independent Evaluation of Budget Support to Mozambique, 2005 -2012
positive (as for the first quarter 2006), it means that the disbursements have been higher
than programmed. In general, we see that the differences are balanced out by the end of
the year, confirming the positive annual disbursement data reported above.
Figure 10: Differences between scheduled & actual GBS disbursements by Quarter (Millions of MZM)
Source: DNT – Ministry of Finance.
70. Field mission interviews suggest that the positive peak of 2006 is mainly explained by
shortcomings in the system of projection of disbursements, which were corrected in
subsequent years. Regarding the shortfalls in disbursements in the first two quarters of
2010, the first quarter of 2011 and the second quarter of 2012, documents and
supporting interviews confirm that these were the results of deliberate delays in
disbursements by some bi-lateral Budget Support providers, due to concerns over the
‘underlying principles’ for Budget Support having been potentially breached, through
electoral irregularities in the national elections of October 2009 (leading to the
subsequent “crispação” with Development Partners), health procurement irregularities in
2011 and education payroll irregularities in 2012.
71. There is some controversy over whether these three suspensions were justified. The
Budget Support MoU of 200927 includes a commitment by DPs to “not interrupt in-year
disbursements unless there is a violation of the underlying principles”. In each of these
cases, there were grounds to suspect that a violation of the underlying principles might
occur but subsequent corrective actions by Government prevented a formal violation of
underlying principles from being declared. Government stakeholders maintain that the
“pre-emptive” suspension of Budget Support by certain partners was not needed, while
several DPs expressed a conviction that corrective actions would not have been taken or
27 Point 25 of the Memorandum of Understanding (2009).

58
Independent Evaluation of Budget Support to Mozambique, 2005 -2012
would have been delayed in the absence of the decision to suspend disbursements. We
return to this point in Section 3.4
72. In practise, the financial costs of these temporary suspensions do not appear so great,
amounting to delays of 3-6 months in disbursements of amounts varying between US 50
and 100 million [i.e., approximately 3% (2010), 1.2% (2011) and 2.1% (2012) of public
spending]. The evaluation team were unable to discern any clear relationship between
Treasury Bill rates and delayed Budget Support disbursements in this period; nor were
there reports of damaging delays in authorisation of planned budget spending.
73. Thus, we conclude that the objectives of annual predictability and of “front-
loading” of disbursements were largely fulfilled during the evaluation period.
Budget Support providers were clearly conscious of the importance of these objectives
and managed to maintain good levels of predictability even through a period of difficult
financial circumstances in many donor countries. However, in-year predictability was
compromised in 2010, 2011 and 2012 due to concerns over potential violations of
underlying principles.
Evidence of positive effects of budget support on aid as a whole: harmonisation, alignment and use of country systems
74. How far has Budget Support had positive effects on the structure of aid as a whole? Two
direct effects envisaged from Budget Support are firstly an increase in the absolute and
relative level of aid managed through the national budget process (and more generally,
through country systems) and secondly an increase in the predictability of aid
disbursements. In addition, the Intervention Logic postulates that the harmonisation and
alignment of budget support inputs may contribute to the wider harmonisation and
alignment of external aid as a whole, with corresponding reductions in the relative
significance of transaction costs.
75. The importance of Budget Support within total ODA has decreased during the
evaluation period from over 30% to less than 25%. (See Table 8). In conjunction with
the lower predictability of projects and basket funds, this has meant that the predictability
of overall aid has declined over the evaluation period (See Figure 7, above.) Nevertheless,
it is quite conceivable that dialogue and management structures for Budget Support
should exert a positive influence on the management of aid, which is independent of the
scale of Budget Support.

59
Independent Evaluation of Budget Support to Mozambique, 2005 -2012
76. The monitoring surveys of the Paris Declaration show a positive trend in the use of
country systems from 2005 to 2010. (Table 9.) The sources of data for these surveys
may be subject to bias, given that they are questionnaire-based, and there is also doubt
over the precise definitions of “use of country PFM systems” that have been applied28.
However, the PEFA assessments also report a small improvement over the evaluation
period in scores for total ODA managed through national systems, scoring “D” (2006), “D”
(2008) and “C” (2010). The data reported on use of country systems within the PAF
indicators for the Programme Aid Partners (PAPs), show some improvement from 2006 to
2009 but suggest a decline thereafter, even though there are some issues of
comparability across the years. (See Table 9.)
Table 9: Trends reported in use of Country systems: Paris Declaration Monitoring Surveys and indicators in PAPs’ Performance Assessment Framework
PARIS DECLARATION MONITORING SURVEY 2005 2007 2010 Assessment
% of total ODA that use national PFM systems
36% 44% 47% Not achieved with progress
% of total ODA that use of national procurement systems
38% 54% 57% Not achieved with progress
Source: Paris Declaration Monitoring Survey.
ANNUAL REVIEW RESULTS (PAPs’ PAF) 2006 2009 2012 Trend
% use of national financial reporting systems 49% 68% 59% Not comparable series but
always below the target
% use of national audit systems 37% 47% 44% Not comparable series but always below the target
% use of national procurement systems 52% 70% 57% Not comparable series but
always below the target Source: Budget Support Annual Reviews.
77. Notwithstanding the decline in its relative influence since 2009, we conclude that
Budget Support made a positive contribution to harmonization of aid. Several
studies, notably the Paris Declaration Monitoring Reports record that at the beginning of
the period Mozambique was frequently used as an example of donor harmonization.
From the initial conception of the Budget Support architecture, DPs understood that the
GBS group should lead harmonisation efforts across a much wider front than just Budget
Support. Indeed, Mozambique is unique among major Budget Support recipient countries
in having established explicit links between the management framework for Budget
Support and the wider goals of aid effectiveness. 28 The final evaluation of the Paris Declaration acknowledged these weaknesses in the data sources for
the 2008 and 2010 monitoring reports and drew its conclusions predominantly from a new set of Country and Donor reports, specially commissioned for the evaluation.

60
Independent Evaluation of Budget Support to Mozambique, 2005 -2012
Figure 11: Results of PAPs’ indicators within the PAF over 2005 – 2012
Source: Budget Support Annual Review reports
78. Performance against DPs’ aid effectiveness indicators was strong during the period
2007 to 2009, after a period of fine-tuning of indicators over 2005-2006. This reflected a
mutual effort to increase the quality of DP performance under the umbrella of the aid
effectiveness agenda. However, since 2009 a sharp drop in achieved indicators is
evident, culminating in 2012 when 22 indicators out of 23 were not achieved. (Figure 11.)
79. Aggregating the assessment scores for the PAPs’s indicators over the whole evaluation
period, 44% were assessed as not achieved, while 42 % were assessed as achieved or ‘not
achieved, with progress’. (Figure 12.) The indicators related to alignment and
harmonisation scored relatively better, with 48% assessed as achieved or ‘not achieved
with progress’. As noted above the decline in performance is particularly notable since
2010, although there are some issues of comparability across the period due to changes
in the indicators.
Figure 12: Aggregate assessment of PAPs’ performance indicators, 2005-212
Source: Own compilation based on PAF indicator scores from Annual Reviews. 80. Government and DP stakeholders agreed that the Budget Support dialogue around
PAPs’ performance had fallen short of expectations since 2010. Among the reasons
presented, interviewed resource persons agreed on the following:
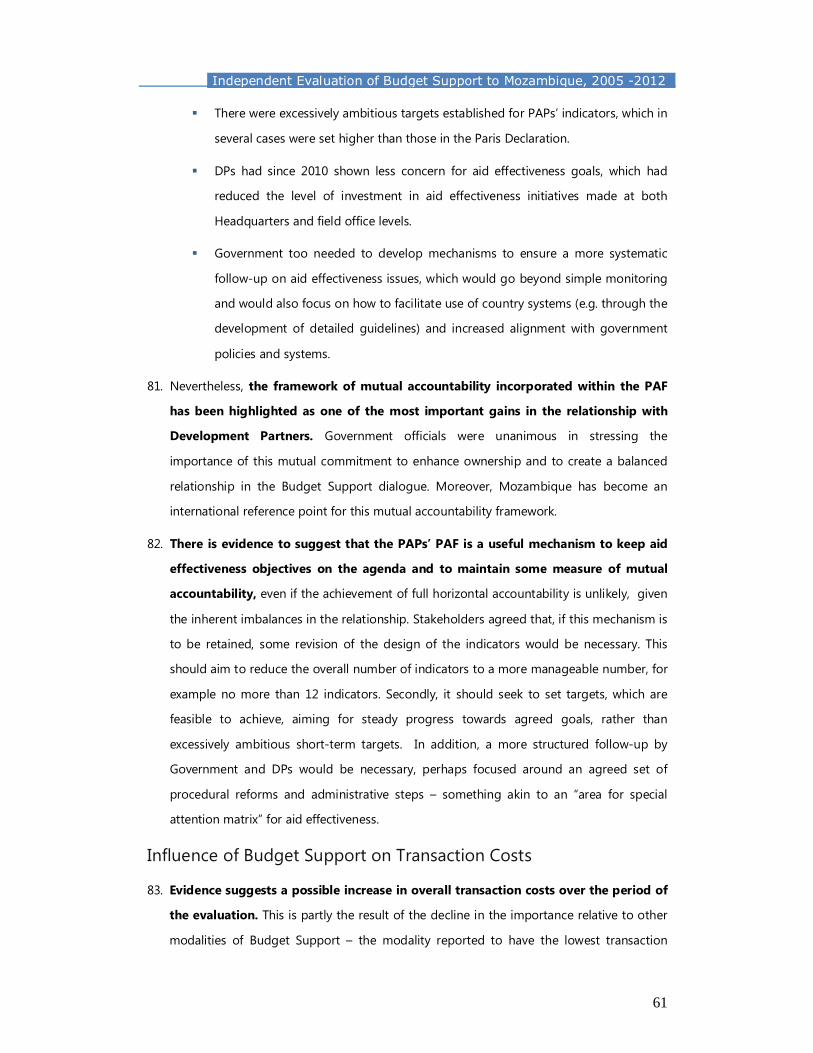
61
Independent Evaluation of Budget Support to Mozambique, 2005 -2012
§ There were excessively ambitious targets established for PAPs’ indicators, which in
several cases were set higher than those in the Paris Declaration.
§ DPs had since 2010 shown less concern for aid effectiveness goals, which had
reduced the level of investment in aid effectiveness initiatives made at both
Headquarters and field office levels.
§ Government too needed to develop mechanisms to ensure a more systematic
follow-up on aid effectiveness issues, which would go beyond simple monitoring
and would also focus on how to facilitate use of country systems (e.g. through the
development of detailed guidelines) and increased alignment with government
policies and systems.
81. Nevertheless, the framework of mutual accountability incorporated within the PAF
has been highlighted as one of the most important gains in the relationship with
Development Partners. Government officials were unanimous in stressing the
importance of this mutual commitment to enhance ownership and to create a balanced
relationship in the Budget Support dialogue. Moreover, Mozambique has become an
international reference point for this mutual accountability framework.
82. There is evidence to suggest that the PAPs’ PAF is a useful mechanism to keep aid
effectiveness objectives on the agenda and to maintain some measure of mutual
accountability, even if the achievement of full horizontal accountability is unlikely, given
the inherent imbalances in the relationship. Stakeholders agreed that, if this mechanism is
to be retained, some revision of the design of the indicators would be necessary. This
should aim to reduce the overall number of indicators to a more manageable number, for
example no more than 12 indicators. Secondly, it should seek to set targets, which are
feasible to achieve, aiming for steady progress towards agreed goals, rather than
excessively ambitious short-term targets. In addition, a more structured follow-up by
Government and DPs would be necessary, perhaps focused around an agreed set of
procedural reforms and administrative steps – something akin to an “area for special
attention matrix” for aid effectiveness.
Influence of Budget Support on Transaction Costs
83. Evidence suggests a possible increase in overall transaction costs over the period of
the evaluation. This is partly the result of the decline in the importance relative to other
modalities of Budget Support – the modality reported to have the lowest transaction

62
Independent Evaluation of Budget Support to Mozambique, 2005 -2012
costs; and partly a consequence of increased transaction costs within the Budget Support
process. The available evidence is indicative rather than conclusive, because it is based
almost exclusively on perceptions but all of these perceptions point in the same direction,
with no contradictory opinions having been identified. The evaluation team interviewed a
range of relevant government and DP stakeholders, including staff with a “central agency”
(i.e MF/ MPD) perspective and staff with sector agency perspectives. They were asked to
report their perceptions on trends in transaction costs over time and by modality. Results
were as follows:
§ There was unanimous agreement that the transaction costs per unit of aid
remained lower for Budget Support than for other modalities.
§ Nevertheless, the transaction costs for Budget Support were perceived to
have increased up to 2010, and more or less remained at that peak since then,
prompting what was perceived as a certain level of disinvestment in the modality
from both Government and the DPs, with less staff time dedicated to dialogue
and to Budget Support-related analysis.
§ A reduction in the number of PAF indicators for Budget Support was noted.
Nevertheless, this was perceived to have been counterbalanced by increasingly
protracted discussions during the Annual Reviews, and increasing use of
alternative performance assessment criteria, such as “areas for special attention”.
Although there was a wider range of opinions on this issue, the majority view
was that the reduced PAF had not yet succeeded in reducing transaction
costs.
§ The balance of opinion was that transaction costs for Basket Funds had
remained steady over time, as management and coordination procedures had
already been streamlined before the evaluation period.
§ No discernible change was reported in the transaction costs of projects, but
government resource persons, at central and sectoral levels, emphasized their
dissatisfaction with the excessively high transaction costs of the project modality,
as well as their concerns over the predictability of disbursements. (See Figure 7
above.)
§ Regarding the large vertical projects in the Health sector, Government found
the transaction costs of working with the Global Fund very high, and it is widely

63
Independent Evaluation of Budget Support to Mozambique, 2005 -2012
accepted that the transaction costs of the other vertical funds (PEPFAR, etc) are
relatively high since they include many parallel structures.
Table 10: Trends in PAPs performance indicators related to aid transaction costs 2006 2009 2012 Trend
% Programmatic Aid 70% 67% 63% Negative, and always below the targets Total number of missions 203 167 158 Positive but not achieving the target % of joint missions 10% 25% 26% Positive but not achieving the target
% of ODA using national financial reporting systems 49% 68% 59% Not comparable data set, but always below
the target % of ODA using national audit systems 37% 47% 44% Not comparable data set, but always below
the target % of ODA using national procurement systems 52% 70% 57% Not comparable but always below the target
Total number of Project Implementation Units (PIU) 21 20 26 Negative, and always below the targets
Source: Budget Support Annual Reviews
84. These perceptions are supported both by the Paris Declaration monitoring reports29 and
by the trends in PAPs’ performance indicators related to aid transaction costs (Table 10).
Although modest progress is reported in some areas, such as numbers of missions,
numbers of joint missions and use of country systems, none of the targets in these areas
have been accomplished as expected. Moreover, performance has deteriorated on the use
of programmatic aid and on the use of Project Implementation Units (PIUs).
3.2. Influence of Budget Support on policy dialogue processes
85. This section examines the extent to which budget support has contributed to sustainable
improvements in the processes and methods of policy development and monitoring - in
terms of institutionalising efficient frameworks, which involve relevant stakeholders, focus
on strategy and results and help to resolve policy dilemmas. We first examine the nature
and quality of the policy dialogue frameworks at national and sectoral levels and their
evolution over the evaluation period. We then consider the evidence that GoM structures
for policy dialogue have been influenced in a positive and sustainable way by budget
support processes, considering also the potential counterfactual that the positive
developments have been driven by SWAP frameworks or other non-Budget Support
factors. This latter analysis is focused on the agriculture, health and education sectors,
where the PROAGRI, PROSAUDE and FASE common funds are prominent.
29 See for example the Paris Declaration Monitoring Survey (2011): “There seems to be a certain
weariness with the lengthy and cumbersome process of coordination, and the associated transaction costs.”

64
Independent Evaluation of Budget Support to Mozambique, 2005 -2012
Framework for policy dialogue at national level
86. The G19 is widely acknowledged as the most influential group in Mozambique due
to the coordination structure related to it and the access to high-level dialogue with
the GoM, which it provides. Although the DPG consists of the heads of mission of
virtually all multilateral agencies and bilateral donors, including the G19 and non-GBS
donors, the group is primarily for information sharing within the development community
and does not interact as a group with the GoM.
Figure 13: Budget Support Coordination and Dialogue Mechanisms
Source: MPD 2013
87. The structure for policy dialogue and assessment of performance in GBS was formalised in
the 2004 Memorandum of Understanding and retained within the 2009 MoU. The
principal mechanisms for GBS coordination and dialogue are illustrated in Figure 13 and
are as follows:
§ Political dialogue: takes place at the Head of Mission/ Ministerial level.
§ The Joint Steering Committee/ Management Group is comprised of the
national directors of the MPD, MoF, MINEC and the Central Bank with the MPD
acting as chair. The PAPs are represented through the “Troika-Plus” which
comprises three members from the PAPs, who rotate every three years with one
new member joining each year. There are in addition two permanent members
(the World Bank and the EU).

65
Independent Evaluation of Budget Support to Mozambique, 2005 -2012
§ Sector and thematic groups report to the management group with the GoM
represented through sector ministry representatives and DPs through their
technical specialists. CSO representatives also sit on a number of sector and
thematic groups.
88. For the sector and thematic dialogue, a five pillar framework, matching the structure of
the PARPA I, was originally established, with pillars covering i) poverty and
macroeconomic management; ii) governance; iii) economic development and; iv) human
capital, in addition to a pillar on cross-cutting issues. There were also a series of working
groups beneath each pillar, with donor focal points and GoM group leaders assigned to
each working group. (See Table 11.)
Table 11: Pillars & Working Groups for PARPA/ Budget Support monitoring, 2004-2009
Thematic Pillars Working Groups
1) Poverty and
Macroeconomic
Management
Growth and macroeconomic stability
Poverty analysis and monitoring systems
Public financial management consisting of 5 subgroups:
budget analysis group, tax reform, procurement reform,
SISTAFE and Audit
2) Governance Public sector reform, Decentralisation, Justice sector
reform
3) Economic Development Financial sector
Private sector
Agriculture and rural development
Road sector (including telecoms and railways)
Energy sector
4) Human Capital Health
HIV/AIDs
Education
Water and sanitation
Cross-cutting Gender, Environment, HIV/AIDs
MoU Implementation PAPs assessment
Source: 2004 MoU for Budget Support
89. The working group structure changed in 2011 with the development of the PARP. This established a new structure that was more cross-cutting and thematic. It increased the number of pillars to six, including one on cross-cutting issues, and replaced the working

66
Independent Evaluation of Budget Support to Mozambique, 2005 -2012
groups with a series of thematic groups and sector groups. This new structure is shown in Table 12.
90. Stakeholders consider that, in the earlier years of budget support, the structures for
policy dialogue between the GoM and the G19 worked well, with dialogue reported
by both the GoM and donors as being reasonably effective. More recently there is a
general perception that there has been a deterioration in the quality of the dialogue. In
part, this deterioration is attributed to the changes in the structure of the pillars and
working groups introduced in 2011 - a structure which is not yet fully functional and
which is perceived, particularly by the DPs, as excessively cumbersome. In part, it is
attributed to a decrease in the commitment of both the Government and the DPs to
resourcing the G19 agenda.
Table 12: PARP/ Budget Support Working group structure 2011-2014
Source: MPD 2013
91. DP stakeholders report that the post-2011 framework for policy dialogue structure is not
yet fully operational and that the sequencing and links between the thematic groups and
working groups have in practice been weak. There has also been a lack of clarity over who
should attend these groups, and over which groups should be regular policy dialogue
groups and which need only convene for the Annual Reviews. In short, more operational
guidance from Government is seen to be needed in order to clarify the functioning of the
proposed structure.

67
Independent Evaluation of Budget Support to Mozambique, 2005 -2012
92. It is also reported that there is significant variability in the quality of the working groups. This is particularly because there has been difficulty experienced by the DPs in staffing some of the most important groups. There have been long gaps in the nomination of DP leads in key G19 working groups such as the Governance Pillar, the Poverty Analysis and Monitoring systems group, the Macroeconomic Pillar and the Budget Analysis Group.
The Performance Assessment Framework (PAF)
93. The Government’s Performance Assessment Framework (PAF) is a central element of the dialogue structure. It is a multi-annual matrix of policy targets, derived from the government’s poverty reduction strategies - PARPA I, PARPA II and PARP. It is the focus of discussions at the Annual and Half-yearly Reviews and together with the assessment of underlying principles is the principal basis for DPs’ decisions on disbursement of Budget Support. The preparation of an effective PAF is a challenging task, given that it strives to capture within a manageable and measureable set of annual indicators, a strategic and relevant way of measuring progress towards the achievement of the poverty reduction strategy, whilst also achieving a consensus between government and 19 DPs on the chosen set of indicators. Many countries have struggled to agree on a PAF that could fulfil all of these objectives30.
Table 13: Total numbers of PAF indicators per year by Sector/ Thematic Area Row Labels 2005 2006 2007 2008 2009 2010 2011 2012 Total % Public Financial Management 7 9 8 8 8 2 8 7 57 17% Justice sector reform 11 11 5 5 5 5 3 3 48 14% Decentralization 3 2 2 2 2 1 2 2 16 5% Public sector reform 1 3 3 2 2 2 2 1 16 5% Agriculture and Rural Dev. 6 4 5 5 5 6 7 8 46 14% Health 6 6 6 6 6 6 3 3 42 12% Education 4 4 3 3 3 3 4 3 27 8% Macroeconomic & financial Policies 9 8 1 1 1 1 2 23 7% Private sector 2 2 2 2 2 2 2 3 17 5% Water and Sanitation 2 3 1 1 1 2 2 2 14 4% Financial Sector 3 2 2 2 1 10 3% Roads 3 1 1 1 1 1 1 9 3% Social Action 1 1 1 1 1 1 6 2% Gender 1 1 1 1 1 5 1% Energy 1 1 1 1 4 1% Total Government 54 54 42 41 41 35 38 35 340 Alignment and Harmonization 12 8 7 7 7 9 10 7 67 39% Predictability 5 4 5 5 4 7 8 10 48 28% Capacity Strengthening 2 4 6 5 5 5 6 3 36 21% Portfolio Composition 2 2 2 3 3 3 3 3 21 12% Total DPs 21 18 20 20 19 24 27 23 172 Total (Gov. + DPs) 75 72 62 61 60 59 65 58 512
(1) Justice, Decentralization and Public Sector Reform are considered as Good Governance. (2) Figures show percentage by category for the Government PAF and the PAPs’ PAF taken separately. Source: Own compilation based on assessments in Annual Review reports
30 The case of Tanzania is an interesting case in point. See Lawson et al, 2013.

68
Independent Evaluation of Budget Support to Mozambique, 2005 -2012
94. How do we rank the quality of the Mozambican PAF? Evidence points to the following
strengths:
§ The PAF is closely aligned to the objectives and targets of the poverty reduction strategy. Taken together, Public Financial Management, Good Governance, Agriculture, Health and Education represent 74% of the total indicators scored. (Table 13). Although the number of PAF indicators has fallen during the period, the weight of these five areas has remained reasonably steady. Among them, Public Financial Management issues have been the most targeted area (17%).
§ The choice of indicators included in the PAF is strategic, in the sense of including issues of importance, which cannot be readily monitored and discussed in other fora. For example, the limited number of sectoral indicators in the PAF reflects the fact that there are sectoral working groups where it is more appropriate to give detailed attention to sectoral objectives and targets. Similarly, the reduced attention to macroeconomic issues reflects the fact that they are being addressed through the monitoring of the IMF Policy Support Instrument (PSI).
§ The number of indicators in the PAF has been reduced from 54 to 35. As we have noted, it is not generally considered that this has reduced transaction costs to date because the number of issues addressed in other ways (as “areas for special attention”) has increased. Nevertheless, the move to a more streamlined PAF should in the medium term restrain transaction costs..
§ Indicators are for the most part measurable, as may be seen from the relatively small number (3-8 %), which are annually classified as “Not Assessed” (N/A). (Figure 14)
§ The level of ambition of the targets for the PAF indicators looks broadly right. On average, slightly over 50 % of targets are assessed as achieved, with a further 30 % assessed as “not achieved but with progress”. (Figures 14 & 15.)
Figure 14: Performance of Government PAF indicators, 2005 - 2012
Note: N/A = Not Assessed.
69
Independent Evaluation of Budget Support to Mozambique, 2005 -2012
Figure 15: Performance of Government PAF indicators by sector/ theme
Source: Own compilation from assessments in Annual Review reports.
95. Based on these five criteria, our assessment of the Government PAF is that it fulfils its
intended purpose reasonably effectively and compares well with the PAFs used in
other Budget Support recipient countries. In stating this, we acknowledge that all
indicator-based assessments of public sector performance have at least two inherent
limitations. Firstly, they must focus on what is measureable, which is not always the same
as what is important, and, secondly, the adoption of indicators as policy targets almost
inevitably creates perverse incentives in the collection and reporting of data and/or in the
process of policy implementation31. Indicator-based assessments – such as PAFs - should
therefore be used as an overall guide to progress and should not be the sole method of
assessment.
Complementary frameworks for Dialogue & Performance Assessment
96. With the PAF essentially established as a mechanism to monitor progress towards results
indicators linked to the PARPA/ PARP, its effectiveness as the core of an overall system of
dialogue must depend significantly on the quality of the complementary frameworks,
which feed into this central structure. At present, there are three policy dialogue
frameworks additional to the PAF: 1) the “areas for special attention” which define policy
actions to be taken in high priority cross-cutting reform areas, such as payroll reform; 2)
the IMF’s Policy Support Instrument, addressing macroeconomic and structural issues;
and 3) sectoral performance matrices for the main sectors. We briefly assess each of
these in turn.
31 To be specific, the use of an indicator as a target may generate incentives to suppress the
dissemination of alternative indicators, which might cast doubt on the degree of progress being achieved or even to “doctor” the data related to the indicator to be reported. It may also encourage attention to those aspects of reform implementation most closely linked to the indicator itself, at the expense of complementary actions, also required for progress to be sustainable. “Goodhart’s Law” essentially states that these perverse incentives are inevitable whenever a performance indicator is adopted as a policy target.

70
Independent Evaluation of Budget Support to Mozambique, 2005 -2012
97. The “areas for special attention” essentially comprise matrices of policy actions and administrative reforms agreed between Government and the G-19, in order to address specifically identified policy problems, which are not adequately addressed through existing sectoral strategies and reform programmes. They have been used in an “ad hoc” manner to address gaps, which have been identified in the normal policy dialogue process. The Governance Action Plan (GAP), developed in 2010 by the Government in response to the concerns expressed by the G-19 over electoral fraud and over the weakness of anti-corruption measures was apparently the first such “area for special attention”. More recently, payroll reform has also been adopted as such, following revelations in late 2011 of payroll fraud in the education sector. In these two cases, Government and DP stakeholders recognised the usefulness of these matrices of policy actions and their value as a complement to the broader outcome targets captured in the PAF. However, stakeholders did express concerns about the potential proliferation of such matrices and the related transaction costs. There is also a doubt over how well these areas for special attention are coordinated and integrated with the monitoring of the PAF and with the wider structures of Budget Support dialogue.32
98. The IMF’s Policy Support Instrument (PSI) is the chief mechanism utilised by the Government for defining targets for macroeconomic policy and for related structural reforms. It is managed directly by the IMF in conjunction with the Mozambican authorities but there are structured points of interaction between the IMF and the G-19 at the time of PSI missions. As a mechanism for setting macroeconomic policy targets, defining actions to achieve those targets and measuring progress, the evidence suggests that the PSI mechanism is highly effective.
99. A notable point of comparison with the PAF is that, although the PSI is focused on a small set of quantitative and structural benchmarks, which are formally monitored, there is an in-depth analysis of the macroeconomic and other variables related to these benchmarks and a policy discussion, which is much more wide-ranging than these benchmarks. By contrast, in several areas of the PAF, evidence suggest that the discussion at the time of the Annual Review does not go much beyond the indicators themselves: there is neither sufficient analysis to assess why or why not indicators have been met, nor sufficient breadth of discussion to properly assess the policy implications33.
100. In principle, this more in-depth analysis and more wide-ranging discussion should be provided through the sectoral and thematic working groups but the evidence suggests that the quality of these groups is highly variable, which impacts directly on the quality of their inputs into the PAF Annual Review. We examine below the functioning of dialogue in three sectoral structures – for health, education and agriculture.
32 For example, for the purpose of this evaluation, documentation on these areas for special attention
was not available through the secretariat of the G-19 and had to be obtained from other sources. Thus, there may be other areas for special attention, of which the evaluation team were not made aware.
33 Clearly, the quality of the dialogue in the PSI process is enhanced by both the volume and the technical quality of the inputs provided by the IMF and by the Mozambican Authorities. The capability to provide equivalent inputs across the range of sectoral and thematic areas captured within the PAF does not exist and could not easily be created but there is certainly a need to strengthen the quality of research and analysis. We return to this point below.

71
Independent Evaluation of Budget Support to Mozambique, 2005 -2012
Sectoral and Budget Support dialogues in Health
101. A Code of Conduct signed in 2000 (revised in 2003) sets out the basic rules of
engagement between the Ministry of Health (MoH) and its partners. There is also a
Memorandum of Understanding (MOU) which sets out working arrangements that enable
structured dialogue and consensus building between MoH and DPs.
102. The SWAp is long established – preceding GBS at the national level, and this structure
has continued throughout the period under review. From 2007 the health sector has
evaluated its performance based upon a sector PAF. In 2012 the PAF comprised 35
indicators. Disbursements are based on overall “satisfactory performance” of the sector
against the Health PAF, including performance in financial management. Assessment
takes place through the annual joint reviews (ACA). The 2010 ACA was the first to be
based on the provisions of PROSAUDE II.
103. Although the health sector dialogue process has its own history, energy and
momentum, the GBS dialogue process and the health sector dialogue processes are
mutually supportive. The main formal links are two. First, the GBS dialogue is based
upon the strategies of the PARP (and PARPA II prior to 2011). Within this, health has been
designated as a priority sector and within the national dialogue process, the percentage
of funds allocated to priority sectors is tracked, the level of budget execution in health is
monitored, and notable developments within the sector are documented and discussed.
The profile of the sector is therefore raised by the national level dialogue, created by the
GBS framework.
104. Second, a number of indicators from the health PAF are elevated to the national level
PAF, and these are discussed within the GBS dialogue. At present there are three such
indicators, which are: (i) rate of coverage for institutional deliveries; (ii) number and
percentage of HIV+ pregnant women and newborns receiving PMTCT prophylaxis; and
(iii) the ratio of health workers in the areas of medicine, nursing and maternal/child health
per 100,000 inhabitants. These indicators were acknowledged in focus groups to be
important and highly relevant. Moreover, the team were informed by some health
partners that the selection of an indicator for the GBS PAF was useful in advocacy: in
bringing central level attention to bear upon issues of sectoral concern.
105. The indicators used in the health PAF over the period under review have been relatively consistent, but this is not true for the health indicators selected for the GBS PAF. They have varied in number. There were 6 health indicators in the GBS PAF from 2005 to

72
Independent Evaluation of Budget Support to Mozambique, 2005 -2012
2010 and in this period 14 different indicators were used, many for only one year before being dropped. In 2011 and 2012 there are only 3 health indicators in the GBS PAF. The steadiest indicators are rate of coverage for institutional deliveries (seven years out of eight) and the number and percentage of HIV+ pregnant women and newborns receiving PMTCT prophylaxis (all years). During the period these indicators have both improved substantially. The institutional births ratio rose from 49% to 64% over the period, while the PMTCT prophylaxis covered 84% of births to HIV+ women in 2012 as against only 6% in 2005. However, many factors are involved in the movement of these indicators, and it is not possible to say to what extent these areas benefited from their continuous presence in the GBS PAF.
106. In addition to these formal links between GBS and the health sector dialogue there are other links less easy to define. In particular health advisors raise issues with their HOMS, and health issues are also raised with HOCS who may take them to the G-19. They may use other fora strategically to push key health issues. In addition, it is likely that health has benefited from the cross-cutting issues debated and promoted at the G19, such as support for decentralization, the strengthening of PFM systems and the extension of the e-SISTAFE system into districts.
107. Another factor is that the health sector dialogue extends beyond the formal dialogue structures defined in the MoU. Major vertical projects such as PEPFAR, Global Fund, FORSASS and others all have their own dialogue arrangements and regular meetings with government. PEPFAR is present in all provinces, and has the opportunity for continuous dialogue at provincial level, which may over time influence policy. It is significant that the total amount of budgeted funding for vertical funds from the US Government alone exceeds $300 million in 2013, which compares with approximately $450 million per annum of GBS. The relationship between influence and funding levels is not quantifiable, but typically major funders expect to engage fully and robustly with government agendas, especially in their areas of support.
108. In conclusion, in the health sector there is no doubt that GBS dialogue and sector dialogue are mutually supportive and informants suggest that national level dialogue associated with budget support has provided additional weight in key policy areas. However, the evolution of health policy dialogue has been driven primarily by SWAP frameworks and reflects the ebbs and flows in the quality of dialogue between the Ministry of Heath and its PROSAUDE partners. The influence of GBS structures is certainly modest and, moreover, works alongside other competing sources of influence such as the vertical programmes.

73
Independent Evaluation of Budget Support to Mozambique, 2005 -2012
Sectoral and Budget Support dialogues in Education
109. In the education sector, clear structures exist for policy dialogue consisting of a
series of consultative and decision making structures. Over time the structures have
matured to better fit with national dialogue processes (including GBS structures).
These structures are well aligned with the policy priorities in the Education Plan.
Government informants unanimously underscore the importance of the policy dialogue
and its improved quality. Donor respondents acknowledge the added value of the
structures, and the improvements over time, but consider the sector structures
burdensome. This is in part because of a reducing staff contingent on the donor side.
110. The basic structure for education sector dialogue was established in 2002 at the time
that FASE (Fundo de Apoio ao Sector de Educação – Education Sector Support Fund) was
put in place. It continues to exist today, with minor modifications, mostly related to
frequency and duration of meetings. Memoranda of Understanding (MoU) have
governed the structures and processes. There have been three MoUs (2002 – signed by 5
partners; 2006 – signed by 10 partners; and 2012, signed by 9 partners). In 2008 an
addendum to the second MoU was made to accommodate the procurement
requirements of the World Bank, so as to channel FTI (Fast Track Initiative) funding to the
sector through FASE. The policy dialogue and monitoring takes place through a
structured set of fora, which meet at fixed times in the year.
111. Documentation and interviews with key informants highlight that over time the
dialogue process has matured and become more formalized. Measures taken have sought
to streamline both processes and results and have included changes in the timing of the
Annual Review to better align with the planning and budgeting cycle of the GoM. As the
systems for disbursement and reporting have become stronger, there has been a shift
from a concentration on process issues related mainly to financial management and
reporting, to discussion of policy implementation.
112. The policy discussion process has been influenced by global commitments and
initiatives. The FTI has been particularly important: “FTI supported existing government
education policies and had a catalytic effect on policy discussions, drawing attention to
areas that were not receiving sufficient attention” (Bartholomew et al., 2009). This included
the need for new, more sustainable policies in teacher education and school construction
but also attention to gender equity and to teacher salaries (Takala, 2008).

74
Independent Evaluation of Budget Support to Mozambique, 2005 -2012
113. A recognition of the importance of linking the sector processes to GBS
processes resulted in a fine-tuning of the structures and timing of major policy
dialogue events. In addition, the sector has chosen to use in a strategic way the three
education sector indicators included in the GBS PAF, so as to bring national level attention
to the issues of importance to the education sector:
§ Increasing the number of teachers has been the most prominent issue over the
period and a policy priority in the two most recent education sector plans. The
MoE has effectively used the PAF indicator on the pupil-teacher ratio, to argue
with the MoF for increased funding for teacher’s salaries.
§ The shift from monitoring Gross and Net Enrolment Rates to explicitly
monitoring right age enrolment in year 1 has helped to bring attention to the
strong link between improved retention rates/ lower drop-out rates and right age
enrolment in Year 1.
§ The focus on decentralization has brought with it a series of decisions around
the need for better monitoring of provinces and districts and improved support
for capacity development, especially at the district level.
§ A more recent policy discussion has been around learning achievement – i.e. the
quality dimension of education. On-going work at the time of this evaluation
related to developing a learning achievement baseline in primary education which
will be one of the three indicators to be monitored at the level of the G19 GBS
dialogue.
114. Thus, in the education sector too a robust framework of policy dialogue has been
built up drawing on the SWAP structures, which in fact preceded GBS at the national level.
Arrangements for sector policy dialogue have matured and improved over the years,
becoming more strategic, more policy focused and less process focused. This was
essentially an autonomous process, to which the GBS process contributed little if at all.
115. In more recent years, sector stakeholders have learned – just as in health - to use
the national level dialogue associated with budget support to lend additional
weight in key policy areas, notably the need to reduce pupil-teacher ratios through
teacher expansion, to introduce a learning achievement baseline so as to monitor the
quality of education more effectively, to manage the process of budget decentralisation
more effectively, and to give increasing attention not just to Gross Enrolment Rates but
more specifically to right age enrolment in year 1.
75
Independent Evaluation of Budget Support to Mozambique, 2005 -2012
Sectoral and Budget Support dialogues in Agriculture
116. The mechanisms for policy dialogue between GoM and PROAGRI donors have
remained more or less the same during the evaluation period. Since 1999 two annual
review meetings between the GoM and donors have taken place. The first - the
Agriculture Joint Review Meeting - occurs in the second quarter of each year and is
focused on discussion of the Annual PROAGRI Report. At the same time a draft annual
plan for the following year is presented and donors announce their planned commitments
for the coming year in the Harmonisation Report. The second meeting - the Agriculture
Mid-year Review Meeting, attended by donors, MINAG, MPD and MoF, is held in the third
quarter of each year and donors and government then confirm their respective
contributions to PROAGRI, based on the annual funding needs. The PROAGRI Working
Group, comprising representatives from MINAG and donors, meets at least once a month
and is the main fora for dialogue on operational matters.
117. Higher level policy dialogue takes place in the Fórum de Concertação which meets
every quarter and is the principal forum for dialogue on policy and strategic direction for
PROAGRI II. The Minister, Vice-Minister or Permanent Secretary of MINAG chairs the
forum and it comprises senior staff members of the MPD and MoF, donor representatives
and senior staff. However, more recently policy has become more fragmented, as the
government has developed policies outside the policy framework supported by PROAGRI
and has allocated significant resources to these processes, notably to the development of
the Programa Nacional de Investimento do Sector Agrário (PNISA – the National
Agriculture Sector Investment Plan), linked to the Comprehensive Africa Agriculture
Development Programme (CAADP), initiated under the auspices of NEPAD.
118. The conditionality framework for PROAGRI I based disbursements on planning and
financial management procedures, such as quarterly disbursement forecasts, a successful
annual review and audit. This led to PROAGRI I being criticized for being too concerned
with processes rather than results. The 2007 MoU therefore introduced a performance
assessment framework, with a matrix of agriculture sector performance indicators.
119. At this stage, the GBS PAF included five indicators for the agriculture sector, focusing
on public extension, irrigation and land registration. However, the 5 agriculture sector
indicators included in the GBS PAF were considered insufficient to assess performance of
MINAG and PROAGRI and a PROAGRI Performance Assessment Matrix, with twenty three
indicators was developed and annual targets established. These indicators and targets are

76
Independent Evaluation of Budget Support to Mozambique, 2005 -2012
reviewed annually by GoM and donors in the Agriculture Mid-year Review, which is part
of the broader GBS review.
120. As Cabral (2009) notes, the process of developing the PROAGRI PAF was not ideal,
which impacted on the quality of the matrix developed. The process was essentially driven
by donors on an ad hoc basis, through individual consultation with different parts of
MINAG. This has led to a disconnect between MINAG annual activity plans and the
indicators and targets in the matrix and as a result, the PROAGRI PAF is not taken
seriously by MINAG. The weaknesses of M&E systems are also still a major concern, while
there has been little involvement of non-state actors in policy dialogue and monitoring of
PROAGRI performance.
121. The link between the PROAGRI performance matrix and the agriculture indicators
included in the GBS PAF is less clear for agriculture than it is for health and education. The
number of indicators has increased gradually over time, reaching 8 in 2012 (See Figures
13, 14 & 15, above), although the focus on irrigation, land registration and public
extension has largely remained. In general, the assessment of these indicators has been
reasonably positive: over 2005 to 2012, 52% have been assessed as ‘achieved’, 24 % ‘not
achieved but with progress’ and 22 % ‘not achieved’. However, there is no clear sense that
indicators are being deliberately selected in order to increase the administrative attention
given to their implementation, and as we note in our analysis of agricultural policy and
spending in chapter 4, the indicators bear little relation to the policy priorities emerging
from research and evaluation. In particular, none of the 20 indicators used over 2005-
2012 related to the degree of access or use of fertilisers, improved seeds or pesticides,
despite the fact that agricultural survey data point clearly to input use as the principal
determinant of agricultural productivity, especially for smallholders. (See Chapters 4.4 &
6.)
122. To summarise, agriculture sector dialogue is based upon a set of well established
structures, which were established initially through PROAGRI and later linked to the GBS
PAF process. However, the functioning of these processes reveals a number of
weaknesses, which the link to the GBS process does not appear to have mitigated in any
significant way, notably:
§ The fragmentation of the national structures for agriculture sector policy making;
§ The weaknesses of monitoring and evaluation systems;

77
Independent Evaluation of Budget Support to Mozambique, 2005 -2012
§ The apparent disconnect between the policy targets in the PROAGRI assessment
matrix and the activity plans and budgets of the Ministry of Agriculture; and
§ The apparent disconnect between the agriculture sector policy targets in the GBS
PAF and the policy priorities emerging from agricultural research and evaluation.
Influence of Budget Support on Policy Dialogue Processes: Conclusions
123. Prior to the evaluation period, Mozambique had already established the core
essentials of a structured, harmonised assessment and disbursement process for
Budget Support, linked directly to the achievement of the targets in the national
poverty reduction strategy. This system has been preserved and refined. An
integrated annual review calendar remains in place, clearly linked to a network of sectoral
and thematic policy processes. The proceedings of the annual review process are open to
a wide range of stakeholders, their results are published and are generally the subject of
press releases.
124. In 2011, a number of changes to the framework for policy dialogue were introduced
to fit with the new PARP structure, which adopted a more thematic structure, designed to
encourage more inter-ministerial cooperation around a more cross-cutting, thematic
dialogue. Whilst the rationale for the new structure is clear, it seems that, in the
short term, its introduction has met with some “teething problems” and generated
additional transaction costs. Some simplification of the structure may perhaps be needed,
in addition to further guidance on how it is expected to work.
125. The dialogue framework was centred around two Performance Assessment
Frameworks (PAFs) one for Government and one for the Programme Aid Partners (PAPs).
There is evidence to suggest that the PAPs’ PAF is a useful mechanism to keep aid
effectiveness objectives on the agenda and to maintain some measure of mutual
accountability. However, stakeholders agreed that, if this mechanism is to be retained,
some revision of the design of the indicators will be necessary. This should aim to reduce
the overall number of indicators to a more manageable number, for example no more
than 12 indicators. Secondly, it should seek to set targets, which are feasible to achieve,
aiming for steady progress towards agreed goals, rather than excessively ambitious short-
term targets. In addition, it should be linked to a more formalised framework for follow-
up, which could potentially be structured as a joint GoM-PAPs matrix of administrative,
procedural and policy actions, akin to an ‘area for special attention’ for aid efffectiveness.

78
Independent Evaluation of Budget Support to Mozambique, 2005 -2012
126. Our assessment of the Government PAF is that it fulfils its intended purpose
reasonably effectively and compares well with the PAFs used in other Budget
Support recipient countries. Notably, it provides a strategic set of measureable targets,
which have worked reasonably well as a focus for dialogue. However, like all indicator-
based assessments of public sector performance the PAF has inherent limitations, which
suggests that it should be used as an overall guide to progress and should be neither the
sole method of assessment nor the sole locus of dialogue.
127. In this respect, the decision by Government and its Partners to assess the
progress of certain governance and public sector reforms through agreed matrices
of policy actions, described as ‘areas for special attention’ seems sensible, so long as
this does not lead to a proliferation of ‘ad hoc’ assessment frameworks. It would therefore
be advisable to formalise this approach so as to prevent such proliferation and so as to
ensure that these frameworks are recognised as legitimate, and are managed in a
transparent and objective manner, clearly integrated with the PAF and the wider GBS
dialogue process.
128. In stating that the PAF has functioned in a reasonably effective manner, we also
acknowledge that there are important policy objectives, related notably to agricultural
development and to poverty reduction where the Budget Support dialogue, focused on
the PAF, has failed to generate results. Some might argue that a more “strategic” selection
of indicators within the PAF would have generated better results in these important areas.
Yet, the PAF must necessarily reflect the nature of a given set of government policies:
setting targets for economic or social objectives, for which there is no clearly defined
policy would simply result in low scoring annual assessments, while potentially failing to
give credit and attention to other areas of policy achieving greater success. In this sense,
we would assert that the PAF can only build upon the existing body of policies, helping to
give focus to those policies, to establish sensible implementation targets and to provide a
public forum for their assessment. If there are economic or social objectives for which well
defined policies are missing, the PAF is unlikely to be the right instrument to generate an
appropriate policy analysis and development process.
129. In our opinion, it is the policy processes at sector and thematic levels, which should
generate the analysis, the testing of ideas and the debate from which appropriate policy
solutions should emerge. National policy structures, such as the PARPA/ PARP should
provide direction in relation to overall priorities but it is at the sectoral and thematic level
that the detailed analysis of problems and constraints should take place, leading to the

79
Independent Evaluation of Budget Support to Mozambique, 2005 -2012
development and consideration of different policy options, from which an
implementation strategy can emerge. The PAF can then consolidate policy targets and
provide a multi-stakeholder process for assessing progress and adjusting implementation
plans as appropriate.
130. Our assessment of the policy dialogue process in Mozambique suggests that the
main structural weakness lies precisely within the policy development process,
which should be situated at the sector and thematic level. There are several problems
of strategic importance to the PARP agenda – such as low productivity in agriculture, high
levels of malnutrition, a poor enabling environment for doing business - where effective
policy responses have simply not been generated. GBS has had only a limited influence
on policy development processes at this level. Four particular factors would appear to be
at play:
§ Firstly, the underlying capacity constraints from which Mozambique suffers –
noted in Chapter 2 as a key aspect of the context for Budget Support – mean that
policy analysis and development skills will always be at a premium. Capacity-
building inputs provided through the Budget Support process can help to
address these constraints (and we argue below that they have succeeded in
reducing such constraints in the PFM area) but there are limitations as to how far
external agents can help to develop internal capacity. Moreover, where Budget
Support dialogue is too wide-ranging, it may inadvertently dissipate the limited
existing capacity for policy analysis and development.
§ Secondly, sector level processes – as we have seen with the case studies of
agriculture, education and health – have their own history and their own
dynamics, on which the influence of the central level GBS PAF is modest at best.
Where the sector dynamics are good, such as in the case of education, the GBS
dialogue can help to sharpen the strategic focus and to raise awareness of sector
level issues; where the sector dynamics are less favourable, such as in agriculture,
a more interventionist approach would be needed in order to have any significant
effect: this may not always be possible and does not carry any guarantee of
success.
§ Thirdly, the disinvestment in the Budget Support process, reported by most
stakeholders to have afflicted both the DPs and Government, has clearly reduced
the administrative attention and analytical effort which might potentially be

80
Independent Evaluation of Budget Support to Mozambique, 2005 -2012
harnessed to address sector level policy problems. For Government, the cause
would appear to be the broadening of the Government’s own agenda, particularly
due to the need to address the policy requirements of the minerals and energy
sector. For DPs, this would appear to be a consequence of declining
administrative budgets and HQ pressures to reduce the degree of concentration
on Budget Support. Whatever the cause, this is a phenomenon to which most
stakeholders attest, and which few believe will be reversed. In these
circumstances, policy gaps at the sector level can only be effectively addressed
through careful prioritisation of the areas where policy analysis should be focused
and/ or through a more careful division of labour – both within government and
within the G-19 – so that available human and administrative resources are more
efficiently used.
§ Finally, many DP stakeholders have asserted that there has been a decline in the
quality of coordination within the G-1934. It is said that there has been a
consequent decline in the ability of the G-19 to develop well researched and
coherently defined policy positions and to harness analytical and financial
resources for the common good. Unfortunately, the evaluation team have been
unable to determine the root cause of these problems from the evidence
available but it seems clear that a concerted effort to revitalise coordination
within the G-19 will be needed if more effective attention is to be given to the
policy gaps at the sectoral level.
3.3. Contributions to capacity building
131. The provision of technical assistance and capacity building is generally perceived as
the third element of the “Budget Support package”. Such inputs would normally be
focused on aspects of policy, institutional reform and monitoring linked directly to the
Budget Support dialogue - such as support to the monitoring of the PRSP and to the
development of statistics, or to PFM reform.
132. In Mozambique, there is only a small minority of Budget Support operations
which make direct provision for the supply of technical assistance and capacity
building. From 2011 onwards there was none provided in this way, while, between 2005
and 2010, only 1 or 2 per year of the 17-19 DPs providing Budget Support made provision
34 Statements to this effect were made by several well informed DP stakeholders both during interviews
undertaken in the field mission and in the comments provided on the first draft of this report.

81
Independent Evaluation of Budget Support to Mozambique, 2005 -2012
for technical assistance and capacity building as part of their Budget Support financing
agreements. In these cases, they were general provisions, which could also be used to
finance studies (such as PEFA assessments), as well as technical assistance to support
monitoring and evaluation tasks undertaken for the Budget Support provider. The three
agencies, who were providing TA support in this way in this period – Danida, the EU and
KfW, did not provide detailed expenditure data on how these facilities had been utilised.
133. Some agencies have funding lines for Technical Assistance, which are managed
separately from Budget Support financing agreements but used to provide policy analysis,
advice and specific technical assistance in GBS relevant areas. For example, DFID report
that such a funding line has been used to fund technical assistance to the Public-Private-
Partnerships unit in MPD, to provide support to the drafting of legislation on State-
Owned Enterprises, to help establish the EITI Secretariat and to support the Ministry of
Justice in its anti-corruption work. Other G-19 agencies have similar budget lines of this
kind for GBS-related technical assistance but the evaluation team were unable to obtain
comprehensive documentation on such initiatives.
134. More structured programmes of technical assistance and capacity building have
been provided through common basket funding arrangements established to help
create capacity in key sectors or institutions. These were essentially of three types:
§ Support to PFM and governance functions through the common funds
established for (i) UTRAFE/ CEDSIF to cover the requirements of the integrated
financial management system (e-SISTAFE) and the PFM reform programme; (ii)
the Autoridade Tributária de Moçambique (ATM – the Tax Authority) to support
revenue administration reforms; (iii) the Tribunal Administrativo to support the
development of external audit capacity; and (iv) the Inspeção Geral de Finanças to
support the development of internal audit capacity.
§ Support to the national statistics system common fund, focused on the
development of statistical capabilities, linked to the monitoring and evaluation of
the poverty reduction strategy (PARPA I, PARPA II and the PARP). This common
fund was primarily focused on support to the National Statistics Institute (INE) but
has also provided funding for research studies undertaken by other organisations.
§ Support to the main sectors, notably Agriculture, Education, Health and Roads to
develop sector policy and planning capabilities and monitoring and evaluation

82
Independent Evaluation of Budget Support to Mozambique, 2005 -2012
capacity, as well as, in some cases, financial and human resource management
capabilities.
135. Of these three types of arrangements, the third type – linked to sector capacity
building – never had any significant links to Budget Support and grew in most cases out
of well-established SWAP arrangements in these sectors, such as FASE, PROSAUDE and
PROAGRI.
136. The common funds linked to PFM/ Governance functions and to statistical capabilities
had their genesis in the early period of Budget Support between 2000 and 2004 (Batley, R.
et al, 2006). As a funding arrangement linked directly to PARPA I, many of the targets in
the first PAFs for Budget Support related to improvements in these areas. At the same
time, the deficiencies in capabilities were abundantly clear and accordingly the
Government sought TA/ capacity-building support, which was provided through these
common funds.
137. By the beginning of our evaluation period in 2005, these funds had taken on an
institutional identity and a momentum of their own. Indeed, when interviewed,
Government and DP stakeholders stated that they believed these funds would continue to
exist, even if Budget Support were to stop. The link to the Budget Support process is thus
less strong than it was but these TA funds clearly operate as a complement to Budget
Support, and we therefore judge that it is still appropriate to conceive of these
arrangements as Budget Support inputs.
138. Taken together, the inputs provided by these common funds, alongside the
other funding lines linked more directly to Budget Support operations, amount to a
significant TA/ capacity-building input within the Budget Support package.
Unfortunately, due to the multitude of these arrangements and the range of funding lines
through which they have been provided, we have been unable to receive the detailed
project documentation, including progress reports and spending data, which would be
necessary to make a judgement about the efficiency and effectiveness of these TA/
Capacity-building inputs. However, Government stakeholders were all positive in their
appreciation of these inputs, both with regard to their relevance and the relative efficiency
with which they were provided.
139. There is evidence that the TA/ Capacity-building provided by the common
funds did generate important outputs, which in some cases facilitated the
production of the “induced outputs” targeted by Budget Support. This has been
83
Independent Evaluation of Budget Support to Mozambique, 2005 -2012
most notable with regard to PFM reforms and the strengthening of the capacities of the
Autoridade Tributária de Moçambique (ATM), the Tribunal Administrativo and the Inspeção
Geral de Finanças. We analyse these “induced outputs” in more detail in Chapter 4.
3.4. Adapting the Budget Support design to the changing context
140. Evaluation Question 1.2 asks how the context for Budget Support has evolved over
the evaluation period and whether the changes made in the scale and in the design and
implementation arrangements for Budget Support have been relevant to the evolving
context? In order to address this question, we first present a recapitulation of the main
contextual changes over the period. We then identify the key changes introduced in the
design and management arrangements. Finally, we consider the consequences of these
adaptations and the extent to which they represented an appropriate and adequate
response to the changed context.
Changes in the context for Budget Support over the evaluation period
141. As detailed in Chapter 2, the principal contextual changes over the period 2005 –
2012 may be summarised as follows:
§ The impact of the global financial crisis on Mozambique was relatively
limited. There was a fall in economic growth during 2008-2009 but
Mozambique’s rate of economic growth bounced back quickly, due to a
countercyclical policy stance, increased donor support, particularly through the
IMF’s Exogenous Shocks Facility (ESF) and an increase in lending by the domestic
banking system. By 2010, export levels had recovered and growth rates had
returned to previous levels.
§ The main economic transformation in Mozambique has been the discovery over
2010 – 2012 of very large deposits of exploitable gas in the Rovuma Basin. The
planned investments in the Rovuma basin, combined with the requirements for
the increased exploitation of gas reserves in the Mozambique Basin, and of coal
and heavy sands, amount to total FDI of some US $88 billion over the next ten
years, more than six times the current GDP. Significant domestic revenue flows
from resource exploitation are unlikely to occur before 2020 but this “mining

84
Independent Evaluation of Budget Support to Mozambique, 2005 -2012
boom” has the potential to raise per capita income levels dramatically and to
provide a major new source of domestic revenue.
§ Although the mining boom remains in the future, by 2013 steady growth in GDP
and in domestic revenue capacity had left Mozambique with an unprecedented
level of fiscal space. Economic growth averaged 7.3 % per annum throughout the
evaluation period, and the revenue to GDP ratio increased from 15.3 % in 2006 to
23.3 % in 2012 (IMF, 2014). Moreover, in 2013, the government received
substantial windfall revenues from the taxation of capital gains on the re-sale of
exploration contracts within the Rovuma Basin (equivalent to 4.2 % of GDP),
creating a significant capital investment fund.
§ The evaluation period has seen a growing concentration of political power,
combined with more serious electoral irregularities, and more widespread
incidents of harassment of civil society. The ruling party, Frelimo increased its
share of parliamentary seats from 129 out of 150 in 1994 to 191 in 2009. Voter
turn-out halved over the last four elections, meaning that the substantial majority
of 2009 was obtained with less than 30 % of the registered voters. There is
evidence that this concentration of power has distanced government from
citizens and reduced the need to listen to criticism and to alternative policy
voices. The irregularities noted in the 2009 elections, where observer groups were
highly critical of many pre-election and election day processes, provided a
tangible manifestation of this change. The campaign period leading up to the
2009 elections was also marred by a significant level of partisan violence, as were
the municipal elections of 2013. Some commentators (CESC, 2013) suggest that
harassment and intimidation of civil society has increased, a view supported by a
number of survey-based indices.
§ The relative shift in European opinion at public and official levels regarding
the desirability of Budget Support has also represented an important change
in the context for Budget Support. This is evidenced in the international
withdrawal from Budget Support by the Netherlands, and in the changes in
Budget Support policies introduced by the European Commission, Sida, SECO and
DFID. These changes have promoted more rigorous assessments of fiduciary risks
and attempts to develop more explicit links between disbursement modalities
and the results of Budget Support.

85
Independent Evaluation of Budget Support to Mozambique, 2005 -2012
Responses to the evolving context
142. Four types of changes have been introduced in the design and implementation
arrangements for Budget Support, which we examine in turn below:
§ A reduction in the scale of Budget Support disbursements relative to GDP and
relative to total public expenditure;
§ Increased use of variable or performance tranches, as a disbursement mechanism
for Budget Support;
§ Changes in the focus of dialogue, bringing new strategic issues into the Budget
Support agenda;
§ Increased attention to the underlying principles for Budget Support, and an
increased readiness to suspend disbursements when a risk of violation of
underlying principles is perceived.
143. In terms of scale, over 2008 to 2012 disbursements of Budget Support remained
broadly stable at an average of $464 million in nominal US dollar terms, having risen
by 75 % from 2005 to 2008. (Table 7) Although this represents a modest decline in real
terms, the relative stability of disbursements suggests that the falling support for Budget
Support noted amongst the majority of the bi-lateral agencies has not impacted
significantly on the magnitude of flows to Mozambique. The relative importance of
Budget Support has, however, declined in recent years both as a proportion of GDP, from
5 % in 2007 to 3.1% in 2012, and more significantly as a proportion of public spending
(18.1% in 2007 to 9.4% in 2012; Table 8). However, this change has been driven by the fast
growth in domestic revenues and in public expenditures.
144. One aspect of the changing design of Budget Support has been the increased
use of “variable tranches” (VTs) or “performance tranches”, in which the value of
disbursements is linked either to the completion of certain reforms or to the achievement
of specific service delivery outcomes. The EU, Sweden and Switzerland employed such
mechanisms from the outset of the period but Denmark, Germany and most recently the
United Kingdom have incorporated them during the evaluation period35. The relative
35 Interestingly, Ireland abandoned its use of variable tranches during the evaluation period. We have
unfortunately not been able to obtain documentation on the reasons for this change.

86
Independent Evaluation of Budget Support to Mozambique, 2005 -2012
importance of these variable tranches has remained quite modest36. The actual size of the
variable portion for the six Development Agencies using the instrument is shown in Table
14. In 2012, the maximum variable tranche disbursement would have comprised $70
million, of which $49 million were paid – approximately 11 % of total Budget Support
disbursements.
Table 14: Variable tranche disbursements, 2012 - 2014 2 0 1 2 2 0 1 3 2 0 1 4
p o te n tia l g ra n te d p o te n tia l g ra n te d p o te n tia l g ra n te dD o n o r's c u rre n c y (m illio n )D e n m a rk D K K 2 2 1 8 2 2 1 3 .2 2 2 1 6 .5U K G B P n o v a r ia b le tra n c h e 7 4 7 4 .4G e rm a n y E U R 1 0 8 5 4 5 n o t k n o w nS w itze r la n d C H F ? ? ? ? 4 3 .2S w e d e n S E K 1 8 0 1 1 5 9 0 6 7 .5 n o c o n tra c tE U E U R 2 1 1 4 .3 7 5 2 1 1 4 .3 7 5 2 1 1 4 .3 7 5
U S D (m illio n )D e n m a rk 3 .8 3 .1 3 .9 2 .3 3 .9 2 .9U K n o v a r ia b le tra n c h e 1 0 .8 6 .2 1 0 .8 6 .8G e rm a n y 1 2 .9 1 0 .3 6 .6 5 .3 6 .6 n o t k n o w nS w itze r la n d 4 .3 3 .4S w e d e n 2 6 .6 1 7 .0 1 3 .8 1 0 .4 n o c o n tra c tE U 2 7 .0 1 8 .5 2 7 .6 1 8 .9 2 7 .6 1 8 .9A ll V T s in U S D 7 0 .2 4 8 .8 6 2 .7 4 3 .0 5 3 .1 3 2 .0 Source: Orlowski, 2013
145. As can be seen from Table 14, the rate of disbursements of variable tranches was 70
% in 2012 and 69% in 2013, reflecting the fact that the majority of indicators were in fact
attained. Can we conclude from this that the increased use of variable tranches had a
positive incentive effect on government reform efforts? It has been impossible to
undertake a comprehensive assessment of this question essentially because it is too
complex a task to undertake with limited resources. There have been regular changes in
the definition of indicators across the evaluation period, the range of policy issues
involved is broad and the web of underlying causality mechanisms with which VT-induced
incentives would need to interact is too complex to untangle easily. However, we can
point to two sources of evidence:
§ The data as presented in Figure 14 in section 3.2 do not suggest any trend
improvement in performance against PAF indicators since 2010, when variable
tranches have been more significant. From 2006 to 2009, 45-60% of indicators
were assessed as achieved, and only 10-15 % as not achieved, with a relatively
large group (25-40%) assessed as ‘not achieved but with some progress’. Over
2010 – 2012, the number assessed as achieved remained broadly the same at 45- 36 We are indebted to Dieter Orlowski for the provision of information presented in this section:
Orlowski, D. (September, 2013), Impact of variable tranches on policy and reforms, Internal Note for Danida, Maputo.

87
Independent Evaluation of Budget Support to Mozambique, 2005 -2012
55% but the number assessed as not achieved rose sharply approaching 30 % in
2012, with a corresponding decline in those assessed as ‘not achieved but with
progress’. Clearly, there are several factors at play, including potentially more
challenging targets and/ or more rigorous standards of assessment, but the
simple numbers do not suggest a trend improvement in performance.
§ A more revealing body of evidence emerges from an internal study done for
Danida to assess the potential incentive effects of variable tranches. (Orlowski,
2013) Interviews were undertaken with the DPs using variable tranches within
their Budget Support operations as well as with officials from MPD and the
Ministry of Finance. As may be seen from Box 2, the results do not suggest any
systematic incentive effects.
146. Although indicative rather than conclusive, the evidence suggests that variable
tranches do not provide any significant additional incentive to meet reform targets. There
are already factors favouring reform progress – which is to be expected given that these
are targets agreed by Government and linked to national strategies and plans - but there
is no sense that those targets, to which DPs attach variable tranches are given any extra
priority. Indeed, Government stakeholders in interviews with Orlowski and with the
evaluation team quite pointedly stated that they considered it inappropriate to give
higher priority to some PAF targets over others.

88
Independent Evaluation of Budget Support to Mozambique, 2005 -2012
Box 2: Stakeholder’s feedback on the Incentive effects of Variable Tranches
Have variable tranches had positive incentive effects in Mozambique?
About two thirds of the variable tranches have been committed and subsequently disbursed in recent years. Does this suggest that incentives have worked? We wanted to know from donor representatives whether and how the variable tranche had contributed to this success.
Surprisingly, no one had a convincing story to offer. Rather, as one interviewee put it, a “happy confluence of events” resulted in difficult indicator targets being attained. One example is the internal revenue target. Most donors use this indicator as a trigger for the variable tranche. Yet, several motives drive the revenue collection effort: notably, there is a strong political interest in increasing public spending and reducing aid dependence and the target is an essential parameter in the IMF programme. As a result, the target is usually met, but probably not because of the additional incentive of receiving variable tranches.
Anti-corruption and procurement triggers appear in most donors’ variable tranches: progress is visible although still below expectations. Was progress due to the incentive effect of a variable tranche? Interviewees indicated that progress was made because of the threat that the donor appetite for GBS would fade quickly. Changes were prompted by the wider threat, not by the immediate effect of non-payment of variable tranches.
There was anecdotal evidence of effects on internal decision-making processes. The Ministry of Planning called a donor in order to clarify the exact definition of the target so that it would not be missed for lack of precision. A line ministry was called by the Ministry of Finance, to ensure that the sector would meet a target linked to a variable tranche.
We had expected the existence of an internal version of the PAF indicator table with amounts shown in the line of each indicator: it does not appear to exist. The PAF table is apparently monitored regularly by the Council of Ministers, and indicators linked to variable tranches are shaded; but the table does not show disbursement amounts.
We had also expected reports about the possible impact of incentives on decision-making within sectors and were interested in whether variable tranches have in fact strengthened the position of reform champions. No one had a story of this sort to tell.
Officials of the Ministries of Finance and of Planning stated that indicators to which variable tranches are attached do not receive higher attention than others. The government has defined its policies and uses a set of indicators to monitor their implementation. Giving special attention to areas where financial rewards can be attained would degrade others to second-class indicators, and should therefore be avoided.
Officials accept that donors have variable tranches essentially for domestic reasons, and see this as an element of risk. They were opposed to the idea of donors bunching up behind a reduced set of triggers, with higher values attached to each, because this could reduce predictability. The potential variability was presented as an unavoidable risk, not as a challenge to ensure predictability by influencing and closely monitoring results.
Source: Orlowski, 2013.

89
Independent Evaluation of Budget Support to Mozambique, 2005 -2012
147. Moreover, where Government has failed to meet targets linked to variable tranches,
there is no clear evidence that this has been due to a lack of political will or administrative
effort. Experience with the EU’s mechanism for determining the Millennium Development
Grant tranche is instructive in this respect. Under this mechanism, performance against
social sector outcome indicators over 2008–2010 determined disbursements for the years
2012–2014. The amount at stake (€15 million per year, €45 million in total) was significant.
The number of indicators (six) was limited, the mechanism was clearly defined, and
announced well in advance. The targets were drawn directly from sectoral and national
plans and they were neither controversial nor politically difficult. Yet, the assessment in
2011 was mixed: performance, as measured by the degree of achievement of targets37,
declined over the years and, as a result, Mozambique lost an annual €6.6 million of
potential budget support in each of the years 2012 – 2014.
Figure 16: Assessment of Performance to determine EU MDG tranche for 2012-2014
8
3. M DG Tranche – Performance on MDG Tranche (1/2)
Subs et of Indicators for the MDG Tranche 2008 2009 2010
Net enrolm ent at 6 years of age in Grade 1 - Girls
0,5 0,5 0,5
Conclusion rate in prim ary school, second leve l (EP2) - Girls
1 0,5 0
Coverage rate of institutional births 1 0 1DPT 3 and HepB coverage rate in children be tween 0-12 months
0 0,5 0
Num ber of inhabitants per qualified he alth worker
1 1 0,5
Total number of people (older than 15) be nefiting from Anti-Retro Vira l Therapy
0,5 1 1
67% 58% 50%
20%30%
50%
Total Score for MDG Tra nche = 55,83%MDG Tranche = 55 ,83% * € 45 m = € 25,125 m
(or € 8 ,375m/ ye ar instead of m ax of €15 m)
Source: Presentation by the EU on 02 June 2011, as quoted in Orlowski, 2013
148. Yet a closer examination of the targets reveals a set of relatively complex policy
37 The assessment process is deliberately kept simple: if a target is achieved (or nearly achieved) a
rating of “1” is given, meaning that the relevant indicator carries its full weighting; if progress towards the target is verified, a rating of “0.5” is given, hence the weighting of the indicator is halved; and if there is little or no progress a zero rating is given, meaning that the resources attached to this indicator are foregone.

90
Independent Evaluation of Budget Support to Mozambique, 2005 -2012
problems. For example, there are a variety of reasons – social, economic and cultural -
why both matriculation and completion rates for girls tend to be low in Mozambique.
Designing specific public policy interventions to address this problem requires a detailed
understanding of its causes and of how those causes may vary between rural and urban
areas and by locality. Dedicating resources to research and to pilot testing of potential
policy responses might thus have proven more helpful than the provision of a variable
tranche incentive mechanism. This is especially probable in the light of the known
weaknesses in the policy research and development process within Mozambique: to
expect this process to generate new and more effective policy solutions simply as a result
of a variable tranche incentive seems somewhat unrealistic.
149. The increased use of variable tranches in Mozambique has been primarily driven by
policy requirements from DP headquarters to show a closer link between Budget support
disbursements and the achievement of results. In addition, the selection of indicators
seems to reflect concerns over corruption and governance. Only the EU still attaches
variable tranches to service delivery, in health and education: attention has shifted to
governance issues: in particular, to indicators in the areas of anti-corruption, transparency
in natural resource management, procurement, external audit and internal controls.
150. There is no clear evidence that the increased use of variable tranches has
generated incentives to give increased attention or to dedicate additional resources
to the related reforms and policy actions. Moreover, increased use of this mechanism
has raised transaction costs (albeit fairly modestly to date) and there is a risk that it may
undermine the predictability of Budget Support. In addition – and perhaps most
significantly – it may have served to divert attention from addressing underlying problems
in the quality of research and policy development processes at the sector level.
151. In managing the implications for Budget Support dialogue of the discovery of
the extensive gas reserves in the Rovuma Basin, a different approach has been
adopted. The design of the future fiscal and institutional framework for natural resource
exploitation has been taken up as an important aspect of the Budget Support dialogue. At
one level, the way in which this was done was quite “traditional” – a PAF indicator on
progress to EITI compliance was developed and indicators related to transparency of the
fiscal arrangements for natural resources were included in the variable tranches. But much
wider efforts were made to promote debate and thinking on the optimum design of
arrangements. For example, various papers on the future management of natural
resource revenues were presented and discussed at the Nordic- Mozambique conference

91
Independent Evaluation of Budget Support to Mozambique, 2005 -2012
on inclusive growth of May 2012, study tours were organised to examine the experience
of other countries and substantial advisory support was provided by the IMF and by
Norway.
152. Thus, the approach adopted by the G-19 was to raise the profile of the natural
resource management issue and to provide exposure to international experience, not to
promote any specific institutional solution. Partly as a consequence of this approach, in
October 2012, after 3 years as a candidate country, Mozambique was granted the status
of a fully compliant member of the Extractive Industries Transparency Initiative (EITI).
Without doubt, this was an important step towards the establishment of transparent
contractual and taxation arrangements.
153. The other substantial change in the management of Budget Support has been
an increased vigilance over the respect for the underlying principles of Budget
Support, culminating in three cases of partial suspensions of Budget Support
disbursements. The most notable – and long lasting of these - was provoked in particular
by concerns of irregularities in the conduct of the 2009 elections. Although the EU and
other observer groups reported that the process of voting was conducted in a peaceful
and orderly manner, they were critical of the pre-election processes. In particular, it was
pointed out that the National Electoral Commission (CNE) decision to disqualify, for
ostensibly technical reasons, the MDM candidates’ nomination papers in 9 of the 13
parliamentary constituencies had substantially restricted voter choice38. Observers also
documented irregularities with election day processes, including ballot stuffing and
tabulation fraud at some polling stations, although these distortions were considered
insufficient to have affected the overall result of the election. (Freedom House, 2010).
154. The electoral irregularities reported, combined with on going concerns about slow
progress in the fight against corruption, prompted the G-19 Budget Support group to
report to Government that it felt that a breach of the underlying principles for Budget
Support might have occurred. This led to the suspension of Budget Support
disbursements by 4 DPs and an intense process of dialogue between Government and the
G-19, which became known as the period of “crispação” (“political tension”). As a result,
Government agreed to implement a Governance Action Plan, whose key elements
38 As a rough indication of the impact this might have had, if MDM had won the same percentage of
parliamentary as presidential votes (8.59 %), they would have won some 15-20 seats, as opposed to the 8, they actually won. Whether this would have been at the expense of Frelimo or Renamo is difficult to judge.

92
Independent Evaluation of Budget Support to Mozambique, 2005 -2012
included the preparation of revisions to the electoral law (drawing on recommendations
from the Constitutional Council, election observer missions, the Head of State and other
stakeholders), certain measures to promote political inclusivity, and a package of Anti-
Corruption legislation. In addition, an informal agreement was reached for the
Government to promote the acceptance of the MDM as a formal opposition “bancada”
(“bench”) – a proposal, which the parliamentary authorities accepted. Normally, MDM
would have required a minimum of 10 seats to obtain the status of a bancada; without
such a status, their rights to debating time and other such parliamentary privileges would
have been significantly restricted.
155. There were two further suspensions of disbursements due to concerns over
underlying principles, prompted by health procurement irregularities in 2011 and by
education payroll irregularities in 2012. There is some controversy over whether these
three suspensions were justified. The Budget Support MoU of 200939 includes a
commitment by DPs to “not interrupt in-year disbursements unless there is a violation of
the underlying principles”. In each of these cases, there were grounds to suspect that a
violation of the underlying principles might occur but subsequent corrective actions by
Government prevented a formal violation of underlying principles from being declared.
Government stakeholders maintain that the “pre-emptive” suspension of Budget Support
by certain partners was not needed, while several DPs expressed a conviction that
corrective actions would not have been taken or would have been delayed in the absence
of the decision to suspend disbursements.
156. We would judge that the suspension of payments in early 2010 was instrumental in
generating corrective actions at the time of the “crispação” but not necessary at the time
of the revelation of the education payroll fraud in late 2011/ early 201240. Problems with
the education payroll were identified by the Ministry of Education itself and both
corrective actions and further investigation of the source of the problems had been
initiated by the Government before the G-19 became aware of the problem. Under these
circumstances, there would not appear to be grounds for suspension of Budget Support,
even if there were good grounds for a discussion over the appropriate corrective
measures and for a process of follow-up to these measures – through the adoption of
payroll reform as an ‘area for special attention’.
39 Point 25 of the Memorandum of Understanding (2009). 40 Information on the circumstances of the 2011 suspension was not sufficiently clear to form a
judgement.

93
Independent Evaluation of Budget Support to Mozambique, 2005 -2012
157. The financial costs of these temporary suspensions were not so great but there may have been more serious and potentially lasting negative effects on the quality of the Budget Support partnership. The Budget Support partnership requires that disbursements should only be suspended in extreme circumstances, because the guarantee of a predictable flow of resources is fundamental to the partnership. Moreover, Budget Support supports the ongoing strengthening of PFM systems and of anti-corruption mechanisms: as these systems become stronger, the level of detection of fraud and mismanagement is likely to improve; to suspend Budget Support each time such a case is detected would be akin to “shooting the messenger” for bringing bad news. What is important to the Budget Support partnership is that cases of fraud should be made public and that adequate corrective actions should be introduced and vigorously pursued. The absence of such a process might legitimately be considered a violation of underlying principles but the occurrence of fraud should not, in itself, be considered as such.
Conclusions on the appropriateness of responses
158. To summarise, our judgements on the appropriateness of the corrective actions introduced in response to the changing context for Budget Support are as follows:
§ It seems appropriate that the relative scale of Budget Support has been allowed to diminish as domestic revenues have grown. Not only has this ensured that investments and service delivery processes previously financed by Budget Support can now be sustained with domestic financing, it has also helped to reduce the unusually high level of aid dependence, which had previously prevailed. However, the growth of domestic revenues has now generated a new opportunity for Mozambique by creating the fiscal space necessary to undertake more ambitious public spending actions to reduce poverty. If the Government of Mozambique can demonstrate its ability to allocate and implement an expanded public budget effectively, then there is every reason to maintain or even expand the current scale of Budget Support, given that such spending should be sustained by a growing domestic revenues over the medium term.
§ There is no evidence that the expanded use of variable/ performance tranches has generated positive incentive effects for the implementation of reforms or the achievement of specific service delivery results. It has allowed some Budget Support providers to signal to their domestic constituencies the nature of the results, which Budget Support is expected to generate. In the process, it may also have helped to improve the understanding of the Budget Support mechanism. If so, it would probably have been a worthwhile response to domestic concerns over the effectiveness of Budget Support. Moreover, within the period of the evaluation, the increased transaction costs, which these variable tranches have entailed, do not appear excessive and the relative impact on the predictability of Budget Support also appears limited. However, there is no evidence that these variable tranches have generated positive incentive effects for the implementation of reforms. Moreover, there is a danger that the growing interest in the use of such mechanisms may detract from efforts to provide direct

94
Independent Evaluation of Budget Support to Mozambique, 2005 -2012
support and advice to the government in the formulation and implementation of public policy. There continue to be significant weaknesses in the capacity to design and implement policy reforms and it is important to ensure that Budget Support dialogue, and accompanying capacity building efforts, are focused on resolving these weaknesses as effectively as possible.
§ The support provided to the Government to address the legal and institutional requirements for managing natural resource extraction and the accompanying revenues is a good example of the creative use of GBS dialogue and accompanying technical assistance. The G-19, along with the IMF, were quick to identify this need and provided support in an appropriate manner. It seems unlikely that progress towards EITI compliance would have been as swift as it was in the absence of this support.
§ There are indications that the apparent readiness to announce GBS suspensions on the grounds of potential violations of underlying principles is undermining the trust between Government and the G-19, and the quality of the related dialogue. The evaluation period saw three cases of partial and temporary suspension of Budget Support disbursements on the grounds that there was risk of underlying principles being violated. In the first of these cases – the ‘crispação’ of late 2009/ early 2010, we would judge that the suspension was justified and effective in generating corrective actions by government, which would probably not have all been undertaken in the absence of this suspension. In the latter two cases, in 2011 (prompted by irregularities in health procurement) and in 2012 (prompted by education payroll irregularities), the justification for suspension is less clear, and in 2012 in particular, does not seem to have been justified. The immediate financial implications of these suspensions were not so significant but the effects on the quality of dialogue may have been more serious. A measured response to cases where fraud or corruption is detected is essential, if open communication and constructive dialogue is to be maintained. In this respect, the revision of the approach to underlying principles, through the process of updating the GBS MoU, seems a welcome step in the right direction.
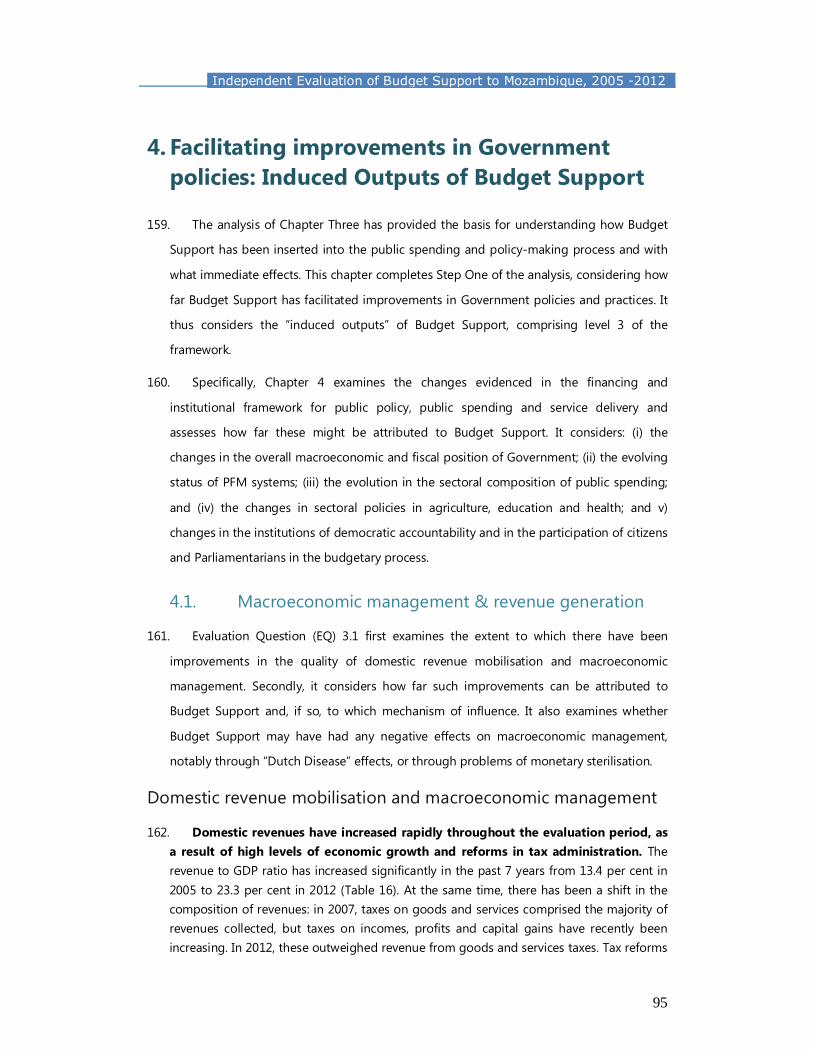
95
Independent Evaluation of Budget Support to Mozambique, 2005 -2012
4. Facilitating improvements in Government policies: Induced Outputs of Budget Support
159. The analysis of Chapter Three has provided the basis for understanding how Budget
Support has been inserted into the public spending and policy-making process and with
what immediate effects. This chapter completes Step One of the analysis, considering how
far Budget Support has facilitated improvements in Government policies and practices. It
thus considers the “induced outputs” of Budget Support, comprising level 3 of the
framework.
160. Specifically, Chapter 4 examines the changes evidenced in the financing and
institutional framework for public policy, public spending and service delivery and
assesses how far these might be attributed to Budget Support. It considers: (i) the
changes in the overall macroeconomic and fiscal position of Government; (ii) the evolving
status of PFM systems; (iii) the evolution in the sectoral composition of public spending;
and (iv) the changes in sectoral policies in agriculture, education and health; and v)
changes in the institutions of democratic accountability and in the participation of citizens
and Parliamentarians in the budgetary process.
4.1. Macroeconomic management & revenue generation
161. Evaluation Question (EQ) 3.1 first examines the extent to which there have been
improvements in the quality of domestic revenue mobilisation and macroeconomic
management. Secondly, it considers how far such improvements can be attributed to
Budget Support and, if so, to which mechanism of influence. It also examines whether
Budget Support may have had any negative effects on macroeconomic management,
notably through “Dutch Disease” effects, or through problems of monetary sterilisation.
Domestic revenue mobilisation and macroeconomic management
162. Domestic revenues have increased rapidly throughout the evaluation period, as a result of high levels of economic growth and reforms in tax administration. The revenue to GDP ratio has increased significantly in the past 7 years from 13.4 per cent in 2005 to 23.3 per cent in 2012 (Table 16). At the same time, there has been a shift in the composition of revenues: in 2007, taxes on goods and services comprised the majority of revenues collected, but taxes on incomes, profits and capital gains have recently been increasing. In 2012, these outweighed revenue from goods and services taxes. Tax reforms

96
Independent Evaluation of Budget Support to Mozambique, 2005 -2012
have strengthened the collection of income, profits and capital gains tax, while rising import volumes have boosted import tax revenues and domestic sales taxes. (Figure 17.)
163. Domestic revenues have however been inflated by VAT figures which have been calculated net of refunds. As a result, fiscal data over-estimate the levels of VAT receipts. There is also a backlog of VAT refund requests, which equalled 1.3 per cent of GDP in 2013. Moreover, the tax burden is quite narrow and unequally distributed with a heavier burden on Small and Medium Enterprises (SMEs), while there are exemptions for megaprojects. These concerns have generated discussion between the IMF and the Government over the possibility of suspending the 0.5% target for annual revenue growth, and introducing policies to ease the tax burden on small businesses.
Figure 17: Revenue Collections 2006-2012 (% of GDP)
Source: MoF and IMF
164. In 2012 and 2013, Mozambique received significant windfall receipts from taxes on capital gains arising from the re-sale by initial investors of exploration rights and shares in the gas sector. In 2012 these were equivalent to approximately 1¼ per cent of GDP (IMF 2013 Jan) and, over the course of 2013, they amounted in total to some US$ 400 million, about 2.5 per cent of GDP. How these windfalls will be spent is a matter of some concern, because significant expansion in recurrent spending will not be sustainable in the medium term, as further windfalls are not guaranteed. Discussions with the IMF are on going over the design of mechanisms to ensure these resources are utilised predominantly for productive investments.
165. Mozambique’s revenue performance compares well with other countries in the region. Domestic revenue collection as a percentage of GDP is significantly higher than in Tanzania (17.6 % of GDP in 2011/ 2012) and Uganda (15.6% in 2011/ 12) and compares favourably with Kenya (23.5 % of GDP in 2011/12.) This represents an exceptional performance by Mozambique, as Kenya has had a long history of tax reform and the size of its formal sector is larger than Mozambique’s (Various IMF Article IV Reports).

97
Independent Evaluation of Budget Support to Mozambique, 2005 -2012
Table 15: Minerals Sector Fiscal Frameworks for Mozambique & competing countries Royalty
Rates Corporate
Income Tax Accelerated
Depreciationi Effective Tax Rateii
Mozambique 3-10% 32% 25% 52% Botswana 3-10% 25% 100% 50% Ghana 3-12% 25% 75% 54% Namibia 5-10% 34% 33% 48% Tanzania 0-5% 30% 100% 45% Zambia 6% 25% 100% 47% Source: Hubert, 2012
166. The mineral sector has the potential to contribute substantially to future revenue growth, although major revenues are not expected for another decade. An important element of this is to have a good fiscal regime for the mineral sector, to ensure revenues are maximised. Work has already been undertaken on this with the existing regime tightened. In 2013 the Government approved draft revisions to the mining and hydrocarbon laws. As Table 15 indicates, Mozambique’s tax regime for the mineral sector has become closer to international norms and is similar to the core provisions in other African countries (Hubert 2012). However, despite contracts since 2007 needing to adhere to this new fiscal framework there have been concerns that some projects are given “one-off” exemptions.
167. Domestic revenue from coal and gas will grow gradually, only exceeding current aid flows of $1.2 billion in a decade’s time (IMF 2013). Over 2007-2011, investments in coal and liquid natural gas (LNG) contributed an annual average of less than ½ percentage point of GDP to total fiscal revenues, although coal royalty revenues have been more significant in 2012 and 2013. This is illustrated in Figure 18 below, which shows the projected levels of exports of these commodities (right-hand scale) and the coal and LNG contribution to fiscal revenues (left-hand scale) as a percentage of non-coal, non-LNG GDP. Over the short to medium term government revenue from coal and gas is projected to be small. It is estimated that total revenue from coal will not exceed 2 percent of GDP, whereas the LNG sector will only start production in 2020 and will not reach full capacity until around 2023.
Figure 18: Mozambique : Coal and LNG Contribution to Fiscal Revenue, 2011-2032
Source: IMF 2013

98
Independent Evaluation of Budget Support to Mozambique, 2005 -2012
168. Mozambique became a candidate for the Extractive Industry Transparency
Initiative (EITI) in 2009 and became compliant in 2012. This was an important step to
allow for the transparency of contracts, regulation, taxation and revenue (EITI 2012). This
has resulted in coverage of its reports on extractive industry payments and government
receipts expanding from 6 to 46 enterprises by 2013. Payments reported by mining
companies now correspond very closely to receipts recorded by government. In terms of
EITI membership, Mozambique is at a similar stage to Tanzania who also achieved EITI
membership in 2012.
Table 16: Overview of Central Government Fiscal Operations 2005-2012 (% of GDP) (Figures in % of GDP) 2005 2006 2007 2008 2009 2010 2011 2012* TOTAL REVENUE 13.44% 14.98% 15.92% 15.92% 17.81% 20.15% 22.07% 23.25% TAX REVENUE 11.02% 12.93% 14.12% 15.43% 15.61% 17.96% 18.69% 19.82% NONTAX REVENUE 2.41% 2.04% 1.81% 0.49% 2.19% 2.19% 3.38% 3.42% TOTAL EXPENDITURE 23.60% 26.00% 27.53% 27.73% 32.52% 31.68% 36.01% 32.63% CURRENT EXPENDITURE 13.42% 14.24% 15.33% 15.66% 17.44% 18.87% 19.45% 19.19%
Compensation to employees 6.83% 7.21% 7.75% 8.02% 8.87% 9.24% 9.76% 10.18% Goods and Services 2.90% 3.03% 3.16% 3.34% 3.40% 3.23% 2.96% 3.71% Interest on public debt 0.82% 0.77% 0.61% 0.52% 0.51% 0.84% 0.98% 1.01% Transfer payments 2.46% 2.53% 2.78% 2.91% 2.98% 3.00% 3.07% 1.99% Other 0.41% 0.70% 1.02% 0.86% 1.68% 2.55% 2.67% 2.30%
CAPITAL EXPENDITURE 8.64% 10.34% 11.22% 11.54% 13.32% 13.14% 15.53% 12.34% of which: locally financed 3.22% 3.64% 4.41% 4.55% 4.73% 6.06% 6.50% 6.06% of which: ext financed 5.42% 6.70% 6.82% 6.99% 8.59% 7.08% 9.04% 6.28% Net lending 1.43% 0.91% 0.79% 0.79% 1.66% 0.61% 1.00% 1.10% Unallocated revenue(+)/expenditure(-) 0.11% 0.52% 0.18% -0.26% 0.09% -0.94% 0.03% -0.12% Overall balance before grants -10.17% -11.03% -11.60% -11.81% -14.76% -11.59% -14.04% -9.50% Grants received 6.55% 9.96% 9.05% 9.42% 9.50% 8.31% 7.84% 5.38% Project 1.26% 2.42% 3.09% 2.56% 2.69% 2.03% 1.83% 1.79% Non-project 5.29% 7.54% 5.96% 6.85% 6.81% 6.29% 6.00% 3.59% Overall balance after grants -2.43% -1.06% -2.56% -2.39% -5.26% -3.28% -6.20% -4.12% Net external borrowing 2.96% 3.92% 2.39% 2.88% 5.07% 3.82% 4.67% 3.39% Disbursements 3.44% 4.52% 2.78% 3.19% 5.33% 4.15% 4.97% 3.79% Project 2.07% 2.82% 1.54% 1.48% 2.45% 2.18% 3.85% 1.65% Non-project 1.37% 1.70% 1.24% 1.71% 2.89% 1.97% 1.12% 2.14% Cash amortization -0.48% -0.60% -0.39% -0.31% -0.26% -0.33% -0.13% -0.39% Net domestic financing -0.22% -3.16% 0.15% -0.83% 0.29% -0.54% 1.50% 0.72%
Source: Bank of Mozambique, except for 2012 (IMF estimates from IMF, 2014). 169. Total expenditure has risen by more than 9 percentage points of GDP between
2005 and 2012, which is similar to the growth in revenue achieved. (Table 16.) Recurrent
expenditure has risen from 13.4 per cent of GDP in 2005 to an estimated 19.9 per cent in
2012. However, it has not outstripped revenue growth, hence, current levels of
expenditure should be sustainable.

99
Independent Evaluation of Budget Support to Mozambique, 2005 -2012
170. Development expenditure increased from 8.6 per cent of GDP in 2005 to 12.3
per cent in 2012, based upon an increasing level of domestically financed
Development spending, which rose from 3.2 per cent of GDP in 2005 to an estimated 6.1
per cent in 2012.
171. The overall balance before grants increased sharply in 2009 as a result of the
global financial crisis, but fell significantly in 2012, towards a more sustainable level.
However, a high proportion of deficit funding used to come from budget support grants
and loans, and from project grants and loans, both of which are decreasing. Net aid flows
have declined from 14.8 percent of GDP in 2009 to 12.8 percent in 2011.
172. External borrowing is likely over time to replace budget and project support for
the financing of capital spending, as investment needs will remain large. In the short
to medium-term government finances should benefit from on-going revenue reforms and
in the medium to long term from increasing revenue from investments in the extractive
industry.
173. Although Government should be able to sustain a higher level of borrowing in
the future, there is a risk of creating an imbalance between debt obligations and
revenue flows. The November 2013 dollar bond issue of US$850 million by a newly
created Mozambican state company EMATUM (National Tuna Company) gives some
indication of the potential risk. The interest rate on this loan was reported in the press to
be 8.5%, as compared with commercial loans, currently being obtained at 6.5% by Ghana
– another economy with expanding mineral resources. High interest rates of this kind,
combined with demanding principal repayment schedules may result in debt obligations
being “front-loaded” relative to revenue flows. There is also a need to plan public
investment projects carefully so as to ensure that they meet policy priorities and are
executed efficiently. There are on going discussions with the IMF over ways to improve
the institutional arrangements for public investment planning and management.
174. Over the evaluation period, Mozambique has remained on-track with the IMF
PSI programme. The majority of the performance assessment criteria have been fully
observed, and structural benchmarks have been met, although occasionally with delays41.
41 Recent delays relate to excess liquidity in late 2012 due to higher than programmed bank deposits
at the Central Bank, thus missing the assesment criterion on reserve money. Net international reserves also exceeded programme targets in 2012. The government revenue target was just missed in 2012, due to lower than expected inflation and problems with the introduction of the single-trade customs window (IMF 2013b).

100
Independent Evaluation of Budget Support to Mozambique, 2005 -2012
Macroeconomic stability and the business climate
175. GDP growth remained high throughout the evaluation period, averaging 7.3 per
cent annual growth. As we have noted in Chapter 2, the Mozambican economy was not
particularly affected by the global financial crisis.
176. Year on year inflation in Mozambique was 2.2 per cent in 2012 - the lowest in
SADC. This also compares favourably to the sub-Saharan average and to inflation
rates in the SSA frontier economies. (Figure 18.) Inflation averaged 10.2 per cent
between 2004-2008 and then declined significantly in 2009, before rising sharply again to
12.7 per cent in 2010 and beginning to decline again in 2011. This was due to a restrictive
fiscal stance by the government and favourable trends in international energy and food
prices. The CPI inflation rate is expected to have risen to 6 per cent by the end of 2013
due to food related price increases, although this remains in line with the government’s
inflation target.
Figure 19: Consumer Price Index 2000-2012, compared with SSA and frontier economies
Angola, Ghana, Kenya, Mauritius, Mozambique, Senegal, Tanzania, Uganda, Zambia, Zimbabwe,
Source: IMF 2012
177. Mozambique has made efforts to improve the investment climate, through
recent reforms related to improving business licensing and registration for small
businesses. Over the evaluation period, improvements were made in the time needed to
start a business. The number of days needed for this fell from 153 in 2005 to 13 in 2011.
However, the number of days taken to get electricity increased from 77 in 2010 to 107 in
2012, while there has been little change in registering a property, getting credit or
enforcing contracts.

101
Independent Evaluation of Budget Support to Mozambique, 2005 -2012
Figure 20: Global Competitiveness, 2012-2013: Mozambique & neighbouring countries
178. Mozambique still ranks low on international indicators of economic
competitiveness and the business environment. In the Doing Business Index,
Mozambique has remained at a ranking of 138 or 139 out of 183 countries, throughout
the evaluation period. In the World Economic Forum’s Global Competitiveness Report
2012-13, Mozambique was ranked 138 out of 139 countries in terms of economic
competitiveness, a fall from 133 in 2011-2012. This compares unfavourably with
neighbouring countries such as Uganda, Tanzania and Kenya, who are all ranked higher
than Mozambique. (Figure 20)
179. The Global Competitiveness Report 2013-2014 highlights the need for
Mozambique to invest in infrastructure in order to increase long-term
competitiveness. It also notes the importance of establishing a regulatory framework
that encourages competition and fosters economic diversification.. The Doing Business
Indicators 2012 and 2013 point to additional problems that constrain business activity,
such as obtaining an electricity supply, enforcing contracts, registering property and
resolving insolvency. However, the 2014 Doing Business Report notes that improvements
were made in 2013 to make it easier to apply for and receive construction permits and
licences for cross-border trading.

102
Independent Evaluation of Budget Support to Mozambique, 2005 -2012
Contribution of Budget Support funds to macroeconomic management
180. During the evaluation period, there has been a strong performance by
Mozambique in macroeconomic management:
§ Total spending has increased by 9 points of GDP as a consequence of both
expanded recurrent and capital expenditure, while domestically financed
development expenditure has almost doubled from 3.2 % of GDP in 2005 to 6.1
% in 2012.
§ Recurrent expenditure is estimated to be 19.2 per cent of GDP in 2012. This is a
level that could be sustained by domestic revenues alone.
§ Domestic revenue mobilisation has increased by 9.8 percentage points of GDP
over the evaluation period.
181. It is unlikely that the growth of domestically-financed capital expenditure could
have been achieved in the absence of budget support, without recourse to expensive
and probably unsustainable levels of borrowing. Until the discovery of gas in the Rovuma
Basin in 2011, Mozambique’s access to foreign commercial borrowing was quite limited.
Domestic borrowing was also constrained by the small size of the market for Treasury
Bills, and by the fact that in 2005 and 2006, the Government was carrying repayment
obligations due to the bank recapitalisation that took place in 2002. It might have been
possible to seek grant or concessional financing for the domestically financed capital
investments but foreign financed capital investments averaged 7.1 % of GDP through the
evaluation period. It seems implausible that there would have been the capacity to raise
foreign financing significantly above this level, given the complexity of the processes for
procuring such finance and the transaction costs and time lags involved.
Potential unintended negative effects of Budget Support funds
182. We have also examined whether these budget support flows had unintended
negative effects. There are three main ways in which this might have happened:
§ Through disincentive effects on domestic revenue collection;
§ Through “Dutch disease” effects, due to large foreign exchange inflows;

103
Independent Evaluation of Budget Support to Mozambique, 2005 -2012
§ Through the inflationary effects of large monetary inflows or through the costs of the monetary sterilisation measures taken to avoid these inflationary effects.
183. Following a brief gestation period in 2007 and 2008, when reforms to revenue administration were being introduced, revenue growth has been consistent throughout the evaluation period showing no clear relationship to fluctuations in Budget Support funding. Budget Support funding may have a disincentive effect on domestic revenue collection efforts by providing a source of budget funding, which does not carry the political costs of increased taxation. Clearly, domestic revenue performance in Mozambique has been impressive, but it is possible that in the absence of budget support, the incentives to increase the mobilisation of domestic revenue may have been greater. However, the data show a rate of revenue growth – particularly in tax revenues, which is probably without precedent for a non-oil economy in Sub-Saharan Africa.
184. Discussions with the Authorities and with the IMF strongly suggest that the desire for revenue growth has been unaffected by the presence of budget support as an alternative funding source In discussions with the evaluation team, the Mozambican authorities expressed a very strong commitment to reducing their reliance on external aid. As a result, the government has made significant efforts to develop the tax regime, establishing a clear fiscal framework for future taxation of extractive industries and renegotiating exemptions for some mega-projects. These perceptions were confirmed by discussions with the IMF, who have been consistent in their praise for the government’s efforts in revenue collection. Indeed, during 2013, the IMF has encouraged the authorities to contemplate the introduction of measures to reduce the tax burden, and has encountered some resistance to this proposal.
Table 17: Real effective exchange rate and Budget Support receipts (2005-2011): 2005 2006 2007 2008 2009 2010 2011
Real Effective Exchange Rate (% change on previous year)*
-6.3 1.8 6.5 11.8 -6.5 -15.1 19.7
Budget Support receipts (MZN million)
6,214 8,824 10,364 11,047 11,513 14,999 15,886
* Positive values represent an appreciation, negative values represent a depreciation.
185. Dutch disease effects occur when aid flows (or large-scale export earnings due to mineral exports) sharply increase the availability of foreign exchange, leading to an appreciation in the real exchange rate. This reduces the income of the traditional export sector, forcing its contraction. There has been considerable volatility in the real effective exchange rate in Mozambique: it appreciated from 2005 until early 2009. It then depreciated until the end of 2010, probably as a consequence of the global financial crisis and the related policy responses. Since 2011, the real effective exchange rate has remained above its average level but the IMF consider that this is likely to be at least partly due to the start up of coal exports in 2011 (IMF 2013).
186. There has been no systematic appreciation of the real exchange rate during the evaluation period. Nor is there any clear relationship to Budget Support inflows. (See

104
Independent Evaluation of Budget Support to Mozambique, 2005 -2012
Table 17.) It remains to be seen whether the real appreciation experienced since 2011 will push the real exchange rate above its (previous) long-term trend level. Even if this were the case, the fact that Budget Support flows have actually been decreasing since 2011 would suggest that this would be due to factors other than budget support.
187. A comparison of budget support disbursements with fluctuations in Treasury bill rates shows no indication of problems with monetary sterilisation. This can occur due to the lumpiness of Budget Support disbursements. However, comparing these with Treasury Bill rates, we see no evidence of “spikes” in interest rates in the periods immediately following large Budget Support disbursements. This suggests that there have been no significant sterilisation requirements – a fact confirmed in discussions with the Bank of Mozambique and the IMF.
188. The main negative effect of budget support has occurred as a result of disbursements being deposited at the central bank late in the fiscal year, with often large amounts of other funds being transferred at the same time. These higher-than-programmed bank deposits at the central bank have led to the IMF PSI target on reserve money being missed in both December 2012 and March 2013. However, this was a minor deviation of 3 per cent of reserve money or Mt 1 billion and was not particularly significant. It is also less a problem of monetary sterilisation due to budget support and more a result of a lack of coordination between the Bank of Mozambique and the Ministry of Finance. If the Central Bank and Ministry of Finance had both been aware of when to expect budget support payments, plans could have been made to increase foreign exchange reserves so as to neutralise the impact of these payments on the money supply. An action plan has now been drawn up to strengthen coordination between the two institutions and to ensure that this problem is addressed in the future.
Budget support policy dialogue on macroeconomic issues
189. There is little evidence that the PAF indicators and dialogue relating to strengthening revenue collection have influenced Government efforts in this area. Increasing revenue collection was a major Government objective as well as an objective in the IMF Policy Support Instrument (PSI) and the Government has had a good track record with the IMF over many years. Budget Support has supported this objective, rather than being instrumental in driving the momentum on this issue.
190. Similarly, interviews with the IMF, MoF and Bank of Mozambique confirmed the government’s political commitment to macroeconomic stability. It therefore seems certain that the Government would have pursued a stable macroeconomic policy even in the absence of Budget Support.
191. The dialogue and indicators related to the private sector have supported government actions in this area. Despite this, Mozambique has had a low ranking in global competitiveness and business environment indices, with little improvement over the evaluation period. We conclude that budget support dialogue has had little additional influence in this area.
192. Stakeholders report that monitoring progress on the EITI initiative through the PAF helped to add momentum to the process and thus contributed to the country

105
Independent Evaluation of Budget Support to Mozambique, 2005 -2012
achieving compliance. We judge that Budget Support dialogue had a positive influence in this area. There has been a significant amount of work undertaken by the G19 task force on Extractive Industries, which was used for political dialogue with the Government. There was also a PAF indicator from 2010, monitoring progress on the EITI initiative.
4.2. The quality of Public Financial Management
193. EQ 3.2 analyses to what extent there have been improvements in the quality of PFM and how far these may be attributed to Budget Support. This question is addressed in four parts:
§ Nature of PFM reform process and its relationship with the Budget Support process;
§ Evidence of the impact of these reforms on PFM systems and processes, drawing on the PEFA assessment findings (2006, 2009, 2011) and the UTRAFE / CEDSIF annual reports;
§ Relevance of current reform programme, considering progress achieved to date and challenges ahead; and,
§ Assessment of relative contribution to BS.
Relationship between PFM Reform and Budget Support
194. The Budget Support MoU sets out as an intermediate objective “providing financing to the public sector for poverty reduction, clearly and transparently linked to performance, in a way which improves aid effectiveness and country ownership of the development process, reduces transaction costs, allows for allocative efficiency in public spending and predictability of aid flows, increases the effectiveness of the state and public administration, improves monitoring and evaluation and strengthens domestic accountability”.42
195. This objective is in turn linked to the MoU underlying principles requiring from GoM the establishment of sound PFM systems and their maintenance and improvement over time (Section 4 of the MoU). 9 to 10 indicators have been regularly included in the PAF for PFM, emphasising its high profile in the Budget Support dialogue.
196. The assessment of PFM performance against the PAF has in general been positive. Over the 9 years from 2005 to 2013, 58 % of the PFM indicators were assessed as achieved, 35 % as ‘not achieved but with progress verified’ and only 7 % as not achieved. (Table 18). Interviews with GoM and DP stakeholders showed a high level of agreement on the relevance of the majority of the indicators, and in terms of the relative rankings of the priority of each indicator, this was the area of the PAF, where DP stakeholders showed the closest alignment with GoM and the greatest degree of harmonisation across DPs.
42 GBS MoU, 2006, Section 2, Article 7 ii)

106
Independent Evaluation of Budget Support to Mozambique, 2005 -2012
Table 18: Summary of PFM annual performance assessments in the Annual Reviews Year Status per JAR Aide Memoire Status per PAF Matrix
2005 “Performance in this area is at best mixed.” 9 indicators out of which 2 achieved, 5 partially achieved and 2 not achieved
2006
“The overall assessment of GoM performance in the area of Public Finance Management is positive, although there remain some important areas of concern. The recently performed PFM Assessment shows that there are still important weaknesses in the PFM framework and addressing these will require continued efforts in the coming years.”
10 indicators out of which 8 achieved and 2 partially achieved
2007
“In global terms progress has been recorded in PFM in the course of 2006, but some areas remain a concern and are challenges to be considered in 2007 and subsequent years.”
12 indicators out of which 7 achieved and 5 with progress on going
2008 “The assessment shows that significant improvements were obtained in the PFM quality, during the 2004-06 period”
8 indicators out of which 5 achieved and 3 with progress verified
2009
“The performance of Public Finance Management (PFM) was positive in 2008. The Government is committed to continuing and deepening the development of PFM systems, and having ascertained the need for a long-term strategy, decided to prepare a Strategic Public Finance Management Vision, to be concluded during 2009.”
8 indicators out of which 5 achieved and 3 with progress verified
2010
“Overall there was progress in the area of Public Finance Management (PFM), essentially marked by the consolidation of reforms initiated earlier. Nevertheless significant weaknesses and challenges remain to be faced.”
8 indicators out of which 5 achieved and 3 with progress verified
2011
“Global performance was mixed. (…) The PEFA assessment carried out confirmed important progress in the period 2007 – 2009 but also highlighted the need to address important challenges related to the consolidation of reforms (…)”
9 indicators out of which 5 achieved, 2 with progress verified and 2 not achieved
2012 “In general, performance was considered to be satisfactory.”
9 indicators out of which 6 achieved, 2 with progress verified and 1 not achieved
2013 “A good performance, in general, has been observed in PFM as a consequence of many of the reforms under implementation (…)”
8 indicators out of which 4 achieved, 3 with progress and 1 not achieved

107
Independent Evaluation of Budget Support to Mozambique, 2005 -2012
Evidence of Government commitment to PFM reforms 197. There has been a consistent government commitment to PFM reform since well
before the evaluation period. The development of the conceptual framework for the development of the SISTAFE (System for Administration of State Finances) and the drafting of its respective law and regulations represent tangible evidence of this, alongside the decision to develop the e-SISTAFE IT tool as the principal vehicle for implementation of PFM reforms. The key milestones within the PFM reform process are summarised in Table 19. These form part of a wider set of institutional and technical reforms, effectively initiated in 2002.
Table 19: Key Events & Developments in PFM (including the IFMIS) Date Key Event / Development in PFM (including IFMIS development from 2004 onwards)
2002 UTRAFE is established within MoF GoM starts to submit annually its Plan (PES) and Budget (LOE) to Parliament
New PFM system introduced (Law 9-2002)43
2003 Public Expenditure Review by World Bank
2004
Decree 23-2004 approving SISTAFE Regulation
1st External Audit Report by TA (CGE 2002) MoU for GBS signed and PAF adopted
Ministry of Finance and Plan separated into Ministries of Finance and Plan & Development)
Institutional development of UTRAFE and conclusion of first stage of e-SISTAFE development (November 2004)
2005
Introduction of new Procurement Regulations
Introduction of e-SISTAFE Rolling Plan (with gradual introduction from central to provincial and district levels) and move from advancement of funds to direct budget execution (process still on-going)
CUT in Meticais operationalized and the accounting module in e-SISTAFE secured; e-SISTAFE rolled out to Ministry of Finance, Education and MPD UTRAFE develops its first Action Plan and Budget for the period 2006-2008 and implements a new organizational structure.
2006
1st National PEFA Assessment (covering the years of 2002, 2003 and 2004) is concluded. Autoridade Tributária de Moçambique (ATM) – Mozambique Revenue Authority established.
Roll out of e-SISTAFE to a further 28 central level ministries and agencies Development of the Budget Preparation Module
Establishment of the Common Fund in support of SISTAFE development
2007
Approval of the Financial Management Manual by Government (Ministerial Diploma 169-2007), an important recommendation of the Tribunal Administrativo.
Roll out of e-SISTAFE to 4 remaining central level ministries
Development of the STA Multi-Currency. Development of the integrated database for staff and state agents using a census (single source for payroll processing)
2008 2nd National PEFA Assessment (covering Roll out of e-SISTAFE to 21 autonomous
43 Replacing the Regulamento da Fazenda the financial management regulations in use since 1901 !

108
Independent Evaluation of Budget Support to Mozambique, 2005 -2012
Date Key Event / Development in PFM (including IFMIS development from 2004 onwards) the years of 2004, 2005 and 2006) Budget Preparation Manual for OE 2009 introduces the programme based budgeting approach Start up of the process for the development of a PFM Vision / Strategy for 2009-2020
institutions at central level and 31 districts; Payment of salaries using direct execution modality in 22 central level institutions
Development of payroll, asset management, revenue collection and internal / external control modules and functionalities
2009
Revised legislation approved for Tribunal Administrativo (Law 26/2009)
Roll out of e-SISTAFE to provincial level institutions Pilot of the use of the programmatic classifier in 3 sectors (Public Works, Education and Agriculture) Conclusion of the staff census (102 sectors and 32.969 individuals registered)
2010
Procurement Regulations revised (Decree 15/2010) CEDSIF is established (merge between CPD and UTRAFE)
UTRAFE converted into CEDSIF and respective regulations approved Roll out of e-SISTAFE to 31 central and provincial level institutions and 21 districts e-Folha is further development and concluded e-Tributação starts to be developed for tax payments
2011
Mozambique adheres to EITI - the dialogue and debate around Natural Resources gains momentum; A new Public Enterprises Law is approved by Parliament; A law for PPPs, Large Scale Projects and Concessions is passed; Tax legislation is reformed and updated; 3rd National PEFA Assessment (covering the years of 2007, 2008 and 2009) PFM Vision document submitted to the Council of Ministers (covering 2011-2025)
Roll out of e-SISTAFE to 78 institutions (but financed directly by such institutions): 38 central level, 22 provincial level and 18 districts e-Folha is expanded to 116 central level institutions and 33 provincial directorates Conceptual model for Planning and Budgeting developed; Business Case for HR Module also developed.
2012
Preparation for IPSAS is started by Public Accounts Directorate of Ministry of Finance Development of IPSAS Action Plan PFM Vision document approved by Council of Ministers (June 2012)
CEDSIF revises its regulations and further develops its organizational set up 106 new institutions operating with e-SISTAFE: 27 central level, 64 provincial level and 15 districts e-Folha expanded to 595 institutions: 6 central level, 136 provincial level, 104 district level and 349 schools Automatized NUIT system established
2013 Review of the 2009 GBS MoU Implementation of IPSAS Action Plan
Roll out of e-SISTAFE to more institutions (70) e-Folha security functionatilities improved.
Source: Compiled by Mariam Umarji, MB Consulting

109
Independent Evaluation of Budget Support to Mozambique, 2005 -2012
198. An IMF mission concluded in 200944 that the level of satisfaction with the reforms
implemented was high and that important benefits had been generated. Missions that
followed (2010 to 2013) confirmed government commitment and the satisfaction of the
stakeholders involved. Weaknesses were also pointed out by the IMF missions – notably
fragilities in PFM not related to e-SISTAFE. These were issues related particularly to the
comprehensiveness of the budget and to internal controls. It was also pointed out that
the budget formulation and execution process was hampered as stakeholder knowledge
and understanding of e-SISTAFE was low. Ministries, auditors, donors and many other key
players lacked adequate knowledge about the functioning of the system. Weaknesses
were also identified in the functioning of e-SISTAFE and in the coordination provided by
the Technical Unit for State Financial Administration Reform (UTRAFE).
199. More recent missions from the IMF (December 201345) reported that progress with
structural reforms continued through several important measures, including:
§ Approval of the Action Plan for the Expansion of the Electronic Payment System
(including the e-folha) and the Civil Service Integrated Database (e-CAF).
§ Submission of Integrated Investment Plan to the Council of Ministers in July 2013,
with a commitment to further to ensure the link with the debt sustainability
analysis.
§ Staffing of a payment systems oversight unit in the Bank of Mozambique (BM)..
200. Regarding future reforms, it has been documented by the IMF that the Government
will continue to implement reforms to strengthen PFM namely46:
§ Wage Bill Management: The action plan to expand the system for direct salary payments to civil servants and agents in institutions with direct access to e-SISTAFE is being implemented (structural benchmark in MEFP-June 2013). The expansion of the payment of salaries by direct bank transfer to all institutions covered by e-CAF and with direct access to e-SISTAFE will be completed by March 2014 (structural benchmark). The Government will expand e-Folha to all
44 Teresa Dabán, Maria Betânia Gonçalves Xavier e Paulo Henrique Feijó, (March 2009) Avaliação Das
Reformas Da Gestão Das Finanças Públicas E Plano De Acção Para O Futuro, IMF Fiscal Affairs Department.
45 Letter of Intent, Memorandum of Economic and Financial Policies, and Technical Memorandum of Understanding, December 2013
46 The Staff Report for the First Review Under the Policy Support Instrument and Request for Modification of Assessment Criteria, January 2014

110
Independent Evaluation of Budget Support to Mozambique, 2005 -2012
civil servants in institutions with direct access to e-SISTAFE (about 90% of all civil servants) by end-2014 (structural benchmark).
§ Expenditure Execution: The roll out of e-SISTAFE has reached 69 per cent of all spending units (including at the district level). By end-2014 e-SISTAFE should reach 75 per cent of spending units and a full rollout is expected by end-2015. On July 1, 2013, the commitment component of e-SISTAFE was activated which will help to improve tracking all phases of the expenditure chain, from commitment to payment.
§ International Accounting Standards: a proposal for a new legal framework has been prepared (Normas e Plano de Contas) to meet international public sector accounting standards based on IPSAS. This proposal has been submitted to public consultation and will be submitted to the cabinet for approval in the first quarter of 2014. The implementation of this framework will require the approval by the Parliament and the subsequent revision of the SISTAFE Law, both expected by end-2014. The new accounting standards and the required adjustments to e-SISTAFE software are expected in 2015 in order to allow for the pilot implementation of the accrual accounting based on the IPSAS in 2016.
§ Economic Classification of Revenue: a new revenue classification has been prepared and is expected to be used in the 2015 budget, in line with best international practice.
201. In November 2013, the IMF also conducted a mission for the introduction of the Fiscal Transparency Assessment in Mozambique. This assessment plans to look into 3 key areas set out in the new Fiscal Transparency Code: Fiscal Reporting, Fiscal Forecasting and Budgeting, and Fiscal Risk Analysis and Management. Once the report is published and recommendations are discussed and agreed they should be properly integrated into the reform programme.
Impact of reforms on the quality of PFM systems
202. The Public Expenditure and Financial Accountability (PEFA) methodology provides an internationally accepted approach to the assessment of PFM systems. During the evaluation period, this methodology has been applied 3 times (2006, 2008 and 2010). The figure above groups the results of the 31 indicators of the PEFA into 8 categories in order to summarise the performance of the PFM system as presented in the 3 PEFA assessments47.
203. The most significant improvements over the period have been in the following areas:
47 Indicators are grouped as follows: Credibility of the budget – PI 1-4; Comprehensiveness &
Transparency – PI 5-10; Policy-based budgeting PI 11&12; Revenue collection & management PI 13-15; Cash management PI 16 & 17; Payroll, procurement & internal controls PI 18-21; Accounting, recording and reporting PI 22-25; External scrutiny and Audit PI 26-28. Indicators of Donor Practices have been excluded. The graphical presentation is derived by assigning a numerical value (from 1 to 7) to each possible score in the PEFA methodology (D, D+, C, C+, B, B+, A) and then averaging across each area of assessment

111
Independent Evaluation of Budget Support to Mozambique, 2005 -2012
§ Budget aggregates: the deviation between overall approved budget and the respective execution is reducing over time and in the case of revenues, execution now consistently surpasses the forecasted amounts (Indicators PI-1 and PI-3);
§ Comprehensiveness and transparency of the budget is improving: the budget documentation presented to Parliament has improved significantly (Indicator PI-6);
§ Tax administration (access to, compliance with and control of taxpayers) and revenue management (including the collection of revenues and respective transfer and reconciliation with Treasury) have improved significantly (Indicators PI-13, PI-14 and PI-15).
§ Better use of budget classifiers at budgeting, execution and reporting stages alongside the generation of more consistent and regularly available information (Indicators PI-5 & PI-10);
§ The introduction of and gradual roll out of the electronic salary payment system (e-Folha) is contributing to better payroll management and control performance (Indicator PI-18); and
§ Accounts reconciliations are regularly and timely undertaken due to the use of direct budget execution in e-SISTAFE combined with the introduction of CUT (Indicator PI-22).
§
Figure 21: Comparison of PEFA Scores for Mozambique - 2006, 2008 and 2010

112
Independent Evaluation of Budget Support to Mozambique, 2005 -2012
204. Performance has deteriorated in two areas:
§ Credibility of the budget, at the level of the composition of expenditure out-turn
by ministry or institution (Indicator PI-2); and
§ The quality of Legislative scrutiny of the annual budget law has fallen due to the
fact that the MTEF (CFMP) is not submitted to Parliament meaning that scrutiny of
medium term government policies is weak (Indicator PI-27).
205. Finally, Indicator PI-23 related to “Availability of Information on Resources Received
by Service Delivery Units” has performed poorly in all the three assessments scoring a D,
largely because a PETS survey has not been undertaken. (It was also a PAF indicator for
many years and later dropped from the matrix).
The relevance of the current reform programme
206. There are six strategic objectives set out in the 2011 – 2015 PFM vision document:
§ Objective 1: Establishment and modernization of the programme based
approach to planning and budgeting and accounting alongside the
decentralization of budget execution to the lowest level of budget holders of the
system;
§ Objective 2: Increase internal revenue and savings and adjust expenditure
patterns to the internal resources available;
§ Objective 3: Improvements in the state asset management capacity as well in the
management of government shareholdings and interests in companies; proper
management of public debt and of social security;
§ Objective 4: Proper accounting and reporting from all budget holders and state
institutions regardless of their autonomous status;
§ Objective 5: Decision making processes based on proper data generated
through trustworthy management information systems with consequent
improvement in internal control, monitoring and reporting;
§ Objective 6: Modernization of processes, systems and technological
infrastructure based on the training and valorisation of national human resources.

113
Independent Evaluation of Budget Support to Mozambique, 2005 -2012
207. In the strategy, the leadership of reform coordination and management is given to
CEDSIF (Centro de Desenvolvimento de Sistemas de Informação de Finanças – the Centre
for Development of IT Systems, resulting from the merger between UTRAFE and CPD, the
former Data Processing Centre of the Ministry of Finance.) Yet, the details on how this will
be operationalized are missing. Moreover, it is not clear whether it is appropriate (or
feasible) for a unit primarily responsible for the IFMIS (e-SISTAFE) to lead a set of reforms,
which are much wider in their coverage. This links back to the IMF recommendation (IMF,
2009) to clarify who within the Ministry of Finance should coordinate and manage the
overall reform programme.
208. The PEFA assessments and other available documentation clearly demonstrate that
substantive improvements have been achieved in the quality of PFM systems.
Nevertheless, there are major challenges that lie ahead and it is not clear that an
adequate framework exists to address these challenges. In particular, we note the
following:
§ The 2011 – 2015 PFM Vision document presents an ambitious vision. Yet, it is
of necessity a complex reform programme and it is not clear that the reform ideas
as presented are sufficiently developed to be confident of effective
implementation:
o The sequencing of reform actions remains incomplete. Although this can
be addressed, to a degree, during implementation it presents real
challenges, for which well-qualified advisory support will be needed.
o A specific problem of sequencing is presented by the need for clear
conceptual designs to precede the development of IT solutions. While
this is not always possible and it can sometimes be advisable to pilot
potential solutions before finalising the conceptual design, there are
areas of reform where IT solutions are being developed before
conceptual models (and the related framework of rules and regulations)
have been tested and finalised. This is the case, for example, in relation to
programme budgeting and also with regard to the geographical
decentralisation of budget execution, where the issues related to
decentralization vs. deconcentration of execution have yet to be clarified.

114
Independent Evaluation of Budget Support to Mozambique, 2005 -2012
o There is also a problem with the scope of reforms, whose focus is on
central government rather than on the broader public sector. In the new
era of extractive industries, there has been a proliferation of public
enterprises, joint ventures and PPPs, new types of autonomous funds and
institutions and other forms of government business, which generate
major risks of actual and contingent liabilities. There is a need for more
comprehensive attention to the monitoring of fiscal risks, within a “whole
of government” perspective.
§ In relation to the coordination of reforms, two problems remain. The first is
over the appropriateness from a technical perspective of CEDSIF as the reform
coordinator, and the second is over the level of authority CEDSIF can exercise, in
trying to monitor and coordinate the actions of other departments with a higher
level of seniority and status. The coordinator of reforms should ideally have a
wider perspective on PFM issues and a higher status, in order to exert authority.
§ Regarding the advice and support available through dialogue with the G-19,
two questions arise. Firstly, can adequate technical expertise be marshalled to
give useful guidance on reform sequencing and the other more complex technical
issues? Secondly, can this advice be provided in a coherent, integrated and timely
way?
209. To a degree, each of these problems has been present in the past during the
implementation of the government’s PFM reforms. As Mozambique moves to more
complex, “second generation” reforms, it becomes more important to address these
weaknesses in a systematic way.
The contribution of Budget Support to PFM reform
210. The TA and capacity building support provided to PFM has been essential to the
success of the reform programme and without doubt, the central place of PFM in
the Budget Support dialogue has had a positive impact on the pace and content of
reform:
§ There has existed throughout the evaluation period a clear PFM reform
programme, to which Government has shown a demonstrated commitment.

115
Independent Evaluation of Budget Support to Mozambique, 2005 -2012
§ Nevertheless, the prominent role of PFM reform in the Budget Support
dialogue and in the PAF process have influenced the pace of PFM reform
and the direction: in particular, stakeholders agree that, in the absence of GBS,
external and internal audit would not have been accorded the degree of attention
they received, and that the roll-out of the e-SISTAFE system would probably have
been slower.
§ The joint analytical work developed by the G-19 PFM working group has
also contributed to improvements in the focus and design of the PFM reform
program.
§ Also important have been the technical assistance and direct financial
support to PFM reform provided through the common funds for e-SISTAFE, for
the ATM (Autoridade Tributária de Moçambique – Mozambique Revenue
Authority), for the IGF (Inspeção Geral das Finanças – the Finance Inspectorate or
Internal Audit service) and the Tribunal Administrativo (TA – the Supreme Audit
Institution). Budget Support dialogue provided the framework in which to identify
needs and track progress, creating a strong synergy with capacity building
through these common funds, which themselves were initiated through the
Budget Support process (See Chapter 3.4).
4.3. Changes in the composition of public spending
211. Evaluation Question 3.3 aims to assess changes in the composition of public
expenditure, in sector policies, and in the resulting composition of spending outputs, and
to examine to what extent these changes may be attributed to Budget Support. In this
section, we examine changes in the economic and sectoral composition of spending. In
section 4.4, we address the second part of the question, presenting our analysis of the
evolution of policies in agriculture, education and health. In chapters 6 and 7, we then link
this analysis to the Step Two analysis of the outcomes and impacts of the agriculture and
education sectors.
Influence of Budget Support on the economic composition of spending
212. In section 3.1, we examined the principal changes in the economic composition of the
budget, as illustrated in the overview of Central Government Fiscal Operations presented
in Table 16. Over the evaluation period (2005 – 2012), we noted that:

116
Independent Evaluation of Budget Support to Mozambique, 2005 -2012
§ Total spending increased by some 9 percentage points of GDP, as a consequence
of both expanded recurrent spending (approximately 5 percentage points) and
expanded development spending (approximately 4 percentage points).
§ Domestic revenue collection expanded dramatically during the period rising from
14.1% of GDP in 2005 to 23.5% in 2012. Income and profit taxes were the most
important component boosting this performance.
§ Recurrent expenditures stabilised at 19.4% of GDP in 2011, and have since 2010
been fully covered by domestic revenues.
§ Within recurrent expenditures, there was an increase in the relative weight of
wages and salaries, which rose from 6.8 % of GDP to 10.2 %, although allocations
for goods & services and transfers also rose modestly.
§ Annual interest payments increased marginally from 0.8 % to 1.0% of GDP
213. These changes in the composition of the budget have served to protect
development spending, while maintaining recurrent spending at a level that could
be sustained from domestic revenues. A significant part of the increase in salary
spending has been due to the expansion of staff in priority sectors, notably health and
education but salary increases have also been significant. With the salaries budget
exceeding 10 % of GDP in 2012, it has reached a level which is high by international
standards. Allocations to transfers and subsidies (4.3 % of GDP in 2012) have also been
relatively high, in part due to the fiscal demands of the government’s fuel subsidy. Thus,
while development spending has been protected, this has been more a consequence of
fast revenue growth rather than control of recurrent expenditures.
214. Issues related to the economic composition of spending do not receive
significant coverage in the PAF. The G-19 Budget Analysis Group does undertake
analysis of this issue, which is considered during Annual Review discussions. For example,
comment has been made on the rising salaries: GDP ratio. Nevertheless, the evidence
does not suggest that budget support-related dialogue had any additional influence on
government policy in this area over what would in any case have been achieved through
the IMF’s Policy Support Instrument.
215. On the other hand, Budget Support funds were important in facilitating the shift
in the composition of spending towards domestically financed development
expenditures, which grew from 3.2 % of GDP in 2005 to almost 6 % in 2012. The special
contribution of Budget Support comes through its ability to enhance discretionary

117
Independent Evaluation of Budget Support to Mozambique, 2005 -2012
resources, that is the pool of resources which are not pre-assigned to any specific
expenditure and whose use is at the full discretion of Government, subject to the relevant
laws and regulations and the wider policy commitments of the Government to the PARPA
and to the MoU.
216. How can we be confident that Budget Support resources facilitated the expansion of
domestically financed development spending? A simplistic analysis of the allocation of
Budget Support might suggest that, as it has comprised on average 15 % of total
spending, it has contributed 15 % of each category of spending, and, as such, its
contribution to development spending has been no greater than its contribution to
interest payments. However, such an argument ignores the true nature of budgetary
decision-making processes. If there had been no Budget Support flows at all, the full
requirement for interest payments would need to have been paid, as well as other
constitutionally protected items of expenditure. It would also have proven difficult to cut
salaries by 15 %. In short, GoM would have been forced to finance the non-discretionary
items of spending, while cutting discretionary items, such as domestically financed
development spending.
217. For most of the evaluation period, it is Budget Support, which has funded
domestically financed development spending, as well as contributing to some
recurrent spending prior to 2010. Figure 22 provides an estimation of the likely
contribution of Budget Support to budget funding, taking into account the relative
discretionality of different categories of expenditure. It illustrates that for much of the
evaluation period, domestic revenue would only have been sufficient to cover recurrent
spending. This trend changed in 2010, by which time the impressive growth achieved in
domestic revenues made it possible to finance all recurrent spending and a considerable
proportion of domestically financed development spending.

118
Independent Evaluation of Budget Support to Mozambique, 2005 -2012
Figure 22: The contribution of Budget Support to the funding of discretionary spending
Source: Fiscal tables from the Bank of Mozambique (for years 2005-2011) and *IMF Article IV (2012) 1/ Budget Support, Basket Funds and Projects include concessional loans and grants; 2/ Domestic borrowing and non-concessional external borrowing are not shown.
218. As the scale of Budget Support has declined, its relative significance as a funding
source has fallen from its peak of nearly 20 % of the total of funding sources in 2007 to
just over 9.4 % in 2012 (Table 20). Domestic revenue has expanded its importance over
the period to comprise more than 71 % of funding in 2012, while the relative importance
of Basket Funds and (externally financed) Projects has also decreased but not as sharply
as that of Budget Support.
Table 20: Composition of Budget Funding (excluding non-concessional borrowing)
2005 2006 2007 2008 2009 2010 2011 2012
Budget Support 16.64% 18.28% 19.61% 16.83% 16.33% 14.81% 12.46% 9.42%
Basket Funds 10.36% 9.72% 11.73% 11.16% 10.38% 8.89% 7.56% 6.41%
External Projects 18.41% 16.08% 6.10% 13.72% 6.04% 13.61% 16.52% 12.93%
Domestic Revenue 54.59% 55.92% 62.56% 58.29% 67.24% 62.69% 63.46% 71.24%
Source: Fiscal tables from the Bank of Mozambique (for years 2005-2011) and *IMF Article IV (2012)

119
Independent Evaluation of Budget Support to Mozambique, 2005 -2012
Influence of Budget Support on the sectoral composition of spending
219. Total spending on the priority sectors designated in PARPA has more than
quadrupled in nominal terms over the evaluation period, increasing by slightly more
than 7 percentage points of GDP. (Table 21.) As a percentage of total expenditure,
education, health, agriculture, good governance and infrastructure, together with the
other smaller priority sectors, have increased their share from 61% to just over 67% of
total spending. Thus, budgetary allocations – boosted by Budget Support disbursements
– have been consistent with the planned expansion of priority sectors outlined in PARPA II
and PARP48.
Table 21: Evolution of Spending within Priority Sectors during evaluation period Priority sectors as % of nominal GDP
2005 2006 2007 2008 2009 2010 2011 2012
Education 4.85% 4.88% 5.74% 6.23% 6.26% 6.31% 6.58% 6.48% Health 3.32% 3.36% 3.66% 3.20% 3.14% 2.61% 2.70% 3.81% Agriculture & Rural Dvt. 1.16% 1.10% 0.91% 1.03% 1.37% 1.18% 2.55% 2.55% Infrastructure 2.90% 4.05% 3.56% 3.94% 3.81% 4.88% 5.65% 5.20% Good Governance 2.00% 1.96% 2.01% 2.60% 2.87% 2.67% 2.41% 2.54% Other priority Sectors 0.21% 0.23% 0.24% 0.39% 0.41% 0.37% 0.46% 1.05% Total Priority Sectors 14.44% 15.58% 16.13% 17.39% 17.86% 18.02% 20.34% 21.62%
Priority sectors as % of total expenditure
2005 2006 2007 2008 2009 2010 2011 2012
Education 20.56% 18.77% 20.86% 22.47% 19.26% 19.91% 18.27% 20.13% Health 14.08% 12.90% 13.29% 11.53% 9.67% 8.24% 7.49% 11.84% Agriculture & Rural Dvt. 4.90% 4.24% 3.30% 3.71% 4.21% 3.73% 7.08% 7.93% Infrastructure 12.29% 15.57% 12.95% 14.20% 11.71% 15.40% 15.68% 16.16% Good Governance 8.49% 7.54% 7.32% 9.37% 8.83% 8.44% 6.68% 7.90% Other priority Sectors 0.88% 0.88% 0.89% 1.41% 1.25% 1.17% 1.28% 3.25% Total Priority Sectors 61.20% 59.90% 58.60% 62.69% 54.93% 56.89% 56.47% 67.21%
Sources: Ministry of Finance and Fiscal tables from the Bank of Mozambique (for years 2005-2011) and *IMF Article IV estimates (2012) 220. The level of spending on the priority sectors has not been one of the indicators
steadily repeated within the PAF. Its use as a PAF indicator was curtailed firstly because of
the difficulties in relating government allocation priorities stated in the PARPA II and
PARP to the budget, and secondly, due to a desire to focus more on the results of
spending. However, allocation to priority sectors has been a subject of discussion within
the Annual Review processes and within some specific working groups (e.g. the Budget
Analysis group).
48 However, the definition of priority sectors in the poverty reduction strategies and in the budget
documents is not fully consistent.

120
Independent Evaluation of Budget Support to Mozambique, 2005 -2012
221. How may we measure the contribution of Budget Support funds to the growth of
spending in these priority sectors? Again, a simple proportionate contribution to each
sector does not capture the real dynamics of budget decision-making. We have therefore
constructed estimations of the relative contribution of budget support to each sector
based on the following assumptions:
§ All sector ministries and agencies will tend to defend their sector shares of the
budget. Thus, increasing allocations to priority sectors by directly cutting other
sectors is extremely difficult to do. A more likely scenario is that incremental
spending for the priority sectors is sourced from new sources of discretionary
spending, such as budget support.
§ We have therefore assumed that each sector would continue to command the
same share of domestic revenue throughout the evaluation period. Thus, we have
assigned domestic revenue by sector according to the sector shares ruling in
2004.
§ Then, the gap between the assumed share of domestic revenue (the black line
based on the above assumption) and the actual share recorded as recurrent and
internally financed development (the area below the green area in each chart in
Figure 23) can be assumed to have been financed by General Budget Support.
121
Independent Evaluation of Budget Support to Mozambique, 2005 -2012
Figure 23: Actual allocations to priority sectors compared with estimated allocations of Domestic Revenue, showing the funding gap filled by Budget Support (MZM Trillions)
Sources: Own computation based on Ministry of Finance data.
222. From this analysis, we draw the following conclusions:
§ Education is the sector that has commanded the largest share of the budget. To a
significant extent, this has been supported by funding from projects and the FASE
common basket fund (shown by the green area in the chart). However, the 2004
share of domestic revenue would have fallen well short of the funding
requirement for recurrent expenditure and for internally financed development
spending. It thus seems very unlikely that the funding levels provided to this
sector would have been feasible in the absence of Budget Support.
122
Independent Evaluation of Budget Support to Mozambique, 2005 -2012
§ Infrastructure and Health are the next most important sectors in terms of
budgetary allocations. They have also received very substantial external funding.
Indeed, due to the weight of external funding in these sectors, it has been
possible to reduce the share of domestic revenue allocated to these sectors from
the share provided in 2004 and to redistribute these domestic revenue shares to
other sectors. Thus, there has been no demand for Budget Support funding for
these sectors.
§ The Good Governance sector received a level of allocations in excess of its 2004
share of domestic revenue. Thus, some recurrent expenditures (at the beginning
of the period) and some internally financed development spending (later in the
period) would have been difficult to finance in the absence of Budget Support.
Nevertheless, the overall share of the sector and the estimated influence of
budget support are lower than in the education sector.
§ A small contribution of Budget Support to internally financed development
spending can be identified in the agriculture and rural development sector, from
2010 onwards. However, the composition of this sector was changed significantly
in 2010 due to the inclusion of rural development and fisheries and this may
distort the applicability of the 2004 revenue share49.
§ Other priority sectors such as Social Action and Labour have represented less
than 4 % of the budget. Nevertheless, the significant increases in spending in
2011 and 2012 exceeded the 2004 share of domestic revenues and would
probably have been more difficult to achieve in the absence of budget support.
223. We conclude that the major contribution of Budget Support funding has been
to support the expansion of public spending in education and to a lesser extent in
good governance. It seems likely that, in addition to funding internally financed
development spending in the sector, Budget Support has facilitated the expansion in
salary costs due to the employment of new teachers. Salary allocations in the sector have
increased significantly from 3.1% of GDP in 2005 to 4.7% in 2012, and have comprised the
predominant share of the increment in recurrent funding.
49 To avoid this negative effect, the 2004 sector share of revenue has been applied up to 2009 and after
that an adjusted assumption based on 2010 shares of revenue has been applied.
123
Independent Evaluation of Budget Support to Mozambique, 2005 -2012
4.4. Changes induced in sectoral policies
169. In this section, we consider the second part of Evaluation Question 3.3, relating to the
changes evidenced in sectoral policies and the relative influence of Budget Support
dialogue upon these changes. Government policies related to macroeconomic
management, to governance and the fight against corruption and to the design of PFM
reforms are considered in other sections; here we focus on policies in three sectors, which
feature within the PAF, namely agriculture, education and health. We first outline the main
changes in policy, considering the respective influence of Budget support in each case,
before then drawing some general conclusions.
Budget Support influence on Policy developments in Agriculture
224. The agricultural sector in Mozambique comprises smallholders, a few “emerging” or
medium-scale commercial farmers, and a handful of large companies that produce, trade,
and process agricultural products, often for export. These companies are mainly involved
in traditional export crops, but recently the mix has diversified with tobacco, bananas, rice,
and sesame. Smallholders account for 99% of the total farms in Mozambique. Producers
organized into small organizations and forums only accounted for 7.2 per cent of farmers
in 2008 (TIA, 2008). Input use (tractors, ploughs, fertilizer, pesticides) is low. At national
level, only 3.9% of smallholders use fertilizers (CAP, 2010), at an average rate of 4 Kg per
hectare - one of the lowest in Africa. The econometric analysis presented in Chapter 6
examines sector outcomes and their determinants in more detail but, in short, the
agriculture sector remains largely undeveloped and the impact of public policy on
spending on the sector continues to be relatively limited. Why is this and how far has
policy adapted to address these problems?
225. Considering first the evolution of agricultural policy, it is clear that there has been no
shortage of agricultural policies or strategies:
§ The Agriculture Policy and Implementation Strategy (Política Agrária e Estratégia
de Implementação-PAEI) adopted in 1995 was the first agriculture policy
document since Independence. PAEI aimed to promote food security, sustainable
economic growth, employment and reduction of absolute poverty.
§ PROAGRI I was launched in 1999 with the objective of improving farmers’ access
to financial and agricultural services and building the capacity of the Ministry of
Agriculture to support sectoral growth and transformation. An important focus of

124
Independent Evaluation of Budget Support to Mozambique, 2005 -2012
the policy was on increasing food crop production and promoting diversification.
(Chilonda et al., 2009).
§ PROAGRI II was adopted in 2005 and was partly aimed at addressing the
weaknesses of the previous programme, which was seen as too centralised and
generally ineffective. PROAGRI II aimed at decentralizing some of the mandates
of the Ministry of Agriculture and emphasized a result-based methodology.
§ Three new rural development strategies were adopted in 2007 - the Green
Revolution Strategy (Estratégia de Revolução Verde-ERV), the Rural Development
Strategy (Estratégia de Desenvolvimento Rural - EDR) and the Investment Fund for
Local Initiatives (Orçamento de Investimento de Iniciativas Locais - OIIL)50.
§ In 2008, PAPA, the Action Plan for Food Production 2008-2011 was launched.
PAPA aimed through national programs to concentrate efforts on increasing
production and productivity in certain crops and products considered key for
household consumption.
§ In 2011, PEDSA, the Strategic Plan for Agriculture Sector Development, was
approved. PEDSA was a more comprehensive agriculture strategy, which
synthesised several existing strategies such as the Green Revolution, the Irrigation
Strategy, PAPA, the Research Strategy, the Reforestation Strategy and the
Nutrition and Food Security Action Plan and Strategy. PEDSA also addressed
climate change as another threat to agricultural development. For the first time
also, more attention was given to infrastructure development and linking
production areas to major markets.
§ Mozambique is one of the countries in the G8 New Alliance for Food Security and
Nutrition, a commitment by G8 members, African countries, and private sector
partners to reduce poverty through inclusive agricultural growth. Under the New
Alliance, the Government of Mozambique and G8 members have endorsed a
country-specific Cooperation Framework, through which the Government of
Mozambique has committed to specific policy actions that will improve the
environment for private investment in agriculture.
50 The OIIL was established to create jobs, improve food production and promote income generation
activities. (Cunguara, 2011). It is colloquially known as “the seven million” because it was based on grants of Mtz 7 million for each district to be allocated by Members of Parliament. It was initially restricted to rural areas but was subsequently expanded to urban areas too.

125
Independent Evaluation of Budget Support to Mozambique, 2005 -2012
§ Linked to this is the Comprehensive Africa Agriculture Development Programme
(CAADP), an Africa-wide initiative of NEPAD, to which Mozambique has signed
up, developing the Programa Nacional de Investimento do Sector Agrário (PNISA –
National Agriculture Investment Plan) as part of this commitment.
226. Despite the plethora of policy documents and strategic initiatives, the performance of
the sector has fallen below expectations. As we note in Chapter 5, national accounts data
from INE show that there has been growth in the agriculture sector at an average annual
rate of 7.5% over 2001-2005 and of 7.8% over 2006-2011. This is only marginally below
the target growth rate of 8 – 10%, established in PARPA/ PARP. However, the problem lies
more in the source of this growth. Mogues & Benin (2012) point out that the primary
source of growth has been expansion in the area under cultivation and that there has
been no improvement in total factor productivity. Without an increase in land and labour
productivity, sustained growth in agricultural production cannot be achieved. Data show
that levels of productivity in agriculture started from a very low base, rose very slowly over
2002-08 and then declined thereafter (TIA surveys; Cunguara 2011). As we note in Chapter
6, this is primarily explained by the very low use of fertiliser, pesticides and improved
seeds.
227. Evaluations of PROAGRI II conclude that it did not have a positive impact on farmers’
income precisely because access to agriculture services diminished, the use of improved
technologies reduced and agricultural productivity declined. (Cunguara, 2011). Cabral
(2009) argues that PROAGRI had little or no effect on sector outcomes because public
sector interventions did not address the challenges facing the agriculture sector. There
was limited attention to the development of input and output markets, to the
strengthening of extension services, and to tackling the low level of agricultural input use
and the limited access to technology.. The PARPA II assessment studies (Cunguara & Kelly,
2009) also showed that many of the agriculture goals were not achieved, notably, those
related to irrigation, access to information on agricultural prices, access to extension
services and use of improved seeds and fertilizers.
228. What explains this failure of public policy? Some have argued that the overall
level of spending on agriculture has been too low: NEPAD, in particular, calls for a
minimum of 10% of public spending to be dedicated to agriculture. However, the
government budget allocated to agriculture has increased significantly over the
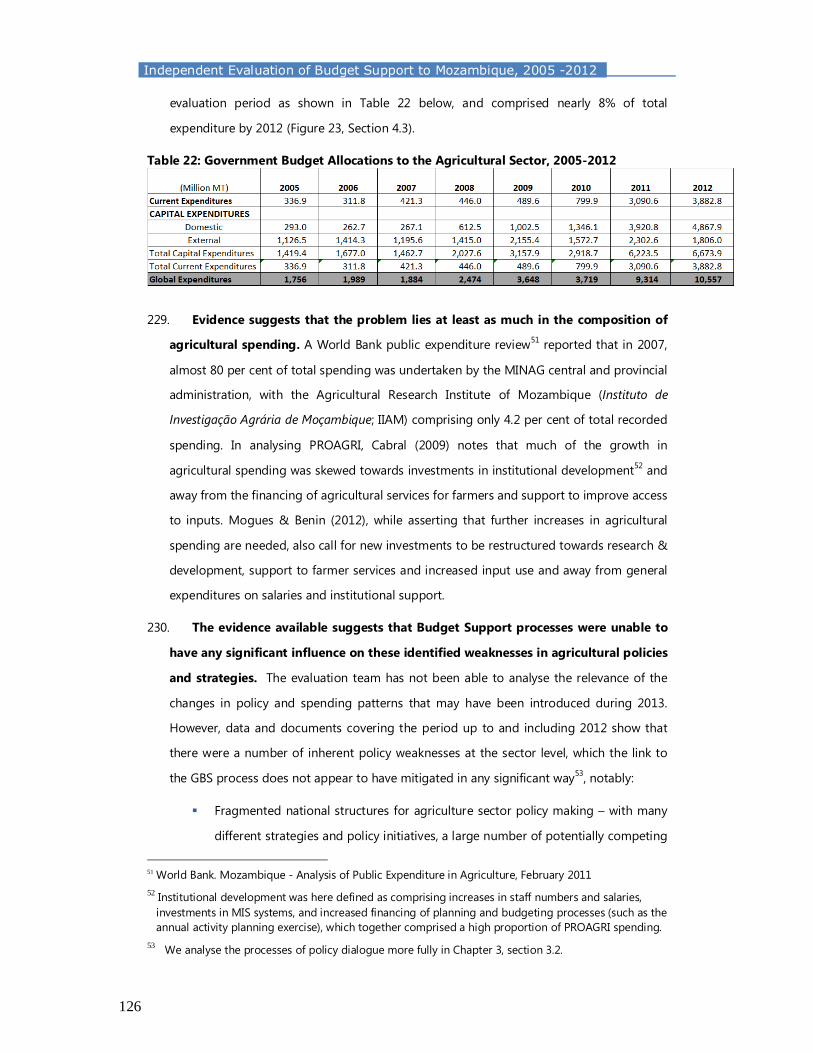
126
Independent Evaluation of Budget Support to Mozambique, 2005 -2012
evaluation period as shown in Table 22 below, and comprised nearly 8% of total
expenditure by 2012 (Figure 23, Section 4.3).
Table 22: Government Budget Allocations to the Agricultural Sector, 2005-2012
229. Evidence suggests that the problem lies at least as much in the composition of
agricultural spending. A World Bank public expenditure review51 reported that in 2007,
almost 80 per cent of total spending was undertaken by the MINAG central and provincial
administration, with the Agricultural Research Institute of Mozambique (Instituto de
Investigação Agrária de Moçambique; IIAM) comprising only 4.2 per cent of total recorded
spending. In analysing PROAGRI, Cabral (2009) notes that much of the growth in
agricultural spending was skewed towards investments in institutional development52 and
away from the financing of agricultural services for farmers and support to improve access
to inputs. Mogues & Benin (2012), while asserting that further increases in agricultural
spending are needed, also call for new investments to be restructured towards research &
development, support to farmer services and increased input use and away from general
expenditures on salaries and institutional support.
230. The evidence available suggests that Budget Support processes were unable to
have any significant influence on these identified weaknesses in agricultural policies
and strategies. The evaluation team has not been able to analyse the relevance of the
changes in policy and spending patterns that may have been introduced during 2013.
However, data and documents covering the period up to and including 2012 show that
there were a number of inherent policy weaknesses at the sector level, which the link to
the GBS process does not appear to have mitigated in any significant way53, notably:
§ Fragmented national structures for agriculture sector policy making – with many
different strategies and policy initiatives, a large number of potentially competing
51 World Bank. Mozambique - Analysis of Public Expenditure in Agriculture, February 2011
52 Institutional development was here defined as comprising increases in staff numbers and salaries, investments in MIS systems, and increased financing of planning and budgeting processes (such as the annual activity planning exercise), which together comprised a high proportion of PROAGRI spending.
53 We analyse the processes of policy dialogue more fully in Chapter 3, section 3.2.

127
Independent Evaluation of Budget Support to Mozambique, 2005 -2012
institutions and a large number of not always well coordinated Development
Partners;
§ Deficiencies in monitoring and evaluation systems;
§ A disconnect between the policy targets in the PROAGRI assessment matrix and
the activity plans and budgets of the Ministry of Agriculture; and
§ A disconnect between the policy priorities emerging from research and
evaluation and the agriculture sector policy targets in the GBS PAF, which
focussed on irrigation, land registration and public extension. None of the 20
indicators used over 2005-2012 related to the degree of access or use of
fertilisers, improved seeds or pesticides.
Budget Support influence on Policy developments in Education
231. The Education sector has been guided by a common Strategic Plan since 1999.
The plan focused on increasing access, improving quality and strengthening institutional
capacity. It was the first comprehensive sector plan that sought to guide external support
to the sector under one policy framework. However its focus was predominantly on
primary education. It was followed by the Plano Estratégico de Educação e Cultura (PEEC)
2006-2011, which was more comprehensive, covering the entire education sector. It
continued the same focus of expanding access and improving education quality but
brought in a strong equity and gender dimension and much needed attention to
HIV/AIDS. This plan and the current Plano Estratégico de Educação (PEE) (2012-2016) were
closely aligned with the PARPA and PARP. The latest education plan prioritizes efficiency
and quality, and has made improving retention and reducing dropouts a major focus.
232. A significant feature of policy development in the sector has been the consistent
focus on harmonisation and alignment. Alignment has focused on ensuring that
planning and budgeting instruments are complementary and consistent, and form a
unified and coherent framework linking global (PARPA/ PARP) and sector objectives,
central and local processes, and short and medium term perspectives (Ernst & Young,
2007). The second, related, priority has been to channel external funding increasingly
through common mechanisms, and in practice through FASE. Interviewees reported that
these two objectives had seen important progress – as is also evident from the increasing
levels of funding through FASE, and the decreasing numbers of “stand-alone” projects.

128
Independent Evaluation of Budget Support to Mozambique, 2005 -2012
233. One of the achievements in the sector in the evaluation period has been the
strengthening of the dialogue with the Ministry of Finance. Education sector stakeholders
are convinced that in the absence of this strong dialogue, it would have been more
difficult to obtain the substantial additional budgetary resources provided for the
recruitment of teachers. The MoE plans to build on this good relationship in the future to
argue for other priorities areas – such as the Apoio Direito as Escolas (ADE)54 – to be
included in the Government budget in the future.
234. As regards policy change, documentation and key interviews concur that the most
important reform in the education sector took place in 2004 i.e. before the evaluation
period. This involved the introduction of free primary education and a related package of
reforms, including:
§ Abolishment of tuition and other fees in primary education;
§ Provision of free textbooks for all primary education pupils;
§ Increased funding to schools through the introduction of the ADE grants - a
capitation grant that goes directly to primary schools for non-salary expenses;
§ The introduction of a new curriculum for primary education in 2004.
235. Situated within the period covered by this evaluation are two areas of policy reform,
namely:
§ Reform of the pre-service teacher training policy for primary level, with 10th
grade entry by candidates, and one year of professional training, replacing the
previous 10 + 2 year training model. This reform reduced the amount of time
spent in training and resulted in a more than doubling of the number of teachers
that were being trained per year (from between 3,000 to 4,000 teachers per year
prior to the reform to almost 10,000 per year from 2008, and 8,500 in 2012). The
design of this model was informed by a detailed study, financed by the Fast Track
Initiative (FTI), which analysed the financial implications of different options of
teacher education and sought to identify what would be needed to obtain 10,000
additional primary school teachers per year (Bartholomew et al., 2009). The new
54 The Direct Support to Schools (DSS) initiative, which was started in 2003 and has focused on children
in public primary schools (in grades 1 through 7). ADE provides funding directly to all primary schools for essential school supplies, with the purpose of contributing to improved teaching and learning, and ultimately to improved pass rates, transition and retention rates.

129
Independent Evaluation of Budget Support to Mozambique, 2005 -2012
teacher education policy was to be accompanied by expanded in-service training,
although progress in this area has been slower.
§ The reform of the school construction strategy to address the challenges that had
arisen with the introduction of a community involvement model (influenced by
the FASE partners) which was based on a per classroom price of $10,000. This
model proved to be difficult to implement in certain areas of the country due to
capacity constraints.
236. These two reforms were part of a concerted effort to expand access to education and
to improve quality of teaching by reducing the pupil teacher ratio. As we note in Chapter
7, econometric analysis suggests that this focus on reducing pupil teacher ratios has been
absolutely appropriate, showing a strong association with progression rates through
primary schooling and transition rates into secondary school. In the case of school
construction, the increasing availability of flexible funding through FASE permitted
expansion, and this reform may be said to be primarily driven by FASE processes,
although Government funding has increased for internally funded investments, and this
includes school construction (Figure 23, Section 4.3).
237. Implementation of the teacher expansion strategy was facilitated to a
significant extent by the existence of the GBS dialogue. Increasing the number of
teachers required approval of additional recurrent funding for salaries by the Ministry of
Finance. Policy dialogue and reflection at the level of the sector led to the identification of
the pupil-teacher ratio as one of the three key indicators for the overall PAF framework.
This was a deliberate choice by the Ministry of Education, to present a convincing
argument for the need to increase the salary bill. Thus, in this second case, a combination
of sector dialogue, the existence of a monitoring framework at GBS level, and the
availability of funding through GBS provided a framework that allowed for the Ministry of
Education to engage in direct dialogue with the Ministry of Finance to obtain substantial
increases in recurrent GoM funds to expand teacher numbers.
238. Within the evaluation period, there have also been important efforts to increase age
six enrolment in grade 1, through mobilization and advocacy efforts among parents and
caretakers55. This policy has had positive effects, with the percentage of age 6 enrolment
55 The age of enrolment is critical in determining future chances for school completion, especially
because children who reach adolescence while still in lower primary have a much smaller probability of completing primary education.

130
Independent Evaluation of Budget Support to Mozambique, 2005 -2012
in grade 1 rising from 36% in 2002 to 72% in 2012. Again this was a policy initiative born
out of sectoral level analysis and debate but where the GBS dialogue contributed to
raising awareness and commitment to this policy objective, both through the adoption of
an explicit PAF indicator on right age enrolment and through discussions at the Annual
Reviews. (See Section 3.2)
239. A related development in the sector has been in the area of Early Childhood
Development (ECD). The education strategy (PEE) recognizes the importance of ECD and
an ECD strategy paper has been finalized through a consultative process. ECD was also
included in the funding proposal to the Global Partnership for Education (GPE – the
former FTI) submitted in 2010. Roll out of the ECD strategy started in 2014 with an IDA
credit from the World Bank, channelled through FASE. This will involve management of
early childhood facilities by private/ civil society actors. Discussions on expanding GoM
funding for this initiative are on-going and there is the potential for also bringing this
subject into the GBS dialogue on education.
240. In summary, during the evaluation period education policy has been refined, building
on the strong policy and strategy framework already existing. Policies implemented within
the period have significantly improved sector outcomes. In the absence of Budget
Support funding, effective implementation of these policies would have been
impossible, without either significant reductions in the scale of system expansion, or the
adoption of funding models (such as the payment of teacher salaries through projects
and common basket funds), which would have jeopardised the longer term sustainability
of benefits.
241. The contribution of policy dialogue through Budget Support has been more
modest but also important. A robust framework of policy dialogue has been built up
building on the SWAP structures, which preceded GBS at the national level, and education
sector policy development has continued to be driven by the FASE process. However, the
national level dialogue associated with budget support has been used to lend additional
weight in key policy areas, notably the need to reduce pupil-teacher ratios through
teacher expansion, to introduce a learning achievement baseline so as to monitor the
quality of education more effectively, to manage the process of budget decentralisation
more effectively, and to give attention not just to Gross Enrolment Rates but specifically
to right age enrolment in year 1.
131
Independent Evaluation of Budget Support to Mozambique, 2005 -2012
Budget Support influence on Policy developments in Health
The Framework for sectoral policy dialogue: alignment & harmonisation
242. In terms of the framework for dialogue, for some time the health sector has been
guided by a common Strategic Plan (PESS), which is aligned with the PARPA/PARP. In
2007, in a deepening of the harmonised approach, the partners in the health SWAp,
PROSAUDE, developed a common PAF which currently comprises 35 indicators. It is
actively monitored, and its monitoring forms the key focus of the annual joint review
(ACA). A major development in policy alignment has been the alignment of the JAR and
the annual review of the health sector with the Annual PES, which is the central document
for annual planning. This alignment has been in place since 2008.
243. In addition to the increasingly aligned nature of this modality, PROSAUDE has
encouraged harmonisation through its focus on the acceptance of common audit
practices and common financial reporting systems among participating health partners.
Although there have been several diagnostics, they have been shared widely and have
helped to form a common view on health sector financial management. A third aspect of
harmonisation during the period under review is the reducing frequency of missions from
partners. This has been a Health PAF indicator since 2008, and between 2008 and 2012
the number of individual health missions has fallen from 37 to 9, and the number of joint
health partner missions has fallen from 9 to 5.
244. In the later part of the period under review, the views of health partners have begun
to diverge with differences in several areas including: on the use of modalities (GBS/ SBS,
Common funds, vertical programmes); the emphasis that should be placed on governance
and audit requirements; disbursement conditions and disbursement responses to
governance shortfalls, audit reports, etc.; attitudes to province-specific programmes; and
views on the levels of the government contribution to health. These fragmented views
have proved to be a major distraction. They have reportedly made it more difficult than
previously to develop common DP positions and have lowered the productivity of
dialogue.
Key health sector policy objectives and changes within the evaluation period
245. In broad terms, health policies have remained remarkably consistent. Policies to
strengthen Human Resources in Health, to combat key diseases and HIV/AIDS, and to
address infant and maternal mortality, have continued in modified forms under revised

132
Independent Evaluation of Budget Support to Mozambique, 2005 -2012
strategy documents. A central pillar of health policy since independence has been
universality. User fees are accepted as a means to broaden the resource base of the
sector, but they have an adverse impact on access, which is a key goal. Universality is also
compromised by “under the table” user fees. The goal of universality continues, although
a recent report (Cumbi et al, 2012) notes that there is a changing ideology accompanying
the growth of private health provision, whereby health is seen less and less as a free
public service and entitlement.
246. Although much has remained the same, there have also been notable developments.
Decentralization and deconcentration policies have changed the way that the health
sector operates. Provincial Departments of Health have their own budgets, and are
empowered by e-SISTAFE to commit expenditures from allocations in the Single Treasury
Account (CUT- Conta Única do Tesouro). However, a recent report (Cumbi et al, 2012) has
argued that in this process the SDSMAS units at primary level have suffered because they
receive funding from the District Secretariat and compete with other priorities.
247. The period under review is largely covered by two poverty Reduction Strategy
documents PARPA II, which covered the period 2006-2010, and the more recent PARP
which covers the period from 2011. The PARPA II has four key components: for health:
improvement of access to health care services, priority programs, improvement of quality,
and increase in efficiency and cross-cutting topics (gender and inter-sectoral
cooperation). It prioritises initiatives in several key areas of health including: reduced
maternal mortality; prevention of vertical transmission of HIV/AIDS; numerous other
HIV/AIDS interventions including a major expansion of TARV; reduction of infant and child
mortality through greater attention to childhood diseases and expanded immunisation;
improved nutrition; action on endemic diseases especially malaria; reduction of the
prevalence of leprosy; and reduced morbidity and mortality rates from TB.
248. The PARP (2011-2014) is a much more concise document than its predecessor. Like
the PARPA II it seeks to promote equity in access to health care, with special attention to
health and nutrition for women, children and other vulnerable groups. It also retains a
focus on reducing the impact of major epidemics such as malaria, tuberculosis and
HIV/AIDS, intestinal parasites, diarrhoea and other pandemics; it has a greater emphasis
on nutrition, and seeks explicitly to reduce chronic malnutrition and protein-calorie and
micronutrient malnutrition; a third focal area is the improvement of human resource
management, humanizing services with emphasis on quality and on satisfying users’
needs; the fourth and final focal area is the prevention and mitigation of HIV/AIDS.

133
Independent Evaluation of Budget Support to Mozambique, 2005 -2012
249. There is general agreement within the sector that the health sector PESS is fully
aligned with PARPA II and the PARP of 2011. The programmes and goals indicated in
poverty strategies are all included in the 35-indicator PAF of the sector and are therefore
monitored through the JAR. It is difficult to identify the extent of influence of the budget
support dialogue on the alignment of health sector policy with national policy. However,
the PARPA II and PARP are products of national dialogue processes associated with
budget support, and the shared language and shared objectives suggest that the two
areas of dialogue – sectoral and national - have been mutually reinforcing.
Policy implementation: changes in the composition of spending to better reflect health policy objectives in PARPA and PESS
250. The nature of the budget classification system and the significant level of off-budget
spending make it difficult to examine the policy orientation of spending. However, we
consider two aspects of spending composition to determine whether expenditure reflects
national objectives. The first of these is equity in distribution of funds amongst provinces.
Equity in distribution of resources is a major goal of the PESS and PARPA II. Both place
great stress on the expansion of access and the latter asks for a review of the criteria for
allocating resources.
Figure 24: Estimates of Per Capita Health spending by Province, 2010 in Meticais
Source: Bibi Umarji, 2011
251. Available estimates suggest a highly unequal distribution of health resources amongst provinces. For example, estimates for 2011 shown above indicate that the per capita allocation for Sofala was 3.4 times the level for Manica. The allocation of resources by province is tracked in the Health PAF (Indicator 23) and the structure has barely changed since it first started to be estimated in 2005. To the extent that access to health

134
Independent Evaluation of Budget Support to Mozambique, 2005 -2012
is dependent on more equitable distribution of resources for health care, there would appear to have been limited progress towards this PARPA and PESS goal.
252. However, there are major shortcomings in the data as presented. In the first place, the two largest referral hospitals in the country are located in Maputo and Sofala (Beira) and, at least in principle, serve populations much larger than their own inhabitants. Indeed, the majority of hospitals, training schools and research institutions serve regional or national populations and yet tend to be concentrated in the larger urban centres. Secondly, and perhaps more importantly, available expenditure data simply record spending in relation to the location of budget responsibility, not in relation to the location of service delivery: many purchases, such as medicines, are managed centrally or regionally but distributed much more widely. Thirdly, even if it were possible to identify expenditure on primary health care and basic curative services by location, there are many reasons – related to population densities, transport costs, differences in the incidence of diseases – why it would be inappropriate to assume that an equal allocation would represent an optimal solution. In short, there remains much work to be done to develop appropriate indicators for this policy objective before meaningful targets (and, thus, corresponding actions) can be properly defined56. As the budget classification develops and evolves, it may prove more helpful in the short to medium term to develop indicators and targets based on data from the Demographic & Health surveys and/ or Household Budget Surveys.
253. The second aspect of spending composition is the split between the government budget, Common Funds (PROSAUDE I & II) and vertical funds. Again, the weaknesses in data availability, especially for off-budget expenditures, complicate the compilation of accurate estimates57. Nevertheless, Table 23 suggests that from 2005 to 2011 the total health budget almost doubled in US$ terms. The government contribution to health rose from $104 million to $160 million, but fell as a proportion of health spending from 30.6% to 24.2%. Common Funds fell from 31.2% to 15.2% and vertical funds rose from 38.2% of spending to 60.6%.
Table 23: Aggregate Health spending by source of funds, 2005 and 2011
Source of Funds 2005 2011
US$ million %
US$ million %
Government Budget 104 30.6 160 24.2 Common Funds 106 31.2 100 15.2 Vertical Funds
130 38.2 400 60.6
Total Expenditure 340 100.0 660 100.0
Source: Evaluation team estimates, based on data from MISAU.
56 Some government stakeholders in MISAU and MPD raised these concerns with the evaluation team.
It was not fully clear to what extent these concerns are appreciated by the health sector DPs.
57 A particular problem relates to the management of end-of-year project balances: with the Government Budget (OE), all balances remain in the CUT and new spending needs to be authorized in the new Budget and, as a result, estimates of spending are quite accurate. By contrast, off budget vertical projects accumulate balances from one year to another and will thus tend to overstate spending if estimates are based on new transfers into the account, without netting off existing balances.

135
Independent Evaluation of Budget Support to Mozambique, 2005 -2012
254. The majority of the vertical funds budget is for HIV/AIDS through PEPFAR, leading to an imbalance in programme funding. Estimates indicate that spending on HIV/AIDS in 2011 and 2012 exceeds 40% of the health budget. HIV/AIDS is clearly and necessarily a priority area, but it is not the only one. There is nothing in the PESS or other documents that would support such a heavy bias of spending in its favour. However, PEPFAR has plans to move resources into health systems strengthening and this might go some way to redress the balance. This trend away from more aligned modalities and towards vertical funds is clearly not influenced by Budget Support, although without PROSAUDE II the movement to non-aligned modalities would be more marked.
Policy implementation: achievement of health sector outcome targets
255. During the period under review 60% of health targets in the GBS PAF were achieved
and a further 21% were not achieved but showed progress. Only 17% were not achieved
without progress. (See Figure 15 in Section 3.2.) Reduction in HIV transmission has been a
major focus and numbers of children under ARV treatment stood at 25,891 in 2012, a
dramatic increase from 2005 (1,686). For adults the corresponding figures were 282,687 in
2012 (2009:156,688). Prevention of mother to child transmission of HIV saw a major
increase so that in 2012 85,587 women were treated (84%) compared with only 8,244 (6%)
in 2005. The number of health facilities providing PMTCT services rose to 1,170 in 2012
(2005:96). The ratio of institutional births – a consistently reported indicator within the
GBS PAF as well as the Health PAF – has also improved significantly from 49 % in 2005 to
64 % in 2012.
256. In short, across the majority of the outcome targets, which feature in the Health PAF
and/ or the GBS PAF, significant progress has been recorded, indicating some degree of
success with health policy. Three caveats need to be expressed, however. Firstly, as we
noted in Chapter 2, the legacy of the civil war continues to influence health care outcomes
in Mozambique, which tend to be lower than other SSA countries of similar per capita
incomes, such as Tanzania, therefore future progress will need to be still faster if this gap
is to be closed. Secondly, there is a big question mark over how efficiently resources are
being used because, at least at first sight, the progress in outcomes does not appear
commensurate with the big budget increases obtained. Thirdly, there is legitimate
concern over the sustainability of the health benefits being achieved, given that the level
of external funding for the sector has risen so fast.

136
Independent Evaluation of Budget Support to Mozambique, 2005 -2012
Conclusions on health policy development and the influence of Budget Support
257. In summary, we conclude that positive changes in spending composition and in
health outputs have resulted from positive synergies between GBS and other
modalities. Budget support thinking has guided the development of PROSAUDE II and
may yet guide it to the development of SBS. Moreover, as we noted in Section 3.2, in the
health sector there is no doubt that GBS dialogue and sector dialogue are mutually
supportive and that national level dialogue associated with budget support has provided
additional weight in key policy areas.
258. However, Budget Support is only one influence among many and there is no
doubt that the major changes in spending composition over time have reflected
non-GBS factors, especially the rise of the vertical funds. This has had two direct
impacts: first, the vertical funds, especially PEPFAR, have created a massive focus on a
specific disease - in this case HIV/AIDs - changing the spending composition in its favour;
and secondly, through increased emphasis on HIV/AIDS, PEPFAR has redirected the wider
health sector effort in that direction. Naturally, positive results have been achieved, but as
we have noted there are concerns about the efficiency and, more significantly, over the
sustainability of this spending, and the related results.
259. The big increase in external funding to the sector, as a result of the combined
weight of the vertical funds and the PROSAUDE common basket fund has had a
negative influence on Government funding to the sector. The response to this has
been to reduce GoM contributions to health (as a percentage of budgetary resources) in
order to maintain an appropriate balance between this and other national priorities. In the
process, the GBS resources available to the Government for use through the Budget have
been dedicated to other sectors, as we noted in Section 4.3 above. This has led to
sustained dependence of the health sector on aid, and a further aggravation of the
imbalance in funding since the proportion of disease-dedicated funds has risen and the
proportion of flexible funding has fallen in response.

137
Independent Evaluation of Budget Support to Mozambique, 2005 -2012
260.
Conclusions: overall influence of Budget Support on Sector Policies
261. In assessing the influence of Budget Support on sector policies, only two of the three
Budget Support inputs, namely funds and policy dialogue, are relevant. Technical
assistance and capacity building at the sector level were not provided through Budget
support but rather through sector specific projects or SWAp arrangements, such as
PROAGRI, FASE and PROSAUDE. By contrast, in the areas of PFM (Section 4.2) and
governance (section 4.5), all three Budget Support inputs have been present.
262. As we noted in Section 4.3, GBS funding has been of considerable importance in
Education and, to a lesser extent in Agriculture. In Education, the scale of GBS funding
available had a clear impact on the scope of education policy – in particular, the scale
of system expansion, which has been undertaken, could not have been contemplated,in
its absence. In Agriculture, the direction of policy has been less consistent and coherent
and we cannot identify any specific effects of Budget support funds on the scale of policy
ambitions or the chosen direction of policy.
263. With regard to GBS policy dialogue, the case studies of agriculture, education and
health show that GBS processes can reinforce and add value to sectoral policy
initiatives but their influence will always be distinctly secondary to sector level
processes. These sector level processes have their own history and their own dynamics,
on which the influence of the central level GBS PAF is modest at best. Where the sector
dynamics have been favourable58, such as in the case of education, the GBS dialogue has
helped to sharpen the strategic focus and to raise awareness of sector level issues; where
the sector dynamics have been less favourable, such as in agriculture, and health, GBS
processes have had less influence.
264. It may be that a much more substantive engagement in sector policy at the central
level – with a higher profile in the GBS PAF, more time dedicated to analysis and debate,
and supporting TA and capacity-building inputs would generate a greater influence, just
as it has in relation to PFM or governance issues. Yet, central to the success of such a
58 Key aspects of this favourable dynamic in the education sector included a) a clear and coherent
policy direction, supported by the key stakeholders; b) a degree of planning and managerial capacity within the sector, supported by consistency in staffing (i.e. avoiding frequent changes of ministers, managers and technical staff); c) a high level of alignment and harmonization across sector partners; and d) strong analytical and facilitation capacity on the part of the lead donor, namely the World Bank. The Agriculture and Health sectors performed less well in relation to each of these factors.

138
Independent Evaluation of Budget Support to Mozambique, 2005 -2012
policy would be i) an adequate level of alignment to Government policy, and ii) an
adequate level of harmonisation across the DPs working at the centre and in the sector. If
these conditions were not already generated by the pre-existing sector dynamics, it would
probably be difficult to create them without a very heavy investment in harmonisation
and alignment processes.
4.5. Governance and the Fight against Corruption
265. Evaluation Question 3.4 aims to analyse whether there have been improvements in
the quality of governance and accountability and to assess to what extent they may be
attributed to Budget Support. We focus on changes with regard to four key aspects of
democratic accountability: (i) the quality of Parliamentary scrutiny of national budgets,
accounts and audit reports; (ii) the quality of media and civil society analysis and scrutiny
of budgetary issues; (iii) the scope, coverage and quality of the audits of the Tribunal
Administrativo (TA – the Administrative Court/ Supreme Audit Institution); and (iv) the
efficiency and the effectiveness of anti-corruption initiatives in combating corruption. We
assess to what extent these changes may be attributed to Budget Support, either
independently or in synergy with other modalities.
Parliamentary scrutiny of the State Budget and of Audit Reports
Table 24: Legislative scrutiny of the Budget - PEFA scores, 2006 - 2011
Indicator Dimension 2006 PEFA Assessment
2008 PEFA Assessment
2011 PEFA Assessment
PI – 27: Legislative scrutiny of the annual budget law
(i) Scope of Legislature's scrutiny A
B+
A
B+
A
C+
(ii) Extent to which the legislature's procedures are well-established and respected.
A A A
(iii) Adequacy of time for the legislature to provide a response to budget proposals.
A A A
(iv) Rules for in-year amendments to the budget without ex-ante approval by the Legislature.
B B C
266. In line with the Constitution, the Assembleia da República – the National Assembly or
Parliament, has the responsibility for scrutinising and voting upon the proposal of the
Executive for the State Budget (OE), and also for reviewing the Tribunal Administrativo’s
report on the General State Accounts (CGE – Conta Geral do Estado). The extent to which

139
Independent Evaluation of Budget Support to Mozambique, 2005 -2012
these tasks are undertaken effectively are assessed in the PEFA methodology and
therefore the 3 PEFA assessments undertaken during the period (2006, 2008 and 2011)
give some indication of trends in this regard.
267. With regard to Legislative scrutiny of the annual budget law, the PEFA
assessments have scored the process quite favourably, reporting scores of “B+”, “B+”
and “C+” in these assessments. (See Table 24 above).
268. Legislative scrutiny of the annual budget law covers the annual plan (PES), fiscal
policies, the medium term fiscal framework and medium term priorities, as well as details
of expenditure and revenue. The procedures adopted for the review are firmly established
and respected. The Ministry of Finance submits the annual budget proposals to the
National Assembly by 30th, September each year. The draft budget is then distributed to
the six Parliamentary Committees, covering discrete sectoral areas, and to the Comisão
Parlamentar do Plano e Orçamento (CPO – Parliamentary Commission for the Plan &
Budget), which plays an overall coordination role across the committees. The Committees
have two months to review proposals, develop comments and negotiate relevant
amendments with the Minister of Finance and his/her staff. In early December, the budget
is then presented to the National Assembly for their consideration and approval. It is
accompanied by a set of formal comments on the budget proposals by the CPO. The
process of scrutiny of budget proposals by the Legislature is thus well developed and
consistent with international good practice norms, with regard to scope, procedures and
the time allowed for scrutiny, and has thus merited “A” scores against each of these
dimensions in the three PEFA assessments.
269. The one dimension where PEFA scores are lower, and where a decline was recorded in
the latest assessment, is in relation to the rules for in-year budget amendments by the
Executive. The rules regarding such amendments are clearly presented within the SISTAFE
law and its related regulations. These do not allow the Executive to increase the overall
level of expenditure, to reallocate funds between budget entities or to alter the scope and
nature of tax instruments without prior approval of the Legislature. These rules are
generally respected. However, the rules allow for virements within a budget entity and
also, more significantly, allow for the contingency fund to be re-allocated without prior
approval of the Legislature. Moreover, there is no requirement to report back to the
Assembly during the year on the scope and nature of these reallocations. Thus, the rules

140
Independent Evaluation of Budget Support to Mozambique, 2005 -2012
do allow for extensive administrative reallocations59. In its 2006 report to Parliament, the
Tribunal Administrativo identified these practices as a deficiency within the SISTAFE law
and regulations, but they have not to-date been amended.
270. The Tribunal Administrativo is the supreme audit institution of Mozambique. It
undertakes the external audits of the individual accounts of government entities and of
the public accounts (CGE) as a whole. In addition, it has a judicial status, acting as the
Tribunal de Contas (Court of Accounts) in reviewing and reaching final decisions over the
audits of individual departments, as well as imposing fines and/ or recommending
criminal investigations, where relevant. Thus, in its capacity as a Tribunal de Contas, the
TA performs most of the functions performed by a Parliamentary Public Accounts
Committee in a Westminster-based system.
59 This is justified in part by the fact that with the Legislature meeting only twice during the year (for 45
day sessions), some degree of flexibility in budget execution is required for the Executive.

141
Independent Evaluation of Budget Support to Mozambique, 2005 -2012
Table 25: Legislative Scrutiny of Audit Reports - PEFA scores, 2006 - 2011
Indicator Dimension 2006 PEFA Assessment
2008 PEFA Assessment
2011 PEFA Assessment
PI – 28: Legislative scrutiny of external audit reports
(i) Timeliness of examination of audit reports by the Legislature (for reports received within the last three years)
A
C+
B
C+
B
C+ (ii) Extent of hearings on key findings undertaken by the Legislature
C C C
(iii) Issuance of recommended actions by the Legislature and implementation by the Executive.
B B B
271. Only the audit of the CGE and the related audit opinion (parecer) of the TA is submitted to the National Assembly, which provides a highly aggregated picture of budget execution. In-depth hearings on key findings do take place but these are mainly with Ministry of Finance officials. A more substantial involvement of the National Assembly in reviewing departmental audits would require a change in the legal framework for external audit in Mozambique. It is this dimension which pulls down the overall PEFA score against this indicator, earning a “C” score for the coverage of hearings by the Legislature. (Table 25.)
272. Despite the limited scope of the audit reports presented for Legislative scrutiny, the quality and timeliness of its work has generally scored well, meriting consistent “C+” PEFA scores across the evaluation period. Legislative scrutiny of the external audit report normally takes place in the first parliamentary session of the year, beginning in late March or early April. With the audit report on the CGE being tabled at end November, legislative scrutiny is thus concluded 4-5 months after its receipt by the Legislature. The Legislature recommends actions to the Executive, as a result of its review of the CGE and the TA’s report and opinion. There is evidence that some of these are implemented and there is a procedure for assessing follow-up, when the CGE of the subsequent year is analysed.
273. The main constraints to the quality of legislative scrutiny relate to the limited time available, the very modest technical support provided to the CPO and the limited technical expertise of its members. However, technical support has been provided to the CPO by UNICEF, by the Westminster Foundation and also by GIZ. Stakeholders report that this is making a positive difference to the scope and quality of the CPO’s work.

142
Independent Evaluation of Budget Support to Mozambique, 2005 -2012
Media and CSO scrutiny of budgetary documents
274. Mozambique’s scores in the Open Budget Survey suggest an improvement in
the public availability of budgetary documents. Its score on the Open Budget Index
(OBI) rose from 28 % in 2010 to 47 % in 2012. Despite this positive trend, Mozambique
remains far from a desirable level of budget transparency particularly in terms of the
quality of information, although the Ministry of Finance is undertaking reforms, such as
the introduction of programme budgets and the modernisation of accounting standards,
which should over time help to address this.
275. In 2010, the CPO agreed to participate in a Budget Monitoring Forum – Fórum de
Monitoria do Orçamento (FMO) – engaging civil society organizations interested in
monitoring the budgeting process and undertaking related advocacy work. The forum
was established through informal links with the CPO, and its objective was essentially to
influence the government in resource allocation and transparent execution of the budget.
The CSOs participating in FMO include the Centre for Public Integrity (CIP), which has
been perhaps the most regular and systematic of the CSOs performing analysis related to
public expenditures, including budget monitoring at the district and municipal levels.
276. The significant role played by CSOs and independent research institutes has been
noted by a number of researchers. Shikhani (2012) states that ‘Mozambique’s socio-
cultural system is characterised by the existence of many pressure groups. They constitute
a growing critical mass and play a fundamental role in helping to deepen democracy in
the country.’ Freedom House (2010) reports that ‘academic freedoms are generally
upheld’ and notes that ‘local journalists and non-governmental organisations such as the
Centre for Public Integrity have played a crucial monitoring role by investigating and
exposing high-profile corruption cases.’
277. Nevertheless,, there is a generalized perception that, in recent years, government aversion to critical voices has risen. Friedrich-Ebert-Stiftung (FES) reported that freedom of expression in Mozambique is becoming more restrictive particularly outside of urban centres (2011)60. The report on the State of the Union prepared by CESC in 2013 indicates problems of political intolerance and a strong aversion to criticism on matters of governance by the government61. Several survey-based perception indices
60 Friedrich-Ebert-Stiftung & MISA (2011), Barómetro Africano da Media. Moçambique, 2011. 61 CESC (2013) gives examples of destruction of flags of opposition parties in the provinces of Manica
and Gaza, the closure of three community radios with programmes focused on monitoring

143
Independent Evaluation of Budget Support to Mozambique, 2005 -2012
support this conclusion, as we noted in Chapter 2. Finally, several important personalities from the political, academic and religious arena have publicly voiced their concerns about the state of governance in Mozambique62.
278. There are thus many informed commentators, who suggest that the level of harassment and intimidation of civil society has increased in recent years. Has this reduced the level of research and analysis of budgetary and governance issues? Has it limited the number of critical voices? CSOs interviewed by the evaluation team held differing opinions on this, but the majority expressed the view that the space for research and criticism remained, even though the environment was becoming more challenging. By comparison with the situation in 2005, when budget information was less easily available and the volume of research and advocacy work was more modest, we judge that the quality of CSO scrutiny of budgetary documents has improved over the evaluation period.
Scope and quality of audits of the Administrative Court (TA)
Table 26: Scope, nature & follow-up of External Audit - PEFA scores, 2006 - 2011
Indicator Dimension 2006 PEFA Assessment
2008 PEFA Assessment
2011 PEFA Assessment
PI – 26:
Scope, nature and follow-up of external audit
(i) Scope/nature of audit performed (incl. adherence to auditing standards)
D D+ C C+ C C+
(ii) Timeliness of submission of audit reports to legislature
C B B
(iii) Evidence of follow up on audit recommendations
C B C
279. The PEFA assessments of the quality of external audit show steady improvements from an initially low base. (Table 26.) The Tribunal Administrativo was established in the 1990 Constitution but only became operational from 2000, and in the 2006 PEFA assessment, its operations were scored poorly primarily because of the small numbers of audits it was undertaking, which limited its oversight capacity.
governance, a coordinator of the civil society platform of Barue threatened by the district administrator with expulsion from the district.
62 We refer in particular to Prof. Lourenço do Rosário, Rector of Apolitécnica; Dinis Sengulane, Bishop of Lebombo; Francisco Chimoio, Archbishop of the Catholic Church in Maputo; and Prof. Carlos Nuno Castel Branco of the Institute of Social and Economic Studies (IESE).

144
Independent Evaluation of Budget Support to Mozambique, 2005 -2012
Table 27: Audit Performance of the Tribunal Administrativo, 2003 -2013
Year Audits planned New Audits
Accounts analysed
(incl. stock)
Accounts judged
2003 5 7 226 0
2004 0 29 272 4
2005 60 68 342 42
2006 70 179 148 49
2007 90 360 192 75
2008 320 350 160 41
2009 450 491 420 72
2010 600 600 214 14
2011 500 502 82 36
2012 450 450 89 102
2013 - - 330 157
Source: Tribunal Administrativo, 2013
280. From 2005 onwards, there has been a sharp improvement in the number and the
quality of audit reports, as documented in recent assessments of the role and
performance of the Tribunal Administrativo63. Since 2004 the number of audits has
increased, the coverage of audits has grown significantly and gains in timeliness in
producing and submitting CGE opinions have been obtained. The increase in the total
number of audits has been especially dramatic from 29 audits in 2004 to over 400 per
year since 2009 (See Table 27.) In 2006, the Tribunal Administrativo expanded the
coverage of its operations to districts and in 2007 it commenced auditing public works. In
2011, it established its first permanent provincial offices.
281. With the introduction of Budget Support, Development Partners started to lend
special attention to strengthening the oversight of public expenditure, as a vital
mechanism to improve government performance and transparency in budget execution.
Technical support for the Tribunal Administrativo was provided by Sweden and Portugal
from 2005, and the volume of technical and financial support has expanded sharply
following the adoption of the Memorandum of Understanding for the Common Fund
supporting the Corporate Plan of the TA (Plano Corporativo - PLACOR 2007-2010 and
PLACOR II 2011-2014). Under the umbrella of this instrument there was a significant
increase in the number of qualified staff in the TA, particularly among the auditor staff. In
63 Eurosis & MGA (2010) Diagnóstico Institucional do Tribunal Administrativo de Moçambique. Maputo,
Agosto de 2010; CIP (2011) O Destino dos Nossos Impostos – A Conta Geral do Estado 2009 e o Parecer do Tribunal Administrativo. Maputo, 2011; Ximungo Consultores (2011) PSGR Case Study Mozambique: External Audit.

145
Independent Evaluation of Budget Support to Mozambique, 2005 -2012
2003 there were only 7 qualified auditors and this number rose to 300 in 2011 (Ximungo
Consultores, 2011.) The coverage of staff costs was secured through the Common Fund.
PLACOR also provided for capacity building and exchange of experiences, through
secondments and study tours, as well as advisory support for the development of the new
External Audit Act, passed in 2009.
Figure 25: Allocations to Tribunal Administrativo compared with estimated allocation of Domestic Revenue, showing the funding gap filled by Budget Support (MZM Trillions)
Note: 2011 and 2012 includes Tribunal Administrativo Provincial
Source: Own computation based on MoF data.
282. Government budget allocations to the Tribunal Administrativo were boosted by
Budget Support funds during the evaluation period. Figure 24 shows the trends in the
composition of expenditure of the institution. The influence of PLACOR can be identified
as the green area at the top of the chart, corresponding to externally financed
Development. Following the same methodology explained in section 4.3 of this report,
the influence of BS funds may be estimated as corresponding to the area between the
black line and the externally financed funds (green area). Thus, from 2005 and more
substantially from 2007, Budget Support funds have helped to finance the expansion of
activity of the TA during the evaluation period, providing funding for all internally
financed development spending and some recurrent spending.
283. However concerns have recently been raised regarding the misuse of funds by the
Tribunal Administrativo, as an audit report in 2013 found evidence of financial
irregularities, due to weaknesses in financial and reporting systems and a failure to adhere
to procurement procedures (Deloitte & Touche, 2013). This indicates that regardless of

146
Independent Evaluation of Budget Support to Mozambique, 2005 -2012
the significant support that has been provided by development partners, weaknesses still
remain in internal management and financial systems.
284. Despite this, it is clear that the quality and volume of TA reports and audits has
improved and it would have been extremely difficult to achieve these results if the
PLACOR Common Fund and Budget Support had not both been in place. The PLACOR
common fund has provided capacity strengthening and additional investment funding. In
parallel, the scope for additional national budget funding which GBS has provided has
been fundamental – indeed, in financial terms its value may have been double that of the
common fund. (See Figure 24.) In addition, stakeholders agree that the attention given to
the Tribunal Administrativo in the Budget Support dialogue – including the incorporation
of a PAF indicator with targets for the growth in audit coverage – has helped to raise its
profile and its ‘negotiating strength’ in lobbying for support from other parts of
government. Thus, Budget Support and the PLACOR common fund have worked in
synergy to support the improvement in the coverage and quality of external audit,
although it appears that insufficient attention has been given to strengthening the
financial management systems of the TA itself.
Progress in the fight against corruption
285. The public perception of corruption in Mozambique is high and has remained
high throughout the evaluation period. The report of the APRM (2010) identifies
corruption as a significant problem both at high levels of government through the
manipulation of public procurement processes, and also via petty corruption, which is
practiced through bribes to employees in sectors such as health, and police. Transparency
International’s Corruption Perception Index (CPI) showed a marginal improvement from
2.8 out of 10 in 2005 to 3.1 in 2012 but this change falls within the confidence interval (2.4
-> 3.1) and is thus not statistically significant. The CPI placed Mozambique in 123rd
position in 2012 from 176 countries and 97th out of 158 in 2005. Overall, there has been
little discernible change in levels of corruption, rather a continuing and serious problem.
286. Nevertheless, a range of government initiatives have been introduced to
strengthen the fight against corruption:
§ The new Public Finance Act (the ‘Lei SISTAFE’, Law nº 9/2002) was approved in
2002, setting the framework for new public finance regulations and control
procedures, and for the subsequent development and establishment of the e-
SISTAFE integrated financial management system.

147
Independent Evaluation of Budget Support to Mozambique, 2005 -2012
§ In 2004, Parliament approved Mozambique’s first Anti-corruption Law (Law nº
6/2004).
§ In 2005 the Public Procurement Law was passed and then subsequently refined in
2010 through Decree 15/2010.
§ In 2006, the Council of Ministers approved the Anti-Corruption Strategy
(Estratégia Anti-Corrupção (EAC) 2006-2010.
287. In 2009, an evaluation of the implementation of the Anti-corruption Strategy64
concluded that although some progress had been made in implementation, there
were serious shortcomings. It noted that activities had been poorly prioritised and had
scarcely reached the local level. The report also pointed to problems concerning the legal
framework for EAC, which was considered deficient in terms of its inter-institutional
coordination, and also identified severe limitations in the technical capacity and legal
mandate of the Central Office for Combating Corrupting – Gabinete Central de Combate a
Corrupção (GCCC).
288. In March 2010 the government presented a Governance Action Plan (GAP). This
was in response to a communication in December 2009, from the Troika Plus on behalf of
the G-19, advising the government that a breach in the underlying principles of Budget
Support might have occurred. This was prompted in part by the irregularities in electoral
procedures identified by international observers of the 2009 elections and in part by a
perception of inadequate progress in the implementation of anti-corruption measures. It
led to the temporary suspension of Budget Support disbursements by 4 DPs and to a
period of significant tension in dialogue, which became known as the ‘crispação’. (See
Chapter 2 and Chapter 3, section 3.4.)
289. In response, government presented in March 2010 the Governance Action Plan
(GAP). This comprised16 action points aimed at introducing electoral reforms, promoting
political inclusivity, strengthening procurement processes (including for extractive
industries through the EITI), simplifying legal and bureaucratic procedures relating to the
private sector, simplifying land regulations, submitting a package of anti-corruption
legislation to Parliament, and formalising the Government’s response to the
recommendations of the Africa Peer Review Mechanism (APRM) report. The majority of
these actions have been implemented between 2010 and 2013. 64 ACS (2009), Avaliação da Implementação da Estratégia Anti-corrupção (2007-2009). Maputo,
UTRESP.

148
Independent Evaluation of Budget Support to Mozambique, 2005 -2012
290. As part of the Governance Action Plan, a package of anti-corruption legislation
was submitted to Parliament during 2011. Parliament opted to discuss and approve it
in a fragmented manner and 3 of the 5 laws submitted have been passed to date. In 2012
the Public Probity Law (Lei de Probidade Pública, Law 16/2012) was approved. This law is
applicable to public providers in areas such as morality, transparency, impartiality,
conflicts of interest and respect in the management of public affairs. As a result, a set of
prominent Frelimo party members were eventually forced to resign from their multiple
positions, following a concerted period of pressure from the media and civil society.
291. Two other laws within the “Anti-Corruption Package” were also passed by Parliament
in 2012. One established mechanisms to protect the rights and interests of victims,
complainants and witnesses (including “whistle-blowers”) in criminal proceedings, and
created the Central Office for the Protection of Victims. Another changed the legal
mandate of the GCCC so that it may press charges in corruption cases, while legislation
on the declaration of assets by public servants was also passed. Two laws addressing the
Penal Code have not yet been passed into law. Of those laws that have been passed,
implementation is still deficient and slow progress has been made on achieving mutually
agreed plans and indicators, although, as part of the GAP, measures have also been taken,
since 2010, to strengthen the budget and the staffing of the Central Office for Combating
Corrupting – Gabinete Central de Combate a Corrupção (GCCC).
Table 28 : Processing of Corruption Cases & Cases of Misuse of State Funds or Property: 2005-2012
Year Cases processed Number accused Court cases
2005 377 13 0
2006 310 35 5
2007 371 19 Not available
2008 619 151 59
2009 623 178 43
2010 649 223 88
2011 677 214 81 2012 526 190 88
Total 4,751 1,155 425
Source: GCCC
292. There is evidence of an increased number of corruption cases going to trial. As shown in Table 28, there has been an increase since 2008 in the number of cases processed by

149
Independent Evaluation of Budget Support to Mozambique, 2005 -2012
the GCCC and the number of people accused, and since 2009 in the number of cases going to court. Overall, the percentage of processed cases which have gone to court has increased from 9.5% in 2008 to 16.7% in 2012. However, several commentators expressed concerns to the evaluation team regarding the degree of politicisation of the judiciary system, suggesting that the potential for fair, unbiased court cases was still low.
293. As a result of the Governance Action Plan and earlier measures, the legal and institutional framework for combating corruption has been strengthened during the evaluation period, although progress on implementation has been slow. This has been a consequence both of actions to strengthen the basis for Anti-Corruption work and broader reforms to strengthen procurement and public financial management65. Although there is no evidence of positive, statistically significant change in the public perception of corruption, the legal and institutional framework to prevent corruption occurring and to prosecute identified cases of corruption is stronger.
Influence of Budget Support on changes identified
Figure 26: Allocations to Good Governance compared with estimated allocation of Domestic Revenue, showing the funding gap filled by Budget Support (MZM Trillions)
Source: Own computation based on MoF data.
294. Good Governance is one of the three sectors that appear as the primary beneficiaries of Budget Support funds during the evaluation period. Figure 26 shows the composition of spending in the sector as a whole and the estimated influence of Budget Support flows, following the assumptions adopted in section 4.3. In the sector as a whole, just as in the case of the Tribunal Administrativo, one of its component institutions, a significant part of the national budget allocations can be linked to Budget Support
65 See section 4.2 above on PFM, where we report steady improvements in the quality of the system as
measured by the PEFA assessments. These include improvements in the mechanisms for procurement, which have scored respectively “C”, “B”, and “B” in the 2006, 2008 and 2011 assessments.

150
Independent Evaluation of Budget Support to Mozambique, 2005 -2012
funds. All in all, it can be said that without the flow of funds provided by Budget Support and to a lesser extent by pooled funds and projects, the changes made in the sector would not have been easily undertaken.
295. With regard to the “institutional effects” of Budget Support processes (as opposed to the “flow of funds effects”), three avenues of influence can be identified:
§ The joint agreement and monitoring with government of targets in the Performance Assessment Framework (PAF), reviewed in the Budget Support Annual Reviews.
§ The engagement of civil society and the media within this PAF review process, and the sharing of information to assist in the research and policy advocacy activities of CSOs.
§ The monitoring of adherence to ‘underlying principles’ and the related policy dialogue between Government and the G-19.
Figure 27: Good Governance indicators in the PAF (left) and overall performance (right)
Source: Own computation based on MPD data.
296. Governance indicators have been the most prominent PAF indicators but their numbers have declined as alternative dialogue channels have been used. Over 2005 – 2012 , governance indicators (Justice, decentralisation and public sector reform) have comprised 24 % of all PAF indicators, as compared with 17 % for PFM. However, their numbers have declined from 2010 onwards. (Figure 27.) In part, this reflects the increased attention given to underlying principles and to “areas for special attention” in the GBS dialogue; and in part, the difficulty in using quantitative indicators to drive progress in a sector as complex as governance.
297. Governance indicators have performed positively during the period, with 48 % “achieved” and 33 % “not achieved but with progress”. Among them, Justice indicators are the ones that on average performed most poorly. The relevance of governance indicators, as tabulated from the opinions of Focus Group members from Government and DPs, scores quite highly (2.9 out of 4). Moreover, there was a reasonable level of consistency between Government and DP stakeholders, as to which indicators were considered more or less important. For example, both parties gave low rankings to the relative importance of indicators of “corruption cases detected”, “cases judged by year” and “crimes solved”,

151
Independent Evaluation of Budget Support to Mozambique, 2005 -2012
298. presumably because there was a mutual appreciation of the unreliability of the corresponding data and of the poor link between these data and performance.
299. Our impression from stakeholders – which is supported by the ‘relevance ratings’ below – is that the PAF indicators provided a useful vehicle, around which to debate and review governance issues. They may also have helped to raise the profile of institutions such as the TA. However, there is no clear evidence that the inclusion or exclusion of a governance indicator had a direct effect on the degree of political and administrative effort dedicated to its achievement. For example, progress on justice issues was no faster with more PAF indicators and no slower without them: this is simply an area, where reforms are inherently difficult. Thus, in the governance area in particular, the mere monitoring of PAF targets proved insufficient to generate progress: in general, this has required additional actions, undertaken either through technical assistance linked to Budget Support or through more detailed processes of dialogue, such as the matrices developed for ‘areas for special attention’, including the Governance Action Plan (GAP) and the payroll reform plan.
Table 29: Performance and relevance of PAF indicators for Governance, 2005 -2012
Sector Key Indicators
Relevance of indicators
based on the Focus Group
poll
PAF Assessment (1=Achieved; 2=Not Achieved but with progress; 3=Not achieved); 0=Not
assessed)
Govt (Ave)
DPs (Ave)
2005
2006
2007
2008
2009
2010
2011
2012
AC
Survey about good governance, corruption and service delivery. 3.67 3.13 3
Anticorruption legislation package 3.67 3.56 1 Number of corruption cases detected 2.33 2.88 1 1 1 1 1 1
J Cases judged by year 2.67 2.50 1 1 3 3 2 3 3 Penal Sector Reform 3.33 2.93 3 2 Crimes solved 2.33 2.29 2 3 0 2
TA* Coverage of Tribunal Administrativo audits 3.00 3.44 1 1 1 1 1 1 1 1
D
Decentralization policies and strategies 3.25 2.56 3 2
Number of municipalities (autarquias) 2.75 1.92 1
Intergovernmental transfers 3.25 2.94 1 1 1 1 1 1
PSR Wage and salaries harmonization policy 3.00 3.00 3 2 1 2 3 2
*Note TA indicator is not considered as a Governance but a PFM indicator in the PAF AC = Anti Corruption; J= Justice; D= Decentralization; PSR= Public sector Reform; TA=Tribunal Adminsitrativo Regarding relevance, 1= least important, 4 = most important, as judged by Focus Group members. Source: Own computation based on data from Annual Reviews and responses from Focus Groups

152
Independent Evaluation of Budget Support to Mozambique, 2005 -2012
300. The public nature of the Annual Review and the use of press statements to announce
its results are perceived as important in promoting accountability. However, CSO
stakeholders did not believe that their interventions in the Annual Reviews made a
material difference to policies. The involvement of civil society was welcomed by CSOs, as
an opportunity to obtain information and participate in debate but targeted advocacy
work and direct dialogue with Government were seen as the most effective ways of
making progress on specific governance questions.
301. There is evidence that the high level debate between Government and the G-19
at the time of the “crispação” was influential in focusing attention and speeding up
the implementation of actions included in the Governance Action Plan (GAP).
Government stakeholders asserted that all of the issues included within the GAP were
already under internal discussion and would have been implemented but they agreed
with DPs that the high-level attention to these issues helped to speed up their
implementation.

153
Independent Evaluation of Budget Support to Mozambique, 2005 -2012
5. Growth & Poverty Reduction 302. This Chapter, together with Chapters 6 and 7, reports on Step Two of the analysis,
comprising Evaluation Questions 4.1 and 4.2. These questions examine the main
outcomes and impacts, generated during the evaluation period. Using different
quantitative and qualitative analytical techniques, the EQs seek to identify the key
determinants of change over the period. In particular, they assess the relative significance,
amongst other factors, of the changes in Government’s allocative and policy decisions,
which were identified in Step One as having been induced by Budget Support processes.
303. We present the analysis of Step Two in three chapters, before then drawing our
overall conclusions on the links with Step One in Chapter 8, which comprises Step Three
of the evaluation. Our Step Two analysis covers three areas:
§ Economic growth and poverty reduction, considering trends in income and non-
income poverty during the evaluation period;
§ Agriculture sector outcomes and their determinants, looking specifically at the
relationship between poverty and agricultural productivity; and
§ Education sector outcomes and their determinants, where we examine the
relationship between the educational inputs, on which budgetary resources have
been concentrated, and the outcomes achieved in primary and secondary
education.
5.1. Growth data and trends by economic sector and province
304. Mozambique has experienced high and sustained growth during the evaluation
period at an average rate of 7.3%, but its progress in poverty reduction has been less
impressive. Although two different methodologies have been applied in measuring and
analysing poverty (the official poverty figures, presented in the Third National Poverty
Assessment and by the World Bank in Alfani et al 2012), both tell a consistent story at the
national level: there has been no statistically significant change in poverty between the
early and the late 2000s. Although the evaluation period covers the years 2005-2011, a
broader perspective helps contextualize better the growth performance in the 2000s.

154
Independent Evaluation of Budget Support to Mozambique, 2005 -2012
305. The national growth performance is summarized in Figure 28 using GDP at constant
2003 prices. This shows that while growth has remained positive and sustained over time,
its pace has slowed in the evaluation period with respect to the previous years. The recent
years though have been characterized by a greater stability in growth rates, probably
signalling the end of the stabilization process following the end of the civil war in 1992.
306. The sharp decrease in growth in 2000 reflects the severe floods that hit the country
causing major agricultural losses, as well as destroying existing irrigation infrastructure
and the cultivated land. There was a quick recovery in 2002, after which time growth has
been more stable, at an average of 7.3% in the evaluation period.
Figure 28: GDP growth (constant prices) Figure 29: Growth in selected sectors
Source: Authors’ calculations using INE data Source: Authors’ calculations using INE data
307. Figure 29 shows the performance of three selected macro-sectors, namely agriculture,
manufacturing and mining. The impact of the 2000 floods on agriculture is clear here,
while other sectors proved more resilient. The sectoral disaggregation also reveals the
high volatility of growth in the extractive sector that experienced some very high growth
peaks (2000 and 2004) and some negative growth rates (1996 and 1999). Mining was the
fastest growing sector in the Mozambican economy in 2011. Finally the growth rate in the
manufacturing sector decreased in the last part of the period but it was also more stable
than in earlier years, in line with the overall GDP trend.
308. Table 30 presents average growth rates for all sectors over 5-year periods, the last
one corresponding to the evaluation period. All sectors show decreasing average growth
rates in the last period, except for construction and agriculture (where the increase is
slight). However, average growth rates hide the large intra-period variations shown in
figures 28 and 29. As noted above, the lower pace of growth in the evaluation period is
associated with higher stability in growth rates, which may be a positive feature.

155
Independent Evaluation of Budget Support to Mozambique, 2005 -2012
Table 30: Average growth in macro-sectors at the national level Sector 1995-2000 2001-2005 2006-2011
Agriculture 5.8 7.5 7.8
Mining 15.8 25.6 14.3
Manufacturing 17.1 15.2 3.5
Utilities and public services 8.0 9.7 7.1
Construction 17.3 6.7 8.4
Services and trade 5.7 8.2 7.7
GDP 8.3 8.8 7.3
Source: Authors’ calculations using data from INE
309. It is worth noting that the manufacturing sector has been underperforming during the
evaluation period, being the slowest growing sector in the economy. In particular in 2011
the sector registered a 3% growth in real terms, compared with an overall GDP (constant
prices) growth of over 7%. This is a reverse situation with respect to the first half of the
2000s when the sector was performing better than any other sector, excluding mining.
310. An analysis of the composition of GDP by the same sectors as in Table 30 shows the
dominance of agriculture and services and trade, together accounting for at least two
thirds of GDP over the period 1995-2011 (39% and 27% respectively of GDP in 2011). The
mining sector, while growing, remained very small, only 1.45% of GDP in 2011. The
sectoral composition of GDP was remarkably stable over this period, aside from a
decrease in the share of agriculture and corresponding increase in manufacturing
between 1995 and 2000; after 2000 the sectoral composition of GDP changes little.
Agriculture remains a very important sector in Mozambique, and this is highly relevant for
poverty (70% of the Mozambican population lives in rural areas66) and for overall growth
dynamics.
311. GDP data at provincial level is available from 1997 and therefore the analysis at this
more disaggregated level focuses on a slightly shorter time horizon. Table 31 shows that,
following the same pattern observed at the national level, GDP growth has stabilized in all
provinces during the evaluation period (and sometimes slowed).
66 Estimate from the 2008/2009 household budget survey (IOF 08/09).

156
Independent Evaluation of Budget Support to Mozambique, 2005 -2012
Table 31: Mozambique - Average growth rates by province Province 1997-2000 2001-2005 2006-2011 Niassa 4.1 8.2 7.2 Cabo Delgado 5.0 7.9 7.7 Nampula 7.3 7.6 7.6 Zambezia 4.1 8.3 7.4 Tete 18.1 7.9 5.2 Manica 5.4 7.8 7.9 Sofala 6.8 8.5 7.4 Inhambane 4.9 13.3 7.6 Gaza 1.1 9.9 8.3 Maputo Province 8.4 12.0 6.3 Maputo City 9.5 7.1 7.8
Source: Authors’ calculations using data from INE
312. Growth rates have been very similar in all provinces in the last period, at between
6.3% and 8.3%. In this period the slowest growing provinces were Tete and Maputo
Province and the fastest was Gaza. In particular Tete only caught up with others in 2009,
after having experienced a drop in growth due to the 2008 weather shock that particularly
affected the central provinces.
313. The provinces in the table are ordered roughly from North to South, to facilitate the
identification of possible geographical patterns. However there is no obvious north/ south
divide in terms of economic growth, particularly in the last years considered.
314. An analysis of the sectoral composition of GDP at the province level shows that in
2011 the most agricultural areas were Zambezia and Cabo Delgado (where agriculture still
contributed over 50% of GDP), followed closely by Niassa and Gaza. Manufacturing is
highly concentrated in Maputo Province, where about half of the total national
manufacturing value added was produced. Maputo City reports a high concentration of
services, suggesting that the economy in the capital is highly reliant on this sector. Finally
mining activities were largely located in Inhambane in 2011, whereas in other provinces
they are very small (though due to the lumpy character of mining activities however, this
geographical picture may change substantially even in the span of a year).

157
Independent Evaluation of Budget Support to Mozambique, 2005 -2012
Table 32: Consumption, GDP and agriculture growth between survey years Growth 96/97 to 02/03 Growth 02/03 to 08/09
Province Consumption GDP Agriculture Consumption GDP Agriculture Niassa 64.8 20.2 6.2 45.1 9.1 10.5 Cabo Delgado 7.6 23.3 10.0 12.7 40.6 38.8 Nampula 18.4 39.3 14.0 10.4 27.7 27.0 Zambezia 34.3 30.2 16.7 -26.9 33.8 30.7 Tete 56.1 73.7 17.0 14.1 -4.6 -30.3 Manica 10.1 18.4 2.3 -15.7 26.8 24.1 Sofala 154.0 42.1 14.9 -19.8 34.9 33.9 Inhambane -10.2 26.7 3.8 74.0 92.4 58.5 Gaza 34.4 13.6 0.2 -12.2 49.6 44.2 Maputo P. 1.7 44.0 -8.1 11.2 15.5 50.2 Maputo C. 19.7 48.1 15.8 4.5 44.9 44.8 National 27.4 38.2 11.0 2.1 31.6 30.7
Source: Consumption from IAF 96/97, IAF 02/03, IOF 0809; GDP and Agriculture from INE GDP series.
315. Table 32 above shows that, at the national level, the growth in per capita
consumption has slowed dramatically over the second period while GDP growth has
remained of similar magnitude. However agricultural per capita production has grown
much faster between 2002/03 and 2008/09 (44.8%) than in the previous period (15.8%).
This high agricultural growth, combined with the predominantly rural population, might
have been a driver for poverty reduction. However the survey data show that this growth
has failed to translate into significantly higher consumption (and so presumably lower
poverty) in rural areas in particular, a picture consistent with the poverty estimates
presented above. At the provincial level the growth (both GDP and agriculture) are not
significantly correlated with changes in poverty, perhaps confirming the missing link
between growth and poverty reduction that has emerged throughout the discussion of
poverty in Mozambique. Indeed the correlation coefficients between growth in household
consumption and in GDP and agriculture are respectively 33% and 8%, neither being
statistically significant67. It is notable that the regions with worse poverty reduction
performance between 2002/03 and 2008/09 (i.e. Zambezia, Manica and Sofala) have
registered high growth rates in per capita GDP and agricultural value added.
67 Correlations coefficients are calculated for growth rates at the provincial level between 2002/03 and
2008/09.

158
Independent Evaluation of Budget Support to Mozambique, 2005 -2012
316. While we might expect growth in consumption and in GDP to be broadly consistent, it
is important to note that they are not expected to display exactly the same pattern.
Consumption is only a component of GDP, which also includes investment amongst
others. While GDP growth matters for poverty, household consumption dynamics are
almost certainly more relevant.
5.2. Trends in consumption poverty by Province
317. This section is concerned particularly with trends in poverty rather than with the level.
While poverty lines and part of the poverty debate is focused on the 13 spatial domains
used to compute poverty lines, here a disaggregation by province is used, which
corresponds to the administrative decentralized structure of Mozambique.
Table 33: Percentage Changes in poverty headcount (P0), poverty gap (P1) and squared poverty gap (P2), 1996/97 – 2008/ 09
Changes in P0 measure Changes in P1 measure Changes in P2 measure 96-97 –
02/03 02/03 – 08/09
96-97 – 02/03
02/03 – 08/09
96-97 – 02/03
02/03 – 08/09
National -15.3 0.6 -8.8 0.7 -5.3 0.7 Urban -10.5 -1.9 -7.0 -0.6 -5.0 0.0 Rural -16 1.6 -9.0 1.3 -5.2 0.9 North -11 -8.8 -7.1 -2.9 -5.0 -0.9 Centre -28.3 14.2 -16.7 8.3 -10.1 5.1 South 0.7 -9.6 2.3 -7.0 2.1 -4.6 Niassa -18.5 -20.2 -14.3 -3.5 -9.4 -0.2 Cabo Del. 5.8 -25.8 1.8 -10.1 0.4 -4.7 Nampula -16.3 2.1 -9.1 0.5 -6.0 0.5 Zambezia -23.5 25.9 -12.0 13.9 -6.2 7.8 Tete -22.5 -17.8 -12.7 -9.8 -7.2 -6.4 Manica -19 11.5 -7.4 4.3 -2.5 1.9 Sofala -51.8 21.9 -38.5 16.3 -27.8 12.8 Inhambane -1.9 -22.8 3.6 -21.3 4.6 -15.9 Gaza -4.5 2.4 -2.4 7.7 -1.6 7.4 Maputo Pr. 3.7 -1.8 3.3 -5.5 2.5 -4.7 Maputo City
5.8 -17.4 4.4 -9.1 2.6 -5.1
Source: Third National Poverty Assessment

159
Independent Evaluation of Budget Support to Mozambique, 2005 -2012
318. Table 33 reports changes in poverty between survey years, using three standard measures of poverty: the poverty headcount (or P0), the poverty gap (or P1), and poverty severity (or P2) measures68. As well as confirming the above national patterns of change, these three measures show that while progress was made in both Northern and Southern areas, the Central region of Mozambique was poorer in 2008/09 for all the poverty indicators than in 2002/03. The indicators by Province show that indeed the central provinces of Zambezia, Manica and Sofala have experienced the highest increases in their headcount poverty (P0) between the last two survey years (statistically significant for the first and third; see TPNA) notwithstanding the good performance of 96/97 – 02/03, and have experienced an increase in both the depth (P1) and the severity (P2) of poverty over the last period. Other small increases in poverty were registered in Nampula and Gaza but these changes are not statistically significant.
319. An analysis of inequality (not presented here) shows that nationally and in many provinces inequality fell, though there were large increases in some cases. The central provinces identified as poor and poorly performing, particularly Zambezia and Sofala, registered not only high but also increasing inequality between the last two survey rounds. However the most dramatic increases in inequality occurred in the north of the country and particularly in Niassa and Nampula. The two best performing provinces in terms of the reduction of inequality between 2002/03 and 2008/09 were Cabo Delgado and Tete that also registered high rates of poverty reduction over the same period.
320. It is possible to disaggregate the reduction in consumption poverty between two points in time to say how much reflects change in average consumption (growth component) and how much is due to change in inequality (redistribution component). Table 34 reports the relative contribution of these two components, calculated using the Datt and Ravallion (1992) decomposition method. The second column of the table reports the total variation in the headcount poverty between 2002/02 and 2008/09, calculated for each region using the averaged poverty line of the corresponding rural and urban spatial domain. The third and fourth columns report respectively the contribution of the growth and redistribution components to the total variation.69 The figures in Table 34 indicate that poverty reduction was mainly due to growth rather than to redistribution, except in Cabo Delgado, Nampula and Gaza where the latter component is larger; inequality rose in Nampula (associated with the increase of poverty) but fell in the other two cases (where poverty fell).
68 The poverty headcount simply measures the share of the population that reports a level of
consumption below the poverty line for the corresponding spatial domain. The poverty gap measures the gap between consumption and the poverty line as a proportion of the poverty line for all poor households (i.e. those below the poverty line). It indicates how distant is the average consumption level of the poor from the poverty line, thus indicating the depth of poverty. The poverty severity (or squared poverty gap) measures the average of the square of the relative poverty gap, again calculated only on households below the Poverty Line. By giving more weight to households that are more distant to the poverty line, it captures the severity of poverty and it takes into account inequality changes amongst the poor.
69 The sum of the two components is not equal to the total variation because a residual is also estimated using the Datt and Ravallion (1992) method

160
Independent Evaluation of Budget Support to Mozambique, 2005 -2012
Table 34: Growth-redistribution decomposition of changes in poverty from 2002/03 to 2008/09 Province Total variation Growth Redistribution Niassa -0.115 -0.201 0.043 Cabo Delgado -0.209 -0.038 -0.159 Nampula 0.082 -0.014 0.100 Zambezia 0.224 0.197 0.030 Tete -0.183 -0.108 -0.054 Manica 0.137 0.170 -0.042 Sofala 0.178 0.195 -0.032 Inhambane -0.268 -0.205 -0.019 Gaza -0.046 0.034 -0.080 Maputo P -0.058 -0.048 0.002 Maputo C -0.192 -0.148 -0.009
Source: Authors’ calculations using IAF 02/03 and IOF 08/09.
321. Finally, growth incidence curves were computed by province and at the national level. The growth incidence curve gives the growth rates in per capita consumption by percentile, ranked by the level of consumption. For simplicity only the national growth incidence curve is reported in Figure 30, and shows a mostly unequal pattern of growth over the period.
Figure 30: Growth incidence curve at the national level, 2002/03 – 2008/09
322. Table 35 reports the rate of pro-poor growth by province, obtained by integrating this curve up to the headcount poverty index for each province, so giving the mean growth rate of the poor. This is compared with the growth rate in the mean and in the median. A rate of pro-poor growth lower than the growth rate in the mean indicates that the poor have benefited less from growth than the non-poor. This is the case for 5 provinces, including four that registered the highest increases in poverty: Nampula, Zambezia, Manica, Sofala, as well as for Niassa (where poverty fell). In general the provinces with the highest rates of pro-poor growth are also those that performed better in terms of poverty reduction.

161
Independent Evaluation of Budget Support to Mozambique, 2005 -2012
Table 35: Rate of pro-poor growth by Province, 2002/03 – 2008/09 Province Pro-poor growth Growth in mean Growth at median Niassa 0.57 6.40 2.85 Cabo Delgado 3.48 2.01 4.58 Nampula -2.09 1.66 -1.06 Zambezia -6.3 -5.09 -6.01 Tete 5.70 2.22 4.90 Manica -2.91 -2.8 -2.21 Sofala -5.04 -3.6 -3.02 Inhambane 11.31 9.67 11 Gaza -1.74 -2.15 0.46 Maputo P 4.77 1.79 4.24 Maputo C 6.39 0.73 5.71 National -0.01 0.35 0.93
Source: Authors’ calculations using IAF2002/03 and IOF 2008/09
5.3. Conclusions on Income Poverty in Mozambique
323. The analysis of growth and poverty in Mozambique allows the drawing of four broad conclusions. Firstly there seem to be a missing link between growth and (especially income) poverty reduction in Mozambique. While the country experienced high and sustained growth rates in the evaluation period, the poverty reduction performance was disappointing. Indeed the analysis of pro-poor growth reported shows that at the national level the poor have benefited less from growth than the non-poor. When growth rates in GDP and in consumption are compared, this disconnect between the two appears rather clearly.
324. Secondly the sectoral analysis of GDP shows that many sectors experienced good growth, including agriculture. This sector is particularly important in the context of a highly rural population (estimated at 70% in Mozambique) and given its large contribution to GDP. However agricultural growth, that was faster in the evaluation period than before, has failed to benefit the poor as well. So good agricultural growth in aggregate has not been enough for poverty reduction.
325. The third conclusion follows naturally from the first two and it relates to data quality.
While the disconnection between GDP, agricultural and consumption growth may well be
a reality, the extent of discrepancies observed require a reflection on the reliability of
available data. National accounts aggregates (GDP and agriculture) include big
investment projects that boost growth but do not necessarily have a strong impact on
poverty. However the counter intuitive patterns do raise questions on the trustworthiness
of data. This is a point consistently underlined also in the poverty debate. Both the TNPA
and the WB paper highlight the limitations of the current surveys, particularly at the

162
Independent Evaluation of Budget Support to Mozambique, 2005 -2012
provincial level, both as regards measurement errors and the long delays between rounds.
An improved survey design and management together with a higher frequency of
survey rounds would surely make the analysis of poverty trends more reliable.
326. The general poverty story in Mozambique is one of slow progress in the
evaluation period in terms of income poverty. However, it is important to also look at
non-income poverty indicators, which tend to have lower volatility with respect to
consumption. They capture long-term welfare whereas consumption poverty is sensitive
to short term variations. This is considered in the next section.
5.4. Trends in non-income poverty
327. Turning to non-income poverty, this section considers a set of indicators largely consistent with those presented in the TNPA for the national level, but disaggregated here by province. We only consider trends between 2002/03 and 2008/09 with the aim of exploring whether improvements occurred in non-monetary poverty despite the limited progress in the consumption dimension.
328. Table 36 presents a set of indicators related to the ownership of a selection of durable goods. These are the same considered in the TNPA, but are here all disaggregated also at the provincial level. The indicators show some improvement in the probability of owning durables in all provinces, particularly when substitute good are considered jointly. This is particularly the case for transport durables, namely cars, motorbikes and bicycles, and information technologies such as radio and TV. However progress has been rather slow, consistent with the stagnating consumption poverty estimates. This consistency should be expected in the case of durables, since this aspect is fully in the household’s control whereas other non-monetary measures, such as education, are also influenced by government spending.

163
Independent Evaluation of Budget Support to Mozambique, 2005 -2012
Table 36: Percentage of households owning durable goods, 2002/ 03 and 2008/ 09
Car Motorbike Telephone Bed Province 02/03 08/09 02/03 08/09 02/03 08/09 02/03 08/09 Niassa 0.6 0.3 1.3 6.9 0.9 13.0 42.3 53.9 Cabodel. 0.7 0.4 0.8 2.8 0.9 11.5 7.8 75.6 Nampula 0.2 0.9 1.3 6.1 1.4 10.7 31.6 28.3 Zambezia 0.2 0.4 0.7 3.1 0.6 8.2 25.2 21.2 Tete 0.8 0.6 0.5 2.1 0.9 11.2 5.0 7.0 Manica 1.7 1.1 1.4 2.9 2.9 19.9 37.0 24.8 Sofala 1.7 1.4 1.8 3.3 4.0 30.5 28.5 26.1 Inhamb. 2.1 2.8 0.4 1.8 1.4 37.0 48.1 51.0 Gaza 2.6 3.2 2.7 3.2 6.0 45.8 60.2 57.7 Maputo P 3.5 5.8 0.9 2.2 15.2 68.5 69.9 69.0 Maputo C 12.8 11.5 2.4 0.9 42.4 85.3 91.2 85.8 National 1.6 1.8 1.2 3.6 4.3 23.7 34.2 39.0 Radio TV Bicycle Fridge Province 02/03 08/09 02/03 08/09 02/03 08/09 02/03 08/09 Niassa 43.0 59.6 2.1 5.1 56.9 65.5 1.4 2.3 Cabodel. 43.0 45.3 2.6 4.3 24.1 42.5 2.6 1.8 Nampula 48.3 38.5 3.0 6.0 26.7 35.1 2.2 3.0 Zambezia 39.4 41.3 1.7 3.7 38.7 48.8 1.1 1.9 Tete 45.1 47.4 1.7 3.7 27.9 41.8 2.2 2.5 Manica 63.5 71.3 4.9 6.7 38.5 55.1 4.2 4.0 Sofala 52.3 53.1 7.0 14.6 35.4 44.1 4.8 10.4 Inhambane 32.9 42.6 3.9 11.0 11.7 24.0 2.4 4.4 Gaza 34.1 40.3 4.6 20.3 16.7 19.3 7.2 9.5 Maputo P 53.5 43.1 18.3 43.7 10.2 10.2 15.0 26.9 Maputo C 61.8 40.8 56.0 65.4 7.8 5.7 43.3 48.6 National 45.5 45.8 6.3 12.4 28.1 38.1 5.1 7.5
Source: Authors’ calculations using IAF 2002/03 and IOF 2008/09
329. Table 37 looks at indicators related to housing, including sanitation and electricity. Walls are defined as durable if they are built of concrete or bricks, and the roof is so defined if built of concrete, zinc, lusalite (fibrous cement) or tiles. Sanitation indicates whether the household has access to a toilet or improved latrine, while electricity is an indicator taking the value of 1 if electricity is the main source of energy for lighting. The indicators show a generally improving trend across provinces, with only a few exceptions showing a decrease in the reported indicators. None of the provinces experienced a decrease in all of the indicators. As far as regional differences are concerned, it is worth noting that Northern provinces seems to be more deprived than Southern ones particularly in terms of durables (namely phones) and the quality of housing (durable roofs and walls).

164
Independent Evaluation of Budget Support to Mozambique, 2005 -2012
Table 37: Percentage of Households with Housing, sanitation and electricity Durable walls Durable roof Sanitation Electricity
Province 02/03 08/09 02/03 08/09 02/03 08/09 02/03 08/09 Niassa 4.4 6.6 4.4 8.1 4.9 17.0 4.4 5.3 Cabo Del. 3.6 2.2 6.8 11.2 6.0 4.4 3.0 3.8 Nampula 8.9 5.0 8.1 11.9 5.4 6.2 4.9 8.5 Zambezia 2.0 9.5 4.2 11.6 2.9 5.5 2.6 4.1 Tete 8.1 17.2 11.8 15.3 3.1 5.8 3.5 5.7 Manica 13.2 13.3 23.4 25.5 20.4 8.4 6.0 8.1 Sofala 19.7 21.0 37.3 39.1 14.3 24.1 6.7 16.7 Inhambane 12.7 13.4 37.8 45.8 5.7 19.2 2.8 3.9 Gaza 17.7 18.2 63.6 67.9 20.2 14.3 6.4 13.1 Maputo P 53.1 67.2 93.6 94.2 27.3 54.0 17.8 45.8 Maputo C 81.6 86.9 99.5 99.8 68.9 79.0 45.7 73.6 National 14.2 17.9 24.8 29.8 11.2 16.0 6.8 13.1
Source: Authors’ calculations using IAF 2002/03 and IOF 2008/09
Table 38: Literacy rates (percentage of 15-30 age group) and Education (percentage of children attending school at right age), 2002/ 03 and 2008/ 09
Primary enrolment Secondary enrolment Literacy Province 02/03 08/09 02/03 08/09 02/03 08/09 Niassa 53.1 74.2 3.0 16.9 39.2 38.8 Cabo Delgado 62.9 69.1 5.7 9.4 31.4 34.2 Nampula 54.4 66.6 2.2 10.6 34.4 43.8 Zambezia 63.9 76.7 1.8 13.0 40.7 47.6 Tete 57.3 69.3 4.1 13.3 45.5 54.2 Manica 71.2 76.2 6.6 14.3 63.3 64.7 Sofala 66.2 76.6 7.4 22.3 52.5 59.9 Inhambane 79.6 86.7 8.9 18.7 65.9 80.8 Gaza 79.4 82.7 6.7 17.7 65.9 68.8 Maputo P 88.2 90.1 11.4 35.8 79.3 84.3 Maputo C 88.8 92.5 24.9 42.5 88.0 92.3 National 65.9 75.7 6.1 17.3 49.1 56.2
Source: Authors’ calculations using IAF 2002/03 and IOF 2008/09
330. Table 38 takes into account trends in indicators related to literacy and enrolment, at both the primary and secondary level. Literacy rates are calculated for all individuals between 15 and 30 years of age. Enrolment rates indicate the share of children of official schooling age that attend school at a grade corresponding to their age range. Secondary school includes technical schools. Age groups are defined as: primary 6 to 13, secondary 14 to 19. Enrolment data show great improvement at both levels of schooling in all provinces, particularly for secondary schooling.
331. Literacy rates have increased in all provinces except Niassa, but in some cases (Cabo Delgado, Manica, Gaza) the improvements are very small. In all of these cases increased

165
Independent Evaluation of Budget Support to Mozambique, 2005 -2012
levels of enrolment at both primary and secondary level have not translated into significant improvements in this basic educational outcome. However, the elapsed time period is probably too short to measure the on-going effects of improved school enrolments on literacy..
332. Finally, Table 39 shows three standard anthropometric measures of child malnutrition, namely:
§ Stunting, based on height-for-age ratios;
§ Wasting, based on weight-for-height values;
§ Underweight, based on weight-for-age ratios.
333. All the variables are measured as the percentage of children that are below two standard deviations from the international reference value (WHO 2006). The data is from the household surveys of 1996/ 97 and 2008/ 09 that include anthropometric information for children. (The 2002/03 round did not collect such information).
334. The figures show that while progress was made at the national level, child malnutrition is still a major problem in Mozambique. At the provincial level, most regions made progress in decreasing the prevalence of stunting, except for Cabo Delgado, Nampula and Inhambane that saw increases in stunting. However some provinces that fared well in terms of stunting report increased prevalence of wasting. This is particularly the case for Zambezia, Tete, Manica and Sofala. The underweight indicator has improved in all provinces. The pattern is therefore far from clear, but it confirms that child malnutrition remains a major unresolved issue.
Table 39: Child malnutrition (% of children two standard deviations from WHO international reference value)
Stunting Wasting Underweight Province 96/97 08/09 96/97 08/09 96/97 08/09 Niassa 54.7 50.1 10.7 6.0 27.8 19.2 Cabo Delgado 50.2 54.8 12.8 7.6 36.0 26.6 Nampula 46.8 55.4 13.8 8.2 32.8 23.4 Zambezia 65.9 48.5 4.9 7.5 28.8 19.8 Tete 51.0 51.4 8.9 9.6 34.6 26.5 Manica 60.4 59.2 3.3 4.7 25.8 21.2 Sofala 54.0 35.7 8.3 11.1 29.7 19.5 Inhambane 34.0 38.6 9.3 2.9 21.2 10.8 Gaza 47.5 34.3 4.7 4.5 15.9 12.4 Maputo P 33.9 20.4 5.4 5.0 13.5 7.6 Maputo C 25.8 25.0 7.2 4.6 10.9 8.2 National 50.6 46.5 8.5 7.1 27.6 19.7
Source: Salvucci (2012)
166
Independent Evaluation of Budget Support to Mozambique, 2005 -2012
335. In general the picture shown by the non-monetary poverty indicators is more positive
than that shown by the monetary poverty measures in particular in relation to education
indicators, and to a much lesser extent for indicators relating to housing and durable
good ownership.
District level welfare assessment
336. So far the discussion has focused on the national and provincial levels. However
provinces in Mozambique cover relatively large areas and intra-province variations in
poverty may therefore be substantial. The household surveys alone do not allow
computing indicators at the next most disaggregated level, i.e. districts, because the
samples are only representative at the national and provincial level. However it is possible
to take a closer look by using census data that was collected in 1997 and in 2007. Two
approaches in particular have been adopted in the case of Mozambique : poverty
mapping and first order dominance (FOD). The poverty maps obtained through the two
approaches are reported in Volume Two.
337. The first approach (Hussain and Castigo 2012) creates poverty maps by district by
combining survey and census data. This uses indicators available in both the census and
the surveys to impute a distribution of poverty at the district level, from which a
headcount measure can be computed and presented on a map. The surveys should be
close to census years (1997 and 2007) to ensure consistency and indeed this is possible in
the case of Mozambique by using IAF 1996/ 97 and IOF 2008/ 09. The authors use
calorie-adjusted consumption70 to overcome the problem of underestimated
consumption for some households.
338. The results show that consumption poverty has decreased in 115 out of 146
districts but that differences between districts have increased between 1997 and
2007, thus pointing to important intra-province dynamics. Districts across the whole
country appear to suffer from high poverty, including in Southern areas where the district
level poverty has become increasingly concentrated. The authors also provide a map to
indicate the areas where most of the poor people live, as opposed to the poverty
headcount (which is relative to the population). Central and Northern areas, and in
particular in Zambezia, are home to most poor people in Mozambique.
70 Consumption is re-estimated and imputed for households reported to consume less than 800 calories
per capita per day. For details see Hussain and Castigo (2012).

167
Independent Evaluation of Budget Support to Mozambique, 2005 -2012
339. The second approach is based on the methodology developed by Arndt et al. (2012)
that allows establishing rankings of small areas based on strict first order dominance
(FOD) of welfare indicators in one area with respect to another. Applied to Mozambique
(Arndt et al. 2013), a multi-dimensional measure is used, which includes the following
indicators of deprivation, all available in the 1997 and 2007 census data:
§ Access to safe water
§ Access to sanitation (i.e. flush toilet or latrine)
§ Education (i.e. at least one Household member has some education)
§ Access to electricity for lighting
§ Radio (i.e. the Household has a functioning radio).
340. The FOD methodology is used to rank districts by level of deprivation in both 1997
and 2007, as well as to obtain a temporal index indicating advancement in welfare over
time. The results show that the worst-ranked districts are in the Central and Northern
areas, both in 1997 and 2007, while the Southern districts are the best-ranked ones. The
correlation between the FOD index in 1997 and in 2007 is high (0.87), indicating that the
welfare rankings are fairly stable.
341. At the provincial level some changes can be identified, with Zambezia and Nampula
relatively worsening on average and Niassa, Manica and Sofala improving. This confirms
again Zambezia as one of the most problematic provinces in Mozambique. The general
patterns revealed by this analysis are consistent with the poverty mapping approach.
5.5. Conclusions on Growth & Poverty in Mozambique
342. There seems to be a missing link between growth and poverty reduction in
Mozambique. While the country experienced high and sustained growth rates in the
evaluation period, the poverty reduction performance was disappointing. Indeed the
analysis of pro-poor growth reported shows that at the national level the poor have
benefited less from growth than the non-poor. When growth rates in GDP and in
consumption are compared, this disconnect between the two appears rather clearly.
343. The sectoral analysis of GDP shows that many sectors experienced good growth,
including agriculture. This sector is particularly important in the context of a highly rural
population (estimated at 70%) and given its large contribution to GDP. However
agricultural growth, although faster in the evaluation period than before, has also failed to

168
Independent Evaluation of Budget Support to Mozambique, 2005 -2012
benefit the poor. Good aggregate agricultural growth has not been enough for poverty
reduction.
344. The general poverty story in Mozambique is one of slow progress in the
evaluation period particularly with regard to income poverty. Poverty has been
assessed here including both its consumption and non-monetary dimensions. Progress
was made in most provinces in terms of housing and education, particularly in those areas
where public spending is likely to have a large impact such as enrolment rates and
electrification. However slow progress is observed in consumption poverty as well as in
malnutrition and some dimensions of non-monetary poverty, particularly durables (with
the exception of telephones).
345. . With regard to malnutrition and other aspects of non-income poverty the
analysis also points to a disappointing performance in this area. While the non-
monetary measures show a more positive picture on poverty reduction, this change is
largely driven by the improvements in education provision. Chapter 7 presents a more
detailed analysis of educational outcomes, including an analysis of progression, repetition
and drop out rates.

169
Independent Evaluation of Budget Support to Mozambique, 2005 -2012
6. Agricultural Sector Outcomes and their Determinants
346. The aggregate national accounts data for Mozambique shows that the agriculture
sector has shown significant growth since 1995. Although for much of that period it has
grown at rates slightly below the average for the economy as a whole, it in fact grew
faster than average over the 2006 -11 period. Despite this, when it comes to explaining
the lack of progress in poverty reduction from 2002/03 to 2008/09, much of the blame for
this is attributed to the lack of progress in agriculture, including the lack of progress in
raising productivity. This is a widely shared concern in Mozambique.
347. This chapter therefore focuses on understanding the trends in, and correlates of,
agricultural productivity in Mozambique over the period 2002 -2008 using data from the
TIA agricultural surveys. The data in particular refers to small and medium farms as these
are the ones most directly related to poverty. Data on community surveys is also used but
only for 2002 and 2003, the only years we were able to obtain. Data from the 2012 TIA
survey was also available, but regrettably did not collect data on production and so could
not be used to estimate productivity.
348. The surveys cover around 5000 farms in 141 districts in Mozambique. The analysis of
productivity conducted here is done at the level of individual farms, as well as at the
community and district level. We begin by presenting some descriptive statistics from the
TIA surveys covering not just productivity but also use of inputs, sale of outputs etc. The
subsequent then presents an econometric analysis of the correlates of productivity, as a
guide to the potential formulation of public policies aimed at improving the productivity
of small and medium farms.
6.1. Trends in agricultural performance
349. The core measure of productivity used here is the value of crop output per unit of
cultivated area, expressed in 2006 province specific prices in order to make the different
provinces and rounds of survey data comparable. A frequency distribution of productivity
across farms in the first and last year for which we have data, respectively 2002 and 2008
shows that throughout most of the distribution, productivity was higher in 2008 than it
was in 2002. This of course can be sensitive to the specific years chosen and climatic
conditions at the time.

170
Independent Evaluation of Budget Support to Mozambique, 2005 -2012
350. Figure 31 shows the year to year trends in the median productivity of small and
medium farms at the national level and by province. The first panel (a) shows the trend in
average national productivity over the years of the TIA surveys. The pattern is one of a
modest increase in productivity over the period, though with some volatility and actually
declining from 2006 to 2008. The second panel (b) shows the equivalent information at a
province level. This shows both significant variations in the level of productivity by
province, and often different trends over time. Productivity levels are highest in Niassa
and Tete, followed by Cabo Delgado and Maputo, whereas productivity levels are very
low in Zambézia and Inhambane. This is strongly associated with the geographic poverty
pattern revealed by the 2008/ 09 IOF survey: the first three are provinces with relatively
low levels of poverty, the last two are provinces with high poverty levels. In addition, it will
be seen shortly that this is strongly linked to patterns of fertilizer use, which is strongly
associated with productivity and whose use is highest in Tete and Niassa.
Figure 31: Trends in median agricultural productivity, 2002-08 (a) National Pattern
(b) Province level patterns

171
Independent Evaluation of Budget Support to Mozambique, 2005 -2012
050
010
0015
000
500
1000
1500
050
010
0015
00
2002 2004 2006 2008
2002 2004 2006 2008 2002 2004 2006 2008 2002 2004 2006 2008
niassa cabo delgado nampula zambezia
tete manica sofala inhambane
gaza maputo maputo city
Media
n Pro
ducti
vity (
Mtk/H
a)
Graphs by Province
Source: TIA surveys
351. Niassa and Tete show large increases in productivity over this period, and there are
more modest increases in Manica, Sofala and Cabo Delgado. Other provinces show
declines (Nampula, Inhambane) or little progress from a low base (Zambézia). An
immediate point to note is the close association between the evolution of productivity
and changes in poverty: Niassa, Tete and Cabo Delgado all had quite large reductions in
poverty over almost the same periods (2002/03 to 2008/09), while Zambézia had an
increase. This association does not however apply to Inhambane where the poverty
reduction does not reflect improved agricultural productivity.
352. The median area cultivated, while not particularly small, does decline over the period
(see Table 40). More than half of the land is allocated to basic crops, and other large
shares to beans and potatoes. The median area allocated to cash crops is small. A
minority of farmers (around 32%) grow cash crops in any case and there is no obvious
trend in this.

172
Independent Evaluation of Budget Support to Mozambique, 2005 -2012
Table 40: Median Area cultivated in Hectares
Total Basic Food Beans Potato
Cash Crop
2002 1.86 1.16 0.20 0.27 0.10 2005 2.27 1.19 0.28 0.30 0.18 2006 1.93 1.03 0.26 0.23 0.11 2007 1.82 0.96 0.25 0.24 0.09 2008 1.67 0.87 0.23 0.23 0.10 Total 1.87 1.01 0.24 0.25 0.11 Source: TIA surveys
353. In terms of inputs the proportion of farmers using fertilizer and pesticides is very low, at 3-4% and 4-6% respectively (see Table 41), and it shows no obvious trend over time. The proportions using manure are also very small. Less than 10% use improved seeds in most years. In addition only a minority report having access to information; where they do it is commonly via the radio and very rarely via extension services. But households still sell quite a lot: the proportion of output which is sold is around 40% which is quite high and if anything shows an increase over the period from 2003 to 2012. (See Table 42.)
Table 41: Percentage of farmers using different inputs
Improved seeds
Used fertilizer
Used manure
Used pesticides Had
Information Through…
Radio
Extension Service
2002 0.037 0.060 0.068 0.345 2003 0.025 0.018 0.052 0.472 0.315 0.066 2005 0.09 0.038 0.028 0.054 0.403 0.300 0.057 2006 0.14 0.046 0.030 0.053 0.363 0.248 0.033 2007 0.14 0.041 0.048 0.042 0.351 0.207 0.030 2008 0.12 0.041 0.044 0.038 0.341 0.218 0.024 2012 0.10 0.026 0.024 0.060 0.490 0.295 0.023 Total 0.12 0.036 0.036 0.052 0.396 0.263 0.038
Source: TIA surveys Table 42: Proportion of output sold, by crop type and year
Sell / Production Share Cash Crop Likelihood
All
Basic Food
Beans Potato Cash Crop
2003 0.40 0.37 0.45 0.59 0.13 2005 0.36 0.35 0.47 0.20 0.63 0.15 2006 0.41 0.34 0.48 0.69 0.14 2007 0.44 0.37 0.50 0.64 0.14 2008 0.44 0.38 0.51 0.66 0.12 2012 0.45 0.37 0.51 0.63 0.14 Total 0.41 0.36 0.49 0.20 0.64 0.14
Source: TIA surveys
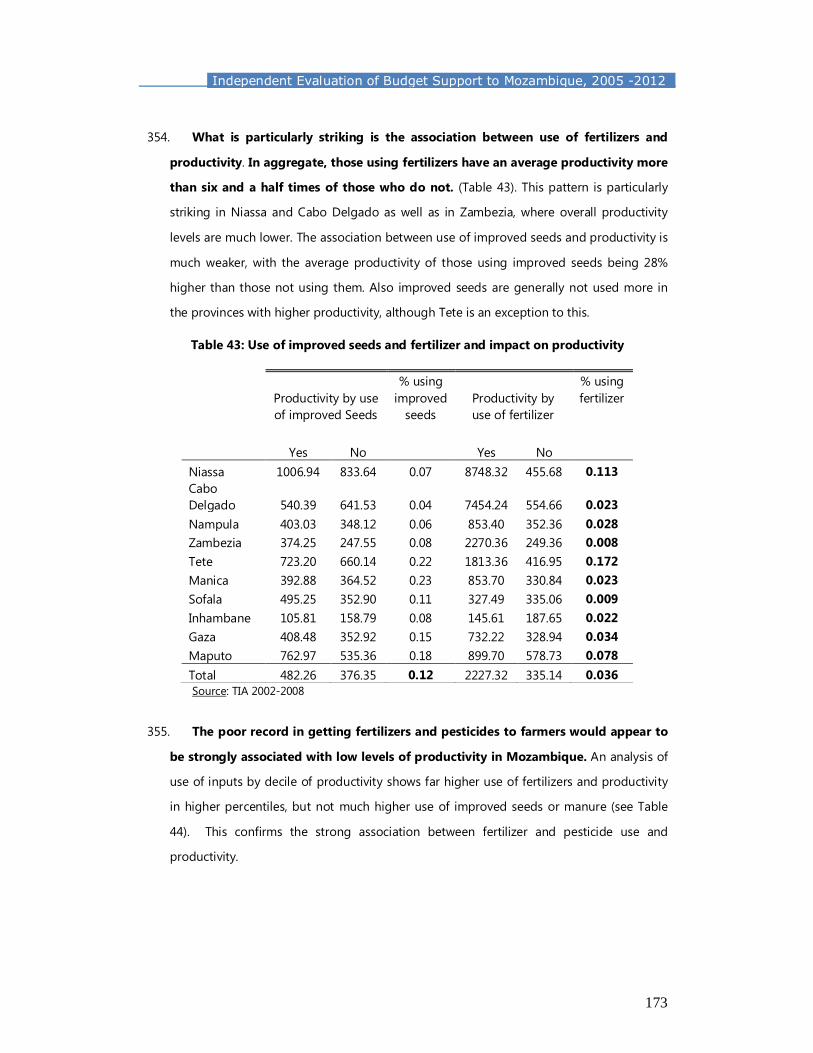
173
Independent Evaluation of Budget Support to Mozambique, 2005 -2012
354. What is particularly striking is the association between use of fertilizers and
productivity. In aggregate, those using fertilizers have an average productivity more
than six and a half times of those who do not. (Table 43). This pattern is particularly
striking in Niassa and Cabo Delgado as well as in Zambezia, where overall productivity
levels are much lower. The association between use of improved seeds and productivity is
much weaker, with the average productivity of those using improved seeds being 28%
higher than those not using them. Also improved seeds are generally not used more in
the provinces with higher productivity, although Tete is an exception to this.
Table 43: Use of improved seeds and fertilizer and impact on productivity
Productivity by use of improved Seeds
% using improved
seeds Productivity by use of fertilizer
% using fertilizer
Yes No
Yes No
Niassa 1006.94 833.64 0.07 8748.32 455.68 0.113 Cabo Delgado 540.39 641.53 0.04 7454.24 554.66 0.023 Nampula 403.03 348.12 0.06 853.40 352.36 0.028 Zambezia 374.25 247.55 0.08 2270.36 249.36 0.008 Tete 723.20 660.14 0.22 1813.36 416.95 0.172 Manica 392.88 364.52 0.23 853.70 330.84 0.023 Sofala 495.25 352.90 0.11 327.49 335.06 0.009 Inhambane 105.81 158.79 0.08 145.61 187.65 0.022 Gaza 408.48 352.92 0.15 732.22 328.94 0.034 Maputo 762.97 535.36 0.18 899.70 578.73 0.078 Total 482.26 376.35 0.12 2227.32 335.14 0.036 Source: TIA 2002-2008
355. The poor record in getting fertilizers and pesticides to farmers would appear to
be strongly associated with low levels of productivity in Mozambique. An analysis of
use of inputs by decile of productivity shows far higher use of fertilizers and productivity
in higher percentiles, but not much higher use of improved seeds or manure (see Table
44). This confirms the strong association between fertilizer and pesticide use and
productivity.

174
Independent Evaluation of Budget Support to Mozambique, 2005 -2012
Table 44: Productivity and use of inputs by productivity percentile
Percentile Productivity Fertilizers Manure Pesticide Seeds 10th 34.28 0.019 0.051 0.047 0.092 25th 74.49 0.020 0.047 0.040 0.099 50th 311.83 0.040 0.040 0.063 0.113 75th 617.84 0.057 0.046 0.083 0.102 90th 1905.26 0.132 0.054 0.182 0.149 Total 1670.36 0.080 0.047 0.106 0.107 Source: TIA 2002-2008. Seeds only from 2005
6.2. Regression analysis: productivity and input use
Table 45: Regression Analysis for determinants of productivity at the farm level
(1) (2) (3) (4) (5) VARIABLES Total Basic Food Beans Potato Cash Crops seeds 46.4 400.1** -3,103.9 1,235.6 475.7 (262.696) (159.847) (4,260.529) (930.734) (4,759.278) fert 3,816.1*** 618.9*** 17,464.7*** -1,038.4 13,524.5*** (322.346) (226.075) (5,031.838) (1,491.031) (4,657.434) pest 1,590.3*** -80.6 862.9 -1,744.1 -2,501.4 (280.218) (213.007) (5,226.251) (1,244.080) (3,698.756) estrume 162.1 43.2 8,837.4 -878.5 4,647.4 (386.945) (240.939) (5,811.539) (1,449.955) (7,407.673) credito 1,042.1*** -397.5* -6,668.2 522.2 2,765.8 (351.956) (238.211) (5,837.961) (1,650.368) (4,812.616) precrad -140.1 79.0 -504.6 1,660.5** -930.1 (194.057) (114.244) (3,044.183) (653.250) (3,605.739) precass -313.2 485.8* -2,607.3 1,810.9 -2,931.4 (437.479) (261.765) (6,683.957) (1,631.498) (7,504.848) precext 273.3 673.8*** -3,309.9 -1,325.4 1,542.1 (375.109) (233.652) (6,290.254) (1,130.834) (6,033.375) precpub 485.4 1,013.3*** -1,575.5 -1,349.5 3,307.1 (445.459) (265.951) (7,547.845) (1,578.829) (7,559.079) precout 40.7 -71.6 -2,545.4 -1,683.3* -3,869.6 (218.504) (130.557) (3,455.050) (872.648) (3,981.894) Constant 2,746.6*** 561.9*** 10,584.8** 885.3 45,579.8*** (320.623) (198.406) (4,429.560) (1,338.538) (6,855.028) Observations 8,005 4,717 2,345 610 2,737 R-squared 0.065 0.055 0.033 0.128 0.052 Province FE Yes Yes Yes Yes Yes Year FE Yes Yes Yes Yes Yes
Standard errors in parentheses *** p<0.01, ** p<0.05, * p<0.1
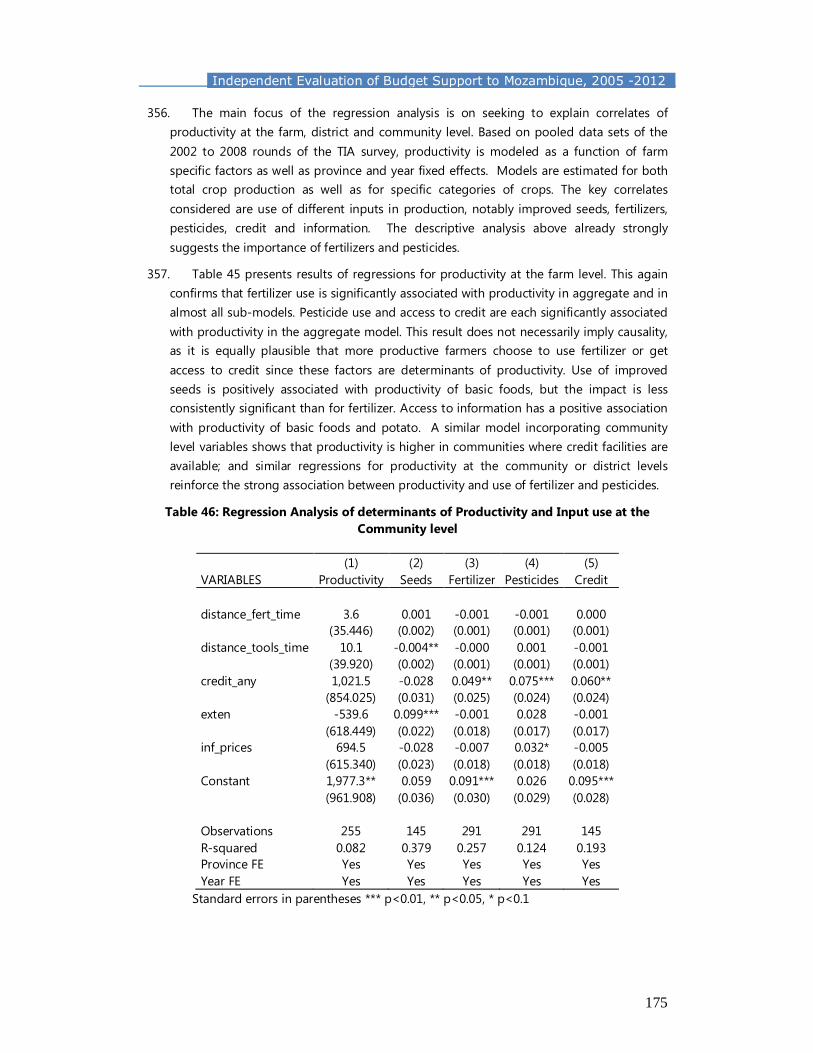
175
Independent Evaluation of Budget Support to Mozambique, 2005 -2012
356. The main focus of the regression analysis is on seeking to explain correlates of productivity at the farm, district and community level. Based on pooled data sets of the 2002 to 2008 rounds of the TIA survey, productivity is modeled as a function of farm specific factors as well as province and year fixed effects. Models are estimated for both total crop production as well as for specific categories of crops. The key correlates considered are use of different inputs in production, notably improved seeds, fertilizers, pesticides, credit and information. The descriptive analysis above already strongly suggests the importance of fertilizers and pesticides.
357. Table 45 presents results of regressions for productivity at the farm level. This again confirms that fertilizer use is significantly associated with productivity in aggregate and in almost all sub-models. Pesticide use and access to credit are each significantly associated with productivity in the aggregate model. This result does not necessarily imply causality, as it is equally plausible that more productive farmers choose to use fertilizer or get access to credit since these factors are determinants of productivity. Use of improved seeds is positively associated with productivity of basic foods, but the impact is less consistently significant than for fertilizer. Access to information has a positive association with productivity of basic foods and potato. A similar model incorporating community level variables shows that productivity is higher in communities where credit facilities are available; and similar regressions for productivity at the community or district levels reinforce the strong association between productivity and use of fertilizer and pesticides.
Table 46: Regression Analysis of determinants of Productivity and Input use at the Community level
(1) (2) (3) (4) (5) VARIABLES Productivity Seeds Fertilizer Pesticides Credit distance_fert_time 3.6 0.001 -0.001 -0.001 0.000 (35.446) (0.002) (0.001) (0.001) (0.001) distance_tools_time 10.1 -0.004** -0.000 0.001 -0.001 (39.920) (0.002) (0.001) (0.001) (0.001) credit_any 1,021.5 -0.028 0.049** 0.075*** 0.060** (854.025) (0.031) (0.025) (0.024) (0.024) exten -539.6 0.099*** -0.001 0.028 -0.001 (618.449) (0.022) (0.018) (0.017) (0.017) inf_prices 694.5 -0.028 -0.007 0.032* -0.005 (615.340) (0.023) (0.018) (0.018) (0.018) Constant 1,977.3** 0.059 0.091*** 0.026 0.095*** (961.908) (0.036) (0.030) (0.029) (0.028) Observations 255 145 291 291 145 R-squared 0.082 0.379 0.257 0.124 0.193 Province FE Yes Yes Yes Yes Yes Year FE Yes Yes Yes Yes Yes
Standard errors in parentheses *** p<0.01, ** p<0.05, * p<0.1

176
Independent Evaluation of Budget Support to Mozambique, 2005 -2012
358. The use by farmers of different inputs as a function of community characteristics (see Table 46) shows that when credit is available farmers are more likely to use fertilizers and pesticides, and that where extension services are available and the community is closer to input sources, farmers are more likely to use improved seeds. However, proximity to the source of fertilizer is not an important correlate of fertilizer use. Similar models conducted at the community level emphasize the important association between access to credit and use of fertilizers as well as pesticides.
359. The extent to which use of inputs varies between more and less productive farmers suggests that a quantile regression may be appropriate. Instead of estimating the regression relative to the mean, quantile regressions estimate the equation relative to different percentiles of the conditional distribution of the dependent variable (here productivity). In particular, a quantile regression can be used to see if different relationships apply for different parts of the distribution. Quantile regressions for the 10th, 25th, 50th, 75th and 90th percentiles are presented in Table 47. The strong association between fertilizer and pesticide use and productivity is evident in all of the regressions, but the magnitudes of the impacts, especially of fertilizer, are particularly large in the higher percentiles. Given the average productivity by percentiles showed in Table 47, it is possible to estimate the relative impact of fertilizers.
Table 47: Quantile regression for correlates of total productivity in crop cultivation
Q10 Q25 Q50 Q75 Q90 VARIABLES Total Total Total Total Total seeds -4.3 3.1 32.9 221.1* 740.5** (8.819) (14.562) (44.495) (134.350) (318.448) fert 142.0*** 418.7*** 1,474.1*** 4,108.9*** 7,883.3*** (10.821) (17.869) (54.598) (164.857) (390.757) pest 40.3*** 109.9*** 488.8*** 1,619.0*** 3,583.6*** (9.407) (15.533) (47.463) (143.311) (339.688) estrume -8.9 -7.7 -49.4 -111.0 30.5 (12.990) (21.450) (65.540) (197.895) (469.066) credito 2.4 47.0** 58.3 297.9* 1,440.7*** (11.815) (19.510) (59.614) (180.000) (426.652) precrad 9.1 32.7*** 69.4** 149.7 284.0 (6.515) (10.757) (32.869) (99.246) (235.242) precass -13.7 -5.8 -21.9 46.0 -73.3 (14.687) (24.251) (74.099) (223.739) (530.325) precext 11.2 12.2 47.1 133.6 559.4 (12.593) (20.794) (63.535) (191.841) (454.718) precpub 21.6 53.0** 89.6 262.8 560.0 (14.954) (24.693) (75.451) (227.821) (539.999) precout 1.8 -0.7 -10.2 -48.4 -108.6 (7.335) (12.112) (37.010) (111.749) (264.877) Constant 77.7*** 218.7*** 758.9*** 2,161.4*** 5,606.1*** (10.867) (17.944) (54.829) (165.555) (392.412) Province FE Yes Yes Yes Yes Yes Year FE Yes Yes Yes Yes Yes Observations 8,005 8,005 8,005 8,005 8,005
Standard errors in parentheses *** p<0.01, ** p<0.05, * p<0.1

177
Independent Evaluation of Budget Support to Mozambique, 2005 -2012
360. The use of fertilizers increases productivity by a factor of 4.14 in the 10th percentile, 5.62 in the 25th percentile, 4.72 in the 50th, 6.65 in the 75th and 4.13 in the 9th one. (Table 47.) Fertilizer impacts on productivity everywhere, and the impact seems to be consistently large. The use of improved seeds though only has a positive impact in the higher percentiles: in other words their productivity impact is not significant at the bottom of the distribution. Credit also matters for the most productive farmers, as well as some less productive ones.
6.3. Conclusions on determinants of agricultural productivity
361. There is certainly a strong association between productivity in agriculture and poverty in Mozambique. Without doubt levels of productivity in agriculture are low and have only improved very slowly over the 2002-08 period. The use of fertilizer, pesticides, and improved seeds are all very low; access to credit is limited; and only a minority of farmers have access to information, and when they do it very rarely comes from extension services.
362. Yet, the picture is not just a negative one. Strikingly, there is a very strong and very large association between the use of fertilizer and pesticides and productivity. Quite a few farms grow cash crops and farmers sell quite a high proportion of their output (some 40% in total). Improved seeds have a positive but more marginal impact on productivity.
363. Data also show that productivity has increased in several locations in Mozambique over the 2002-08 period, and for the most part these are the same locations which experienced greater poverty reduction over the same period. These are also mostly the same locations where fertilizer and pesticides are more widely used. Access to inputs seems to be critical to raising productivity and the large majority of farmers fail to get access to these inputs or to the credit needed to finance their purchase. This would seem to be a major factor behind their poverty.
364. Access to inputs and credit is clearly not just the responsibility of government, as the private sector also plays an important role but key government actions can certainly facilitate this. Infrastructure is one key factor, including access to roads and markets. Measures to facilitate access to credit in rural areas by simplifying the legal and institutional framework for credit providers are likely to be useful. Actions to improve awareness of the importance of fertiliser and other inputs and to incentivise their marketing and distribution into more remote rural areas might also be considered.

178
Independent Evaluation of Budget Support to Mozambique, 2005 -2012
7. Education Sector Outcomes and their Determinants
365. The education sector is crucial in ensuring long-term poverty reduction as well as
sustainable development. It represents a substantial item of public spending - around one
fifth of the public budget and, during the evaluation period, public spending in the
education sector rose dramatically – from some US $ 310 million in 2005 to US $ 938
million in 2012. Moreover, as noted in Chapter 4, it has been the major beneficiary of
Budget Support funding. The analysis of education sector outcomes therefore allows us
to judge whether positive benefits have been obtained from the increased public
spending facilitated by Budget Support.
366. This Chapter is organised as follows. It first assesses the situation in the education
sector in terms of enrolment rates, analysing trends in time, by province and by gender.
Secondly, we present our analysis of the determinants of a selected number of key
outcomes, with particular attention to the schooling inputs (teachers, text books, etc)
provided, directly or indirectly, by government – in other words, the immediate outputs of
education sector spending. This analysis sheds light on the nature of education outcomes,
in terms of quantity and quality, and on the specific expenditure outputs that have been
most relevant in determining such outcomes.
7.1. Overview of enrolment & other key data
367. Data on education is available for Mozambique from two main sources: the Ministry
of Education and the three household surveys carried out in 1996/97 (IAF), 2002/03 (IAF)
and 2008/09 (IOF). The Ministry of Education collects administrative data, through the
Education Management Information System (EMIS). The EMIS dataset is a comprehensive
source of information on pupils and their progress in education, teachers and their
qualifications, schools and their infrastructure. The EMIS data can be disaggregated by
grade, district, school, and gender. It includes information on over 13,000 schools: private
(1%), public (97%) and community (2%) for a period of 9 years (2004 to 2012).
368. The EMIS data on enrolments and other key variables is presented below, It provides
the basis for the econometric analysis of outcomes and their relationship to spending
outputs. In the latter we consider the following outcomes that refer to education quantity
as well as quality:

179
Independent Evaluation of Budget Support to Mozambique, 2005 -2012
§ Absolute enrolment, taking the value of 1 in 2004
§ Progression indicates the proportion of pupils in grade g that progressed to
grade (g + 1).
§ Repetition captures the proportion of pupils required to repeat a year before
they can progress further in their education.
§ Approval indicates the proportion of pupils that were approved in grade 7 to
proceed to secondary education.
369. The econometric analysis relates these outcomes to a number of educational inputs
that can be measured with the EMIS data, such as the ratio of teachers per pupil, the
proportion of teachers with high qualifications, class size, number of classrooms, the
number of mathematics books per pupil, the material used to build the school. All
outcome and input indicators are available at a disaggregated level, for instance by sex,
school type, level of schooling, and by year.
370. The IAF/IOF household surveys are representative at the national and provincial level.
They contain information on education at the individual level, and particularly on
children’s attendance at school and the current grade. This allows us to compute
enrolment rates by province, by gender and by level of schooling. Enrolment rates
indicate the share of children of official schooling age that attend school at a grade
corresponding to their age range – in other words, these are Net not Gross Enrolment
Rates71.. Because the surveys are representative at the provincial level at maximum, it is
not possible to match them with EMIS administrative data at the district or school level.
Enrolment data from household surveys
371. The (net) enrolment rate at the primary level in 2008/09 was 75.7%, markedly higher than the 1996/97 (42.4%) and 2002/2003 (65.9%) rates. These figures confirm the great effort the government has made in increasing enrolment and the tremendous progress made in this sector over this period. However the Millennium Development Goal of having all boys and girls in primary education is still far away and even in 2013 is still unlikely to be met (Visser 2013). It is plausible that this progress in enrolment involved particularly poorer households that are most likely excluded from education and most affected by demand side constraints. Fox et al. (2012) confirm that the largest gains in the
71 Secondary school includes technical schools and the age groups are defined to correspond to the
education system of Mozambique. In particular children start primary school at 6 years of age, complete the first cycle at grade 5 when they are 11, and finally complete grades 6 and 7 of primary school by 13 years of age. Secondary school involves 5 grades and it is expected to be completed at 19 years of age.

180
Independent Evaluation of Budget Support to Mozambique, 2005 -2012
observed increase in enrolment is for poorer households, who also benefited particularly from the reforms of 2004 – notably, from the abolition of fees and the provision of free textbooks.
372. As far as secondary education is concerned, great progress has been made perhaps due to the lower starting rates. In 2008/09 17.3% of children of the relevant age group were in secondary education, compared with a rate of 3.1% in 1996/97 and 6.1% in 2002/03.
373. In terms of provincial trends, progress was made consistently across provinces both in primary and secondary enrolment. In all provinces, the increase in primary enrolment rates was relatively quick between 1996/97 and 2002/03 and more moderate between 2002/03 and 2008/09. At the secondary level the picture is different, with a higher pace of increase in the second than in the first period. This is probably due to a lag effect: with more pupils completing primary education more children were actually able to continue to secondary education, resulting in a higher rate of increase in secondary enrolment in the second period.
374. The provinces with the lowest primary enrolment rates in 2008/09 were Nampula, Cabo Delgado, Tete and Niassa; the highest enrolment rates were reported in Maputo City, Maputo Province, Inhambane and Gaza. The picture is very similar at the secondary level. The provincial pattern in terms of enrolment rates is highlighted in Figure 32, where provinces are ordered from north to south on the horizontal axis72 and enrolment rates for 2008/09 are measured on the vertical axis. For primary enrolment, Northern provinces clearly perform worse than Southern ones. This regional pattern is confirmed at the secondary level but less markedly so.
Figure 32: Regional pattern in Primary and Secondary Enrolment rates, 2008/09
Source: Author’s calculations from IOF 2008/09.
72 The numbers in the axis are associated to provinces as follows: 1 Niassa, 2Cabo Delgado, 3 Nampula,
4 Zambezia, 5 Tete, 6 Manica, 7 Sofala, 8 Inhambane, 9 Gaza, 10 Maputo Province, and 11 Maputo City

181
Independent Evaluation of Budget Support to Mozambique, 2005 -2012
Figure 33: Primary and Secondary Net Enrolment rates by sex and by year, 1997 - 2009
Source: Author’s calculations from IAF 96/97, IAF 02/03 and IOF 2008/09.
375. Girls’ enrolment is always lower than for boys in all years and in all schooling levels.
However, the primary enrolment rate for boys in 2008/9 was only 4% higher than
the corresponding figure for girls, indicating a small and gradually reducing gender
gap at this level of schooling. (Figure 33.)This may be due to the abolition of fees from
2004 and therefore the softening of financial constraints that may reduce the demand for
education for girls in particular.
376. At secondary level the gender gap is much larger, at 40%, indicating a problem
related to girls staying in school rather than entering the system in the first place.
Family planning issues related to marriage and early pregnancy may also explain this
result.
Descriptive analysis based on the EMIS data
377. As we do not have population data to compute enrolment rates, the enrolment
figures computed from the EMIS data are absolute figures scaled as an index, such that
2004=1.00. In addition this analysis looks at progression and repetition rates, class sizes
and pupil per teacher ratios. Table 48 presents the national results. The pattern here is
one of fast increasing enrolment. It drops slightly from 2010, probably reflecting the
constraints on system expansion on both supply and demand sides. As already seen, a
particularly large increase is observed at secondary level, although starting from a lower
base.

182
Independent Evaluation of Budget Support to Mozambique, 2005 -2012
Table 48: Key indicators for primary and secondary education in Mozambique, 2004-12 Primary
Enrolment Progression Repetition Class Size Pupils per
Teacher 2004 1.00 0.20 18.47 73.80 2005 1.15 0.84 0.11 19.23 82.65 2006 1.24 0.84 0.06 18.55 86.53 2007 1.33 0.85 0.06 19.25 76.99 2008 1.42 0.85 0.06 19.54 76.46 2009 1.44 0.83 0.07 18.62 71.55 2010 1.46 0.83 0.07 18.27 68.02 2011 1.42 0.81 0.07 18.05 62.32 2012 1.41 0.81 0.07 17.44 60.47
Secondary
Enrolment Progression Repetition Class Size
Pupils per Teacher
2004 1.00 0.17 26.22 29.22 2005 1.20 0.85 0.15 26.81 33.42 2006 1.34 0.82 0.12 27.93 40.38 2007 1.50 0.83 0.11 28.13 39.91 2008 1.60 0.84 0.10 27.78 37.49 2009 1.67 0.83 0.10 27.72 38.11 2010 1.71 0.83 0.11 28.91 40.36 2011 1.70 0.82 0.12 29.25 38.09 2012 1.65 0.80 0.12 27.31 36.94
378. .The number of pupils per teacher falls significantly over this period at both primary
and secondary level though the absolute levels remain quite high. The average primary
class size at least seems to be declining marginally over recent years. This reduction in
pupils per teacher is observed in most provinces.
379. At both primary and secondary level the progression rates are in the range 80-85%,
declining a little at primary level in more recent years. Repetition at primary level had
been quite high in 2004, but has declined since and levels are now in the range 6-7%. At
secondary level, repetition rates are higher and increasing since 2009. There are no
significantly different patterns by province.
380. By achieving fast increases in enrolment while maintaining relatively high progression rates, it has been possible to attain dramatic improvements in gross completion rates, which increased four-fold at primary level and eight-fold at secondary level between 2004 and 2012. UNESCO has described this as ‘perhaps the most prominent success in the sector’ (UNESCO, 2011). Given the scale of system expansion, it is not surprising that some fall in progression rates has occurred, given that a higher proportion of pupils from less well-resourced households is being admitted. At the secondary level, international data show that the level of parental education is a major determinant of performance and this is likely to be an important factor here: many of the pupils enrolling

183
Independent Evaluation of Budget Support to Mozambique, 2005 -2012
into secondary in the evaluation period would have come from households where no adult had secondary education. Although the drop in progression rates is relatively small (84% to 81% in primary, 85% to 80% in secondary), the fact that this has been accompanied by a fall in repetitions indicates that those not progressing are increasingly dropping out of the education system, which is clearly a concern.
381. EMIS also reports on the extent to which teachers are trained, the availability of books and the construction of the schools. This information is summarized for primary schools at the national level in Figures 34, 35 and 36. There has been a large reduction since 2004 in the number of teachers without any training: a province level analysis shows this to be the case everywhere, although the process is slower and less consistent in Zambezia than anywhere else. At the national level there is an increase in the proportion having a high degree of training; at the province level though this is not observed everywhere and there are still hardly any highly trained teachers in Cabo Delgado, Inhambane, Manica and Zambezia, although the proportions with some training are increasing.
Figure 34: Extent of training of teachers in Primary Education, 2004 - 2012
382. The availability of books per pupil at primary level has not kept pace with the growth of enrolments, declining by 30-35% over the period (compared with a 41% expansion in enrolments).. In terms of classroom construction there has been a modest increase over the period in those constructed from concrete or brick. Given the significant expansion in the number of schools and classrooms this is not an insignificant achievement but a majority of classrooms are still made of maticado73, mud or other generally substandard materials.
73 Maticado is a mixture of non-durable materials such as mud, straw, and canes.

184
Independent Evaluation of Budget Support to Mozambique, 2005 -2012
Figure 35: Index of availability of books per pupil in Primary schools, 2004=1.00
Figure 36: Classroom construction material; Primary Schools, 2004-2012
7.2. Analysis of the determinants of educational outcomes
383. The econometric analysis looks at the four outcomes described above as the
dependent variables. These outcomes are explained with educational inputs, typically
provided by the government, related to teachers, schools and books. The inputs
considered are:
§ Ratio of teacher per pupil
§ Interaction terms between the ratio teacher/pupil and community/private
dummies, where public schools are the base category
§ The ratio of highly trained teachers (‘teachers with high formation’)74 to pupils
§ Interaction terms of the above ratio with community/private schools dummies
(public is the base category)
§ The number of maths books per pupil 74 This includes foreigners, IMAP, Magistério Primário, UEM-CFP 10th and 11th,UEM-CFP 7 and 9, UP-
Bacharel and UP-Licenciado.

185
Independent Evaluation of Budget Support to Mozambique, 2005 -2012
§ The number of pupils per classroom
§ The number of classrooms for each school, which indicates school size
§ The proportion of rooms constructed with bricks or cement
§ The proportion of rooms constructed with mud
§ The proportion of rooms constructed with maticado
§ Participation in the ADE (Apoio Direito as Escolas) program at district level: a direct support to schools programme targeted to poorer districts, funded through the FASE programme.
384. Different sets of these explanatory variables are included in the regressions, differentiating by grade and sex where relevant. Note that the number of Portuguese books is not included, although data would be available, due to multicollinearity with maths books.
385. As far as the econometric methods are concerned, the panel nature of the EMIS dataset allows using a fixed effects estimator that eliminates unobserved factors that vary across schools but not in time. This includes both school specific elements such as the ability of the director and the school’s culture and reputation, that are expected to change little in the relatively short time considered; and location specific effects. Because school fixed effects also capture location effects, the inclusion of district and provincial dummies is not required in this context. The fixed effects used in the regressions are taken at the most disaggregated level and they refer to grade-school combinations. In addition, year dummies are included in all regressions to take into account particular events that may have affected the education sector, in a given year.
Table 49: Results for absolute enrolment (1) (2) (3) VARIABLES Total Male Female Number of classrooms 0.035*** 0.032*** 0.047*** (0.001) (0.001) (0.001) Concrete or Brick 0.006 0.005 -0.000 (0.004) (0.004) (0.008) Maticado 0.006 0.009* -0.036*** (0.005) (0.005) (0.011) Mud 0.017*** 0.017*** 0.006 (0.004) (0.005) (0.010) Constant 0.818*** 0.832*** 0.770*** (0.005) (0.005) (0.011) Observations 351,160 351,045 348,858 R-squared 0.097 0.062 0.074 Number of id 41,317 41,299 41,029 Year FE Yes Yes Yes
Note: standard errors in parentheses; *** p<0.01, ** p<0.05, * p<0.1

186
Independent Evaluation of Budget Support to Mozambique, 2005 -2012
386. The first set of results investigates the absolute enrolment index (2004 = 1.00). Table
49 presents the results for all grades. The explanatory variables here are mainly related to
the school’s infrastructure, with the aim of identifying the inputs at the school level that
influence enrolment. The number of classrooms has a positive association with
enrolment in all specifications, which is clearly expected. A higher share of rooms
built with mud has a positive association with total enrolment, mainly driven by male
enrolment whereas it is not significant for females. This result may indicate that newer
classrooms are built with non-durable materials and they have therefore a high impact on
enrolment. The higher impact of new classrooms may be in rural areas that typically
present lower enrolment rates and a higher prevalence of non-durable construction
materials.
Table 50: Results for Progression Rates (1) (2) (3) (4) VARIABLES Total Male Female Total with ADE Teacher per Pupil 2.82*** 2.66*** 2.30*** 1.81*** (0.06) (0.07) (0.07) (0.04) Teacher per Pupil * Community -2.24*** -2.28*** -1.55*** -0.98*** (0.16) (0.18) (0.19) (0.10) Teacher per Pupil * Private -2.52*** -2.53*** -1.92*** -0.89*** (0.15) (0.18) (0.18) (0.09) Teacher High Education -0.40*** -0.42*** -0.31*** -0.43*** (0.08) (0.09) (0.09) (0.06) Teacher High Education * Community 0.16 0.28 -0.28 0.54*** (0.24) (0.28) (0.30) (0.18) Teacher High Education * Private 0.39** 0.51** 0.31 0.14 (0.19) (0.23) (0.23) (0.14) Class Size 0.01** 0.00 0.02*** 0.15*** (0.00) (0.00) (0.00) (0.00) Number of classrooms 0.00*** 0.00*** 0.00*** 0.01*** (0.00) (0.00) (0.00) (0.00) ADE District 0.00*** (0.00) Constant 0.77*** 0.78*** 0.73*** 0.73*** (0.00) (0.00) (0.00) (0.00) Observations 306,567 306,468 306,390 306,567 R-squared 0.018 0.015 0.009 0.096 Number of id 51,057 51,045 51,039 Year FE Yes Yes Yes Yes School-Class FE Yes Yes Yes No Class FE No No No Yes Province FE No No No Yes
Standard errors in parentheses, *** p<0.01, ** p<0.05, * p<0.1
387. Table 50 focuses on progression rates, namely the proportion of pupils that progress

187
Independent Evaluation of Budget Support to Mozambique, 2005 -2012
to the following year. The EMIS dataset however does not track individual pupils, but it
provides information about the number of pupils in each class. The underlying
assumption for the calculation of the progression indicator is therefore that pupils do not
change school. We recognize that this is a limitation, since pupils can move school in the
course of their studies but this should not affect the general pattern observed. The
progression rate is constrained to take a maximum value of 1 and it is calculated at the
school-class level to reduce measurement error.
388. In looking at progression, the analysis relates the dependent variable at time t with
independent variables at time (t – 1). The first year of primary education is therefore
excluded. School fixed effects and year dummies are included, and the results in Table 50
include all grades in both primary and secondary education. Because information on
books is only available for primary education, this variable is not included in this set of
results.
389. The teacher-to-pupil ratio is important in ensuring progression of pupils in all
specifications, although the effect is smaller for community and private schools.
More highly trained teachers often have a negative influence on progression, though this
does not apply in private schools. Higher training provides more effective teachers, but
this may be outweighed if they apply higher standards to decisions about pupil
progression. In specification (4) we re-run specification 1 with a dummy variable to
indicate whether the district where the school operates is an ADE district75. Results remain
the same, but the rate of highly trained teachers in community schools has now a positive
and significant effect. The positive result for class size in all regressions is rather
surprising. An explanation may be related to the higher pressure to make the pupils
progress in big classes that would become even bigger with a large number of
repetitions.
75 Since specifications 1- 3 are fixed effect estimations at school-class level, the introduction of a
dummy that is the same all years (province or ADE district) will be dropped from the estimation. In specification 4 we include province and class dummies in order to control for fixed effects at that level.

188
Independent Evaluation of Budget Support to Mozambique, 2005 -2012
Table 51: Results for Repetition (1) (2) (3) (4) VARIABLES Total Male Female Total with ADE Teacher per Pupil -0.05* -0.04 -0.07** -0.01 (0.027) (0.030) (0.033) (0.018) Teacher per Pupil * Community -0.32*** -0.33*** -0.31*** -0.44*** (0.064) (0.074) (0.081) (0.041) Teacher per Pupil * Private -0.03 -0.09 0.01 -0.41*** (0.061) (0.076) (0.074) (0.039) Teacher High Education 0.17*** 0.18*** 0.18*** 0.17*** (0.036) (0.040) (0.043) (0.030) Teacher High Education * Community 0.18** 0.17* 0.18 -0.10 (0.088) (0.101) (0.108) (0.070) Teacher High Education * Private -0.04 0.04 -0.08 0.02 (0.080) (0.097) (0.098) (0.060) Class Size -0.03*** -0.03*** -0.04*** -0.01*** (0.002) (0.002) (0.002) (0.001) Number of classrooms -0.00*** -0.00*** -0.00*** 0.00*** (0.000) (0.000) (0.000) (0.000) ADE District -0.00* (0.000) Constant 0.21*** 0.21*** 0.22*** 0.16*** (0.001) (0.001) (0.001) (0.001) Observations 462,668 462,431 461,272 462,668 R-squared 0.175 0.147 0.133 0.207 Number of id 68,708 68,680 68,637 Year FE Yes Yes Yes Yes School-Class FE Yes Yes Yes No Class FE No No No Yes Province FE No No No Yes
Standard errors in parentheses, *** p<0.01, ** p<0.05, * p<0.1
390. Repetition has slightly different results compared to those of progression. A higher
number of teachers per pupil is negatively associated with repetition in community
schools and for females in public schools, but not in fact in the private schools which few
pupils attend. But consistent with the progression results, more educated teachers are
associated with higher rates of repetition; again the higher level of training may cause
them to require higher standards to allow pupils to progress, especially in years with no
national examination (1-6 grades). If so this may be a positive quality indicator.
Repetition rates are smaller in larger classes (consistent with the same finding in the
progression equation) and where there are more rooms in the school. In this case
allowing for ADE districts makes insignificant the effect of teachers per pupil in public
schools, and makes no difference in the rest of explanatory variables, though the ADE
variable itself is significant.

189
Independent Evaluation of Budget Support to Mozambique, 2005 -2012
391. The key regressions of interest here are those that look at the rate of pupils
approved to proceed after grade 7 of primary school, i.e. those who are allowed to
enter secondary school. The results only refer to pupils in grade 7 and the fixed effects
are included at the school level. It is useful to report that approval rates are very high in
Mozambique (80 % for boys and 79 % for girls.) Therefore the marginal effect of the
independent variables can be expected to be relatively small.
Table 52: Results for approval into Secondary School (1) (2) (3) (4) VARIABLES Total Male Female Total with ADE Teacher per Pupil 0.62** 0.43 1.12*** 0.62*** (0.245) (0.275) (0.337) (0.161) Teacher per Pupil * Community -2.19*** -0.40 -2.90*** -0.45* (0.615) (0.902) (0.828) (0.268) Teacher per Pupil * Private 0.20 0.03 0.43 0.70* (0.967) (1.088) (1.300) (0.382) Teacher High Education -0.69** -0.56* -1.31*** -0.64*** (0.274) (0.308) (0.380) (0.220) Teacher High Education * Community -0.35 -4.42*** 0.92 1.01** (0.908) (1.282) (1.222) (0.476) Teacher High Education * Private 0.80 0.70 0.84 0.35 (1.101) (1.238) (1.480) (0.573) Math Books 0.01 0.01* 0.00 0.02*** (0.005) (0.006) (0.007) (0.004) Class Size -0.05*** -0.05*** -0.04 -0.13*** (0.017) (0.019) (0.023) (0.010) Number of classrooms -0.00 -0.00* -0.00 -0.00*** (0.001) (0.001) (0.001) (0.000) ADE District -0.01** (0.003) Constant 0.86*** 0.87*** 0.84*** 0.92*** (0.010) (0.011) (0.013) (0.007) Observations 10,035 10,026 9,979 10,035 R-squared 0.110 0.087 0.074 0.131 Number of id 3,384 3,381 3,375 Year FE Yes Yes Yes Yes School-Class FE Yes Yes Yes No Class FE No No No Yes Province FE No No No Yes
Standard errors in parentheses, *** p<0.01, ** p<0.05, * p<0.1
392. Table 52 shows that the number of teachers per pupil has a positive effect on the outcome of interest for the case of females only or in the specification including the ADE district dummy. A higher teacher to pupil ratio helps in following pupils more closely and therefore facilitating their approval to proceed to the next level of education. The same variable, however, has a negative effect in community schools. But the most striking result in this model is that the higher education of teachers seems to have a negative effect on approval, and this is significant and quantitatively important in all models. The result may be explained by higher standards under highly qualified teacher that may tend

190
Independent Evaluation of Budget Support to Mozambique, 2005 -2012
to be stricter with pupils therefore making it more difficult for them to be approved at the end of grade 776. Class size has the expected negative and significant coefficient in most specifications, consistent with the result on teacher-to-pupil ratio. Since this is a primary education model, we could include the books (maths) per pupil variable. This variable has a positive association with the outcome for males and in the model controlling for ADE districts. In addition, approval rates are lower in ADE districts.
7.3. Conclusions: key determinants of education outcomes
393. This report presents an analysis of the education sector based on different data sources, namely EMIS and national household budget surveys, and methods, including descriptive and econometric analysis. In terms of progress over the evaluation period, the results point to great improvements in education particularly related to the increase of enrolment rates for both boys and girls.
394. As far as educational inputs are concerned, the econometric analysis pointed to the importance of the teacher-to-pupil ratio for both approval in 7th grade and progression. In this respect, it shows clearly that the increased public spending on teacher recruitment and salaries, as well as on classroom and school construction has been a determinant factor in the outcomes recorded.
395. The increase in the level of training of teachers is a welcome development, though this also seems to be associated with higher repetition rates and lower approval in grade 7. This may be due to higher standards applied by qualified teachers or to inadequate training, rather than to the limited role of higher qualifications in improving outcomes in education. It does not suggest to us that it is an inappropriate investment, rather that it should be supported by additional inputs targeted on those schools with higher repetition rates and lower approval in grade 7.
396. Smaller class sizes are positively associated with approval into secondary school, but are also positively associated with repetition, perhaps because there is a tendency to ‘avoid repetition at all costs’ in over-crowded schools with large class sizes. Again, it suggests a need for a cluster of inputs targeted to the schools with the larger class sizes.
397. The availability of maths books is significantly associated with higher approval rates in some specifications. This would suggest that there are only certain contexts (in terms of pupil-teacher ratios, levels of training of teachers, etc.) in which increased availability of text books is likely to make a positive difference. Further analysis could assist in identifying “threshold levels” (minimum requirements) for these essential complementary inputs.
398. Despite this positive progress achieved throughout the sector, much remains to be done to achieve the MDG of having all boys and girls in primary education. Moreover, enrolment rates in secondary education remain low, despite massive increases
76 There could be other factors. Higher qualified teachers will work in the more urban schools, where
also school inspection would be more a reality than remote rural schools

191
Independent Evaluation of Budget Support to Mozambique, 2005 -2012
in the last 15 years, and the widening gender gap at this level is particularly worrying. All this points to the need to keep a high priority on the education sector and to continue the efforts carried out in the evaluation period.
399. On the positive side, our evidence suggests that the combination of educational inputs on which public spending has been concentrated, notably teachers, teacher training and classroom construction is efficient and effective. Moreover, these inputs have been allocated relatively efficiently both geographically and by gender. In some cases, notably for the schools with the larger classroom sizes, it would seem that more attention is needed to provide the right combination of additional inputs. Further econometric analysis, supported by qualitative work in schools may assist in determining the precise parameters of these optimal combinations and in understanding how they may vary by type of school and geographical location.

192
Independent Evaluation of Budget Support to Mozambique, 2005 -2012
8. Conclusions and Recommendations
8.1. Overall findings
400. This study has evaluated all of the Budget Support operations undertaken in
Mozambique from 2005 to 2012. These operations amount to a resource transfer of US $
3,354 million - an annual average disbursement in excess of US $ 400 million, some $16
per annum per head of the Mozambican population, provided by 19 Development
Partners (the “G-19” or Programme Aid Partners”). In evaluating these operations, our
study has addressed three questions:
i. How successful has Budget Support been in providing the means to the
Government of Mozambique to implement its national and sectoral
strategies? (EQ. 1.1-2.3)
ii. How successful has Budget Support been in facilitating improvements in the
efficiency and effectiveness of these national and sectoral strategies? (EQ. 3.1
– 3.4)
iii. As a consequence, how successful has Budget Support been in attaining
successful outcomes and impacts on growth and poverty reduction? (EQ. 4.1
& 4.2.)
Providing the means to implement Government policy (EQ.1.1 - 2.3)
401. In relation to financial inputs, Budget Support inputs have been important and
efficiently delivered. Disbursements during the 8-year evaluation period were
substantial both in fiscal terms – where they represented on average 15 % of public
spending, and as a proportion of total ODA, where they comprised an average of 30 %.
402. Annual predictability of budget support has been significantly better compared
with the two other aid modalities. Actual disbursements of Budget Support have
generally been close to 100% of the planned disbursements, averaging 116% over the 8-
year period since 2004. This compares with projects, which averaged disbursements of
56% of projections with a considerable variance around this mean. Basket fund
disbursements were more stable, but also averaged significantly below Budget Support as
a percentage of projections. (79% versus 116%),

193
Independent Evaluation of Budget Support to Mozambique, 2005 -2012
403. The objectives of in-year predictability and of “front-loading” of disbursements were largely fulfilled during the evaluation period. Budget Support providers were clearly conscious of the importance of these objectives and managed to maintain good levels of predictability even through a period of difficult financial circumstances in many donor countries.. Over 2008 – 2012, an average 60-80 % of BS funds were disbursed in the first two quarters (i.e”front-loaded”). From 2005 to 2009, the gap between quarterly projections and actual disbursements was close to zero. In-year predictability was compromised in 2010, 2011 and 2012 due to suspensions resulting from concerns over potential violations of underlying principles, although the financial costs of these temporary suspensions were not substantial.
404. Budget Support is no longer exerting a significant influence on the overall effectiveness of aid. In the early years of the evaluation period and in the years immediately preceding it, the Budget Support process was instrumental in generating support for aid effectiveness principles. A key aspect of this was the commitment by the Programme Aid Partners to monitor their own performance through the PAPs’ Performance Assessment Framework. This was widely heralded as major step towards mutual accountability and highly valued by the Government of Mozambique. However, since 2009, performance against these indicators has plummeted. A firm renewal of the commitment to these objectives and a re-investment by the Government of Mozambique and its Development Partners in the aid effectiveness principles, will be required for performance to improve again.
405. Regarding the use of country systems, the importance of Budget Support within total ODA has decreased during the evaluation period (from 30% to 20%). Moreover, there is no evidence of a lasting influence of Budget Support on other modalities concerning the use of the national budget and/or the single treasury account (CUT). The proportion of projects that were executed off-CUT averaged 85% during the period 2009-2012. Common Basket Funds have made more use of country systems but there is no evidence that this has been influenced by Budget Support.
406. By 2005, Mozambique had established a structured, harmonised assessment and disbursement process for Budget Support, linked directly to the achievement of the targets in the national poverty reduction strategy. This system - centred around two Performance Assessment Frameworks (PAFs) one for Government and one for the Programme Aid Partners (PAPs) - has been preserved. An integrated annual review calendar has been established, clearly linked to a network of sectoral and thematic policy processes. The proceedings of the annual review process are open to a wide range of stakeholders, their results are published and are the subject of press releases.
407. Since 2011, the transaction costs of the dialogue process have increased largely due to changes to the framework introduced to fit with the newly issued PARP, which adopted a more cross-cutting, thematic structure. Whilst the rationale for the new dialogue structure is clear, its introduction has met with “teething problems”: some simplification is needed, in addition to further guidance on how it is expected to work.
408. The Government PAF fulfils its intended purpose reasonably effectively and compares well with the PAFs used in other Budget Support recipient countries. It

194
Independent Evaluation of Budget Support to Mozambique, 2005 -2012
provides a relatively strategic set of measureable targets, which have worked as a focus for dialogue. The number of targets is broadly appropriate and the process of assessment does not entail excessive transaction costs.
409. However, the PAF has inherent limitations, and requires complementary frameworks in order to work effectively: these complementary dialogue frameworks are in need of further development. Like all indicator-based assessments of performance, the PAF has three disadvantages: i) it focuses exclusively on what is measureable, which is not always what is important; ii) it runs a continuous risk of generating perverse incentives by converting performance indicators into policy targets, to which money and prestige is attached; and iii) it relies on pre-existing processes of research and policy development in order to generate meaningful policy targets. Given these inherent limitations, the PAF should therefore be neither the sole method of assessment nor the sole locus of dialogue. In Mozambique, alternative frameworks have been utilised on an ad hoc basis – such as the matrices of policy actions developed as ‘areas for special attention’. These have presented a relevant, pragmatic response to the problem but do not constitute a sustainable longer term solution.
410. Our assessment of the policy dialogue process suggests that the main structural weakness lies precisely within the policy development process, which should be situated at the sector and thematic level. There are several problems of strategic importance to the PARP agenda – such as low productivity in agriculture, high levels of malnutrition, a poor enabling environment for doing business - where effective policy responses have not been generated. GBS has had only a limited influence on policy development processes at this level, for four principal reasons:
§ The underlying capacity constraints from which Mozambique suffers mean that policy analysis and development skills have been at a premium.
§ Sector level processes have their own history and their own dynamics, on which
the influence of the central level GBS PAF has proven to be modest. Where the
sector dynamics have been good, such as in the case of education, the GBS
dialogue has helped to sharpen the strategic focus and to raise awareness of
sector level issues; where the sector dynamics have been less favourable, such as
in agriculture, the GBS process has proven incapable of exerting a positive
influence.
§ The disinvestment in the Budget Support process, reported to have afflicted both
the DPs and Government, has reduced the administrative attention and analytical
effort, which might be harnessed to address sector level policy problems.
§ DP stakeholders asserted that there had been a decline in the quality of
coordination within the G-19, and a consequent decline in the ability of the G-19
to develop well-researched and coherently defined policy positions and to
harness analytical resources for the common good.

195
Independent Evaluation of Budget Support to Mozambique, 2005 -2012
411. The inputs provided by the four common funds supporting PFM & Governance
functions, alongside funding lines linked more directly to Budget Support
operations, amounted to a significant TA/ capacity-building input within the Budget
Support package. Due to the multitude of these arrangements and the range of funding
lines through which they have been provided, it has not been possible to reach a
judgement about their efficiency and effectiveness. However, Government stakeholders
were positive in their appreciation of these inputs, both with regard to their relevance and
the relative efficiency with which they were provided.
412. Moreover, there is evidence that the TA/ Capacity-building provided by these
common funds generated important outputs, which facilitated the production of
the “induced outputs” targeted by Budget Support. This has been most notable with
regard to PFM reforms and the strengthening of the capacities of the Autoridade
Tributária de Moçambique (ATM), the Tribunal Administrativo and the Inspeção Geral de
Finanças.
Facilitating improvements in Government policies (EQ 3.1-3.5)
413. During the evaluation period, there has been a strong performance by the
Mozambican authorities in fiscal and macroeconomic management:
§ Revenue mobilisation has increased by nearly 10 points of GDP, out-performing
Tanzania and Uganda and narrowing the gap with Kenya.
§ Total spending has increased by more than 9 points of GDP as a consequence of
both expanded recurrent and capital expenditure.
§ Domestically financed development expenditure has almost doubled from 3.2 %
of GDP in 2005 to 6.1 % in 2012.
§ The overall deficit before grants increased to nearly 15 % of GDP in 2009 due to
the global financial crisis, but fell to less than 10 % of GDP in 2012, a more
sustainable level.
§ Although inflation fluctuated at 10-12 % up to 2011, restrictive monetary policy
brought it to 2.2 per cent in 2012, the lowest in the SADC region.
414. Budget Support funding contributed significantly to these achievements,
without introducing substantive negative side effects. It is unlikely that the growth of
domestically financed capital expenditure could have been achieved in the absence of

196
Independent Evaluation of Budget Support to Mozambique, 2005 -2012
budget support, without recourse to unsustainable levels of borrowing. However,
macroeconomic and fiscal policies have been driven by the Government’s own objectives
and its PSI agreements with the IMF. There is no evidence that the Budget Support
process had more than a supportive effect in this area.
415. Stakeholders report that monitoring progress on the EITI initiative through the
PAF helped to add momentum to the process and thus contributed to the country
achieving compliance. There has been a significant amount of work undertaken by the
G19 task force on Extractive Industries, which was used for political dialogue with the
Government. There was also a PAF indicator from 2010 onwards, monitoring progress on
the EITI initiative.
416. There is a risk on the horizon concerning the expansion of commercial external
borrowing for capital investment, taking advantage of the favourable long term
outlook due to revenues from the extractive industry. High commercial interest rates and
demanding principal repayment schedules may result in debt obligations being “front-
loaded” relative to revenue flows. Public investment projects also need to be planned
carefully to ensure that they meet policy priorities and are executed efficiently.
417. Significant improvements have been made in Public Finance Management:
§ A coherent programme of PFM reform has been in place throughout the
evaluation period, to which the Government has shown a clear commitment;
§ The GoM has achieved important progress in setting up a modern PFM system
based upon a functioning IFMIS system.
§ The PEFA assessments of 2006, 2008 and 2010 attest to improvements across all
aspects of the PFM system and in particular with regard to comprehensiveness &
transparency, revenue collection and management, cash management and
internal and external audit.
418. Without doubt, the central place of PFM in the GBS dialogue has had a positive
impact on the pace and content of reform. Also important have been the technical
assistance and direct financial support provided through the 4 common funds.
419. Nevertheless, there are major challenges ahead and it is not clear that an
adequate framework exists to address these challenges:
§ The 2011 – 2015 PFM Vision presents an ambitious reform programme but
exhibits weaknesses regarding the sequencing of reform and the scope of

197
Independent Evaluation of Budget Support to Mozambique, 2005 -2012
reforms: more attention should be dedicated to the monitoring of fiscal risks,
within a “whole of government” perspective.
§ In relation to the coordination of reforms, problems remain over the adoption
of CEDSIF as the reform coordinator: the coordinator of reforms should ideally
have a wider perspective on PFM issues and a higher status, in order to exert
authority.
§ Regarding the advice and support available through dialogue with the G-19,
there is a question mark over the ability to marshal adequate technical expertise
to give guidance on reform sequencing and other increasingly technical issues
now emerging.
420. Total spending on the priority sectors designated in PARPA & PARP has more
than quadrupled in nominal Meticais terms over the evaluation period, increasing by
slightly more than 7 percentage points of GDP. As a percentage of total expenditure,
these priority sectors have increased their share from 61 % to just over 67 % of total
spending.
421. The major contribution of GBS funding has been to support the expansion of
public spending in the education and good governance sectors, alongside a lesser
contribution to the agriculture sector. We draw this conclusion from an analysis of trends
in funding sources and sector expenditure shares, making assumptions that reflect the
processes of budgetary negotiation and decision-making in Mozambique.
422. There is strong evidence that the combination of GBS funding through the
budget with targeted support to institutions of accountability such as the NAO, the
Parliament, CSOs and the media has created more transparency. Targeted support
through common funds has been fundamental to this achievement but Good Governance
is one of two sectors that appear as the primary beneficiaries of Budget Support funds.
423. Although there remain concerns about the quality of transparency and accountability
in Mozambique, over the period of the evaluation there is evidence of improvement:
§ The public availability of budgetary documents improved as measured by its
score on the Open Budget Index (OBI) which increased from 28 % in 2010 to 47 %
in 2012.

198
Independent Evaluation of Budget Support to Mozambique, 2005 -2012
§ There has been a sharp improvement in the number and the quality of audit
reports of the Tribunal Administrativo from 29 audits in 2004 to over 400 per year
since 2009.
§ CSOs and the media have become more active on corruption issues and in
reporting on budgetary and financial management questions.
424. The legal and institutional framework for combating corruption has been
strengthened during the evaluation period:
§ In 2004, Parliament approved Mozambique’s first Anti-corruption Law (Law nº
6/2004).
§ In 2005 the Public Procurement Law was passed and then subsequently refined in
2010 through Decree 15/2010.
§ As part of the Governance Action Plan, a package of 5 anti-corruption laws was
submitted to Parliament during 2010, with 3 of these 5 laws being passed in 2012.
§ Measures have been taken, since 2010, to strengthen the budget and the staffing
of the Central Office for Combating Corrupting – Gabinete Central de Combate a
Corrupção (GCCC).
425. However, there are concerns over the extent to which anti-corruption legislation
is being implemented. A higher number of corruption cases has been taken up by the
GCCC and a bigger proportion of these have been taken to court but there are
widespread concerns over the politicisation of the judicial process. As a result, there is
little confidence among CSOs or the general public that the selection of cases for
investigation and prosecution is genuinely impartial and evidence-driven.
426. There is evidence that the high level debate between Government and the G-19
at the time of the “crispação” was influential in focusing attention and speeding up
the implementation of actions included in the Governance Action Plan (GAP).
Government stakeholders asserted that all of the issues included within the GAP were
already under internal discussion and would have been implemented in time but they
agreed with DPs that the high-level attention to these issues helped to speed up their
implementation.
199
Independent Evaluation of Budget Support to Mozambique, 2005 -2012
Attaining sustainable outcomes and impacts (EQ. 4.1 and 4.2)
427. GDP growth remained high throughout the evaluation period, averaging 7.3 per
cent annual growth. Moreover, the pattern of growth remained stable throughout the
period despite the global financial crisis.
428. Budget Support funds have enabled the government to increase development
spending without recourse to domestic borrowing. This has helped to keep gross
domestic investment buoyant (at 19-20 % of GDP) up until 2011 when large FDI inflows
linked to the extractive industry then kicked in. Budget Support facilitated an expansion in
domestically financed development spending from 3.2 % of GDP in 2005 to 6.1 % in 2012.
By avoiding recourse to borrowing, the Government also restrained its demands on the
domestic banking sector and facilitated the increase in the ratio of private sector credit to
GDP.
429. Mozambique has made efforts to improve the investment climate but still ranks
low on international indicators of economic competitiveness and the business
environment. Dialogue in this area has largely failed to achieve any acceleration in
progress.
430. There has been no statistically significant change in poverty between the early
and the late 2000s, with 54.1% of the population reported below the poverty line in 2003
and 54.7% in 2009, according to the official poverty figures, presented in the Third
National Poverty Assessment. Therefore, there seem to be a missing link between growth
and income poverty reduction. While the country experienced high and sustained growth
rates, the poverty reduction performance was disappointing. Indeed the analysis of pro-
poor growth shows that at the national level the poor have benefited less from growth
than the non-poor.
431. In part, this may be attributed to the pattern of public spending, which had largely
favoured the education and heath sectors – investments which might support poverty
reduction in the long term but which would not have a positive short-term effect on
household consumption. In part, it may be attributed to the slow progress in improving
the business environment, which would have hindered the growth of small and medium-
scale enterprises; and, in part, to the failure to generate improvements in the productivity
of small and medium farmers in the agriculture sector.

200
Independent Evaluation of Budget Support to Mozambique, 2005 -2012
432. The sectoral analysis of GDP shows that many sectors experienced good growth,
including agriculture. This sector is particularly important in the context of a highly rural
population (estimated at 70%) and given its large contribution to GDP (39 % in 2011).
However agricultural growth, that was faster in the evaluation period than before, failed
to benefit the poor.
433. There is a very strong and very large association between the use of fertilizer
and pesticides and productivity. Access to inputs seems to be critical to raising
productivity and the large majority of farmers fail to get access to these inputs or to the
credit needed to finance their purchase. This would seem to be a major factor behind
their poverty.
434. GBS dialogue had little impact on the development of policies to improve access
to inputs and credit within the evaluation period, despite the fact that agriculture and
rural development were prominent in the PAF. There are, however, indications that the
increased level of public spending in the sector since 2010 has in part been facilitated by
GBS.
435. Non-income measures of poverty have shown some improvements:
§ From 2005 to 2012, Mozambique’s Human Development Index increased from
0.287 to 0.327. (HDR, 2013).
§ Indicators of malnutrition have improved moderately, while still remaining very
high by international and regional standards.
§ The 2008/09 Household Budget Survey showed improvements in some
indications of welfare, and most especially in education provision.
436. Education was designated as a ‘priority sector’ in PARPA/ PARP and has throughout
the evaluation period commanded the highest share of the national budget. Combined
with some signficant policy changes introduced in 2004 (such as abolition of school fees,),
this has permitted dramatic improvements in education provision:
§ The net enrolment rate at the primary level in 2008/09 was 75.7%, markedly
higher than the corresponding rates in 1996/97 (42.4%) and 2002/2003 (65.9%).
41 % more children were in school in 2012 in comparison with 2004.
§ The largest gains in the observed increase in enrolment were for poorer
households. (Fox et al., 2012)

201
Independent Evaluation of Budget Support to Mozambique, 2005 -2012
§ 17.3% of children of the relevant age group were in secondary education in
2008/09, compared with a rate of 3.1% in 1996/97 and 6.1% in 2002/03. Pupil
numbers were 65 % higher in 2012 as compared with 2004.
§ In terms of provincial trends, progress was made across all provinces both in
primary and secondary enrolment.
§ The primary enrolment rate for boys in 2008/9 was only 4% higher than for girls,
indicating a small and gradually reducing gender gap at this level of schooling.
§ At secondary level the gender gap is much larger, at 40%, indicating a problem
related to girls staying in school rather than entering the system in the first place.
437. Econometric analysis pointed to the importance of the teacher-to-pupil ratio for
both approval in 7th grade and progression. In this respect, it shows clearly that the
increased public spending on teacher recruitment and salaries, as well as on classroom
and school construction has been a determinant factor in the outcomes recorded.
Moreover, evidence suggests that these inputs have been allocated relatively equitably
geographically and by gender.
438. Funding through Budget Support has played a key role in funding the expansion
of the education sector. The expanded levels of provision could not have been financed
in the absence of General Budget Support, which facilitated the expansion of the teachers’
wage bill and of internally financed investment in school construction, while FASE
common basket funding and projects were dedicated to school construction, teacher
training and supporting inputs. The policy framework for the fast expansion of public
education was developed primarily through FASE structures, although the GBS framework
helped to generate support at the centre of government, most notably from the Ministry
of Finance.
8.2. Step Three: Conclusions on Impact of Budget Support
439. What do the findings from Step One and Step Two tell us about the overall impact of
Budget support over the evaluation period? In order to address this question, we have
constructed a matrix (Figure 37) with the following elements:
§ It presents on the right-hand side the targeted outcomes and impacts - growth,
reductions in income and non-income poverty and improved education sector
provision.

202
Independent Evaluation of Budget Support to Mozambique, 2005 -2012
§ In the middle column, it identifies the changes in public policies and
expenditures, induced by Budget Support, which might have exerted a positive
influence on final outcomes and impacts.
§ In the left-hand column, it identifies the inputs and immediate effects of Budget
Support.
§ In the two connecting columns it identifies the relative degree of influence, which
the evaluation team have identified, defining this as (i) Absent or Negligible; (ii)
Weak; (iii) Moderately Important; and (iv) Important.
440. A simplified diagrammatic overview of our Step Three analysis is presented in Figure
38. This should be read together with the matrix in Figure 37 so as to understand the lines
of causality identified.

203
Independent Evaluation of Budget Support to Mozambique, 2005 -2012
Figu
re 3
7: S
tep
Thre
e –
Sum
mar
y of
ana
lysi
s of
agg
rega
te im
pact
of B
udge
t Su
ppor
t in
Moz
ambi
que

204
Independent Evaluation of Budget Support to Mozambique, 2005 -2012
Figu
re 3
8: D
iagr
amm
atic
Ove
rvie
w o
f Bud
get
Supp
ort
impa
cts
and
tran
smis
sion
mec
hani
sms
in M
ozam
biqu
e

205
Independent Evaluation of Budget Support to Mozambique, 2005 -2012
Summary of Step Three Analysis: The Impact of Budget Support in Mozambique
441. The primary contribution of Budget support has been in the form of increased funding. This was provided in a manner which was both more predictable and lower in transaction costs than other modalities.
442. The potential wider effects of Budget Support on aid effectiveness have not been evident within the evaluation period, although it is possible that use of country systems and harmonisation and alignment would have been lower in its absence. Our judgement is that these effects were strong in the years shortly before the evaluation period but that there has been no further increment in the use of government systems during the period evaluated.
443. Budget Support inputs for technical assistance and capacity building have been significant in scale. These were provided primarily through common basket funds linked to PFM reform and to the strengthing of the governance institutions. We judge that these inputs had a moderately important influence on improved PFM processes and a weak influence on improved democratic accountability.
444. Budget Support has supported the creation of an effective structure for dialogue, based upon the definition of policy targets and a framework of annual monitoring, comprising sector reviews and a national level policy dialogue, as well as periodic assessments of underlying principles. Nevertheless, the influence of this framework has been limited by underlying weaknesses in sectoral processes of policy analysis and development – a weakness which GBS processes could only mitigate to a modest extent.
445. Through its funding contribution, Budget Support had an important influence on macroeconomic management and on the increased allocation of resources to PARPA/ PARP priority sectors. The fact that PFM reform and improvements in governance, especially the fight against corruption, were systematically discussed and reviewed on an annual basis through the Budget Support dialogue is also likely to have been moderately important to the continued progress made in these areas.
446. Good macroeconomic management, combined with increased allocations to the priority sectors allowed Budget Support to have an important influence on overall growth and on the dramatically improved outcomes in the education sector. Even if the desired reductions in poverty did not occur, these are major achievements, which fully justify the provision of Budget Support.
Could other modalities support scaling up of service delivery as effectively as Budget Support?
447. Neither project funding nor common basket funding could have achieved the
same results as Budget Support, with the same degree of efficiency, effectiveness
and sustainability:

206
Independent Evaluation of Budget Support to Mozambique, 2005 -2012
§ The funding provided through GBS of US $ 400 million per annum would have been equivalent to about 100 additional project and CBF operations, disbursing an average of $4 million each per annum. These additional transaction costs would almost certainly have been prohibitive, given existing constraints on absorptive capacity.
§ It would have been difficult for GoM to utilise such operations to finance recruitment of additional teachers or to provide non-salary recurrent cost funding.
§ With the average levels of predictability of disbursements from projects (56%) and of CBF operations (79%) achieved during the evaluation period, there would need to have been a systematic over-programming of some 40 %, and even with such adjustments the annual volatility of disbursements would have proven problematic.
§ The sustainability of this incremental funding would have been difficult to ensure, whereas Budget Support funding is gradually being replaced with domestic revenue, using the same planning and budgeting procedures and hence ensuring sustainability.
§ Finally, while we have concluded that the influence of Budget Support policy dialogue has been relatively modest, it has served to generate certain improvements in the design and implementation of policies and strategies, which could not have been generated by the more limited spaces for dialogue offered by project and CBF arrangements.
448. The analysis of common basket funding (CBF) mechanisms has not formed a major part of the terms of reference for this evaluation but the prominence of the PROAGRI, FASE and PROSAUDE mechanisms in agriculture, education and health has permitted at least some analysis of these three mechanisms. The contrasting performance of the three is quite revealing.
449. A central tenet of good public finance is that there should always exist an effective “budget challenge function”, which is normally provided by the Ministry of Finance and/or the Ministry of Planning. This “budget challenge” requires all sectoral proposals for spending to be assessed at the centre against competing demands from other sectors, against national policy priorities and against the prevailing rules of financial and personnel management. In the absence of this challenge from the centre, sectoral agencies will tend to assign themselves larger budgets than necessary and to spend them less on service delivery functions and more on sectoral administration functions and processes, from which they directly benefit.
450. A common weakness in many CBF mechanisms is that they inadvertently by-pass the budget challenge function by excluding the Ministry of Finance and other central agencies from the process of scrutinising proposals for spending from the sectoral basket fund. In many CBFs, sector ministries submit proposals directly to sector donors, without the involvement of the Ministry of Finance. Sector donors may sometimes be able to apply an adequate budget challenge function but there are often conflicts of interest

207
Independent Evaluation of Budget Support to Mozambique, 2005 -2012
which prevent this: notably, sector donors share the objective of sector ministries to increase the sectoral budget and will tend to put a lower valuation on the budget demands of other sectors.
Box 3: Why PROSAUDE is not SBS and how GBS/ SBS could be diferent In the last decade health sector fragmentation has been aggravated in Mozambique by the presence of multiple donors and the onset of vertical funds, which now dominate in the sector. Sector stakeholders responded to this fragmentation by developing a sector SWAp in the 1990s followed by the establishment of three common funds and then in 2009 their amalgamation into one – PROSAUDE II. The intention of the health partners involved was to transition to SBS, but in spite of this, PROSAUDE II has not moved beyond the original arrangement. PROSAUDE II is on-budget, and on-Treasury, using a dedicated account in the CUT, but it is a project account, effectively controlled by MISAU and overseen by the PROSAUDE partners. The funds are not budgeted through standard government procedures and hence not subject to the budget contest, which that process incorporates. There is no procedural manual, although a broadly based budget is drawn up for PROSAUDE II spending. It is not controlled or monitored according to government procedures, and there are no written rules governing budget revisions, virements etc. PROSAUDE II funds are often spent on items which cannot be covered by the OE such as salary top-ups, salaries of new employees pending registration on e-CAF, per diems and other personnel items, which would normally be met by GoM. In this respect they circumvent, rather than follow, government procedures. This is done with good intent, and in recognition of the serious shortage of human resources in the health sector. Nonetheless, the process has created a perverse incentive, removing the urgency to reform health sector salary scales and bureaucratic recruitment procedures. PROSAUDE II has not made the transition to SBS for several reasons: first because there has not been a consensus amongst PROSAUDE signatories, in favour of SBS (partly a result of the documented and persistent limitations of GoM financial systems, and the difficulty in obtaining reliable audits); second, with the growth of vertical funds, PROSAUDE II financial leverage became less (averaging around 20% of the Health Budget in recent years but a lower proportion of total resources for health); and third, MISAU does not favour SBS because it values the flexibility of using PROSAUDE II funds to cover expenses that cannot be paid from OE. GBS would be different because funds would flow through the OE and would not be dedicated to any particular sector or purpose. National accounting systems, including Treasury budget monitoring systems, would apply, and there would be no opportunity for MISAU to circumvent regulations, for instance in hiring staff without TA approval. Flexibility would in that sense, be reduced. How would SBS be different? Funds would flow to an account controlled by MoF (not MISAU) and would be used to enhance the OE ceilings of beneficiary health agencies. They would be budgeted in concert with OE funds. Like GBS, SBS funds would form part of a single budget governed according to standard budget monitoring, review and audit arrangements. The outcome of both SBS and GBS would be lower transaction costs, greater transparency, and the ending of the perverse incentives described above. 451. In Mozambique, the PROAGRI and PROSAUDE basket funds clearly suffered from the
lack of a budget challenge. As a result, in both cases a disproportionate share of the CBF was dedicated, not to service delivery functions, but to expenditures on sectoral administration processes at the headquarters level, including workshop processes and

208
Independent Evaluation of Budget Support to Mozambique, 2005 -2012
institutional development expenditures. In both these cases, CBF funds were also used to finance staff salaries, often in contravention of public service rules, and without serious examination of the sustainability of financing salaries from external funds. In the case of PROSAUDE, over 5,000 heath staff are financed through the common fund, although initiatives are now being taken to bring these staff onto the government payroll.
452. In the case of FASE, - perhaps because the scale of funding required was too great to permit a “go it alone mentality” to develop in the sector, perhaps because the DPs involved had more rigorous processes for assessing the sustainability of spending plans – there was a greater consciousness of the need to use the FASE common fund as a complement to GoM funding through the budget. Thus, teacher salaries were never financed through FASE and it was always understood that the Direct Support to Schools (ADE) grants would need to be transferred to the Budget over time.
453. Notwithstanding the success of FASE, we would contend that most large-scale Common Basket Funds are likely to generate the sort of perverse incentives, which have been prominent in PROAGRI and PROSAUDE. (See Box 3). For these reasons, General or Sector Budget Support is likely to be a less distortionary and more sustainable method of providing external support to scale up service delivery and poverty-reducing spending. The case of GBS in Mozambique provides an excellent example of how these processes may work, even in quite difficult environments.
8.3. Recommendations
454. Our overall conclusion is that Budget Support has been fundamentally successful. It has made possible a major expansion in education provision, whilst supporting economic growth and macroeconomic stability and facilitating steady improvements in the quality of public financial management and, to a lesser extent, in governance.. These are major achievements, which fully justify the risks that have been taken in providing Budget Support. These are still more impressive if one considers the relatively difficult context for Budget Support, which has prevailed in Mozambique over the evaluation period.
455. The challenge for Mozambique and its Development Partners is to find ways of achieving more with Budget Support in the future – in particular to find ways of making a greater impact on poverty. With this as the overarching goal, we make a set of recommendations for the joint consideration of the Mozambican authorities and its Development Partners. These recommendations need further refinement and development, based on inputs from the stakeholders on the ground. Their implementation will therefore require a shared dialogue between the Mozambican Authorities and the G-19, in which analysis and ideas are exchanged and a set of concrete actions is agreed and implemented, aimed at increasing the effectiveness and impact of Budget Support in Mozambique.
456. We recommend that this dialogue, and the resulting action plan, should be clustered around four objectives:
209
Independent Evaluation of Budget Support to Mozambique, 2005 -2012
§ Renewing the commitment to the Budget Support process and the related aid effectiveness agenda based upon realistic expectations not only of what it may achieve but also of the investment of time and effort, which is required to make it work.
§ Revitalising the Budget Support policy dialogue process, establishing a more streamlined central process for assessing and reviewing performance, and creating a stronger framework for sectoral policy analysis and dialogue, aimed at stimulating good policy ideas and actions in the areas where they are currently lacking.
§ Consolidating the progress achieved in education, in macroeconomic management, in PFM reform and in the improvement of transparency and accountability.
§ Focussing attention on poverty reduction through targeted programmes to reduce the incidence of childhood malnutrition, increase the access of small farmers to fertiliser and other inputs, and to create a conducive climate for business and employment growth.
Renewing the commitment to the Budget Support process
457. Within this objective, the basic goal would be to first stop and then reverse the disinvestment in the Budget Support process, identified by so many stakeholders in Mozambique. “Half-hearted Budget Support” is not sustainable and should not be allowed to continue. Among the G-19, those agencies unable or unwilling to invest in a full commitment to Budget Support – for whatever reason – need to withdraw from the process. Within the Government of Mozambique, there also needs to be a firm decision about whether Budget Support is really wanted or not. A potential way forward to obtain a renewal of the political commitment to Budget Support by the GoM and the G-19 members would be a structured campaign at the technical level by the GoM and the G-19 to present a more realistic message to their political leaders and supporting constituencies about what Budget Support can and cannot achieve.
458. An obvious problem in the past has been that the expectations held for Budget Support have been unrealistically high. Many DPs – in particular at headquarters level – expect to be able to use Budget Support to exert “policy leverage” over partner governments so as to change the governance context and achieve fast improvements in PFM and other reforms. This has not happened in Mozambique nor in any other Budget Support recipient countries. What Budget Support can do is firstly to provide funding for areas, which are clear shared priorities and where tried and tested service delivery strategies exist – such as expansion of education coverage and quality – and secondly to support and guide those institutional reforms for which there is a government commitment.
459. A clear awareness also needs to be created regarding the commitments which Budget Support entails both for GoM – in terms of transparency, exchange of information, an openness to dialogue – and for the G-19 – in terms of a commitment to predictable

210
Independent Evaluation of Budget Support to Mozambique, 2005 -2012
funding, to consistency in expectations, consistency in the treatment of problems, notably cases of suspected violations of underlying principles, and to aid effectiveness principles. The on-going revision of the MoU for Budget Support provides an excellent opportunity to lay down common rules, regulations and procedures more carefully.
460. As a part of this process, there will also need to be a commitment – and a related set of actions – to revitalise the processes of coordination across the G-19. The evaluation team were unable to determine exactly why there has been deterioration in the quality of coordination across the G-19. On the surface, there does not appear to be any particular structural problem, nor any specific weakness with the frameworks that have been established for coordination: the Troika Plus, the GBS secretariat, etc. However, it may be that there are problems, which it was not possible to diagnose through the evaluation process. An internal examination of the reasons for the deterioration in the effectiveness of coordination is therefore recommended, based on a participatory process – potentially managed by an external facilitator.
Revitalising the Policy Dialogue process
461. Policy dialogue lies at the heart of Budget Support. It is essential that it should be structured to be strategic (i.e. focused on issues of major importance to the national development process), problem-solving (offering up solutions to policy blockages and constraints) and efficient (as low in transaction costs as possible). At present, the combined structure of central-level, sectoral and thematic groups within the dialogue structure is not achieving these three objectives as effectively as it might. Again, we would recommend an internally led, participatory diagnostic process, focused at two levels:
§ At the sectoral level, mechanisms need to be found to support effective processes of research, debate and policy development. These mechanisms need to be structured so as to strengthen policy development processes in the strategic areas, where they appear to be weak – such as in the design and implementation of agricultural policy. A structured, multi-annual programme of research and evaluation guided through the Budget Support process should probably be created as part of this mechanism. In addition, some facility could be created for bringing into problematic sectors external facilitators, who might help to bring a greater problem-focus into debate. In Tanzania, such a facility has been introduced through the “Big Fast Results” initiative, led by the President’s Office and has reportedly been helpful.
§ At the central level, efforts need to be made to streamline processes and
increase efficiency. The current Budget Support management framework works
relatively well and operates reasonably efficiently. However, attention should be
given to correcting the three areas of inefficiency in the current arrangements,
which relate to (i) the annual review framework created to mirror the PARP
structure, which has inadvertently introduced new transaction costs and over-

211
Independent Evaluation of Budget Support to Mozambique, 2005 -2012
complicated the dialogue structures; (ii) the continued lack of precision in the
definition of underlying principles and the methods to be used to assess and
monitor them; and (iii) the size of the PAPs’ PAF and the overly ambitious targets
which have been established in the recent past for the indicators in the PAPs’ PAF.
Consolidating gains
462. Continued attention must be given to the success areas identified by this evaluation, while adapting to the new challenges with regard to macroeconomic management, PFM reform, governance and education. The major ‘success areas’ for Budget support in the evaluation period were education, macroeconomic management, PFM reform, and, to a lesser extent, governance.. There is every reason to expect that further progress can be made in these important areas and it is therefore absolutely essential for the Government and the G-19 to maintain the attention devoted to them in terms of policy dialogue, budgetary resources and technical assistance and capacity building. At the same time, it will be important in each of these areas to adapt the policy dialogue and, where relevant, the focus of spending, to the new challenges which are emerging.
463. For macroeconomic management, it will mean greater attention to the framework for investment selection and management and to the creation of the legal and institutional framework for managing future revenues from the extractive industries. These are issues where the lead advisory role must clearly be with the IMF in the context of the on-going PSI. Hence the issue of the division of labour with the IMF and the appropriate roles for the GBS PAF and for technical assistance from other sources needs also to be determined.
464. In relation to education, the challenge is firstly to strengthen the degree of attention given to education quality issues and secondly to dedicate more attention to poor-performing schools. As part of the FASE programme, the education sector is already devoting more attention to learning achievement. There is work on going related to developing a learning achievement baseline in primary education, which will be one of the three indicators to be monitored at the level of the G19 GBS dialogue. This will also have implications for the approach to teacher training and probably for textbook policy. The other big challenge in the sector is to focus not just on improving average achievements (average pupil-teacher ratios, average school performance, etc.) but also in finding ways of reducing the variance around the mean by focusing attention more specifically on poor performing schools and districts.
465. In relation to governance, the challenge is to convert gains in transparency into tangible gains in accountability. The main improvements made over the evaluation period relate to transparency – improvements in the availability of budgetary documents, and in the scope and coverage of internal and external audit, and to a lesser extent to the legislative framework for fighting corruption. Improvements in these areas need to be continued and consolidated but efforts need also to be made to find more ways of using information so as to exert accountability. We would recommend beginning with simple

212
Independent Evaluation of Budget Support to Mozambique, 2005 -2012
measures – making internal and external audit reports more user-friendly and less technical so that they can more readily be understood (and thus actioned) by public sector managers, by Members of Parliament and by ordinary citizens. Mechanisms to follow up on the implementation of recommendations also need to be tightened up by formalising and documenting them and also by more active cooperation between the institutions of accountability – the Inspeção Geral de Finanças (IGF), the Tribunal Administrativo (TA), the Gabinete Central de Combate a Corrupção (GCCC) and the Comissão Parlamentar do Plano e Orçamento (CPO). We recommend that each of these ideas should be considered for inclusion within the work programmes for these areas.
466. For PFM reform, the challenge is both to strengthen the design of the PFM Reform Vision and to reinforce the institutional arrangements for the coordination of reforms and for the provision of support to reforms. In relation to PFM reform design, there is a need on the one hand to move from broad objectives to a more precise strategy, based on careful attention to the sequencing of individual reforms, and on the other to broaden the focus of reforms so as to address more fully the institutional requirements for controlling and monitoring fiscal risks. With regard to coordination of reforms, there remains a need to situate the coordination unit in the Ministry of Finance itself and to raise its profile and relative level of authority so that it can be more effective in driving change across the PFM system. In parallel, it is recommended that the G-19 should seek to strengthen its access to high-level advisory support, so as to meet the challenges posed by the more complex, ‘second generation’ reforms.
Focussing on targeted programmes to reduce poverty
467. Finally, we recommend an expanded programme of Budget Support focused on specific expenditure programmes and policies that might impact on poverty in the short to medium term. The main shortcoming of Budget Support in the evaluation period has been the failure to reduce income poverty. However, this is not just a failing of Budget Support but of government policy as a whole. Most stakeholders now agree that PARPA I and PARPA II focused too much on social sector spending and, while they were successful in improving education and health outcomes, they failed to introduce the types of policy changes and public expenditure programmes that could make a real difference to income poverty. The PARP is certainly more focused on the income poverty problem but we would argue that it is too vague to constitute a real strategy, based on concrete actions and precise programmes.
468. Steady economic growth and fast increases in domestic revenue have created a degree of fiscal space, which Mozambique has never experienced before. If projections for continued economic and revenue growth are fulfilled, then domestic revenue should exceed 25% of GDP by 2018. This permits Mozambique to contemplate, from 2015 onwards, an ambitious programme of public spending targeted on poverty reduction. Expanded provision of Budget Support could allow such a programme to be quickly scaled up, without serious risk to long-term fiscal sustainability. In addition to expanded social spending and investment in physical infrastructure as in the past, we would recommend the design and development of new programmes of spending and policy reform focused on three areas:

213
Independent Evaluation of Budget Support to Mozambique, 2005 -2012
§ A programme of social transfers and educational inputs targeted to address
malnutrition: this should build on the work on Early Childhood Development,
which has been developed under the FASE programme but might also include
school-feeding programmes and cash transfers, focused on poor female-headed
households.
§ A programme to improve availability of fertilisers and inputs for small and
medium farmers: this should probably include measures to facilitate access to
credit in rural areas by simplifying the legal and institutional framework for credit
providers, actions to improve awareness of the importance of fertiliser and other
inputs, and to incentivise their marketing and distribution, and measures to
facilitate cross-border trade in agricultural inputs and in marketed output.
Improvements to rural transport infrastructure might also potentially form a part
of such a programme.
§ A programme of policy measures, conducted in close collaboration with the
private sector, aimed at improving the business environment and promoting
employment growth. This is likely to build on on-going work in this area being
conducted in conjunction with the World Bank.
469. The evaluation team looks forward to discussing these recommendations with
stakeholders from Government and the DPs, with a view to refining them and helping to
convert them into a set of precise, actionable measures. The challenge for Mozambique
and its Development Partners is to find ways of achieving more with Budget
Support in the future.

214
Independent Evaluation of Budget Support to Mozambique, 2005 -2012
Bibliography
ACS (2009), Avaliação da Implementação da Estratégia Anti-corrupção (2007-2009). Maputo, UTRESP, 27 de Julho de 2009.
Alfani, F et al. (2012) Poverty in Mozambique. New evidence from recent household surveys Policy research working paper 6217, The World Bank
APRM (2010), Country Review Report N0 11. Republico of Mozambique. Midrand, South Africa; OSISA (2009), Democracy and Political Participation, A review by AfriMAP and Open Society Foundation for Southern Africa.
Arndt C, et al (2011) Explaining poverty evolution. The case of Mozambique. UNU-WIDER Working Paper 2011/17
Brito, L (2010) O Sistema Eleitoral: Uma Dimensão Crítica da Representação Política em Moçambique.
Cabral, L (2009) Sector Budget Support in Practice – Mozambique Desk Study, Overseas Development Institute
Canadian Food Security Policy Group, Effective Aid for Small Farmers in Sub-Saharian Africa: Southern Civil Society Perspectives, January 2007.
Castel-Branco, N. (2008) Aid and Dependency and Development: A Question of Ownership? A Critical View. Working Paper 1, IESE,Maputo.
CEDSIF (2012) PFM Vision Document
CEDSIF (2010) Annual Report
CEDSIF (2011) Annual Report
CEDSIF (2012) Annual Report
CIA Fact book. Mozambique. Accessed 5/12/2013
CIP (2009) Relatório Anual de Controlo da Corrupção em Moçambique – 2008
CIP (2011) O Destino dos Nossos Impostos – A Conta Geral do Estado 2009 e Parecer do Tribunal Administrativo. Maputo, 2011.
Cumbi, A et al, 2012, Political economy of the health sector in Mozambique, MAP Consult
Cunguara, Benedito and Garret James. “Agricultural Sector in Mozambique: Situation analysis, constraints and opportunities for agricultural growth.” IFPRI, 2011.
Erskog, H and Rasmussen, P (2009) Analysis of External Funds Registered in the State Budget 2009. Draft (Unpublished)
European Commission, (2012) Monitoring of EU education and health expenditure in developing countries: Mozambique Case Study

215
Independent Evaluation of Budget Support to Mozambique, 2005 -2012
Eurosis & MGA (2010), Diagnóstico Institucional do Tribunal Administrativo de Moçambique Maputo
FANR Directorate, SADC Secretariat (2008) Situation Analysis of Agricultural Research and Training in the SADC Region (Mozambique)
FAO/WFP (2010) (Crop and Food Security Assessment Mission to Mozambique. The Food and Agriculture Organization of the United Nations and the World Food Program, Rome
Friedrich-Ebert-Stiftung & MISA (2011) Barómetro Africano da Media. Moçambique
Hubert, D. (2012) Resources, Revenues and Social Development: Prospects and Challenges for the Extractive Industry in Mozambique, UNICEF, September 2012.
Hubert, D. (2013) Natural Gas from the Rovuma Basin: A ‘Game Changer for Mozambique?, UNICEF February 2013
IFPRI Discussion Paper 01229, The Supply of Inorganic Fertilizers to Smallholder Farmers in Mozambique”, December 2012.
INE, Agriculture and Livestock Census (2009-2010).
IMF (2006) Fourth Review Under the Three-Year Arrangement Under the Poverty Reduction and Growth Facility, Financing Assurances Review, IMF Country Report No. 6/254
IMF (2007) Republic of Mozambique: Sixth Review Under the Three- Year Arrangement Under the Poverty Reduction, IMF Country Report No. 07/262
IMF (2012) Republic of Mozambique: Fifth Review Under The Policy Support Instrument And Request For Modification Of Assessment Criteria, IMF Country Report No. 12/148
IMF (2013), Republic Of Mozambique, Staff Report For The 2013 Article Iv Consultation, Sixth Review Under The Policy Support Instrument, Request For A Three-Year Policy Support Instrument And Cancellation Of Current Policy Support Instrument, Country Report No. 13/200
IMF (2013) Republic of Mozambique: Fifth Review Under The Policy Support Instrument And Request For Modification Of Assessment Criteria, IMF Country Report No. 13/1
IMF (2014) Republic of Mozambique: First Review Under the Policy Support Instrument and Request for Modification of Assessment Criteria – Staff Report; Press Release IMF Country Report No. 14/20
Lawson, A et al (2006) Assessment Of Public Finance Management In Mozambique 2004/05 Based On PEFA Methodology, Final Report (Current Status Of PFM Systems & Processes, Overview Of Reforms And Perspectives For 2006), ODI / SAL & CALDEIRA,
Lawson, Andrew et al, (2008) Assessment of Public Finance Management & Procurement systems in the Mozambique Health Sector, based on an adaptation of the PEFA Methodology to the Health Sector, Final Report – English Version
Lawson, A et al (2009) Final Assessment Report 2008, Public Expenditure And Financial Accountability (PEFA) Assessment In Mozambique, SAL & CALDEIRA, FISCUS Limited / SAL & CALDIERA,

216
Independent Evaluation of Budget Support to Mozambique, 2005 -2012
Martinez, S, Naudeau, S and Pereira, V (2012) The Promise of Pre-School in Africa: A Randomized Impact Evaluation of Early Childhood Development in Rural Mozambique World Bank/Save the Children
MB Consulting & CIPFA (2011). Avaliação de Despesa Pública e Responsabilidade Financeira (PEFA) em Moçambique. Relatório Final
Ministerio da Agricultura (2005) Trabalho de Inquerito Agricola. Maputo
Ministerio da Agricultura (2006) Trabalho de Inquerito Agricola. Maputo
Ministerio da Agricultura (2007) Trabalho de Inquerito Agricola. Maputo
Ministerio da Agricultura. (2008) Trabalho de Inquerito Agricola. Maputo
Ministerio da Agricultura (2011) Plano Estrategico de Desenvolvimento do Sector Agrario (PEDSA) Republica de Mocambique
Ministry of Agriculture (2011) Monitoring Agriculture Sector Performance, Growth and Poverty Trends in Mozambique, 2010 Annual Trends and Outlook Report, Directorate of Economics, Mozambique Strategic Analysis and Knowledge Support System (MozSAKSS) Mozambique
Ministry of Agriculture (2012) Monitoring Agriculture Sector Performance, Growth and Poverty Trends in Mozambique, 2011 Annual Trends and Outlook Report, Directorate of Economics, Mozambique Strategic Analysis and Knowledge Support System (MozSAKSS) Mozambique
Ministry of Agriculture (2010) Strategic Plan for Agricultural Development: PEDSA 2010-2019 Republic of Mozambique
MISAU, 2006, Avaliação Conjunta Annual do Desempenho do Sector de Saúde – 2005, ACA V
MISAU, 2008, National Plan for Human Resources Development 2008-2015
MISAU, 2008, Plano Estratégico do Sector Saúde: 2008 -2012
MISAU, 2009, Plano de Acção - Contributo para o desenvolvimento operacional do nível dos Sistemas de Gestão Financeira & Aquisiçõe
MISAU, 2009, Avaliação Conjunta Annual do Desempenho do Sector de Saúde – 2008, ACA VIII
MISAU, 2011, Relatório da Revisão do Sector de Saúde, 3rd Draft
MISAU, 2012, Relatório da Revisão do Sector de Saúde, Final
MISAU, 2012, Strategic Plan for Pharmaceutical Logistics, December 2012
MISAU, 2012, Plano de Acção para o Fortalecimento da Gestão Financeira do Sector de Saúde em Moçambique, Versão Final.
MISAU, 2013, Plano Estratégico do Sector Saúde: 2013 -2017, Pre Final Version
MISAU, 2013, Relatório de Execução Orçamental e Financeira, Sector da Saúde – 2012
MISAU, 2013, Avaliação Conjunta Annual do Desempenho do Sector de Saúde – 2012, ACA XII
Mogues, T and Benin, S (2012) Public Expenditures in Agriculture in Mozambique International Food Policy Research Institute

217
Independent Evaluation of Budget Support to Mozambique, 2005 -2012
Molenaers, N, Capinskas, L and Jacobs, B (2010) Budget Support and Policy/Political Dialogue: Donor Practices in Handling (Political) Crises IOB/Universiteit Antwerpen
Mucavele, F (2009) The true contribution of Agriculture to the Economic Development of Mozambique, Paper presented at the Regional Stakeholders Policy Dialogue from 31st of August to the 4th of September 2009, in Maputo, Mozambique.
Ncube, S and Goris, W (2009) Trip report to Mozambique, July 2009 Hivos regional office Harare and Agri-ProFocus support office Arnhem
OECD-DAC (2006), Harmonising Donor Practise for Effective Aid Delivery: Volume 2; Budget Support, Sector Wide Approaches & Capacity Development in Public Finance Management, OECD-DAC; Paris
PAPs Secretariat / MPD Annual Review Aide Memoires 2004 to 2013
Pauw, K., Thurlow, J., Uaiene, R. and Mazunda, J. (2012) Agricultural Growth and Poverty Reduction in Mozambique: Technical Analysis in Support of the Comprehensive Africa Agriculture Development Program (CAADP). MozSAKSS Working Paper
PEFA (2010) Report on the Years 2007 – 2009 Draft version
Pessoa, M et al (2011) Mozambique: Follow-up of the Public Financial Management Reforms, International Monetary Fund
Pessoa, M et al (2012) Follow-Up of the Public Financial Management Reforms 2012
Pessoa, M et al (2012) Mozambique: Follow-up of the Public Financial Management Reforms 2012, International Monetary Fund
Republic of Mozambique, MISAU, Memorando de Entendimento
Republic of Mozambique, nd. CNCS, Memorando de Entendimento
Republic of Mozambiquen-European Community Country Strategy Paper 2008-2012
República de Moçambique, Tribunal Administrativo (2012) Demonstraçôes Financeiras Auditadas
Sida, Irish Aid and UK aid (2013) Summary Report of the Public Sector Governance Reform
Torbick, N.M. (2011) Mozambique: Agricultural Weather Risk Mapping: Final Report, Applied GeoSolutions LLC (for World Bank)
Transparency International (2012) Corruption Perception Index 2012. Berlin
Transparency International (2013) Global Corruption Barometer 2013. Berlin
Tribunal Administrativo (2010) Plano Estratégico do Tribunal Administrativo – PLACOR 2011-2014. Novembro 2010.
Umarji, M et al (2011) Final Assessment Report 2010, Public Expenditure And Financial Accountability (PEFA) Assessment In Mozambique MB Consulting / CIPFA,
Umarji, M. et al (2011) Avaliação de Despesa Pública e Responsabilidade Financeira (PEFA) em Moçambique 2010, MB Consulting, CIPFA

218
Independent Evaluation of Budget Support to Mozambique, 2005 -2012
USAID (2010) Comparative Assessment of Decentralization in Africa: Mozambique In-country Assessment Report
Van den Boom, B (2011) Analysis of poverty in Mozambique. Household poverty status, child malnutrition and other indicators 1997, 2003, 2009
Visser-Valfrey, M and Bibi, M (2010) Sector Budget Support in Practice, Case Study: Health Sector in Mozambique, ODI/Mokoro
World Bank (2011) Mozambique - Analysis of Public Expenditure in Agriculture
Ximungo Consultores (2011) PSGR Case Study Mozambique: External Audit