Budget Summary Book 2021-INSIDES-Color
216
Phoenix Summary Budget 2021-22 Setting a path forward for a sustainable Phoenix
Transcript of Budget Summary Book 2021-INSIDES-Color

PhoenixSummary Budget
2021-22
Setting a path forward for a sustainable Phoenix

SUMMARYBUDGET
2021-2022PHOENIX

Printed on Recycled Paper150
August 2021
CAREFREE HWY.
JOMAX
JOY RANCH
DOVE VALLEY
CLOUD RD.
JOMAX
C.A.P.
PINNACLE PEAK
BETHANY HOMEMISSOURI
BETHANY HOME
THOMASTHOMAS
OSBORN
BUTLER BUTLER
VAN BUREN
BASELINE
OSBORN
THUNDERBIRD
GREENWAYBELL
DUNLAP
NORTHERN
CACTUS
MOUNTAIN VIEW
GLENROSA
NORTHERN
CAMELBACK
INDIAN SCHOOL
McDOWELL
McDONALD
OAK
McDOWELL
VAN BUREN
BUCKEYE
BUCKEYE
BROADWAY
I-10MCDOWELL
I-10
RAYESTRELLA
ELLIOT
BASELINE
DOBBINS
SOUTHERN
PECOS
INDIAN
RESERVATION
19TH
AV
E.
7TH
AV
E.
43RD
AV
E.
NEW
RIV
ER
67TH
AV
E.
43RD
AV
E.
99TH
AV
E.
ELM
IRA
GE
107T
HA
VE.
51ST
AV
E.
71ST
AV
E.75
THA
VE.
35TH
AV
E.
27TH
AV
E.
67TH
AV
E.
51ST
AV
E.
59TH
AV
E.
19TH
AV
E.
3RD
ST.
7TH
ST.
CEN
TRA
L
SR51
7TH
AV
E.
7TH
ST.
48TH
ST.
56TH
ST.
I-10
83RD
AV
E.
19TH
AV
E.15
THA
VE.
7TH
ST.
SCO
TTSD
ALE
RD.
64TH
ST.
CAV
ECR
EEK
64TH
ST.
64TH
ST.
56TH
ST.
56TH
ST.
TATU
M
40TH
ST.
24TH
ST.
40TH
ST.
JENNY LIN RD.
WANDER LN.
CIRCLE MOUNTAIN RD.
ANTHEM WAY
75TH
AV
E.
67TH
AV
E.
NEW
RIV
ERRD
.
51ST
AV
E.
C.A.P.
JOY RANCH RD.
BEARDSLEY
UNION HILLS
SALT RIVER
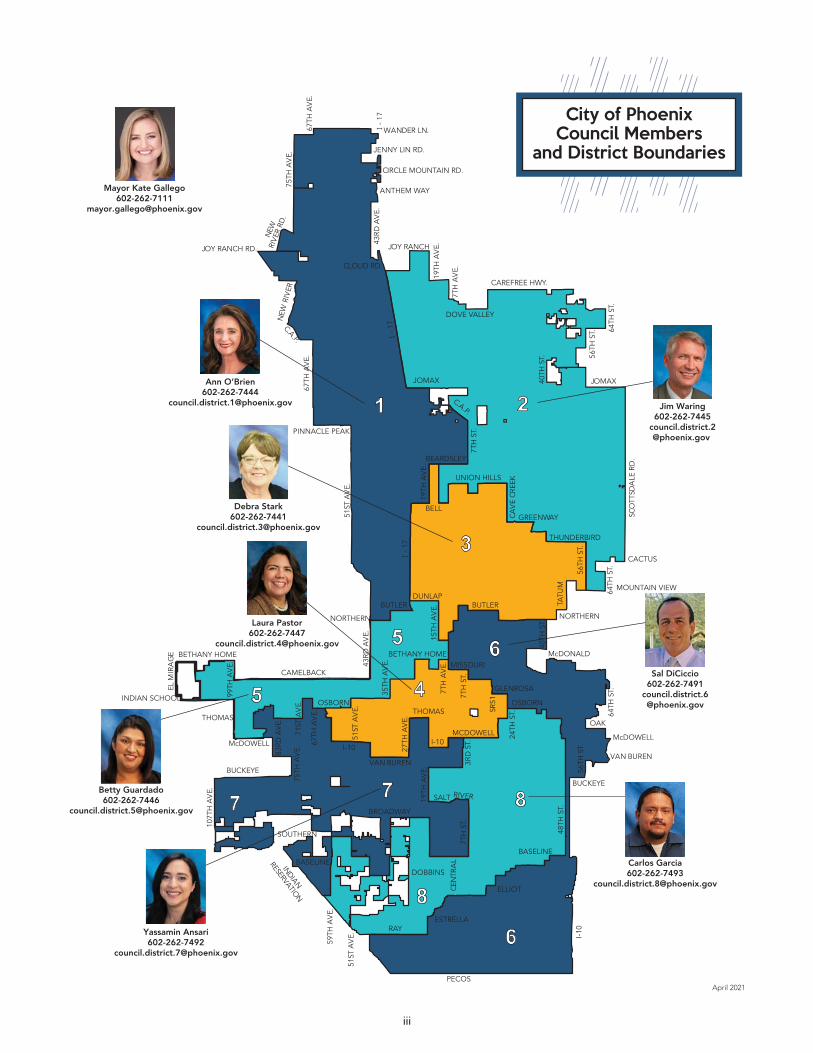
Jim Waring602-262-7445
Sal DiCiccio602-262-7491
Laura Pastor602-262-7447
Debra Stark602-262-7441
Betty Guardado602-262-7446
Carlos Garcia602-262-7493
Mayor Kate Gallego602-262-7111
Ann O’Brien602-262-7444
Yassamin Ansari602-262-7492
April 2021
iii
City of PhoenixCouncil Members
and District Boundaries

iv
Mayor and City Council
Kate GallegoMayor
Carlos GarciaVice MayorDistrict 8
Ann O’BrienDistrict 1
Jim WaringDistrict 2
Debra StarkDistrict 3
Laura PastorDistrict 4
Betty GuardadoDistrict 5
Sal DiCiccioDistrict 6
Yassamin AnsariDistrict 7
Lisa Fernandez Chief of Staff
Sina MatthesCouncil Chief of Staff
Management Staff
Ed ZuercherCity Manager
Jeff BartonAssistant City Manager
Inger EricksonDeputy City Manager
Toni MaccaroneDeputy City Manager
Gina MontesDeputy City Manager
Mario PaniaguaDeputy City Manager
Karen PetersDeputy City Manager
Ginger SpencerDeputy City Manager
Department Heads
Cynthia Aguilar Parks and Recreation Director
Denise Archibald City Clerk
Lori Bays Human Resources Director
John Chan Phoenix Convention Center Director
Marchelle F. Franklin Human Services Director
Kathleen Gitkin
Steen Hambric
Rita Hamilton City Librarian
Troy Hayes Water Services Director
Kara KalkbrennerFire Chief
Kini KnudsonStreet Transportation Director
Donald R. LoganEqual Opportunity Director
Christine MackayCommunity and Economic Development Director
Chad MakovskyDirector of Aviation Services
Titus MathewHousing Director
Frank McCuneGovernment Relations Director
Cris MeyerCity Attorney
Jesús Sapien Public Transit Director
Spencer SelfNeighborhood Services Director
Felissa Washington SmithInterim Public Works Director
Alan J. StephensonPlanning and Development Director
Ross TateCity Auditor
Jeri L. WilliamsPolice Chief
Amber WilliamsonBudget and Research Director
Dan Wilson
Chief Presiding Judge
B. Don Taylor III
CITY OF PHOENIX

v
PUBLIC
CITY MANAGEREd Zuercher
MAYOR AND CITY COUNCIL
MUNICIPALCOURT
Community and Economic Dev.
IDA / PCDIC
State Land
Planning andDevelopment
Inger EricksonDEPUTY
CITY MANAGER
Arts & Culture
Parks and Recreation
PhoenixConvention
Center
Youth &Education
Citywide Volunteer Program
Library
Finance
Court Liaison
Karen PetersDEPUTY
CITY MANAGER
Water Strategy
EnvironmentalPrograms
Public Works
Sustainability
Water Services
Public DefenderLiaison
Heat Responseand Mitigation
ASSISTANT CITY MANAGERJeff Barton
Fire
Budget andResearch
Police
COVID Response/ARPA
Office of Government
Relations
Gina MontesDEPUTY
CITY MANAGER
Housing
StrategicInitiatives
Human Services
Homelessness/Affordable Housing
Strategies
NeighborhoodServices
City Auditor
CommunicationsOffice
Toni MaccaroneDEPUTY
CITY MANAGER
City Clerk
Human Resources
COPERS /Retirement
311 Project
EqualOpportunity
InformationTechnology
Homeland Security & Emergency Management
Ginger SpencerDEPUTY
CITY MANAGER
Law
Mario PaniaguaDEPUTY
CITY MANAGER
Aviation
Major Events
West Phoenix Revitalization
CommunityAssistanceProgram
City Council Mtg. Function
PERB Liaison
Diversity, Equity& Inclusion Office
Public Transit
StreetTransportation
Light Rail
AdvancePhoenix
FreewayCoordination
Infrastructure
CITY OF PHOENIX ORGANIZATIONAL CHART

vi
vii
Budget Document Overview ................................................ 1
Distinguished Budget Presentation Award ........................... 3
City Manager's Budget Message ........................................... 5
Strategic Plannning And Community Involvement .............. 9Phoenix Strategic Plan ..........................................................11
Strategic Plan 2020-21 Major Accomplishments ............... 17
Our Commitment To Excellence ........................................23
..........................................33
BUDGET OVERVIEWResource and Expenditure Summary .................................37Financial Organizational Chart – Operating Budget ......... 44Services to the Community ................................................47Budget Process, Council Review and Input, Public Hearings and Budget Adoption ......................................65General Budget and Financial Policies ..............................71
REVENUE OVERVIEWRevenue Estimates ..............................................................79General Funds .....................................................................81Special Revenue Funds .......................................................91Enterprise Funds .................................................................96
DEPARTMENT PROGRAM SUMMARIES
General GovernmentMayor .................................................................................100City Council ........................................................................100City Manager .....................................................................101Regional Wireless Cooperative .........................................101Government Relations ......................................................102
....................................................102City Auditor ........................................................................103Equal Opportunity .............................................................104Human Resources .............................................................105Phoenix Employment Relations Board .............................106Retirement Systems ..........................................................106Law .....................................................................................107Information Technology ....................................................108City Clerk ............................................................................109Finance ..............................................................................110Budget and Research ........................................................111
Public SafetyPolice .................................................................................114Fire .....................................................................................116Homeland Security and Emergency Management ..........117
Criminal JusticeMunicipal Court .................................................................120Public Defender .................................................................121
TransportationStreet Transportation ........................................................124Aviation ..............................................................................126Public Transit ....................................................................127
Community DevelopmentPlanning and Development ..............................................130Housing..............................................................................132Community and Economic Development.........................133Neighborhood Services.....................................................134
Community EnrichmentParks and Recreation ........................................................138Library ................................................................................140Phoenix Convention Center ..............................................141Human Services ................................................................142
...................................144
Environmental ServicesWater Services ...................................................................146Public Works - Solid Waste Management .......................147Public Works - Support Services ......................................148Environmental Programs ..................................................149
......................................................150
Contingencies ....................................................................151COVID-19 Funding Summary .............................................153Debt Service ......................................................................157
CAPITAL IMPROVEMENT PROGRAMOverview of Capital Improvement Program Process ......161Capital Improvement Program Highlights .......................165Financial Organizational Chart – 2021-22 Capital Improvement Program ....................175Operating Costs for New Capital Facilities ......................177
SUMMARY SCHEDULES1. Resources and Expenditures by Fund 2019-20 Actual ...........................................................180 2020-21 Estimate .......................................................181 2021-22 Budget ..........................................................182
2. Revenues by Major Source ...........................................1833. Operating Expenditures by Department .......................1854. Operating Expenditures by Department by Source of Funds .........................................................1875. Debt Service Expenditures by Source and Use of Funds and Type of Expenditure.................................1896. Capital Improvement Program Financed by Operating Funds ........................................................1917. Interfund Transfers to the General Fund ......................1928. Positions by Department ..............................................194
GLOSSARY ........................................................................ 198
2021-22 SUMMARY BUDGET TABLE OF CONTENTS

viii

1
This overview outlines the 2021-22 Annual Budget. This budget document can be accessed at phoenix.gov/budget, or copies of the document are available by contacting the City of Phoenix Budget and Research Department at 602-262-4800, TTY: use 7-1-1. To request this in alternate formats (large print, braille, audio cassette or compact disc), please contact the Budget and Research Department.
The summary budget contains a narrative description of Phoenix programs and services planned for 2021-22. Also included is a narrative description of all revenue sources
The detail budget presents extensive statistical data (including multiyear comparisons) for each City department and fund. The statistical data includes
expenditures.
Finally, the 2021-26 Capital Improvement Program provides Phoenix’s planned construction program by project and detailed sources of funds.
A more detailed description of the 2021-22 Phoenix summary budget follows.
CITY MANAGER’S BUDGET MESSAGEThe City Manager’s budget message provides an executive summary of the City Manager’s priorities and outlook for
months of working with the Mayor and City Council, the community and City staff.
PHOENIX STRATEGIC PLANThis section provides the City’s mission statement, complete Phoenix strategic plan, strategic plan goals, and strategic plan major accomplishments.
OUR COMMITMENT TO EXCELLENCEThis section provides an overview of the City’s various programs that contribute to our overall pursuit of excellence. Included is a description of a few of the awards and recognitions received by employees this year, results of the employee suggestion program and winners of the Employee Excellence Awards.
COMMUNITY PROFILE AND TRENDS
are provided for 2020-21 and 2021-22 as well as actual results for recent and historical periods.
2021-22 BUDGET OVERVIEWThe budget overview provides a description of the City’s budget process as well as the major assumptions included in the preparation of the 2021-22 Annual Budget. This section includes a broad overview of the resources and expenditures included in the budget. Also included is a historical look at Phoenix’s community services, an
including general legal requirements and basis of accounting, and descriptions of City funds.
2021-22 REVENUE OVERVIEWThis section provides an extensive narrative describing the City’s revenue estimates. The section is divided into three categories: general funds, special revenue funds and enterprise funds.
DEPARTMENT PROGRAM SUMMARIESThe department program summaries section provides total funding and positions, program goals, major performance measures and service trends, and any changes in service for each City department. Also included in this section is a discussion of the City’s debt management policies and the contingency fund.
CAPITAL IMPROVEMENT PROGRAMThis section provides a description of the Capital Improvement Program process and an overview of the 2021-26 Capital Improvement Program.
SCHEDULESThe schedules provide a general statistical overview of the budget. Schedule 1 provides estimated beginning and ending balances for each major fund group. The remaining
resources and expenditures.
GLOSSARY
document are presented in the glossary.
concept or term, or desire more detailed information about this document, please contact the Budget and Research Department at 602-262-4800.
BUDGET DOCUMENT OVERVIEW

2

3
���������������� ���������
����
���������������������������������������
!"#�$%�&'&'
()*�+,-�(./012�3-1*�4-5.66.65�
789:9;<9=�<>
?@A#�BC�7DBEF@G
HI-0J+.K-�L.*-0+)*
MN@OBFP
Association of the United States and Canada (GFOA) presented a Distinguished Budget Presentation Award to the City of Phoenix, Arizona
year beginning July 1, 2020.
In order to receive this award, a governmental unit must publish a budget document that meets program criteria as a policy document, as an operations
communications device.
This award is valid for a period of one year only. We believe our current budget continues to conform to program requirements, and we are submitting it to GFOA to determine its eligibility for another award.
DISTINGUISHED BUDGET PRESENTATION AWARD

4
5
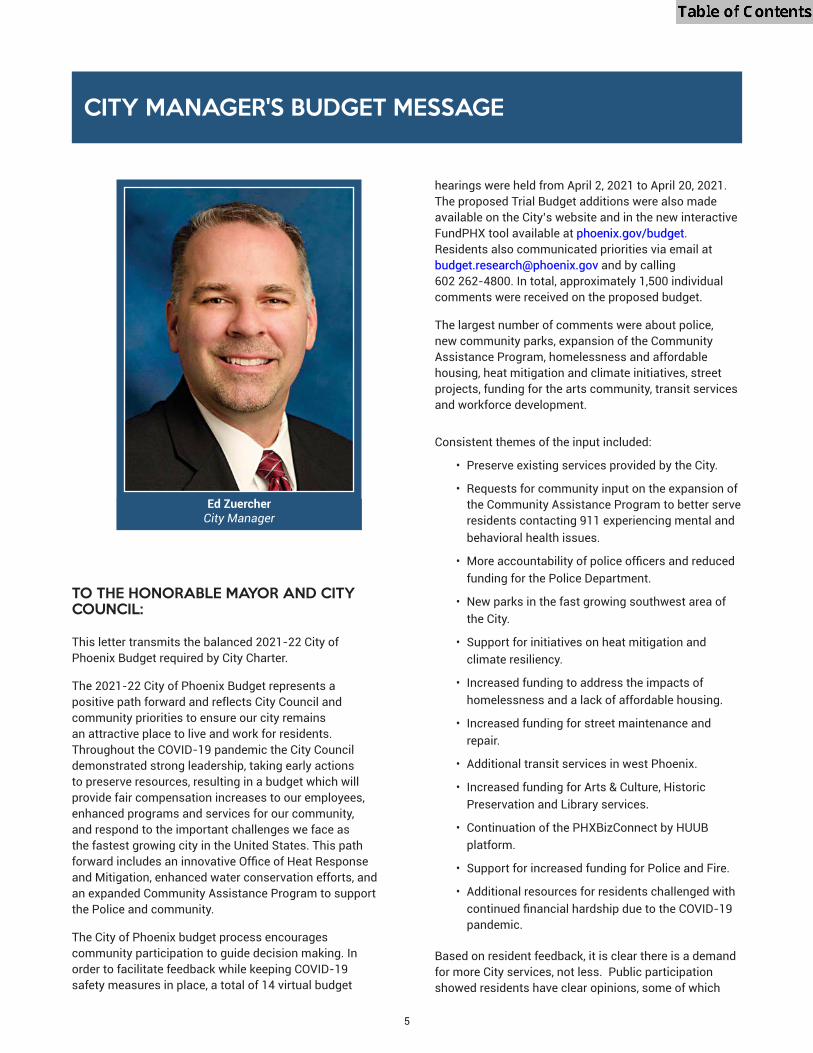
TO THE HONORABLE MAYOR AND CITY COUNCIL:
This letter transmits the balanced 2021-22 City of Phoenix Budget required by City Charter.
The 2021-22 City of Phoenix Budget represents a positive path forward and reflects City Council and community priorities to ensure our city remains an attractive place to live and work for residents. Throughout the COVID-19 pandemic the City Council demonstrated strong leadership, taking early actions to preserve resources, resulting in a budget which will provide fair compensation increases to our employees, enhanced programs and services for our community, and respond to the important challenges we face as the fastest growing city in the United States. This path
and Mitigation, enhanced water conservation efforts, and an expanded Community Assistance Program to support the Police and community.
The City of Phoenix budget process encourages community participation to guide decision making. In order to facilitate feedback while keeping COVID-19 safety measures in place, a total of 14 virtual budget
hearings were held from April 2, 2021 to April 20, 2021. The proposed Trial Budget additions were also made available on the City’s website and in the new interactive FundPHX tool available at phoenix.gov/budget. Residents also communicated priorities via email at [email protected] and by calling 602 262-4800. In total, approximately 1,500 individual comments were received on the proposed budget.
The largest number of comments were about police, new community parks, expansion of the Community Assistance Program, homelessness and affordable housing, heat mitigation and climate initiatives, street projects, funding for the arts community, transit services and workforce development.
Consistent themes of the input included:
• Preserve existing services provided by the City.
• Requests for community input on the expansion ofthe Community Assistance Program to better serveresidents contacting 911 experiencing mental andbehavioral health issues.
funding for the Police Department.
• New parks in the fast growing southwest area ofthe City.
• Support for initiatives on heat mitigation andclimate resiliency.
• Increased funding to address the impacts ofhomelessness and a lack of affordable housing.
• Increased funding for street maintenance andrepair.
• Additional transit services in west Phoenix.
• Increased funding for Arts & Culture, HistoricPreservation and Library services.
• Continuation of the PHXBizConnect by HUUBplatform.
• Support for increased funding for Police and Fire.
• Additional resources for residents challenged withancial hardship due to the COVID-19
pandemic.
Based on resident feedback, it is clear there is a demand for more City services, not less. Public participation showed residents have clear opinions, some of which
CITY MANAGER'S BUDGET MESSAGE
Ed ZuercherCity Manager

6
are contradictory, about the services we deliver every day to the community. While not all input could be directly accommodated into the budget, the feedback is extremely important to set budget and policy discussions for the future. Many additions in this year’s budget reflect input received over the past several years.
I would like to acknowledge and thank City staff in Budget & Research, City Clerk, Information Technology
work on development, advertisement and facilitation of community engagement in the development of the 2021-22 budget.
Overview of 2021-22 BudgetGeneral Fund: The 2021-22 General Fund (GF) budget is $1.608 billion. This is a $182 million or 12.8 percent increase from the adopted 2020-21 budget of $1.426 billion. The increase accounts for strategic use of the $154.8 million surplus and provides compensation increases for our employees, and enhancements to programs and services. Expenditure increases also include higher costs for capital pay-as-you-go
contingency fund to maintain 4 percent of GF operating expenditures.
Revenue and Resources: Projected GF revenue in 2021-22 is estimated to be $1.356 billion and represents an increase of $33.0 million or 2.5 percent over the 2020-21 Revised Estimate of $1.323 billion, excluding one-time revenues of $109.2 million from the Council approved transfer from the Coronavirus Relief Fund to offset public safety salaries as permitted by the Federal guidelines. Growth in 2021-22 reflects anticipated increases in city and state sales taxes and state-shared vehicle license taxes as the local economy continues to improve from the Coronavirus pandemic. This growth is offset by estimated declines in state-shared income tax revenues, which is based on collections from two years prior, and is impacted
last quarter of 2019-20 in response to the pandemic. Additionally, the City's proposed 2021-22 combined property tax rate of $2.12 is one cent lower than the 2020-21 combined rate of $2.13. The primary property tax rate used to support all GF programs and services remains unchanged at $1.31, while the secondary property tax rate used to pay voter approved general obligation debt service decreases from $0.82 to $0.81.
Finally, including revenue along with the estimated beginning fund balance of approximately $244.7 million (largely made up of one-time funds from the Coronavirus Relief Fund), and fund transfers and recoveries estimated at $7.1 million, total 2021-22 GF resources are estimated to be $1.608 billion.
General Fund Additions: The 2021-22 budget preserves existing City programs and will positively impact our employees and the community. The budget makes
76 percent, or $118.3 million of the available GF surplus of $154.8 million, to provide much deserved compensation increases. Our employees have demonstrated their commitment to the community by ensuring City services continued to be delivered throughout the pandemic.
The remaining $36.5 million includes additions designed to accomplish several important City Council policy goals. Primary among these additions are resources for public safety reform and responsiveness including: adding a Victim Advocate to assist family members who have experienced use of force incidents, resources to provide quicker turnaround for public records requests, improved data reporting and analytics to support accurate statistics and to facilitate early intervention for possible adverse sworn police behaviors. These additions are designed to improve accountability and trust between the Phoenix Police Department and the
investment of $15 million to expand the existing Community Assistance Program (CAP) to provide crisis response services for residents experiencing mental and behavioral health issues. This investment will achieve several goals including: meeting the demand for services, provide an appropriate response with civilian staff trained in crisis care and mental and behavioral health, reduce response times, and facilitate a connection to care for ongoing counseling and support services with community partners. Another outcome
response times for public safety related calls for service.
General Fund additions also include several items in the areas of building community and responding to growth, affordable housing and homelessness, climate change and heat readiness, COVID response and resiliency and administrative accountability. Highlights of these categories include: adding three new parks in the southwest region of Phoenix, providing staff to operate the new Cesar Chavez Community Center, expanding the successful Adaptive Recreation program to offer year-round inclusive recreation opportunities for residents with disabilities and college readiness programs for our youth provided by College Depot.
Funding is also included for art grants, historic preservation, support for veterans, funding for Fast-Track Cities initiatives to provide education and treatment for residents with HIV/AIDS, staff to work with small businesses to revitalize retail development in the west part of the City, and new positions to support Council and community initiated projects like the Rio Reimagined Plan to develop an economically viable and diverse mix of housing and businesses along the banks of the Salt River.

7
Resources are also included to achieve the goals of the Council adopted Housing Phoenix Plan and Homeless Strategies Plan to provide assistance to individuals experiencing homelessness and to expand the number of affordable housing units in Phoenix. To help mitigate
Response and Mitigation will be created to identify strategies to help our most vulnerable populations who struggle every summer to survive rising valley
is included to focus on climate change and includes resources to conduct greenhouse gas emission inventories and to plant more trees around the City to achieve the Council adopted Tree and Shade Master Plan goal of doubling the tree canopy by 2050.
Additionally, funding is included to continue innovative services developed due to COVID-19 such as providing
continue contracts with public health consultants, an additional position to continue the Emergency Food Action program to achieve the goals of the Council approved 2025 Food Action Plan.
Finally, new administrative positions are added to
ensure Phoenix remains a place to live and work which promotes equitable and respectful treatment of all people. Funding is also added to restore positions for Information Technology, Human Resources and to properly maintain the City’s fleet of vehicles.
Other Funds: Important and critical services to the community are provided through non-General Fund resources. This includes Special Revenue funds like voter-approved Public Safety and Transit taxes and the Arizona Highway User Revenue fund, and Enterprise Funds like Aviation, Phoenix Convention Center, Solid Waste, Water and Wastewater. Additions to the 2021-22 budget for other funds includes $4.3 million in resources to add new positions in the Development Services fund to process increasing commercial and residential plan reviews, in the Solid Waste fund due to growth in both the number of households and refuse and recycling tonnage, in the Water fund to implement 13 projects recommended by the Water Conservation Ad Hoc Committee to address water shortages from the Colorado River, and in the Arizona Highway User Revenue fund for additional street maintenance needs.
For all funds, which includes General, Enterprise and Special Revenue funds such as grants, and all debt service and pay-as-you-go capital costs, the 2021-22 budget amount is $5.627 billion.
This budget is a dynamic representation of City Council objectives and our commitment to providing our community the best possible programs and services.
All the City's budget information - including complete program information and the City Manager's Trial Budget details - is available at phoenix.gov/budget.
Looking AheadThe City and its residents continue to experience unprecedented stresses from COVID-19. I am committed to working with you and our community to continue to safely and responsibly navigate the pandemic, including identifying strategic use of American Rescue Plan Act funds to help residents who continue to experience
leadership we have navigated this crisis successfully by taking a cautious and steady approach to how we utilize taxpayer resources and adopt spending commitments to keep the budget solvent and balanced.
Looking ahead, our future is full of opportunity. Phoenix is one of the fastest growing and most desirable locations in
including economic uncertainty, increasing costs for
fleet and City facilities, the need for new City infrastructure to keep pace with population growth, increased costs for implementing and maintaining technology to ensure our City systems remain functional and stay protected from cyber security threats, resources to retain and attract a highly skilled workforce, continued demands for more City services, potential reductions to state shared revenues and new unfunded state or federal mandates. The good news is under your leadership we are an organization that has proven to be responsible stewards of public resources. We are committed to work through challenges and identify solutions so we can continue to serve the citizens of Phoenix. This budget is a reflection of that unwavering commitment.
Thank You for Your Commitment to PhoenixI want to thank the Mayor and City Council for your dedication to the City and the community we all serve.
to navigate through the pandemic strategically by working together to continue our tradition of providing exceptional services to our community.
Finally, I want to thank the residents who took the time to attend hearings and provided comments on the budget. Together, we all make a great city to work and live.
Ed ZuercherCity Manager
8

The Phoenix Strategic Plan was adopted in the spring of 2011 and was included in the Summary Budget Book for 2011-12. The plan was developed by a team of 50 people working in 10 study-area committees. The team consisted of City staff and members of the private sector.
The Phoenix Strategic Plan guides decision-making within the organization and focuses the City’s efforts to deliver core services that meet the City’s mission: “public services.” The plan includes 10 study areas:
• Economic Development and Education
• Financial Excellence
• Infrastructure
•
• Neighborhoods and Livability
• Phoenix Team
• Public Safety
• Social Services Delivery
• Sustainability
• Technology
own study objectives.
Documents included in this section:
• Phoenix Strategic Plan
• Strategic Plan 2020-21 Major Accomplishments
9
STRATEGIC PLANNING AND COMMUNITY INVOLVEMENT

10

ECONOMIC DEVELOPMENT AND EDUCATIONA diverse, vibrant economy that provides economic opportunity for residents is essential to achieving the City’s aspirations for a high quality of life. Creating and preserving jobs and enhancing our revenue base are key objectives. Businesses,
create. The most important building block of a strong economy is an educated and productive workforce.
Priorities
1. Create and retain high-quality jobs focusing on key domestic and international business sectors. To a great extent, thequality of life for Phoenix residents will be dependent on the number and quality of jobs created and retained that areconvenient and appropriate for residents of the City of Phoenix.
2. Foster an environment for entrepreneurial growth. Entrepreneurs make critical contributions to the economy, includingthe generation of new jobs. Energized, educated entrepreneurs create economic opportunity for others and enhance aculture of innovation.
3. Revitalize the urban areas of Phoenix. Thriving urban cores are critical to the economic health and well-being of theentire metropolitan area. Strong urban centers enhance Phoenix’s image and should be reflective of the City’s collectivesocial and economic aspirations as a region.
4. Expand the City’s revenue base. Sales taxes provide the largest source of local government funding. Phoenix needs toattract and retain a fair share of retail activity to sustain quality public services for residents.
5. A skilled workforce is essentialfor an economy to sustain and enhance its competitiveness. A workforce development strategy that allows employersto grow and residents to enhance their income is critical to maintaining a high quality of life for Phoenix residents.
6. Promote early literacy and prepare young children for academic success. Early childhood development is critical inpreparing youth for success in school and developing a foundation of knowledge, skills and life-long learning in familiesand the community.
7. Commit to achieving educational excellence for all Phoenix residents through sponsored facilities and programs.The future success of the region depends on ensuring that residents are prepared to meet the challenges of the 21stCentury as educated, productive and engaged residents.
11
PHOENIX STRATEGIC PLAN
MISSION STATEMENT
ABOUT THE STRATEGIC PLANThe City of Phoenix developed a strategic plan to help guide decision-making at all levels of the organization and focus the
more information about the Strategic Plan, visit phoenix.gov/strategicplan.
FINANCIAL EXCELLENCE
Priorities
1. Maintain high bond ratings. A bond rating is a measure of the credit quality of the City. Factors considered in a rating are the health of the local economy, stability and volatility of revenues, level of reserves for liquidity during unexpected
address challenges. An entity with a long-term outlook and has plans to address unexpected changes is positively
usually result in lower borrowing costs.
2. Prioritize capital and funding plans for critical infrastructure.
must be balanced with the need for new infrastructure. This includes prioritizing the use of the remaining 2006 General
needs.
3. Provide accurate and reliable revenue and expenditure forecasting. To ensure available resources are allocated to the highest priority needs, accurate and reliable forecasts of both revenues and expenditures are needed. This requires access to the necessary resources and expertise to ensure all critical factors are considered in revenue forecasts and all factors that impact expenditures are considered and modeled. Accuracy of expenditure forecasts also requires discipline of all City departments to ensure expenditures are monitored and managed. Without accurate forecasts and management of expenditures, reserve levels may be tapped below critical levels and services may be unnecessarily reduced.
4. One of the most important aspects of
systems and processes are in place to prevent fraud, waste and abuse of public funds. An important element of
regular internal and external audits to prevent fraud, waste and abuse.
INFRASTRUCTUREInfrastructure is the basic physical and organizational structure needed for the operation of a society or enterprise and the services and facilities necessary to function, such as roads, pedestrian and bicycle systems, water supply, sanitary and storm sewers, public transit, airports, railroads, public buildings and facilities, solid waste collection, power supply and telecommunications.
Priorities
1. Create and maintain intra-City transportation.transportation systems consistent with Complete Streets policies to support mobility needs of present and future residents, businesses, and visitors within the City of Phoenix.
2. Establish and enhance inter-City transportation.transportation systems to support economic growth, population growth, and competitiveness through connectivity to regional, national, and global destinations.
3. Develop and operate public utilities.affordable water, wastewater, stormwater, and garbage and diversion (recycling, reducing, reusing) services.
4. Construct and manage public facilities.aesthetically pleasing public facilities for delivery of municipal services to residents and visitors; build, maintain, and manage capital assets to preserve long-term investment and ensure uninterrupted support services.
12

INNOVATION AND EFFICIENCYThe City of Phoenix must further enhance its commitment to developing new and creative service delivery methods to provide services to residents. The City must also remain dedicated to developing and seeking continuous improvements in
Priorities
1. An “innovation
and continues to be integrated into the way everyday business is conducted. Executives, managers, supervisors and frontline staff must embrace an attitude that questions existing business processes and practices throughout the organization, with the goal of fostering innovation through the creation and implementation of new ideas.
2. Establish and support City programs and mechanisms focused on developing and implementing tangible innovations throughout the organization.results oriented, and demonstrate investment of available means. A proven approach involves assignment of resources dedicated to producing substantial innovative changes that enhance customer service, increase productivity, reduce costs and engage employees.
3. Several obstacles can stand in the way of
perceived hindrances and, when appropriate, actively remove or facilitate working through them.
4. input and awareness.goals will boost the meaningfulness and connectedness of the achievements to the community. It is important for the
relevant input.
NEIGHBORHOODS AND LIVABILITYTo preserve healthy, vibrant, diverse and safe neighborhoods that enhance the quality of life for all Phoenix residents through neighborhood vitality, by providing a range of housing opportunities and choices, supporting quality parks and open space, and enriching its populace with a strong art and culture infrastructure, and an accessible and quality library system.
Priorities
1. In order to preserve healthy, vibrant, diverse and safe neighborhoods, the City must support neighborhood self-reliance and enhance the quality of life for all residents through community-based problem solving, neighborhood-oriented services and public/private cooperation.
2. Provide a diverse range of housing opportunities and choices to Phoenix residents.opportunities enriches the quality of life for all Phoenix residents, including low- to moderate-income families, seniors, persons with disabilities and the homeless. Providing a range of housing opportunities allows the City to continue to preserve healthy, vibrant, diverse and safe neighborhoods.
3. Ensure Phoenix residents have quality parks and open space. Partner with the community to provide a parks and recreation system that meets the needs of Phoenix residents and visitors that is convenient, accessible and diverse in programs, locations, and facilities.
4. Promote a strong arts and culture infrastructure. Continue to partner with the community to provide strong arts and culture facilities and programs to create a more beautiful and vibrant City which contributes to a better quality of life.
5. Provide accessible and quality library systems to Phoenix residents. Partner with the community to provide a library system that meets the needs of residents and visitors and is accessible, convenient and diverse in locations, programs and facilities.
13

PHOENIX TEAMAs the organization becomes leaner and continues to face increasing pressures for improved results, it becomes even more critical for a heightened connection between employees and their work, their organization, and the people they work for and with. Methods for motivating employees must be updated to keep employees engaged and retained within the organization. Additionally, traditional means of communication may no longer be adequate to convey critical information to both employees and the public.
Priorities
1.
compensation packages for government employees.
2. The City of Phoenix
Employees also recognize that they can improve their lives by taking charge of their own health and making greater use of technology to ease ever increasing work demands.
3. Establish Communications Plans to engage and inform employees and the community. The City’s recent budget challenges have made evident the necessity of providing clear, timely and accurate information to employees and the public to garner continued support for and achievement of organizational goals and continued quality services.
4. Create development opportunities that enhance the City’s standing as a high-performing organization. The City
This has resulted in a flatter organization, increases in span of control and consequently fewer promotional opportunities. Further, an increasing number of employees are leaving the City as they reach retirement eligibility. As a result, it becomes even more critical to manage and coordinate the available human resources effectively to provide leadership and ongoing quality services to the community.
5. Mobilize and leverage community partnerships and volunteer programs to enhance programs and services. The City
uncertainty. Additionally, the community has expressed interest in assisting the City in continuing to provide quality services to residents in a variety of areas.
PUBLIC SAFETYThe City of Phoenix is committed to a high level of public safety and working in partnership with the community to maintain a safe and secure City. The Public Safety Study Area includes members of and services provided by the Police Department,
departments strive to provide Phoenix with an environment of safety and security.
Priorities
1. Prevent crimes and accidents by enhancing community awareness of public safety systems and partnering with other crime prevention programs. The City provides the community with information about a variety of public safety issues including crime and accident prevention, information on the operation of the judicial system, and education on police
2. Provide public safety workers with the tools necessary to professionally meet City and regional public safety needs. Ensure that public safety workers have the training, education, equipment, facilities and other resources needed to provide a high level of service to the community.
3. Ensure timely and appropriate response. The City of Phoenix deploys public safety workers in a manner that provides a timely and appropriate response to emergencies. Response resources include those needed for routine incidents as
4. Provide strong customer service internally and externally. Every member of the community and every organization
to protect the people they serve. Every public safety worker should serve their customers with dignity and honor to develop mutual trust and respect.
5. Public safety managers and public safety workers must be responsible stewards of the funds provided by the customers to support public safety efforts.
14
SOCIAL SERVICES DELIVERYThe City of Phoenix has a long history of responding to community needs and providing services to those most in need. Building upon this foundation, the City is committed to continue seeking innovative and effective methods for delivering social services. The City will serve as a catalyst to support a full continuum of high quality services for Phoenix residents.
providing a clear vision and continued leadership, City services will be provided in tandem with other resources provided by community and faith-based organizations, as well as, other levels of government.
Priorities
1. Strengthen the safety net of social services available to protect those who are most vulnerable or in crisis. The City of Phoenix will assure those most in need have access to basic needs such as shelter and food. The City will connect the homeless, working poor, elderly, disabled and victims of violent crimes to core services needed to stabilize their lives.
2. Enhance the quality of life for low-income or at-risk individuals and families. The City of Phoenix will empower
employment and other economic resources needed to maximize their quality of life.
3. The City of Phoenix will promote rich, diverse, and innovative networks of public, community, and faith-based programs, services, and facilities to maximize the potential of every community. The City will serve as a resource and a catalyst in strengthening neighborhoods and building community capacity.
SUSTAINABILITYThe City of Phoenix is committed to securing environmental and economic livability for future generations in the region, with an emphasis on solar energy production. Phoenix has long used sustainability as a guiding principle, believing that sustainable living is critical to ensuring that the actions we take today do not compromise the ability of future generations to
current programs and future plans.
Priorities
1. Accelerate renewable energy development. The City has a long-standing commitment to resource conservation and
renewable energy development guides the City towards energy independence.
2. Enable opportunities for environmental stewardship. Environmental sustainability is best achieved by encouraging
important to implement policies, programs and practices that have a far-reaching effect on the environment.
3. Enhance sustainable land use and mobility practices. The success in sustainable land use and mobility lies in adopting
within road networks, and ensuring connectivity between pedestrian, bike, transit and road facilities.
4. Foster collaboration and communication. Empowering employees at all levels through collaborative workgroups will galvanize them to realize the City’s sustainability goals. They in turn become an example of the City’s efforts and progress to the community they serve. Communicating and celebrating the City’s accomplishments is essential to motivating employees, customers, stakeholders and the public in achieving sustainability goals.
15

16
TECHNOLOGYInformation technology is a vital part of a vibrant City government. Information technology, utilized appropriately, enables
The Phoenix Strategic Plan’s Technology Area leverages technology to drive key actions that fundamentally enhance the way Phoenix connects to information.
Priorities
1. Provide seamless customer service. A seamless customer experience is achieved when a customer interacts with both internal and external City service providers without experiencing service interruptions during the service delivery process.
2. Constant product and service innovation nurtures ideas and focuses on customer satisfaction, combines process and technology to enhance productivity and value, drives down operational costs, and supports other City strategies.
3. Turn data into information through a web-enabled City. When business data is stored in easily accessible, organization-wide repositories, the City can create opportunities to use this data to make better decisions. Internet-based information delivery and collection efforts empower the community to interact with and receive City services 24 hours a day, giving the opportunity to conduct business on-line versus waiting in line.
4. Create a shared common infrastructure. Consolidating technological infrastructure around common IT components allows improved investments on behalf of the entire City. Strategic use of technology will result in tangible cost savings
5. Enhance information security and privacy. In today’s business environment, information security and privacy form the foundation of technology projects. The City should create a comprehensive program to protect data and technology infrastructures, secure systems and assets, mitigate threats and provide a mechanism for business continuity in emergencies.

ECONOMIC DEVELOPMENT AND EDUCATION1. Business Attraction
• In May, Taiwan Semiconductor Manufacturing Company (TSMC) announced they selected Phoenix for their new U.S. advanced semiconductor factory. This will include 1,900 high wage jobs and a $12 billion investment from the company.
• Staff assisted 23 companies to locate and create 5,635 new jobs with a capital expenditure of more than $457 million and a total of 3.6 million square feet, representing a 25% increase in jobs from last year. Despite the pandemic we are at historically low vacancy rates in our industrial product.
space has been leased creating 1,571 new jobs with an average annual salary of $79,332. These new companies are expected to bring over $18.5 million in capital investment including PennyMac, ZorroSigns, SMS Assist, MakeSpace, Dataminr, FrontApp, Smead Capital, Blue Optima and Protecht.
2. Business Retention & Expansion Outreach - Twenty companies indicated they were expanding within the next 12 months, creating 4,480 new jobs at an average salary of $54,243, with a capital investment of more than $519 million and a total of 1.5 million square feet. Examples of expansions include: Freestar, LLC, Honeywell Aerospace, and Industrial Metal Supply.
3. Emergence of Food System Entrepreneurship and Innovation - In partnership with the Public Works Department, Parks
as Arizona Fresh is moving forward with a food innovation, education, distribution facility and a new City park amenity. Arizona Fresh projects to create 1,500 jobs, incur a capital expenditure of $200 million and create $848 million in annual economic output.
4. Arena Renovation - Nearly $150 million of improvements have been implemented, employing more than 2,800 people,
including a reimagined entry pavilion and guest experience. All 17,000 seats have been replaced and fans will enjoy improved technology, from upgraded Wi-Fi to visually stunning LED displays. The project has achieved a better than 75% waste diversion rate.
5. Global Biorisk Advisory Council STAR Accreditation - In 2020, the Phoenix Convention Center (PCC) achieved the
Global Biorisk Advisory Council (GBAC) STAR accreditation. The PCC is among the few major convention centers in the
infectious disease prevention. To achieve GBAC STAR accreditation, the PCC was required to demonstrate compliance with the program's 20 core elements, which range from standard operating procedures and risk assessment strategies to personal protective equipment and emergency preparedness and response measures.
FINANCIAL EXCELLENCE1. Short-Term Debt - In June 2020, the Finance Department successfully issued short-term debt for Streets and Transit
for $200,000,000. The short-term debt was a T2050 Revolving Credit Facility Agreement (three-year term) with Bank of America to pay for costs of certain improvements to the City’s streets and public transit systems. This Revolver was issued during a time where the banks nationwide were limiting or omitting borrowing due to liquidity shortages as a result of COVID-19.
2. Senior Lien Airport Revenue - The Finance Department issued $762,535,000 of Senior Lien Airport Revenue Bonds and Refunding Bonds to pay the costs of certain improvements for the City’s aviation system. The all-in interest cost was
3. Delinquent Collections - Delinquent collections amounted to over $28 million and tax audits brought in an additional $10 million.
4. Finance Procurement - The Finance Procurement Division established a collaborative partnership for procurement from the State of Arizona to streamline procurement processes.
5. Risk Management - information has been made available on the City’s website.
17
STRATEGIC PLAN 2020-21 MAJOR ACCOMPLISHMENTS
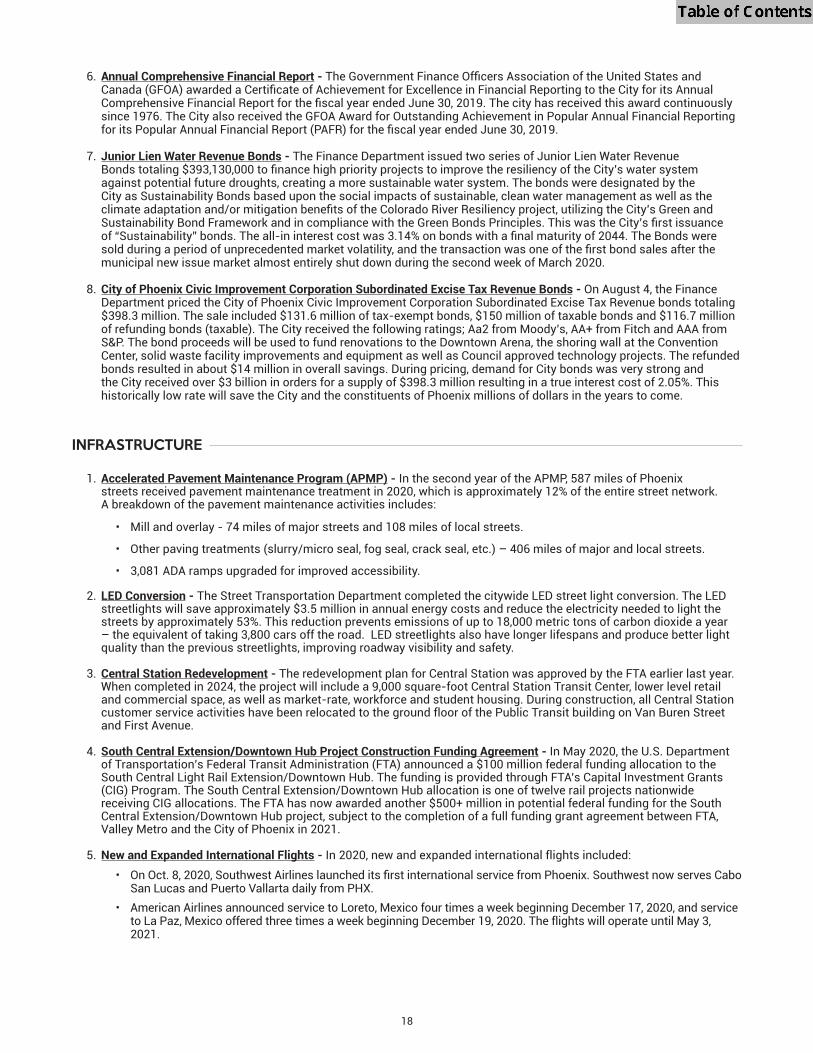
6. Annual Comprehensive Financial Report -
since 1976. The City also received the GFOA Award for Outstanding Achievement in Popular Annual Financial Reporting
7. Junior Lien Water Revenue Bonds - The Finance Department issued two series of Junior Lien Water Revenue
against potential future droughts, creating a more sustainable water system. The bonds were designated by the City as Sustainability Bonds based upon the social impacts of sustainable, clean water management as well as the
municipal new issue market almost entirely shut down during the second week of March 2020.
8. City of Phoenix Civic Improvement Corporation Subordinated Excise Tax Revenue Bonds - On August 4, the Finance Department priced the City of Phoenix Civic Improvement Corporation Subordinated Excise Tax Revenue bonds totaling $398.3 million. The sale included $131.6 million of tax-exempt bonds, $150 million of taxable bonds and $116.7 million of refunding bonds (taxable). The City received the following ratings; Aa2 from Moody’s, AA+ from Fitch and AAA from S&P. The bond proceeds will be used to fund renovations to the Downtown Arena, the shoring wall at the Convention Center, solid waste facility improvements and equipment as well as Council approved technology projects. The refunded bonds resulted in about $14 million in overall savings. During pricing, demand for City bonds was very strong and the City received over $3 billion in orders for a supply of $398.3 million resulting in a true interest cost of 2.05%. This historically low rate will save the City and the constituents of Phoenix millions of dollars in the years to come.
INFRASTRUCTURE
1. Accelerated Pavement Maintenance Program (APMP) - In the second year of the APMP, 587 miles of Phoenix streets received pavement maintenance treatment in 2020, which is approximately 12% of the entire street network. A breakdown of the pavement maintenance activities includes:
• Mill and overlay - 74 miles of major streets and 108 miles of local streets.
• Other paving treatments (slurry/micro seal, fog seal, crack seal, etc.) – 406 miles of major and local streets.
• 3,081 ADA ramps upgraded for improved accessibility.
2. LED Conversion - The Street Transportation Department completed the citywide LED street light conversion. The LED streetlights will save approximately $3.5 million in annual energy costs and reduce the electricity needed to light the streets by approximately 53%. This reduction prevents emissions of up to 18,000 metric tons of carbon dioxide a year – the equivalent of taking 3,800 cars off the road. LED streetlights also have longer lifespans and produce better light quality than the previous streetlights, improving roadway visibility and safety.
3. Central Station Redevelopment - The redevelopment plan for Central Station was approved by the FTA earlier last year. When completed in 2024, the project will include a 9,000 square-foot Central Station Transit Center, lower level retail and commercial space, as well as market-rate, workforce and student housing. During construction, all Central Station customer service activities have been relocated to the ground floor of the Public Transit building on Van Buren Street and First Avenue.
4. South Central Extension/Downtown Hub Project Construction Funding Agreement - In May 2020, the U.S. Department of Transportation’s Federal Transit Administration (FTA) announced a $100 million federal funding allocation to the South Central Light Rail Extension/Downtown Hub. The funding is provided through FTA’s Capital Investment Grants (CIG) Program. The South Central Extension/Downtown Hub allocation is one of twelve rail projects nationwide receiving CIG allocations. The FTA has now awarded another $500+ million in potential federal funding for the South Central Extension/Downtown Hub project, subject to the completion of a full funding grant agreement between FTA, Valley Metro and the City of Phoenix in 2021.
5. New and Expanded International Flights - In 2020, new and expanded international flights included:
San Lucas and Puerto Vallarta daily from PHX.• American Airlines announced service to Loreto, Mexico four times a week beginning December 17, 2020, and service
to La Paz, Mexico offered three times a week beginning December 19, 2020. The flights will operate until May 3, 2021.
18

INNOVATION AND EFFICIENCY
1. Projects Completed - In the past year, the City Auditor Department completed 71 audits and management services, with
2. Economic Impact - City Auditor Department recommendations resulted in over $6.6 million in revenue recovery and
3. - In addition to recommendations to improve management controls and reduce risk, the Audit
transparency and accountability, enhanced internal controls, reduced costs, increased revenue, and improved services.
NEIGHBORHOODS AND LIVABILITY
1. Coronavirus Relief Fund (CRF) Utility, Rent, Mortgage Assistance Program
participating agencies, launched the Coronavirus Relief Fund (CRF) Utility, Rent/ Mortgage Assistance Program, which
adapted their infrastructures and existing programs to make service delivery a priority. In 2020, these agencies provided 3,003 households with over $9.8 million in rent/mortgage assistance and over $1.9 million in utility assistance, totaling over $11.7 million in critical services to households in need.
underserved population also has access to critical services that have the potential to stabilize households in need. In 2020, these six agencies prevented 192 households from facing utility disconnection and eviction/foreclosure by providing $600,600 in rent/mortgage assistance and $80,700 in utility assistance. These agencies have successfully reinforced their infrastructures and adapted their existing programs to engage an increasing number of residents and households in this vulnerable community.
2. Youth Day Camps / Virtual Learning - On March 23, 2020, the Parks and Recreation Department began offering free
youth camps for children and dependents ages 6 to 17 of all full and part-time City employees in multiple community centers. When the 2020-21 school year began, those sites transitioned into virtual learning locations and are still being used for that purpose. Those camps have served more than 4,200 participants. On August 28, 2020, in partnership with the Housing Department, the Parks and Recreation Department began facilitating youth camps at six housing sites: Sidney P. Osborn, Luke Krohn, Aeroterra, Foothills, Vernell Coleman and Harmon Park. More than 2,200 youth have participated in activities offered as part of those camps.
3. Virtual Recreation Programs - The Parks and Recreation Department and several of its partner organizations offered a variety of free virtual programs, activities and resources to help community members of all ages stay active and engaged during the pandemic. Activities include the PHXPlays at Home Virtual Recreation series; Virtual Adaptive Recreation programs; Virtual Chats for Seniors; Virtual Speaker Series; FitPHX Virtual Fall Into Fitness, Boot Camp and Morning Yoga series; virtual activities for the PHXteens, Project BRAVE and Partners programs; virtual Park Ranger programming; Pueblo Grande Museum virtual storytelling and enrichment activities; self-guiding codePHX resources; the Camp Colley Virtual Environmental Learning Program; and Daring Adventures Virtual Adventures series. More than 2,000 people participated in those programs. Video of the FitPHX activities was archived on the department’s YouTube channel and is available on-demand for free. Those videos have been viewed more than 4,400 times.
4. Cesar Chavez Community Center Groundbreaking - In September 2020, the Parks and Recreation Department kicked off construction of the City’s newest community center with a ceremonial groundbreaking event in Cesar Chavez Park. Construction of the $12 million, 34,000-square-foot facility is scheduled for completion in fall 2021.
5. Library Resources - On March 16, 2020 Phoenix Public Library closed all locations and book drops due to the Coronavirus pandemic. Even with an unexpected closure to in-building services and visits, Phoenix Public Library continues to be responsive while maintaining the health and responsible safety measures as a top priority for the
checked out items through June 30 and communicated with over 400,000 library cardholders as to the status of their access to library services and resources. Phoenixpubliclibrary.org remains available 24/7 and hosts approximately 470,000 visits each week, with digital customers checking out over 2,444,500 digital items, an average of more than 69,800 digital items a week. Circulation of a diverse selection of eMaterials provided through the public website
expanded and adjusted the volume and selection of their content.
19

6. Increase Solid Waste Service Levels - During this unprecedented pandemic, the Public Works Department experienced an increase in solid waste collection demand from residential customers. Recycling tonnage increased by 20%, refuse tonnage increased by 11%, and bulk trash tonnage experienced a 15% increase. Increased tonnage has been a challenge for many cities across the state and country. Where many local and national cities addressed this concern through reducing services such as bulk trash and recycling, the Public Works Department stepped up and managed to maintain continuity of services with existing resources despite the drastic increase in tonnage.
PUBLIC TEAM
1. City of Phoenix Learning Resource Library - The City of Phoenix Learning Resource Library was designed for City employees to access learning tools and resources for developing professional, personal, physical, wellness, and emotional skills. The Library helps employees and leaders navigate some of the work and life challenges they may be facing during the COVID-19 health crisis.
2. Enhancements - Due to restrictions from COVID-19, the Human Resources Department made several enhancements including electronic routing of documents for employee relations matters, electronic tuition reimbursement process, electronic approval for payroll preparation, semi-virtual Civil Service Board meetings, use of video conferencing for internal and external meetings and conversion to virtual learning including new employee orientation webinar. For required in-person training, the department created a written safety plan and discovered non-traditional training techniques that allowed employees to achieve social distancing and other COVID-19 recommendations.
3. Census 2020 - During calendar year 2020, planning and execution efforts for the 2020 Census came to fruition. In addition to continually working with regional partners through the Maricopa Association of Governments (MAG) and the U.S. Census Bureau, census staff engaged local partners in supporting outreach as community ambassadors to spread messaging and increase participation. The 2020 Census team achieved, following a national self-response rate of 67%, a City self-response rate of 66.2% resulting in the third highest self-response rate among cities of similar population.
PUBLIC SAFETY
1. COVID-19 Testing -
required by the Arizona Department of Health Services to provide this public service. Testing performed by the crime lab
2. - In July, the Phoenix Police Department shortened the release time of Critical Incident
the CIB videos are also available for release during this abbreviated period. 3. Body-Worn Cameras - The Phoenix Police Department has deployed 2,170 body-worn cameras to sworn and nonsworn
assistants, the Gang Enforcement Unit, Crisis Intervention Teams, Community Response Squads, the Downtown
academy graduates.
4. New Fire Station 62 - service delivery improvements to the surrounding community.
SOCIAL SERVICE DELIVERY
1. Bridging the Digital Divide - PHXHousing Connect Tablet Distribution - In June 2020, the Housing Department began distribution of 800 tablets with 24 months of unlimited WiFi data service to provide digital learning access to public housing households with school-aged children. These devices can be utilized as a hotspot to connect additional devices in the household to the internet. A custom image was deployed on each device providing immediate access to educational applications and website bookmarks. The devices are managed through a mobile device management software which allows the Housing Department to broadcast messages and share information electronically with residents. All program participants received a user guide which provided information on tablet and application usage, cyber safety and device care. Distribution was completed in September 2020. In October 2020, City Council approved 800 additional devices for public housing senior residents to reduce social isolation and assist them with access to online services, telemedicine and social media.
20

2. Delivering Essential Services to Residents - Providing essential services to meet the basic needs of residents in public housing was a priority for the Housing Department during the COVID-19 pandemic. Beginning in March 2020, the Housing Department shifted resources to focus on assisting these residents and from March to October, provided over 25,000 Kids Café meals to youth in public housing and over 4,700 food boxes in mobile food pantry events to ensure families had access to nutritious food. Health and wellness services were facilitated on-site to maximize access and eliminate potential transportation barriers. In total, 340 residents received onsite COVID-19 testing, 283 residents were administered the seasonal flu shot, and 265 senior residents participated in health screenings. Staff coordinated with the City’s mobile testing van to provide additional on-site testing and flu shots for hundreds of public housing
household cleaning supplies.
3. Housing Phoenix Plan - Plan, which establishes a goal of creating or preserving 50,000 homes by 2030 to address the housing shortage in
2019 with the goal of completing a housing needs assessment and establishing policy recommendations to address the City's current housing challenge. Through extensive research and community outreach, the published plan
recommends nine policy initiatives to increase the number of available and affordable housing options throughout the
and Phoenix Residential Investment Development Effort (PRIDE). Five homes will be placed in the Community Land Trust, which will ensure long-term affordable homeownership opportunities for residents. Another accomplishment includes the development of the Section 8 Landlord Incentive Program which incentivizes Phoenix landlords to sign a one-year Housing Assistance Payment (HAP) contract to make their properties available to Section 8 voucher holders.
Continuing to make progress in implementing the Housing Phoenix Plan will help the City reach the goal of creating a stronger and more vibrant Phoenix through increased housing options for all.
4. Monroe Gardens Completion - Monroe Gardens, located at 1441 E. Monroe St. in Council District 8, is a new 78-unit affordable housing community that will be completed in December 2020. This project replaces the demolished A.L. Krohn East Public Housing. Monroe Gardens converted 38 obsolete public housing units into 78 project-based Section 8 rental assistance units through the Rental Assistance Demonstration (RAD) program. The new apartment community
in the Downtown Eastlake Community.
5. Soluna Groundbreaking - of the City’s Choice Neighborhoods (CN) Implementation Grant was held on Feb. 10, 2020. In 2018, the City of Phoenix was awarded a $30 million CN Grant from the U.S. Department of Housing and Urban Development to transform the Edison-Eastlake Community into a vibrant mixed-income neighborhood, linking housing redevelopment with new amenities, upgraded infrastructure, neighborhood economic growth and social services. With this grant, Housing will redevelop 577 obsolete public housing units into 1,011 mixed-income housing units in four phases over six years.
2021.
SUSTAINABILITY
1. Heat Ready - mitigate the Urban Heat Island in Phoenix through the following initiatives:
Transportation Department to prioritize tree planting in the right-of-way in vulnerable neighborhoods. Future applications will identify streets in vulnerable communities to be targeted for development as cool corridors.
to hire a full-time electric vehicle program manager to roll out initiatives in 2020.
21

TECHNOLOGY
1. Phoenix Expands Free Wi-Fi Coverage Across the City - To ensure students and community members have free internet access, as some schools remain closed due to the global pandemic, the City of Phoenix expanded its Wi-Fi coverage outside of nearly 50 libraries, community, senior, and recreation centers to ensure all students have internet access. The Information Technology Services Department provided approximately 1.18 square miles of exterior Wi-Fi coverage, allowing residents to sit in parking lots and public areas outside of participating facilities to connect their devices daily from 8 a.m. to 9 p.m. Phoenix’s focus on digital equity ensures students have 13 hours of internet access a day to participate in distance learning and navigate online tools. Phoenix City Council approved the installation of Wi-Fi antennas on city-owned, public facilities in May funded through the Federal Coronavirus Aid, Relief, and Economic Security (CARES) Act.
2. Phoenix Residents Participate Virtually in City Council & Community Meetings - In partnership with the Phoenix City Clerk Department, the Information Technology Services Department worked with a vendor to create the ability for residents to participate virtually in City Council meetings during the global pandemic. Now, residents can electronically comment on City Council agendas, select their opinion of Support/Neutral/Oppose on an agenda item and/or electronically register to speak during a meeting. Similar virtual interactions were extended to community meetings.
3. Legacy Phone System Shut Down in 2020 - After successfully completing one of the largest IT projects the City has
multi-year $36.5 million project upgraded the data network and replaced a 30-year-old TDM-based Ericsson telephone system. The project began shutting down the old phone system on January 31, 2020.
4. Phoenix Named a 2020 ‘Top 10 Digital Cities’ Winner - The Center for Digital Government (CDG) named the City of Phoenix a Top 10 Digital Cities winner for the ‘500,000 or More Population Category’ in November. Phoenix ranked fourth in this highly competitive award, moving up one spot from last year. The 20th annual Digital Cities Survey examines the overall technology programs and plans of the City. It focuses on twelve categories ranging from aligned leadership to cybersecurity to data governance and transparency. New this year, the survey called for narratives about each city’s Covid-19 response.
22

to Phoenix residents is the cornerstone of our commitment to public service.
The City of Phoenix is committed to helping residents understand how their tax dollars are being spent and making all our processes accessible and easy to understand. As part of efforts to advance transparency and further engage citizens in helping shape the City’s budget, the City provides one of the most open and accessible budget input and adoption processes in the country. The Zero-Based Inventory of Programs budget document, implemented in 2012 in response to the Mayor and City Council’s request for a more transparent, relevant, and detailed presentation of the City’s budget, provides important context for evaluating the costs of City programs. The document is online, searchable, and has links to allow for easy navigation. The Inventory of Programs document answers many questions for residents, including the following:
• Does spending reflect my priorities?• How much of the costs to provide City services come from staff, contractual services or supplies?
• • What programs and services are provided by the City?• How much do these programs cost?• How many City staff are involved in delivering these programs?• What sources of funding are used to pay for these programs?• What services are provided by these programs and how are they being measured?
The City of Phoenix recognizes we must focus on the well-being of residents, a strong economy and a healthy environment, and embrace a full approach to sustainability. It is our responsibility to provide leadership and demonstrate our commitment
After an extensive community consultation process, the Phoenix City Council adopted seven 2050 Environmental Sustainability goals in April 2016 that articulate the community's desired long-term environmental outcomes that would
underway to identify additional short and mid-term goals and metrics to be included in the next update to the General Plan for the community's and Council's consideration. Along with environmental metrics, additional social and economic goals are being considered that would best articulate the community's desired outcomes to become a socially, economically and
1. TransportationOur goal by 2050 is to make walking, cycling, and transit commonly used and enjoyed in every Phoenix neighborhood. This goal will result in 90 percent of the population living within one-half mile of public transportation and 40 percent of the population choosing to commute by walking, biking, or using public transportation. This will be accomplished through two key actions:
a. Implementing the Transportation 2050 Plan which includes: • Tripling the amount of light rail miles to 60. • Allowing 90 percent of the population to be a 10-minute walk from transit through the expansion of routes and service frequency (and shaded bus stops). • Creating 300 miles of walkable bike paths, greenways and vibrant urban canal paths. • Encouraging walking and biking and expanding the bike share system.
b. Lowering the carbon intensity of the current transportation system by 80 percent by: • Developing 15 vibrant compact complete centers throughout the City to provide the majority of services residents need within their local community. • Encouraging environmentally friendly transportation modes and providing infrastructure for electric vehicles and low carbon fuel vehicles.
23
OUR COMMITMENT TO EXCELLENCE

2. WasteIn 2050, Phoenix will create ZERO WASTE through participation in the "Circular Economy." To move toward Zero Waste by 2050, three key actions are needed:
a. Increasing the number of products that are recyclable by incubating local businesses to capture new products from the waste stream. The City of Phoenix has established the Resource Innovation Campus at the 27th Avenue Transfer Station to support new businesses and constructed a new Compost Facility for the processing of green waste and organics which opened in June 2017.
b. Supporting the transition to a Circular Economy and encouraging the retail industry to provide products that are either 100% recyclable or able to be repurposed at end of life.
c. Expanding the current recycling program to remove commonly recycled products from the waste stream (and reducing the number of non-recyclable products from the recycle bins) through public education and awareness campaigns and new programs that increase access to recycling services for residents and businesses.
3. Water StewardshipThe 2050 goal, essentially a perpetual one, is to provide a clean and reliable 100-year supply of water. The City of Phoenix has been proactive over the last century building the necessary infrastructure and systems to provide a clean
conservation programs. The three action areas of which it has been a long-established national leader are:a. Groundwater management: Supported by the nation-leading Groundwater Act of 1983, Phoenix is a net-positive
contributor to groundwater using only of its allocation from the Colorado River and diverting the other toward groundwater recharge.
b. Wastewater Management: Phoenix recycles 89 percent of its wastewater for uses such as irrigation and cooling for the Palo Verde Nuclear Plant. Phoenix also captures methane emissions from wastewater treatment and partnered with Ninety-First Avenue Renewable Biogas, LLC to build a facility to generate renewable natural gas from the wastewater treatment for use in vehicles. The bio-gas facility opened in February 2019.
c. Water and Wastewater Innovation: Phoenix is an established leader in water innovation and was recognized for three innovative projects; the $6 million annual Colorado Water Resiliency Fund, the “Tucson-Exchange” where Phoenix stores water resources underground in Tucson to be used during low water years, and the Tres
vibrant ecosystem.
4. Building and Land UseAll new buildings will be "net-positive" in terms of energy and materials, meaning they will produce more energy than they consume. This can be accomplished through employing passive design principles, such as highly insulated wall assemblies and on-site renewable energy. This goal will apply to all new construction after 2050. Buildings exist today that already meet this standard, like those that meet the Living Building Challenge 3.0. At the community scale, the goal will be to establish 15 vibrant compact complete centers where the majority of services needed by each community are provided locally; residents will be able to live, work, and play all within walking distance.
5. Parks, Preserves, and Open SpacesMore than many cities, Phoenix residents have a strong connection to the natural eco-system around them; most
open space is enhanced through two complementary actions:a. Adding 150 miles of paths, greenways, and bikeways throughout the City, and transforming an additional 150
needed to make them widely used and enjoyed.b. Reducing urban heat-island through green-infrastructure (such as "cool roofs", permeable pavement, and
stormwater capture) as well as doubling the current tree and shade canopy to 25% by 2030. Structured shade and trees facilitate increased walking and biking, increase property values, and can be used to create great public gathering spaces in communities.
6. Clean AirBy 2050, Phoenix will achieve a level of air quality that is healthy for humans and the natural environment. This includes out performing all federal standards and achieving a visibility index of good or excellent on 90 percent of days or more. (Depending on the year, Phoenix currently achieves this good or excellent visibility rating 70%-80% of days).
7. Local Food SystemsIncrease community access to fresh and healthy food by creating a vibrant food system. Many residents live in "food deserts" where they are more than one mile from fresh and healthy food. In Phoenix, there are 43 food deserts which are more than 75 percent of the total number of food deserts in Maricopa County. Increasing neighborhood
24

access to fresh and healthy food will improve community health and reduce diet-related disease. By 2050, we want to establish a sustainable, healthy, equitable, local food system by eliminating food deserts, increasing urban agriculture,
obesity, and diet-related disease. Additionally, the City Council adopted the 2025 Food Action Plan in March 2020 to outline actions and policies, develop and enhance partnerships, to support people most impacted by food insecurity and hunger, and to achieve the goals of access to healthy food for everyone in Phoenix.
Other examples of environmental stewardship include:
• The City of Phoenix Water Services Department launched a digital education page to make learning from home convenient for everyone. The Phoenix Water Cloud page offers water conservation resources for all ages including
common household leaks and information about landscape watering. See the website at phoenix.gov/WaterCloud. In addition, the department created an interactive water calculator for residents to help better understand their water usage. At phoenix.gov/Waterservices/Usage-Calculator residents can enter information about their household and the calculator will provide their optimal monthly water usage. Resources are also available to help you conserve water and save on your bill.
• The City of Phoenix Street Transportation Department is launched a pilot study to evaluate cool pavement treatment. Asphalt collects and retains heat during the day and releases it slowly at night. Phoenix is among several cities that are experiencing the urban ‘heat island’ effect due to the retention of heat within the built environment. U.S. Environmental Protection Agency data shows the difference in nighttime temperatures in heat island areas can be as much as 22 degrees hotter than temperatures measured outside the heat island. Higher nighttime temperatures lead to more energy consumption, more greenhouse gas emissions, air pollution and other harmful effects. Cool pavement is lighter in color than traditional asphalt or other seal coatings. Cool pavement reflects back the sunlight that hits it. Because the surface reflects, rather than retains heat, cool pavement has the potential to offset rising nighttime temperatures in Phoenix. It should also help cool neighborhood areas that don’t have much shade from the sun. Cool pavement is not a paint treatment. It is a water-based asphalt sealant that is applied on top of the existing asphalt pavement. It contains no harmful chemicals and bonds with the asphalt layer underneath. Esteban Park at 32nd Street and Roeser Road was
pavement, visit phoenix.gov/streets/coolpavement.
• The City of Phoenix Water Services Department is pleased to announce that the Renewable Natural Gas (RNG) facilityat the 91st Avenue Wastewater Treatment Plant received honorable mention in the 2020 World Changing Ideas Awards,in the energy category. This facility is the largest wastewater treatment biogas-to-renewable natural gas facility of itskind in the United States. The gas is a result of the natural breakdown of organic matter in the wastewater treatmentprocess. Prior to this operation, the majority of this gas was burned off using flares. Through this new effort, 600,000cubic feet of gas will be treated annually and transferred to a nearby commercial gas pipeline, where it will be soldon the open market as green energy. The carbon neutral RNG produced at this facility offsets approximately 44,671metric tons of CO2 per year, the equivalent of taking roughly 70,452 passenger vehicles off the road for one year. TheWorld Changing Ideas Awards showcased how some of the world’s most inventive entrepreneurs and companies areaddressing grave global challenges.
• The Phoenix City Council recently approved the implementation of a 6-month pilot program that will allow Phoenixsolid waste customers to schedule a home pickup of their household hazardous waste (HHW) materials beginningmid-January 2021.The HHW Home Pickup Pilot Program will be managed by the Phoenix Public Works Departmentin partnership with Kay Environmental Services, a local company that offers professional collection and handling ofhazardous waste materials. Public Works is responsible for the proper collection, diversion and disposal of trash andrecyclable materials from more than 400,000 Phoenix residential customers. This home pickup program makes it easyfor residents to properly dispose of hazardous materials, including things like batteries and paint. It is expected this
• The City of Phoenix once again earned the Bronze-level award as a Bicycle Friendly Community for its commitment tomaking the City a better, safer place to bicycle. The League of American Bicyclists’ Bicycle Friendly America programsets standards for how communities build and mark progress toward safer and better bicycling options. The Bronzelevel award recognizes Phoenix’s commitment to improving conditions for all people who bike, through investments inbicycle infrastructure, bicycle education, adult and youth bicycle safety programs and events like Bike-to-Work-Day.Phoenix joins 482 communities across the country in the pursuit of safer streets and better bicycling for everyone.Phoenix currently has 1,062 bike lane miles with that number continuously growing. With support from the Mayor and
Program as part of our commitment to improving safety and active transportation options citywide.
25

26
• The Phoenix Parks and Recreation Department’s recent renovation of Piestewa Peak Trailhead was honored with the Natural Resources Award during the Arizona Parks and Recreation Association’s (APRA) Best of the Best Virtual
Phoenix Mountains Preserve, which started in 2017, and is funded by the voter-approved Phoenix Parks and Preserve
an additional 22 parking spaces for what is one of the City's most popular hiking destinations. Trail users can also now
station, four new ramadas and two renovated ramadas, as well as improved sidewalks, curbing, lighting and signage. Additionally, a new 60-foot-tall concrete and steel entry monument was constructed to greet visitors as they enter the trailhead. The Phoenix Mountains Preserve is located within the ancestral homeland of what is today represented by the Tohono O'odham Nation, Gila River Indian, Ak-Chin Indian and Salt River Pima Maricopa Indian communities.
management.
• Tree and Shade Master Plan - The Tree and Shade Master Plan provides a roadmap to creating a 21st Century desert city. The urban forest is a keystone to creating a sustainable city because it solves many problems with one single solution. By investing in trees and the urban forest, the City can reduce its carbon footprint, decrease energy costs, reduce storm water runoff, increase biodiversity, address the urban heat island effect, clean the air, and increase property values. In addition, trees can help to create walkable streets and vibrant pedestrian places. More trees will not solve all the problems, but it is known that for every dollar invested in the urban forest results in an impressive return of
1. Raise Awareness by:• Establishing partnerships.• Educating the public and staff through programs, publicity and media.• Leading by example - In 2018-19 City Council approved funding of $450,000 annually to improve tree
replacement in the right-of-way. For 2021-22 City Council approved funding for the Cool Corridors Program to plant 1,800 trees annually in the right-of-way.
2. Preserve, Protect, and Increase by: • Creating an Urban Forest Infrastructure Team.
• Conducting a tree inventory for city-owned facilities and rights-of-way.• Developing and adopting best management practices.• Researching and developing dedicated revenue streams to purchase trees.
3. Sustain Maintainable Infrastructure by reviewing City ordinances to possibly include: • Engineered shade standards. • Streamlined permitting for engineered shade. • Tree permitting. • Tree protection on construction sites. • Incentives and alternatives. • Planting and irrigation standards. • Landscaping standards based on the concepts of right tree, right place.

The City’s commitment to maintaining a highly trained and well-educated workforce is imperative to achieving the maximum contribution a workforce can provide to the customers they serve. In addition to the community’s recognition of a job well done, the City and its employees have also been recognized by a variety of professional organizations for its continuous
• The City of Phoenix recently was named the 2020 Gold Winner in the category of Best Government Response-Helping People and Businesses During COVID-19 by Public Relations World Awards (PRWA). This award recognizes outstanding work in agency and in-house public relations, corporate communications, marketing and investor relations from around the world. Because of the pandemic, PRWA created the new category to honor the contributions of individuals, teams and organizations that have demonstrated creativity, resourcefulness and innovative thinking to assist the
pandemic. We stepped up to provide accessible, no-cost testing to every resident with help from community partners and local healthcare providers,” said Phoenix Mayor Kate Gallego. Phoenix partnered with several local healthcare providers to deliver free drive-thru COVID-19 testing at various city-owned parks. Even in the middle of Phoenix's summer season, the drive-thru sites were flocked by hundreds of vehicles, which captured the national media's attention. In August, City leaders saw an additional need to bring COVID-19 testing at no cost to the underserved communities of Phoenix. They conceptualized a mobile unit that could bring the testing to community members experiencing various challenges that prevent them from getting to a testing site--transportation, language barriers, health and personal reasons. A multi-departmental collaboration resulted in the COVID-19 Mobile Testing Van, which currently is managed and operated by the City's medical partner, Vincere Cancer Center. Phoenix Public Works' Fleet Services division procured the cargo van and customized it to the medical staff's needs, while Phoenix Communications
administered more than 17,000 tests at 55 different locations since its launch in mid-August. For the drive-thru testing, 75 events have been held in city-owned parks, as well as schools and churches. The drive-thru tests have provided more than 12,000 tests to individuals ages 6 months and above.
• The City of Phoenix was recently honored with a Distinguished Budget Presentation Award by the Government Finance
through a peer-review process. The GFOA gives the Distinguished Budget Presentation Award to government organizations that most effectively present their budget information according to nationally recognized guidelines. This
a communications tool, and are clear to understand and encourage budget transparency.
• The City of Phoenix earned a perfect score of 100 on the 2020 Human Rights Campaign (HRC) Municipal Equality Index for the seventh year in a row for its ongoing efforts to ensure equal treatment of members of the lesbian, gay, bisexual and transgender community. The HRC uses the Municipal Equality Index score to examine how inclusive municipal
perfect score since the passage of the City’s anti-discrimination ordinance in 2012. The ordinance makes it unlawful to discriminate against someone based on sexual orientation, gender, identity or disability for the purpose of employment, public accommodations, housing, and government contracts.
• The City of Phoenix's Human Services Department director, Marchelle Franklin, was named one of the AZ Business magazine's Most Influential Women in Arizona Business for 2020. As one of only 50 Arizona women to receive this honor, Franklin was recognized for her 18 years of public service and her mission and commitment to meet the needs of at-risk residents. Franklin manages a $95 million budget and leads over 375 employees as the Human Services Director. She joined the City of Phoenix in 2002 and prior to her current role, served as director of the Phoenix Police Department Community Affairs division, deputy director for community development and government relations at Phoenix Sky Harbor International Airport and separate roles as chief of staff for the Mayor and City Council. “It is an honor and a testament to Marchelle's hard work and commitment that she is recognized by AZ Business magazine for contributions she makes to the community," Phoenix City Manager Ed Zuercher said. “During her two decades with the City, Marchelle's career embodies passion for people and the impact that better systems and structures have on our residents' quality of life." Before transitioning to municipal work, Franklin spent nearly 15 years in the private sector working in human resources management. In addition to her role as a member of the Board of Directors at the Fiesta Bowl, Franklin also serves as Board Secretary for The Desert Pearls Foundation, Inc.
• City of Phoenix Director of Golf, Greg Leicht, was honored as the Southwest PGA Golf Professional of the Year. This is the highest annual award bestowed by the Southwest PGA on a PGA Professional. Leicht is the 46th recipient of the award. The Professional of the Year award is given to those who have great leadership qualities, strong moral character and a substantial record of service. Leicht has served as the City's director of golf since 2018 and oversees the operation of its eight municipal courses. During his tenure, he's directed a variety of upgrades to those facilities, including renovated and re-branded restaurants that opened in 2019. Those improvements contributed to a 12.5
Management and has worked at number of courses around the Phoenix metro area, including the TPC Scottsdale, The Phoenician and Vistal Golf Club. While at Vistal, Leicht hosted the Special Olympics State Golf Championships for 12 years and continues to be heavily involved with that event.
27

• Ed Faron, Accredited Airport Executive, Manager of the Phoenix Deer Valley Airport, was named 2020 Airport Executive of the Year by the Arizona Airports Association. Mr. Faron has been with the City of Phoenix for 18 years, the last six as airport manager for Phoenix Deer Valley, which is the busiest general aviation airport in the country. He works tirelessly to advocate for the growth and development of Deer Valley Airport and for aviation in Arizona as a whole. A pilot himself, Ed’s deep passion for general aviation allows him to run a seamless operation and advocate for pilots, tenants, and stakeholders throughout the state of Arizona.
The City’s Mission and Vision statements continue to serve as a common source of motivation for City of Phoenix employees to do all that they can to make Phoenix better.
CITY OF PHOENIX MISSION STATEMENT
CITY OF PHOENIX VISION STATEMENT We will make Phoenix a great place to live, work and visit by fostering a dynamic and sustainable environment with exceptional public services.
CITY OF PHOENIX VALUES STATEMENTS We are committed to excellence through:
1. Exceptional Customer Service We exist to provide responsive and consistent customer service to the community and to City employees. We exhibit empathy by listening to each other and to the public in our efforts to deliver services that improve people's lives.
2. Integrity and Transparency We safeguard the public trust through honest business practices and open communication. Our credibility with the public depends on our strong ethical stewardship of all resources.
3. Respect for Diversity We recognize and respect the differences that make us unique. We embrace diversity in everything we do to create a healthy and productive community and workplace.
4. Personal Empowerment We trust our employees to always own the problem and solution in addressing business challenges. We value and invest in the growth and development of our employees.
5. Engaged Teamwork We engage employees and the public in productive and respectful dialogue. Our success hinges on dynamic and interdependent partnerships. We achieve our highest performance by working together.
6. Consistent Professionalism
7. Creativity and Innovation for Excellent Results We promote an environment of inventive thinking and imaginative solutions to community needs. We encourage a spirit of continuous improvement in all our activities to exceed community expectations.
Not only do City of Phoenix employees follow these guiding principles in their workplace, they show they care about the
Service Fund Drive. The Community Service Fund Drive (CSFD) has provided City employees with the ability to pool their charitable giving dollars together resulting in the donation of millions of dollars to worthwhile health, human service, environmental and conservation organizations.
Our workplace partners - Valley of the Sun United Way (VSUW) and the Environment Fund of Arizona (EFAZ) - help us offer employees plenty of choices for employee giving. Since the campaign began in 1980, employees have raised more than
organizations in Arizona, with the majority of those providing services in Maricopa County. This year, employees raised more than $620,000 during the City’s “Activate Change” Valley of the Sun United Way campaign.
28
City of Phoenix employee organizations and departments coordinate various fund-raising events to assist communities in need both locally and globally. In addition, City employees volunteer in the community with many organizations serving youth, homeless, disadvantaged, marginalized and other areas of need.
The following are a few public service successes, large and small, that improved the quality of life for residents, businesses and visitors.
• In February 2021, the City of Phoenix and Local First Arizona Foundation won an award for the Feed Phoenix Initiative from the Arizona Recycling Coalition. The organization recognized the contribution that the Feed Phoenix Initiative has made to feeding COVID-19 impacted individuals and families in our most vulnerable communities. The initiative is providing food and helping to preserve small businesses and jobs. Produce from local farmers is purchased for use in healthy, culturally appropriate meals that are being prepared by local restaurants and caterers and delivered to social service organizations serving people impacted by the pandemic and living in food deserts. To date, about 65,000 meals and nearly 3,000 CSA (community-supported agriculture) shares have been delivered by 8 farms and 45 restaurants/caterers to 17 organizations in Phoenix.
• The City of Phoenix continues to maintain its streets more than ever before. The hottest summer on record and a global pandemic did not slow street maintenance crews and contractors who successfully completed the City's busiest
quickly and in a more convenient way. Every year since its implementation in 2018, Phoenix's Accelerated Pavement Maintenance Program has broken records, and 2020 was busy, with approximately 130 more miles of streets treated than in 2019. Approximately 590 miles of Phoenix streets received pavement maintenance treatment in 2020 – about
than smooth roads to Phoenix. People walking and riding bicycles will also notice improvements. A freshly paved street is a blank canvas – Street Transportation staff examine each roadway for opportunities to improve safety and bicycle connectivity. More than 40 miles of new bicycle lanes were installed and approximately 30 miles of bicycle lanes were
most current ADA standards through the 2020 pavement maintenance program.
• The City of Phoenix made available to the public a new customer experience, myPHX311. Customers will have access to a new mobile app and web portal to access their City services account, pay their bill, request service for their home or submit requests for issues in the community. The app will be available for both Apple and Android devices. The web portal will replace the current “Phoenix at Your Service” web page. Users on that page will also be able to interact with a
interaction. One of the robust features of this new service will be the virtual assistant or “chat bot.” A chat bot allows the user to “talk” via typing to a virtual customer service agent to help them with their needs.
GOOD WORK MATTERS!
Good work continues to matter here at the City of Phoenix. With roughly 15,000 employees who work around-the-clock, what we do makes a difference 24/7. Sometimes it’s truly ‘the little things’ that make the biggest impact to our customers. Here are a few examples of good work that make Phoenix a great city.
• Matt Davis, an Environmental Specialist with the City of Phoenix Public Works Department, was waiting for the light to turn green at the intersection of Camelback Road and 83rd Avenue, when a vehicle traveling south on 83rd Avenue immediately caught his attention. The vehicle ran through a red light, headed straight to the sidewalk and eventually
beacon lights of his work vehicle, parked, and approached the vehicle. The female driver was having severe seizures and was convulsing and had a three-month old child in the vehicle. Matt wasted no time in calling 911 for immediate help. Right after calling 911, the driver of the vehicle slowly gained consciousness, after Matt was assured the woman
show any signs of injury, and seemed unfazed by the whole incident. Matt waited with the driver and child a few more minutes until the Fire Department arrived on the scene.
• Phoenix resident, Ann Barnett, has been routinely impressed by the punctuality and service provided by two of our Solid Waste Equipment Operators (SWEOs), the men and women who collect trash and recycling daily. Amidst all the chaos this year with the pandemic, Barnett wrote, “They never missed a scheduled service, time or date . . .." She added, “I could set my alarm clock by them if I needed to", and she is absolutely right! Phoenix's SWEOs have been showing up and showing out for their City, during these uncertain times. Lucas Coleman, an 8-year vet with the Public Works Department explains, “We are expected to provide an essential service that everybody needs, and we want to
29
30
provide exceptional customer service for our residents." Coleman works Barnett's route in west Phoenix and said at the beginning of the pandemic, “thank you" signs attached to solid waste containers were common. In response to receiving compliments and praise from residents, Coleman plays it cool. “That's the stuff that means something, it makes you feel like people truly appreciate what we are doing out here," he said. The pandemic has not been easy on SWEOs. As more and more people were advised to stay home, Phoenix saw sizeable increases in solid waste tonnage this year—20% increase in trash and recycling and 15% increase in bulk trash collection. The increase in material has extended workdays and sometimes forced crews to work into the weekends. These essential workers are heroes to the residents of Phoenix, but for Coleman, who shares the same sentiment as his colleagues, “It's just an everyday job." As for Barnett, she wants to make sure our SWEOs get the credit they deserve. “(SWEOs) are as essential as police and
• Early Monday morning, just before 7 a.m., Solid Waste Equipment Operator Blaine Freeman, a recycling truck driver,
Freeman was working his recycling route, he noticed smoke a few blocks away and decided to head that direction
alongside other residents, proceeded to knock on doors without hesitation to make sure family members were out of
equipment operator with the Phoenix Public Works Department, has more than 12 years of experience as a collection truck driver. He has been the recycling driver for the area near Jomax and the I-17 and for six years now and has gotten familiar with the characteristics of the neighborhood. He views his job as more than just collecting waste and/
employee”.
• This year, Phoenix Planning and Development Department staff used “Building Safety Month” as the platform to launch a community project that will continue for most of the summer to repair and rebuild a Phoenix woman’s home after
went unrepaired for months as the expenses were too much for Mary to afford. Planning and Development Department Field Supervisor, Don Councilor, learned of Mary’s situation and launched the effort to gather contractors to rally around her to donate their services and materials to get the critical repairs completed before the extreme Arizona heat sets in. The response was above and beyond and within days of this project starting, Mary’s electricity was restored. Now, the roof has been replaced, the bathroom shower has been retiled, the ceiling repaired, air conditioning was installed, smoke detectors have been installed and all life-safety measures are in working order. “We are seeing contractors that normally compete with each other coming together for this cause,” said Don Councilor. “I knew people in the industry would respond but they went above and beyond.” “It is so wonderful,” said Mary Chavez. “They are doing so much. I’m very thankful”.
• The City of Phoenix Aviation Department earned recognition as a GBAC STAR™ Facility Accreditation Program. Phoenix Sky Harbor, Phoenix Deer Valley and Phoenix Goodyear airports have all received this accreditation. “To receive this distinction is a testament to the Aviation staff’s commitment to making sure travelers, operators, airlines, concessionaires, tenants and business partners have the safest environment possible when interacting with us" said Phoenix Mayor Kate Gallego. The Global Biorisk Advisory Council's GBAC STAR™ facility accreditation program is an outbreak prevention, response, and recovery accreditation for facilities. It represents a high level of achievement within the cleaning industry, including 20 components that a facility must meet to achieve this accreditation. Facilities must demonstrate that they have established and maintained a cleaning and disinfecting program to minimize risks of infectious diseases; have employed the proper protocols to clean and disinfect facilities; and have staff who are trained for outbreak and infectious disease preparation and response. Earning the GBAC STAR™ accreditation is the gold standard in a performance-based program, and it demonstrates commitment to safety and preparedness. Throughout the COVID-19 pandemic, Phoenix Sky Harbor, Phoenix Deer Valley, and Phoenix Goodyear airports have employed a number of initiatives to ensure a safe, welcoming and healthy environment for those coming through the airports. Phoenix Sky Harbor, Deer Valley and Goodyear airports continue to provide world-class safe, clean facilities and service to our customers.
As you can see, we work very hard to earn our reputation as a well-run city. We strive to be leaders in our professions. Each day the values of our organization – what we call our “Mission and Vision” – are at the core of everything we do.

31

32
PHOENIX GROWTH

Phoenix was founded in 1870 as an agricultural community and was incorporated as a city in 1881. The original City charter was adopted in 1913 and has been amended by Phoenix voters from time to time since then. The charter allows Phoenix to determine its governmental structure and levy revenue and privilege license taxes. A council-manager form of government was also adopted in 1913. Under this organizational structure, the Mayor and Council appoint a city manager to act as the
for electing council members. These residents were concerned that at-large elections resulted in an organization that was less responsive to neighborhoods. The initiative was passed by the voters of Phoenix, and the number of council seats was increased from six to eight. The mayor continued to be elected at-large.
ECONOMIC DIVERSITYPhoenix has grown steadily, especially since 1950. The 1900 Census recorded Phoenix‘s population at 5,544. In 1950, the City occupied 17 square miles with a population of almost 107,000, ranking it 99th among American cities. The 2010 Census recorded Phoenix population at 1,447,128. The City currently encompasses 519.8 square miles.
area encompassed by Maricopa County. This metropolitan area also includes the Cities of Mesa, Glendale, Tempe, Scottsdale, Chandler, Peoria, Surprise, Goodyear, Avondale, El Mirage, Tolleson and the Towns of Gilbert and Buckeye. It is situated 1,117 feet above sea level in the semi-arid Salt River Valley. The area is widely known for its mild, sunny winters and hot summers and receives an average rainfall of seven inches a year.
States average due to historical rapid population and employment growth. Additionally, the Phoenix area’s manufacturing mix is much more concentrated in high technology than the United States. The high technology manufacturing sectors are cyclical in nature and may be more impacted during periods of economic slowing than other manufacturing sectors. The primary employment sectors and their share of total employment in the Phoenix metropolitan area consist of service
employers of the Phoenix metropolitan area include Banner Health, State of Arizona, Wal-Mart Inc., Fry’s Food Stores, Wells Fargo & Company, Maricopa County, City of Phoenix, Intel Corp., Arizona State University and JPMorgan Chase and Co. The top ten property taxpayers, based on secondary assessed valuation, are Arizona Public Service Company, Southwest Gas Corporation, CenturyLink Inc., Host Camelback I L.L.C., Host Kierland L.P., Esplanade Owner L.P., Phoenix Plaza P.T. L.L.C., Target Corporation, Epic Apollo L.L.C. and the United Services Automobile Association. These taxpayers make up 5.9 percent of total assessed valuation.
33
COMMUNITY PROFILE AND TRENDS
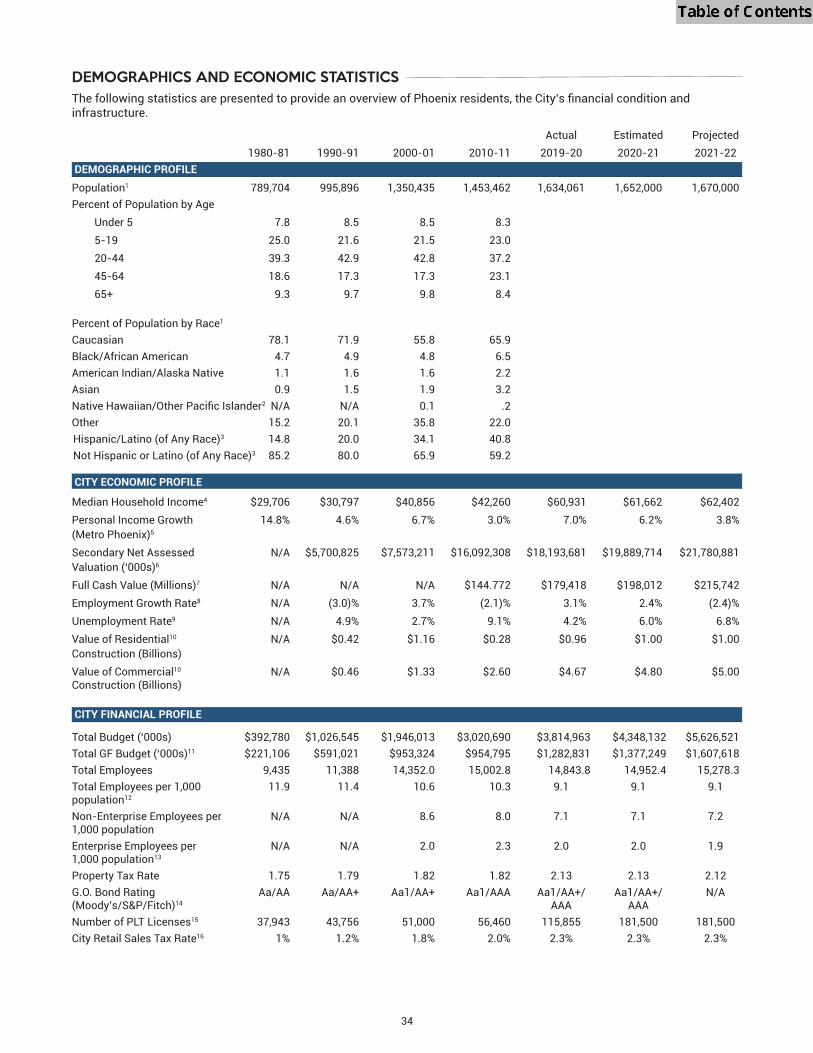
Actual Estimated Projected 1980-81 1990-91 2000-01 2010-11 2019-20 2020-21 2021-22 DEMOGRAPHIC PROFILE
Population1 789,704 995,896 1,350,435 1,453,462 1,634,061 1,652,000 1,670,000Percent of Population by Age
Under 5 7.8 8.5 8.5 8.35-19 25.0 21.6 21.5 23.020-44 39.3 42.9 42.8 37.245-64 18.6 17.3 17.3 23.165+ 9.3 9.7 9.8 8.4
Percent of Population by Race1 Caucasian 78.1 71.9 55.8 65.9Black/African American 4.7 4.9 4.8 6.5American Indian/Alaska Native 1.1 1.6 1.6 2.2Asian 0.9 1.5 1.9 3.2
2 N/A N/A 0.1 .2Other 15.2 20.1 35.8 22.0 Hispanic/Latino (of Any Race)3 14.8 20.0 34.1 40.8 Not Hispanic or Latino (of Any Race)3 85.2 80.0 65.9 59.2 CITY ECONOMIC PROFILE
Median Household Income4 $29,706 $30,797 $40,856 $42,260 $60,931 $61,662 $62,402Personal Income Growth 14.8% 4.6% 6.7% 3.0% 7.0% 6.2% 3.8% (Metro Phoenix)5
Secondary Net Assessed N/A $5,700,825 $7,573,211 $16,092,308 $18,193,681 $19,889,714 $21,780,881 Valuation (‘000s)6
Full Cash Value (Millions)7 N/A N/A N/A $144.772 $179,418 $198,012 $215,742Employment Growth Rate8 N/A (3.0)% 3.7% (2.1)% 3.1% 2.4% (2.4)%Unemployment Rate9 N/A 4.9% 2.7% 9.1% 4.2% 6.0% 6.8%Value of Residential10 N/A $0.42 $1.16 $0.28 $0.96 $1.00 $1.00 Construction (Billions)Value of Commercial10 N/A $0.46 $1.33 $2.60 $4.67 $4.80 $5.00 Construction (Billions) CITY FINANCIAL PROFILE
Total Budget (‘000s) $392,780 $1,026,545 $1,946,013 $3,020,690 $3,814,963 $4,348,132 $5,626,521Total GF Budget (‘000s)11 $221,106 $591,021 $953,324 $954,795 $1,282,831 $1,377,249 $1,607,618Total Employees 9,435 11,388 14,352.0 15,002.8 14,843.8 14,952.4 15,278.3Total Employees per 1,000 11.9 11.4 10.6 10.3 9.1 9.1 9.1 population12
Non-Enterprise Employees per N/A N/A 8.6 8.0 7.1 7.1 7.2 1,000 populationEnterprise Employees per N/A N/A 2.0 2.3 2.0 2.0 1.9 1,000 population13
Property Tax Rate 1.75 1.79 1.82 1.82 2.13 2.13 2.12G.O. Bond Rating Aa/AA Aa/AA+ Aa1/AA+ Aa1/AAA Aa1/AA+/ Aa1/AA+/ N/A (Moody’s/S&P/Fitch)14 AAA AAANumber of PLT Licenses15 37,943 43,756 51,000 56,460 115,855 181,500 181,500City Retail Sales Tax Rate16 1% 1.2% 1.8% 2.0% 2.3% 2.3% 2.3%
34
DEMOGRAPHICS AND ECONOMIC STATISTICS
infrastructure.

35
1
City’s 2010 Census population count which in turn affected the preceding years’ population estimates. The preceding years also include additional population estimate adjustments approved by Maricopa Association of Governments.
2
was included in the Asian category. 3 Hispanic/Latino of any race is included in the Census’ “Other” race category for 1980-81, 1990-91, 2000-01 and 2010-11. 4 Median Household Income is based on U.S. Census Bureau data for the City of Phoenix geographic area. For the estimate and projection years, the Calendar
Year (CY) 2020 greater Phoenix Consumer Price Index (CPI) of 1.2% was applied to the U.S. Census Bureau’s (FactFinder) 2019 American Community Survey 1-year estimates for City of Phoenix Median Household income. The reported data is from March 2021.
Actual Estimated Projected 1980-81 1990-91 2000-01 2010-11 2019-20 2020-21 2021-22 INFRASTRUCTURE PROFILE
Area (Square Miles) 329.1 427.1 483.5 519.1 519.7 519.7 519.8 Police
Major Crimes17 86,287 110,961 97,666 70,108 66,908 65,600 65,300Dispatched Calls for Service18 452,350 895,117 862,769 666,116 681,230 657,000 659,500
19 1,694 2,047 2,810 3,281 3,274 3,271 3,271Fire
Fire Stations 35 45 45 57 59 59 59Fires and All Other Calls 25,162 26,281 28,369 19,335 25,311 27,300 24,700Emergency Medical Calls 46,122 75,112 101,396 136,163 187,378 187,700 182,500
19 838 1,042 1,315 1,661 1,695 1,723 1,722Building Inspections
Total Number of Inspections20 196,356 176,909 261,184 131,600 272,514 266,200 270,000Streets
Total Miles21 3,084 3,800 4,299 4,825 4,872 4,849 4,849Miles Resurfaced and Sealed22 216 250 220 127 559 740 288Total Miles of Bikeway23 N/A 250 472 615 1,474 1,514 1,531
Signalized Intersections 555 761 906 1,092 1,152 1,165 1,180Street Lights24 39,097 50,825 70,750 89,826 94,562 100,562 108,746
25 28,129 28,414 36,500 22,742 31,397 30,853 30,949Aviation
Passengers Arriving and 6,500,000 22,175,000 35,900,000 40,500,000 34,725,551 21,898,000 20,000,000 Departing
Solid Waste Collection Residences Served26 281,900 281,392 327,953 392,825 411,814 415,500 419,300Tons Disposed at City 379,000 513,643 1,051,935 1,002,346 972,267 983,600 989,500
27 Municipal Parks
Number of Municipal Parks28 137 181 199 225 232 227 231Developed Park Acres29 1,303 2,206 3,332 5,071 4,787 8,860 8,860Number of Municipally 5 5 7 6 5 5 5 Operated Golf Courses
Libraries Material Circulation30 3,691,745 5,962,411 9,151,000 13,839,543 8,528,708 6,750,000 8,000,000Total Material Stock31 1,182,606 1,732,410 2,016,000 1,643,977 3,500,000 4,000,000 4,100,000Number of Library Branches 9 11 13 16 17 17 17
Equipment Management Number of Equipment Units 4,497 4,776 6,080 7,612 7,548 7,711 7,760 in Fleet32
Water Connections33 282,048 321,996 350,967 397,390 434,023 437,495 441,870Production (billions of gallons)34 88.5 84.7 109.4 98.6 99.3 108.2 108.2Miles of Line 3,083 4,246 5,007 6,270 6,990 7,038 7,075
Wastewater Connections 250,199 311,980 327,051 389,978 417,346 420,685 424,892Miles of Line 3,040 3,661 4,174 4,980 4,933 4,952 4,972
5 Personal income growth percentage is from University of Arizona’s “Economic Outlook” quarterly publication (University of Arizona Economic and Business Research Center), which reflects estimated impacts to personal income growth from COVID-19.
6 Following the 2012 voter approval of the Arizona Property Tax Assessed Valuation Amendment (Proposition 117), and A.Z. Const. art. IX, § 18(3), Secondary (Full Cash) Net Assessed Valuation is no longer used for purposes of calculating Secondary Property Taxes. The City continues to report Secondary Net Assessed Valuation here for continuity with previous reports.
7
Value formulas, assessment ratios and exemptions. Prior to 2015-16, trends in Full Cash Value correlated to trends in the City's Secondary Property Tax Base; however, this correlation no longer applies. Reported values lag market conditions by approximately 18 to 24 months.
8
Scottsdale Statistical Area (MSA) and is obtained from the United States Department of Labor – Bureau of Labor and Statistics website: www.bls.gov. The reported data is from March 2021 and does account for impacts to employment growth from COVID-19.
9 Unemployment rate is reported monthly by the US Bureau of Labor Statistics website: www.bls.gov (LAU – Local Area Unemployment searchable databases)
reported data is from March 2021 and does account for impacts to the unemployment rate from COVID-19. 10 These measures represent the annual estimated value of projects permitted by the City of Phoenix (new construction and remodels).11 As of 1998-99, Arizona Highway User Revenue funds are no longer included in the General Fund total.12 A correction was made to the calculation of City employees per 1,000 population for 1980-81 and 1990-91. Previous budget books did not adjust for Census
data that was published at least a year after the statistic was recorded in budget documents. 13 Enterprise departments include Water, Wastewater, Aviation, Phoenix Convention Center and Solid Waste Management.14 The ratings listed in the estimated 2020-21 are the City’s rating at the time of publication. No attempt has been made to project the City’s ratings.15 As of January 1, 2017, the City of Phoenix no longer has administrative and collection duties over the management of Transaction Privilege (Sales) and Use
Tax Licenses (TPT) accounts. This process is administrated by the State of Arizona. Previously, the City allowed businesses to report multiple locations or entities under one license; that is no longer the policy under the State. Although the Arizona Department of Revenue assumed these duties in 2017, it is expected that the State remits the same approximate amount of annual license fee revenues for the same approximate number of (TPT) accounts that have privilege tax liability within the City of Phoenix limits.
16 Voters approved a 0.3 percent increase in most city sales tax categories effective January 1, 2016 to fund a comprehensive transportation plan. This was an increase to and an extension of the 0.4 percent tax that was effective June 1, 2000, resulting in a total tax of 0.7 percent for transportation with a 35-year sunset date.
17 Total violent and property crimes are based on Uniform Crime Reporting (UCR) standards, not based on Arizona Revised Statutes. Counts are based on
from 2014-15 forward. Similarly, beginning in January 2016, the aggravated assault counts include incidents that met the updated FBI aggravated assault
18 The formula that categorizes calls as dispatched was revised in 2017. Counts for 2015-16 and forward have been updated. Call data is based on actual data through April 30, 2021 and projected data for the remaining months.
19 The numbers shown represent the Council authorized sworn position count in Police and Fire. The sworn hiring target for Police is 3,125 based on projected available resources. The sworn hiring target for Fire is 1,706 based on projected available resources.
20 Includes building, electrical, mechanical, plumbing and general inspections. Decrease in 2020-21 is due to COVID-19 restrictions. 21 Total Mileage decreased due to previously reported mileage included roads no longer in Phoenix jurisdiction (New River Road).22 Miles of streets resurfaced or sealed varies year over year and is dependent on actual streets selected and distribution of wide versus narrow. It also varies
based on the method of seal used.23 City of Phoenix bicycle network consists of bicycle lanes, routes and paths. The measurement methodology of bikeways records bicycle lanes as bi-directional
because of the doubled signage and striping requirements.24 2021-22 it is anticipated that 15 new signalized intersections and 12 HAWKs will be installed.25
26 2020-21 projected service level is based on annualized 10 months of actuals data and assumptions from Business Intelligence Living Unit report (average 0.90% growth over the last 10 months). Projected households for 2021-22 are based on 0.90 growth from 2020-21 projections.
27
28 This number includes all properties except undeveloped land. 29
the new system. This number includes all flatland parks.30 Measure covers all media including: audio books, e-books, CDs, DVDs, databases, books, and periodicals. 2019-20 and 2020-21 data reflect the temporary
suspension of in-person services at all library locations in March 2020 and the availability of curbside library services that began in May 2020. 2021-22 reflects partial resumption of in-person services at all Library branches.
31
32 Includes vehicle replacements.33 Water connections have increased due to an increase in customer accounts.34 Includes water produced for City of Phoenix only.
36

37
RESOURCE AND EXPENDITURE SUMMARY
This section provides a broad overview of the resources and expenditures included in the 2021-22 budget. Information is presented for General, Special Revenue and Enterprise funds. General funds, which receive special attention by the community, are highlighted throughout this section. General funds are of importance to our residents as they provide for the
provided except for the Convention Center which has earmarked sales taxes as its primary funding source. Special Revenue funds are restricted to statutory and/or voter-approved uses.
portion of $1,607,618,000 is approximately 29 percent of the total. The Enterprise funds, which include Aviation, Water, Wastewater, Solid Waste and Convention Center, make up another 30 percent of the total. Special Revenue funds such as Arizona Highway User Revenues, grant funds such as Community Development Block Grants, Human Services grants, and Housing grants represent the remaining 41 percent of the total budget.
All Sources of Funds Total Expenditures - $5.63 Billion
Operation and Maintenance
72%
Debt Service 10%
Capital 18%
All Sources of Funds Total Resources - $5.63 Billion
Special Revenue Funds 41%
General Funds 29%
Enterprise Funds 30%
In addition to presenting the budget by funding source, the budget is also described in terms of the major types of activities or expenditures funded. Included in the operating budget are operating and maintenance expenses that provide for ongoing costs of delivering City services; capital expenditures for pay-as-you-go projects for major additions, improvements or renovations to City facilities; and debt service payments to retire outstanding debt. The pie chart above shows the distribution of the total operating budget into these three types of expenditures. Bonds and other capital funds used for capital improvement projects are included in a separate capital improvement program.
The 2021-22 General Fund budget includes ongoing operating and maintenance and pay-as-you-go capital expenses. No debt service is paid from the General Fund. Instead, debt service associated with General-funded activities is paid for with earmarked property taxes or with the City Improvement fund. Due to the restrictions on using these funds both are appropriately included in the Special Revenue funds portion of the budget.

38
*
Millions Expenditures by Department 2021-22 General Fund Budget
Finally, budgeted expenditures are provided on a departmental basis. Detailed explanations of each department’s budget are provided in the Department Program Summary section of this document. The following bar chart presents the General Fund budget on a department-by-department basis.
2021-22 Budget Compared to 2020-21 Adopted Budget (In Millions of Dollars)
2019-20 2020-21 2021-22 Actual Adopted Amount Percent Expenditures Budget Budget Change Change
Operating and Maintenance Expenditures 2,889.3 3,713.3 4,055.2 341.9 9.2% Capital Expenditures 358.6 758.9 1,022.9 264.0 34.8%Debt Service 567.1 548.2 548.4 0.2 0.0%Total 3,815.0 5,020.4 5,626.5 606.1 12.1%
The table below provides a comparison of the 2021-22 budget to the 2020-21 adopted budget. Actual expenditures for the
Overall, citywide operating and maintenance expenditures are expected to rise by $341.9 million. Most of the increase is attributable to the planned spending of the American Rescue Plan Act (ARPA) funds awarded by the federal government in its continued effort to respond to the COVID-19 pandemic. Other reasons for the growth include funding for emergency
same contracts; additional staff for programs and services; and higher contingencies. Commodity purchases are expected to increase due to the carryover of unspent Police grants and additional grant funding for Police operations equipment as well as rising costs for water treatment chemicals. Other department increases are attributed to increased funding for
Pay-as-you-go capital expenditures are expected to increase as available Transportation 2050, Wastewater and Water pay-
Debt service expenditures are expected to mostly remain consistent with 2020-21 budget levels.
$0
$100
$200
$300
$400
$500
$600
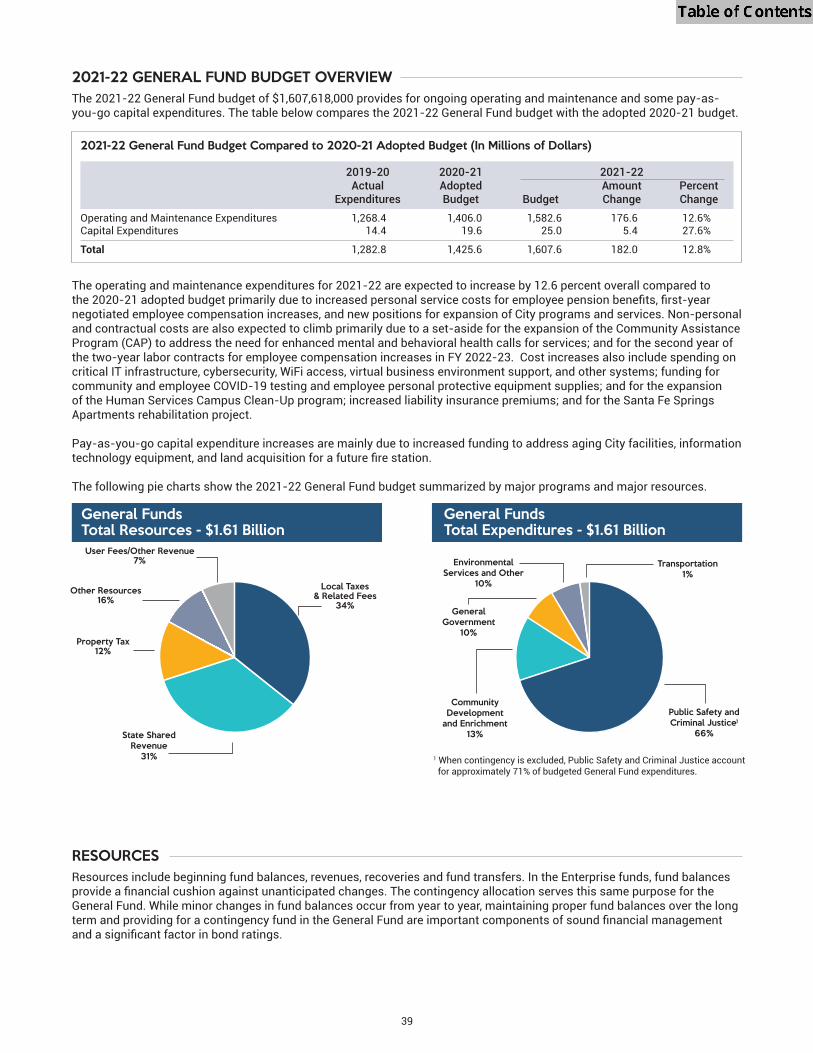
39
2021-22 GENERAL FUND BUDGET OVERVIEWThe 2021-22 General Fund budget of $1,607,618,000 provides for ongoing operating and maintenance and some pay-as-you-go capital expenditures. The table below compares the 2021-22 General Fund budget with the adopted 2020-21 budget.
2021-22 General Fund Budget Compared to 2020-21 Adopted Budget (In Millions of Dollars)
2019-20 2020-21 2021-22 Actual Adopted Amount Percent Expenditures Budget Budget Change ChangeOperating and Maintenance Expenditures 1,268.4 1,406.0 1,582.6 176.6 12.6% Capital Expenditures 14.4 19.6 25.0 5.4 27.6%
Total 1,282.8 1,425.6 1,607.6 182.0 12.8%
RESOURCESResources include beginning fund balances, revenues, recoveries and fund transfers. In the Enterprise funds, fund balances
General Fund. While minor changes in fund balances occur from year to year, maintaining proper fund balances over the long
The operating and maintenance expenditures for 2021-22 are expected to increase by 12.6 percent overall compared to
negotiated employee compensation increases, and new positions for expansion of City programs and services. Non-personal and contractual costs are also expected to climb primarily due to a set-aside for the expansion of the Community Assistance Program (CAP) to address the need for enhanced mental and behavioral health calls for services; and for the second year of the two-year labor contracts for employee compensation increases in FY 2022-23. Cost increases also include spending on critical IT infrastructure, cybersecurity, WiFi access, virtual business environment support, and other systems; funding for community and employee COVID-19 testing and employee personal protective equipment supplies; and for the expansion of the Human Services Campus Clean-Up program; increased liability insurance premiums; and for the Santa Fe Springs Apartments rehabilitation project.
Pay-as-you-go capital expenditure increases are mainly due to increased funding to address aging City facilities, information
The following pie charts show the 2021-22 General Fund budget summarized by major programs and major resources.
General FundsTotal Expenditures - $1.61 Billion
Transportation 1%
Public Safety and Criminal Justice1
66%
Community Development
and Enrichment 13%
General Government
10%
Environmental Services and Other
10%
1 When contingency is excluded, Public Safety and Criminal Justice account for approximately 71% of budgeted General Fund expenditures.
General FundsTotal Resources - $1.61 BillionUser Fees/Other Revenue
7%
Local Taxes & Related Fees
34%
State Shared Revenue
31%
Property Tax 12%
Other Resources 16%
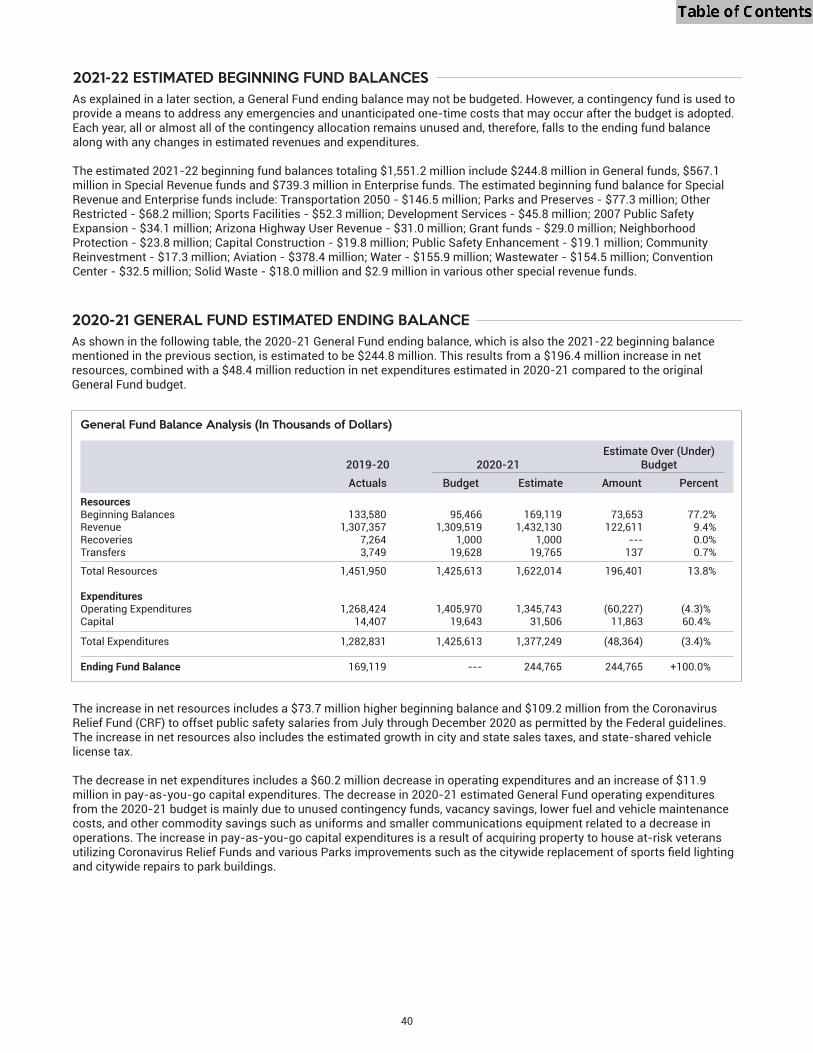
40
2020-21 GENERAL FUND ESTIMATED ENDING BALANCEAs shown in the following table, the 2020-21 General Fund ending balance, which is also the 2021-22 beginning balance mentioned in the previous section, is estimated to be $244.8 million. This results from a $196.4 million increase in net resources, combined with a $48.4 million reduction in net expenditures estimated in 2020-21 compared to the original General Fund budget.
General Fund Balance Analysis (In Thousands of Dollars)
Estimate Over (Under) 2019-20 2020-21 Budget Actuals Budget Estimate Amount PercentResources Beginning Balances 133,580 95,466 169,119 73,653 77.2%Revenue 1,307,357 1,309,519 1,432,130 122,611 9.4%Recoveries 7,264 1,000 1,000 --- 0.0%Transfers 3,749 19,628 19,765 137 0.7%
Total Resources 1,451,950 1,425,613 1,622,014 196,401 13.8% Expenditures Operating Expenditures 1,268,424 1,405,970 1,345,743 (60,227) (4.3)%Capital 14,407 19,643 31,506 11,863 60.4%
Total Expenditures 1,282,831 1,425,613 1,377,249 (48,364) (3.4)% Ending Fund Balance 169,119 --- 244,765 244,765 +100.0%
2021-22 ESTIMATED BEGINNING FUND BALANCESAs explained in a later section, a General Fund ending balance may not be budgeted. However, a contingency fund is used to provide a means to address any emergencies and unanticipated one-time costs that may occur after the budget is adopted. Each year, all or almost all of the contingency allocation remains unused and, therefore, falls to the ending fund balance along with any changes in estimated revenues and expenditures.
The estimated 2021-22 beginning fund balances totaling $1,551.2 million include $244.8 million in General funds, $567.1 million in Special Revenue funds and $739.3 million in Enterprise funds. The estimated beginning fund balance for Special Revenue and Enterprise funds include: Transportation 2050 - $146.5 million; Parks and Preserves - $77.3 million; Other Restricted - $68.2 million; Sports Facilities - $52.3 million; Development Services - $45.8 million; 2007 Public Safety Expansion - $34.1 million; Arizona Highway User Revenue - $31.0 million; Grant funds - $29.0 million; Neighborhood Protection - $23.8 million; Capital Construction - $19.8 million; Public Safety Enhancement - $19.1 million; Community Reinvestment - $17.3 million; Aviation - $378.4 million; Water - $155.9 million; Wastewater - $154.5 million; Convention Center - $32.5 million; Solid Waste - $18.0 million and $2.9 million in various other special revenue funds.
The increase in net resources includes a $73.7 million higher beginning balance and $109.2 million from the Coronavirus Relief Fund (CRF) to offset public safety salaries from July through December 2020 as permitted by the Federal guidelines. The increase in net resources also includes the estimated growth in city and state sales taxes, and state-shared vehicle license tax.
The decrease in net expenditures includes a $60.2 million decrease in operating expenditures and an increase of $11.9 million in pay-as-you-go capital expenditures. The decrease in 2020-21 estimated General Fund operating expenditures from the 2020-21 budget is mainly due to unused contingency funds, vacancy savings, lower fuel and vehicle maintenance costs, and other commodity savings such as uniforms and smaller communications equipment related to a decrease in operations. The increase in pay-as-you-go capital expenditures is a result of acquiring property to house at-risk veterans
and citywide repairs to park buildings.

General Fund revenues are estimated at $1,355,775,000 which is $76,355,000 or 5.3 percent less than the 2020-21 estimate of $1,432,130,000. The decline is primarily due to the projected decrease in state-shared income tax and the discontinuation of the one-time CRF in 2021-22.
Special Revenue Funds are projected at $1,993,618,000 which is $549,677,000 or 38.1 percent higher than the 2020-21 estimate of $1,443,941,000. The estimate for Special Revenue funds includes a $25.3 million increase in Transportation 2050 funds, an $11.7 million increase in Other Restricted revenues, an $11.1 million increase in Regional Transit funds, a $6.8 million increase in Highway User Revenue, a $5.5 million increase in Secondary Property Tax revenues, a $4.6 million increase in Sports Facilities funds, a $2.2 million increase in Parks and Preserves funds, and a $1.9 million increase in Development Services funds. Furthermore, there is a $503.8 million increase in various grant funds including Community Development, Criminal Justice, Public Transit and Other grants. Special Revenue funds also include a $9.9 million decrease in Human Services grants, a $4.0 million decrease in Public Housing grants, a $3.9 million decrease in 2007 Public Safety Expansion funds, a $2.1 million decrease in Public Safety Enhancement funds, a $1.6 million decrease in Golf Courses revenue, a $1.1 million decrease in Neighborhood Protection funds, and a combined decrease of $0.6 million in Court Awards, Capital Construction, Community Reinvestments, and Regional Wireless Cooperative revenues.
The 2021-22 estimates for Enterprise Funds include the impact of rate increases for Water and Solid Waste services, and the rideshare fees at Phoenix Sky Harbor International Airport. The projected revenue increases are offset by the revenue loss resulting from the discontinuation of the one-time COVID-19 related federal funding and lower revenue collections due to the anticipated lower water consumption in 2021-22.
2021-22 TRANSFERS TO THE GENERAL FUND
central service cost allocation or to assess in lieu property taxes.
Central service cost allocation and other transfers to the General Fund for 2021-22 total $80.1 million. This amount reflects $76.1 million to recoup central service costs and/or payments of in-lieu property taxes, the majority of which is from the Aviation, Water and Wastewater, Solid Waste, Convention Center and Development Services funds. Central service provides a repayment to the General Fund for services provided by departments such as Human Resources, Information Technology, Finance, Law and other administrative support areas that are General funded. This transfer is calculated by the Finance Department in accordance with generally accepted full-cost accounting principles and is in accordance with long-established City Council-approved policy.
Approximately $4.0 million in miscellaneous transfers from other funds is also included. As a result, total transfers to the General Fund exclusive of excise tax-related items are $80.1 million. A transfer of $970.2 million from the Excise Tax fund represents the General Fund share of local and state-shared sales taxes, fees and state-shared income taxes. However, this amount is reflected in revenues, rather than a transfer, throughout this section.
2021-22 ESTIMATED ENDING BALANCESArizona budget law requires a balanced General Fund budget. No General Fund balances may be accumulated in reserve
included for the General Fund contingency, with an additional $67.2 million set aside for the expansion of the Community Assistance Program, labor costs, police reform, and staff, supplies and equipment to operate three new parks, as is discussed in more detail in the Contingency section of this document. As a result, budgeted General Fund resources equal expenditures. However, any unused contingency amounts at year-end fall to a General Fund ending balance. The contingency fund has remained 100 percent funded for over ten years.
41
2021-22 ESTIMATED REVENUESRevenues from taxes, fees, interest, grants and other sources provide resources to fund programs and services delivered by the City. Total revenues for 2021-22 are estimated at $4,770,197,000. This is $475,307,000 or 11.1 percent higher than the 2020-21 estimate of $4,294,890,000.
The following table provides a comparison of the 2021-22 estimated revenues to 2020-21 estimates and 2019-20 actual collections. Detailed explanations by category are provided in the 2021-22 Revenue Estimates section of this document.
2021-22 Estimated Revenues Compared to 2020-21 Estimates (In Thousands of Dollars)
2021-22 2019-20 2020-21 Amount PercentFund Types Actuals Estimate Estimate Change ChangeGeneral 1,307,357 1,432,130 1,355,775 (76,355) (5.3)%Special Revenue Funds 1,246,000 1,443,941 1,993,618 549,677 38.1%Enterprise Funds 1,301,276 1,418,819 1,420,804 1,985 0.1%
Total 3,854,633 4,294,890 4,770,197 475,307 11.1%

Year-end balances are planned in the Enterprise funds and other self-supporting funds primarily to provide for adequate
fluctuations in service demand, insure bondholders of future debt service payments and to accumulate funds for annual pay-as-you-go capital improvements. In addition, Enterprise fund balances are intentionally permitted to grow over time in order to fund large capital projects.
The estimated 2021-22 ending balance of $727.9 million includes: Other Restricted - $47.9 million; Parks and Preserves - $46.7 million; Sports Facilities - $32.6 million; Transportation 2050 -$27.7 million; Development Services - $26.4 million; Grant Funds - $21.7 million; Neighborhood Protection - $18.0 million; 2007 Police Public Safety Expansion - $16.7 million; Community Reinvestment - $15.9 million; Public Safety Enhancement - $12.9 million; Capital Construction - $7.1 million; Arizona Highway User Revenue - $5.1 million; Aviation - $228.0 million; Wastewater - $121.2 million; Water - $76.6 million; Convention Center - $19.7 million; Solid Waste - $0.1 million; and a combined $3.6 million in various other Special Revenue funds. Beginning and ending fund balances are provided in more detail in Schedule 1 located in the Summary Schedules section.
Special Revenue fund balances in the aggregate are expected to decrease from $567.2 million to $282.3 million. • Transportation 2050 fund balances are decreasing primarily due to shifting costs from bond funds to pay-as-you-go
capital funds, allowing issuance of debt to be delayed.• The Phoenix Parks and Preserves fund balance is decreasing primarily due to planned pay-as-you-go capital spending for
land acquisition and improvements to existing facilities and negotiated employee compensation increases.• The Public Safety Specialty funds, including Neighborhood Protection, 2007 Public Safety Expansion and Public Safety
Enhancement, are decreasing primarily due to reduced revenue caused by the ending of the one-time CRF funding, increased personal service costs, as well as increases for vehicle replacements.
• The Arizona Highway User Revenue fund balance is diminishing primarily due to negotiated increases to employee compensation; the full year cost of positions added for the Roadway Safety Action Plan; additional staff to support street cleaning and maintenance and increased costs for related materials; and greater pay-as-you-go capital spending for the Residential Street Overlay program.
• Other Restricted fund balances are declining primarily due to additional capital expenditures for purchasing new software and equipment for the Computer-Aided Dispatch (CAD) system and increased operating expenditures for contractual and personal services.
• The Sports Facilities funds are decreasing due to increased operating expenditures as a result of higher contingency reserves.
• Development Services funds are reducing due to negotiated employee compensation increases, higher contingency reserves, and increased facility management charges.
• Capital Construction fund balances are decreasing primarily due to pay-as-you-go capital expenditures for future street construction projects, local drainage improvements, and for a street study of Happy Valley Road from 35th Avenue to 67th Avenue.
• A few Special Revenue fund balances are expected to increase slightly primarily due to decreases in total expenditures.
In 2021-22, the Enterprise funds ending balances in the aggregate are programmed to decline from $739.3 million at the beginning of 2021-22 to $445.6 million at year end.
• The Aviation balance is declining primarily due to a fall in airport revenue as a result of the discontinuation of the one-time Coronavirus Relief Funds; negotiated increases to employee compensation and other normal inflationary adjustments. Pay-as-you-go capital is also expected to rise due to increased contingencies for future projects that may occur in the Airport Development Plan.
• Water funds are decreasing due to lower revenue collections due to less water consumption; negotiated employee compensation increases; higher contingency reserves; increased debt service payments; increased costs for purchasing raw water from the Central Arizona Project; higher costs for consultants to administer and inspect pavement repairs;
equipment to implement Phase II of the water conservation plan. Pay as you go capital is also expected to increase primarily for the Deer Valley Water Treatment Plant rehabilitation project.
• Wastewater funds are diminishing primarily due to higher pay-as-you-go capital expenditures for projects such as a new grit basin and other equipment at 23rd Avenue Wastewater replacing assets and infrastructure at support facilities. Increases to operating funds are a result of higher contingency appropriations; negotiated increases to employee compensation; higher chemical and electricity costs; and property insurance increases.
• Solid Waste funds are lessening due to negotiated employee compensation increases and added positions to support growth in various Solid Waste areas; higher spending for vehicle replacements as a result of an aging fleet; contractual increases for recycling and long-haul waste transport services; and increased pay-as-you-go expenses primarily for the 27th Avenue Transfer Station painting project.
• The Convention Center fund balance is falling primarily due to increases in negotiated employee compensation; and rising
replacement.
42

43
The Highest S&P Credit Rating of the 5 Largest U.S. Cities
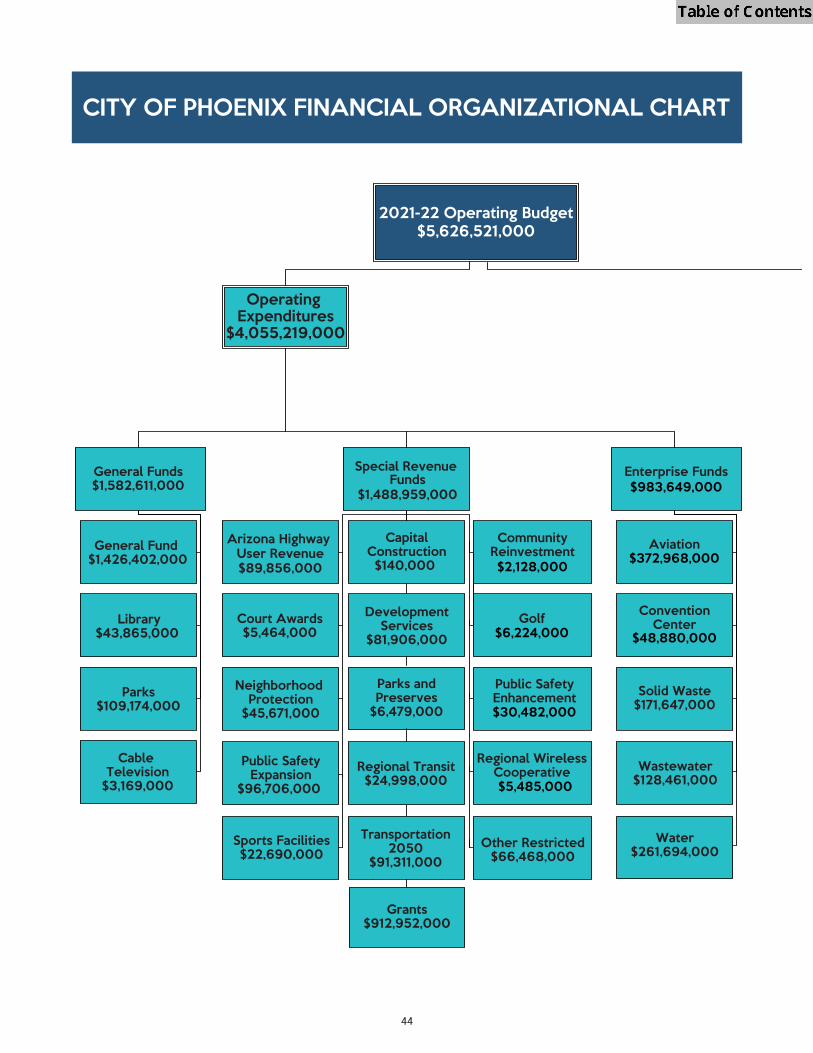
2021-22 Operating Budget$5,626,521,000
Operating Expenditures
$4,055,219,000
Enterprise FundsSpecial Revenue FundsGeneral Funds
$1,582,611,000
Cable Television
$3,169,000
Parks$109,174,000
Library$43,865,000
General Fund $1,426,402,000
Court Awards$5,464,000
DevelopmentServices
$81,906,000
CapitalConstruction
$140,000
Wastewater$128,461,000
Water$261,694,000
AviationCommunityReinvestment
Golf
Arizona Highway User Revenue$89,856,000
Parks andPreserves
$6,479,000
Regional Transit$24,998,000
Public SafetyEnhancement
Regional WirelessCooperative
Grants$912,952,000
Other Restricted$66,468,000
Sports Facilities$22,690,000
$1,488,959,000
$2,128,000
$6,224,000
$30,482,000
$5,485,000
$983,649,000
$372,968,000
Neighborhood Protection
$45,671,000
Public SafetyExpansion
$96,706,000
Transportation2050
$91,311,000
ConventionCenter
$48,880,000
Solid Waste$171,647,000
44
CITY OF PHOENIX FINANCIAL ORGANIZATIONAL CHART

Debt Service Pay As You GoCapital
SecondaryProperty Tax$129,714,000
Transportation2050
Parks and Preserves
$66,212,000
CapitalConstruction$20,380,000
General Fund Library$955,000
Other Restricted$12,718,000
Regional Transit$13,961,000
DevelopmentServices
$4,451,000
ConventionCenter
$15,480,000
$548,415,000
City Improvement$70,421,000
Wastewater$71,389,000
Aviation$87,281,000
Solid Waste$15,227,000
$1,022,887,000
$24,052,000
$308,724,000
Wastewater$71,659,000
Water$153,620,000
Convention Center
$20,763,000
CommunityReinvestment$7,734,000
Solid Waste$11,278,000
Aviation$126,993,000
Sports Facilities$2,393,000
Water$125,355,000
Grants$125,058,000
Arizona HighwayUser Revenue$85,482,000
45
CITY OF PHOENIX FINANCIAL ORGANIZATIONAL CHART
46

Phoenix is the core of Maricopa County and the state’s population and economic center. With its attractive climate, recreational opportunities, and affordable costs of living and doing business, the City has experienced sustained growth. The local economy continues to make progress and City revenue collections reflect modest growth.
The 2021-22 General Fund includes a projected surplus of 154.8 million of which $36.5 million is allocated for new or expanded services. The additions address critical community priorities set by the City Council and are grouped into the following categories: public safety reform and responsiveness; COVID-19 relief and resiliency; climate change and heat readiness; affordable housing and homelessness; building community and responding to growth; and administrative accountability. A summary of the major programs receiving funding follows below.
The public safety reform and responsiveness category totals $20.5 million and is intended to increase transparency and public trust in public safety programs. This category includes funding for: Fire to expand the Community Assistance Program for mental health calls for service; Police public records requests, data reporting compliance, and to civilianize the Central Booking Detail; and Street Transportation projects included in the Council approved Roadway Safety Action Plan.
The COVID response and resiliency category totals $2.6 million and is intended to provide services to continue to responsibly
locations, and video conferencing; Environmental Programs to continue the Emergency Food Assistance Program and to achieve the goals of the Council approved 2025 Phoenix Food Action Plan; and for the Library Department to continue mobile
The climate change and heat readiness category totals $2.8 million and is intended to address negative impacts to air quality from pollutants and carbon emissions and the hazards of urban heat. This category includes funding for: establishing a new
Fire to increase staff for the Energy System Inspection Program; and Environmental Programs to conduct greenhouse gas emissions inventories and to assist with implementing the City's newly created Climate Action Plan.
The affordable housing and homelessness category totals $2.8 million and is intended to increase affordable housing and help the homeless. This category includes funding for: Housing community outreach and development of affordable or mixed- income housing, as well as onetime funding for infrastructure improvements at Santa Fe Springs affordable apartment homes; Neighborhood Services, Street Transportation, and Public Works for Human Services Campus downtown area clean-ups and outreach; and Human Services to create a homeless advocate workforce specialist to help the homeless
The building community and responding to growth category totals $4.7 million and is intended to address the need for more resources due to growth and demand for City amenities and services. This category includes funding for: Parks and Recreation staff to support the growing needs at various parks and recreation centers and the operations of three new parks in the Southwest region of the City; Community and Economic Development to provide targeted economic development opportunities for the West region of the City; and Human Services to increase engagement and connection to treatment for residents with HIV/AIDS and a position to serve as a navigator for connection to services for residents who are veterans of the military.
The administrative accountability category totals $3.1 million and includes additions across several City departments. The intent of this category is to improve service delivery for City elections, public records requests, information technology, administrative functions, and to increase funding for maintenance of the City's aging fleet of vehicles.
approved public safety and transit taxes, and Enterprise Funds like Water Services and Solid Waste. The 2021-22 non-General Funds include $4.3 million in new funding for various departments. Some of the major programs include: Water Services to implement water conservation programs; Planning and Development for plan reviews and inspections; and Solid Waste for residential refuse and recycling collection necessary due to household growth.
The chart that follows indicates how major services provided to Phoenix residents have been adjusted in response to local
47
SERVICES TO THE COMMUNITY

48
PROGRAM SERVICE SERVICE CHANGES SERVICE CHANGESLEVEL IN 2010-11 THROUGH 2020-21 FOR 2021-22
PUBLIC SAFETY
POLICEPersonnel Resources:
In 2010-11, the Police Department had 3,558 sworn and 938.7 civilian employees.
The 2020-21 budget includes several service enhancements. The Center for Continuous improvement was created and staffed to focus on the department mission to constantly and continuously improve both the organization and individual employees by focusing on
management, accountability, technology and transparency, messaging, and employee wellness and development. The Compliance and Oversight Bureau was created to implement the Police Department’s on-going commitment to data-driven decision making, accountability and organizational commitment and transparency.
2020-21, with the planned hiring of 210
the department’s goal of reaching 3,125
sworn positions. The 2020-21 budget also provides for 1,093.6 civilian positions.
The 2021-22 budget includes several service enhancements. Additional support staff will be added to the Public Records and Services Unit to help eliminate public records request backlogs, ensure timely request processing, and improve overall customer service and transparency.
Additional staff will be hired to meet federal National Incident-Based Reporting System requirements, which will provide more extensive crime reporting statistics and enhance crime analysis.
Staff will be hired for the Professional Standards Bureau Inspection Unit’s Early Intervention System, which will ensure timely and accurate data and implement intervention recommendations, with the goal of identifying employee risk and preventing adverse events.
will be added to the Centralized Booking Detail to take the place of sworn positions,
priority duties.
Funding will be added for a third party to conduct a comprehensive review of Police policies and practices with the goal to improve community trust and transparency. Funds will be used to hire independent third parties that have a demonstrated track record with assisting police departments across the country achieve this goal.
The sworn hiring plan continues in 2021-22, with the planned hiring of 120 police
Response Time Average:
Response time for 2010-11 Priority 1 emergency calls was an average of 5 minutes.
Due to sworn vacancies in the Police Department, overtime usage has increased
patrol. This has negatively impacted Priority 1 emergency call response times, which are currently 6 minutes and 30 seconds. The department has strived to maintain the percentage of 911 calls answered within 15 seconds in the 90th percentile, per National Emergency Number Association (NENA)
challenges have reduced the percentage to 79 percent for 2020-21.
The 2021-22 budget provides for an estimated 6 minute and 36 second average response time for Priority 1 calls.

49
PROGRAM SERVICE SERVICE CHANGES SERVICE CHANGESLEVEL IN 2010-11 THROUGH 2020-21 FOR 2021-22
PUBLIC SAFETY
FIREResponse Time Average:
In 2010-11, the Fire Department maintained an average response time of 4 minutes 42 seconds
emergency calls.
Since 2010-11, response times have increased
emergency calls. This increase is at least partly
paramedic engine companies and ambulances. The overall incident activity level increased 38 percent from 2010-11 to 2020-21.
The 2010-11 budget included the elimination of two full-time ambulances and the reduction of part-time ambulance operational times. In-service hours for part-time ambulances were reduced from 12 hours to 10.8 hours per day. These changes decreased the Emergency Transportation System to 21 full-time and 11 part-time ambulances.
The 2012-13 and 2013-14 budget’s each included adding staff for an additional One and One Ambulance (seven sworn positions) to meet state -mandated response times. This brought the total to 23 full-time and 11 part-time ambulances.
The 2016-17 budget included a total of 23 full-time and 14 part-time ambulances in service.
The 2017-18 budget included the addition of one dedicated part-time ambulance for emergency response at Sky Harbor Airport. This unit will assure compliance with timely ambulance transportation response. This addition gave the department a total of 23 full-time and 15 part-time ambulances in service.
In 2018-19 an additional full-time ambulance was placed into service bringing the total to 24 full-time rescues and 15 part-time rescues.
The 2019-20 budget includes funding for two additional full-time ambulances, bringing the total to 26 full-time
is for the new Fire Station 55 located at I-17 and Jomax Road. The second ambulance is for Fire Station 58 to improve ambulance response time in the southwest region of the City of Phoenix and will be staffed by approved sworn positions previously unbudgeted.
The 2020-21 budget has no service changes.
The 2021-22 budget recommends retaining current emergency
and medical emergency calls.
Emergency Transportation:
In 2010-11, the City had a total of 21 full-time and 11 part-time ambulances in service.
The 2021-22 budget has no service changes.

Annual 2015-16 bus revenue miles are estimated at 17,202,500, Express/RAPID revenue miles are estimated at 920,700, and Dial-a-Ride service hours are estimated at 323,810.
route frequency on some existing routes, and added one new bus route to
Annual 2016-17 local bus revenue miles are estimated at 17,206,500, Express/RAPID revenue miles are estimated at 920,700 and Dial-a-Ride service hours are estimated at 323,286.City Council approved expanding bus service and increasing service frequency in Phoenix to at least every 30 minutes on all routes in October 2016 and April 2017. Public Transit Department also extended Route 39 to Dreamy Draw Park and Ride and extended Route 122 to service both Arizona State University (ASU) West and 19th Avenue and Dunlap light rail station. Annual 2017-18 local bus revenue miles are estimated at 19,836,900, Express/RAPID revenue miles are estimated at 920,700 and Dial-a-Ride services hours are estimated at 322,760.In October 2017, Public Transit Department extended Route 19 to service Happy Valley Towne Center, Route 60 to service 24th Street and Camelback area, and improved frequency on Routes 29 and 50. In April 2018, Public Transit Department extended Route 32 to Arizona Mills Mall in Tempe via 48th Street, University, 40th Street, and Baseline Road. Route 51 has been extended on 51st Avenue from Lower Buckeye Road to Baseline Road. In addition, the extended 51 consolidated with Route 251 to form a single bus route on 51st Avenue from ASU West to Pecos Road. Frequency improvements were made on Routes 3 and 19 in April 2018.Annual 2018-19 local bus revenue miles are estimated at 20,372,200, Express/RAPID revenue miles are estimated at 850,500 and Dial-a-Ride services hours are estimated at 324,864.In October 2018, Public Transit Department and all jurisdictions under the Valley Metro system restored weekday service levels on Martin Luther King Jr. Day, Presidents’ Day, Veterans’ Day, Day after Thanksgiving, and Christmas Eve. Public Transit Department also made a minor routing change on Route 8 in Downtown Phoenix and Route 106 in Metrocenter Mall. Frequency improvements were completed for Route 41 on Indian School Road. In April 2019, Public Transit Department made several schedule
shifting several trips to better serve our riders. In addition, a minor routing
reliability. On April 5, 2020, in response to the ridership decline on RAPID/Express routes due to COVID-19, Public Transit reduced RAPID and Express trips into Downtown Phoenix.In April 2020, Public Transit Department’s service change items include
On May 4, 2020, in response to the ridership decline and operator shortage
reduced to weekdays 5am-11pm, weekends 6am-11pm.On May 18, 2020, reduction in service hours for local routes is applied to RPTA operated routes in Phoenix. Annual 2019-20 local bus revenue miles with COVID-19 related reduction are estimated at 20,303,300. Express/RAPID revenue miles with COVID-19 related reduction are estimated at 827,400 and Dial-a-Ride services hours are estimated at 326,966.Annual 2020-21 local bus revenue miles were originally estimated at 20,205,800 but reduced to 18,761,400 due to COVID-19.Express/RAPID revenue miles were originally estimated at 944,300 but reduced to 491,700 due to COVID-19. Dial-a-Ride services hours are estimated at 325,390 and have not been reduced due to COVID-19.
50
PROGRAM SERVICE SERVICE CHANGES SERVICE CHANGESLEVEL IN 2010-11 THROUGH 2020-21 FOR 2021-22
TRANSPORTATION
PUBLIC TRANSITService Miles/Hours:
In 2010-11, an estimated 16,853,484 bus miles and 324,990 hours of Dial-a-Ride services were provided on weekdays and weekends in the City of Phoenix.
Annual 2021-22 local bus revenue miles are estimated at 20,210,200.
Express/RAPID revenue miles are estimated at 948,000, and Dial-a-Ride services hours are estimated at 326,000.
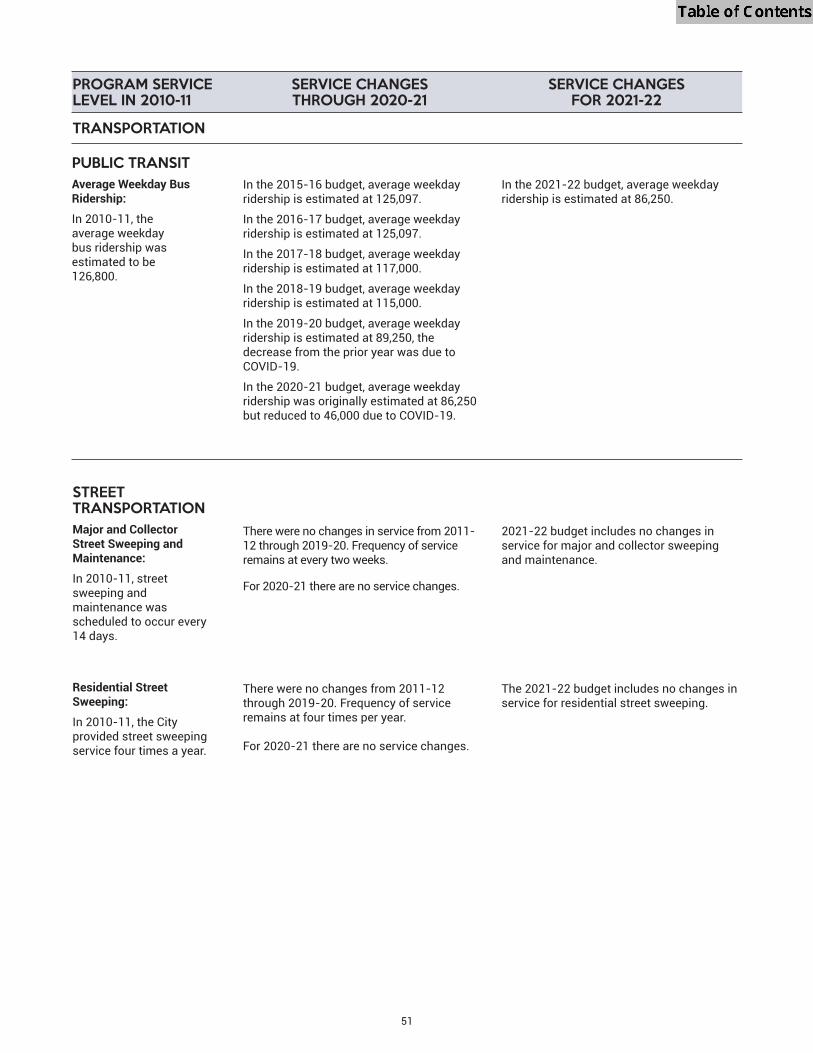
PUBLIC TRANSITAverage Weekday Bus Ridership:
In 2010-11, the average weekday bus ridership was estimated to be 126,800.
51
In the 2015-16 budget, average weekday ridership is estimated at 125,097.
In the 2016-17 budget, average weekday ridership is estimated at 125,097.
In the 2017-18 budget, average weekday ridership is estimated at 117,000.
In the 2018-19 budget, average weekday ridership is estimated at 115,000.
In the 2019-20 budget, average weekday ridership is estimated at 89,250, the decrease from the prior year was due to COVID-19.
In the 2020-21 budget, average weekday ridership was originally estimated at 86,250 but reduced to 46,000 due to COVID-19.
In the 2021-22 budget, average weekday ridership is estimated at 86,250.
PROGRAM SERVICE SERVICE CHANGES SERVICE CHANGESLEVEL IN 2010-11 THROUGH 2020-21 FOR 2021-22
TRANSPORTATION
STREET TRANSPORTATIONMajor and Collector Street Sweeping and Maintenance:
In 2010-11, street sweeping and maintenance was scheduled to occur every 14 days.
There were no changes in service from 2011-12 through 2019-20. Frequency of service remains at every two weeks.
For 2020-21 there are no service changes.
2021-22 budget includes no changes in service for major and collector sweeping and maintenance.
Residential Street Sweeping:
In 2010-11, the City provided street sweeping service four times a year.
There were no changes from 2011-12 through 2019-20. Frequency of service remains at four times per year.
For 2020-21 there are no service changes.
The 2021-22 budget includes no changes in service for residential street sweeping.

52
PROGRAM SERVICE SERVICE CHANGES SERVICE CHANGESLEVEL IN 2010-11 THROUGH 2020-21 FOR 2021-22
TRANSPORTATION
STREET TRANSPORTATIONSealcoat:
The 2010-11 budget provided sealcoating for 41 miles of City streets.
The 2011-12 budget included funding for 39 miles of City streets to be sealcoated.
The 2012-13 budget included 45 miles of streets to be sealcoated. It also included 20 miles of the FAST program.
The 2013-14 budget provided no changes to service levels.
The 2014-15 budget provided no changes to service levels. However, the two September 2014 storms diverted attention from sealcoat to repairs.
The 2015-16 budget included 68 miles of streets to be sealcoated. It also included 10 miles of the FAST, and 26 miles of preservative arterial street crack sealing programs. Transportation 2050 funds from passage of Proposition 104 improved the budget, coupled with the availability of improved technology allowed for revamping of the sealcoat program to increase the level of service.
The 2016-17 budget provided funding for 297 miles of streets to be sealcoated. New resurfacing treatments were added that
(PMM). The addition of these treatments, and additional Arizona Highway User Revenue (AHUR) funding, allowed the number of miles treated to increase to a total of 360 miles.
The 2017-18 budget provided funding for 212 miles of streets to be sealcoated.
The 2018-19 budget provided funding for 200 miles of streets to be sealcoated.
The 2019-20 budget includes 110 miles of streets to be sealcoated.
The 2020-21 budget includes 280 miles of streets to be sealcoated.
The 2021-22 budget includes 39 miles of streets to be sealcoated. The bond funded portion of the Accelerated Pavement Maintenance Program ended in 2020-2021 reducing the number of miles per year.
The number of miles sealcoated may vary year over year based on the streets selected and the distribution of wide versus narrow streets treated. It can also vary based on the method of sealcoat used.

53
PROGRAM SERVICE SERVICE CHANGES SERVICE CHANGESLEVEL IN 2010-11 THROUGH 2020-21 FOR 2021-22
TRANSPORTATION
STREET TRANSPORTATIONAsphalt Overlay:
In 2010-11, 85 miles of asphalt overlay were estimated to be completed, including 65 miles that were funded by the AmericanRecovery and Reinvestment Act (ARRA).
The 2011-12 budget provided 153 miles of overlay. The increase in miles of overlay was due to a carryover of AHUR Funds from the prior year.
The 2013-14 budget provided for 106 miles of overlay. The change in overlay is due to the elimination of the ARRA funding and the addition of $5 million in AHUR.
The 2014-15 budget provided no changes to service levels. However, the two September 2014 storms diverted attention from overlay to repairs.
The 2015-16 budget provided for 100 miles of overlay.
The 2016-17 budget allowed for 90 miles of overlay. Additional AHUR funding was added to increase the total to 121 miles.
The 2017-18 budget allowed for 76 miles of overlay.
The 2018-19 budget provided for 187 miles of overlay. This included overlays as part of the Accelerated Pavement Maintenance Program, which started in 2018-19.
The 2019-20 budget provided for 261 miles of overlay completed.
The 2020-21 budget provided for 90 miles of overlay to be completed.
The 2021-22 budget provides for 29 miles of overlay. The bond funded portion of the Accelerated Pavement Maintenance Program ended in 2020-2021 reducing the number of miles per year.
The number of miles resurfaced can vary year over year based on the streets selected and the distribution of wide versus narrow streets being treated.
54
PROGRAM SERVICE SERVICE CHANGES SERVICE CHANGESLEVEL IN 2010-11 THROUGH 2020-21 FOR 2021-22
COMMUNITY DEVELOPMENT
HOUSINGScattered Sites Housing Program:
In 2010-11, the Housing Department had 427 units.
This homeownership program allows eligible tenants the opportunity to purchase a home.
At the end of 2020-21, the inventory of 191 units reflects the reduction of 289 homes due to sales to eligible residents over the past decade under the Section 32 program and the demolition/disposition of properties under the Section 18 program.
In the 2021-22 budget, the program is expected to sell 20 units, reducing its inventory to 171 units.
By the end of 2011-12, the Affordable Housing Program was expanded to a total of 3,115 city-owned units for families and individuals, with the addition of 483 units from the newly renovated units at Park Lee and The Symphony.
At the end of 2020-21, the Affordable Housing Program consists of 2,637 units for families.
In the 2021-22 budget, the program is expected to remain at 2,637 units.
Federal Assisted Housing Program:
In 2010-11, the total inventory of assisted housing units was 1,909.
At the end of 2020-21, the Federal Assisted Housing Program consists of 1,695 units for families and individuals.
In the 2021-22 budget, the program is expected to decrease the number of units for a total of 1,615 due to continuing sales of Section 32 properties and the conversion of Public Housing units to Rental Assistance Demonstration units.
Affordable Housing Program:
In 2010-11, this program had 2,174 units for families and individuals.
Housing Payment Assistance Program:
In the 2010-11 budget, the rental assistance program provided 6,096 units of vouchers for low income residents in the private housing market.
At the end of 2020-21, the rental assistance program will provide 6,977 vouchers for low income residents in the private housing market.
In the 2021-22 budget, the program is expected to maintain 7,300 vouchers for low income residents in the private housing market.

55
PROGRAM SERVICE SERVICE CHANGES SERVICE CHANGESLEVEL IN 2010-11 THROUGH 2020-21 FOR 2021-22
COMMUNITY DEVELOPMENT
NEIGHBORHOOD SERVICESNeighborhood Preservation Case Cycle Time (Days)
In 2010-11, the average case cycle time was 51 days.
In 2011-12, additional performance standards and quality control measures were initiated along with ongoing process improvements and some division reorganization to reduce the overall average case cycle time to 45 days in 2013-14, and to 33 days in 2014-15.
From 2015-16 through 2020-21, the overall average case cycle time was 34 days or less.
The overall average case cycle time in 2021-22 is anticipated to increase to 36 days due to ongoing COVID-19 safety protocols and regulations remaining in effect.

56
PROGRAM SERVICE SERVICE CHANGES SERVICE CHANGESLEVEL IN 2010-11 THROUGH 2020-21 FOR 2021-22
COMMUNITY DEVELOPMENT
ECONOMIC DEVELOPMENTEmployment Growth Rate Compared to Other Cities:
In 2010, Phoenix’s employment growth rate was as follows:
Austin – 2.0%PHOENIX – 1.7%Dallas – 1.4%Ft. Worth-Arlington – 1.0%San Jose – 1.0%San Antonio – .8%San Diego – .5%Los Angeles/Long Beach – .3%Kansas City – (1.9)%
As the below data show, due to the COVID-19 pandemic, employment in 2020 fell for all benchmark cities.
Based on data from the Bureau of Labor Statistics, Phoenix’s employment growth rate fell by nearly 6.0 percent in 2020 with a rate of (2.4) percent versus 3.5 percent in 2019. This places Phoenix 6th among the ten benchmark cities below. Kansas City saw the lowest drop in employment at (1.2) percent, while Los Angeles saw the highest employment drop at (13.9) percent.
The Phoenix unemployment rate saw a large increase due to the pandemic. Peak unemployment occurred in April 2020 at 13.9 percent. For the remainder of the year, the unemployment rate dropped to 7.1 percent in December.
Kansas City – (1.2)%Dallas – (1.6)%Ft. Worth – (1.7)%Austin – (2.1)%San Antonio – (2.1)%PHOENIX – (2.4)%Denver – (4.0)%San Jose – (7.0)%San Diego – (7.3)%San Francisco – (10.6)%Los Angeles – (13.9)%
Based on data from the Arizona
Opportunity, Phoenix’s employment level was expected to increase by 101,390 from 2020 to 2022 prior to the COVID-19 pandemic.
Given economic conditions related to the pandemic and the decline in employment
employment growth in 2021.

57
PROGRAM SERVICE SERVICE CHANGES SERVICE CHANGESLEVEL IN 2010-11 THROUGH 2020-21 FOR 2021-22
COMMUNITY ENRICHMENT
HUMAN SERVICESHead Start Program:
In 2010-11, the program served 3,090 children.
In 2021-22 the Head Start program is expected to serve more than 3,451 children, and 1,737 of those will be in full day Head Start classes while the rest will continue to attend half day classes. The Early Head Start Program will serve more than 488 children. The increase in children served is due to the phasing in of the return to normal operations.
For 2015-16, the program served 538,133 meals.
For 2016-17, the program served 494,230 meals.
For 2017-18, the program served 448,799 meals. The meals served decreased due to the demographics shifting towards attendees who are joining the center for activities and classes, while not partaking in meal services.
For 2018-19, the program served 444,385 meals. The meals served decreased slightly due to the continued demographics shifting towards attendees who are joining the center for activities and classes, while not partaking in meal services.
For 2019-20, the program served 499,273 meals. The meals served included an additional 44,818 meals using federal funding from the C.A.R.E.S. Act for responding to COVID-19.
In 2020-21 the program served 706,920 meals. This includes 197,220
the Area Agency on Aging.
In 2021-22 the program expects to serve 716,918 meals. This includes projections for up to
COVID-19 pandemic relief using federal funding from the Area Agency on Aging.
Senior Nutrition Program:
In 2010-11, the program served 611,000 congregate and home-delivered meals.
In 2011-12, eight pools previously closed for infrastructure repairs were re-opened. This increased the number of open pools to 28 out of 29.In 2014-15, the number of open pools increased to 29 with the re-opening of Cortez Pool.Between 2015-16 and 2018-19, no changes were included in the budget.In 2019-20 all pools were closed during the summer months of 2020 in response to the COVID-19 pandemic. In 2020-21 all pools were closed during July and August of 2020 in response to the COVID-19 pandemic. City Council directed 12 of the 29 pools to reopen in May 2021.
No changes are included in the 2021-22 budget for swimming pools. As of May 2021, no date has been set for the remaining 17 pools to resume operations.
PARKS AND RECREATIONSwimming Pools:
In 2010-11, 20 of 29 pools continued to provide open swim. Eight pools were closed for infrastructure repairs on a rotating basis and Cortez Pool was
structural repairs.
The program served 3,667 children during 2015-16, of which 845 were included in the Early Head Start Program.
The program served 4,321 children during 2016-17, of which, 831 were included in the Early Head Start Program.
The program served 4,377 children during 2017-18, of which, 868 are included in the Early Head Start Program.
The program served 4,289 children during 2018-19, of which, 765 are included in Early Head Start Program.
The program served 4,220 children in 2019-20, of which, 745 are included in the Early Head Start Program.
In 2020-21 the Head Start program is expected to serve more than 2,338 children, and 1,726 of those will be in full day Head Start classes while the rest will continue to attend half day classes. The Early Head Start Program will serve more than 371 children. The decline in the number of children served was a result of restricted classroom attendance due to the COVID-19 pandemic.

58
PROGRAM SERVICE SERVICE CHANGES SERVICE CHANGESLEVEL IN 2010-11 THROUGH 2020-21 FOR 2021-22
COMMUNITY ENRICHMENT
PARKS AND RECREATIONSwimming Pool Season:
In 2010-11, the budget allowed for an eight-week season.
The 2012-13 budget added open swim hours at nine pools, representing all Council districts and City regions, from 1 to 7 p.m. each day in August through the Labor Day Holiday.
No changes were included in the budget for 2013-14 through 2015-16.
In 2016-17, 29 pools were open on Memorial Day weekend through the last weekend in July; due to additional “Kool Kids” funding from Cigna, 11 pools remained open in August through the Labor Day Holiday.
No changes were included in the budget for 2017-18 and 2018-19.
In 2019-20 all pools were closed during the summer months of 2020 in response to the COVID-19 pandemic.
As of May 2021, recreational swim and dive teams, water basketball programs and Cigna Summer programs continue to be temporarily suspended for the 2020-21 season, in response to the COVID-19 pandemic.
No changes are included in the 2021-22 budget for the swimming pool season. As of May 2021, recreational swim and dive teams, water basketball programs and Cigna Summer programs continue to be temporarily suspended, in response to the COVID-19 pandemic.
School Recreation Program During School Year:
The 2010-11 budget reduced after-school sites to 25 General Fund
full cost recovery sites.
In 2012-13, nine PAC sites were restored, which brought the total number of sites to 39.
The 2013-14 budget increased PAC sites to 44.
In 2014-15, the number of PAC sites started with 44. Two sites were cancelled mid-year due to low enrollment.
The 2015-16 budget had 42 PAC sites.
In 2016-17, eight smaller sites were combined into four “super” sites, which reduced the number of sites to 38.
No changes were included in the 2017-18 budget.
The 2018-19 budget decreased PAC sites to 37 due to the Kyrene School District discontinuing services.
In 2019-20, PAC sites decreased from 37 to 36 due to Washington School District discontinuing services at one site. All PAC sites ceased operations in March 2020 in response to the COVID-19 pandemic.
In 2020-21, as of May 2021 all PAC sites remained closed in response to the COVID-19 pandemic.
No changes are included in the 2021-22 budget for Phoenix Afterschool Center (PAC) sites. As of May 2021, all PAC sites continue to be temporarily suspended in response to the COVID-19 pandemic.
59
PROGRAM SERVICE SERVICE CHANGES SERVICE CHANGESLEVEL IN 2010-11 THROUGH 2020-21 FOR 2021-22
COMMUNITY ENRICHMENT
LIBRARYCentral Library:
The 2010-11 budget included 58 hours of operation per week.
In December 2010, the hours at Burton Barr Central Library were expanded by six hours per week, from 52 to 58 hours per week.
In July 2012, Burton Barr Central Library expanded morning hours by six hours, from 58 to 64 hours per week, opening at 9 a.m. instead of 11 a.m. on Tuesdays, Wednesdays and Thursdays.
In 2013-14, the number of electronic materials was increased by over 13,000 items.
In July 2013, MACH1 opened. MACH1 is a space for coding classes, robotics, science cafes, and STEM programming for all ages. It is only open for scheduled classes and programs.
In January 2014, hive@central opened. The hive@central is a collaborative space designed to bring together inventors, problem-solvers, entrepreneurs, and small businesses.
In January 2015, partnered with St. Mary’s Food Bank to provide Kids Café, a meal service program designed to provide a free, healthy meal along with educational programs.
In January 2015, College Depot launched the ReEngage Phoenix program to provide adults 21 and older and youth who have not completed high school with the opportunity to earn an accredited high school diploma and a career
Beginning March 2015, materials that do not have holds placed are automatically renewed, enhancing the customer experience.
The 2016-17 budget restored $100,000 for electronic materials, representing a 22 percent increase. Funding provided an alternative method of delivering services following reductions to branch hours in 2009-10 and 2010-11.
In January 2017, entered into a contract with Southwest Autism Research & Resource Center (SARRC) to operate a café at Burton Barr Library.
Burton Barr Central Library was closed the summer of 2017 due to storm damage and reopened in June 2018.
The renovation of Burton Barr Central Library expanded the College Depot, MACH1 and Children’s areas within the library.
The College Depot area expanded from 4,000 to 12,000 square feet which enabled an increase in the number of workshops. In addition to doubling the number of “applying for college” workshops, each workshop accommodates double the number of attendees. Specialty programming was added to include more summer camps; additional break-out sessions with expertise; additional GED sessions; “Youth Work Readiness” sessions, and additional capacity for in service and workshop sessions.
The 2021-22 budget adds two positions for the expansion of the College Depot program to accommodate growing demand for additional GED classes, ACT/SAT prep classes, and one-on-one counseling appointments. The program expansion is projected to serve additional students, offer additional classes, and increase the one-on-one college counseling appointments.
StartupPHX, formerly known as hive@Central, will offer additional business and entrepreneurial services, in partnership with other departments and agencies.
Additional Arizona Room digitized collection will be made available online through the Phoenix Public Library website and the Arizona Memory Project.
Several online virtual tours of specialty spaces will be made available through the Phoenix Public Library website.
60
PROGRAM SERVICE SERVICE CHANGES SERVICE CHANGESLEVEL IN 2010-11 THROUGH 2020-21 FOR 2021-22
COMMUNITY ENRICHMENT
LIBRARYCentral Library Continue: The MACH1 space added two designated computer labs.
The space doubles the capacity for computer-related classes and programs. The designated classroom space allows break-out sessions which provides different age groups and level of expertise access to resources. A designated space for the sewing machine program was added, enhancing focused learning. A 3D printer room was added which allows for an increase in the number of 3D printers. Designated computers are available for customers to book time. The open making space is upgraded to include state-of-the-art flooring, tables and outlets to allow the addition of another full summer camp series.
The Children’s Space expanded from 5,000 square feet to 14,000 square feet. Design was updated to include a larger capacity Storytime area. Expansion also included a tripling of the children’s materials collection with an increase to the “Great Children’s Book” specialty collection. A designated children’s makers’ programming space, “MACH.5,” for ages birth to 12 was added. Specially designed early literacy interactive furniture and “Little Sprouts” (children’s seed library) were incorporated.
No service changes were included in the 2019-20 budget, with hours of operation at 64 hours per week. Two full-time Municipal Security Guard positions were added to provide continuous security coverage for patrons and staff at the Burton Barr Central Library during all hours of operation.
In 2019-20, an automated materials handling (AMH) system was installed at Burton Barr Central Library to generate
24/7 and get immediate acknowledgement of the returned item(s).
In partnership with First Things First, the Human Services
Family Resource Center to provide services to families with
was discontinued.
In March 2020, all library locations temporarily suspended in-person services due to the COVID-19 global pandemic. The loan period for all materials checked out, as well as library card account renewals, was extended. Literacy and STEM programs were offered virtually; customers were provided with online, phone, and one-on-one appointment assistance; and, access was extended for eLibrary platforms. Curbside services to allow customers to pick up library materials began in May 2020.
In April 2020, in partnership with St. Mary’s Food Bank Alliance, the annual food drive held during National Library Week was conducted virtually and raised enough funds for nearly 175,000 meals for the community.

61
In April 2010, the hours of operation per week were reduced from 52 to 44 hours at seven branches and 48 to 40 hours at the remaining branches.
Additionally, in April 2010, the staff and library materials at Century, Acacia, and Ocotillo branch libraries were reduced resulting in decreased direct customer service and increased time to access library materials. Administrative and support staff were also reduced resulting in slower processing and re-shelving of materials system-wide and less timely maintenance of facilities.
In December 2010, the hours at Mesquite Library were increased by six hours per week.
A new South Mountain Community Library, jointly operated by Maricopa County Community College District and the City, opened in August 2011 on the campus of South Mountain Community College at 72 hours per week.
In July 2012, evening hours were expanded at eight branches: Ironwood, Cholla, Cesar Chavez, Palo Verde, Juniper, Agave, Yucca and Saguaro. They opened an additional six hours per week, from 7 to 9 p.m. on Tuesdays, Wednesdays and Thursdays, bringing total branch service hours to 759 per week. College Depot also expanded its programming to four branch libraries: Cesar Chavez, Cholla, Palo Verde and South Mountain Community College.
In 2013, an automated material handling system was installed at
return materials 24/7 and get immediate acknowledgement of the return.
In January and October 2014, began partnering with St. Mary’s Food Bank at six branches to provide Kids Café, a meal service program designed to provide a free, healthy meal along with a learning component.
In 2013, the FitPHX Energy Zones program, an after-school health education program for Phoenix youth ages 10 to14, was established in three Phoenix Library locations: Harmon, Palo Verde and Yucca. In October 2015, through a Super Bowl grant, these three locations installed active computer workstations, so customers can walk at a leisurely pace on a treadmill while using one of the library's public computers.
A temporary branch at Park Central Mall opened in January 2018 due to the temporary closure of Burton Barr Central Library in the summer of 2017.
The additional four hours of service on Sundays were continued at four branch libraries that were temporarily added because of the Burton Barr Library closure for most of 2017-18: Yucca, Century, Harmon and Ocotillo. The additional Sunday hours resulted in an average 10 percent increase in usage at the four branches, serving over 21,000 people in 24 weeks. This change brings total branch hours to 775 hours per week.
PROGRAM SERVICE SERVICE CHANGES SERVICE CHANGESLEVEL IN 2010-11 THROUGH 2020-21 FOR 2021-22
COMMUNITY ENRICHMENT
LIBRARYBranch Libraries:
The 2010-11 total branch library service hours were 1,008 per week.
The 2021-22 budget adds funding to continue mobile and self-serve computing services initiated as a result of the COVID-19 pandemic including cellular service for the MiFi hotspot loan program, annual maintenance for additional self-checkout payment kiosks, and security software for the laptop loan program.

62
The 2019-20 budget added Municipal Security Guard positions to various library branches to provide continuous security coverage for patrons and staff during all hours of operation.
Staff and supplies were added to expand Kindergarten Bootcamp programming citywide to help parents and children learn together the skills needed for school success. This provided an additional 25 series of classes per year, serving between 350 to 450 families.
Sunday hours at the remaining four branches (Acacia, Agave, Desert Broom, and Desert Sage) without Sunday hours were restored. This addition restored branch hours to approximately 49 hours per branch or 68 percent of pre-recession level hours. The total branch library service hours were 833 per week.
In 2019-20, in partnership with First Things First, the Human
the Family Resource Center to provide services to families with
In March 2020, all library locations temporarily suspended in-person services due to the global COVID-19 pandemic. The loan period for all materials checked out, as well as library card account renewals, was extended. Literacy and STEM programs were offered virtually; customers were provided with online, phone, and one-on-one appointment assistance; and, access was extended for eLibrary platforms. Curbside services to allow customers to pick up library materials began in May 2020.
In May 2020, added curbside services 15 hours per week permitting customers to drive/walk up and pick up holds and utilize mobile printing.
In January 2021, launched an upgraded version of its website in partnership with the Information Technology Services Department.
In April 2021, all library locations began a laptop and hotspot lending program to customers.
In April-May 2021, all library locations restored limited in-house services in a phased reopening plan. Services include collection-browsing, computer use and self-check-out of materials. Access is provided with 45-minute reservations made online or at the door based on occupancy limits set by federal Centers for Disease Control (CDC) guidelines. Curbside service continues for three hours each morning.
In May 2021, the Cesar Chavez Library coordinated with the Parks and Recreation and Housing Departments to install a StoryWalk in the Cesar Chavez Park with related kits and materials available for
In June 2021, a virtual assist on Phoenix.gov will assist customers with common Library-related inquiries.
62
PROGRAM SERVICE SERVICE CHANGES SERVICE CHANGESLEVEL IN 2010-11 THROUGH 2020-21 FOR 2021-22
COMMUNITY ENRICHMENT
LIBRARYBranch Libraries Continue:

63
PROGRAM SERVICE SERVICE CHANGES SERVICE CHANGESLEVEL IN 2010-11 THROUGH 2020-21 FOR 2021-22
ENVIRONMENTAL SERVICES
WATER SERVICESWater Bill Comparison for Single-Family Homes:
In a March 2011 survey, Phoenix’s average monthly water bill compared favorably to the following benchmark cities:
San Diego - $72.84San Jose –$53.32Kansas City –$52.15Austin –$48.40Dallas –$43.21Tucson –$39.87PHOENIX –$36.12Alburquerque –$29.21San Antonio –$19.96
In an April 2021 survey, Phoenix’s monthly water bill compared favorably to the following benchmark cities:
San Diego – $112.30 San Jose – $106.91Austin – $100.55 Tucson – $72.36 Fort Worth – $49.39 Dallas – $42.04PHOENIX – $38.24Albuquerque – $37.70 San Antonio – $29.85
Phoenix water rates will increase in October 2021 and then in March 2022 to $40.75.
Wastewater Bill Comparison for Single-Family Homes:
In a March 2011 survey, Phoenix’s average monthly wastewater bill compared favorably to the following benchmark cities:
Austin – $51.73San Diego – $45.94San Jose – $32.86Tucson – $32.52Kansas City – $32.19Dallas – $31.40PHOENIX – $22.34San Antonio – $19.32Alburquerque – $14.09
In an April 2021 survey, Phoenix’s monthly wastewater bill compared favorably to the following benchmark cities:
Austin – $74.95 San Diego – $51.22 Tucson – $50.54Fort Worth – $49.99Dallas – $44.43San Antonio – $42.46 San Jose – $41.64PHOENIX – $25.21Albuquerque – $18.63
It is anticipated Phoenix wastewater rates will continue this trend during 2021-22.

64

Each year, the City of Phoenix budget is developed in conjunction with the Mayor and City Council, residents, City employees,
BUDGETING PROCESSEnhancements made over the last several years demonstrate the City’s commitment to continuously improve transparency, better communicate detailed budget information, and further engage the community in the budget process. At the direction of the City Council, several steps continued to be carried out to enhance the City’s budget process, making it a year-round, flexible process.
• Staff presents an early and detailed budget status to facilitate enhanced strategic resource and expense discussions.
• For the seventh consecutive year, the Budget and Research (B&R) Department consulted with the University of ArizonaEconomic Business Research Center to enhance the City’s sales tax revenue forecasting model. The partnershipresulted in improved revenue projections as we now have access to independent expert economists who understandthe impact that local, national and global economic changes have on the Phoenix economy. In Fiscal Year 2019-20,
the one-time Coronavirus Relief Fund (CRF) monies of $48.5 million, was $1,403.4 million for a positive difference of
compared to the estimate of $1,254.0 million for a variance of $4.9 million or 0.4 percent.
•planning and strategic decision making by policymakers.
• Staff compiles 18 key Phoenix economic indicators in a quarterly report. The indicators are provided to the City Council
• Preliminary Capital Improvement Programs are presented by departments to Council subcommittees to provide earlierand additional opportunities for input.
• For the second year, the City continues to use the FundPHX tool at phoenix.gov/FundPHX. FundPHX is an onlinebudget tool designed to educate and engage the public in the City's annual budget process. The tool is available inboth English and Spanish, and it gives residents an opportunity to try their hand at balancing the City's General Fundoperating budget, provide feedback on current funding levels, and share community priorities with staff.
Each fall, departments start from zero and submit an estimate of the costs associated with providing their current levels of service for the following year (the “base budget”). Budget and Research staff review these base budget estimates to ensure that only the funding needed to continue current service levels is included in the department’s base budget for the following year. A department’s base budget funding may differ from its current year funding for a variety of reasons. For example, an increase or decrease in electricity or postage rates would be reflected in the base budget.
for potential elimination. These proposals are potential base reductions and represent the department’s lowest-priority activities. Departments also are asked to provide any requests for new or expanded programs. These are called supplemental budget requests. Departments can propose reducing or eliminating an existing program to fund the expansion of an existing program or adding a new program. Base reductions and supplemental budget requests include all operating and
personnel costs for a lifeguard and other staff, chemicals for the pool, maintenance and utilities.
When base reductions and supplemental budget requests are proposed, they are ranked together according to the department’s priorities. These rankings are used by City management to assist in the development of the City Manager’s Trial Budget.
The Trial Budget is reviewed with the City Council early each spring. The purpose of the Trial Budget is to enable the community and the City Council to comment on a balanced budget proposal well before the City Manager is required to submit a proposed budget in May. Budget hearings are conducted throughout the community during day and evening hours at which residents are encouraged to provide their feedback. The Trial Budget is also available online, and residents can send comments by email, letters, phone, through the City’s website and social media, and online using the FundPHX tool.
The City Manager’s Proposed Budget provided in May reflects the input received from the community and City Council.
65
BUDGET PROCESS, COUNCIL REVIEW AND INPUT,PUBLIC HEARINGS AND BUDGET ADOPTION

2021-22 BUDGET PROCESS
Initial Budget Status
On October 13, 2020, staff provided an early review of the 2019-20 General Fund budget results. Results reflect the impact of
offset public safety salaries as permitted by the federal guidelines.
Overall, General Fund resources exceeded estimates by $55.7 million or 4.0 percent. Excluding the one-time CRF amount of $48.5 million received by the General Fund, the variance was only $7.2 million or 0.5 percent. Expenditures came in lower by $17.9 million or 1.4 percent, primarily due to one-time vacancy savings as a result of the hiring freeze implemented earlier
approximately $73.6 million higher than anticipated, or $25.1 million excluding the one-time resources from the CRF.
Staff also requested adoption of the 2021-22 budget calendar. The City Council adopted staff’s recommendation.
Zero-Based Budget Inventory of Programs
On February 9, 2021, for the tenth consecutive year, the Budget and Research Department provided detailed preliminary estimates with multiple year-to-year comparisons in the Zero-Based Inventory of Programs document. The City’s budget was presented by program, the key component of a zero-based budget approach. The document was put in place in response to the City Council’s request for a more transparent, relevant and detailed presentation of the City’s budget. The
detail for the more than 360 programs and services citywide.
The Zero-Based Inventory of Programs document was provided at least six weeks prior to the City Manager's Trial Budget. By detailing the more than 360 City programs and services and providing a complete view of the City's current year budget along with a preliminary look at next year's estimates, the Mayor, City Council and public could begin reviewing this important information very early in the process.
Preliminary Status of 2021-22 General Fund Budget and Five-Year General Fund Forecast
General Fund forecast through 2025-26 was also presented to the Mayor and City Council for the tenth consecutive year, providing an essential tool in long-term budget discussions and decision making. The report explained economic, resource,
and adversely impacted revenue streams, primarily in the hospitality and leisure sales tax categories. Under the leadership of the City Council, the General Fund remained balanced and was projected to end Fiscal Year 2021-22 with a surplus of $153 million of which $98 million was one-time resources. The surplus was comprised of both one-time and ongoing resources.
Staff explained one-time resources were due to the Council-approved transfer of funding from the CRF to the General Fund
May 2020).
On December 8, 2020, in anticipation of the pending CRF deadline of December 30, 2020, Council again approved the use of the CRF public safety salary offset. This time, the offset was used to free up General Fund resources to continue programs, originally funded from the CRF, that would have ended prematurely due to the pending CRF deadline.
Staff noted estimated one-time General Fund resources were $98 million, and in order to maintain a structurally balanced budget, available ongoing resources were projected to be $55 million, for a combined surplus of $153 million. These resources were available to be used to provide new or expanded programs and services, employee compensation increases, one-time investments in City assets, infrastructure, or increasing the pension stabilization reserve fund. Staff noted it was critical the City did not use one-time resources to fund ongoing costs, especially considering the City was still dealing with the pandemic.
Over the last few years, the City Council has taken necessary actions to protect City services while facing very challenging
measures including:
• Strategic use of the Coronavirus Aid, Relief, and Economic Security (CARES) Act and CRF to preserve City programs and services during the COVID-19 pandemic.
•
• Net reduction in City employee count of approximately 2,700 positions since Fiscal Year 2007-08, resulting in the smallest government per capita since 1970-71.
66

• Consistently raising the contingency fund to its highest level in City history.
• Paying Public Safety Pension costs on an expedited 25-year amortization schedule instead of a 30-year schedule.
• Creating a Pension Funding Policy and Pension Reserve Fund which currently carries a balance of over $40 million that can only be used to offset increased future costs for Public Safety Pensions.
Staff reported that the forecast showed a structurally balanced budget where ongoing revenues are available for existing programs. However, staff was mindful of the pandemic and how its effects may continue to impact the City's budget. This uncertainty called for a cautious approach to forecasting future revenues to ensure the City could sustain a balanced budget into the future.
The report also included stress testing of the forecast, which was done for the third consecutive year, to model the potential for a recession in the last two years of the forecast. While this is not anticipated to occur, the alternative models provided an opportunity to evaluate how declines in revenue could compromise the General Fund's structurally balanced budget.
Staff reported the preliminary Fiscal Year 2021-22 General Fund expenditures to continue existing levels of service were projected to be $1.452 billion. This compared to the adopted General Fund expenditure budget of $1.426 billion for Fiscal Year 2020-21 or an increase of $26 million. The increase accounted primarily for higher costs for public safety pension, increases in capital equipment, lower than anticipated vacancy savings, higher contingency to maintain a four percent reserve, and increases for pay-as-you-go capital projects, many of which reflected deferred maintenance over the past decade.
Staff explained that this year's forecast illustrated the General Fund baseline (midpoint) forecast for each year and reflects a balanced budget. Looking ahead, staff stated the areas of concern for the General Fund budget are pension costs for sworn public safety staff, service costs and capital needs for facilities, vehicles and information technology, service levels, and revenue.
Service costs include employee compensation levels, contractual increases, commodity purchases, capital needs for technology hardware and software, infrastructure and vehicles, including Fire apparatus. Service levels involve the amount of services, hours and the number of facilities kept open to serve the public. Revenues consider taxes, fees, economic growth, predictions of potential continuing negative impacts from the COVID-19 pandemic, along with 2020 Census’s potential impact on the City's relative population share.
The current forecast assumed no changes to existing labor contracts or service levels, however, it assumed any surplus is incorporated into the subsequent years' expenditures, whether in increased one-time or ongoing costs for added programs and services, labor increases, set-asides, or other uses of the funds. The current labor contracts expire at the end of June 2021, and contract negotiations were underway at the time. Any changes to these contracts would impact Fiscal Year 2021-22 and beyond.
City Manager’s 2021-22 Trial Budget
The Trial Budget is an important step in the City's Zero-Based Budget development process. It provides the Mayor and City Council, the community and employee groups an opportunity to review a proposed balanced budget, which includes proposed increases in employee compensation, and additions of a variety of City programs and services. This information is
On March 16, 2021, staff presented the 2021-22 Trial Budget. Staff stated the General Fund long-term outlook was positive, with ongoing resources balanced to projected ongoing expenditures. The Trial Budget included several recommendations that continue to move the City forward in addressing critical community priorities and ensuring City employees were compensated fairly. These General Fund priorities included the following recommended increases by category:
• Employee compensation increases (ongoing and one-time) - $118M
• Public safety reform and responsiveness - $21.0M
• COVID relief and resiliency - $2.6M
• Climate change and heat readiness - $2.8M
• Affordable housing and homelessness - $2.8M
• Building community and responding to growth - $2.9M
• Administrative accountability - $3.0M
The proposed Trial Budget also included additions of $3.6 million for non-General Fund departments for Planning and Development, Solid Waste and Street Transportation.
67
Community Feedback
Resident input was solicited at 14 virtual community budget hearings held between April 2, 2021 and April 20, 2021. Residents also provided feedback online using the FundPHX tool and comments were received directly to the Budget & Research Department via email and voicemail. In total, between March 8 through May 4, 2021, the City received 2,094 comments from 1,464 individuals on the proposed Budget. Several residents commented multiple times on the same topic.
City Manager’s Proposed Budget and Council Action
On May 4, 2021, staff presented a balanced 2021-22 City Manager’s Proposed Budget to the Mayor and City Council for information and discussion. Staff revised revenue estimates based on 8-month technical revenue reviews resulted in an
into consideration, and changes to the Trial Budget were reflected.
The General Fund revised projected surplus for Fiscal Year 2021-22 was $154.8M. Due to the leadership of the City Council over the past year, it represented a turnaround from the budget of 2020-21 when the City instituted hiring freezes to prevent
programs and services in several important categories.
Staff reported the City Manager's 2021-22 Proposed Budget included several recommendations that continue to move the City forward in addressing critical community priorities and ensuring City employees are compensated fairly. The following is a summary list of the changes to the Trial Budget:
• Build and set-aside operating funds for three new neighborhood parks in the southwest area of Phoenix, which can be built with impact fees.
• Add staff to properly maintain the Highline Canal.
• Add staff for the Pueblo Grande Museum.
• Fund resources for advancement of Fast Track City initiatives to promote AIDS awareness, prevention and treatment.
• Fund a City Navigator for veterans' services.
• Add funding for the City's Adaptive Reuse Program.
• Add staff to properly maintain City cemeteries.
• Add staff in the Water Services Department (non-general funded from Water Services) to implement recommendations from the Water Conservation Ad Hoc Committee.
Council Action
The 2021-22 City Council Budget Decision was presented to the City Council for action on May 18, 2021. The General Fund budget for action was the same as presented on May 4, 2021.
On May 18, 2021, the City Council approved the proposed 2021-22 budget as presented. The May 18, 2021 Council action provided the time needed to meet legal deadlines and comply with City Code, Charter and State law. Requirements include
The proposed balanced 2021-22 General Fund budget was $1,607.6M. This was a $182M increase or 12.8 percent from the adopted 2020-21 General Fund Budget of $1,425.6M. The increase accounted for the additions mentioned earlier and increases in capital pay-as-you-go projects, employee pension costs, and an increase in the contingency fund to maintain 4 percent of General Fund operating expenditures.
Projected General Fund revenue in 2021-22 was estimated to be $1,355.8M and represented an increase of $32.9M or 2.5 percent over the 2020-21 Revised Estimate of $1,322.9M, excluding one-time revenues of $109.2M from the Council approved transfer from the Coronavirus Relief Fund to offset public safety salaries as permitted by federal guidelines. Growth in 2021-22 reflected anticipated increases in city and state sales taxes and state-shared vehicle license taxes; this growth was offset by estimated declines in state-shared income tax revenues, which was based on collections from two years prior.
the COVID-19 pandemic.
Total General Fund resources for Fiscal Year 2021-22 are estimated at $1,607.6M and included the estimated beginning fund balance of $244.7M (largely made up of one-time funds discussed earlier), estimated revenue of $1,355.8M and fund transfers and recoveries estimated at $7.1M.
For all funds, which includes General, Enterprise and Special Revenue funds such as grants, and all debt service and pay-as-you-go capital costs, the proposed 2021-22 budget is $5,626.5M. Included in this proposed budget amount is $416M allocated to the city by the federal government in the American Rescue Plan Act (ARPA).
Following the Council's budget action on May 18, 2021, both the City Charter and State law require subsequent public
68

Tentative Budget Adoption
A public hearing and adoption of the tentative budget ordinances was completed on June 2, 2021, in compliance with the City Charter requirement that the budget be adopted no later than June 30, 2021.
Upon adoption of tentative budget ordinances, the budget becomes the City Council’s program of services for the ensuing
be increased. Generally, the ability to increase the budget applies to expenditures exempted from the State expenditure
Final Adoption
levy ordinance was completed no less than 14 days with the City Charter requirement that the budget be adopted no later than July 1, 2021, in accordance with State law.
The following chart is an overview of the 2021-22 community budget process calendar.
69
DATE BUDGET ITEMSNovember 2020 FundPHX (available to the public)
February 9, 2021 2021-22 Inventory of Programs
February 23, 2021 Preliminary 2021-22 Budget Status and Five-Year General Fund Forecast
March 16, 2021 2021-22 City Manager’s Trial Budget and Preliminary Five-Year Capital Improvement Program for 2021-26
April 1, 2021 Publish Budget Tabloid
April 2021 14 Virtual Community Budget Hearings
May 4, 2021 City Manager’s Proposed 2021-22 Budget
May 18, 2021 Council Final Budget Decision
June 2, 2021 2021-22 Tentative Budget Ordinance Adoption
June 16, 2021 2021-22 Funding Plan and Final Budget Ordinance Adoption
July 1, 2021 2021-22 Property Tax Levy Ordinance Adoption
70

71
GENERAL BUDGET AND FINANCIAL POLICIES
accepted accounting standards. These laws and standards set budget calendar dates, provide for budget control, describe ways to amend the budget after adoption, and identify appropriate methods for budgeting, accounting and reporting. The Arizona Constitution establishes the property tax system and sets tax levy and assessed valuation limits. The City Charter and Code also provide restrictions on property tax. The constitution also provides annual expenditure limits and sets total bonded debt limits.
The City’s budget policies are extensions of these basic laws and follow generally accepted governmental budgeting and accounting practices and standards.
A BALANCED BUDGET IS REQUIREDArizona law (Title 42 Arizona Revised Statutes) requires the City Council to annually adopt a balanced budget by purpose
other available resources, must equal these expenditures.” Therefore, no General Fund balances can be budgeted in reserve
included in the budget each year.
The City Charter also requires an annual balanced budget. The Charter further requires that “the total of proposed expenditures shall not exceed the total of estimated income and fund balances.”
Annual Budget Adoption Requirements Instruments
The City Charter and Code and state statutes contain legal deadlines and actions that must be followed in adopting the budget. In cases where the deadlines conflict, the City meets the earlier of the two dates. The deadlines and formal actions prescribed by both, as well as the actual or planned dates for the 2021-22 budget development process are as follows:
City Charter Arizona State Statute 2021-22 Action Required Prescribed Deadline Prescribed Deadline Budget Dates
City Manager’s recommended
Improvement Program submitted to the City Council.
City website if there will be an increase in either the primary or the secondary property tax rate, even if the combined tax rate is a decrease.
City Manager’s proposed budget for ensuing year presented to the Mayor and City Council.
Publish general summary of budget and notice of public hearing that must be held prior to adoption of tentative budget ordinances.
At least three months prior to
budget or a date designated by the City Council.
No requirement.
in June or a date designated by the City Council.
Publish in newspaper of general circulation at least
hearing.
Capital Improvement Program not required.
60 days prior to Tax Levy Adoption.
City manager budget not required.
No requirement.
March 16, 2021
May 1, 2021
May 4, 2021
Publish Week of May 17, 2021

72
Publish notice of public hearing which must be held
year Capital Improvement Program by resolution.
Public hearing immediately followed by adoption of tentative budget ordinances with or without amendment.
Publish truth-in-taxation notice twice in a newspaper of general circulation (when required).
Publish summary of tentatively adopted budget and notice of public hearing
adoption.
Post a complete copy of the tentatively adopted budget on the City’s website and provide copies to libraries and City Clerk.
Post notice of intent on the
distribute notice through the City’s social media accounts if there will be an increase in either the primary or secondary property tax rate.
Public hearing on budget plus property tax levy or truth-in-taxation hearing (when required) immediately
budget ordinances.
Post a complete copy of the
City’s website.
Public hearing and property tax levy adoption.
Publish in newspaper of general circulation at least
hearing.
On or before the last day of June.
No requirement.
No requirement.
No requirement.
No requirement.
No requirement.
No requirement.
No later than the last regularly scheduled Council meeting in July.
No requirement.
On or before the third Monday of July.
First, at least 14 but not more than 20 days before required public hearing; then at least seven days but not more than 10 days before required hearing.
Once a week for two consecutive weeks following tentative adoption.
No later than seven business days after the estimates of revenue and expenses are initially presented before the City Council.
At least 15 days prior to Tax Levy Adoption.
On or before the 14th day before the tax levy is adopted and
August.
No later than seven business days after adoption.
No sooner than 14 days
and no later than the third Monday in August.
Publish Week of May 17, 2021
June 2, 2021
Publish weeks of May 31, 2021
and June 7, 2021
Publish weeks of June 7, 2021
and June 14, 2021
June 11, 2021
June 15, 2021
June 16, 2021
June 25, 2021
July 1, 2021
City Charter Arizona State Statute 2021-22 Action Required Prescribed Deadline Prescribed Deadline Budget Dates

PROPERTY TAXES AND BONDED DEBT LIMITArizona property tax law provides for two separate tax systems. A primary property tax is levied to pay current operation and maintenance expenses. Therefore, primary property tax revenue is budgeted and accounted for in the General Fund. A secondary property tax levy is restricted to the payment of debt service on long-term debt obligations. Therefore, secondary property tax revenue is budgeted and accounted for as a special revenue fund.
Primary Property Tax Restrictions
Primary property tax levies are restricted to an annual two percent increase plus an allowance for growth attributable to previously unassessed properties (primarily new construction). The City Charter requires that eight cents of the primary property tax levy be allocated to the Parks and Recreation Fund. In addition, the City Charter limits the primary property tax rate to $1.00 plus an amount that provides for the establishment and support of free public libraries and reading rooms. The primary levy may additionally increase by an amount equal to annual tort liability claims. Assessment ratios and the primary tax rate are applied to a property’s limited property value, less exclusions, to determine the property’s primary tax levy. Beginning in 2015-16 due to state Proposition 117 passed by Arizona voters in 2012, the limited property value used in this
property’s prior-year limited property value.
Secondary Property Tax Restrictions
Secondary property tax levies are restricted in their use to the payment of annual debt service on long-term debt obligations. Any over-collection of the secondary levy or any interest earned by invested secondary property tax funds must be used to reduce the following year’s levy. Beginning in 2015-16 due to state Proposition 117 passed by Arizona voters in 2012, assessment ratios and the secondary tax rate were applied to a property’s limited property value, less exclusions, to determine the property’s secondary tax levy. The limited property value used in this calculation for most properties was the
Prior to 2015-16, full cash value rather than limited property value applied.
Generally, Arizona counties assess property and collect all property taxes. Proceeds are distributed monthly to the appropriate jurisdictions.
Bonded Debt Limit
Arizona cities can issue general obligation bonds for purposes of water, sewer, lighting, open space preserves, parks,
amount not exceeding 20 percent of the secondary assessed valuation. General obligation bonds can be issued for all purposes other than those previously listed up to an amount not exceeding six percent of the secondary assessed valuation. An analysis of bonded debt limits is provided in the Debt Service chapter.
73
Amendments to the Budget After Final Adoption
Generally, by Arizona state statute, no expenditure may be made, nor liability incurred for a purpose not included in the budget even if additional funds become available. Phoenix’s level of legal budgetary control is by fund except for the General Fund and Capital Funds for which control is by program.
In certain instances, however, the budget may be amended after adoption. All budget amendments require City Council approval. These are 1) transfers from any contingency appropriation and 2) reallocations of amounts included in the original budget. An amount for contingencies is included in the General Fund and in many other restricted funds. Informal
adopts amendments to the budget ordinances to reflect transfers of contingency amounts and reallocations as needed.
According to a State Attorney General opinion, appropriations may be increased if funds are unexpectedly received during
(pass-through).
Manager.

ANNUAL EXPENDITURE LIMITATION
Constitution. This limitation is based upon the City’s actual 1979-80 expenditures adjusted for interim growth in population and inflation as measured by the gross domestic product (GDP) implicit price deflator. The constitution exempts certain expenditures from the limitation. Constitutional exemptions generally do not apply to cities adopting a home rule option
debt-service payments, expenditures of federal funds, certain state-shared revenues and other long-term debt obligations. Exemptions associated with revenues not expended in the year of receipt may be carried forward and used in later years. The 1979-80 expenditure base may be adjusted for the transfer of functions between governmental jurisdictions.
The constitution provides for four processes to exceed the expenditure limitation: (1) a local four-year home rule option, (2) a
pay-as-you-go capital. They all require voter approval.
City of Phoenix voters have approved 10 local home rule options in 1981, 1985, 1991, 1995, 1999, 2003, 2007, 2011, 2015 and 2020. Before 1999, the home rule options generally excluded enterprise operations such as Aviation, Water, Wastewater and Solid Waste from the expenditure limitation. Beginning in 1999, the voters approved establishing the City’s annual budget as the spending limit. Voters approved the permanent annual exclusion in 1981 of the following amounts for pay-as-you-go capital: $5 million for Aviation, $6 million for Water, $6 million for Wastewater and $2 million for General Fund street improvements.
The current home rule option, approved by the voters on November 3, 2020, sets the limit at the City’s annual budget after obtaining community input by the residents of the City of Phoenix on the proposed spending plan. This home rule option
expenditures.
BUDGET BASIS OF ACCOUNTING
revenues in the period that they become available and measurable, and expenditures are recognized in the period the associated liability is incurred. This method differs from Generally Accepted Accounting Principles (GAAP) used for preparing
GAAP basis are listed below. A reconciliation of budgetary and GAAP fund balances is provided each year in the Annual Comprehensive Financial Report.
1. For budgetary purposes, encumbrances (contractual commitments to be performed) are considered the equivalent of expenditures rather than as a reservation of fund balance.
3. Fund balances reserved for inventories, bonded debt and unrealized gains or losses on investments are not recognized in the budget.
4. In lieu property taxes and central service cost allocations (levied against certain Enterprise and Special Revenue funds) are budgeted as interfund transfers rather than revenues and expenses.
of many other local governments. These differences exist largely because they provide a more conservative view of revenues and expenditures and because they provide greater administrative controls.
GENERAL FINANCIAL POLICIESIn addition to the legal constraints outlined in the previous section, a number of administrative and City Council-approved policies provide guidance and direction to the budget development process.
Form of Budget Adoption
1. Allocation of Appropriations -divisions, sections, projects and type of expenditure by the City Manager or as delegated to the Budget and Research Director to provide managerial control and reporting of budgetary operations.
2. Budget Controls - At the department level, control of expenditures is governed by Administrative Regulation. City departments prepare revised expenditure estimates twice a year. The Budget and Research Department keeps the City Manager and the City Council advised on the status of the budget through periodic budget status reports. Mid-year revenue shortfalls can result in the adoption of mid-year expenditure reductions.
74

3. Contingency Amounts - A contingency allowance is appropriated to provide for emergencies and unanticipated expenditures. The use of contingency funds is intended for one-time expenses since it represents limited one-time resources in the fund balances. Expenditures may be made from contingencies only upon approval by the City Council with recommendation by the City Manager. In March 2010, the City Council agreed to gradually increase the
improve the City’s ability to withstand future economic cycles. Enterprise and Special Revenue funds have varying levels of contingency funding consistent with the variability in revenues and expenditures associated with the services provided.
4. Ordinances -capital funds ordinance and (3) the re-appropriated funds ordinance. The last ordinance is required because the
Since all expended amounts must be included in the budget adoption ordinance, the City re-budgets all encumbrances outstanding at year’s end.
Cost Allocation and Expenditure Policies
1. Administrative Cost Recovery - The Finance Department prepares an indirect cost allocation plan that conforms to federal guidelines for grant reimbursement of appropriate administrative costs. The allocated costs are charged to eligible federal grant funds through a fund transfer to the General Fund.
2. Central Services Cost Allocation - The Finance Department annually calculates the full cost of central services provided to Enterprise and certain Special Revenue funds. These allocated costs are recouped from the Enterprise and certain Special Revenue funds through fund transfers to the General Fund.
3. Employee Compensation Costs - Costs for employee compensation including all wages, social security, industrial, health, life, unemployment, dental insurance and other personal allowances are allocated to each department. Annual amounts for cash conversion of vacation, compensatory time and sick leave are included in the budget. However, future values of compensated absences are not included in the budget but are disclosed in the notes to the Annual Comprehensive Financial Report at year’s end.
4. Enterprise Cost Recovery - Aviation, Water, Wastewater and Solid Waste are fully self-supporting from rates, fees and charges and, as such, are budgeted and accounted for as Enterprise funds. Cost recovery includes direct operation and maintenance expenses, capital expenditures, debt service, indirect cost allocation, and in-lieu property taxes, where
rental and parking fees with the remainder coming from earmarked sales taxes. Finally, federal regulations preclude the Aviation Fund from paying in-lieu property taxes. By City Council policy, the Convention Center Fund does not pay in-lieu property taxes.
5. Internal Cost Accounting Allocation - Interdepartmental services performed by one department for another are credited to the performing department and charged to the receiving department to reflect the accurate costs of programs. The rates used are intended to reflect full costs including appropriate overhead.
6. Maintenance and Replacement of Rolling Stock and Major Facilities - A multiyear plan is used to project the need for,
asset category is matched to the life of the asset. Annually, that plan, combined with periodic physical inspections of streets, facilities, vehicles and other equipment, is used to develop funding levels for inclusion in the budget. During
the asset.
7. Pension Funding - In addition to other employee compensation amounts, pension amounts are allocated to each
members and to amortize any unfunded actuarial liability as a level percent of projected member payroll over the amortization period determined by the appropriate pension board.
Due to rising pension costs and reforms made to both the general City employee retirement system (COPERS) and the public safety retirement system (PSPRS), these systems have become increasingly complex. In 2017, the State legislature passed a law that offered employers some relief from the escalating PSPRS contribution rates. This law allowed cities to increase the amortization period for the unfunded actuarial liability from a closed 20-year period to a closed 30-year period. The City requested and was approved for the change to a closed 30-year amortization period effective July 1, 2017. However, the Council adopted a plan to use a 25-year amortization period and to establish a Public Safety Pension Reserve Fund with the savings based on the difference from the original 20-year amortization in 2017-18. The reserve fund may be used to make extra contributions to pay off the unfunded liability quicker or to help offset future cost increases. The Personal Services section of the Detail Budget document contains additional information regarding the pension systems.
75

8. Self-Insurance Costs - With a few exceptions, the City is fully self-insured for general and automotive liability exposures. The major exceptions to self-insurance include airport operations, police aircraft operations and excess general and automotive liability for losses in excess of $7.5 million. An independent actuary determines the self-insurance costs, which are combined with purchased policy costs and allocated to department budgets based on the
Revenue Management
All local governments struggle to generate the funds necessary to provide, maintain and enhance the service demands of their community. Due to the legal limitations on property taxes in Arizona, and due to the pre-emption of city-imposed income, luxury and gas taxes, Arizona cities and towns largely rely on local sales taxes and state-shared sales, income and vehicle license taxes. In Phoenix, 39 percent of General Fund revenue comes from the local sales tax. This reliance on sales tax collections
Council’s February 2010 approval of a temporary sales tax on food for home consumption effective April 1, 2010. The temporary food tax was reduced in half by the City Council effective Jan. 1, 2014, and the remaining tax expired by ordinance on March 31, 2015.
Given the City’s reliance on sales taxes, developing personal income is an important step in managing the revenue base. In recent years, considerable effort has been devoted to attracting employers that will provide quality jobs and to developing a local workforce that will support the needs of quality employers. The City also has worked to develop an employment base that is not as heavily concentrated in the highly cyclical construction industry.
In the past the growth of internet sales created concern about the erosion of the revenue base. However, as a direct result of a U.S. Supreme Court decision (Wayfair), the State passed H.B. 2757, effective in October 2019, which created an economic nexus standard and required most marketplace facilitators to collect tax on behalf of sellers using the facilitator’s platform. This resulted in a much larger portion of internet sales becoming taxable.
The use tax is an important tool for reducing the impact of otherwise non-taxable retail sales. Also, the development of tourism-related sales tax base (hotels, restaurants and short-term car rentals) is another important component of diversifying revenue.
Finally, utility taxes levied against the sales of electricity, natural gas, telecommunications, water and sewer make up about 16 percent of General Fund local sales tax collections. Generally, utility taxes are not responsive to economic conditions and
revenue policies follow.
1. Privilege License and Use Taxes (Sales Tax) – The City Council may set the City sales tax rate by ordinance. The City sales tax rate on retail sales and most other categories is 2.3 percent effective January 1, 2016. However, a two-tier rate structure was established for retail sales of single items in excess of $10,000; with the requirement that the threshold, be adjusted biennially for inflation. Additional information on the current threshold and the rates on other specialized tax categories are included in the Current Local Sales Tax Rates chart within the Revenue Estimates section of this document. The Model City Tax Code exemption on food for home consumption was temporarily removed by City Council action in February 2010. By ordinance, the exemption was restored in April 2015. The food tax was previously last imposed in June 1980. Effective January 1, 2017 the Arizona Department of Revenue (ADOR) began collecting all city sales tax.
2. Property Tax – The City Charter limits City property tax rates to $1.00 per $100 of net assessed valuation, plus the amount necessary to pay for debt service and to maintain public libraries. Except as otherwise limited by state law, the City’s primary property tax rate is set based on the $1.00 limitation plus an amount needed for library operations. The secondary property tax rate is set to support debt service requirements.
3. In-Lieu Property Taxes – In-lieu property taxes are charged to the Water, Wastewater and Solid Waste funds based upon acquisition or construction cost with the appropriate assessment ratio and current property tax rate applied. These amounts are calculated annually by the Finance Department.
4. Annual User Fee Reviews – The City Auditor conducts a comprehensive user fee review to project cost recovery rates, and then compares the projections to the established cost recovery policy. The rates are based upon generally accepted full-cost accounting standards. The City Manager recommends expenditure reductions or fee adjustments to the City Council to maintain the established cost recovery policy.
5. Fines and Forfeitures –schedules.
6. Parks and Recreation Fees and Charges – The Parks and Recreation Board has jurisdiction over establishing charges for miscellaneous recreational facilities and advising the City Council on fees to be set for golf courses, tennis centers and swimming pools.
7. Interest Earnings –Interest earnings from the investment of temporarily idle funds are credited to the fund generating the earnings.
76
FUND STRUCTUREThe budget presented here is made up of three distinct fund groups: General, Special Revenue and Enterprise funds.
All planned uses of these fund types are included in the annual budget. Fiduciary funds, which are described later in this section, are not included in the annual budget.
General Funds
General – These revenues come from four major sources: local sales (privilege license) taxes, local primary property taxes, state-shared revenues, and user fees and other revenues. State-shared revenues include state-shared sales, vehicle license
neighborhood services.
Parks – The City Charter requires that a portion of the primary property tax levy be used to support parks programs. To demonstrate compliance with this requirement, all parks revenues and expenditures are segregated in a separate fund.
Library – State law requires that funds received for library purposes are segregated in a separate Library Fund. Revenues
Cable Communications – Included in this fund are the revenues and expenditures associated with administering cable television licensing and programming the government and education access channels.
Special Revenue Funds
Arizona Highway User Revenue (AHUR) – AHUR funds are made up of state-collected gas taxes and a portion of other state-collected fees and charges such as registration fees, driver’s licenses and motor carrier taxes. These funds can only be used for street maintenance and construction, and street-related debt service.
Capital Construction – This fund is used to account for the two percent utility taxes on telecommunication services that are used for pay-as-you-go capital projects in the City’s right-of-way.
City Improvement – This fund is used to account for debt payments incurred as a result of capital projects by the Civic Improvement Corporation.
Community Reinvestment – Revenues and expenditures associated with economic redevelopment agreements are maintained in this fund.
Court Awards – and state Organized Crime Acts. Expenditures are restricted to additional law enforcement programs in the Police and Law departments.
Development Services – Fee revenues and expenditures associated with permitting and inspection services provided by the Planning & Development Department are maintained in this fund.
Excise Tax – The Excise Tax Fund is used to account for tax revenues ultimately pledged to pay principal and interest on various debt obligations.
Golf – The Golf Fund is used to account for revenue and expenditures associated with the rental, sales, development and maintenance of the City’s golf courses.
Grant Funds – Grant funds include federal, state and local agency awards. These are Community Development Block Grant funds, Public Housing funds, Human Services funds and various other smaller grant allocations. Grant funds can be applied only to grant-eligible expenditures.
Neighborhood Protection – These funds are used to account for the revenues and expenditures associated with a voter-
neighborhood protection programs, and police Block Watch programs. The Police Department is allocated 70 percent, Fire Department 25 percent and Block Watch Programs 5 percent of revenues.
Other Restricted Funds – This is a combination of funds used to segregate restricted revenues and related expenses. Included are Court Technology Enhancement Fees, Parks revenues such as Heritage Square and Tennis Center, and various other receipts and contributions received in small amounts and earmarked for restricted purposes.
77

Parks and Preserves – This fund is used to account for the funds generated by the 0.1 percent increase in the sales tax approved by voters in 1999 for a 10-year period. In 2008, voters approved a 30-year extension to July 1, 2038. The funds are used to purchase state trust lands for the Sonoran Desert Preserve open space, and the development and improvement of regional and neighborhood parks to enhance community recreation.
Public Safety Enhancement – These funds are used to account for the revenues and expenditures associated with a voter-approved two percent increment of the 2.7 percent sales tax on utilities with franchise agreements in March 2005. The Police
Department 38 percent of revenues.
2007 Public Safety Expansion – These funds are used to account for the 0.2 percent increase in the sales tax approved
increasing paramedic and other emergency medical services. The Police Department is allocated 80 percent of this fund and the Fire Department is allocated 20 percent.
Regional Transit – This fund is used to account for transit services that are paid by and provided for other cities or funded by the Regional Public Transportation Authority.
Regional Wireless Cooperative (RWC) – This fund accounts for revenues and expenditures associated with the Regional Wireless Cooperative (RWC), which is an independent, multi-jurisdictional organization that manages and operates a regional
other municipal radio users in and around Central Arizona’s Valley of the Sun. Phoenix operates and maintains the network and is also responsible for accounting, budgeting, procurement and contracting for the RWC. Costs are shared among the RWC member organizations.
Secondary Property Tax – In Arizona, property taxes are divided into two separate levies: primary and secondary. The primary levy can be used for general operating and maintenance expense. The secondary levy can only be used for payment of general obligation bond interest and redemption. Because of this restriction, secondary property tax funds are segregated in a Special Revenue Fund.
Sports Facilities – This fund accounts for revenues generated from a one percent hotel/motel tax and a two percent tax on short-term vehicle rentals. These funds are designated for payment of debt service and other expenditures related to the downtown sports arena.
Transportation 2050 – These funds are used to account for the revenues generated by the 0.7 percent sales tax approved by voters in August 2015, with an effective date of January 1, 2016, to fund a comprehensive transportation plan with a 35-year sunset date. This tax supersedes the 0.4 percent sales tax approved by voters in March 2000, which was accounted for in the Transit 2000 Fund. The Public Transit Department is allocated 86.2 percent of the sales tax, with the remaining 13.8 percent being allocated to the Streets Department. Fare box collections are also included in the Transportation 2050 Transit Fund. This fund replaced the Transit 2000 Fund.
Enterprise Funds
Enterprise funds include Water, Wastewater, Aviation, Solid Waste and Convention Center funds. Except for Convention Center funds, these funds come entirely from the fees and rents paid by those who use the services and facilities provided. Enterprise funds are “self-contained” and can only be used to pay for the costs associated with Enterprise Fund-related services and programs. Therefore, fees are set to recover all costs associated with providing these services. These costs include day-to-day operations and maintenance, in lieu property taxes (as appropriate), pay-as-you-go capital improvements and debt service.
Convention Center funds come from a combination of rental and parking income and earmarked sales taxes. These earmarked taxes include a portion of the hotel, restaurant and bar, construction contracting, and advertising taxes levied by the City. This tax stream has been earmarked to repay the debt issued for the Convention Center facility and to provide for operations and maintenance costs.
Capital Funds
Capital Funds include bond issuance proceeds, and other funds such as development impact fees and airport passenger facility charges that are restricted in use to the acquisition of capital assets. The City appropriates Capital Funds separately, and all Capital Fund expenditures are budgeted in the Capital Improvement Program.
Fiduciary Funds
Fiduciary funds, including trust and custodial funds, represent funds held for others. As such, these funds are not included in the annual budget. Any contributions made to these funds using City funds are included in the budget for the appropriate
78

4.4%
$
12%�
10%�
8%�
6%�
4%�
2%�
0%�
3.8%
$
2014-15 2019-20 2021-22*
3.7%
$
2012-13 2013-14
4.6%3.1%
$
5.3%
2015-16 2016-17 2017-18
$ $
6.5%
$
2018-19
6.2%
$
2020-21*
7.0%
$ 6.2%
$
Revenue estimates for 2021-22 are based on assumptions about the local economy, population changes, activity levels, underlying estimates for cost-recovery rates and fees, and on the continuation of current state revenue collection and sharing practices. In addition, other revenue estimates are developed using the most current information from outside entities that establish such fees. Examples of revenues derived from fees set by outside entities include portions of court
of $2.1196 reflects a decrease to the secondary property tax rate of one cent from 2020-21.
pandemic has severely impacted the global economy and ended the longest U.S. economic expansion on record — nearly 11 years. Arizona has been able to recover quicker than many other states and ranks 6th in economic momentum among the nation represented by strong growth in jobs, population and personal income. The federal stimulus packages also have
individual rebates to households have certainly indirectly positively impacted City revenues.
City and state-shared sales tax revenues have shown solid growth throughout the COVID-19 crisis. In the past, the growth of internet sales created concern about the erosion of the revenue base. However, as a direct result of a U.S. Supreme Court decision (Wayfair), the State passed H.B. 2757, effective in October 2019, which created an economic nexus standard and required out-of-state remote sellers with a certain number of sales into the state to collect and remit sales tax and to collect tax on behalf of sellers using the facilitator’s platform. This resulted in a much larger portion of internet sales becoming taxable and mitigated the impacts of COVID-19 on city and state sales taxes.
Personal income is one of many indicators used for estimating state and local sales taxes. Consistent with projections by local economists, the chart below shows that personal income is expected to grow by 6.2 percent for 2020-21 and 3.8 percent for 2021-22.
Several other economic indicators are used to develop revenue forecasts including the consumer price index, unemployment, population, gasoline sales, housing unit data, wage and salary related information, retail sales and disposable income. Projections of these economic variables are provided by the University of Arizona (UofA). The estimation process also includes information gathered throughout the year from national and local publications, as well as opinions from
79
REVENUE ESTIMATES
Personal Income Growth
Fiscal Year *Estimated

80
FIVE YEAR EXCISE TAX FORECAST Excise taxes include local sales taxes, state-shared sales and income taxes, and sales tax license fees and permits. Excise
taxes also provide non-General Fund resources to programs such as Transit, Parks and Preserves, Convention Center and Public Safety.
assumptions including continued growth for city and state sales taxes, population, personal income and jobs, marginal increases in consumer spending and a strong housing market. The forecast also includes no change to state-shared revenue formulas. As indicated previously, Arizona adopted Wayfair economic nexus for internet sales. As a result, effective
Arizona.
CITY OF PHOENIX, ARIZONA FIVE YEAR EXCISE TAX REVENUE FORECAST (In Thousands of Dollars)

81
GENERAL FUNDS
Total 2021-22 General Fund revenues are estimated to be $1,355.8 million or 5.3 percent less than 2020-21 estimates of $1,432.1 million. General Fund revenues consist of four major categories: local taxes and related fees, state-shared revenues, primary property taxes and user fees. Following are descriptions of the revenue sources within these four categories and explanations of 2021-22 revenue estimates.
Local and state sales tax collections represent approximately 53.6 percent of General Fund revenues. Local sales taxes for 2021-22 are expected to grow by 4.4 percent over 2020-21 estimates. Phoenix’s share of state sales taxes for 2021-22 is expected to grow by 4.2 percent over 2020-21 estimates.
Combined local and state sales tax revenues for 2021-22 are expected to grow by 4.3 percent over 2020-21 estimates. Combined rates of growth since 2012-13 are provided in the chart below.
The table on the next page details estimated General Fund revenue by major source.
Local and State Sales Tax Revenue Growth
Fiscal Year *Estimated
15%�
13%�
11%�
9%�
7%�
5%�
3%�
1%
4.1%3.0% 3.0%
0.2%
2.8% 2.0%
2014-15
4.3%
2021-22*2012-13 2013-14 2015-16 2016-17 2017-18 2020-21*
7.6%
2018-19 2019-20
6.8%
2.9%

82
GENERAL FUND REVENUE BY MAJOR SOURCE (In Thousands of Dollars)
LOCAL TAXES AND RELATED FEES
Local Taxes and Related Fees
40.6%
This major revenue category consists of local sales tax, privilege license fees, use tax, franchise taxes and fees, and other general excise taxes. The 2021-22 estimate is $550,197,000, which is $22,334,000 or 4.2 percent greater than the 2020-21 estimate of $527,863,00. The assumptions used to estimate local taxes and related fees follow.
General FundsTotal Revenues - $1,355.8 Million
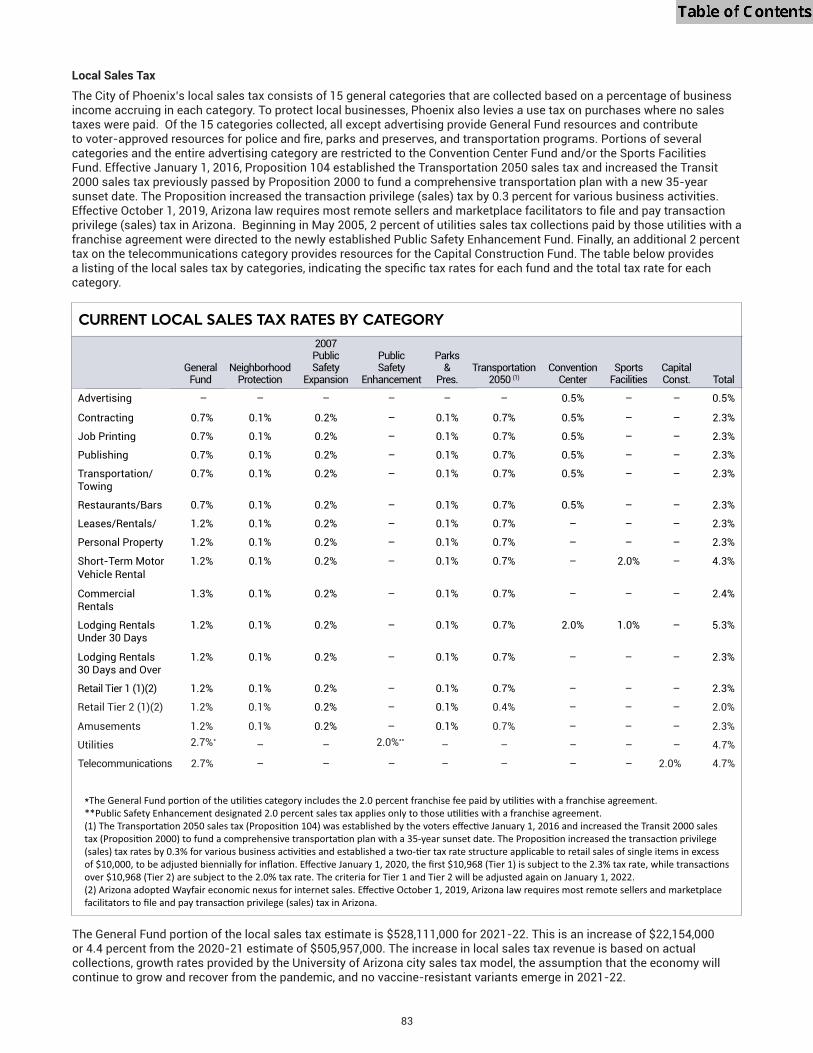
83
CURRENT LOCAL SALES TAX RATES BY CATEGORY
The General Fund portion of the local sales tax estimate is $528,111,000 for 2021-22. This is an increase of $22,154,000 or 4.4 percent from the 2020-21 estimate of $505,957,000. The increase in local sales tax revenue is based on actual collections, growth rates provided by the University of Arizona city sales tax model, the assumption that the economy will continue to grow and recover from the pandemic, and no vaccine-resistant variants emerge in 2021-22.
GeneralFund
NeighborhoodProtection
2007PublicSafety
Expansion
PublicSafety
Enhancement
Parks&
Pres.Transportation
2050 (1)Convention
CenterSports
FacilitiesCapitalConst. Total
Advertising – – – – – – 0.5% – – 0.5%
Contracting 0.7% 0.1% 0.2% – 0.1% 0.7% 0.5% – – 2.3%
Job Printing 0.7% 0.1% 0.2% – 0.1% 0.7% 0.5% – – 2.3%
Publishing 0.7% 0.1% 0.2% – 0.1% 0.7% 0.5% – – 2.3%
Transportation/Towing
0.7% 0.1% 0.2% – 0.1% 0.7% 0.5% – – 2.3%
Restaurants/Bars 0.7% 0.1% 0.2% – 0.1% 0.7% 0.5% – – 2.3%
Leases/Rentals/ 1.2% 0.1% 0.2% – 0.1% 0.7% – – – 2.3%
Personal Property 1.2% 0.1% 0.2% – 0.1% 0.7% – – – 2.3%
Short-Term MotorVehicle Rental
1.2% 0.1% 0.2% – 0.1% 0.7% – 2.0% – 4.3%
Commercial Rentals
1.3% 0.1% 0.2% – 0.1% 0.7% – – – 2.4%
Lodging RentalsUnder 30 Days
1.2% 0.1% 0.2% – 0.1% 0.7% 2.0% 1.0% – 5.3%
Lodging Rentals30 Days and Over
1.2% 0.1% 0.2% – 0.1% 0.7% – – – 2.3%
Retail Tier 1 (1)(2) 1.2% 0.1% 0.2% – 0.1% 0.7% – – – 2.3%
Retail Tier 2 (1)(2) 1.2% 0.1% 0.2% – 0.1% 0.4% – – – 2.0%
Amusements 1.2% 0.1% 0.2% – 0.1% 0.7% – – – 2.3%
Utilities 2.7%* – – 2.0%** – – – – – 4.7%
Telecommunications 2.7% – – – – – – – 2.0% 4.7%
*
Local Sales Tax
The City of Phoenix’s local sales tax consists of 15 general categories that are collected based on a percentage of business income accruing in each category. To protect local businesses, Phoenix also levies a use tax on purchases where no sales taxes were paid. Of the 15 categories collected, all except advertising provide General Fund resources and contribute
categories and the entire advertising category are restricted to the Convention Center Fund and/or the Sports Facilities Fund. Effective January 1, 2016, Proposition 104 established the Transportation 2050 sales tax and increased the Transit 2000 sales tax previously passed by Proposition 2000 to fund a comprehensive transportation plan with a new 35-year sunset date. The Proposition increased the transaction privilege (sales) tax by 0.3 percent for various business activities.
privilege (sales) tax in Arizona. Beginning in May 2005, 2 percent of utilities sales tax collections paid by those utilities with a franchise agreement were directed to the newly established Public Safety Enhancement Fund. Finally, an additional 2 percent tax on the telecommunications category provides resources for the Capital Construction Fund. The table below provides
category.
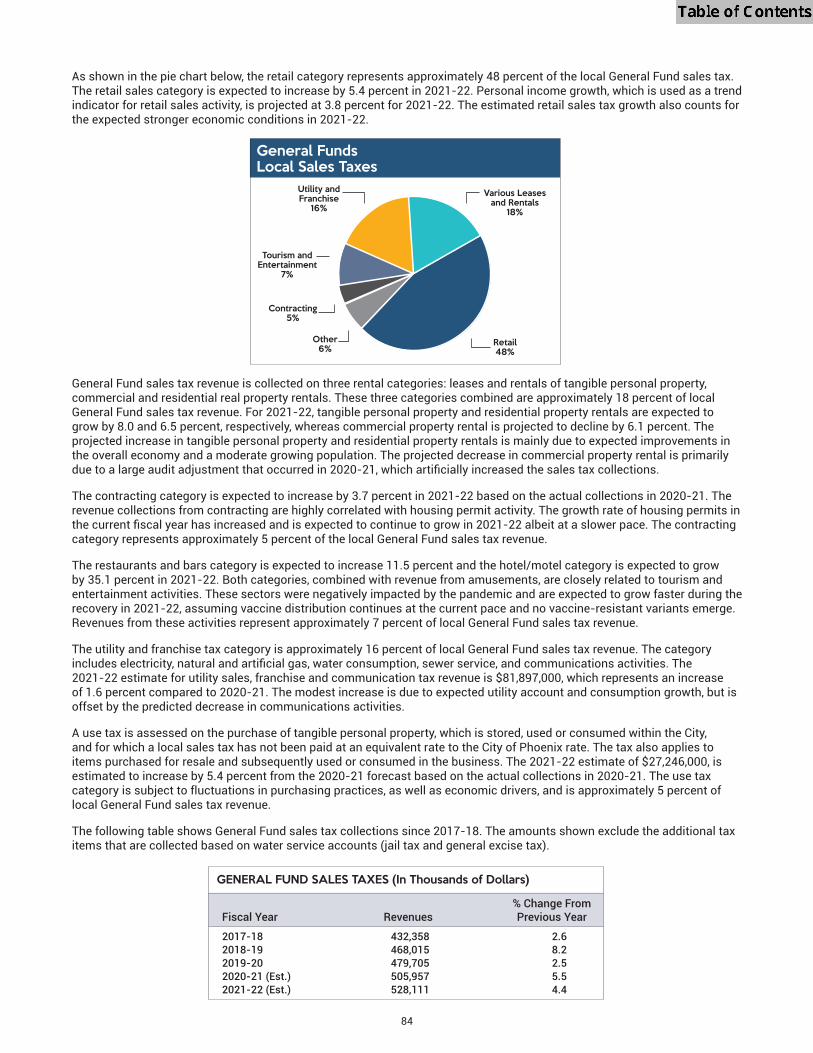
84
As shown in the pie chart below, the retail category represents approximately 48 percent of the local General Fund sales tax. The retail sales category is expected to increase by 5.4 percent in 2021-22. Personal income growth, which is used as a trend indicator for retail sales activity, is projected at 3.8 percent for 2021-22. The estimated retail sales tax growth also counts for the expected stronger economic conditions in 2021-22.
General Fund sales tax revenue is collected on three rental categories: leases and rentals of tangible personal property, commercial and residential real property rentals. These three categories combined are approximately 18 percent of local General Fund sales tax revenue. For 2021-22, tangible personal property and residential property rentals are expected to grow by 8.0 and 6.5 percent, respectively, whereas commercial property rental is projected to decline by 6.1 percent. The projected increase in tangible personal property and residential property rentals is mainly due to expected improvements in the overall economy and a moderate growing population. The projected decrease in commercial property rental is primarily
The contracting category is expected to increase by 3.7 percent in 2021-22 based on the actual collections in 2020-21. The revenue collections from contracting are highly correlated with housing permit activity. The growth rate of housing permits in
category represents approximately 5 percent of the local General Fund sales tax revenue.
The restaurants and bars category is expected to increase 11.5 percent and the hotel/motel category is expected to grow by 35.1 percent in 2021-22. Both categories, combined with revenue from amusements, are closely related to tourism and entertainment activities. These sectors were negatively impacted by the pandemic and are expected to grow faster during the recovery in 2021-22, assuming vaccine distribution continues at the current pace and no vaccine-resistant variants emerge. Revenues from these activities represent approximately 7 percent of local General Fund sales tax revenue.
The utility and franchise tax category is approximately 16 percent of local General Fund sales tax revenue. The category
2021-22 estimate for utility sales, franchise and communication tax revenue is $81,897,000, which represents an increase of 1.6 percent compared to 2020-21. The modest increase is due to expected utility account and consumption growth, but is offset by the predicted decrease in communications activities.
A use tax is assessed on the purchase of tangible personal property, which is stored, used or consumed within the City, and for which a local sales tax has not been paid at an equivalent rate to the City of Phoenix rate. The tax also applies to items purchased for resale and subsequently used or consumed in the business. The 2021-22 estimate of $27,246,000, is estimated to increase by 5.4 percent from the 2020-21 forecast based on the actual collections in 2020-21. The use tax category is subject to fluctuations in purchasing practices, as well as economic drivers, and is approximately 5 percent of local General Fund sales tax revenue.
The following table shows General Fund sales tax collections since 2017-18. The amounts shown exclude the additional tax items that are collected based on water service accounts (jail tax and general excise tax).
GENERAL FUND SALES TAXES (In Thousands of Dollars)
% Change FromFiscal Year Revenues Previous Year
2017-18 432,358 2.62018-19 468,015 8.22019-20 479,705 2.52020-21 (Est.) 505,957 5.52021-22 (Est.) 528,111 4.4
Retail 48%
Other 6%
Utility andFranchise
16%
Contracting 5%
Tourism and Entertainment
7%
Various Leases and Rentals
18%
General FundsLocal Sales Taxes

85
Privilege License Fees
The City charges a $50 annual license fee to businesses that engage in activity where a transaction privilege tax is imposed. This category also includes a $2 per unit ($50 maximum) annual fee on each apartment complex for non-transient lodging. The 2021-22 estimate for privilege license fee revenue of $2,800,000 is projected to remain flat from the 2020-21 estimate.
Other General Fund Excise Taxes
The jail tax collected on water service accounts was implemented on October 1, 1990 and provides resources to help offset jail costs paid to Maricopa County for misdemeanor defendants. The City Council voted to reduce the jail tax 50 percent effective July 2012. The 2021-22 estimate of $7,460,000 is $70,000 or 0.9 percent more than the 2020-21 estimate of $7,390,000. This category also includes a general city services excise tax on municipal services bills based on water meter size implemented in July 2014. The 2021-22 estimate for the general city services excise tax of $11,170,000 is $110,000 or 1.0 percent more than the 2020-21 estimate of $11,060,000. The Government Property Lease Excise Tax (GPLET) is also included in this category, which is a tax incentive agreement negotiated between a private party and a local government. It was established by the State of Arizona in 1996 to stimulate development in commercial districts by temporarily replacing a building’s property tax with an excise tax. The 2021-22 estimate for the GPLET of $656,000 is projected to remain flat from the 2020-21 estimate.
STATE-SHARED REVENUES
This major revenue category consists of the City’s share of the state sales tax, the state income tax and vehicle license tax. The 2021-22 estimate for this category is $496,361,000, which is $8,974,000 or 1.8 percent less than the 2020-21 estimate of $505,335,000. The decrease is due to an estimated decrease of 8.7 percent in state-shared income tax. It is offset by an estimated increase of 4.2 percent in state sales tax and estimated growth of 5.2 percent in vehicle license tax.
Prior to 2016-17 state-shared revenues were distributed to cities and towns based on mid-decade and decennial census counts and thus, except for minor adjustments primarily due to annexations, each city or town’s relative share only changed
updated annually based on Census Bureau population estimates starting in 2016-17. The decennial census will continue to be used, but only for the year it is completed.
State SharedRevenue36.6%
General FundsTotal Revenues - $1,355.8 Million
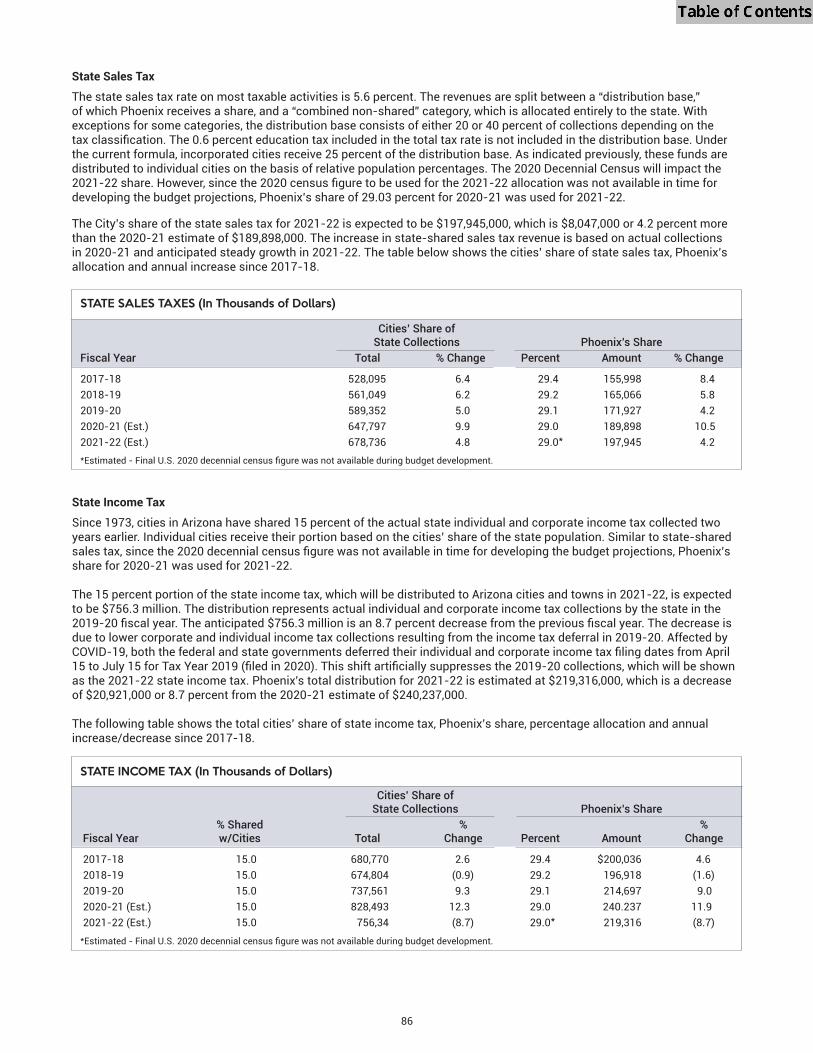
86
STATE SALES TAXES (In Thousands of Dollars)
Cities’ Share of State Collections Phoenix’s ShareFiscal Year Total % Change Percent Amount % Change
2017-18 528,095 6.4 29.4 155,998 8.42018-19 561,049 6.2 29.2 165,066 5.82019-20 589,352 5.0 29.1 171,927 4.22020-21 (Est.) 647,797 9.9 29.0 189,898 10.52021-22 (Est.) 678,736 4.8 29.0* 197,945 4.2*
State Income Tax
Since 1973, cities in Arizona have shared 15 percent of the actual state individual and corporate income tax collected two years earlier. Individual cities receive their portion based on the cities’ share of the state population. Similar to state-shared
share for 2020-21 was used for 2021-22.
The 15 percent portion of the state income tax, which will be distributed to Arizona cities and towns in 2021-22, is expected to be $756.3 million. The distribution represents actual individual and corporate income tax collections by the state in the
due to lower corporate and individual income tax collections resulting from the income tax deferral in 2019-20. Affected by
as the 2021-22 state income tax. Phoenix's total distribution for 2021-22 is estimated at $219,316,000, which is a decrease of $20,921,000 or 8.7 percent from the 2020-21 estimate of $240,237,000.
The following table shows the total cities’ share of state income tax, Phoenix’s share, percentage allocation and annual increase/decrease since 2017-18.
State Sales Tax
The state sales tax rate on most taxable activities is 5.6 percent. The revenues are split between a “distribution base,” of which Phoenix receives a share, and a “combined non-shared” category, which is allocated entirely to the state. With exceptions for some categories, the distribution base consists of either 20 or 40 percent of collections depending on the
the current formula, incorporated cities receive 25 percent of the distribution base. As indicated previously, these funds are distributed to individual cities on the basis of relative population percentages. The 2020 Decennial Census will impact the
developing the budget projections, Phoenix’s share of 29.03 percent for 2020-21 was used for 2021-22.
The City’s share of the state sales tax for 2021-22 is expected to be $197,945,000, which is $8,047,000 or 4.2 percent more than the 2020-21 estimate of $189,898,000. The increase in state-shared sales tax revenue is based on actual collections in 2020-21 and anticipated steady growth in 2021-22. The table below shows the cities’ share of state sales tax, Phoenix’s allocation and annual increase since 2017-18.
STATE INCOME TAX (In Thousands of Dollars)
Cities’ Share of State Collections Phoenix’s Share % Shared % %Fiscal Year w/Cities Total Change Percent Amount Change
2017-18 15.0 680,770 2.6 29.4 $200,036 4.6 2018-19 15.0 674,804 (0.9) 29.2 196,918 (1.6)2019-20 15.0 737,561 9.3 29.1 214,697 9.02020-21 (Est.) 15.0 828,493 12.3 29.0 240.237 11.92021-22 (Est.) 15.0 756,34 (8.7) 29.0* 219,316 (8.7)
*
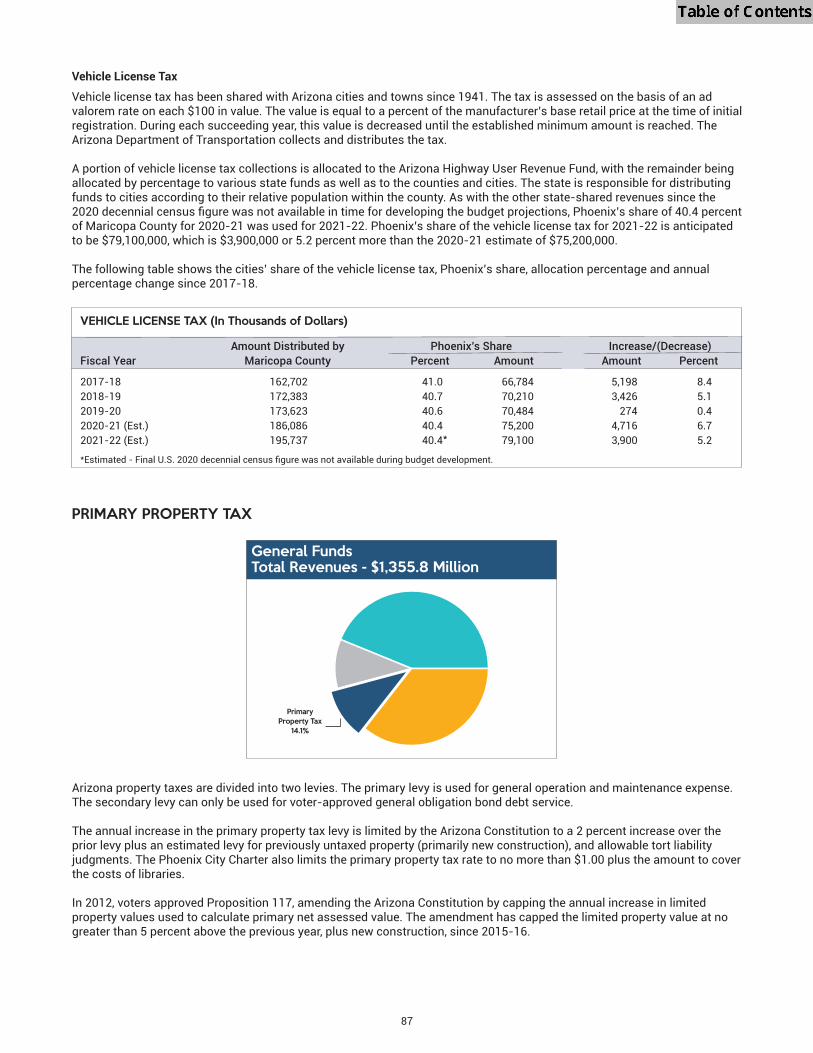
87
Vehicle License Tax
Vehicle license tax has been shared with Arizona cities and towns since 1941. The tax is assessed on the basis of an ad valorem rate on each $100 in value. The value is equal to a percent of the manufacturer’s base retail price at the time of initial registration. During each succeeding year, this value is decreased until the established minimum amount is reached. The Arizona Department of Transportation collects and distributes the tax.
A portion of vehicle license tax collections is allocated to the Arizona Highway User Revenue Fund, with the remainder being allocated by percentage to various state funds as well as to the counties and cities. The state is responsible for distributing funds to cities according to their relative population within the county. As with the other state-shared revenues since the
of Maricopa County for 2020-21 was used for 2021-22. Phoenix’s share of the vehicle license tax for 2021-22 is anticipated to be $79,100,000, which is $3,900,000 or 5.2 percent more than the 2020-21 estimate of $75,200,000.
The following table shows the cities’ share of the vehicle license tax, Phoenix’s share, allocation percentage and annual percentage change since 2017-18.
VEHICLE LICENSE TAX (In Thousands of Dollars)
Amount Distributed by Phoenix’s Share Increase/(Decrease)Fiscal Year Maricopa County Percent Amount Amount Percent
2017-18 162,702 41.0 66,784 5,198 8.42018-19 172,383 40.7 70,210 3,426 5.12019-20 173,623 40.6 70,484 274 0.42020-21 (Est.) 186,086 40.4 75,200 4,716 6.72021-22 (Est.) 195,737 40.4* 79,100 3,900 5.2*
PRIMARY PROPERTY TAX
Arizona property taxes are divided into two levies. The primary levy is used for general operation and maintenance expense. The secondary levy can only be used for voter-approved general obligation bond debt service.
The annual increase in the primary property tax levy is limited by the Arizona Constitution to a 2 percent increase over the prior levy plus an estimated levy for previously untaxed property (primarily new construction), and allowable tort liability judgments. The Phoenix City Charter also limits the primary property tax rate to no more than $1.00 plus the amount to cover the costs of libraries.
In 2012, voters approved Proposition 117, amending the Arizona Constitution by capping the annual increase in limited property values used to calculate primary net assessed value. The amendment has capped the limited property value at no greater than 5 percent above the previous year, plus new construction, since 2015-16.
General FundsTotal Revenues - $1,355.8 Million
Primary Primary Property TaxProperty Tax
14.1%14.1%

$1.50
$1.25
$1.00
$0.75
$0.50
$0.25
$0.00 2017-18
$1.34
2018-19
$1.32
2019-20
$1.31
2020-21
$1.31
2021-22
$1.31
88
The chart below shows the primary property tax rate since 2017-18.
The estimated 2021-22 primary property tax levy is $193,225,000. The levy is a 6.3 percent increase over the 2020-21 levy of $181,767,000. The primary net assessed valuation of $14.80 billion is 6.3 percent above the 2020-21 primary net assessed valuation of $13.92 billion.
Historically, actual property tax collections have been slightly lower than the amount levied. For 2021-22, collections for primary property tax are estimated to be $191,294,000, or 99 percent of the levy amount.
Primary Property Tax Rate
The 2021-22 levy results in a primary property tax rate of $1.3055 per $100 of assessed value and a secondary property tax rate of $0.8141, for a total property tax rate of $2.1196 per $100 of assessed value.
The table below shows primary assessed valuation, primary property tax revenues and primary rates since 2017-18.
PRIMARY PROPERTY TAX
Primary Net Assessed % Primary Levy % Rate per $100 NetFiscal Year Valuation (in Millions) Change (in Thousands) Change Assessed Valuation
2017-18 11,721 6.7 156,586 6.7 1.33592018-19 12,400 5.8 163,218 4.2 1.31632019-20 13,223 6.6 172,626 5.8 1.30552020-21 13,923 5.3 181,767 5.3 1.30552021-22 14,801 6.3 193,225 6.3 1.3055
Fiscal Year

89
USER FEES/OTHER REVENUES
General FundsTotal Revenues - $1,355.8 Million
User Fees andOther Revenues
8.7%
Licenses and Permits
This category consists of various business permit application and annual fees, including liquor license applications, amusement machines, annual liquor licenses and other business license applications and fees. The 2021-22 estimate of $2,771,000 is $269,000 or 10.8 percent more than 2020-21 estimate of $2,502,000. The increase assumes that the economy will continue to recover in 2021-22.
Cable Communications
The City imposes up to a 5 percent fee on the gross receipts of cable television licensees in return for the use of streets and public rights-of-way by cable companies in the provision of cable television service. The 2021-22 estimate of $9,600,000 is projected to remain flat from the 2020-21 estimate.
Fines and Forfeitures
driving under the influence, defensive driving program and substance abuse screening service. The 2021-22 estimate of $8,956,000 is $38,000 or 0.4 percent more than the 2020-21 estimate of $8,918,000. The slight increase is attributable to projected higher collections from parking violation fees.
Court Default Fee
A default fee was implemented in 1993-94 in order to recover court costs associated with defendants who fail to appear for
$40. The 2021-22 estimate for this revenue category is $1,451,000, which is $235,000 or 19.3 percent more than from the 2020-21 estimate of $1,216,000 as activity is expected to increase after the pandemic.
Fire
The Fire Department receives fees from various services. The majority of the revenue comes from emergency transportation service (ETS). This user fee includes basic life support and advanced life support services and related charges for mileage and supplies for the provision of ambulance service. The 2021-22 estimate for ETS is $33,500,000, which is $3,129,000 or 10.3 percent more than the 2020-21 estimate of $30,371,000. The increase accounts for the inflationary rate adjustment
inspection fees, computer-aided dispatch (CAD) and various other charges for the services provided to the community. The
Fund revenue sources. The 2021-22 estimate for this category is $117,923,000, which is $8,166,000 or 7.4 percent more than the 2020-21 estimate of $109,757,000. The increase is primarily due to the estimated revenue growth in emergency transportation service and other service charges. Following are descriptions of the various categories and explanations of the revenue estimates.
Hazardous Materials Permit and Inspection Fee
Because incidents involving hazardous materials have increased over the years, a hazardous material permit and inspection fee was established in October 2001. Revenues from this category are used to recover direct costs incurred for inspecting businesses that use hazardous materials. Upon review in 2003-04, the annual permit fee amount was raised. This annual permit now varies from $400 to $1,650 and depends on the volume of hazardous materials stored on site. The 2021-22 estimate is $1,500,000, which is $100,000 or 7.1 percent more than the 2020-21 estimate of $1,400,000. The increase is primarily due to more anticipated permit applications and inspections after COVID-19 restrictions ease up.
Library Fees
late. The revenue lost from this program is being partially offset by additional revenue from the Maricopa County Library Assistance Program. Library revenues are primarily generated from the Maricopa County Library Assistance Program, copier/printer and damaged library materials fees, wireless communications license fees and room rentals at City libraries. The 2021-22 estimate of $483,000 is $279,000 more than the 2020-21 estimate of $204,000. During the pandemic, several
Parks and Recreation Fees
This category includes parks concession revenues, swimming pool revenues, fees for the use of various park facilities
Baseball Facility, and other miscellaneous park fees. The 2021-22 estimate of $4,093,000 is $632,000 or 18.3 percent more than the 2020-21 estimate of $3,461,000. Due to COVID-19, revenue collections from parks programs and facilities declined dramatically in 2020-21. The increase in 2021-22 assumes higher revenues as recreation programs are resumed and facilities reopen.
Planning
User fees in this category include revenue from the sale of codes and plans, rezoning fees and zoning adjustment fees for use permits and variances. The 2021-22 estimate of $1,497,000 is $110,000 or 7.9 percent above the 2020-21 estimate of $1,387,000. The projection accounts for increased revenue from rezoning fees.
Police
The Police Department receives revenues for various services and programs. Police services are provided on a fee-per-hour basis for school and athletic events as well as other activities where a law enforcement presence is desired. In addition, a false alarm program includes both permit fees and assessments for false alarm responses. The estimate of $13,108,000 in 2021-22 is projected to increase by $133,000 or 1.0 percent from the 2020-21 forecast of $12,975,000. The increase is primarily due to anticipated higher revenues from police personal services billings and pawnshop regulatory fees, which is offset by an estimated decrease in records and information fees and miscellaneous fees.
Street Transportation
This user fee category includes permit fees for utility construction in the public rights-of- way as well as utility ordinance inspections. The 2021-22 estimate of $6,481,000 is $336,000 or 5.5 percent more than the 2020-21 estimate of $6,145,000. The increase is mainly due to an anticipated increase in revenues from utility ordinance inspection and rights-of-way fees.
Other Service Charges
Revenue in this category is composed of several non-tax sources, including interest income, parking meter revenue, in lieu property taxes, sales of surplus and abandoned property, and various rental, parking and concessions. The 2021-22 estimate of $15,306,000 is $1,717,000 or 12.6 percent more than the 2020-21 estimate of $13,589,000. The increase is primarily due to more estimated revenues from parking garages, parking meters, and interest earnings, offset by less anticipated revenue from sales of surplus and abandoned property.
All Other Fees
This fee category consists of miscellaneous service charges in the Finance, Human Services and Neighborhood Services departments and miscellaneous categories. The 2021-22 estimate of $2,579,000 is $95,000 or 3.6 percent less than the 2020-21 estimate of $2,674,000. The decrease is mainly due to lower anticipated revenue from recovery of damage claims.
90

NON-GENERAL FUNDS Non-General Fund revenues consist of two major categories: Special Revenue and Enterprise funds. The following sections provide descriptions of the various revenue sources in each category and explanations of 2021-22 revenue estimates. The table on the next page provides 2020-21 and 2021-22 estimates as well as 2019-20 actual revenue amounts for revenues within these two categories.
SPECIAL REVENUE FUNDS
are voter-approved sales taxes for Neighborhood Protection, 2007 Public Safety Expansion, Public Safety Enhancement, Parks and Preserves, and Transportation 2050. Also included in this category are revenue from Court Awards, Development Services, Capital Construction, Sports Facilities, Arizona Highway User Revenue funds, Public Transit, Community Reinvestment, Secondary Property Tax, Regional Wireless Cooperative, Golf Courses, grant funds and other revenues.
Neighborhood Protection Sales Tax
This 0.1 percent sales tax rate was approved by the voters in October 1993 and implemented in December 1993. As
(70 percent), Police Block Watch programs (5 percent) and Fire neighborhood protection programs (25 percent). The 2021-22 estimate of $40,214,000 is $1,956,000 or 5.1 percent more than the 2020-21 estimate of $38,258,000. These estimates are consistent with those for the same categories in the local sales tax discussion. In addition, $405,000 is estimated for combined net interest earnings in 2021-22, which is $3,028,000 or 88.2 percent less than the 2020-21 estimate of $3,433,000 since revenue in 2020-21 also includes the one-time Coronavirus Relief Fund.
2007 Public Safety Expansion Tax
The 2007 Public Safety Expansion sales tax is a 0.2 percent sales tax approved by voters in September 2007 and implemented in December 2007. Revenues are allocated 80 percent to Police and 20 percent to Fire. The funds are to be
medical services. The 2021-22 estimate is $80,428,000 or 5.1 percent more than the 2020-21 estimate of $76,517,000. These estimates are consistent with those for the same categories in the local sales tax discussion. In addition, $321,000 is estimated for interest earnings in 2021-22. Similar to Neighborhood Protection Sales Tax, it is $7,825,000 or 96.1 percent less than the 2020-21 estimate of $8,146,000 since revenue in 2020-21 includes the one-time Coronavirus Relief Fund.
Public Safety Enhancement Sales Tax
The Public Safety Enhancement sales tax was implemented on May 1, 2005 and is made up of the 2.0 percent increment of the 2.7 percent sales tax on utilities with franchise agreements. The fund is allocated between Police and Fire. The Police Public Safety Enhancement Fund is allocated 62 percent of revenues and is dedicated to Police and Emergency Management needs. The Fire Public Safety Enhancement Fund is allocated 38 percent of the revenues collected and is dedicated to Fire needs. The 2021-22 estimate of $24,706,000 is $325,000 or 1.3 percent greater than the 2020-21 estimate of $24,381,000. Since the 2020-21 estimate also includes the one-time Coronavirus Relief Fund, the overall Public Safety Enhancement Sales Tax is projected to be $2,102,000 or 7.8 percent less than the 2020-21 estimate of $26,808,000.
Parks and Preserves Sales Tax
The Parks and Preserves sales tax is a 0.1 percent sales tax rate increase approved by voters in September 1999 and implemented in November 1999. Revenues from the 0.1 percent tax are allocated to park improvements and acquisition of desert preserves. This tax was renewed by voters for a 30-year period in May 2008. Sixty percent of the revenues are to be used for parks and recreation and forty percent for desert preserves. The 2021-22 estimate of $40,214,000 is $1,955,000 or 5.1 percent more than the 2020-21 estimate of $38,259,000. These estimates are consistent with the estimates for the same categories in the local sales tax discussion. In addition, $1,852,000 is estimated for land rentals, lease revenue and interest earnings in 2021-22.
91

92
NON-GENERAL FUND REVENUE BY MAJOR SOURCE (In Thousands of Dollars)

Transit 2000 and Transportation 2050 Funds
Effective January 1, 2016, Proposition 104 established the Transportation 2050 sales tax, which increased the 0.4 percent Transit 2000 sales tax previously passed by Proposition 2000 to fund a comprehensive transportation plan with a new 35-year sunset date. The Proposition increased the transaction privilege (sales) tax by 0.3 percent for various business activities. Since January 2016, sales tax collections from Proposition 104 have been budgeted and accounted for in the Transportation 2050 fund, while sales tax collections prior to that time from Proposition 2000 were included in the Transit 2000 fund. The 2021-22 sales tax estimate for Transportation 2050 is $274,395,000, which is $13,212,000 or 5.1 percent more than the 2020-21 estimate of $261,183,000. These estimates are consistent with the estimates for the same categories in the local sales tax discussion. Also included in this fund are fare box and other miscellaneous transit system revenues. Fare box revenues are the revenues collected by the transit service for bus ridership. The 2021-22 fare box revenue estimate of $19,129,000 is projected to increase by $14,449,000 from the 2020-21 estimate of $4,680,000. This increase is primarily attributable to anticipated increases in ridership after the pandemic. The 2021-22 estimate also includes interest earnings and other miscellaneous revenue of $8,844,000, which is $2,331,000 or 20.9 percent less than the 2020-21 estimate of $11,175,000. This decrease is due to less anticipated revenue from bus shelter advertising and interest income.
Court Awards Funds
The City of Phoenix receives funds as a result of participation in the arrest and/or prosecution of certain criminal cases. These funds, referred to as Court Awards funds, represent court-ordered forfeitures of seized assets. Their use is limited to police and prosecutor functions. Revenue estimates are based on cases in progress. The estimate for 2021-22 is $5,296,000, which is $312,000 or 5.6 percent less than the 2020-21 estimate of $5,608,000. The decrease reflects less anticipated cases in 2021-22.
Development Services
Revenues in this user fee category include building permits and plans review, subdivision and site plan fees, sign permit fees, and engineering permits and plan review fees. These fees are used to fully support the activities of Development Services. The 2021-22 estimate is $71,428,000, which is $1,928,000 or 2.8 percent more than the 2020-21 estimate of $69,500,000. This increase is primarily due to estimated revenue growth in building and new sign permit fees, building inspection fees, building plans review fees, and site plan and engineering plan review fees.
Capital Construction
This category includes revenue from a 2 percent increase in the sales tax on telecommunications implemented in February 1998 and is intended to reimburse Phoenix residents for the use of their public rights of way by the telecommunications industry. These funds are used primarily for right-of-way improvements in the Street Transportation Capital Improvement Program. The 2021-22 estimate is $7,370,000, which is $420,000 or 5.4 percent less than the 2020-21 estimate of $7,790,000. The telecommunications tax category has experienced a declining trend; thought to be caused by transition from the hard-wired telephone lines to non-taxable data/Internet-based communications. The 2021-22 estimate also includes interest earnings of $222,000.
Sports Facilities
Sports facilities revenues consist of a 1 percent portion of the 5.3 percent hotel/motel tax category, a 2 percent tax on short-term motor vehicle rentals, and interest revenue generated by the fund. The 2021-22 estimate is $15,578,000, which is $4,701,000 more than the 2020-21 estimate of $10,877,000. The revenue estimates are consistent with the estimates for the same categories in the local sales tax discussion. The 2021-22 estimate also includes $4,240,000 in other revenues, including lease payments from TGen and interest earnings.
Arizona Highway User Revenue
The State Transportation Financing Plan adopted by the Legislature in 1981 and amended in 1982 and 1985 included a 13 cent per gallon gas tax plus other user fees and charges such as registrations, driver’s licenses, motor carrier taxes, other miscellaneous fees and an increased share of the motor vehicle license taxes. Additional gasoline taxes were added in 1986 (3 cents per gallon), in 1988 (1 cent per gallon), and in 1990 (1 cent per gallon) for a total state gas tax rate of 18 cents per gallon. These statewide funds are deposited in the state’s Highway User Revenue Fund (HURF) for allocation, including an allocation to cities and towns. Phoenix’s HURF distribution is recorded in the City’s Arizona Highway User Revenue (AHUR) fund. A new distribution formula for HURF was passed by the Legislature and signed by the governor in May 1996 (effective July 1, 1996). It was intended to be revenue neutral to cities. This distribution formula provides 27.5 percent to incorporated cities and towns (distributed one-half on the relative population of the cities and towns and one-half on the county origin of sales/relative population of the counties) and 3 percent to cities over 300,000 population (Phoenix, Tucson and Mesa). In 2016-17 and 2017-18, to partially offset the impact of supplementing the Department of Public Safety with HURF, the Arizona State Budget included a special distribution of $30 million from the State General Fund to Arizona counties, cities and towns, equating to $4.8 million per year for the City of Phoenix. This supplemental distribution as well as the Department of Public Safety’s HURF distribution was discontinued in 2019-20. For 2021-22, Phoenix is projected to receive $118.8 million from the allocation to all cities and towns and $30.1 million from the allocation to cities and towns over 300,000 population. The total 2021-22 HURF distribution estimate of $148,960,000 is $6,841,000 more than the 2020-21 estimate of $142,119,000.
93

Regional Transit Revenues
This category includes revenue from the Regional Public Transportation Authority (RPTA) for the regional transportation plan, other state funding agencies, and the sale of bus service provided to other jurisdictions. The 2021-22 estimate of $38,945,000 is $11,117,000 or 39.9 percent higher than the 2020-21 estimate of $27,828,000. The increase is due to an increase in reimbursements from RPTA for regional transportation plan-funded projects.
Community Reinvestment
The 2021-22 estimate of $5,863,000 is $75,000 less than the 2020-21 estimate of $5,938,000 and represents estimated revenues to be received through various economic redevelopment agreements in the downtown area. The slight decrease is due to an estimated decline in lease revenue in 2021-22.
Secondary Property Tax
By law, secondary property taxes are used to pay debt service on voter-approved general obligation bonds. In 2012, voters approved Proposition 117, amending the Arizona Constitution by capping the annual increase in limited property values used to calculate primary net assessed value. Proposition 117 additionally replaced secondary net assessed value with primary net assessed value as the base for secondary property taxes beginning in 2015-16. The amendment caps the
General Fund revenue section, the 2021-22 primary property tax rate is $1.3055 per $100 of assessed valuation and remains unchanged from the 2020-21 primary property tax rate. The 2021-22 secondary rate is $0.8141 per $100 of assessed value, and represents a $0.01 cent decrease from the 2020-21 secondary rate of $0.8241 for a combined property tax rate of $2.1196. The 2021-22 secondary property tax levy of $120,494,000 is based on this $0.8141 rate and the primary net assessed valuation of $14.80 billion. This resulting levy increases the 2020-21 secondary property tax levy of $114,741,000 by $5,753,000 to satisfy debt service requirements. Also included in the 2021-22 estimate is $4,397,000 in bond interest subsidies. Revenues are partially offset by an estimated $1,205,000 in uncollected taxes. In total, secondary property tax and bond interest subsidy revenue is estimated to be $123,686,000. The table below shows secondary assessed valuation, secondary property tax levies and secondary property tax rates since 2017-18.
94
Current trends are forecast to continue for the balance of 2020-21 with the Gas and Use Fuel category returning to positive growth rates beginning in 2021-22. Estimates for interest and other income are projected to remain stable between 2020-21 and 2021-22, at $760,000 and $755,000, respectively. The table below shows the state-shared HURF allocations to the City of Phoenix since 2017-18.
SECONDARY PROPERTY TAX
Rate per $100 Net Assessed Valuation % Secondary Levy % Net AssessedFiscal Year (in Millions) Change (in Thousands) Change Valuation
2017-18 11,721 6.7 96,596 5.5 0.82412018-19 12,400 5.8 102,187 5.8 0.82412019-20 13,223 6.6 108,971 6.6 0.82412020-21 13,923 5.3 114,741 5.3 0.8241 2021-22 14,801 6.3 120,494 5.0 0.8141
ARIZONA HIGHWAY USER REVENUES (In Thousands of Dollars)
Increase/(Decrease)Fiscal Year AHUR Distribution Amount Percent
2017-18 131,355 5,303 4.22018-19 138,864 7,509 5.72019-20 135,984 (2,880) (2.1)2020-21 (Est.) 142,119 6,135 4.52021-22 (Est.) 148,960 6,841 4.8

Regional Wireless Cooperative
The Regional Wireless Cooperative (RWC) is an independent, multi-jurisdictional organization that manages and operates
Phoenix metropolitan region. As the managing network and administrative member, Phoenix is responsible for operating and maintaining the network and for the accounting, budgeting, procurement and contracting functions. The revenue in this fund primarily consists of reimbursements from the other participating jurisdictions for their share of the cost to operate and maintain the network. The 2021-22 revenue estimate of $5,515,000 is $28,000 less than the 2020-21 estimate of $5,543,000. The slight decrease is due to less anticipated revenue from the Special Assessments fund for the Conventional Network (VHF) project.
Golf Courses
and pro shop sales at city-run golf courses which include Aguila, Cave Creek, Encanto, and Palo Verde. The 2021-22 estimate of $6,794,000 is $1,645,000 less than the 2020-21 estimate of $8,439,000. The reduction is due to higher revenue estimates in 2020-21. Covid-19 has positively affected the demand for golf services and therefore revenue collections from golf courses. Demand is expected to return to normal levels after the pandemic.
Impact Fee Program Administration
In 1987, the City Council established an Impact Fee Program. Impact fees are charged to new development in the City’s peripheral planning areas. Impact fees assess new development for its proportionate costs of public infrastructure that
conjunction with the Impact Fee Program, an administrative fee collected as a percentage of the gross impact fee is also charged. This administrative fee pays for the costs of administering the overall Impact Fee Program. The 2021-22 revenue is estimated at $525,000, which is 1.9% greater than the 2020-21 revenue estimate of $515,000.
Other Restricted Fees
Included in this category are revenues associated with the Court Technology Enhancement fee and the Judicial Collection Enhancement Fund, monopole rentals from several City parks, Tennis Center at Washington Park, Vehicle Impound fees, Heritage Square, Affordable Housing Program, and Jet Fuel Other Restricted Fund. The Jet Fuel Other Restricted Fund was established to account for jet fuel sales and use tax as a result of an FAA policy requiring that those funds be used only for aviation-related purposes, which was subsequently included in State law with an effective date of December 2017. Also
The 2021-22 estimate of $36,929,000 is $11,646,000 or 46.1 percent more than the 2020-21 estimate of $25,283,000. The increase is primarily due to higher anticipated revenues from the Affordable Housing Program since the 2020-21 estimate includes a one-time revenue transfer from the Housing Department to the Neighborhood Services Department for loan repayment receipts. Higher Parks program fees are also attributable to the growth in 2021-22.
Public Housing Grants
The 2021-22 Public Housing grants revenue included in the annual operating budget is $105,745,000, which is $3,988,000 or 3.6 percent less than the 2020-21 estimate of $109,733,000. This decrease is primarily due to less HOME Investment Partnerships Program (HOME) funding from the federal government and the expiration of several grants, which is offset by more revenue from housing assistance payments. The HOME program is aimed at increasing the availability of affordable
housing subsidies, rentals, and interest income.
Human Services Grants
The 2021-22 revenue estimate of $86,581,000 is $9,866,000 or 10.2 percent less than the 2020-21 estimate of $96,447,000. The decrease is primarily due to the ending of the Coronavirus Aid, Relief, and Economic Security Act (CARES) funding, which is offset by estimated increases in Human Services Operating Grants. This category includes funds from the Department of Health and Human Services, Department of Housing and Urban Development, Workforce Investment Act, Aging Program Grants, and Head Start funds.
Community Development Block Grant
Each year since 1974, the City has received Community Development Block Grant (CDBG) funds from the U.S. Department of Housing and Urban Development. These funds are used to support a variety of projects and programs that must meet
and blight; or meet other urgent community development needs. The 2021-22 CDBG entitlement is $70,581,000 which is $28,786,000 or 68.9 percent more than the 2020-21 estimate of $41,795,000. The increase is due to a carryover from 2020-21 of grant revenues from the federal government and additional revenue from the federal government for COVID-19 related expenses.
95

Criminal Justice Grants
The 2021-22 grant revenue for criminal justice programs is estimated to be $18,876,000, which is $4,107,000 or 27.8 percent more than the 2020-21 estimate of $14,769,000. The increase is primarily due to the anticipated funding aid from the federal government for Police, Court and Law departments. Grants include funding for the Police Department training academy, drug
Public Transit Grants
The 2021-22 Federal Transit Administration Grant estimate is $240,756,000 reflecting an increase of $98,407,000 or 69.1
from the Coronavirus Response and Relief Supplemental Appropriations Act (CRRSAA) and the American Rescue Plan Act (ARPA) to continuously prevent, prepare for and respond to COVID-19.
Other Grants
The 2021-22 budget also includes $508,465,000 for federal, state and other grants which is $372,476,000 or 273.9 percent more than the 2020-21 estimate of $135,989,000. The substantial increase is primarily due to State and Local Fiscal Recovery Funds awarded to the City of Phoenix under the ARPA signed by President Biden in March 2021 to provide further relief from the COVID-19 pandemic. This funding will be allocated based on a Council approved strategic plan and in accordance with federal guidelines. This category also includes grant funding for various parks and recreation and library
the Neighborhood Stabilization Program.
ENTERPRISE FUNDSThis category includes revenues from the City’s Enterprise funds including Aviation, Water, Wastewater and Solid Waste. These Enterprise funds fully recover their costs through user fees associated with the provision of their services. This category also includes the Convention Center that, in addition to the user fees associated with the operation of the Convention Center, is supported by earmarked sales taxes. Following are descriptions of each Enterprise Fund category and explanations of the revenue estimates.
Aviation
Aviation revenue estimates primarily include airline operation fees, concession revenues and interest income at Sky Harbor International, Deer Valley and Goodyear airports. In December 2019, the City Council approved the imposition of new rideshare fees at Sky Harbor International Airport to help reduce the number of vehicles at the terminals and encourage use of the free Sky Train. The fees went into effect on May 1, 2020 after being unanimously upheld by the Arizona Supreme
maintenance and improvements at the airport. Total Aviation revenue for 2021-22 is anticipated to be $412,547,000, which is $13,930,000 or 3.3 percent less than the 2020-21 estimate of $426,477,000. The decrease is due to the elimination of CARES Act revenue received in 2020-21 in response to the pandemic, which is not anticipated in 2021-22. The decrease is offset by expected increases in airline operation fees, concession and rental revenues as travel resumes after the pandemic.
The following table shows Aviation revenue by major category and annual percent change since 2017-18.
96
SUMMARY OF AVIATION REVENUES (In Thousands of Dollars)
2020-21 2021-22 2017-18 2018-19 2019-20 (Est.) (Est.)
Airline Operation 151,326 157,123 159,116 139,646 170,264 Concessions and Rentals 215,631 220,644 173,643 131,668 220,522Interest 7,019 9,241 10,418 5,711 5,711 Other/Federal Grants 6,093 2,466 12,856 143,327 9,644Goodyear 2,647 2,615 2,947 2,760 2,884Deer Valley 3,172 3,144 3,366 3,365 3,522
Total Aviation Revenue 385,888 395,233 362,346 426,477 412,547 Change From Prior Year 8.8% 2.4% (8.3)% 17.7% (3.3)%

97
Water System
Water system revenues include water sales, development fees, various water service fees, resource acquisition fees, fees paid by other jurisdictions for the operation of the Val Vista Water Treatment Plant and other miscellaneous fees. Total water system revenue for 2021-22 is projected to be $487,696,000, which is $15,283,000 or 3.0 percent less than the $502,979,000 estimate for 2020-21, despite the City Council action on March 17, 2021 to adopt water rate increases of 3 percent effective in October 2021 and 3.5 percent in March 2022. The decrease in water revenue is primarily based on the assumption that water consumption will be less in 2021-22 as compared to 2020-21.
The following table shows water system revenues by major category since 2017-18.
Wastewater System
Wastewater system revenues include monthly sewer service charge revenues, which are based on water consumption rates, development fees, the sale of wastewater treatment services to other jurisdictions, the sale of effluent and other miscellaneous fees. The wastewater system is expected to generate revenue of $254,696,000 in 2021-22, which is $1,488,000 or 0.6 percent more than the 2020-21 estimate of $253,208,000. The increase is mainly due to expected revenue growth in sewer service charges and environmental charges, which is offset by an anticipated decrease in interest earnings.
The following table shows Wastewater revenue by major category and annual percent change since 2017-18.
SUMMARY OF WASTEWATER SYSTEM REVENUES (In Thousands of Dollars)
2020-21 2021-22 2017-18 2018-19 2019-20 (Est.) (Est.)
Sewer Service Charge 166,711 168,740 171,133 172,296 174,019Environmental Charges 34,474 35,032 35,294 35,747 36,105Development Fees 3,751 4,048 5,152 4,400 4,400Interest 3,481 3,984 6,047 4,654 3,317Multi-City 14,884 15,205 15,296 15,885 16,050Other 15,944 15,950 19,742 20,226 20,805
Total Wastewater Revenue 239,245 242,959 252,664 253,208 254,696 Change From Prior Year 4.6% 1.6% 4.0% 0.2% 0.6%
Solid Waste
$189,869,000 is an increase of $7,691,000 or 4.2 percent above the 2020-21 estimate of $182,178,000. The revenue increase is due to more anticipated revenue from solid waste service fees. In February 2020, the City Council approved an increase to the solid waste monthly rate for residential customers of $3.75 effective in April 2020 and another increase of $3.25 effective in January 2021, and a 2 percent inflation rate to be added to the residential rate each year effective in January 2022 until 2026.
SUMMARY OF WATER SYSTEM REVENUES (In Thousands of Dollars)
2020-21 2021-22 2017-18 2016-19 2019-20 (Est.) (Est.)
Water Sales 342,094 302,919 315,381 355,542 343,515 Environmental Consumption Charge 34,427 42,846 68,719 79,299 74,227 Raw Water Charge 26,451 26,395 34,427 39,999 36,693 Interest 3,613 3,844 5,225 8,555 8,374 Development Fees 3,916 4,221 5,536 4,900 4,900 Combined Service Fees 2,326 2,143 1,983 2,500 5,000 Val Vista 6,461 6,846 8,081 8,117 8,735 All Other 14,944 13,585 14,763 4,067 6,252 Total Water Revenue 434,232 402,799 454,115 502,979 487,696
Change From Prior Year 4.0% (7.2)% 12.7% 10.8% (3.0)%

98
Convention Center
The majority of Convention Center revenues are from earmarked sales taxes including a 0.5 percent tax on advertising, a 0.5 percent portion of the 2.3 percent tax on construction, printing, publishing, transportation/towing and restaurant/ bar sales, plus a 2.0 percent portion of the 5.3 percent hotel/motel tax on rooms rented for 30 days or less.
Earmarked sales taxes are expected to produce $57,196,000 in 2021-22, an increase of $6,776,000 or 13.4 percent above the 2020-21 estimate of $50,420,000. Convention Center operating revenues are expected to be $14,585,000, parking revenue is expected to be $3,101,000, and interest revenue is expected to be $1,114,000, for total revenue estimates of $75,996,000. This is $22,019,000 or 40.8 percent more than the 2020-21 total estimated revenue of $53,977,000. The increase is based on the assumption that the activity levels at the convention center and the economy will continuously recover and get close to the pre-crisis level. Tax estimates are consistent with General Fund sales tax estimates for the categories included in Convention Center.
The following table shows the Convention Center excise tax collections since 2017-18.
CONVENTION CENTER SALES TAXES (In Thousands of Dollars)
Increase/(Decrease)Fiscal Year Amount Collected Amount Percent
2017-18 52,730 3,679 7.52018-19 61,200 8,470 16.12019-20 55,266 (5,934) (9.7)2020-21 (Est.) 50,420 (4,846) (8.8)2021-22 (Est.) 57,196 6,776 13.4
Overall growth rates differ from General Fund sales taxes due to the smaller number of categories, differing proportions of the total and their more volatile nature. As shown in the following pie chart, contracting and tourism represent 94 percent of the sales tax revenue to this fund. Both industries are considered volatile; and both have experienced dramatic changes in the last several years. The tourism industry has been hit especially hard by the novel coronavirus. In the General Fund, however, contracting and tourism represent only 12 percent of the sales tax revenue. Because of this, any changes to these more volatile industries have a greater impact in this fund’s sales tax revenue than in the General Fund’s sales tax revenue. The increase estimates assume the city sales tax will continue to recover from the pandemic and no vaccine-resistant variants emerge in 2021-22.
2021-22 Convention Center Earmarked Sales Taxes
Contracting 36%
Other 6%
Tourism-related 58%
99
GENERALGOVERNMENT

100
MAYOR
Program GoalThe Mayor is elected on a nonpartisan ballot to represent the entire City for a four-year term. The Mayor represents
the City Council, administrative staff and the community at large. The Mayor recommends and votes on policy direction for the City and chairs all City Council meetings.
Budget Allowance Explanation
of $2,323,000 is $65,000 or 2.9 percent more than 2020-21 estimated expenditures. The budget reflects negotiated increases in employee compensation and other normal inflationary adjustments.
CITY COUNCIL
Budget Allowance ExplanationThe 2021-22 City Council operating budget allowance of $5,577,000 is $179,000 or 3.3 percent more than 2020-21 estimated expenditures. The budget reflects negotiated increases in employee compensation and other normal inflationary adjustments.
Expenditure and Position Summary
2019-20 2020-21 2021-22 Actual Estimate Budget
Operating Expense $1,624,000 $2,258,000 $2,323,000 Total Positions 13.0 15.3 14.3 Source of Funds: General $1,624,000 $2,244,000 $2,323,000Grants - 14,000 -
Expenditure and Position Summary
2019-20 2020-21 2021-22 Actual Estimate Budget
Operating Expense $4,024,000 $5,398,000 $5,577,000 Total Positions 33.0 32.0 32.0 Source of Funds: General $4,024,000 $5,398,000 $5,577,000
Program GoalThe City Council is composed of eight council members elected by districts on a nonpartisan ballot. Four-year terms for council members from even-numbered districts expire in April 2023. Terms for council members from odd-numbered districts expire in April 2025. The City Council serves as the legislative and policy-making body of the municipal government and has responsibilities for enacting City ordinances, appropriating funds to conduct city business and providing policy direction to the administrative staff. Under the provisions of the City Charter, the City Council appoints a city manager, who is responsible for carrying out its established policies and administering operations.

101
CITY MANAGER
Program Goal
professional administration of the policies and objectives established by the Mayor and City Council, develops alternative solutions to community problems for Mayor and City Council consideration and plans programs that meet the future public needs of the City. Deputy City Managers oversee and provide assistance to City departments to ensure achievement of their departmental objectives and the objectives of the city government as a whole.
Budget Allowance Explanation
is $4,915,000 or 35.8 percent less than 2020-21 estimated expenditures. This is primarily due to decreased costs in the General Fund and Grants Funds.
The General Fund 2021-22 budget allowance of $8,111,000 is $2,997,000 or 27.0 percent less than 2020-21 estimated expenditures. The decrease is primarily due to the conclusion of the General Fund resources made available through the offset of public safety salaries with the Coronavirus Relief Fund. This is partially
increases in employee compensation.
The Grants 2021-22 budget allowance of $494,000 is $1,994,000 or 80.1 percent less than 2020-21 estimated expenditures. This is primarily due to the conclusion of the federal grant for the Coronavirus Relief Fund.
Expenditure and Position Summary
2019-20 2020-21 2021-22 Actual Estimate Budget
Operating Expense $2,433,000 $13,741,000 $8,826,000 Total Positions 20.5 27.9 33.9 Source of Funds: General Fund $2,338,000 $11,108,000 $8,111,000Grants 94,000 2,488,000 494,000Other Restricted 1,000 0 0Water 0 146,000 222,000
REGIONAL WIRELESS COOPERATIVE
Program GoalThe Regional Wireless Cooperative (RWC) is an independent, multi-jurisdictional organization that manages and operates a regional radio communications network, built to seamlessly serve the interoperable
municipal radio users in and around Central Arizona's Valley of the Sun. Formerly known as the Phoenix Regional Wireless Network, the RWC has expanded to service a still
many other area entities who serve public safety needs. The RWC was formed through a governance structure founded on the principle of cooperation for the mutual
Budget Allowance ExplanationThe RWC 2021-22 operating budget allowance of $5,485,000 is $462,000 or 7.8 percent less than 2020-21 estimated expenditures. The budget reflects increased credits received for radio services due to an increase in the number of units in service and is partially offset by negotiated increases in employee compensation.
Expenditure and Position Summary
2019-20 2020-21 2021-22 Actual Estimate Budget
Operating Expense $4,636,000 $5,947,000 $5,485,000 Total Positions 4.0 4.0 4.0 Source of Funds: RWC $4,636,000 $5,947,000 $5,485,000

102
GOVERNMENT RELATIONSProgram GoalGovernment Relations represents the City, as appropriate, in contacts with federal, state, regional, county and other local governments. Government Relations also is charged with citywide grants coordination.
Budget Allowance ExplanationThe Government Relations 2021-22 operating budget allowance of $1,259,000 is $255,000 or 16.8 percent less than 2020-21 estimated expenditures due to the completion of marketing and engagement efforts for the 2020 Census. This is partially offset by negotiated increases in employee compensation and other normal inflationary adjustments.
2019-20 2020-21 2021-22 Actual Estimate1 Budget Percentage of Arizona state legislative bills opposed by the City which were not enacted 89% 85% 85% 2 72 82 70 Success rate of federal and state competitive grants and private foundation grants that 77% 77% 75% Government Relations assisted departments securing Number of tribal gaming grants processed by Government Relations 81 85 84
Government Relations Major Performance Measures and Service Levels
1 Based on 10 months actual experience.2 2020-21increase in federal meetings is due to discussions on the Federal American Rescue Plan and the Coronavirus Relief Fund.
Expenditure and Position Summary 2019-20 2020-21 2021-22 Actual Estimate Budget Operating Expense $4,291,000 $1,514,000 $1,259,000 Total Positions 7.0 5.0 5.0 Source of Funds: General Fund $2,359,000 $1,270,000 $1,259,000Other Restricted 1,853,000 - -Grants 79,000 244,000 -
Expenditure and Position Summary 2019-20 2020-21 2021-22 Actual Estimate Budget Operating Expense $2,446,000 $2,740,000 $3,159,000 Total Positions 19.1 19.1 20.1 Source of Funds: General Fund $2,365,000 $2,684,000 $3,159,000Other Restricted 50,000 50,000 0Grants 32,000 6,000 0
COMMUNICATIONS OFFICEProgram Goal
and events to residents, businesses, visitors and the media. The
in promoting their programs and messages. In addition, the
educational programming of PHX TV Classroom and daily content for both the City website and the City’s main social media platforms.
1 Based on 10 months actual experience.2 The anticipated increase in FY21-22 is due to a new contract for media monitoring services commencing in July 2021 which will provide a more accurate measure of news
release success than the current method.3 4 The anticipated decrease in FY20-21 and FY21-22 is due to less people viewing the phoenix.gov website for COVID-19 information.
Budget Allowance Explanation
allowance of $3,159,000 is $419,000 or 15.3 percent more than 2020-21 estimated expenditures. The increase is primarily due to negotiated increases in employee compensation, contractual services for the new public records request system software, and the addition of a position to assist with tracking and responding to public records requests.
2019-20 2020-21 2021-22 Actual Estimate1 Budget Percent of news releases that generate media coverage2 73% 75% 80% New PHX 11 programs produced per year3 360 400 360 Percent of news distributed to stakeholders by 5 p.m. daily 93% 95% 95% Percent of email responses to public inquiries within one day 96% 96% 96% Average response time to public records requests (days) 1.5 1.5 1.5 Phoenix.gov pageviews (monthly average)4 1,313,457 1,250,000 1,200,000

103
CITY AUDITOR
Program GoalThe City Auditor Department supports the city manager and elected
and services by providing independent and objective feedback on the City’s programs, activities and functions. The City auditor’s work is
effectively and honestly. The City Auditor budget also funds an annual independent audit conducted by outside auditors in accordance with the City Charter. This includes an audit of City accounting and
and review of business systems for possible improvements.
Budget Allowance ExplanationThe City Auditor 2021-22 operating budget allowance of $3,174,000 is $262,000 or 9.0 percent more than 2020-21 estimated expenditures. The increase is primarily due to negotiated increases in employee compensation, fewer anticipated vacancies and retirements, and increased costs for computer software agreements.
2019-20 2020-21 2021-22 Actual Estimate1 Budget
Percent of audit plan completed 78% 80% 80% Performance audit and management reports issued2 71 68 68 Average audit cycle time (calendar days)3 206 180 180 Economic impact of audits as a
or cost savings (millions)4 $0.5 $0.6 $0.9 Hearing rulings issued timely according to time frames listed in the city code 100% 100% 100%
City Auditor Major Performance Measures and Service Levels
will be achieved with the 2021-22 budget allowance:
1Based on 10 months actual experience.2The decrease from 2019-20 reflects that 16% of auditor positions are vacant due to retirements and hiring restrictions during the COVID-19 pandemic.
3Number of audit reports issued and average cycle time can vary due to the size and complexity of audits conducted.
42021-22 budget level is representative of the historical average.
Expenditure and Position Summary
2019-20 2020-21 2021-22 Actual Estimate Budget
Operating Expense $2,523,000 $2,912,000 $3,174,000 Total Positions 25.4 25.4 25.4 Source of Funds: General $2,523,000 $2,912,000 $3,174,000
City Auditor Impact of Recommendations
The 2021-22 level is representative of the historical average.
Fiscal Year *Estimated
$1,400
$1,200
$1,000
$800
$600
$400
$200
$0
Thousands
2019-20
$500$600
2017-18
$300
2018-19 2020-21*
$600
2021-22*
$900
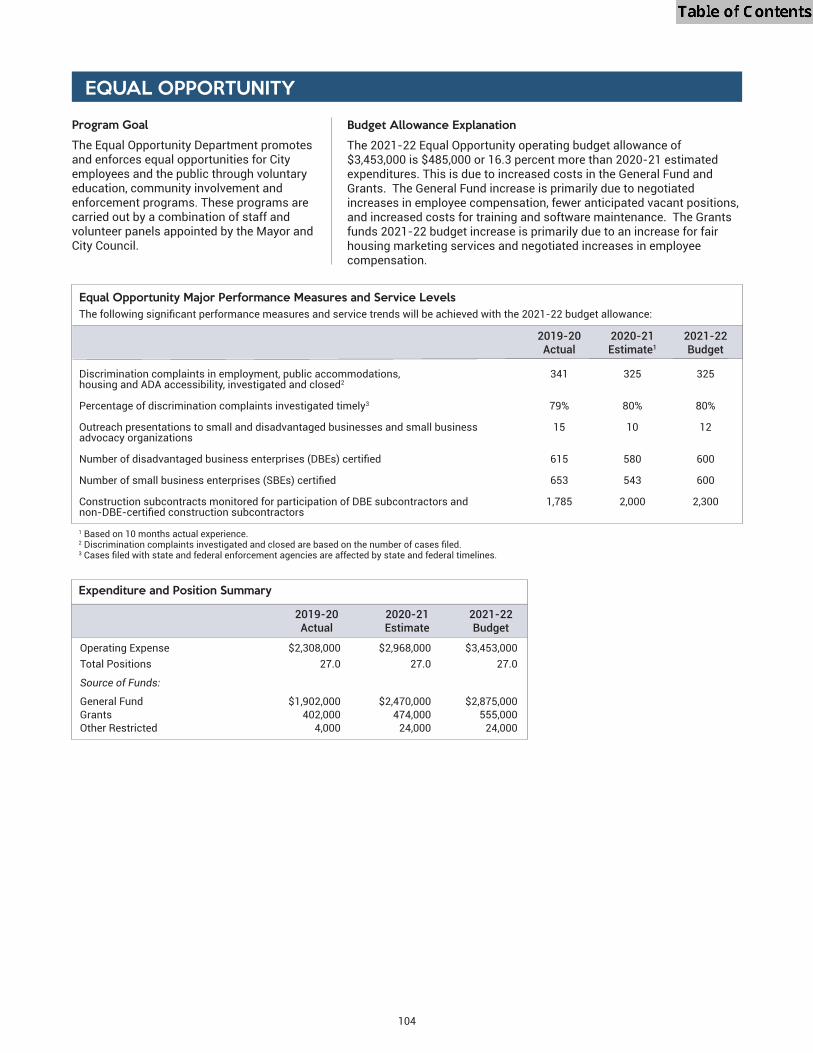
104
EQUAL OPPORTUNITY
2019-20 2020-21 2021-22 Actual Estimate1 Budget
Discrimination complaints in employment, public accommodations, 341 325 325 housing and ADA accessibility, investigated and closed2
Percentage of discrimination complaints investigated timely3 79% 80% 80% Outreach presentations to small and disadvantaged businesses and small business 15 10 12advocacy organizations
Construction subcontracts monitored for participation of DBE subcontractors and 1,785 2,000 2,300
Equal Opportunity Major Performance Measures and Service Levels
1 Based on 10 months actual experience. 2
3
Expenditure and Position Summary
2019-20 2020-21 2021-22 Actual Estimate Budget
Operating Expense $2,308,000 $2,968,000 $3,453,000 Total Positions 27.0 27.0 27.0 Source of Funds: General Fund $1,902,000 $2,470,000 $2,875,000Grants 402,000 474,000 555,000Other Restricted 4,000 24,000 24,000
Program GoalThe Equal Opportunity Department promotes and enforces equal opportunities for City employees and the public through voluntary education, community involvement and enforcement programs. These programs are carried out by a combination of staff and volunteer panels appointed by the Mayor and City Council.
Budget Allowance ExplanationThe 2021-22 Equal Opportunity operating budget allowance of $3,453,000 is $485,000 or 16.3 percent more than 2020-21 estimated expenditures. This is due to increased costs in the General Fund and Grants. The General Fund increase is primarily due to negotiated increases in employee compensation, fewer anticipated vacant positions, and increased costs for training and software maintenance. The Grants funds 2021-22 budget increase is primarily due to an increase for fair housing marketing services and negotiated increases in employee compensation.

105
HUMAN RESOURCES
2019-20 2020-21 2021-22 Actual Estimate1 Budget
Annualized employee turnover rate 7.7% 5.7% 6.0% Employee performance evaluations completed on time 75% 83% 80% The number of employee suggestions received 6 7 10
Human Resources Major Performance Measures and Service Levels
1 Based on 10 months actual experience.
Expenditure and Position Summary
2019-20 2020-21 2021-22 Actual Estimate Budget
Operating Expense $12,258,000 $22,650,000 $19,762,000 Total Positions 112.7 117.7 118.7 Source of Funds: General $11,762,000 $16,316,000 $19,275,000Grants 77,000 5,904,000 0Other Restricted 419,000 431,000 487,000
Program GoalThe Human Resources Department partners with departments and employees to hire, compensate, support and develop a diverse workforce that is dedicated to delivering high-quality services to the community.
Budget Allowance ExplanationThe Human Resources Department 2021-22 operating budget allowance of $19,762,000 is $2,888,000 or 12.8 percent less than 2020-21 estimated expenditures. This is primarily due to the conclusion of the General Fund resources made available through the offset of public safety salaries with the Coronavirus Relief Fund.
The General Fund 2021-22 budget allowance of $19,275,000 is $2,959,000 or 18.1 percent more than 2020-21 estimated expenditures. The increase is primarily due to funding programmed for COVID-19 testing for employees, the addition of three positions for procurement, data management, and investigations, and negotiated increases in employee compensation and other normal inflationary adjustments.

106
PHOENIX EMPLOYMENT RELATIONS BOARD
Program GoalThe Phoenix Employment Relations Board oversees administration of the City’s meet and confer ordinance. Primary responsibilities of the board include conducting representation elections and selecting mediators and fact
members appointed by the City Council and has one staff member.
Budget Allowance ExplanationThe Phoenix Employment Relations Board 2021-22 operating budget allowance of $124,000 is $16,000 or 11.4 percent less than 2020-21 estimated expenditures. The decrease is primarily due to lower anticipated costs
which is partially offset by negotiated increases in employee compensation.
Expenditure and Position Summary
2019-20 2020-21 2021-22 Actual Estimate Budget
Operating Expense $104,000 $140,000 $124,000 Total Positions 1.0 1.0 1.0 Source of Funds: General $104,000 $140,000 $124,000
RETIREMENT SYSTEMS
2019-20 2020-21 2021-22 Actual Estimate1 Budget
General City retirements 385 400 390 Public safety retirements 424 400 380 General City and public safety member contacts
Appointments 1,255 1,200 1,200 Walk-in service2 866 180 500 Telephone calls 7,695 8,000 9,000
Retirement Systems Major Performance Measures and Service Levels
1 Based on 10 months actual experience.2 2020-21 data reflects the impact of the COVID-19 pandemic.
2019-20 2020-21 2021-22 Actual Estimate Budget
Operating Expense (Gross1) $2,565,000 $2,847,000 $3,001,000 Total Positions 16.0 16.0 16.0 Source of Funds: General Fund (Gross1) $2,565,000 $2,847,000 $3,001,000
Program GoalRetirement Systems provides staff
retirement boards and administers retirement programs for all City employees.
Budget Allowance ExplanationThe Retirement Systems 2021-22 gross operating budget allowance of $3,001,000 is $154,000 or 5.4 percent more than 2020-21 estimated expenditures. The increase is primarily due to negotiated increases in employee compensation and other normal inflationary adjustments.
1 Gross costs are recovered through citywide assessments to all city departments.
2019-20 2020-21 2021-22 Actual Estimate1 Budget
2 5 1 4
Phoenix Employment Relations Board Major Performance Measures and Service Levels
will be achieved with the 2021-22 budget allowance:
1 Based on 10 months actual experience.2
2020-21 reflects temporarily lower activity due to the COVID-19 pandemic.
Expenditure and Position Summary
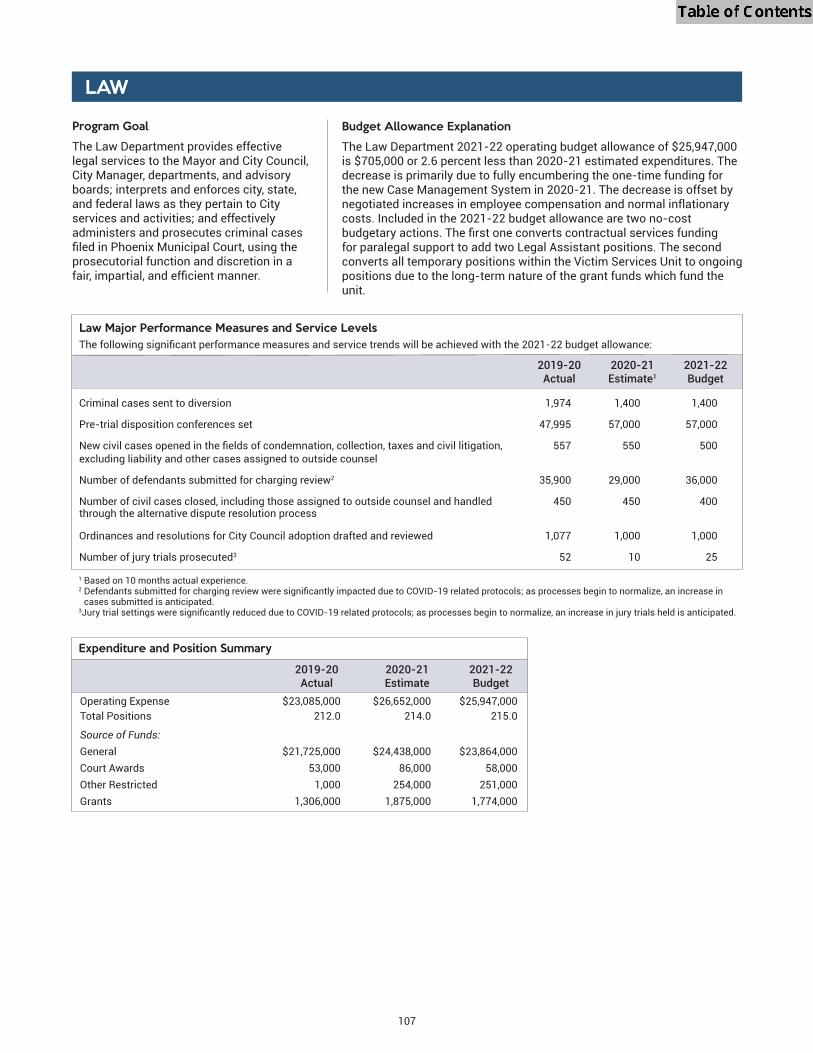
107
LAW
2019-20 2020-21 2021-22 Actual Estimate1 Budget
Criminal cases sent to diversion 1,974 1,400 1,400 Pre-trial disposition conferences set 47,995 57,000 57,000
excluding liability and other cases assigned to outside counsel Number of defendants submitted for charging review2 35,900 29,000 36,000 Number of civil cases closed, including those assigned to outside counsel and handled 450 450 400 through the alternative dispute resolution process
Ordinances and resolutions for City Council adoption drafted and reviewed 1,077 1,000 1,000 Number of jury trials prosecuted3 52 10 25
Law Major Performance Measures and Service Levels
1 Based on 10 months actual experience.2
cases submitted is anticipated.3
Program GoalThe Law Department provides effective legal services to the Mayor and City Council, City Manager, departments, and advisory boards; interprets and enforces city, state, and federal laws as they pertain to City services and activities; and effectively administers and prosecutes criminal cases
prosecutorial function and discretion in a
Budget Allowance ExplanationThe Law Department 2021-22 operating budget allowance of $25,947,000 is $705,000 or 2.6 percent less than 2020-21 estimated expenditures. The decrease is primarily due to fully encumbering the one-time funding for the new Case Management System in 2020-21. The decrease is offset by negotiated increases in employee compensation and normal inflationary costs. Included in the 2021-22 budget allowance are two no-cost
for paralegal support to add two Legal Assistant positions. The second converts all temporary positions within the Victim Services Unit to ongoing positions due to the long-term nature of the grant funds which fund the unit.
Expenditure and Position Summary
2019-20 2020-21 2021-22 Actual Estimate Budget Operating Expense $23,085,000 $26,652,000 $25,947,000Total Positions 212.0 214.0 215.0 Source of Funds: General $21,725,000 $24,438,000 $23,864,000Court Awards 53,000 86,000 58,000Other Restricted 1,000 254,000 251,000Grants 1,306,000 1,875,000 1,774,000

108
INFORMATION TECHNOLOGY
Program GoalInformation Technology Services coordinates the use of information technology across the various departments and agencies of city government to ensure that accurate and timely information is provided to residents,
City management and staff in the most cost-effective manner possible. The department provides operating departments with information processing through the application and coordination of computer technology and procures, manages and maintains the City’s radio, telephone and computer network systems.
Budget Allowance ExplanationThe Information Technology Services (ITS) 2021-22 operating budget allowance of $60,974,000 is $7,830,000 or 11.4 percent less than 2020-21 estimated expenditures. The overall decrease is primarily due to the conclusion of the General Fund resources made available through the offset of public safety salaries with the Coronavirus Relief Fund. The General Fund allocation increase of $4,123,000 reflects negotiated increases in employee compensation, normal inflationary increases and additional funding for various staff and contractual services to support numerous City and community information technology initiatives. ITS received grant funding made available through the CARES Act. This funding was used for various technology projects in response to the COVID-19 pandemic to support both City operations and community services. To ensure the continuity of City operations technology was deployed for teleworking and to enhance e-government services. Community services
facilities and tablets for public housing residents.In relation to the City’s continued COVID-19 response and resiliency efforts, new funding was added to the 2021-22 budget allowance for three on-going positions, two temporary positions and for contractual services to continue support of critical IT infrastructure, cybersecurity, Wi-Fi support, virtual business environment support, a new Learning Management System and expanding the City’s 311 system.ITS continues to see an increase in cyberattacks and threats to the City’s IT systems and infrastructure. In response, funds for three IT security related positions are being added to lead infrastructure and application vulnerability remediation efforts that mitigate known security
Also included in the budget are funds for managed service agreements to bridge the technical expertise gap in existing staff who support the City's SAP and Peoplesoft ERP systems. These agreements will provide an ERP program manager, business analyst, technical leader and other needed services to improve processes and implement system advancements.
2019-20 2020-21 2021-22 Actual Estimate Budget Operating Expense $46,980,000 $68,804,000 $60,974,000Total Positions 200.0 206.0 209.0 Source of Funds: General Fund $44,538,000 $56,015,000 $60,138,000Other Restricted - 87,000 87,000Grants 1,970,000 12,042,000 -Aviation 266,000 273,000 286,000Solid Waste 197,000 200,000 208,000Water 4,000 174,000 243,000Cable Television 5,000 12,000 12,000
Expenditure and Position Summary
2019-20 2020-21 2021-22 Actual Estimate1 Budget Percentage of on-time operations center services 99.0% 99.0% 99.0% Critical systems availability percentage:
Enterprise network 99.9% 99.9% 99.9% Telephone network 98.5% 99.9% 99.9% Phoenix.gov 99.9% 99.9% 99.9% ePay 99.9% 99.9% 99.9% TALIS 95.5% 95.5% 95.5% RWC 99.9% 99.9% 99.9%
Number of pages accessed in Phoenix.gov 16,249,572 18,654,000 16,500,000Average cycle time of telephone service requests 19 days < 21 days < 21 daysUnits of portable and mobile radio equipment2 19,757 19,700 19,700
Information Technology Major Performance Measures and Service Levels
1 Based on 10 months actual experience.2 Includes all portable and mobile radios support on behalf of all RWC members, as well as support of portable and mobile radios for Fire’s VHF system.

109
CITY CLERK
Program GoalThe City Clerk Department exists to uphold public trust and protect local democracy by providing access to services and information on matters of public interest to residents,
The department manages elections and annexations; prepares council agendas, minutes and meeting notices; maintains public records; processes liquor and regulated business licenses; and supports all city department operations through provision of internal printing, graphic design, and mail services.
Budget Allowance ExplanationThe City Clerk 2021-22 operating budget allowance of $7,475,000 is $1,139,000 or 18.0 percent more than 2020-21 estimated expenditures. The increase is primarily due to the carryover of funding for the new business licensing system and the records management system, and negotiated increases in employee compensation. Additionally, funding was added for consulting services to perform a strategic assessment of the City’s election services information technology needs.
2019-20 2020-21 2021-22 Actual Estimate1 Budget
Number of council formal and special meeting agenda items2 2,500 3,000 2,600 Open meeting law notices posted 2,900 2,800 2,900 Percent of open meeting law notices posted in accordance with state law 100% 100% 100% Total printing and copy impressions (millions) 17,409,300 18,000,000 18,000,000 City Council regular and special elections held 3 2 0
License services applications and contacts 15,600 16,000 17,100 Records (in pages) provided for public access online 154,000 160,000 160,000
City Clerk Major Performance Measures and Service Levels
1 Based on 10 months actual experience.2 The anticipated reduction in FY21-22 is due to not having as many COVID-19 related City Council agenda items.
Expenditure and Position Summary
2019-20 2020-21 2021-22 Actual Estimate Budget
Operating Expense $4,528,000 $6,336,000 $7,475,000 Total Positions 51.5 51.5 51.5 Source of Funds: General $4,528,000 $6,336,000 $7,475,000
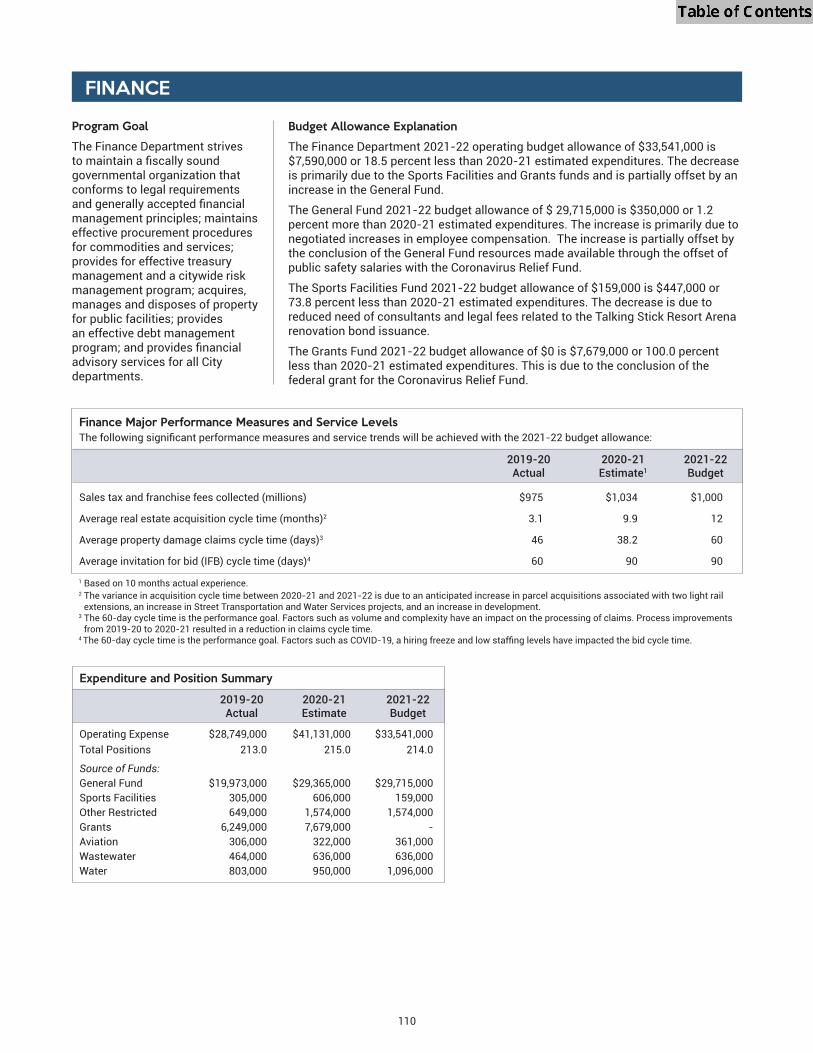
110
FINANCE
Program GoalThe Finance Department strives
governmental organization that conforms to legal requirements
management principles; maintains effective procurement procedures for commodities and services; provides for effective treasury management and a citywide risk management program; acquires, manages and disposes of property for public facilities; provides an effective debt management
advisory services for all City departments.
Budget Allowance ExplanationThe Finance Department 2021-22 operating budget allowance of $33,541,000 is $7,590,000 or 18.5 percent less than 2020-21 estimated expenditures. The decrease is primarily due to the Sports Facilities and Grants funds and is partially offset by an increase in the General Fund.
The General Fund 2021-22 budget allowance of $ 29,715,000 is $350,000 or 1.2 percent more than 2020-21 estimated expenditures. The increase is primarily due to negotiated increases in employee compensation. The increase is partially offset by the conclusion of the General Fund resources made available through the offset of public safety salaries with the Coronavirus Relief Fund.
The Sports Facilities Fund 2021-22 budget allowance of $159,000 is $447,000 or 73.8 percent less than 2020-21 estimated expenditures. The decrease is due to reduced need of consultants and legal fees related to the Talking Stick Resort Arena renovation bond issuance.
The Grants Fund 2021-22 budget allowance of $0 is $7,679,000 or 100.0 percent less than 2020-21 estimated expenditures. This is due to the conclusion of the federal grant for the Coronavirus Relief Fund.
2019-20 2020-21 2021-22 Actual Estimate1 Budget
Sales tax and franchise fees collected (millions) $975 $1,034 $1,000 Average real estate acquisition cycle time (months)2 3.1 9.9 12 Average property damage claims cycle time (days)3 46 38.2 60 Average invitation for bid (IFB) cycle time (days)4 60 90 90
Finance Major Performance Measures and Service Levels
1 Based on 10 months actual experience.2 The variance in acquisition cycle time between 2020-21 and 2021-22 is due to an anticipated increase in parcel acquisitions associated with two light rail
extensions, an increase in Street Transportation and Water Services projects, and an increase in development.3 The 60-day cycle time is the performance goal. Factors such as volume and complexity have an impact on the processing of claims. Process improvements
from 2019-20 to 2020-21 resulted in a reduction in claims cycle time.4
Expenditure and Position Summary
2019-20 2020-21 2021-22 Actual Estimate Budget
Operating Expense $28,749,000 $41,131,000 $33,541,000Total Positions 213.0 215.0 214.0 Source of Funds: General Fund $19,973,000 $29,365,000 $29,715,000Sports Facilities 305,000 606,000 159,000Other Restricted 649,000 1,574,000 1,574,000Grants 6,249,000 7,679,000 -Aviation 306,000 322,000 361,000Wastewater 464,000 636,000 636,000Water 803,000 950,000 1,096,000

111
BUDGET AND RESEARCH
Program GoalThe Budget and Research Department ensures effective,
Council, City Manager and City departments to provide quality services to our residents.
Budget Allowance ExplanationThe Budget and Research 2021-22 operating budget allowance of $4,311,000 is $488,000 or 12.8 percent higher than 2020-21 estimated expenditures. The budget reflects negotiated increases in employee compensation and other normal inflationary adjustments.
2019-20 2020-21 2021-22 Actual Estimate1 Budget
Percent variance of actual versus estimated expenditures for each major fund -0.8% 0 -± 3% 0 -± 3%(data for the General Fund is shown) Percent variance of actual versus estimated revenues for each major fund 0.4% 0 -± 3% 0 -± 3% (data for the General Fund is shown) Percent of Requests for Council Action processed within 24 hours 94% 85% 85% Capital Improvement Program expenditures as a percentage of original budget 58% 43% 65%
Budget and Research Major Performance Measures and Service Levels
1 Based on 10 months actual experience.
Expenditure and Position Summary
2019-20 2020-21 2021-22 Actual Estimate Budget
Operating Expense $3,333,000 $3,823,000 $4,311,000Total Positions 24.0 25.0 25.0 Source of Funds: General $3,329,000 $3,823,000 $4,311,000Grants 4,000 - -

112

113
The Public Safety program budget includes Fire, Police,
Management.
PUBLICSAFETY
The Public Safety Program Represents 30.8% of the Total Budget.

114
POLICE
Program GoalThe Police Department provides the community with a law enforcement system that integrates and uses all departmental, civic and community resources for police services and protection of the lives and property of our residents.
Budget Allowance ExplanationThe Police Department 2021-22 operating budget allowance of $786,708,000 is $66,746,000 or 9.3 percent more than 2020-21 estimated expenditures. The 2020-21 estimated expenditures reflect
reflects the Council approved hiring target of 3,125 sworn positions and explains the majority of the budget increase in 2021-22. The budget also reflects negotiated increases in employee compensation, additional civilian positions and other normal inflationary adjustments.
The General Fund budget increase in 2021-22 reflects $3.2 million for 75 new civilian positions and includes: 15 staff to ensure timely processing of public records requests; four positions for the Early Intervention System to identify sworn employee risk and prevent adverse events; 34 positions to provide expanded data tracking compatible with the National Incident-Based Reporting System; and 22 positions to further civilianize the Central Booking Detail, enabling
The 2021-22 non-General Fund budgets in Police include increases related to the carryover of unspent grant funds and additional grant funding, as well as additional funding in the Public Safety Specialty Funds for vehicle replacements.
2019-20 2020-21 2021-22 Actual Estimate1 Budget
Average Response Time (Minutes) Priority 1 – Emergency 6.5 6.5 6.6 Priority 2 – Non-Emergency 20.2 22.6 22.6 Priority 3 – All Others 44.8 50.4 50.4
Percentage of phone calls to 9-1-1 and Crime Stop answered within 15 seconds2 n/a 79% 79%Moving violation citations issued3 81,831 50,800 70,200
Percentage of cases cleared: Murder 73% 72% 72% Rape 10% 10% 10% Robbery 27% 26% 26% Aggravated Assault 33% 30% 30% Burglary 9% 10% 10% Theft 15% 13% 13% Auto Theft 8% 8% 8% Arson 22% 26% 26%
Police Major Performance Measures and Service Levels
1 Based on 10 months actual experience.2 The National Emergency Number Association (NENA) updated their guidelines in April 2020 to recommend a 90% call pickup rate within 15 seconds. This
change prevented the availability of complete data for 2019-20.2 The 2019-20 and 2020-21 reductions in moving violation citations reflect City Council action to end the red-light photo enforcement program in January 2020,
as well as a pause on the use of photo radar vans in school zones due to COVID-19 school closures.
Expenditure and Position Summary
2019-20 2020-21 2021-22 Actual Estimate Budget
Operating Expense $708,888,000 $719,962,000 $786,708,000 Total Positions 4,363.6 4,363.6 4,436.6 Source of Funds: General Fund $557,552,000 $569,252,000 $611,239,000Court Awards 5,680,000 4,307,000 5,406,000Neighborhood Protection 31,082,000 28,636,000 34,347,000Public Safety Enhancement 17,826,000 16,736,000 18,880,000Public Safety Expansion 67,186,000 65,735,000 79,093,000Sports Facilities 1,528,000 1,604,000 1,685,000Other Restricted 21,250,000 20,907,000 18,957,000Grants 6,785,000 12,785,000 17,102,000

115
PoliceViolent Crimes per 1,000 Residents
PoliceProperty Crimes per 1,000 Residents
Fiscal Year *Estimated
Fiscal Year *Estimated
12
9
6
3
02021-22*
8.5
2017-18
8.1
2020-21*
8.3
2018-19
7.3
2019-20
7.8
2017-18
60
40
20
02018-19 2020-21*
31
2021-22*
3038
2019-20
3336

116
Minutes
6:00
4:00
2:00
0:00 2018-19 2020-21*
5:18
2021-22*
5:15
2017-18
5:09 5:06
2019-20
5:22
FIRE
Program GoalThe Fire Department provides the highest level of life and property
and emergency medical and public education services.
Budget Allowance ExplanationThe Fire Department 2021-22 operating budget allowance of $462,262,000 is $45,276,000 or 10.9 percent more than 2020-21 estimated expenditures. The increase is primarily in the General Fund and Other Restricted and is partially offset by a decrease Grant funding.
The General Fund 2021-22 budget allowance of $388,358,000 is $36,879,000 or 10.5 percent more than 2020-21 estimated expenditures. The increase is primarily due to negotiated increases in employee compensation and $15.8 million in new funding for multiple programs. Included in the 2021-22 budget is funding for ten new positions for the Phoenix Fire Regional Dispatch Center (PFDRDC) which provides
26 other jurisdictions. Also included is funding for 130.9 new positions to expand the City of Phoenix Community Assistance Program to provide for a civilian trained response to mental and behavioral health calls for service. Also included is funding for ten new positions to enhance paramedic training, support
The Other Restricted 2021-22 budget allowance of $17,062,000 is $10,270,000 or 151.2 percent higher than 2020-21 estimated expenditures. This is due to the establishment of a dedicated funding source for
The Grants 2021-22 budget allowance of $17,061,000 is $2,795,000 or 14.1 percent less than 2020-21 estimated expenditures due to the conclusion of the federal grant for the Coronavirus Relief Fund and homeland security operating grants.
2019-20 2020-21 2021-22 Actual Estimate1 Budget
Patient transports to Valley hospitals via emergency medical vehicles 64,809 63,000 65,000 Percentage of time Advanced Life Support (ALS) medical calls are responded to
Number of calls by type:
Emergency Medical 187,678 187,699 182,548 Fire 18,095 19,792 17,404 Other (mountain/swift water/trench/tree rescues/other) 7,216 7,516 7,286
Fire Major Performance Measures and Service Levels
1 Based on 10 months actual experience.
Department has changed standardized reporting for response time to include only emergency calls.
FireFirst Unit Average Response Time
Fiscal Year *Estimated
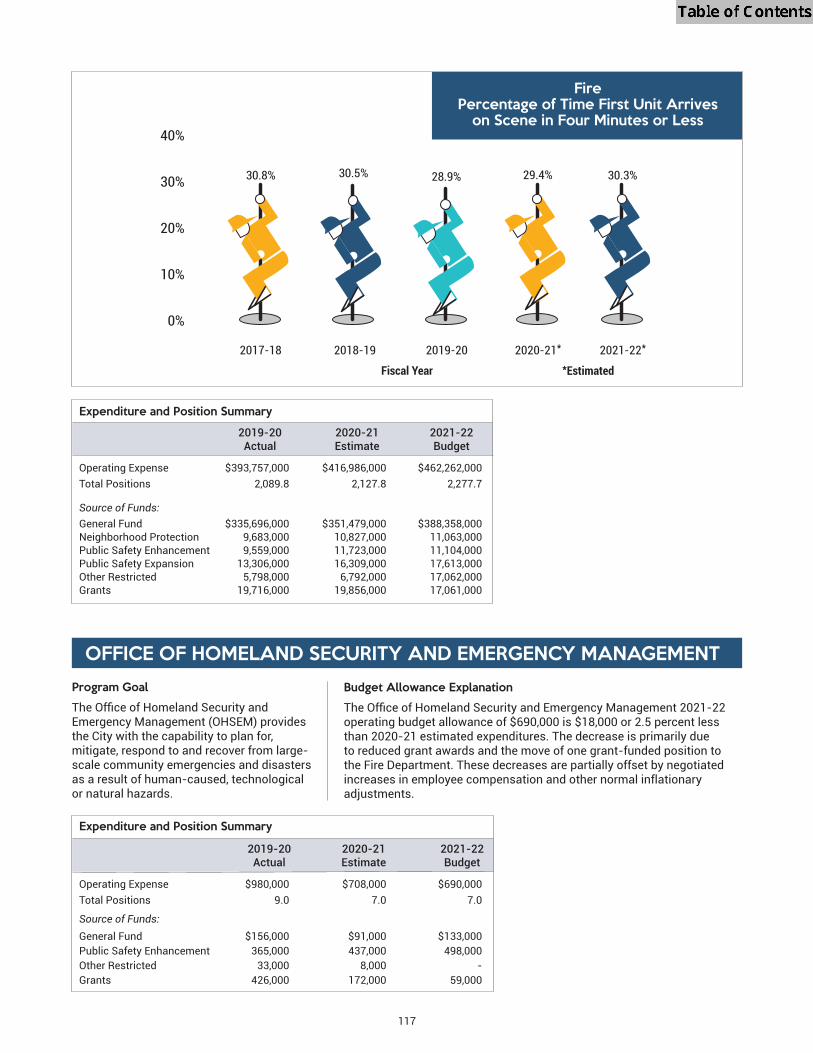
117
40%
30%
20%
10%
0%
28.9%30.5%
2017-18 2019-20
29.4%
2020-21*2018-19
30.3%
2021-22*
30.8%
FirePercentage of Time First Unit Arrives
on Scene in Four Minutes or Less
Expenditure and Position Summary
2019-20 2020-21 2021-22 Actual Estimate Budget
Operating Expense $393,757,000 $416,986,000 $462,262,000 Total Positions 2,089.8 2,127.8 2,277.7 Source of Funds: General Fund $335,696,000 $351,479,000 $388,358,000Neighborhood Protection 9,683,000 10,827,000 11,063,000Public Safety Enhancement 9,559,000 11,723,000 11,104,000Public Safety Expansion 13,306,000 16,309,000 17,613,000Other Restricted 5,798,000 6,792,000 17,062,000Grants 19,716,000 19,856,000 17,061,000
OFFICE OF HOMELAND SECURITY AND EMERGENCY MANAGEMENTProgram Goal
Emergency Management (OHSEM) provides the City with the capability to plan for, mitigate, respond to and recover from large-scale community emergencies and disasters as a result of human-caused, technological or natural hazards.
Budget Allowance Explanation
operating budget allowance of $690,000 is $18,000 or 2.5 percent less than 2020-21 estimated expenditures. The decrease is primarily due to reduced grant awards and the move of one grant-funded position to the Fire Department. These decreases are partially offset by negotiated increases in employee compensation and other normal inflationary adjustments.
Expenditure and Position Summary
2019-20 2020-21 2021-22 Actual Estimate Budget
Operating Expense $980,000 $708,000 $690,000 Total Positions 9.0 7.0 7.0 Source of Funds: General Fund $156,000 $91,000 $133,000Public Safety Enhancement 365,000 437,000 498,000Other Restricted 33,000 8,000 -Grants 426,000 172,000 59,000
Fiscal Year *Estimated
118

119
The Criminal Justice program budget includes the City Prosecutor, Municipal Court, and Public Defender.
The Criminal Justice Program Represents 1.5% of the Total Budget.
CRIMINALJUSTICE

100%
60%
40%
20%
0
80%76%
2021-22*2017-18 2018-19
95%
2019-20
95% 80%
2020-21*
95%
120
MUNICIPAL COURTProgram GoalThe Municipal Court provides, with integrity, to all individuals who come before this court: equal access, professional and impartial treatment, and just resolution of all court matters.
Budget Allowance ExplanationThe Municipal Court’s 2021-22 operating budget allowance of $37,489,000 is $3,113,000 or 9.1 percent more than 2020-21 estimated expenditures. The increase is primarily due to negotiated increases in employee compensation, three new positions
positions to support criminal courtroom operations at the new Maricopa County Intake, Transfer and Release facility that opened in November 2020.
2019-20 2020-21 2021-22 Actual Estimate1 Budget
2 43,500 36,000 35,0002 114,750 80,000 70,000
Number of criminal cases with a pending trial date at year end 2,800 3,500 3,500Average cycle time for sending out restitution and bail refund checks 2.5 days 2.5 days 2.5 daysAverage hold time for incoming information calls to the Customer Call Center 3.0 minutes 4.0 minutes 5.0 minutes
Municipal Court Major Performance Measures and Service Levels
1 Based on 10 months actual experience.2 Citations issued by Phoenix Police, Neighborhood Services, and other citing authorities decreased beginning in April 2020 due to the COVID-19 pandemic.
Municipal CourtPercent of Criminal Cases Resolved
within 180 Days from Case Filing
Expenditure and Position Summary
2019-20 2020-21 2021-22 Actual Estimate Budget
Operating Expense $32,376,000 $34,376,000 $37,489,000 Total Positions 274.0 274.0 279.0 Source of Funds: General Fund $29,706,000 $31,310,000 $34,224,000Other Restricted 2,375,000 2,956,000 3,265,000Grants 295,000 110,000 -
Fiscal Year *Estimated
In 2020-21, continuances were requested from all parties due to COVID-19 which resulted in a lower percentage of resolved cases.

121
PUBLIC DEFENDER
Program GoalThe Public Defender Program provides legal representation for indigent defendants in Phoenix Municipal Court.
Budget Allowance ExplanationThe Public Defender 2021-22 operating budget allowance of $5,634,000 is $261,000 or 4.9 percent more than 2020-21 estimated expenditures. The increase is primarily due to negotiated increases in employee compensation and other normal inflationary adjustments.
2019-20 2020-21 2021-22 Actual Estimate1 Budget2
Defendants charged with misdemeanor crimes represented in Phoenix Municipal Court 16,094 16,036 17,500
Public Defender Major Performance Measures and Service Levels
1 Based on 10 months actual experience.2 Anticipated increase in Veterans and individuals with mental health issues who appear in court, receive treatment, and maintain contact with the Court and
social service agencies.
Expenditure and Position Summary
2019-20 2020-21 2021-22 Actual Estimate Budget
Operating Expense $5,327,000 $5,373,000 $5,634,000 Total Positions 11.0 11.0 11.0 Source of Funds: General $5,327,000 $5,373,000 $5,634,000
122

123
The Transportation program budget includes Aviation, Public Transit, and Street Transportation.
The Transportation Program Represents 18.4% of the Total Budget.
TRANSPORTATION

124
STREET TRANSPORTATION
Program GoalThe Street Transportation Department plans for the safe and convenient movement of people and vehicles on City streets, effectively maintains the City’s streets, designs and inspects the construction of streets to assure they meet
street damage through the control of irrigation and storm water. The Street Transportation Department also provides for the economical, safe and aesthetic design and construction of facilities on City property.
Budget Allowance ExplanationThe Street Transportation 2021-22 operating budget allowance of $115,853,000 is $10,939,000 or 10.4 percent more than 2020-21 estimated expenditures. The increase is primarily due to increased costs in the General Fund and Arizona Highway User Revenue funds.
The General Fund 2021-22 budget allowance of $21,639,000 is $2,672,000 or 14.1 percent more than 2020-21 estimated expenditures. The increase is primarily due to the implementation of the City Council approved Roadway Safety Action Plan, funding for the Cool Corridors Program, conversion of federally-funded deep-cleaning around the Human Services Campus and the right of way in the West Hatcher Road area of Sunnyslope to General Funds, additional funding to maintain street landscaping along newly developed and renovated streetscapes, and negotiated increases in employee compensation.
The Arizona Highway User Revenue fund 2021-22 budget allowance of $89,856,000 is $8,142,000 or 10.0 percent more than 2020-21 estimated expenditures. The increase is primarily due to negotiated increases in employee
Action Plan, additional positions to support street maintenance and street cleaning, an increase in electricity in street lighting, increased costs for liability insurance and street maintenance materials, and a decrease in charges to the Capital Improvement Program budget for street marking due to the Advanced Pavement Management Program coming to an end.
The Grants funds 2021-22 budget allowance of $30,000 is $140,000 or 82.4 percent less than the 2020-21 estimated expenditures. The decrease is primarily due to the conclusion of the federal grant for the Coronavirus Relief Fund.
Street TransportationMaintenance Rapid Response
(Responding to urgent issues such as obstructions in the roadway)
Fiscal Year *Estimated
% within1 day
100%
80%
60%
40%
20%
0%
91.0%
2020-21*
98.0%
2019-202017-18
98.0%
2018-19
98.0% 98.0%
2021-22*

125
Expenditure and Position Summary
2019-20 2020-21 2021-22 Actual Estimate Budget
Operating Expense $98,378,000 $104,914,000 $115,853,000
Total Positions 721.0 728.0 734.0 Source of Funds: General Fund $18,468,000 $18,967,000 $21,639,000Arizona Highway User Revenue 75,913,000 81,714,000 89,856,000Capital Construction 89,000 70,000 70,000Transportation 2050 384,000 362,000 515,000Other Restricted 3,364,000 3,631,000 3,744,000Grants 159,000 170,000 30,000
2019-20 2020-21 2021-22 Actual Estimate1 Budget
Routine street maintenance requests for service completed within 21 days 75% 75% 75%2 95% 51% 95%
(knockdowns, signal on flash and signal malfunction)
Construction project complaints or inquiries addressed within two working days 97% 98% 98%
Number of days to review and respond to street light requests 5 5 5
Number of days to review private development plans3 9 10 10
Utility plan review turnaround time within 10 working days 92% 92% 92%
Complete requests for sign and crosswalk work within 45 days 82% 82% 82%
Total number of High Intensity Activated Pedestrian Crosswalk System (HAWKS) 55 67 79
Street Transportation Major Performance Measures and Service Levels
1Based on 10 months actual experience.2
3

126
Budget Allowance ExplanationThe Aviation Department 2021-22 operating budget allowance of $352,246,000 is $113,000 or 0.0 percent less than 2020-21 estimated expenditures. Aviation committed to paying down a portion of unfunded pension in 2020-21 by $100,000,000 and in 2021-22 by $70,000,000. The 2021-22 budget allowance decrease from the prior year is a result of the pension pay down which is offset by negotiated increases in employee compensation and other normal inflationary adjustments. Aviation passenger activity levels have been severely impacted by the COVID-19 pandemic. Federal funds received from the Coronavirus Aid Relief and Economic Security
anticipated to return to pre-pandemic levels by FY 2023-24.
AVIATION
Program GoalThe Aviation Department provides the Phoenix metropolitan area with a self-supporting system of airports and aviation facilities that accommodate general and commercial
and convenient manner.
2019-20 2020-21 2021-22 Actual Estimate1 Budget
Airline rental rates (cost per square foot): Terminal 22,3 $126.84 NA NA Terminal 3 $126.84 $124.20 $100.44 Terminal 4 $126.84 $124.20 $100.44 Gross sales per departing passenger: Terminal 22 $9.41 NA NA Terminal 3 $10.48 $9.00 $10.00 Terminal 4 $11.21 $9.00 $10.00 Aircraft takeoffs and landings4 756,392 634,253 650,000 Total international passengers4 1,454,133 637,093 700,000 Air cargo processed (in tons)5 405,085 427,008 450,000
Aviation Major Performance Measures and Service Levels
will be achieved with the 2021-22 budget allowance:
1 Based on 10 months actual experience. 2 Terminal 2 closed on February 1, 2020 and consolidated operations in
Terminal 3.3 The use of federal grants decreases the airline cost requirement, leading to
lower airline rates in 2020-21 and 2021-22.4
COVID-19 pandemic. It is expected to fully recover to pre-pandemic levels by FY 2023-24.
5 Air cargo continued to grow with online orders during the pandemic.
Expenditure and Position Summary
2019-20 2020-21 2021-22 Actual Estimate Budget
Operating Expense $258,733,000 $352,359,000 $352,246,000Total Positions 890.0 889.0 889.0 Source of Funds: Aviation $258,733,000 $352,359,000 $352,246,000
Sky Harbor Airport Passengers Arriving and Departing
Fiscal Year *Estimated
It is expected to fully recover to pre-pandemic levels by FY 2023-24.
Passengers (Millions)
50
40
30
20
102021-22*2017-18
21.9
44.3
2018-19
45.5
2019-20
34.7
2020-21*
20.0
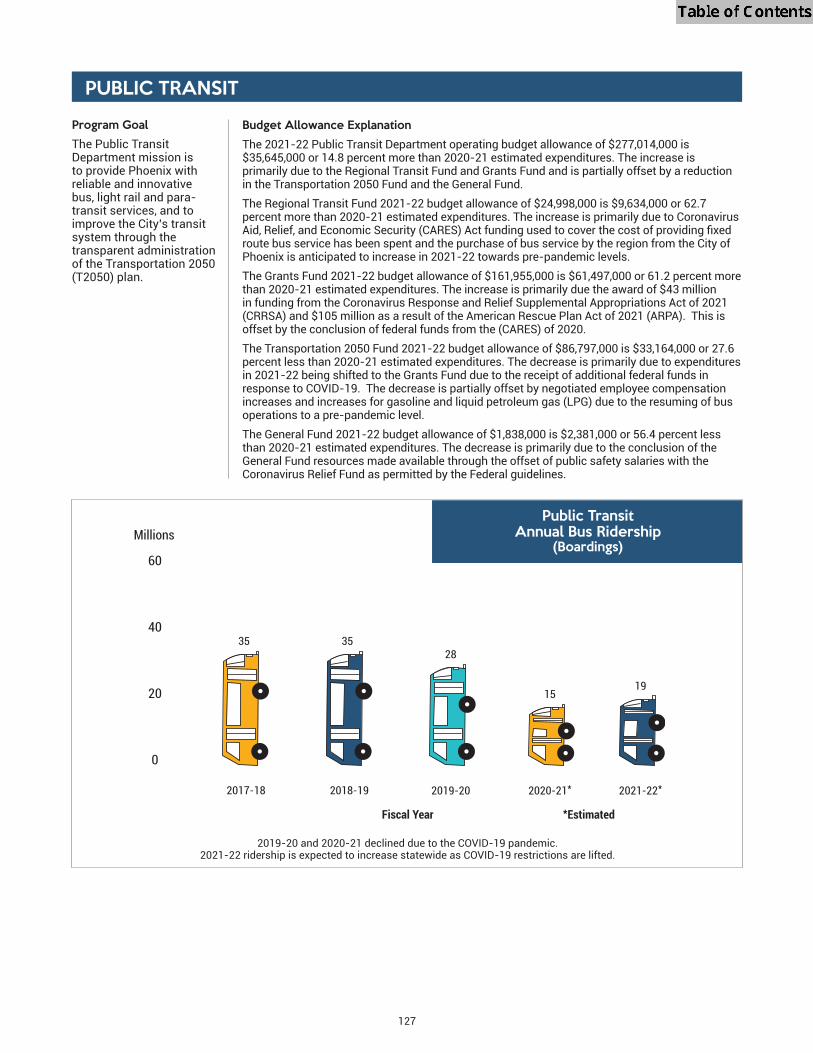
127
PUBLIC TRANSIT
Program GoalThe Public Transit Department mission is to provide Phoenix with reliable and innovative bus, light rail and para-transit services, and to improve the City’s transit system through the transparent administration of the Transportation 2050 (T2050) plan.
Budget Allowance ExplanationThe 2021-22 Public Transit Department operating budget allowance of $277,014,000 is $35,645,000 or 14.8 percent more than 2020-21 estimated expenditures. The increase is primarily due to the Regional Transit Fund and Grants Fund and is partially offset by a reduction in the Transportation 2050 Fund and the General Fund.The Regional Transit Fund 2021-22 budget allowance of $24,998,000 is $9,634,000 or 62.7 percent more than 2020-21 estimated expenditures. The increase is primarily due to Coronavirus
route bus service has been spent and the purchase of bus service by the region from the City of Phoenix is anticipated to increase in 2021-22 towards pre-pandemic levels.The Grants Fund 2021-22 budget allowance of $161,955,000 is $61,497,000 or 61.2 percent more than 2020-21 estimated expenditures. The increase is primarily due the award of $43 million in funding from the Coronavirus Response and Relief Supplemental Appropriations Act of 2021 (CRRSA) and $105 million as a result of the American Rescue Plan Act of 2021 (ARPA). This is offset by the conclusion of federal funds from the (CARES) of 2020.The Transportation 2050 Fund 2021-22 budget allowance of $86,797,000 is $33,164,000 or 27.6 percent less than 2020-21 estimated expenditures. The decrease is primarily due to expenditures in 2021-22 being shifted to the Grants Fund due to the receipt of additional federal funds in response to COVID-19. The decrease is partially offset by negotiated employee compensation increases and increases for gasoline and liquid petroleum gas (LPG) due to the resuming of bus operations to a pre-pandemic level.The General Fund 2021-22 budget allowance of $1,838,000 is $2,381,000 or 56.4 percent less than 2020-21 estimated expenditures. The decrease is primarily due to the conclusion of the General Fund resources made available through the offset of public safety salaries with the Coronavirus Relief Fund as permitted by the Federal guidelines.
Public TransitAnnual Bus Ridership
(Boardings)
Fiscal Year *Estimated
Millions
60
40
20
0
2017-18 2018-19
28
2019-20
3535
19
2021-22*
15
2020-21*
2019-20 and 2020-21 declined due to the COVID-19 pandemic. 2021-22 ridership is expected to increase statewide as COVID-19 restrictions are lifted.

128
2019-20 2020-21 2021-22 Actual Estimate1 Budget
On-time performance for bus service 95.0% 95.0% 95.0%On-time performance for Dial-a-Ride prescheduled service 95.0% 95.0% 95.0%Cost recovery from bus fares2 11.36% 2.66% 8.48%Bus boardings per revenue mile3 1.30 0.71 1.00Average weekday ridership - light rail (Phoenix only)3 29,000 16,000 17,000 Number of Senior Center Shuttle Trips4 53,807 0 59,000
Public Transit Major Performance Measures and Service Levels
1Based on 10 months actual experience.2The decrease in 2020-21 cost recovery is due to the temporary suspension in collecting passenger fares, due to the implementation of passenger rear-door boarding procedures resulting from the COVID-19 pandemic. The anticipated increase in 2021-22 is due to the gradual growth of ridership and the completion of the installation of safety barriers on buses thus enabling front door entry and the use of the farebox.
3The decrease in 2020-21 is related to the COVID-19 pandemic. The anticipated increase in 2021-22 is due to anticipated gradual growth of ridership.4The decrease in 2020-21 resulted from the temporary closure of senior centers due to the pandemic, and the anticipated increase in 2021-22 is due to the senior centers being reopened.
Expenditure and Position Summary
2019-20 2020-21 2021-22 Actual Estimate Budget
Operating Expense $253,972,000 $241,369,000 $277,014,000Total Positions 120.0 121.0 121.0
Source of Funds: General Fund $1,280,000 $4,219,000 $1,838,000Transportation 2050 191,630,000 119,961,000 86,797,000Regional Transit 34,263,000 15,364,000 24,998,000Grants 25,486,000 100,458,000 161,955,000Other Restricted 1,313,000 1,368,000 1,426,000

129
The Community Development program budget includes Community and Economic Development, Housing, Neighborhood Services, and Planning and Development.
The Community Development Program Represents 7.2% of the Total Budget.
COMMUNITYDEVELOPMENT

130
PLANNING AND DEVELOPMENT
Program GoalThe Planning and Development Department manages planning, development and preservation for a better Phoenix. Key services of the department include design review, permitting, inspections, implementation and updates to the General Plan, administration of the Zoning Ordinance, processing rezoning requests and Historic Preservation.
Budget Allowance ExplanationThe Planning and Development Department 2021-22 operating budget allowance of $81,254,000 is $9,439,000 or 13.1 percent more than 2020-21 estimated expenditures. This is primarily due to increased costs in the Development Services Fund, General Fund and Other Restricted Fund.
The Development Services Fund 2021-22 budget allowance of $74,906,000 is $8,431,000 or 12.7 percent more than 2020-21 estimated expenditures. This increase is primarily due to negotiated increases in employee compensation, the full year cost of new positions that were added in February 2021 to address workloads associated
accommodate new staff. In addition, funding was added for positions to conduct residential and commercial plan reviews, support accounting and technology due to the new KIVA permitting system, processing citations and court documents for increasing non-permitted construction activity and the new Remote Inspections Program implemented in the spring of 2020.
The General Fund 2021-22 budget allowance of $5,173,000 is $824,000 or 18.9 percent more than 2020-21 estimated expenditures. The increase is primarily due to the addition of staff to support the Long Range Planning Division to carryout City Council approved and community requested projects, funding for historic preservation grants to assist residential property owners in maintaining their historic properties, increased funding for the Adaptive Reuse Program, and negotiated increases in employee compensation.
The Other Restricted Fund 2021-22 budget allowance of $1,110,000 is $207,000 or 22.9 percent more than 2020-21 estimated expenditures. This increase is primarily for a
drainage study.
Planning and Development Total Construction Permits Issued
Fiscal Year *Estimated
Thousands60
50
40
30
20
10
0
4844.5
2021-22*2017-18
47
2020-21*
44.2
2018-19
43.3
2019-20

131
2019-20 2020-21 2021-22 Actual Estimate1 Budget
Total construction permits issued 43,330 47,000 48,000
Turnaround time for major commercial building plans (days)2 50 41 45
Turnaround time for medium commercial building plans (days)3 33 37 35
Turnaround time for minor commercial building plans (days)3 22 26 25
Turnaround time for residential building plans (days) 31 32 30
Percent of commercial inspections completed on time 99% 98% 99%
Percent of residential inspections completed on time 96% 96% 96%
Percent of costs recovered through fees 109% 105% 100%
Average number of days to schedule pre-application meeting prior to rezoning application 14 14 14
Board, commission and committee packets available seven days prior to meeting 100% 100% 100%
Number of design reviews performed on building permits in historic districts4 697 688 692
Number of City grants awarded for historic rehabilitation projects5 7 1 12
Number of regulatory compliance reviews for federally funded City capital projects 266 200 200
Planning and Development Major Performance Measures and Service Levels
1 Based on 10 months actual experience.2 The decrease in days from 2019-20 was due to the complexity of larger project submittals received in 2019-20. 3 The increase from 2019-20 is due to more medium and minor commercial plan reviews submitted. 4
hearings. 5 The reduction in 2020-21 resulted from not receiving requests for grant funds due to the COVID pandemic, an increase in requests is expected in 2021-22.
Expenditure and Position Summary
2019-20 2020-21 2021-22 Actual Estimate Budget
Operating Expense $64,824,000 $71,815,000 $81,254,000Total Positions 444.8 467.8 480.8Source of Funds: Development Services $60,353,000 $66,475,000 $74,906,000Grants 165,000 87,000 66,000General Fund 3,691,000 4,349,000 5,173,000Other Restricted 615,000 903,000 1,110,000
132
HOUSING
Program GoalThe Housing Department provides
environments for low-income families, seniors and persons with disabilities through the operation and leasing of assisted and affordable housing.
Budget Allowance ExplanationThe Housing 2021-22 operating budget allowance of $113,507,000 is $1,727,000 or 1.5 percent more than 2020-21 estimated expenditures. The increase is primarily due to new funding provided in the General Fund for a Special Projects Administrator to continue implementation of the Housing Phoenix Plan, as well as $1.4 million to fund rehabilitation work at Santa Fe Springs Apartments. The budget also reflects negotiated increases in employee compensation and other normal inflationary adjustments.
2019-20 2020-21 2021-22 Actual Estimate1 Budget
Affordable housing units for families and individuals 2,297 2,297 2,297
Affordable housing units created or preserved for families and individuals 202 119 361 owned and operated by private sector developers2
Rental assistance provided for low-income residents in the private housing market3 6,110 6,977 7,300
Federally-Assisted housing units for families and seniors4 2,537 1,695 1,615
Utilization rate for Section 8 vouchers 91% 93% 93%
Occupancy rate for public housing units 91% 90% 90%
Housing Major Performance Measures and Service Levels
1Based on 10 months actual experience.2The COVID-19 pandemic caused delays in the development of affordable housing units. Development is expected to increase in 2021-22. 3Through the Rental Assistance Demonstration (RAD) program, approximately 680 units in public housing complexes are being converted to voucher-based
aging facilities, while not diminishing the supply of available public housing.4
the Section 32 program.
Expenditure and Position Summary
2019-20 2020-21 2021-22 Actual Estimate Budget
Operating Expense $96,702,000 $111,780,000 $113,507,000Total Positions 129.0 126.0 126.0
Source of Funds: General Fund $152,000 $295,000 $1,772,000Other Restricted 4,416,000 5,488,000 7,402,000Grants 92,133,000 105,997,000 104,332,000
1Based on 10 months actual experience.22020-21 decrease in jobs is due to the impact of the COVID-19 pandemic. 2021-22 increase is due to a surge in advance manufacturing sector jobs.32020-21 reduction in average salary is due to the impact of the COVID-19 pandemic. 2021-22 wage increase is due to the increase of manufacturing jobs which have a higher wage.
133
COMMUNITY AND ECONOMIC DEVELOPMENT
Program GoalThe Community and Economic Development Department creates or facilitates development activities that add or retain jobs, enhances City revenues and enhances the quality of life including business development in Sky Harbor Center, downtown redevelopment area and other non-redevelopment areas.
Budget Allowance ExplanationThe Community and Economic Development 2021-22 operating budget allowance of $13,882,000 is $7,939,000 or 36.4 percent less than 2020-21 estimated expenditures. This is primarily due to the conclusion of the federal grant for the Coronavirus Relief Fund.
The General Fund 2021-22 budget allowance of $6,884,000 is $928,000 or 15.6 percent more than 2020-21 estimated expenditures. The increase is primarily due to negotiated increases in employee compensation and other normal inflationary adjustments. Funding is also included to convert one Special Project Administrator position from temporary to regular status and add one Economic Development Program Manager and one Project Manager to support citywide economic development and retail revitalization projects.
The Community Reinvestment 2021-22 budget allowance of $2,128,000 is $53,000 or 2.4 percent less than 2020-21 estimated expenditures due to a decrease in contractual obligations.
The Sport Facilities 2021-22 budget allowance of $292,000 is $63,000 or 17.7 percent less than 2020-21 estimated expenditures due to the completion of the Talking Stick Resort Arena project.
The Other Restricted 2021-22 budget allowance of $3,866,000 is $631,000 or 19.5 percent more than 2020-21 estimated expenditures due to an increase in Strategic Economic Development Fund projects.
2019-20 2020-21 2021-22 Actual Estimate1 Budget
Projected jobs created/retained within the City of Phoenix as a result of department efforts.2 10,000 6,000 8,000
Projected average annual salary for new jobs with companies newly located in Phoenix.3 $48,200 $40,000 $50,000
Community and Economic Development Major Performance Measures and Service Levels
Expenditure and Position Summary
2019-20 2020-21 2021-22 Actual Estimate Budget
Operating Expense $15,848,000 $21,821,000 $13,882,000Total Positions 57.0 57.0 59.0
Source of Funds: General Fund 5,490,000 5,956,000 6,884,000Community Reinvestment 1,104,000 2,181,000 2,128,000Sports Facilities 364,000 355,000 292,000Other Restricted 3,184,000 3,235,000 3,866,000Grants 5,086,000 9,456,000 102,000Aviation 29,000 75,000 75,000Convention Center 560,000 532,000 504,000Water 31,000 31,000 31,000

134
NEIGHBORHOOD SERVICES
Program GoalTo preserve and improve the physical, social and economic health of Phoenix neighborhoods, support neighborhood self-reliance and enhance the quality of life of residents through community-based problem solving, neighborhood-oriented services and public/private cooperation.
Budget Allowance ExplanationThe Neighborhood Services 2021-22 operating budget allowance of $82,998,000 is $7,358,000 or 9.7 percent more than 2020-21 estimated expenditures. The increase is due to Grants and the General Fund.
The Grants Funds 2021-22 budget allowance of $67,211,000 is $6,275,000 or 10.3 percent more than 2020-21 estimated expenditures. The increase is primarily due to unspent funding that was carried forward and included in the 2021-22 budget and negotiated increases in employee compensation.
The General Fund 2021-22 budget allowance of $15,515,000 is $1,059,000 or 7.3 percent more than 2020-21 estimated expenditures. The increase is primarily due to negotiated increases in employee compensation and for the replacement of vehicles which have reached the end of their useful life.
Neighborhood ServicesNeighborhood PreservationStandard Case Cycle Time
Standard case cycle time is the number of calendar days it takes to open and close cases in which a violation is resolved before a
Fiscal Year *Estimated
Calendar Days100
80
60
40
20
0
34 36
2019-20 2021-22*2017-18
34
2020-21*
29
2018-19
31

135
2019-20 2020-21 2021-22 Actual Estimate1 Budget
Residents who receive landlord/tenant counseling2 462 N/A N/A
Number of household units rehabbed or assisted through housing rehabilitation programs3 138 120 120
Neighborhood Preservation cases opened annually4 48,808 40,000 40,000
Neighborhood Preservation average standard case cycle time (days)5 34 34 36
Percent of Neighborhood Preservation cases resolved voluntarily (goal is 93% or above)5 94% 97% 93%
The number of new neighborhood groups6 25 12 15
Neighborhood Services Major Performance Measures and Service Levels
1 Based on 10 months actual experience.2 The decrease in 2020-21 and 2021-22 is due to the program being moved to the Human Services Department. 3 The decrease in 2020-21 and 2021-22 resulted from contractors and residents choosing to delay their participation in the program due to the COVID-19
pandemic.4 The decrease in 2020-21 and 2021-22 is due to a decline in resident complaints during the pandemic. 5 The change in 2021-22 is due to the anticipation that voluntary compliance might decline to pre pandemic levels resulting in a slightly higher case cycle
time.6 The decrease in 2020-21 and 2021-22 is due to residents choosing to delay participation in the program due to the COVID-19 pandemic.
Expenditure and Position Summary
2019-20 2020-21 2021-22 Actual Estimate Budget
Operating Expense $45,778,000 $75,640,000 $82,998,000Total Positions 190.0 190.0 191.0
Source of Funds: General Fund $13,210,000 $14,456,000 $15,515,000Other Restricted 7,000 10,000 11,000Grants 32,561,000 60,936,000 67,211,000Neighborhood Protection - 237,000 261,000
136

137
The Community Enrichment program budget includes Human
and the Phoenix Convention Center.
The Community Enrichment Program Represents 9.1% of the Total Budget.
COMMUNITYENRICHMENT

Thousands
1200
1000
800
600
400
200
0
2021-22*
903
2017-18
1
2020-21*
1,012
2018-19
264
2019-20
275
138
PARKS AND RECREATION
Program GoalThe Parks and Recreation Department provides and maintains a diverse parks and recreation system available and accessible to all, which contributes to the physical, mental, social and cultural needs of the community and provides outlets that cultivate a wholesome sense of civic pride and social responsibility.
Budget Allowance ExplanationThe Parks and Recreation Department 2021-22 budget allowance of $124,443,000 is $11,741,000 or 10.4 percent more than 2020-21 estimated expenditures. The increase is due to the General Fund, Phoenix Parks and Preserves Initiative (PPPI) Fund, and the Other Restricted Fund. This is partially offset by a decrease in the Golf Fund and Grant Funds.
The General Fund 2021-22 budget allowance of $108,229,000 is $12,528,000 or 13.1 percent more than 2020-21 estimated expenditures. The increase is primarily due to negotiated increases in employee compensation, fewer anticipated vacancies, and increased operating costs due to the phased-in re-opening of facilities. Additionally, funding has been added to restore a Forestry Crew in support of the Tree and Shade Master Plan, for the opening of the new Cesar Chavez Community Center, increased maintenance for new park amenities and historic cemeteries, expansion of the Adaptive/Inclusive Recreation Program, and a set-
addition, staff have been added to support the Urban Park Ranger program, Pueblo Grande Museum, facility and IT maintenance, and maintenance of the Highline Canal Trail.
The Phoenix Parks and Preserves Initiative Fund 2021-22 budget allowance of $6,479,000 is $550,000 or 9.3 percent more than 2020-21 estimated expenditures. The increase is primarily due to negotiated increases in employee compensation.
The Other Restricted Fund 2021-22 budget allowance of $2,909,000 is $2,132,000 or 274.4 percent more than 2020-21 estimated expenditures. This increase is primarily due to the
response to COVID-19, and an anticipated phased reopening of facilities in 2021-22.
The Grants Fund 2021-22 budget allowance of $602,000 is $2,228,000 or 79.5 percent less than 2020-21 estimated expenditures. This decrease is primarily due to the conclusion of the federal grant for the Coronavirus Relief Fund.
The Golf Fund 2021-22 budget allowance of $6,224,000 is $1,140,000 or 15.5 percent less than 2020-21 estimated expenditures. The decrease is primarily due to an increase in 2020-21 for facility maintenance and repair expenses, and a reduction in the transfer of expenditures to the General Fund, which was facilitated by increased revenue.
Parks and RecreationRecreation Facility Attendance
Fiscal Year *Estimated
* The decrease in 2019-20 and 2020-21 is due to all recreation facilities being closed on April 1, 2020, in response to the COVID-19 pandemic and the increase in 2021-22 is due to the Phoenix City Council directing the phased reopening of recreation facilities beginning June 2021.

139
2019-20 2020-21 2021-22 Actual Estimate1 Budget
Construction projects completed 85% 85% 90%
Fill 80% or more of all non-team sport registration openings3 64% 64% 70%3 45% 40% 45%
Community usage of recreation and community center available programmable time2 45% 10% 46%
Recreation facility attendance2 264,147 1,000 275,000
Number of Golf Rounds4 215,306 275,609 281,000
Parks and Recreation Major Performance Measures and Service Levels
1 Based on 10 months actual experience.2 3 Affected by the reduction in registration openings and programmable time available as a result of closures due to COVID-19.4 Increase from 2019-20 due to limited recreation options during the COVID-19 pandemic and higher customer satisfaction from better golf course conditions,
the fleet of new golf carts, renovated on-site restaurants, and the golf instruction program.
Expenditure and Position Summary
2019-20 2020-21 2021-22 Actual Estimate Budget
Operating Expense $107,259,000 $112,702,000 $124,443,000Total Positions 1,013.1 1,017.0 1,050.0
Source of Funds: General Fund $92,755,000 $95,701,000 $108,229,000Other Restricted 2,083,000 777,000 2,909,000Grants 1,153,000 2,930,000 602,000Parks and Preserves 5,638,000 5,929,000 6,479,000Golf 5,630,000 7,364,000 6,224,000
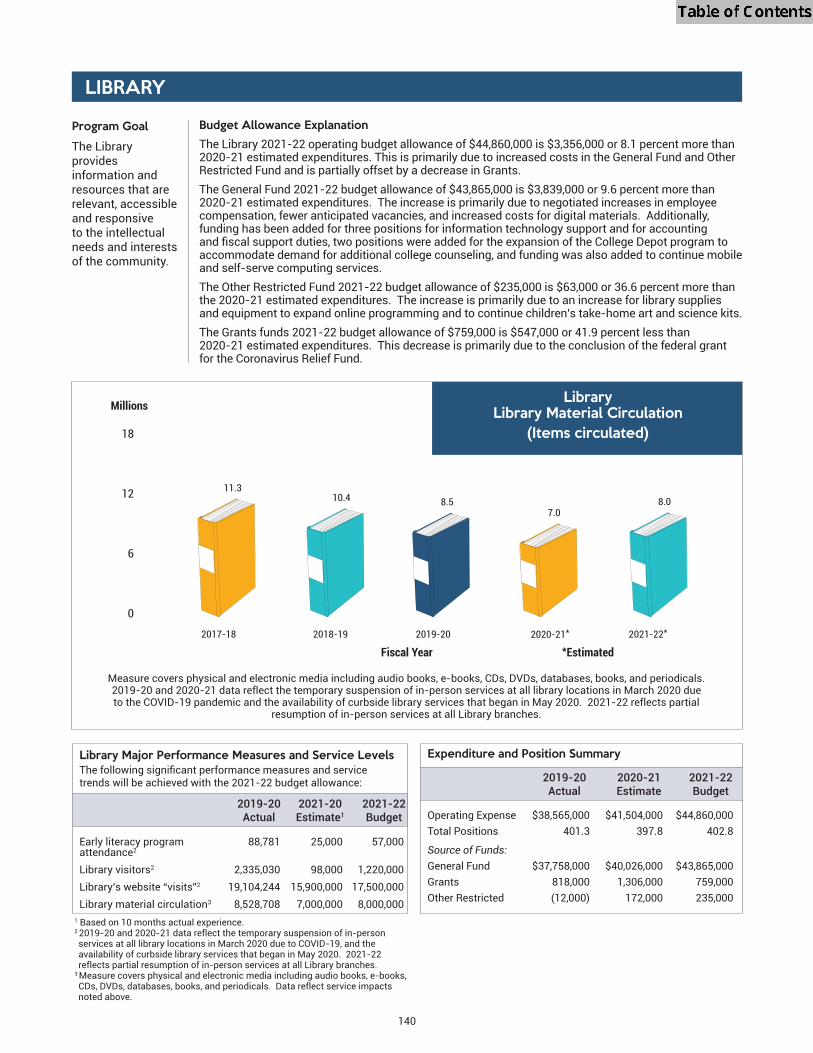
140
LIBRARY
Program GoalThe Library provides information and resources that are relevant, accessible and responsive to the intellectual needs and interests of the community.
Budget Allowance ExplanationThe Library 2021-22 operating budget allowance of $44,860,000 is $3,356,000 or 8.1 percent more than 2020-21 estimated expenditures. This is primarily due to increased costs in the General Fund and Other Restricted Fund and is partially offset by a decrease in Grants.The General Fund 2021-22 budget allowance of $43,865,000 is $3,839,000 or 9.6 percent more than 2020-21 estimated expenditures. The increase is primarily due to negotiated increases in employee compensation, fewer anticipated vacancies, and increased costs for digital materials. Additionally, funding has been added for three positions for information technology support and for accounting
accommodate demand for additional college counseling, and funding was also added to continue mobile and self-serve computing services.The Other Restricted Fund 2021-22 budget allowance of $235,000 is $63,000 or 36.6 percent more than the 2020-21 estimated expenditures. The increase is primarily due to an increase for library supplies and equipment to expand online programming and to continue children’s take-home art and science kits.The Grants funds 2021-22 budget allowance of $759,000 is $547,000 or 41.9 percent less than 2020-21 estimated expenditures. This decrease is primarily due to the conclusion of the federal grant for the Coronavirus Relief Fund.
LibraryLibrary Material Circulation
(Items circulated)
Measure covers physical and electronic media including audio books, e-books, CDs, DVDs, databases, books, and periodicals. 2019-20 and 2020-21 data reflect the temporary suspension of in-person services at all library locations in March 2020 due to the COVID-19 pandemic and the availability of curbside library services that began in May 2020. 2021-22 reflects partial
resumption of in-person services at all Library branches.
2019-20 2021-20 2021-22 Actual Estimate1 Budget
Early literacy program 88,781 25,000 57,000 attendance2 Library visitors2 2,335,030 98,000 1,220,000 Library’s website “visits”2 19,104,244 15,900,000 17,500,000 Library material circulation3 8,528,708 7,000,000 8,000,000
Library Major Performance Measures and Service Levels
trends will be achieved with the 2021-22 budget allowance:
1 Based on 10 months actual experience.2 2019-20 and 2020-21 data reflect the temporary suspension of in-person services at all library locations in March 2020 due to COVID-19, and the availability of curbside library services that began in May 2020. 2021-22 reflects partial resumption of in-person services at all Library branches.
3 Measure covers physical and electronic media including audio books, e-books, CDs, DVDs, databases, books, and periodicals. Data reflect service impacts noted above.
Expenditure and Position Summary
2019-20 2020-21 2021-22 Actual Estimate Budget
Operating Expense $38,565,000 $41,504,000 $44,860,000Total Positions 401.3 397.8 402.8
Source of Funds: General Fund $37,758,000 $40,026,000 $43,865,000Grants 818,000 1,306,000 759,000Other Restricted (12,000) 172,000 235,000
Fiscal Year *Estimated
18
12
6
0
Millions
8.011.3
2021-22*2017-18
7.0
2020-21*
10.4
2018-19
8.5
2019-20
2019-20 2020-21 2021-22 Actual Estimate1,3 Budget4
Estimated direct spending impact from conventions (millions)2 $214 $0 $188
Number of convention delegates 167,372 0 147,445
Number of conventions 42 0 37
Number of Consumer Shows 29 0 9
Percent square feet occupancy (average of all event types) 42.8% 0.0% 46.6%
Number of theatrical performances5 299 15 255
Total theater attendance5 266,942 740 196,926
Total parking revenue (millions) $4.80 $1.11 $4.45
Revenue per parking space $1,092 $253 $1,012
Operating expense per parking space $875 $830 $838
Phoenix Convention Center Major Performance Measures and Service Levels
141
PHOENIX CONVENTION CENTER
Program GoalThe Phoenix Convention Center and Venues hosts a diverse range of conventions, trade shows, meetings and entertainment events in one of the premier convention facilities in the United States. The department is committed to delivering the highest levels of customer service and guest experience in the industry. The Phoenix Convention Center and Venues enhances the economic vitality of the downtown area, the City of Phoenix and the state of Arizona by supporting tourism-related industries, businesses and cultural organizations.
Budget Allowance ExplanationThe Phoenix Convention Center 2021-22 operating budget allowance of $48,223,000 is $3,190,000 or 6.2 percent less than 2020-21 estimated expenditures. The decrease is primarily in the Convention Center fund.
The General Fund 2021-22 budget allowance of $2,292,000 is $94,000 or 3.9 percent less than 2020-21 estimated expenditures. The decrease is primarily due to postponing of capital purchases due to reduced revenue from the COVID-19 pandemic and reductions in maintenance for the Heritage and Regency garages due to expected reduced usage in 2021-22.
The Convention Center Fund 2021-22 budget allowance of $45,376,000 is $3,095,000 or 6.4 percent less than 2020-21 estimated expenditures. The decrease is due to reductions in facility maintenance and the contract with the Phoenix Visitor’s Bureau due to reduced revenue as a result of the COVID-19 pandemic.
1 Based on 10 months actual experience.2 Estimated direct spending impact is reported by the Greater Phoenix Convention and Visitors Bureau.3 Due to the COVID-19 pandemic, the Phoenix Convention Center was not able to host events and activities based on the guidelines of the CDC and local health
professionals in 2020-2021.4 The expectation of 2021-2022 is events and activities will gradually return to the Phoenix Convention Center based on CDC guidelines and local health
5 Virtual performances are counted in number of theatrical performances. The performances are not counted in theater attendance.
Expenditure and Position Summary
2019-20 2020-21 2021-22 Actual Estimate Budget
Operating Expense $53,680,000 $51,413,000 $48,223,000Total Positions 220.0 219.0 219.0
Source of Funds: General Fund $2,200,000 $2,386,000 $2,292,000Sports Facilities 591,000 555,000 555,000Convention Center 50,890,000 48,471,000 45,376,000

142
HUMAN SERVICES
Program GoalThe Human Services Department promotes
providing a wide array of services that foster the economic, physical and social well-being of residents.
Budget Allowance ExplanationThe Human Services Department 2021-22 operating budget allowance of $147,633,000 is $12,682,000 or 7.9 percent less than 2020-21 estimated expenditures. The overall decrease is primarily due to the conclusion of the federal grants related to the CARES Act that was a response to the COVID-19 pandemic.
The General Fund 2021-22 budget allowance of $22,051,000 is $1,641,000 or 8.0 percent more than 2020-21 estimated expenditures. This is primarily due to negotiated increases in employee compensation. In addition, funding was added to assist relatives of decedents, incapacitated individuals and juveniles as a
experiencing homelessness, to provide administrative support for the Homeless Services Division, to provide case management services for veterans seeking social services, and to support the Fast Track Cities initiative to end HIV/Aids.
The Grants 2021-22 budget allowance of $124,460,000 is $13,668,000 or 9.9 percent less than 2020-21 estimated expenditures. The decrease is primarily due to the conclusion of the federal grants related to the CARES Act that was a response to the COVID-19 pandemic.
The Other Restricted 2021-22 budget allowance of $742,000 is $655,000 or 46.9% less than 2020-21 estimated expenditures. The decrease is primarily due to the conclusion of the contributions from Suns Legacy Partners and Phoenix Suns Marketing Limited Partnership for Head Start services.
Human ServicesMeals Served by Senior
Nutrition Program
Increase for 20-21 and 21-22 is based on contracted units available to Senior Center members and Pandemic Relief Meal projections.
Fiscal Year *Estimated
Thousands
800
600
400
200
0
717
2021-22*
449
2017-18
499
2019-20
707
2020-21*
459
2018-19

143
Expenditure and Position Summary
2019-20 2020-21 2021-22 Actual Estimate Budget
Operating Expense $85,644,000 $160,315,000 $147,633,000Total Positions 391.0 392.0 395.0
Source of Funds: General $18,245,000 $19,184,000 $19,978,000Human Services Grants 55,689,000 61,958,000 58,963,000Community Development 1,107,000 1,119,000 2,213,000Block Grant Water 233,000 233,000 225,000Wastewater 173,000 173,000 155,000Other Restricted 284,000 1,784,000 1,670,000City Improvement 91,000 78,000 136,000Grants 7,170,000 10,213,000 17,074,000HOPE VI - 65,000 80,000Public Housing 53,000 83,000 89,000
1 Based on 10 months actual experience.2 Increase in 2020-21 and 2021-22 is due to the receipt of additional federal funds in response to the COVID-19 pandemic.3 Decrease in 2020-21 is due to restrictions related to the COVID-19 pandemic.4 Increase for 20-21 and 21-22 is based on contracted units available to Senior Center members and Pandemic Relief Meal projections. This includes 197,220
5 The increase in Victim Services in FY20-21 and FY21-22 are due to Family Advocacy Center staff streamlining how services are reported and increased referrals.
6 FY2019-20 higher numbers are due to the large scale “Return Stronger” campaign initiated by the State of Arizona that resulted in large numbers of people
attendance at the job centers.
2019-20 2020-21 2021-22 Actual Estimate1 Budget
Number of homeless households (individuals and families) 7,627 8,701 9,001 assisted through emergency shelter Number of households served at family service centers2 8,385 15,742 17,396 Percentage of school attendance for Head Start3 87% 56% 85% Medical and dental exams completed for Head Start3 4,744 3,111 4,700 Medical and dental exams completed for Early Head Start3 1,074 933 1,000 Number of meals served to seniors4 499,273 706,920 716,918
Number of victim services provided5 38,925 46,800 47,000
Number of job seekers assisted through the Workforce Development initiatives6 255,207 55,228 75,000
Human Services Major Performance Measures and Service Levels

144
PHOENIX OFFICE OF ARTS AND CULTURE
Program Goal
Culture supports the development of the arts and cultural community in Phoenix and seeks to raise the level of awareness and participation of City residents in the preservation, expansion and enjoyment of arts and culture.
Budget Allowance Explanation
$4,773,000 is $2,178,000 or 31.3 percent less than 2020-21 estimated expenditures. This is primarily due to decreases in Grants and Other Restricted Funds and is partially offset by an increase in the General Fund.
The Grants funds 2021-22 budget decrease is primarily due to the conclusion of federal grants for the Coronavirus Relief Fund. The General Fund 2021-22 increase is primarily due to additional funding for public art maintenance, arts grants, youth arts and culture development programs, professional development and technical assistance for artists and arts administrators, and Latino Cultural Center popup programming. The increase is also due to negotiated increases in employee compensation, fewer anticipated vacancies, and increased costs for facility maintenance.
2019-20 2020-21 2021-22 Actual Estimate1 Budget
2 87 96 1052 84 91 96
Completed Percent-for-Art projects to enhance capital improvement projects with artwork 4 7 8
Local artists/arts organizations training workshops3 10 30 20
Percent of projects in Art Plan being implemented4 76% 82% 72%
Community presentations 67 72 80
1 Based on 10 months actual experience.2 Increases are expected due to increased outreach to grantees.3 Numbers reflect presentations and workshops to local artists, the annual grant workshop training for arts organizations, and arts learning workshops.4 Measure reflect projects that were in design, under construction, or were completed. Reduced percentage reflects Art Plan projects that are programmed to
be implemented in future years.
Expenditure and Position Summary
2019-20 2020-21 2021-22 Actual Estimate Budget
Operating Expense $3,871,000 $6,951,000 $4,773,000Total Positions 11.0 11.0 11.0
Source of Funds: General $3,717,000 $3,947,000 $4,726,000Grants 153,000 2,979,000 27,000Other Restricted 1,000 25,000 20,000

145
The Environmental Services program budget includes
Works, and Water Services.
The Environmental Services Program Represents 13.9% of the Total Budget.
ENVIRONMENTALSERVICES
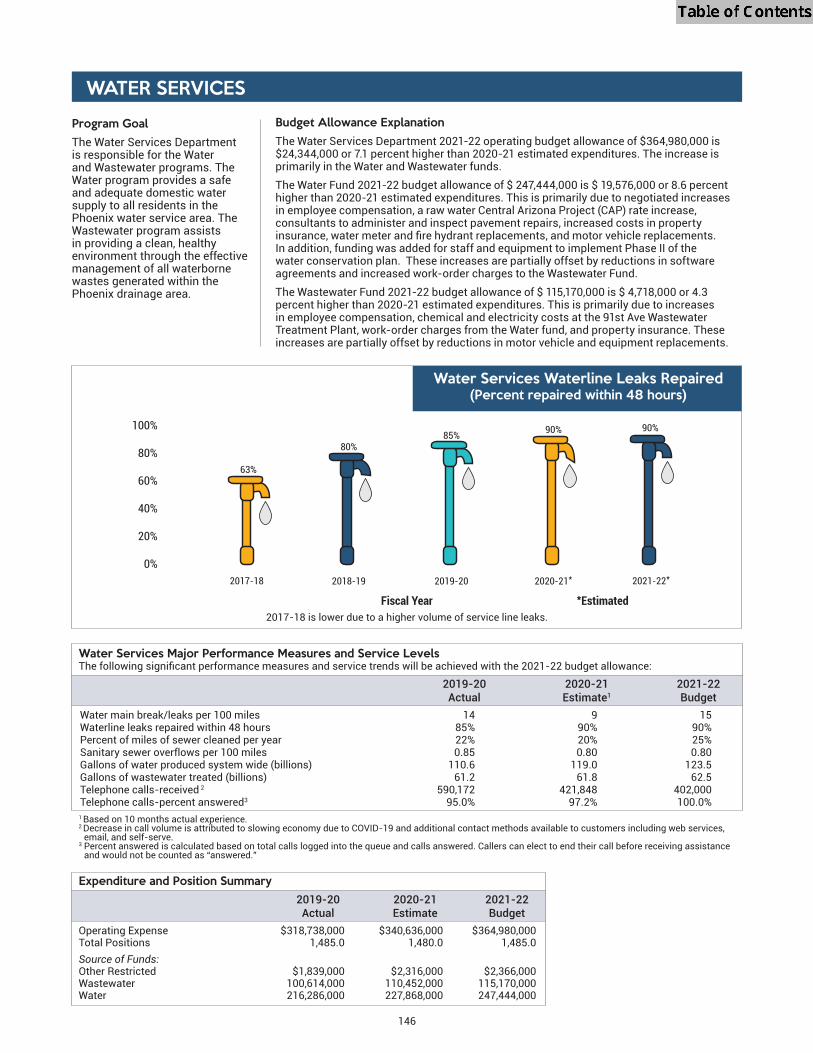
100%
80%
60%
40%
20%
0%
90%
63%
2021-22*2017-18
90%
2020-21*
80%
2018-19
85%
2019-20
146
WATER SERVICES Program GoalThe Water Services Department is responsible for the Water and Wastewater programs. The Water program provides a safe and adequate domestic water supply to all residents in the Phoenix water service area. The Wastewater program assists in providing a clean, healthy environment through the effective management of all waterborne wastes generated within the Phoenix drainage area.
Budget Allowance ExplanationThe Water Services Department 2021-22 operating budget allowance of $364,980,000 is $24,344,000 or 7.1 percent higher than 2020-21 estimated expenditures. The increase is primarily in the Water and Wastewater funds. The Water Fund 2021-22 budget allowance of $ 247,444,000 is $ 19,576,000 or 8.6 percent higher than 2020-21 estimated expenditures. This is primarily due to negotiated increases in employee compensation, a raw water Central Arizona Project (CAP) rate increase, consultants to administer and inspect pavement repairs, increased costs in property
In addition, funding was added for staff and equipment to implement Phase II of the water conservation plan. These increases are partially offset by reductions in software agreements and increased work-order charges to the Wastewater Fund.The Wastewater Fund 2021-22 budget allowance of $ 115,170,000 is $ 4,718,000 or 4.3 percent higher than 2020-21 estimated expenditures. This is primarily due to increases in employee compensation, chemical and electricity costs at the 91st Ave Wastewater Treatment Plant, work-order charges from the Water fund, and property insurance. These increases are partially offset by reductions in motor vehicle and equipment replacements.
Expenditure and Position Summary 2019-20 2020-21 2021-22 Actual Estimate Budget Operating Expense $318,738,000 $340,636,000 $364,980,000Total Positions 1,485.0 1,480.0 1,485.0Source of Funds: Other Restricted $1,839,000 $2,316,000 $2,366,000Wastewater 100,614,000 110,452,000 115,170,000Water 216,286,000 227,868,000 247,444,000
2019-20 2020-21 2021-22 Actual Estimate1 Budget Water main break/leaks per 100 miles 14 9 15Waterline leaks repaired within 48 hours 85% 90% 90%Percent of miles of sewer cleaned per year 22% 20% 25%Sanitary sewer overflows per 100 miles 0.85 0.80 0.80Gallons of water produced system wide (billions) 110.6 119.0 123.5Gallons of wastewater treated (billions) 61.2 61.8 62.5Telephone calls-received 2 590,172 421,848 402,000Telephone calls-percent answered3 95.0% 97.2% 100.0%
Water Services Major Performance Measures and Service Levels
1 Based on 10 months actual experience.2 Decrease in call volume is attributed to slowing economy due to COVID-19 and additional contact methods available to customers including web services,
email, and self-serve.3 Percent answered is calculated based on total calls logged into the queue and calls answered. Callers can elect to end their call before receiving assistance
and would not be counted as “answered.”
Water Services Waterline Leaks Repaired (Percent repaired within 48 hours)
Fiscal Year *Estimated2017-18 is lower due to a higher volume of service line leaks.

147
PUBLIC WORKS – SOLID WASTE MANAGEMENT
Program GoalThe Solid Waste Management Program assists in providing a safe and aesthetically acceptable environment through effective, integrated management of the solid waste stream, including collection, disposal, source reduction and recycling activities.
Budget Allowance ExplanationThe Solid Waste 2021-22 operating budget allowance of $170,439,000 is $11,671,000 or 7.4 percent more than 2020-21 estimated expenditures. This includes negotiated increases in employee compensation, increased costs for equipment maintenance, and reflects a large investment in replacement vehicles due to an aging fleet.
positions are included to support the coordination and expansion of the Human Services Campus Clean-Up service funded by the General Fund. Funding is also included for one Senior Human Resources Analyst position which was added to the Public Works Support Services area.
Solid Waste Recyclable Material Processed
1 Based on 10 months actual experience.2 Projected households for 2021-22 are based on 0.90% growth from 2020-21 projections.
3 Tonnage includes disposal tonnage collected at City transfer stations and
on 0.6% growth from 2020-21 projections.4 Tonnage includes Solid Waste Field Services tonnage, transfer station
tonnage for 2021-22 is based on 0.6% growth from 2020-21 projections.
Expenditure and Position Summary
2019-20 2020-21 2021-22 Actual Estimate Budget
Operating Expense $141,943,000 $158,768,000 $170,439,000Total Positions 603.0 625.5 633.5
Source of Funds: Solid Waste $141,943,000 $158,768,000 $170,439,000
2019-20 2020-21 2021-22 Actual Estimate1 Budget
Residential households served with 411,814 415,533 419,286 same day contained solid waste and recyclable material collections2 Tons of total solid waste 972,267 983,644 989,546
3 Tons of solid waste from City 632,699 634,474 638,281 residences disposed4
Solid Waste Management Major Performance Measures and Service Levels
will be achieved with the 2021-22 budget allowance:
Fiscal Year *Estimated
150
100
50
0
Thousands of Tons
120.1
130.1
2021-22*2017-18
129.3
2020-21*
120.3
2018-19
123.7
2019-20

148
PUBLIC WORKS – SUPPORT SERVICES
Program GoalThe Public Works Department provides mechanical and electrical maintenance and energy conservation services for City facilities; procures, manages and maintains the City’s fleet of vehicular equipment; and provides for the economical, safe and aesthetic design and construction of facilities on City property.
Budget Allowance ExplanationThe Public Works 2021-22 operating budget allowance of $23,368,000 is $146,000 or 0.6 percent more than 2020-21 estimated expenditures. The increase is primarily in the General Fund and is offset by a decrease in Grant funding due to the conclusion of the federal grant for the Coronavirus Relief Fund.
The General Fund 2021-22 budget allowance of $22,728,000 is $2,221,000 or 10.8 percent more than 2020-21 estimated expenditures. The increase is primarily due to negotiated increases in employee compensation. The 2021-22 budget allowance also includes restoration of ten fleet maintenance positions, one new position to support the Flood Plain Management program and three positions to support the operation of the Phoenix City Hall and Calvin C. Goode buildings appointment service counters implemented during the COVID-19 pandemic to provide for service continuity.
In addition, funding is included in the General Fund to support the coordination and expansion of the Human Services Campus Clean-up program for which positions and equipment will be in the Solid Waste Division of Public Works.
The Other Restricted 2021-22 budget allowance of $641,000 is $569,000 more than 2020-21 estimated expenditures due to ASU Facilities operations.
2019-20 2020-21 2021-22 Actual Estimate1 Budget
Square footage of buildings maintained 10,514,903 10,514,903 10,514,903Facility service requests completed2 19,299 17,500 18,000Fleet vehicles per mechanic3 40.4 41.3 39.8Units of equipment for which fleet management is provided 7,548 7,711 7,760Annual miles of fleet vehicle utilization (in millions) 49.2 47.4 47.8
Public Works Major Performance Measures and Service Levels
1 Based on 10 months actual experience.2 2020-21 facility service requests are projected to decrease due to building closures due to the COVID-19 pandemic. 2021-22 service requests are projected to
increase as City buildings open back up and employees return to work locations.3 The reduction in 2021-22 is due to the addition of new fleet maintenance positions.
Expenditure and Position Summary
2019-20 2020-21 2021-22 Actual Estimate Budget
Operating Expense $19,006,000 $23,222,000 $23,368,000Total Positions 426.0 431.0 443.0Source of Funds: General Fund $18,181,000 $20,507,000 $22,728,000Other Restricted 50,000 45,000 641,000Grants 775,000 2,671,000 -

149
OFFICE OF ENVIRONMENTAL PROGRAMS
Program Goal
Programs provides coordination and monitoring for the City’s environmental programs and activities, and develops and implements regulatory policies and programs.
Budget Allowance Explanation
is $1,759,000 or 46.8 percent less than the 2020-21 estimated expenditures. The decrease is primarily due to the conclusion of the federal grant for the Coronavirus Relief Fund.The General Fund 2021-22 budget allowance of $1,280,000 is $546,000 or 74.4 percent higher than 2020-21 estimated expenditures. Funding was added for a new Program Manager position to focus on the 2025 Phoenix Food Action Plan. Additional funding was added to support existing and future needs relating to air quality, climate and resilience planning. The Grants 2021-22 budget allowance of $16,000 is $2,354,000 or 99.3 percent less than 2020-21 estimated expenditures primarily due to the conclusion of the federal grant for the Coronavirus Relief Fund.
Environmental Programs Total Training Provided to Employees/ Consultants on Environmental Issues
The fluctuations reflect mandatory cyclical training requirements. Fiscal Year (FY) 2019-20 training numbers were low due to the COVID-19 pandemic as the majority of training was scheduled March–June 2020. FY 2020-21 had unusually high training numbers as more training sessions were added to capture those staff that missed the training the prior year. FY 2021-22 is slightly lower due to the biennial cycle of some of the training classes.
2019-20 2020-21 2021-22 Actual Estimate1 Budget
Number of site assessments conducted2 237 209 150
Percentage of time an emergency response team will arrive on-scene 92% 91% 90%within 2 hours of a call for service
Environmental Programs Major Performance Measures and Service Levels
1 Based on 10 months actual experience.2 While the number of assessments conducted remains consistent across years, the number of 404/sensitive species assessments varies based on the number
of capital projects in design in any one year. Fiscal year 2019-20 had a slightly higher than normal number of capital project assessment requests compared to previous years.
Expenditure and Position Summary
2019-20 2020-21 2021-22 Actual Estimate Budget
Operating Expense $1,300,000 $3,756,000 $1,997,000Total Positions 10.0 10.0 11.0Source of Funds: General Fund $620,000 $734,000 $1,280,000Capital Construction 64,000 70,000 70,000Other Restricted 159,000 183,000 199,000Grants 104,000 2,370,000 16,000Water 354,000 399,000 431,000
Fiscal Year *Estimated
2,000
1,500
1,000
500
0
Number Trained
800
1,536
2021-22*2018-19
489
2019-20
1,361
2017-18
1,661
2020-21*
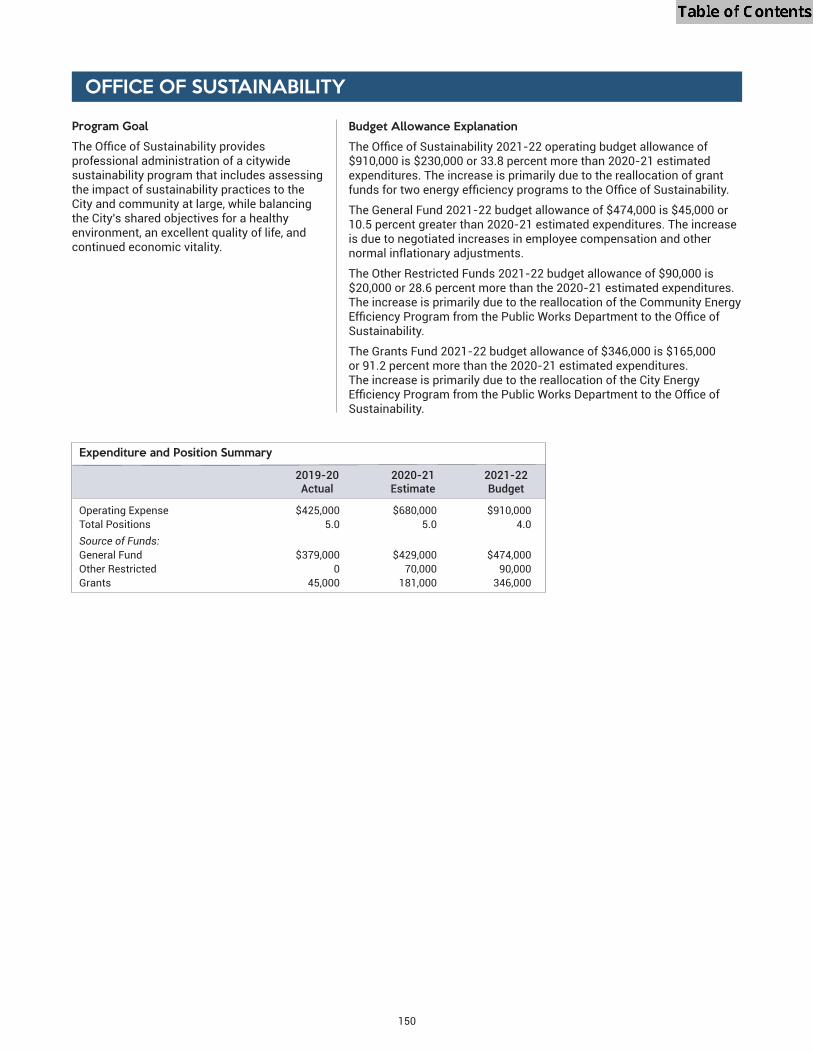
150
OFFICE OF SUSTAINABILITY
Program Goal
professional administration of a citywide sustainability program that includes assessing the impact of sustainability practices to the City and community at large, while balancing the City's shared objectives for a healthy environment, an excellent quality of life, and continued economic vitality.
Budget Allowance Explanation
$910,000 is $230,000 or 33.8 percent more than 2020-21 estimated expenditures. The increase is primarily due to the reallocation of grant
The General Fund 2021-22 budget allowance of $474,000 is $45,000 or 10.5 percent greater than 2020-21 estimated expenditures. The increase is due to negotiated increases in employee compensation and other normal inflationary adjustments.
The Other Restricted Funds 2021-22 budget allowance of $90,000 is $20,000 or 28.6 percent more than the 2020-21 estimated expenditures. The increase is primarily due to the reallocation of the Community Energy
Sustainability.
The Grants Fund 2021-22 budget allowance of $346,000 is $165,000 or 91.2 percent more than the 2020-21 estimated expenditures. The increase is primarily due to the reallocation of the City Energy
Sustainability.
Expenditure and Position Summary
2019-20 2020-21 2021-22 Actual Estimate Budget
Operating Expense $425,000 $680,000 $910,000Total Positions 5.0 5.0 4.0Source of Funds: General Fund $379,000 $429,000 $474,000Other Restricted 0 70,000 90,000Grants 45,000 181,000 346,000

General Fund Contingency and Percent of Fiscal Year Operating Expenditures Set-Aside Amounts Operating Expenditures 2012-13 1,109,322 40,658 4% 2,000 2013-14 1,125,373 43,658 4% —
2014-15 1,145,995 45,268 4% — 2015-16 1,149,761 46,400 4% — 2016-17 1,212,282 48,400 4% 34,746 2017-18 1,268,098 50,400 4% 5,500 2018-19 1,296,723 52,400 4% 9,219 2019-20 1,374,444 55,400 4% 2,512 2020-21 1,405,970 55,596 4% —
2021-22 1,576,231 57,000 4% 67,164
151
CONTINGENCIES
The Contingency Fund provides for possible emergencies and unanticipated costs that may occur after the budget is adopted. The possibility of natural disasters, public or employee safety emergencies or up-front costs for productivity opportunities necessitates the need for adequate contingency funds. The use of contingency is intended for unanticipated one-time expenses, since it represents limited one-time resources in the fund balance. Use of these contingency funds requires the recommendation of the City Manager and City Council approval.
GENERAL FUND CONTINGENCYThe General Fund contingency in 2021-22 will be $57,000,000, plus $67,164,000 in set-asides. The set-asides include $6,229,000 for the expansion of the Community Assistance Program to provide additional resources for responding to mental and behavioral health calls for service; $59,490,000 for the second year of the two year labor contracts for employee compensation increases in 2022-23; $500,000 for police reform to hire independent third-parties to complete a comprehensive review of the Phoenix Police Department to improve trust and accountability with the community; and $945,000 for staff, supplies and equipment to operate three new parks in the Southwest area of Phoenix expected to open in 2022-23.
operating expenditures. Achieving this goal will improve the City’s ability to withstand future economic cycles. The 2021-22 contingency reflects an increase of $1,404,000 over the 2020-21 contingency of $55,596,000 and maintains the contingency percentage at four percent.
The following table shows contingency funding and set-aside amounts over the past 10 years.
Comparison of Annual Budget for General Fund Contingency Amount to Operating Expenditures (000’s)

152
OTHER FUND CONTINGENCIESSimilar to the General Fund, other funds also include contingency amounts. The contingency amounts and percentages of total operating expenditures vary to accommodate differences in the volatility of operations and revenues. Use of these amounts requires City Council approval. The following table shows the contingency amount for each of the other funds.
2021-22 OTHER FUND OPERATING EXPENDITURE AND CONTINGENCY AMOUNT (000’S) Percent of Fund Operating Expenditures Contingency Amount Operating Expenditures
Aviation 372,968 20,000 5% Convention Center 48,880 3,000 6% Development Services 81,906 7,000 9% Solid Waste 171,647 1,000 1% Sports Facilities 22,690 20,000 88% Transportation 2050 91,311 4,000 4% Wastewater 128,461 12,500 10% Water 261,694 12,000 5%
153
COVID-19 FUNDING SUMMARY
On March 27, 2020 the Coronavirus Aid, Relief, and Economic Security (CARES) Act was signed into law to address the economic fallout resulting from the COVID-19 pandemic in the United States. State and local governments were awarded a variety of grant funds under the CARES Act.
Coronavirus Relief Fund (CRF)
The CARES Act allocated $150 billion in Coronavirus Relief Funds to states and cities with a population over 500,000 to address and mitigate the negative impacts of COVID-19. As a result, the City of Phoenix was awarded $293 million in Coronavirus Relief Funds. Based on the federal guidance, these funds could only be used to cover costs that were necessary expenditures caused by COVID-19 incurred between March 1 and December 30, 2020.
On May 5, 2020 City Council adopted the Coronavirus Relief Fund Strategic Plan. Based on input from City Council, the funds were allocated between Community Investment, City Operations and a Reserve to Preserve City Services. The Community Investment Programs were allocated between the following six categories:
• Business and Employee Assistance• Rent/Mortgage and Utility Assistance• Distance Learning and WiFi Access• Mitigation and Care of Vulnerable Populations• Food Delivery• Better Health and Community Outcomes
The programs created within these categories were designed to directly address the negative impact that the COVID-19 virus was having on Phoenix residents and local businesses. Some of the approved programs were new initiatives, while others supplemented existing programs that were approved or implemented as a broader strategy to mitigate COVID-19.
The City Operations portion of the Coronavirus Relief Fund Strategic Plan was designed to provide City departments with the resources needed to keep employees and residents safe and to provide staff with the tools and technology needed to facilitate teleworking and continuity of operations. The City Operations Programs were allocated under the following six categories:
• Employee COVID-19 Testing• PPE and Cleaning Supplies• Medical and Public Safety Measures• Payroll Expense Reimbursement/Management Oversight of COVID Funds• Telework/e-Government Solutions
The Reserve was initially created to address any unknown needs that could have surfaced as staff and the community dealt with the virus. However, as guidance from the Treasury changed, staff determined that the Reserve could be used to preserve existing General Funded programs that were facing reduction due to declining revenue by strategically offsetting eligible public safety salaries in the General Fund.
The following is a summary of other funds received by City Departments under either the CARES Act or the Consolidated Appropriations Act.
AviationThe Aviation Department received $148 million in funding from the CARES Act. Per Department of Treasury guidance this funding was available to be used on any lawful airport purpose. In addition, the Aviation Department received $39 million in funding from the Coronavirus Response and Relief Supplemental Appropriations Act of 2021(CRRSA).
Public TransitThe Public Transit Department received $99.5 million in CARES Act funding from the U.S. Department of Transportation (USDOT). In addition, the Public Transit Department received $43 million in funding from USDOT as a result of the Coronavirus Response and Relief Supplemental Appropriations Act of 2021 (CRRSA). The funding from the federal COVID-19 relief packages is to provide the resources needed to continue public transit operations and respond to the impacts of COVID-19.
Neighborhood ServicesThe Neighborhood Services Department received approximately $23.9 million in CARES Act Community Development Block Grant funding from the federal Department of Housing and Urban Development (HUD). These funds were allocated to
provide community services, supporting residents sheltering in place through housing rehabilitation, and increasing shelter beds for people experiencing homelessness.
Human ServicesThe Human Services Department has received nearly $40 million in COVID-related funding through a variety of agencies. Funding was used to assist Phoenix residents facing housing instability, homelessness, and other emergency services. Funding was also used to support Head Start aged children and families. Additionally, the Human Services Department received $51.1 million for the emergency rental assistance program from the Consolidated Appropriations Act 2021.
Housing DepartmentThe Housing Department has received $6.6 million in CARES Act funding from the federal Department of Housing and Urban Development (HUD) to be used for maintenance of normal operations and to prevent, prepare for, and respond to the coronavirus during the period impacted.
Fire Department
funds were allocated to purchase personal protective equipment for public safety responders and include items such as respirators, masks, and gloves.
Police Department and Fire DepartmentThe Police and Fire Departments received $2,572,519 in Coronavirus Supplemental Funding Program Formula Grant funds to purchase personal protective equipment for public safety responders. Items funded include masks, gloves, and gowns. Funds were also allocated to cover Police and Fire overtime expenses attributed to the City of Phoenix Incident Management Team while managing the COVID19 response.
American Rescue Plan Act (ARPA)
On March 11, 2021 the American Rescue Plan Act (ARPA) was signed into law to provide additional relief to address the continued impact of the COVID-19 pandemic on the economy, public health, state and local governments, individuals, and businesses.
State and Local Fiscal Recovery FundsOver the next two years, the City of Phoenix will receive approximately $396 million in State and Local Fiscal Recovery Funds under the umbrella of the previously approved American Rescue Plan Act which was signed by President Biden in March.
approximately $198 million on May 19, 2021. The second allocation of $198 million will be awarded approximately one year from now and is not expected to be available to spend until FY 2022-23.
According to federal guidance, these funds may only be used to cover costs that are necessary expenditures caused by COVID-19 incurred between March 3, 2021 and Dec. 31, 2024. Per the revised guidance and language currently available, funds can only be used to:
• Support public health expenditures, by funding COVID-19 mitigation efforts, medical expenses, behavioral healthcare, and certain public health and safety staff;
• Address negative economic impacts caused by the public health emergency, including economic harms to workers, households, small businesses, impacted industries, and the public sector;
• Replace lost public sector revenue, using this funding to provide government services to the extent of the reduction in revenue experienced due to the pandemic;
• Provide premium pay for essential workers, offering additional support to those who have borne and will bear the greatest health risks because of their service in critical infrastructure sectors; and
• Invest in water, sewer, and broadband infrastructure, making necessary investments to improve access to clean drinking water, support vital wastewater and stormwater infrastructure, and to expand access to broadband internet.
154
155
On June 8, 2021 City Council approved the American Rescue Plan Act Strategic Plan. Consistent with City Council direction
Community Investment, City Operations Investments and a Contingency.
The Community Investment category, the largest proposed allocation in this plan, is strategically focused on providing assistance to vulnerable populations, businesses and those hardest hit by the COVID-19 pandemic. This portion of the plan includes six distinct focus areas consisting of multiple programs. The proposed strategic plan assumes Community Investment will receive approximately 72% of ARPA funding. The Community Investment Programs were allocated between the following six categories:
• Phoenix Arts, Business and Employee Assistance• Mitigation and Care of Vulnerable Populations• Youth Sports, Recreation, Education, After-School and Wireless• Household and Residential Assistance• Phoenix Resilient Food System• Better Health and Community Outcomes
The City Operations category, the second largest of the three plan areas, is strategically focused on General Fund (GF) resiliency and capitalizing on the one-time nature of this funding source to address issues that will free up future GF resources and support transformational investments. The proposed strategic plan assumes City Operations will receive approximately 25% of ARPA funding, or $100 million, over two years. This area includes the following areas of focus:
• Infrastructure, Technology and Capital Needs• Revenue Replacement• PPE, Cleaning, Sanitizing/Testing and Vaccine Distribution
A $5 million contingency was included to preserve resources in case the federal government changes guidance to allow the funds to be used in new areas of concern for the Council or to supplement funding for an approved program that exhausts its allocation of funds before more funding becomes available. The contingency would also be available to cover other unexpected COVID-19 expenses that could occur later in the year. The reserve is not a requirement and Council could
In addition to the funds awarded to the City of Phoenix mentioned above, ARPA funds were also awarded directly to certain departments within the City of Phoenix.
Aviation DepartmentThe U.S. Department of Transportation also provided $8 billion for airport operations nationwide. The Aviation Department’s allocation for these ARPA funds has not yet been determined. The Aviation Department will apply for these funds after the Federal Aviation Administration publishes the funding requirements.
Housing DepartmentThe U.S. Department of Housing and Urban Development awarded the Housing Department $25.5 million in ARPA funds. The award was comprised of $4.2 million for Emergency Housing Vouchers to provide temporary public housing to individuals and families experiencing homelessness or at risk of homelessness, and $21.3 million for the on-going production or preservation of affordable housing, tenant-based rental assistance, supportive services, and purchase or development of non-congregate shelter for individuals and families experiencing homelessness.
Human Services DepartmentThe Human Services Department was awarded $55.3 million to continue the emergency rental assistance program, providing
Public Transit DepartmentThe U.S. Department of Transportation awarded the Public Transit Department $186 million as part of the American Rescue Plan Act. $105 million is to continue public transit operations and respond to the impacts of COVID-19, while $81 million is

156

157
DEBT SERVICE
Debt service expenditures include payments of principal, interest, costs of issuance and related costs such as trustee fees and reserve requirements for bonds issued. The debt service allowance in 2021-22 for existing debt and anticipated future bond sales is $651,533,000. As shown in the following pie chart, debt service expenditures are funded by both operating and capital funding sources. Secondary Property Tax represents the annual tax levy for general obligation bonded debt service and a federal subsidy payment.
2021-22 Debt Service
Types of Bonds Issued and Security
Under Arizona law, cities are authorized to issue voter-approved general obligation, highway user revenue and utility revenue bonds. For the City of Phoenix, this includes property tax-supported bonds and revenue bonds (such as water revenue and airport revenue bonds).
The City’s general obligation bonds are “full faith and credit” bonds. This means they are secured by a legally binding pledge to levy property taxes without limit to make annual bond principal and interest payments. Revenue bonds (such as water revenue and airport revenue bonds) are secured by a pledge of these enterprises’ net revenues (revenues net of operation and maintenance expenses) and do not constitute a general obligation of the City backed by general taxing power. Highway user revenue bonds are secured by state-shared gas taxes and other highway user fees and charges and also are not general obligations of the City.
Secondary Property Tax19.9%
Convention Center3.2%
City Improvement10.8%
Wastewater11.0%
Solid Waste2.3%
Water23.6%
Capital Funds15.8%
Aviation13.4%

Debt Management
centers and storm sewers. The debt service on these bonds is paid from the secondary property tax levy. By state law, the City can only use its secondary property tax levy to pay principal and interest on long-term debt.
revenues of these enterprises. In the past, the City also has used general obligation bonds for water, airport, sanitary sewer and solid waste purposes when deemed appropriate. Since the 1950s, the City has used a community review process to develop and acquire voter approval for general obligation bond programs. At a bond election held on March 14, 2006, voters approved all of the $878.5 million of the 2006 Citizens’ Bond Committee recommended bond authorizations. These authorizations provided funding to construct capital improvements in the following areas:
• Police and Fire Protection• Police, Fire and Computer Technology• Parks, Recreation and Mountain Preserves• Education Facilities• Library Facilities
In December 2011, the City Council adopted a policy to delay lower priority bond projects subject to an annual review of
advantage of favorable market rates. The General Obligation Reserve Fund is utilized strategically to pay down debt service to the staff-recommended balance while preserving the high bond ratings.
Bond RatingsAs shown in the chart below, the City’s bonds are rated favorably by the major bond rating agencies, Moody’s Investors Service, S&P and Fitch. The City’s general obligation bonds are rated Aa1, AA+ and AAA respectively.
158
City of Phoenix Bond Ratings
Rating (1)
Moody’s S&P FitchGeneral Obligation Aa1 AA+ AAAJunior Lien Water Revenue (2) Aa2 AAA -Senior Lien Airport Revenue (2) Aa3 A+ -Junior Lien Airport Revenue (2) A1 A -Senior Lien Tax Excise Tax Revenue (2) Aa2 AAA AA+Subordinated Excise Tax Revenue (2) Aa2 AAA AA+Senior Lien Wastewater System Revenue (2) Aa2 AAA -Junior Lien Wastewater System Revenue (2) Aa2 AAA -Rental Car Facility Charge Revenue Bonds (2) A3 BBB+ -Transit Excise Tax Revenue Bonds (Light Rail) (2) Aa2 AA -State of AZ Distribution Revenue Bonds (2) Aa2 AA -
(1) Represents underlying rating, if insured.(2) Issued by the City of Phoenix Civic Improvement Corporation.
Maintaining high bond ratings has resulted in a broader market for the City’s bonds and lower interest costs to the City. The following table is a statement of the City’s bonded indebtedness.
Statement of Bonded Indebtedness(1) (In Thousands of Dollars) General Obligation Bonds Non-Enterprise General Revenue-Supported General Total GeneralPurpose Obligation Bonds Obligation Bonds Obligation BondsVarious $1,002,860 $ — $1,002,860Airport — — —Sanitary Sewer — 375 375Solid Waste — 640 640Water — — —Direct Debt $1,002,860 $ 1,015 $1,003,875Less: Revenue Supported — (1,015) (1,015)Net Debt $1,002,860 $ — $1,002,860
(1) obligation bonds that have been refunded or the payment of which has been provided for in advance of maturity. The payment of the refunded debt service requirements is secured by obligations issued or fully guaranteed by the United States of America which were purchased with proceeds of the refunding
all principal, interest and redemption premiums where applicable, on the refunded bonds.
• Street Improvements• Storm Sewers• Senior Facilities• Cultural Facilities• Affordable Housing • Neighborhood Revitalization

159
Debt Limitation
Pursuant to Chapter 177, Laws of Arizona 2016, which became effective August 6, 2016, the City’s debt limitation is based on the full cash net assessed valuation. Full cash net assessed valuation for 2020-21 was $19,889,713,798. Under the provisions of the Arizona Constitution, outstanding general obligation bonded debt for combined water, sewer, light,
and transportation may not exceed 20 percent of a City’s full cash net assessed valuation, nor may outstanding general obligation bonded debt for all other purposes exceed 6 percent of a City’s full cash net assessed valuation. Unused borrowing capacity as of January 1, 2021, is shown below, based upon 2020-21 assessed valuation.
Water, Sewer, Light, Parks, Open Spaces, Playgrounds, Recreational Facilities, Public Safety, Law Enforcement, Fire Emergency, Streets and Transportation Purpose Bonds
20% Constitutional Limitation $3,977,942,760
Direct General Obligation Bonds Outstanding(1) (890,365,000)
Less: Debt Limit Reduction from Refunding(2) (33,261,199)
Unused 20% Limitation Borrowing Capacity $ 3,054,316,561
(1) Represents general obligation bonds outstanding as of January 1, 2021.(2) Per A.R.S. Section 35-473.01.I, refunding bonds issued on or after August 6, 2016 may cause a reduction in available debt limits based on the nature of the
refunded bonds (each, a “Debt Limit Reduction from Refunding”). If the principal amount of the refunded bonds is greater than the principal amount of the bonds that are refunding them and net premium is used to fund the escrow, then the difference in principal amounts will constitute a Debt Limit Reduction from Refunding.
All Other General Obligation Bonds
6% Constitutional Limitation $1,193,382,828
Direct General Obligation Bonds Outstanding(1) (113,510,000)
Less: Debt Limit Reduction from Refunding(2) (14,628,277)
Unused 6% Limitation Borrowing Capacity $1,065,244,551
Debt Burden
Debt burden is a measurement of the relationship between the debt of the City supported by its property tax base (net direct debt) to the broadest and most generally available measure of wealth in the community: the assessed valuation of all taxable property and the assessed valuation adjusted to reflect market value. In addition, net debt can be compared to population to determine net debt per capita. The City makes these comparisons each time it offers bonds for sale. They are included in
burden ratios as of January 1, 2021.
Net Direct General Obligation Bonded Debt Ratios
Per Capita Debt Limited Net Assessed Full Cash Pop. Est. Valuation Valuation (1,680,992)(1) ($13,923,185,918) ($198,012,408,578)
Direct General Obligation Bonded Debt $597.19 7.21% 0.51% Outstanding as of January 1, 2021 Net Direct General Obligation Bonded Debt $596.59 7.20% 0.51% Outstanding as of January 1, 2021
(1) Population estimate obtained from the U.S. Census Bureau as of July 1, 2019.
The City’s debt burden remains in the low-to-moderate range. This means the amount of net debt supported by the City’s property tax base is moderate relative to the value of that tax base.
The City has considerable bonded debt outstanding. However, the use of revenue bonds for enterprise activities and enterprise-supported general obligation bonds, in combination with a well-managed, property tax-supported bond program, has permitted the maintenance of a low-to-moderate debt burden.

debt service requirements to the corporation.
The City’s payments to the corporation are guaranteed by a pledge of excise taxes or utility revenues generated by the City’s airport, water system or wastewater system. Pledged excise taxes may include city sales, use, utility and franchise taxes; license and permit fees; and state-shared sales and income taxes.
160
Debt Service by Source of Funds and Type of Expenditure (In Thousands of Dollars)
2019-20 2020-21 2021-22SOURCE OF FUNDS Actual Estimate Budget
Operating FundsCity Improvement 123,972 58,706 70,421Secondary Property Tax 116,210 128,846 129,714Aviation 91,827 126,449 87,281Convention Center 19,952 20,639 20,763Solid Waste 14,041 14,977 15,227Wastewater 72,806 71,783 71,389Water 128,287 136,908 153,620
Capital Funds
Aviation 1,722 - - Convention Center - 259 - Transportation 2050 - - 800 Water 770 302 498 Other - 164 -
Capital Reserves - 800 -Customer Facility Charges 14,024 15,557 20,558Federal, State and Other Participation 23,500 23,998 24,498Passenger Facility Charges 49,945 22,598 56,763
Total $657,055 $621,986 $651,533
TYPE OF EXPENDITURE
Principal 361,917 306,895 314,169Interest and Other 295,138 315,090 337,363
Total $657,055 $621,986 $651,533

161
need and provide funding for capital projects and related operating costs.
Improvement Program transmitted to the City Council and reflected here includes replacement and improvements to water and wastewater infrastructure; construction of Terminal 4 South 1 Concourse at Phoenix Sky Harbor Airport; major street and bridge rehabilitation and new construction; major maintenance and assessments of facilities citywide; replacement of the KIVA Planning and Development permitting system and the Fire Computer-Aided Dispatch and Record Management
Phoenix; investment in northwest Phoenix regional public infrastructure, facilitating development of a multibillion dollar Taiwan Semiconductor Manufacturing Company campus; and development of Edison-Eastlake multifamily housing. The
2021-26 Capital Improvement Program Development
The annual citywide Capital Improvement Program update process began in December 2020 when departments prepared
updated construction cost estimates, schedules adjustments, awarded contract amounts and other program changes. The 2021-26 program includes projects planned for authorized and anticipated bond funding and the latest estimates for pay-as-you-go projects funded with operating funds, federal funds, impact fees and other sources. Also included are net new operating costs and/or savings. Budget and Research staff reviewed the departments’ programs for funding availability, reasonableness and technical accuracy.
Presented in this citywide program are projects reviewed and adopted through several planning processes. These include capital projects funded through the most recently adopted multi-year rate plans for enterprise funds such as Water,
various multi-year facility maintenance plans. Also reflected are capital projects from sales tax and voter-approved bond programs including the 2006 Bond Program approved by Phoenix voters in March 2006.
2006 Citizens’ Bond Program
A Citizens’ Bond Committee process was initiated by the City Council in June 2005. More than 700 community volunteers were appointed by the City Council to serve on 17 bond subcommittees to help shape the 2006 Citizens’ Bond program.
Two of the committees evaluated the City’s capacity to service new debt and to fund the operating costs of new capital facilities. These committees reviewed multi-year forecasts for assessed valuation and property tax levies, and for General Fund revenues and expenses. They recommended annual bond and operating cost capacities before 14 service-related
The City Council grouped the $878.5 million in projects into seven propositions all of which were approved by voters in March 2006. The decline in the local real estate market from the 2007-2009 recession resulted in a reduction in property tax revenue, which placed a strain on the property tax supported General Obligation Bond Program. As a result, a portion of this
Enterprise Funds
In addition to supporting related operations and maintenance costs, enterprise funds support pay-as-you-go funded capital projects and debt service for enterprise bond-funded capital projects.
Water, Wastewater and Solid Waste enterprise funds complete annual updates to their multi-year rate plans. These plans are
the full City Council. If necessary, user fee changes are implemented to support the updated plans.
Aviation funds include airport revenues, Passenger Facility Charges collected from enplaned passengers at the time of booking, Customer Facility Charges assessed to rental car customers, and federal and state grants. The City Council adopts ordinances establishing fee structures for use of the airport facilities, including airline rates and charges, at the beginning of
OVERVIEW OF CAPITAL IMPROVEMENT PROGRAM PROCESS

162
The Phoenix Convention Center enterprise fund receives most of its resources from designated sales taxes. To support a
was developed to establish pay-as-you-go, bond and related debt service, and operations and maintenance cost capacities
between the City and State of Arizona to expand and modernize the facility.
Capital Construction Funds
The Capital Construction Fund was established in 1998-99 and provides funding for critical street transportation and drainage infrastructure improvements, including projects focused on street pavement maintenance, and bicycle, pedestrian, stormwater and drainage facilities. Capital Construction funds are programmed into project categories for each year
Improvement Program.
Parks and Preserves Funds
In September 1999, the voters approved a 10-year, one-tenth of one percent sales tax to purchase state trust lands for the Sonoran Desert Preserve, and for the development and improvement of regional and neighborhood parks. This tax was renewed by voters in May 2008 for 30 years. The 2021-26 Capital Improvement Program includes $185.9 million of these funds, which are programmed for regional, community and neighborhood parks, and Sonoran Preserve land acquisition.
Transportation 2050 Funds
The voters approved Proposition 104 (Transportation 2050) in August 2015. This initiative authorized a three-tenths of one percent increase in the transaction privilege and use tax rate to fund the City’s Comprehensive Transportation Plan including new light rail lines, bus expansion and street improvements. Collection of Transportation 2050 sales tax began on January 1, 2016. The 2021-26 Capital Improvement Program includes $729.2 million in Transportation 2050 pay-as-you-go funds, as well as $200.2 million in Transportation 2050 bond funds.
Five-Year Streets Plan
and stormwater construction and major maintenance projects. This program is primarily funded through the Arizona Highway User Revenue (AHUR) fund, including state-shared revenue from gas taxes and vehicle license taxes, but also includes funding through the Transportation 2050 (Proposition 104) voter-approved initiative. The update begins with the
streams, and requirements for AHUR and other revenue resources to support operating expenditures and debt service to determine the amounts available for pay-as-you-go capital projects. Also included in the program are any needed updates to voter-approved bond projects as well as projects funded through intergovernmental partnerships.
Programming of Impact Fees
In 1987, the City Council adopted an ordinance requiring new development in the City’s peripheral planning areas to pay its proportionate share of the costs associated with providing public infrastructure. The impact fee program is also regulated by state law. The impact fee program was developed to address projected infrastructure requirements within several planning
the fees.
Only impact fee revenues that have been collected are budgeted in the Capital Improvement Program.
Operating costs for impact fee-funded projects are included in the rate planning process for Water, Wastewater and Solid
through the annual operating budget as costs for operating and maintaining new capital projects. Budget and Research staff has worked with the Planning and Development Department as well as operating department staff to appropriately program $175.2 million in available impact fees in the 2021-26 Capital Improvement Program. Additional impact fees will be programmed in future capital improvement programs as these fees are collected.

163

164

165
2021-26 CAPITAL IMPROVEMENT PROGRAM HIGHLIGHTS
for the 2021-26 program comes from $2.9 billion in bond funds, $3.1 billion in pay-as-you-go operating funds and $2.2 billion in other capital funds.
Program by source of funds and the 2021-22 Capital Improvement Program by fund group and program. A brief overview of
Arts and Cultural Facilities
The Arts and Cultural Facilities program totals $0.9 million and is funded by General Obligation Bond funds.Projects are typically prioritized based on community input obtained during the development of periodic General Obligation Bond programs.
The program provides partial funding to develop a Latino Cultural Center.
Aviation
The Aviation program totals $1,494.2 million and is funded by Aviation, Aviation Bond, Capital Grant and Passenger Facility Charge funds.
The Aviation program includes improvements at Phoenix Sky Harbor International, Phoenix Deer Valley and Phoenix Goodyear Airports as well as support for Phoenix-Mesa Gateway Airport.
Various divisions of the Aviation Department are responsible to identify and request new CIP projects as they are needed for airport expansion and replacement of existing infrastructure. They work with the stakeholders impacted by the project to develop a business case which includes a scope, schedule, and budget, including a return on investment analysis, for the project. As part of the business case, a points-based score is developed for the project. Scoring is based on the project’s
or public-private partnerships; regulatory mandates; safety and security risk mitigation; and level of service or community
2021-26 Capital Improvement ProgramSources of Funds
Other Capital Funds$2.2 Billion
Operating Funds$3.1 Billion
Bond Funds $2.9 Billion
relations needs. The business case is then presented to Aviation’s executive team for approval or revision. If approval is received, the project is placed on the priority ranking list according to the project’s score to await available funding and incorporation into the Aviation CIP.
Major projects include:
• Modernization of Terminal 4 vertical and horizontal transportation equipment
• Design and construction of Terminal 3 North Concourse
Economic Development
The $36.6 million Economic Development program is funded by Downtown Community Reinvestment, Arizona Highway User Revenue, Other Restricted and Sports Facilities funds.
alignment with strategic planning objectives; collaboration with business, government and educational partners; and, engagement with community groups and business associations. The City commits funds and expertise to partner with private and public entities. These partnerships help to expand the City’s economy through the creation of new infrastructure and civic improvements, that trigger regional revitalization, enhance public tax revenues, facilitate the growth of the
workforce housing objectives, and support of historic preservation and adaptive reuse projects.
Major projects include:
• Downtown Redevelopment Area project facilitation and assistance• ASU Thunderbird School of Global Management development assistance• Historic Preservation and Conservation facilitation and assistance • Arizona Biomedical Corridor Project Facilitation and assistance
Environmental Programs
The $1.3 million Environmental Programs CIP is funded by Other Restricted funds. Environmental Programs facilitates citywide general stormwater compliance projects.
Stormwater capital improvement projects are implemented to advance the City’s efforts to comply with stormwater management requirements and regulations. Any City department may propose a potential stormwater project, provided that the project meets the criteria outlined in the Stormwater Capital Improvement Project Fund Eligibility and Funding Protocol. The proposed projects are periodically reviewed by the Stormwater Working Group and then approved by the Stormwater Executive Committee based on criteria established in the funding protocol, including: risk of regulatory non-compliance, ability for the project to achieve sustained compliance, degradation to the City’s Municipal Separate Storm Sewer System, need for remediation, and other associated risks.
Facilities Management
The Facilities Management program totals $97.4 million and is funded by General, Development Services, Other Restricted, Solid Waste, Wastewater, Water, Other Bond and Other Capital funds.
The Facilities Management program includes various major maintenance projects for City facilities and fuel infrastructure. Additional citywide efforts to be implemented by Facilities Management primarily include: security access control, energy
Most Facilities Management capital projects are requested and prioritized under the annual General Fund Facilities Project Prioritization Process. New project requests originate from facility lifecycle replacement plans, facility assessments,
City facilities staff. Projects are reviewed by a committee of subject matter experts from various departments and are
Finance
system.
166
Fire Protection
The $37.1 million Fire Protection program is funded by General, Other Restricted, Other Bonds and Impact Fee funds.
The program consists of infrastructure in growth areas, implementation of new Computer Aided Dispatch and Records Management systems, construction of new Fire Station 62 at 99th Avenue and Lower Buckeye Road, and land acquisition for
new CIP project needs are presented to the Fire Department executive staff in the form of business cases, that are then evaluated based on the potential positive impact on service delivery to the Phoenix community.
incorporated in the City’s Infrastructure Financing Plan, which is reviewed by a citizens’ committee prior to public hearings and ultimate adoption by the City Council.
Historic Preservation & Planning
The Historic Preservation and Planning program totals $3.6 million and is funded by the Development Services fund.
The program includes the SHAPE Phoenix project which targets the Planning and Development Department’s primary land management applications for replacement. This multi-year project envisions replacing KIVA, PlanWeb and other supporting applications with a modern Planning, Zoning, Plan Review and Permitting application that supports community planning, development and regulation.
Housing
The Housing program totals $88.2 million and is funded by Operating Grant, Public Housing, Other Restricted and Capital Grant funds.
The program provides funding for the creation and modernization of senior public housing units and affordable housing units for low-income families throughout the City. Grant-funded modernization projects are planned based on the availability of these funds. Projects include HOME multifamily loan programs, transformation of the Choice Neighborhood at Edison-Eastlake community, conversion of existing public housing units into Rental Assistance Demonstration (RAD) housing units, affordable housing development and rehabilitation, and remodeling of family and senior public housing units.
Affordable Housing Initiative, in coordination with planned redevelopment programs, feedback from the Public Housing Resident Advisory Board, the Affordable Housing Development Community, and other stakeholders. Fiscal staff, project managers and housing managers actively participate in prioritizing funding availability, and addressing community housing needs and contractual terms of co-developers.
Human Services
The $0.6 million Human Services program is funded by General Obligation Bond funds.
Projects are typically prioritized based on community input obtained during the development of periodic General Obligation Bond programs.
The Human Services program includes design of a multi-purpose senior center adjacent to the Southwest Family Services Center.
Information Technology
The $59.0 million Information Technology program is funded by General, Arizona Highway User Revenue, Development Services, Transportation 2050, Aviation, Convention Center, Solid Waste, Wastewater, Water and Other Bond funds.
Information Technology CIP project requests typically start with the submission of a Business Investment Request Form from operational staff. The form provides City leadership visibility into information technology spending across the organization and helps ensure technology purchases are in alignment with current and future technology. Projects are evaluated and approved by various Information Technology divisions for security, application, and infrastructure considerations. After divisional review, projects are submitted for evaluation and prioritization by the Chief Information
The Information Technology program includes enhancement of the City's business intelligence and business analysis capabilities, replacement of FCC-mandated equipment with 700 MHz radios, and implementation of a modernized data center environment to provide a more reliable and secure computing environment.
167

Libraries
The Libraries program totals $9.4 million and is funded by General and Impact Fee funds.
The program includes branch library improvements and renovations to maintain current standards, and growth-driven infrastructure development pending future funding availability.
Improvement and renovation projects are requested and prioritized under the annual General Fund Facilities Project Prioritization Process. New project requests originate from facility lifecycle replacement plans, facility assessments,
City facilities staff. Projects are reviewed by a committee of subject matter experts from various departments and are
incorporated in the City’s Infrastructure Financing Plan, which is reviewed by a citizens’ committee prior to public hearings and ultimate adoption by the City Council.
Neighborhood Services
The Neighborhood Services program totals $14.1 million and is funded by Operating Grant funds.
The Neighborhood Services program seeks to stabilize neighborhoods and improve infrastructure by acquiring properties for revitalization. By partnering with City departments, projects such as landscaping, sidewalks, lighting and other infrastructure improvements provide enhancements to City neighborhoods.
The Neighborhood Services Department considers new CIP projects though the efforts of their Grants Compliance Team, which works closely with program staff, to identify potential CIP projects. Projects may also be proposed by the City Council or City management and evaluated based on availability of funding, eligibility of project area and scope which meets a HUD National Objective. Additionally, qualitative feedback is collected through community workshops, stakeholder consultations, and public requests, for projects such as: facility renovations, improvements to community centers, playgrounds, and other enhancements to community public infrastructure. Large projects, like acquisition of strategic or blighted properties,
community such as providing affordable housing or creating Safe Routes to Schools.
Non-Departmental Capital
The non-departmental capital program totals $515.4 million and is funded by Transportation 2050 Bond, Water Bond, Customer Facility Charge, Federal, State and Other Participation, and Passenger Facility Charge funds.
The non-departmental capital program consists of existing and anticipated future capital debt service, including payments of principal, interest, issuance costs and related expenditures such as trustee fees for bonds issued. The capital debt program reflects debt service for capital projects funded in other capital improvement programs.
Parks, Recreation and Mountain Preserves
The Parks, Recreation and Mountain Preserves program totals $212.7 million and is funded by Parks and Preserves, Operating Grant, Sports Facilities, Capital Grant, Capital Reserve, and Development Impact Fee funds.
amenities; and other citywide park infrastructure improvements.
database. Staff submit project PLAI request forms for the replacement or addition of equipment and structures. Staff review the PLAI database throughout the year; monitor park needs; score amenities based on categories including condition, location and safety, while accounting for emergency needs; and rate and rank each park site based on scores. New park
incorporated in the City’s Infrastructure Financing Plan, which is reviewed by a citizens’ committee prior to public hearings and ultimate adoption by the City Council.
Major projects include:
• New park at 55th Avenue and Samantha Way• New park at 87th Avenue and Lower Buckeye Road• New park at 71st Avenue and Meadows Loop Road• Design of future Lone Mountain park at 56th Street and Montgomery Road• Perry Park renovation
168
• Surrey Park renovation• North Mountain Park improvements• Citywide building repairs• Aquatic infrastructure renovation

Phoenix Convention Center
The $32.0 million Phoenix Convention Center program is funded by General and Convention Center funds. In addition to the Convention Center, this program includes projects and improvements for the Herberger Theater Center and Orpheum Theatre, Symphony Hall, and the Heritage and Convention Center parking garages.
The Phoenix Convention Center has a multi-discipline CIP committee comprised of members of the department including
project request form. The projects are then reviewed and ranked by staff for inclusion to a perpetual 10-year CIP forecast, that is constantly evaluated and updated. Project considerations include life safety, revenue generation, facility enhancement, and business and customer impact.
Major projects include
• Roof repairs for the South Building• Installation of HVAC and light control systems at the North and West buildings• Replacement of dimmer racks at Orpheum Theatre and Herberger Theater• Expansion joint replacement at the East Garage• Elevator refurbishment at Symphony Hall• Replacement veneer at the North Building
Police Protection
The $52.4 million Police Protection program is funded by General Obligation Bond, Capital Reserve and Impact Fee funds.
The program consists of purchasing replacement aerial fleet assets and future infrastructure in growth areas.
incorporated in the City’s Infrastructure Financing Plan, which is reviewed by a citizens’ committee prior to public hearings and ultimate adoption by the City Council.
Public Art Program
Public Art Program was established through the City’s Percent-for-Art ordinance in 1986 to enhance the form and function of public infrastructure, buildings and spaces. One percent of eligible capital funds are set aside to enhance the design of public building, infrastructure and spaces.
use GIS mapping to identify where multiple City efforts and fund sources can be combined to meet public needs. The Public
determine and approve projects to be included in the annual Public Art Plan.
Public Transit
The Public Transit program totals $1,241.7 million and is funded by Operating Grant, Other Restricted, Regional Transit, Transportation 2050, Transportation 2050 Bond and Capital Grant funds.
Public Transit staff and management identify project needs by utilizing several planning documents – the Transportation 2050 Plan, the fleet replacement plan, the Maricopa Association of Governments Transportation Improvement Program, and the Transit Life Cycle Program element of the Regional Transportation Plan. Additionally, public assets are considered for potential refurbishment, upgrade, or replacement. Staff from each division submit project requests to Public Transit management for review, prioritization, and funding consideration.
Major projects in the Public Transit program include:
• Implementation of Transportation 2050 Bus Rapid Transit program• Land acquisition and support services for Northwest Extension Phase II Light Rail extension• Land acquisition, design and construction of the Capitol and I-10 West Phase I Light Rail extension• Land acquisition and support services for South Central Light Rail construction• Implementation of technology enhancements• Purchase of new and replacement buses, Dial-A-Ride vehicles and commuter vans
169

170
Regional Wireless Cooperative (RWC)
The Regional Wireless Cooperative (RWC) program totals $30.0 million and is funded through the contributions of RWC member cities. The City of Phoenix’s contribution is funded through excise tax-supported city improvement debt.
The RWC program’s objective is to develop and assist subscriber cities with an FCC mandate requiring 700 MHz infrastructure upgrades for narrow-banding capabilities.
prioritized, and scheduled by the Administrative Manager, the City’s Information Technology Services Department, which
based on percentage of network use or special assessments and presented to the RWC Board of Directors for action. A CIP Working Group may also be asked to consider and draft large-scale CIP projects as needed.
Solid Waste Disposal
The $75.0 million Solid Waste Disposal program is funded by Solid Waste, Solid Waste Bond, Capital Reserve and Solid Waste Remediation funds.
New projects for the Solid Waste Disposal CIP are evaluated and prioritized using the annual Project Charter process. Staff submit a Program/Project Charter form to provide information about the new program or project request. The form describes
the Public Works Director and Assistant Directors review the requests. The committee evaluates and prioritizes the projects
operational flexibility, system security, system replacement and rehabilitation, regulatory compliance, and system growth. In addition to staff reviews, a Citizens Solid Waste Rate Advisory Committee performs an advisory role in reviewing the Solid Waste Utility Financial Plan and advising on the operating and capital program expenses and projects.
Major projects include:
• Major maintenance, repair, and equipment replacement to support transfer stations operations• Material Recovery Facility (MRF) equipment replacement
Street Transportation and Drainage
The Street Transportation and Drainage program totals $860.4 million and is funded by Arizona Highway User Revenue, Capital Construction, Transportation 2050, General Obligation Bond, Transportation 2050 Bond, Impact Fee, and partner agency contribution funds.
The program includes ongoing major maintenance of streets and bridges, new and expanded streets, mobility improvements,
accelerated citywide pavement maintenance program.
process begins with the collection of “Call for Projects” forms submitted by staff. These forms require various quantitative
requirements. The requests are gathered and evaluated. Immediate funding needs for existing funded projects and programs, and local funding matches required to leverage outside funding, are prioritized. Prioritization of new project and program proposals considers immediate life safety needs; the existence of completed pre-design studies with economical, feasible and publicly supported recommendations; and equity in project distribution. Project prioritization outcomes are presented to department management for review.
incorporated in the City’s Infrastructure Financing Plan, which is reviewed by a citizens’ committee prior to public hearings and ultimate adoption by the City Council.
Major projects planned include improvements to the following locations:
• Lower Buckeye Road: 27th Avenue to 19th Avenue• Pinnacle Peak Road: 45th Avenue to 35th Avenue• Pinnacle Peak Road: Central Avenue to 7th Street• 13th Street: Van Buren Street to Moreland Street• 3rd Street Promenade: McDowell Road to Indian School Road• 35th Avenue: I-10 Freeway to Camelback Road• Western Canal Multi-Use Path: 4th Avenue to 24th Street• 51st Avenue to 43rd Avenue and Carefree Highway to SR 303
171
WastewaterThe Wastewater program totals $1,626.8 million and is funded by Wastewater, Wastewater Bond, Impact Fee and Other Cities’ Share in Joint Venture funds.
Avenue and 23rd Avenue wastewater treatment plants, Cave Creek Water Reclamation Plant, multi-city and Phoenix sewer line systems, lift stations, support facilities and other related initiatives.
issue, the result of a study, a condition assessment, age of equipment or infrastructure, new technology, growth, increased number of pipe breaks, developer requests, City Council requests, and neighborhood requests. Once it has been determined a project has merit, staff submit a project request form and the proposed project is included in the department’s annual Project Charter Process. The department’s deputy directors of water and wastewater engineering then determine optimal timing, the approach for lowest cost, and coordinate with the affected operational division. All current and new CIP projects are presented to department executive staff and prioritized based on factors including risk of failure, criticality, timing and funding availability. Staff recommendations are reviewed by the Water and Wastewater rates and advisory citizens’ committee, and then by the City Council’s Transportation, Infrastructure and Innovation Subcommittee.
incorporated in the City’s Infrastructure Financing Plan, which is reviewed by a citizens’ committee prior to public hearings and ultimate adoption by the City Council.
projects in the proposed capital improvement plan include:
• Land acquisition, design and construction for the SROG Interceptor
• Rehabilitation of 91st Avenue Wastewater Treatment Plant
• Cave Creek Water Reclamation Plant equipment and systems rehabilitation
Water
The Water program totals $1,739.1 million and is funded by Water, Wastewater, Solid Waste, Water Bond, Impact Fee and Other Cities’ Share in Joint Venture funds.
Valley, Union Hills and Val Vista water treatment plants, water storage facilities, wells, pressure reducing valve stations, booster pump stations, water and transmission mains, support facilities and other water related initiatives. Investments in power redundancy and water resiliency programs ensure stable water delivery for customers.
issue, the result of a study, a condition assessment, age of equipment or infrastructure, new technology, growth, increased number of pipe breaks, developer requests, City Council requests, and neighborhood requests. Once it has been determined a project has merit, staff submit a project request form and the proposed project is included in the department’s annual Project Charter Process. The department’s deputy directors of water and wastewater engineering then determine optimal timing, the approach for lowest cost, and coordinate with the affected operational division. All current and new CIP projects are presented to department executive staff and prioritized based on factors including risk of failure, criticality, timing and funding availability. Staff recommendations are reviewed by the Water and Wastewater rates and advisory citizens’ committee, and then by the City Council’s Transportation, Infrastructure and Innovation Subcommittee.
incorporated in the City’s Infrastructure Financing Plan, which is reviewed by a citizens’ committee prior to public hearings and ultimate adoption by the City Council.

172

173

174

175
Federal, State andOther Participation
$118,761,000
Solid WasteRemediation$1,465,000
DevelopmentServices
$4,451,000
CapitalConstruction$20,380,000
Other Bonds$40,590,000
2021-22 Capital Improvement Program$2,180,453,000
Capital Grants$189,542,000
Bond Funds$529,057,000
2006 G.O.Various Purpose
$4,370,000
2001 G.O. Various Purpose
$902,000Capital Reserves
$15,151,000General
$24,052,000Library
$955,000
Other Capital Funds$628,509,000
Operating Funds$1,022,887,000
Aviation Bonds$92,487,000
Solid Waste Bonds$19,145,000
CommunityReinvestment$7,734,000
Arizona HighwayUser Revenue$85,482,000
CustomerFacility Charges$20,558,000
Other Capital$835,000
Other Cities' Sharein Joint Ventures
$34,721,000
Impact Fees$166,111,000
PassengerFacility Charge$81,365,000
Grants$125,058,000
Wastewater Bonds$112,016,000
Transportation2050
$308,724,000
Wastewater$71,659,000
PhoenixConvention Center
$15,480,000
Parks and Preserves$66,212,000
Aviation$126,993,000
Sports Facilities$2,393,000
Other Restricted$12,718,000
Regional Transit$13,961,000
Solid WasteRemediation$11,278,000
Transportation2050 Bonds
$39,898,000
Water Bonds$219,648,000
Water$125,355,000
2021-22 CAPITAL IMPROVEMENT PROGRAMORGANIZATIONAL CHART
176

customer service centers needed to deliver services to our residents. Capital improvements also include investment in infrastructure, commercial and neighborhood development, redevelopment and revitalization. Since these types of capital projects are assets with a multi-year life, issuing bonded debt is an appropriate way to pay for these expenses. It allows the initial costs to be repaid over the years the investment is used. The service delivery costs and day-to-day operating expenses such as staff salaries or supplies are not capital assets. These costs are not funded with bonded debt and must be paid from the City's annual operating funds.
New Facilities Funding and Their Operating Costs
In accordance with Bond Committee recommendations and property tax policy adopted by the City Council in December 2011, the primary property tax levy is maximized to ensure its stability as a source of General Fund revenue and to help pay for operation and maintenance of capital facilities. On March 14, 2006, Phoenix voters approved an $878.5 million bond program. Estimated General Fund expenditures to operate bond- funded projects are updated annually. For enterprise fund operations, multi-year rate planning processes are used to provide the City Council with the effects new capital facilities will have on future rate-payers. Each year, the City Council considers the impact of future capital facilities as it sets annual utility rates.
Identifying Operating Costs
Each fall, departments are asked to review all capital projects, their estimated completion dates, any costs associated with operating new facilities, and the funding source(s) for these costs. These costs are reviewed by the Budget and Research Department. The 2021-22 budget includes $2,430,000 in new operating and maintenance costs for new facilities. The schedule on the next page provides project operating and maintenance costs for 2021-22, the full year operating and maintenance costs for 2022-23, and the operating funds to be used for these costs.
177
OPERATING COSTS FOR NEW CAPITAL FACILITIES
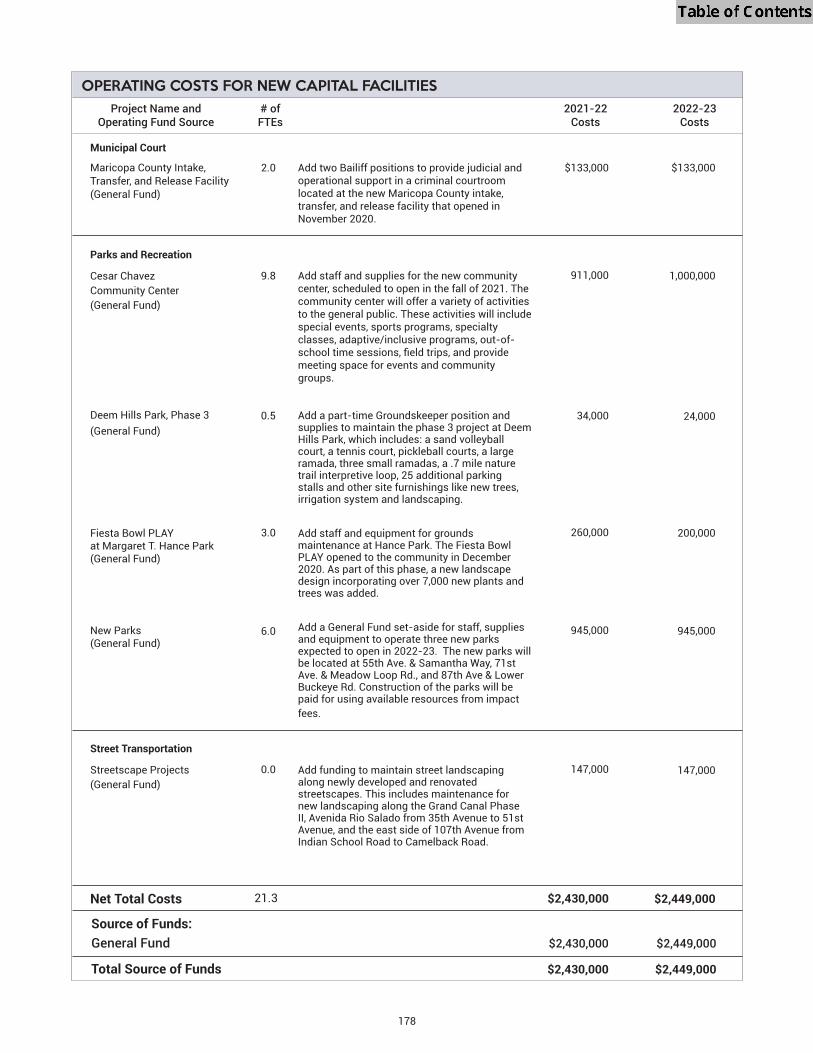
178
OPERATING COSTS FOR NEW CAPITAL FACILITIES Project Name and # of 2021-22 2022-23 Operating Fund Source FTEs Costs Costs
Municipal Court
Maricopa County Intake, Transfer, and Release Facility (General Fund)
Parks and Recreation
Cesar Chavez Community Center(General Fund)
Deem Hills Park, Phase 3(General Fund)
Fiesta Bowl PLAY at Margaret T. Hance Park(General Fund)
New Parks(General Fund)
Street Transportation
Streetscape Projects (General Fund)
Net Total Costs
Add two Bailiff positions to provide judicial and operational support in a criminal courtroom located at the new Maricopa County intake, transfer, and release facility that opened in November 2020.
Add staff and supplies for the new community center, scheduled to open in the fall of 2021. The community center will offer a variety of activities to the general public. These activities will include special events, sports programs, specialty classes, adaptive/inclusive programs, out-of-
meeting space for events and community groups.
Add a part-time Groundskeeper position and supplies to maintain the phase 3 project at Deem Hills Park, which includes: a sand volleyball court, a tennis court, pickleball courts, a large ramada, three small ramadas, a .7 mile nature trail interpretive loop, 25 additional parking stalls and other site furnishings like new trees, irrigation system and landscaping.
Add staff and equipment for grounds maintenance at Hance Park. The Fiesta Bowl PLAY opened to the community in December 2020. As part of this phase, a new landscape design incorporating over 7,000 new plants and trees was added.
Add a General Fund set-aside for staff, supplies and equipment to operate three new parks expected to open in 2022-23. The new parks will be located at 55th Ave. & Samantha Way, 71st Ave. & Meadow Loop Rd., and 87th Ave & Lower Buckeye Rd. Construction of the parks will be paid for using available resources from impact fees.
Add funding to maintain street landscaping along newly developed and renovated streetscapes. This includes maintenance for new landscaping along the Grand Canal Phase II, Avenida Rio Salado from 35th Avenue to 51st Avenue, and the east side of 107th Avenue from Indian School Road to Camelback Road.
$133,000
911,000
34,000
260,000
945,000
147,000
$2,430,000
2.0
9.8
0.5
3.0
6.0
0.0
21.3
$133,000
1,000,000
24,000
200,000
945,000
147,000
$2,449,000
Source of Funds:
General Fund $2,430,000 $2,449,000
Total Source of Funds $2,430,000 $2,449,000

179
SUMMARYSCHEDULES

180
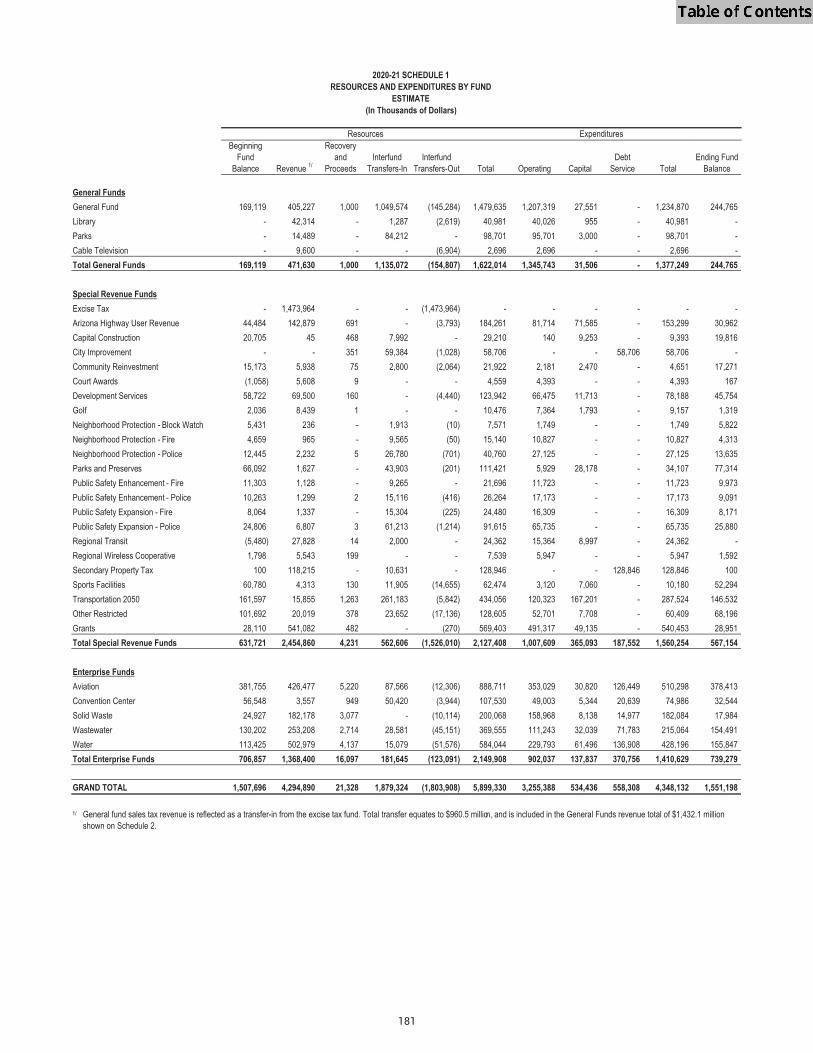
181

182
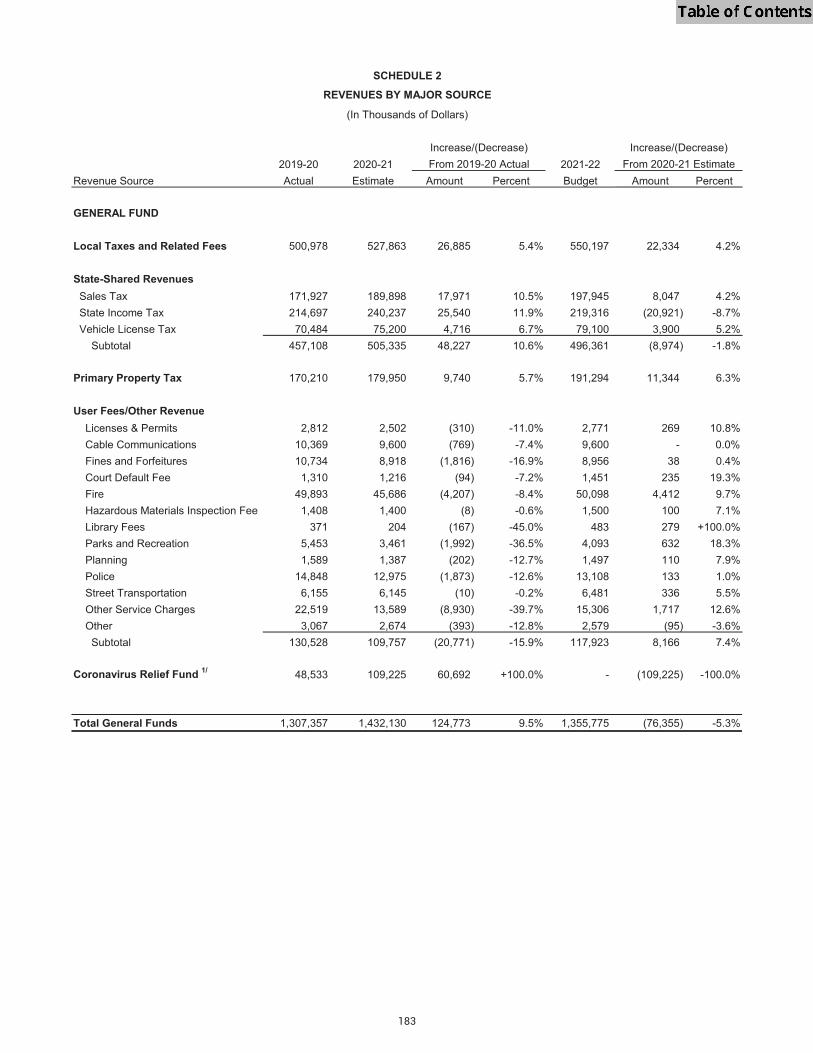
183

184

185
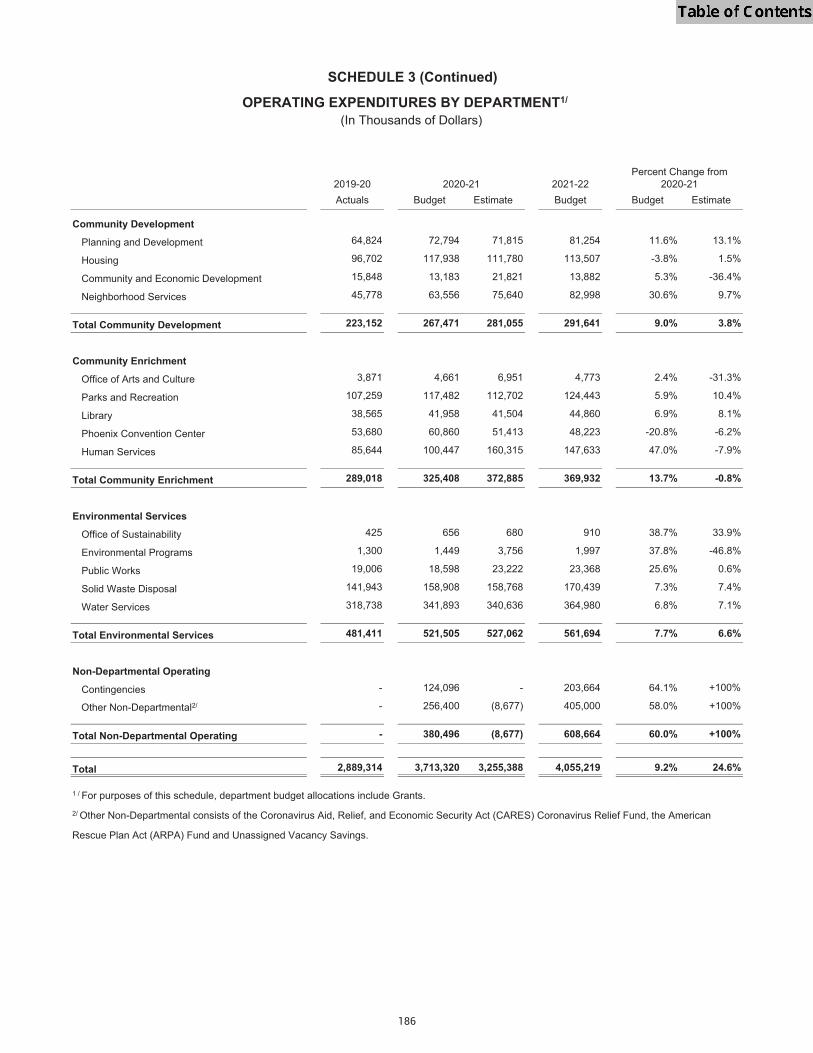
186

187

188

189

190

191

192
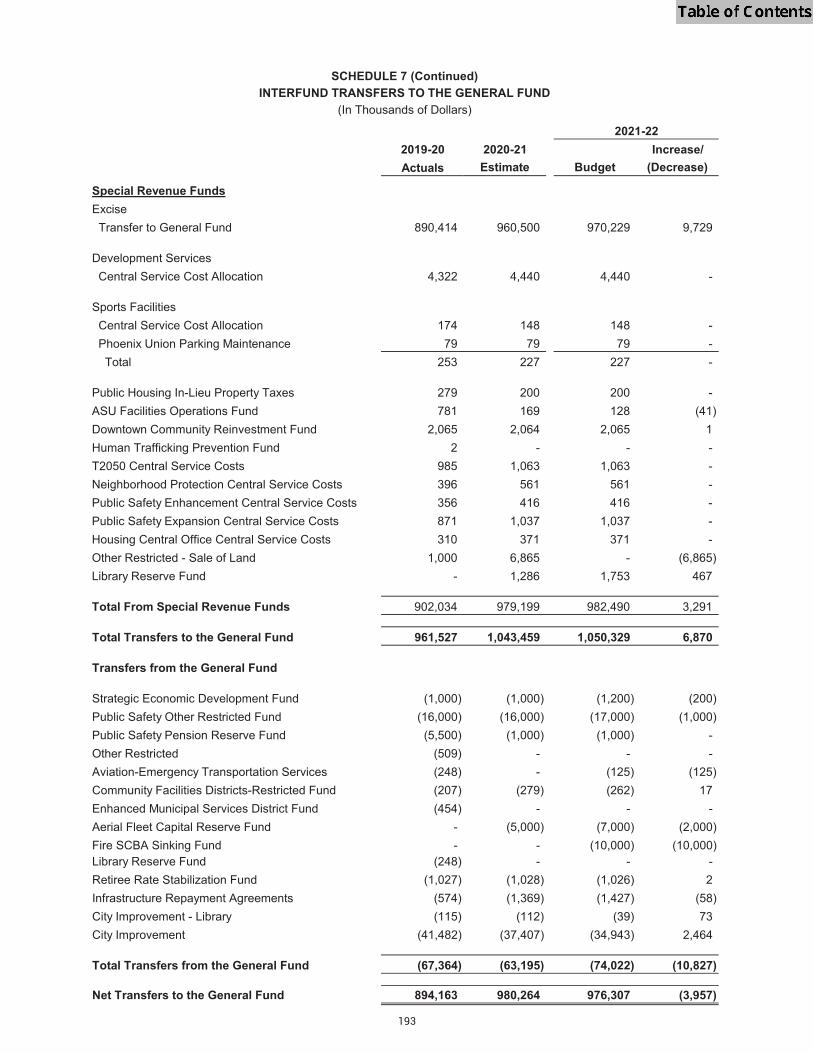
193

194

195

196

197
GLOSSARY

Accrual Basis AccountingThe most commonly used accounting method, which reports income when earned and expenses when incurred, as opposed to cash basis accounting, which reports income when received and expenses when paid. For the City's Annual
Accounting Principles (GAAP) recognizes grant revenues on an accrual basis.
Annual Comprehensive Financial Report (ACFR)
balances.
Appropriation
appropriation ordinances. Three appropriation ordinances are adopted each year: 1) the operating funds ordinance, 2) the capital funds ordinance, and 3) the re-appropriated funds ordinance.
Arizona Highway User Revenue (AHUR)Various gas tax and vehicle licensing fees imposed and collected by the state and shared with cities and towns. This revenue must be used for street or highway purposes.
ARPAAmerican Rescue Plan Act (ARPA) signed into law to provide additional relief to address the continued impact of the COVID-19 pandemic on the economy, public health, state and local governments, individuals, and businesses.
Asset BettermentAn addition or change to a Capital Asset intended to prolong the life of the asset beyond its original design life, or to
prescribed or routine maintenance.
Audit
auditor in pursuance of that appointment and in compliance with generally accepted accounting principles.
Balanced BudgetArizona law (Title 42 Arizona Revised Statutes) and the City of Phoenix Charter (chapter XVIII) require the City Council to
property tax levy, when added together with all other available resources, must equal these expenditures.” Therefore, no
included in the budget each year. The charter further requires that “the total of proposed expenditures shall not exceed the total of estimated income and fund balances.”
Base BudgetFunding for ongoing expenditures for personnel, commodities, contractual services and replacement of existing equipment previously authorized. The base budget provides funding to continue previously authorized services and programs.
Block Watch FundThis fund is the Block Watch portion of the Neighborhood Protection Fund. This fund is a portion of a voter-approved 0.1 percent sales tax increase approved in October 1993. Grant funds are awarded to communities for innovative methods to deter crime-related problems in their neighborhoods. The City disburses these funds through an annual application process.
Bonds
at a stated rate or according to a formula for determining the interest rate.
Bond RatingAn evaluation of a bond issuer's credit quality and perceived ability to pay the principal and interest on time and in full. Three agencies regularly review city bonds and generate bond ratings - Moody's Investors Service, Fitch Ratings and Standard & Poor's Ratings Group.
Budget
198

Capital Asset (Outlay)
Capital ExpendituresExpenditures in the Capital Improvement Program.
Capital FundsResources such as bond issuance proceeds that are restricted to expenditures for Capital Assets.
Capital Funds Budget
Funds.
Capital Improvement Program (CIP)
Projects, and any expenditure of capital funds, are budgeted and recorded in the Capital Improvement Program. Additionally, direct costs of multi-year comprehensive infrastructure studies that are intended to expansively identify or prioritize Capital
Improvement Program.
Capital Project
Betterment for the City or its partner agency with a useful life of at least 5 years, and that involves acquisition, construction or improvement of land rights, buildings, infrastructure (including IT infrastructure) or major enterprise technology.
CARES ActCoronavirus Aid, Relief, and Economic Security (CARES) Act signed into law to address the economic fallout resulting from the COVID-19 pandemic in the United States.
Carryover
CDBGSee Community Development Block Grant.
Central Service Cost Allocation
CIPSee Capital Improvement Program.
City Manager’s BudgetSee Preliminary Budget.
City of Phoenix Employees’ Retirement System (COPERS)A pension plan for full-time employees who retire from service with the City of Phoenix.
Civic Improvement Corporation (CIC)
secured by enterprise fund revenues or excise tax pledges.
Commodities
nature.
Community Development Block Grant (CDBG)Grant funds allocated by the federal government to the City of Phoenix to use for the prevention and removal of slum and
Contingency
mandate, unanticipated one time expenses and similar eventualities.
199
Contractual Services
CoronavirusA large family of viruses which may cause illness in animals or humans.
Coronavirus Relief Fund (CRF)The CARES Act established the Coronavirus Relief Fund (the “Fund”) and appropriated $150 billion to the Fund. Under the
Act provides that payments from the Fund may only be used to cover costs for necessary expenditures incurred due to the public health emergency with respect to COVID–19, were not accounted for in the budget most recently approved as of March 27, 2020 (the date of enactment of the CARES Act) for the State or government and were incurred during the period that begins on March 1, 2020, and ends on December 30, 2020.
CostThe amount of funding required to pay for a given program or service.
Council-Manager Form of GovernmentAn organizational structure in which the Mayor and City Council appoint an independent city manager to be the chief
Court Awards Fund
funds are used for additional law enforcement activities in the Police and Law departments.
COVID-19An illness caused by a novel coronavirus now called severe acute respiratory syndrome coronavirus 2 (SARS-CoV-2). The illness was termed COVID-19 by the World Health Organization (WHO), the acronym derived from "coronavirus disease 2019”.
COVID-19 PandemicOn March 11, 2020 the Novel Coronavirus Disease, COVID-19, was declared a global pandemic by the World Health Organization (WHO).
Cycle Time
Debt ServicePayment of principal and interest on an obligation resulting from the issuance of bonds.
DepreciationThe decline in the value of an asset due to general wear and tear or obsolescence.
DBEDisadvantaged Business Enterprise.
Encumbrance
budget basis of accounting considers an encumbrance to be the equivalent of an expenditure.
Enterprise FundsFunds that are accounted for in a manner similar to a private business. Enterprise funds usually recover their costs (including depreciation) through user fees. The City has four such self-supporting funds: Aviation, Water, Wastewater, and Solid Waste. In addition, the Phoenix Convention Center Fund, which is primarily supported by earmarked excise taxes, uses enterprise fund accounting to provide for the periodic determination of net income.
EstimateThe most recent prediction of current year revenue and expenditures. Estimates are based upon several months of actual expenditure and revenue information and are prepared to consider the impact of unanticipated costs or other economic changes.
Excise Tax FundThis fund is used to account for tax revenues ultimately pledged to pay principal and interest on various debt obligations. This fund includes local sales taxes, state-shared sales taxes, state-shared income taxes and sales tax license fees.
200

ExpendituresRefers to current cash operating expenses and encumbrances.
Expenditure LimitSee State Expenditure Limit.
Fiduciary FundsFunds used to account for assets held by the City of Phoenix as a trustee or agent. These funds cannot be used to support the City’s own programs.
Fiscal Year
FTESee Full-Time Equivalent Position.
Full-Time Equivalent Position (FTE)A position converted to the decimal equivalent of a full-time position based on 2,080 hours per year. For example, a part-time clerk working for 20 hours per week would be equivalent to one half of a full-time position or 0.5 FTE.
Fund
activities or objectives. For budgetary purposes, funds are categorized as General, Special Revenue, Enterprise, or Capital.
Fund BalanceAs used in the budget, the excess of resources over expenditures. The beginning fund balance is the residual funds brought
GAAPSee Generally Accepted Accounting Principles.
General Obligation Bonds (G.O. Bonds)
improvements. The bonds are backed by the “full faith and credit” of the issuing government.
General Funds
Generally Accepted Accounting Principles (GAAP)
statements. The City's Annual Comprehensive Financial Report outlines adjustments needed to convert Phoenix's budget basis of accounting to a GAAP basis.
GFOA
GoalA statement of broad direction, purpose or intent based on the needs of the community. A goal is general and timeless; that
G. O. BondsSee General Obligation Bonds.
GrantA contribution by one government unit or funding source to another. The contribution is usually made to aid in the support of
HUDU.S. Department of Housing and Urban Development.
InfrastructureFacilities that support the daily life and growth of the city, for example, roads, water lines, sewers, public buildings, parks and airports.
201

Impact FeesFees adopted by the City Council in 1987 requiring new development in the city's outlying planning areas to pay its proportional share of the costs associated with providing necessary public infrastructure.
Improvement DistrictsSpecial assessment districts formed by property owners who desire and are willing to pay for mutually enjoyed improvements such as streets, sidewalks, sewers and lighting.
In Lieu Property Taxes (or In Lieu Taxes)An amount charged to certain city enterprise and federally funded operations that equal the city property taxes that would be
and Public Housing funds.
Levy See Tax Levy.
MandateLegislation passed by the state or federal government requiring action or provision of services and/or programs. Examples include the Americans with Disabilities Act, which requires actions such as physical facility improvements and provision of specialized transportation services.
M/W/SBEMinority, Women and Small Business Enterprise.
Method under which revenues are recognized in the period they become available and measurable, and expenditures are recognized in the period the associated liability is incurred. Most government accounting follows this method.
Neighborhood Protection FundThis fund, also referred to as Proposition 301, is used to account for the funds generated by the 0.1 percent increase in the
programs. The breakdown of funding is as follows: Police 70 percent, Fire 25 percent and Block Watch 5 percent.
Net Direct Debt RatioThe ratio between property tax-supported debt service and secondary-assessed valuation. The Net Direct Debt Ratio is one way to gauge the ability of a local property tax base to support general obligation debt service.
Non-Recurring CostA one-time cost, which is not expected to be required on an ongoing basis.
ObjectiveDesired output-oriented accomplishments that can be measured and achieved within a given time frame, and advance the activity and organization toward a corresponding goal.
Operating Funds
capital projects.
OrdinanceA formal legislative enactment by the City Council. If it is not in conflict with any higher form of law, such as a state statute or constitutional provision, it has the full force and effect of law within the boundaries of the city.
Outstanding BondsBonds not yet retired through principal and interest payments.
Parks and Preserves FundThis fund is used to account for the funds generated by the 0.1 percent increase in the sales tax approved by voters in 1999 and reauthorized in 2008. The funds are to be used for the purchase of state trust lands for the Sonoran Desert Preserve Open Space, and the development of regional and neighborhood parks to enhance community safety and recreation.
Pay-As-You-Go Capital ProjectsCapital projects whose funding comes from day-to-day city operating revenue sources.
202

Percent-for-ArtAn ordinance that allocates up to one percent of the City's capital improvement budget to fund public art projects.
Performance Measure
Personal Services
and clerks. It does not include fees for professional or other services.
Plan Six Agreements
unappropriated water, controlling floods, improving the safety of existing dams, and providing new and improved recreational facilities.
PLT See Privilege License Tax.
PolicyA set of plans, directions, or guidelines, which dictate City business. Policies may be directly approved and set by City Council, or they may refer to internal City policies set by the City Manager.
Preliminary BudgetA balanced budget presented to the City Council by the City Manager (sometimes referred to as the City Manager's Budget) based upon an earlier Trial Budget, City Council and community feedback and/or changing economic forecasts. Any City
Primary Property TaxA tax levy that can be used to support any public expense.
PriorityIn relation to City projects, goals, or services, something that takes precedence or suggests particular importance.
Privilege License Tax (PLT)The City of Phoenix's local sales tax, made up of more than 14 general categories.
Privilege License Tax FeesIncludes fees charged for Privilege License Tax (PLT) licenses and the annual fee per apartment unit on the rental of non-
allows the licensee the privilege to conduct taxable business activities and to collect and remit those taxes.
ProgramA group of related activities performed by one or more organizational units.
Property TaxA levy upon each $100 of assessed valuation of property within the City of Phoenix. Arizona has two types of property taxes. Primary property taxes support the City's General Fund and secondary property taxes pay general obligation debt.
Proposition 1See Public Safety Expansion Fund.
Proposition 301See Neighborhood Protection Fund.
Public Safety Enhancement FundsThe Public Safety Enhancement funds are used to account for a 2.0 percent increment of the 2.7 percent sales tax on utilities with franchise agreements. The Police Public Safety Enhancement Fund is dedicated to Police and Emergency Management needs and receives 62 percent of the revenues generated. The Fire Public Safety Enhancement Fund is dedicated to Fire needs and receives 38 percent of the revenues generated.
203

Public Safety Expansion FundsThis fund is used to account for the 0.2 percent increase in sales tax approved by Phoenix voters in 2007. The funds will be
revenues and the Fire Department receives 20 percent.
Reappropriated Funds
RecoveriesCanceled prior year encumbrances.
Recurring CostA cost incurred on an ongoing basis.
Regional Wireless Cooperative (RWC)An independent, multi-jurisdictional organization that manages and operates a regional radio communications network
around Central Arizona’s Valley of the Sun.
RPTARegional Public Transportation Authority.
ResourcesTotal amounts available for appropriation including estimated revenues, recoveries, fund transfers and beginning fund balances.
Restricted FundsSee Special Revenue Fund.
Salary SavingsBudget savings realized through employee turnover or vacant positions.
Secondary Property TaxA tax levy restricted to the payment of debt service on bonded debt.
Self-InsuranceSelf-funding of insurance losses. With the exception of airport operations, police aircraft operations, and excess general and automobile liability for losses in excess of $7.5 million, the City is self-insured for general and automobile liability exposures.
ServiceA public good provided to residents.
Service LevelThe amount or scope of a given service.
Special Revenue Fund
expenditures. Examples include Arizona Highway User Revenue (AHUR) funds, which must be used for street and highway purposes, and secondary property tax, which is restricted to general-bonded debt obligations.
Sports Facilities FundA special revenue fund established to account for revenue raised from a designated portion of the hotel/motel tax and tax on short-term motor vehicle rentals. These funds pay the City's portion of the debt service and other expenditures related to the downtown sports arena.
State Expenditure LimitA limitation on annual expenditures imposed by the Arizona Constitution as approved by the voters in 1980. The limitation is based upon a city's actual 1979-80 expenditures adjusted for interim growth in population and inflation. Certain expenditures may be exempt by the State Constitution or by voter action.
State-Shared RevenuesRevenues levied and collected by the state but shared with local governments as determined by state government each year. In Arizona, a portion of the state's sales, income and vehicle license tax revenues are distributed on the basis of a city's relative population percentage.
204

Strategic PlanA set of steps and strategies which help to achieve goals and realize an overarching vision. The City’s Strategic Plan helps
StrategyAn informed and carefully constructed plan for meeting a goal.
Structurally Balanced BudgetA budget in which proposed ongoing expenditures are matched by available ongoing resources. By State law and City Charter, the City must propose a structurally balanced budget each year.
SupplementalResources to provide new or enhanced programs or services over the base budget allocation.
Tax Levy
Technical ReviewA detailed line-item review of each City department's budget conducted by the Budget and Research Department.
Transit 2000 FundThis fund was used to account for the 0.4 percent sales tax dedicated to transit that was approved by voters on March 14, 2000. Fare box collections were also included in this fund. This fund is being replaced by the Transportation 2050 Fund.
Transportation 2050 FundThese funds are used to account for the revenues generated by the 0.7 percent sales tax approved by voters in August 2015, with a January 1, 2016 effective date. This tax supersedes the 0.4 percent sales tax approved by voters in March 2000, which was accounted for in the Transit 2000 Fund. These funds are to be used for a comprehensive transportation plan, including public transit and street improvements. The Public Transit Department is allocated 86.2 percent of the sales tax, with the remaining 13.8 percent being allocated to the Streets Department. Fare box collections are also included in the Transportation 2050 Transit Fund.
Trial BudgetA budget developed in early spring that presents a proposed balanced budget for discussion by the City Council and the community before the City Manager submits the Preliminary Budget in late spring.
User Fees or User Charges
Zero Base BudgetingA process whereby a budget is developed at the program level, and starting from zero the next year’s budget is estimated assuming only those costs necessary to provide the currently approved level of service. This initial estimate is referred to as
budget also is provided on a program basis.
205

Amber Williamson

Setting a path forward for a sustainable Phoenix