BUDGET-BUSTERS: The shift to high-priced...
18
BUDGET-BUSTERS: The shift to high-priced innovator drugs in the USA
-
Upload
trinhthuan -
Category
Documents
-
view
215 -
download
1
Transcript of BUDGET-BUSTERS: The shift to high-priced...
BUDGET-BUSTERS:The shift to high-priced innovator drugs in the USA

EvaluatePharma®’s USA Sales, Volume and Pricing Intelligence
A clear picture of drug pricing in key markets, trends and competitor pricing is essential to our clients in the Pharma and Biotech sector. We have heard from many of our clients that too much of their time is currently spent on data collation and not enough time on market analysis and strategic decision-making. They require an efficient way to analyse what is driving USA sales.
At Evaluate, our aim is to bring transparency to pricing and we focused our efforts initially on the largest and most influential market, the USA. Our team of experienced analysts started the development of an integrated, single source for USA sales, volume and pricing information. We defined a methodology to provide insights into the annual cost per patient for the top selling drugs as well as number of patients treated. The analysis combines USA government data sources and is fully transparent as to the specific sources and the methodology of our calculations. A comprehensive methodology document is available to all Evaluate’s subscribers.
The clients we collaborated with to develop the pricing insights told us that they particularly valued:
� A more efficient way to conduct pricing analysis
� Transparency as to sources used to triangulate the analysis
� Ability to calculate annual cost and volume per patient
� Credible insights into competitor’s sales dynamics
� Insights with regard to rebates and discounts
� Retail level drug prices
Key features of this new intelligence include:
� A single, trusted source for USA Sales, Volume and Pricing intelligence
� Comprehensive prescription drug pricing in the USA
- Includes primary care medications, injectable biotechnology products and vaccines
- Sources: Retail Rx unit / pack prices (Medicaid), J-Code, NADAC, Federal Contract
� Exclusive cost per patient and number of patients treated calculations for top-selling USA Drugs including
Orphan Drugs
� Transparency to Off-invoice Discounts (Payer / Wholesale rebates)
� Complete commercial context through EvaluatePharma® content integration
� Commentary and analysis from the EP Vantage editorial team
To find out more about USA Sales, Volume and Pricing, future pricing developments and Evaluate’s full range of services contact us:
Disclaimer
All intellectual property rights in this report remain that of Evaluate Ltd and/or its respective third party licensors. Whilst all reasonable steps have been taken to ensure that the data presented are accurate, Evaluate Ltd cannot accept responsibility for errors or omissions. Neither does Evaluate Ltd warrant the accuracy, merchantability or fitness for a particular purpose of the data. Nothing in the reports shall constitute investment, financial or legal advice and the contents of the reports are provided for information purposes only. The data is not intended to amount to advice and should not be used as a determining factor in any investment decision. This report may not be lent, resold, hired out or otherwise disposed of by way of trade in any form of binding or cover other than that in which it is published, without the prior written consent of Evaluate Ltd. Copyright © 2014 Evaluate Ltd. All rights reserved.
� North America: Debbie Paul Tel: +1 617 573 9453 Email: [email protected]
� Rest of the World: Will Hau Tel: +44 (0)20 7377 0800 Email: [email protected]
� Japan: Hiroshi Yamazaki Tel: + 81 (0) 80 1164 4754 Email: [email protected]
� For general questions: Christine Lindgren Tel: +1 617 866 3906 Email: [email protected]
Co
pyr
igh
t ©
201
4 Ev
alu
ate
Ltd
. All
rig
hts
res
erve
d.
September 2014Welcome
2

EvaluatePharma® Foreword:
Move to Higher Priced Drugs Within the Top 100 Selling Drugs in the USA
Over the last five years a fundamental shift in spending trends towards high-priced medicines, which treat substantially smaller patient populations, has been underway in the US market. Based on an analysis of the Top 100 selling drugs in the USA we have found that:
� The median revenue per patient of the Top 100 drugs has increased from $1,260 in 2010
to $9,400 in 2014, representing an seven-fold increase (see page: 7).
� The median patient population size served by a Top 100 drug in 2014 is 146,000, down from
690,000 in 2010.
� There are now seven treatments priced in excess of $100,000 per patient per year in 2014,
versus four in 2010.
(In this report the Top 100 drugs are based on net manufacturing sales disclosed by companies and we define a drug selling
for greater than the median price (>$10,000) of the Top 100 as high-priced.)
Why the Shift?
The changes in spending are complex, but we have identified a number of factors that could have contributed to the increase in launch prices and drug price inflation, including:
� Successful R&D innovation
� Drug pricing models that impact launch price
� Advancing patient outcome
� Removing costs from healthcare
� Improving patient economic productivity
� Private and public ability to pay
An example of these factors in action is Sovaldi, the first of the so called ‘budget-busting’ drugs. The hepatitis C treatment’s $84,000 list price has been defended because it offers a step-change advance in patient outcomes, removes costs from healthcare and improves patient economic productivity.
The US system of free market pricing also allows a correlation between higher drug prices and new treatments which offer real innovation over current treatments. Thus, Sovaldi was able to charge more than Incivek (Vertex) and Victrelis (Merck), the first advancements in hepatitis C treatment, whose commercial edge lasted for only two and a half years.
The report also considers other factors that might be influencing drug pricing and changes in patient population size, these are explored below.
Shift in Focus - Tax and Regulatory System Biased Towards Orphan Drug/Smaller Patient Population Drugs
Over the past 15 years FDA requirements for the approval of new drugs have become more stringent, particularly for primary care products. This has pushed up primary care clinical trial sizes and R&D costs. In addition, the unintended extended patent life/softer patent erosion available to biologicals and the tax advantages of the Orphan Drug Act have skewed the R&D incentives towards investment in non-primary care diseases with smaller patient population sizes. Our report shows that this has increased the number of new product launches of higher-price/small-population drugs.
� In 2010 the number of Top 100 drugs treating 1-100,000 patients was 23. In 2014 the number
had jumped to 41.
� Correspondingly, the number of Top 100 drugs treating 500,000 plus patients had fallen
from 55 to 35.
September 2014C
op
yrig
ht
© 2
014
Eval
uat
e Lt
d. A
ll ri
gh
ts r
eser
ved
.
3

While some of the decline in top selling drugs treating large patient populations may have been due to products such as Lipitor, Plavix and Actos losing patent protection, their places have been taken by biologic drugs, which can command much higher median pricing and have so far enjoyed little or no generic competition (see page 9).
The current lack of biosimilars means that successful biologicals have not only entered the Top 100, but have not dropped out of it, despite some experiencing patent expiry, e.g. Epogen, originally launched in 1989, has yet to experience biosimilar competition.
Drug Price Inflation and Monopoly Pricing
The report also shows that companies have aimed to maximise revenues, not only for new products but for existing ones. We found that 19 drugs in the Top 100 have moved up a price bracket in the last four years (see page: 7). E.g., nine products have gone from costing less than a $1,000 in 2010 to being priced in the $1,000 to $5,000 bracket in 2014.
The US phenomenon of drug price inflation - where prices increase after initial launch - is in direct opposition to Japan where the government reimbursement system reduces the price of successful products which beat initial sales expectations at launch. US drug price inflation could be due to a number of factors:
� Lack of Competition - The biggest brake to the price inflation of a first-to-market drug is the entry of
“me-too” or marginally differentiated products to treat the same disease providing additional competition. In
reviewing the Top 100 selling drugs in 2014 the cohort is biased to successful products, so it is not surprising
certain products move up a price bracket. Even when a “me-too” drug enters the market, the list price of the
first-to-market drug tends not to drop but off-invoice discounts start to occur to private payers.
� Drug Profile – Over the life of a product, a better understanding of the drug’s benefits versus the competition
tends to emerge, which could justify price increases.
� Patient Switching - Companies increasing the price of mature products, knowing that physicians will be
reluctant to switch to less expensive alternatives, when patients are responding well to the drug.
Budget-Busters Versus High-Priced Imitators
We define a budget-busting drug as a drug that offers a step-change in patient outcome and/or removes costs from other parts of the health system, normally in a non-rare disease population size (>200,000 patients in USA). Budget-busters lead to payers having to revisit budget size and allocations to pay for innovative products.
However, it’s important to be aware of high-priced drugs which do not offer a step-change in patient outcomes, and therefore do not justify a high-price. Zaltrap, initially priced highly was judged by the Memorial Sloan Kettering Cancer Center to offer little cost/ benefit over Avastin, the current colorectal cancer treatment. Sanofi responded by halving the US price.
The report also shows that a number of drugs such as Roche’s cancer products, Herceptin and Rituxan, were able to command prices well in excess of the other top 20 biggest selling cancer products in 2014 despite competing products on the market.
Celgene’s Revlimid had the highest price premium within the Top 20 selling cancer drugs, achieving $164,859 per patient and treating an estimated 17,380 patients in 2014 (see page 13).
However, with an increasing number of potential “budget-busters” on the horizon, these prices might not be sustainable as payers could start to get even tougher on new and currently marketed products that are poorly differentiated.
Co
pyr
igh
t ©
201
4 Ev
alu
ate
Ltd
. All
rig
hts
res
erve
d.
Foreword
4
Co
pyr
igh
t ©
201
4 Ev
alu
ate
Ltd
. All
rig
hts
res
erve
d.
Future of High Drug Pricing in Top 100
� The shift to high-priced medicines will increase friction between payers and companies. However, as long
as the economic basis of the high price is sound (namely improved patient outcomes, reduced healthcare costs,
or improved patient economic activity versus current treatments) budget-busters will - for now - get a slice of
the USA market. The losers will be poorly-differentiated products which get dropped from reimbursement
lists. This is how the market should operate and will actively encourage R&D spend to be allocated to
innovative products.
� The biggest concern is that with government drug spend approaching 43% of the USA market by 2017, up
from 24% in 2005, the system lacks enough automatic discounts off the private price, and safeguards against
drug price rises from companies, to be sustainable. This is particularly an issue for Medicare Part B and Part D
programs. The expansion of Medicare (2005+) and Medicaid (2014+) enrolment has incrementally expanded
the USA drug market, so any discounts off private drug prices will act only to moderate growth. Thus the call
for reform will grow stronger.
� The adoption of biosimilars appears crucial to moderate overall pharmaceutical sales growth in both the private
and public sector, but also to free up funds to pay for the innovation of tomorrow.
� Launch prices are likely to be determined more and more by competitive profile of the product rather than R&D
spend. Gilead paid $11.2 billion for Pharmasset because of the future commercial profile of Sovaldi at the time
of acquisition, not because Pharmasset had spent $272 million on R&D to get the compound into late-stage
phase III.
Conclusion
There appears to be little let up on the budgets of both government and private payers in the USA seeking access to innovative drugs.
With the Affordable Care Act (ACA) set to add nine million additional Americans in 2014 to Medicaid budgets and the increasing numbers of Medicare enrolments due to the aging baby-boomer generation, the US government is already forecasting Medicare/Medicaid spend to account for 43% of the entire USA prescription drug market by 2017, up from 24% in 2005.
The government has also raised its forecast for both Medicaid and Medicare prescription drug spend by $10bn to $210.7bn in August 2014, with Sovaldi alone adding over $1bn to the Medicaid drug bill in 2014. While efforts have been made to reduce Medicaid spend on generic drugs (see page 16) the current system looks to be unsustainable.
To rein in costs or justify the prices private payers are expected to pay for innovation, private payers could organise to conduct drug cost/benefit analyses to call out the effectiveness of high-priced drugs. And while the 2003 Medicare Act explicitly stops Medicare from negotiating drug prices, a prohibition that failed to get overturned in the Senate in 2007, the government-run health plan for seniors could put pressure on its health plan providers to negotiate more aggressively.
As such the increasing rumblings of discontent from both government and private payers mean that pharma companies need to be providing real innovation to justify the prices of their products and closely work with the hand that feeds their growth.
Anthony Raeside Head of Research, Evaluate Ltd
Foreword
5

Co
pyr
igh
t ©
201
4 Ev
alu
ate
Ltd
. All
rig
hts
res
erve
d.
Table of Contents
7 Top 100 USA Drugs: Revenue per Patient per Year Analysis 2010 & 2014
8 Top 100 USA Drugs: Number of Patients Treated Analysis 2010 & 2014
9 Top 100 USA Drugs in 2014: Revenue per Patient vs. No. of Patients Treated
10 Top 100 USA Drugs: Revenue per Patient vs. No. of Patients (<100k)
11 Top 100 USA Drugs: Revenue per Patient vs. No. of Patients (100 to 500k)
12 Top 100 USA Drugs: Revenue per Patient vs. No. of Patients (>500k)
13 Top 20 Cancer Drugs in 2014: Revenue per Patient vs. No. of Patients Treated
14 USA Primary Care (MEPS): Proprietary (NDA) vs. Generic (ANDA) 2005-12
15 Top 100 USA Generic Drugs (MEPS): Retail Sales per Patient 2012
16 Medicaid Generic Drugs: Generic Prescription Price Trend 2008 to 2014
6

7
Top 100 USA Drugs: Revenue per Patient per Year Analysis 2010 & 2014
Count of Drugs in USA Top 100 (2010 & 2014) by Revenue per Patient per Year Price Band
Revenue Banding 2010 2014 Chg. 2010 2014
$100,000+ 4 7 +3 4% 7%
$50,000 - $100,000 3 12 +9 3% 12%
$25,000 - $50,000 9 11 +2 9% 11%
$10,000 - $25,000 10 17 +7 10% 17%
$5,000 - $10,000 7 10 +3 7% 10%
$1,000 - $5,000 27 24 -3 27% 24%
$0 - $1,000 40 19 -21 40% 19%100 100 100% 100%
$10,000+ 26 47 26% 47%
$0 - $10,000 74 53 74% 53%
USA Top 100 2010 2014 CAGR (2010-14)
Median Revenue $1,258 $9,396 +65.3%
Average Top 100 $1,433 $1,524 +1.6%
Total USA Sales ($m) 143,340 152,440 +1.6%
2010: USA Top 100 Drugs by Cost Bands 2014: USA Top 100 Drugs by Cost Bands
Median Annual Drug Revenue of Top 100 Drugs Balloons to $9,396 in 2014, from $1,258 in 2010Seven Drugs in Top 100 Cost more than $100,000 per YearEvaluatePharma® finds that the median revenue per patient per year (annual drug cost net of discounts and adjusted for patient compliance) within the top 100 selling products, has increased from $1,258 in 2010 to $9,396 in 2014. The shift to higher cost drugs reflects industry product launches of innovative drugs aimed at smaller patient population sizes (see page 8), high priced biologicals not being impacted by patent competition, but also drug companies increasing prices to maximise revenues. Further analysis reveals that 19 drugs, in both the 2010 & 2014 Top 100 lists, moved up a pricing band. There are now seven drugs in the Top 100 in 2014 which cost in excess of $100,000, up from four drugs in 2010. In 2010, drugs selling for less than $1,000 was the largest component of the Top 100 at 40 (40% of the Top 100); in 2014, that number fell to 19 (19%).
4 3
9 107
27
40
712 11
17
10
24
19
0
5
10
15
20
25
30
35
40
$100,000+ $50,000 -$100,000
$25,000 -$50,000
$10,000 -$25,000
$5,000 - $10,000 $1,000 - $5,000 $0 - $1,000
Coun
t of P
rodu
cts w
ithin
Top
100
Revenue per Patient per year Banding ($)
Count of Drugs in USA Top 100 by Revenue per Patient per Year Price Band in 2014Source: EvaluatePharma® (22 SEP 2014)
2010 2014
$100,000+4%
$50,000 -$100,000
3% $25,000 -$50,000
9%
$10,000 -$25,000
10%
$5,000 -$10,000
7%$1,000 -$5,000
27%
$0 - $1,00040%
$100,000+7% $50,000 -
$100,00012%
$25,000 -$50,000
11%
$10,000 -$25,000
17%$5,000 -$10,000
10%
$1,000 -$5,000
24%
$0 - $1,00019%
2014: Revenue per Patient $100k +Advate $449kSoliris $427kGamunex $172kRevlimid $165kErbitux $140kYervoy $126kAfinitor $107k
Co
pyr
igh
t ©
201
4 Ev
alu
ate
Ltd
. All
rig
hts
res
erve
d.

8
Top 100 USA Drugs: Number of Patients Treated Analysis 2010 & 2014
Count of Drugs in USA Top 100 (2010 & 2014) by Number of Patients Treated per Year Bands
No. of Patients Treated 2010 2014 Chg. 2010 2014
500,000+ 55 35 -20 55% 35%
100,000 to 500,000 22 24 +2 22% 24%
0 to 100,000 23 41 +18 23% 41%100 100 100% 100%
USA Top 100 2010 2014 CAGR (2010-14)
Median No. of Patients Treated 689,604 146,252 -32.1%
Average Top 100 1,733,705 1,266,910 -7.5%
Total No. Treated by Top 100 173,370,517 126,691,003 -7.5%
2010: USA Top 100 Drugs by No. of Patients Treated Bands 2014: USA Top 100 Drugs by No. of Patients Treated
Source: EvaluatePharma® (22 SEP 2014)
USA Top 100 Drugs Shifts to Higher Price, Smaller Patient GroupsEvaluatePharma® finds that the median number of USA patients treated by a Top 100 product, has fallen from 689,604 to 146,252 per drug. The number of drugs within the Top 100 that treat fewer than 100,000 patients annually has increased from 23 (23% of the Top 100) in 2010, to 41 (41%) drugs in 2014. The number of drugs serving groups of over 500,000 patients has decreased from 55 (55%) to35 (35%) in 2014.A number of factors have contributed to this shift to higher-priced, lower patient-population groups: the innovation potential of primary care has somewhat matured; and, companies have switched strategic focus and are increasingly innovating in biologicals, orphan diseases, cancer, and specialist markets. In addition the absence of patent competition on biologicals means established biologicals do not drop off the list.
55
22 23
35
24
41
0
10
20
30
40
50
60
500,000+ 100,000 to 500,000 0 to 100,000
Coun
t of P
rodu
cts W
ithin
Top
100
No. of Patients Treated per Year Bands
Count of Drugs in USA Top 100 by No. of Patients Treated per Year Bands in 2014Source: EvaluatePharma® (22 SEP 2014)
2010 2014
500,000+55%
100,000 to 500,000
22%
0 to 100,000
23%500,000+
35%
100,000 to 500,000
24%
0 to 100,000
41%
Note: Top 100 drugs ranked by EvaluatePharma® consensus USA sales in 2014. Excludes: Generics, OTC, Botox.
Co
pyr
igh
t ©
201
4 Ev
alu
ate
Ltd
. All
rig
hts
res
erve
d.

9
Top 100 USA Drugs in 2014: Revenue per Patient vs. No. of Patients Treated
Top 10 USA Drugs by Sales 2014: Revenue per Patient per Year vs. No. of Patients Treated
USA Sales ($m) No. of Revenue Patient Off-Invoice
Product Company 2014 Patients Per Patient Compliance Discount USA Cost Band
1 Sovaldi Gilead Sciences 10,098 135,182 56,212 -31% $50,000 - $100,000
2 Humira AbbVie 6,078 245,693 24,561 74% $10,000 - $25,000
3 Lantus Sanofi 5,759 4,905,321 1,190 51% -34% $1,000 - $5,000
4 Enbrel Amgen 4,311 223,884 19,585 63% $10,000 - $25,000
5 Remicade Johnson & Johnson 4,154 277,633 14,716 65% $10,000 - $25,000
6 Abilify Otsuka Holdings 3,886 394,344 9,180 28% -27% $5,000 - $10,000
7 Rituxan Roche 3,707 70,347 52,459 $50,000 - $100,000
8 Neulasta Amgen 3,523 277,894 12,679 94% $10,000 - $25,000
9 Seretide/Advair GlaxoSmithKline 3,325 1,850,662 1,938 56% -6% $1,000 - $5,000
10 Avastin Roche 2,928 44,552 66,828 $50,000 - $100,000
Average Top 10 4,777 842,551 25,935
Average Top 100 1,524 1,266,910 31,740
Median Price 979 146,252 9,396
Top 10 USA Drugs by Sales 2010: Revenue per Patient per Year vs. No. of Patients Treated
USA Sales ($m) No. of Revenue Patient Off-Invoice
Product Company 2010 Patients Per Patient Compliance Discount USA Cost Band
1 Plavix Bristol-Myers Squibb 6,154 5,110,004 1,204 66% $1,000 - $5,000
2 Lipitor Pfizer 5,329 4,870,912 1,094 84% -36% $1,000 - $5,000
3 Seretide/Advair GlaxoSmithKline 4,026 3,570,316 1,128 56% -29% $1,000 - $5,000
4 Abilify Otsuka Holdings 3,606 647,918 5,566 28% -20% $5,000 - $10,000
5 Actos Takeda 3,582 1,901,531 1,884 76% -7% $1,000 - $5,000
6 Enbrel Amgen 3,304 209,777 15,750 71% $10,000 - $25,000
7 Singulair Merck & Co 3,219 3,603,517 893 84% -32% $0 - $1,000
8 Seroquel AstraZeneca 3,107 1,651,254 1,882 35% -24% $1,000 - $5,000
9 Remicade Johnson & Johnson 3,099 282,743 10,960 66% $10,000 - $25,000
10 Avastin Roche 3,068 45,273 67,764 $50,000 - $100,000
Average Top 10 3,849 2,189,324 10,813
Average Top 100 1,433 1,733,705 16,013
Median Price 975 689,604 1,258
Source: EvaluatePharma® (22 SEP 2014)
USA Top 100 Drug Cost (Revenue per Patient) is Strongly Correlated to Patient SizeEvaluatePharma® finds the annual revenues per patient of a Top 100 USA drug is strongly correlated (R2 = 0.92) to the number of patients it treats. This surprisingly strong correlation is likely due to the fact that only a subset of patients taking primary care drugs require hospitalization and, in general, such drugs do not offer the same improvement in patient outcomes than drugs used to treat smaller patient population groups. Gilead's Sovaldi is an outlier, with a list price of $84k an estimated revenue per patient of $56k in 2014. The predicted revenue per patient based on the regression is $8,726 for a product treating 135,182 patients. The innovation Sovaldi offers over current treatments (patient outcomes, costs out of healthcare, patients improved economic activity) reflects this price premium. We have analyzed three patient population subgroups over the next three pages.
y = 580,773,061.274791x-0.940023
R² = 0.919463
0
50,000
100,000
150,000
200,000
250,000
300,000
350,000
400,000
450,000
0 500,000 1,000,000 1,500,000 2,000,000 2,500,000 3,000,000 3,500,000 4,000,000 4,500,000 5,000,000
USA
Rev
enue
per
Pat
ient
($)
USA Number of Patients Treated
Top 100 USA Drugs by Sales: Revenue per Patient per Year vs. No. of Patients Treated Source: EvaluatePharma® (22 SEP 2014)
Number of Patients Treated Subgroups Analyzed:
USA Patients Treated: <100,000 Analysed: Page 10USA Patients Treated: 100,000 to 500,000: Page 11USA Patients Treated: >500,000 Page 12
Methodology: We chose to test the correlation of revenues per patient and the number of patients treated in 2014. The Top 100 drugs in USA, by definition, arerelatively successful so the expected commercial drug profile has broadly been met. There are many factors other than target patient population size influencing price.
Note: To enhance the chart visual the x-axis has been limited to 5 million patients (Fluzone is not visible: 44m patients)Fluzone is included in the trendline and R2 calculation.
Sovaldi (GILD)
Co
pyr
igh
t ©
201
4 Ev
alu
ate
Ltd
. All
rig
hts
res
erve
d.

10
Top 100 USA Drugs: Revenue per Patient vs. No. of Patients (<100k)
Top 10 USA Drugs by Sales 2014: USA Revenue per Patient per Year vs. No. of Patients Treated (<100k)
USA Sales ($m) No. of Revenue Patient Off-Invoice
Product Company 2014 Patients Per Patient Compliance Discount USA Cost Band
1 Rituxan Roche 3,707 70,347 52,459 $50,000 - $100,000
2 Avastin Roche 2,928 44,552 66,828 $50,000 - $100,000
3 Revlimid Celgene 2,107 17,380 164,859 $100,000+
4 Copaxone Teva 2,700 52,217 43,877 73% $25,000 - $50,000
5 Herceptin Roche 2,060 28,587 71,513 $50,000 - $100,000
6 Gleevec Novartis 2,023 64,884 31,006 40% -23% $25,000 - $50,000
7 Tecfidera Biogen Idec 1,968 54,735 34,981 $25,000 - $50,000
8 Olysio Johnson & Johnson 1,916 15,560 49,536 -23% $25,000 - $50,000
9 Lucentis Roche 1,904 81,204 24,050 $10,000 - $25,000
10 Avonex Biogen Idec 1,837 31,953 57,125 $50,000 - $100,000
Source: EvaluatePharma® (22 SEP 2014)
Revlimid, Avastin & Rituxan Priced at a PremiumEvaluatePharma® finds that Revlimid (Celgene), Avastin and Rituxan (Roche) are priced at a premium versus other products used to treat fewer than 100,000 patients in the USA. EvaluatePharma® finds that annual revenue per patient of a Top 100 drug treating less than 100,000 patients is moderately correlated to the number of patients treated (R2 = 0.75).
y = 171,870,708.729157x-0.823195
R² = 0.751557
0
50,000
100,000
150,000
200,000
250,000
300,000
350,000
400,000
450,000
500,000
0 10,000 20,000 30,000 40,000 50,000 60,000 70,000 80,000 90,000 100,000
USA
Rev
enue
per
Pat
ient
($)
USA Number of Patients Treated
Top 100 USA Drugs 2014: Revenue per Patient per Year vs. No. of Patients Treated (<100k)Source: EvaluatePharma® (22 SEP 2014)
Avastin (Roche)
Revlimid (CELG)
Price Premium vs. Peers
Soliris (ALXN)
Rituxan (Roche)
Advate (BAX)
Note: Top 100 drugs ranked by EvaluatePharma® consensus USA sales in 2014. Excludes: Generics, OTC, Botox.EvaluatePharma® is currently working on developing patient compliance rates for biological cancer products. The lack of patient compliance percentages means that the revenue per patient will generally be overstated and the number of patients treated understated.
Co
pyr
igh
t ©
201
4 Ev
alu
ate
Ltd
. All
rig
hts
res
erve
d.

11
Top 100 USA Drugs: Revenue per Patient vs. No. of Patients (100 to 500k)
Top 10 USA Drugs by Sales 2014: USA Revenue per Patient per Year vs. No. of Patients Treated (100-500k)
USA Sales ($m) No. of Revenue Patient Off-Invoice
Product Company 2014 Patients Per Patient Compliance Discount USA Cost Band
1 Sovaldi Gilead Sciences 10,098 135,182 56,212 -31% $50,000 - $100,000
2 Humira AbbVie 6,078 245,693 24,561 74% $10,000 - $25,000
3 Enbrel Amgen 4,311 223,884 19,585 63% $10,000 - $25,000
4 Remicade Johnson & Johnson 4,154 277,633 14,716 65% $10,000 - $25,000
5 Abilify Otsuka Holdings 3,886 394,344 9,180 28% -27% $5,000 - $10,000
6 Neulasta Amgen 3,523 277,894 12,679 94% $10,000 - $25,000
7 Atripla Gilead Sciences 2,180 143,056 14,404 81% -26% $10,000 - $25,000
8 Epogen Amgen 1,950 129,971 14,555 $10,000 - $25,000
9 Eylea Regeneron 1,750 112,514 15,662 $10,000 - $25,000
10 Truvada Gilead Sciences 1,560 153,475 9,960 -34% $5,000 - $10,000
Source: EvaluatePharma® (22 SEP 2014)
Sovaldi, Enbrel & Humira at Price PremiumEvaluatePharma® finds that Sovaldi (Gilead), Enbrel (Amgen/ Pfizer) and Humira (AbbVie) are priced at a premium compared to other products used to treat between 100,000 and 500,000 patients in the USA. The annual revenue per patient of the Top 100 drugs treating
between 100,000 and 500,000 patients is poorly correlated to the number of patients treated (R2 = 0.20).
y = 109,478,787.773947x-0.782752
R² = 0.199054
0
10,000
20,000
30,000
40,000
50,000
60,000
100,000 150,000 200,000 250,000 300,000 350,000 400,000 450,000 500,000
USA
Rev
enue
s per
Pat
ient
($)
USA Number of Patients Treated
Top 100 USA Drugs 2014: Revenue per Patient per Year vs. No. of Patients Treated (100-500k)
Source: EvaluatePharma® (22 SEP 2014)
Humira (ABBV)Enbrel (AMGN)
Sovaldi (GILD) Price Premium vs. Peers
Note: Top 100 drugs ranked by EvaluatePharma® consensus USA sales in 2014. Excludes: Generics, OTC, Botox.
Neulasta (AMGN)
Remicade (JNJ)
Co
pyr
igh
t ©
201
4 Ev
alu
ate
Ltd
. All
rig
hts
res
erve
d.

12
Top 100 USA Drugs: Revenue per Patient vs. No. of Patients (>500k)
Top 10 USA Drugs by Sales 2014: USA Revenue per Patient per Year vs. No. of Patients Treated (>500k)
USA Sales ($m) No. of Revenue Patient Off-Invoice
Product Company 2014 Patients Per Patient Compliance Discount USA Cost Band
1 Lantus Sanofi 5,759 4,905,321 1,190 51% -34% $1,000 - $5,000
2 Seretide/Advair GlaxoSmithKline 3,325 1,850,662 1,938 56% -6% $1,000 - $5,000
3 Crestor AstraZeneca 2,894 3,098,491 887 57% -53% $0 - $1,000
4 Spiriva Boehringer Ingelheim 2,473 1,693,829 1,458 36% -39% $1,000 - $5,000
5 Lyrica Pfizer 2,422 1,241,435 1,756 90% -27% $1,000 - $5,000
6 Januvia Merck & Co 2,138 1,040,874 2,031 74% -36% $1,000 - $5,000
7 Prevnar 13 Pfizer 1,986 3,739,698 532 $0 - $1,000
8 NovoRapid Novo Nordisk 1,863 1,624,457 1,192 62% -58% $1,000 - $5,000
9 Celebrex Pfizer 1,672 3,082,429 462 13% -29% $0 - $1,000
10 Humalog Eli Lilly 1,644 2,264,508 723 63% -74% $0 - $1,000
Source: EvaluatePharma® (22 SEP 2014)
Januvia, Advair & Lantus at Price PremiumEvaluatePharma® finds that Januvia (Merck & Co.), Advair (GSK) and Lantus (Sanofi) are priced at a premium to other products that treat more than 500,000 patients in the USA. The annual revenue per patient of the Top 100 drugs, treating between 100,000 and 500,000
patients, is moderately correlated to the number of patients treated (R2 = 0.75).
y = 870,538,116.786405x-0.974941
R² = 0.745858
0
500
1,000
1,500
2,000
2,500
0 500,000 1,000,000 1,500,000 2,000,000 2,500,000 3,000,000 3,500,000 4,000,000 4,500,000 5,000,000
USA
Rev
enue
per
Pat
ient
($)
USA Number of Patients Treated
Top 100 USA Drugs 2014: Revenue per Patient per Year vs. No. of Patients Treated (>500k)Source: EvaluatePharma® (22 SEP 2014)
Advair (GSK)
Lantus (SNY)
Price Premium vs. Peers
Crestor (AZN)
Januvia (MRK)
Note: Top 100 drugs ranked by EvaluatePharma® consensus USA sales in 2014. Excludes: Generics, OTC, Botox.
Co
pyr
igh
t ©
201
4 Ev
alu
ate
Ltd
. All
rig
hts
res
erve
d.
13
Top 20 Cancer Drugs (2014): Revenue per Patient vs. No. of Patients Treated
Top 10 USA Cancer Drugs by Sales: USA Revenue per Patient per Year vs. No. of Patients Treated 2014
Sales ($m) No. of Revenue Patient Off-Invoice
Product Company 2014 Patients Per Patient Compliance Discount USA Cost Band
1 Rituxan Roche 3,707 70,347 52,459 $50,000 - $100,000
2 Avastin Roche 2,928 44,552 66,828 $50,000 - $100,000
3 Revlimid Celgene 2,107 17,380 164,859 $100,000+
4 Herceptin Roche 2,060 28,587 71,513 $50,000 - $100,000
5 Gleevec Novartis 2,023 64,884 31,006 40% -23% $25,000 - $50,000
6 Stelara Johnson & Johnson 1,269 37,327 32,997 78% $25,000 - $50,000
7 Alimta Eli Lilly 1,251 26,674 47,300 $25,000 - $50,000
8 Zytiga Johnson & Johnson 992 35,801 28,212 44% -20% $25,000 - $50,000
9 Velcade Takeda 983 16,097 61,053 $50,000 - $100,000
10 Afinitor Novartis 779 7,253 106,675 -15% $100,000+
Average Top 10 1,810 34,890 66,290
Average Top 20 1,236 24,587 64,266
Source: EvaluatePharma® (22 SEP 2014)
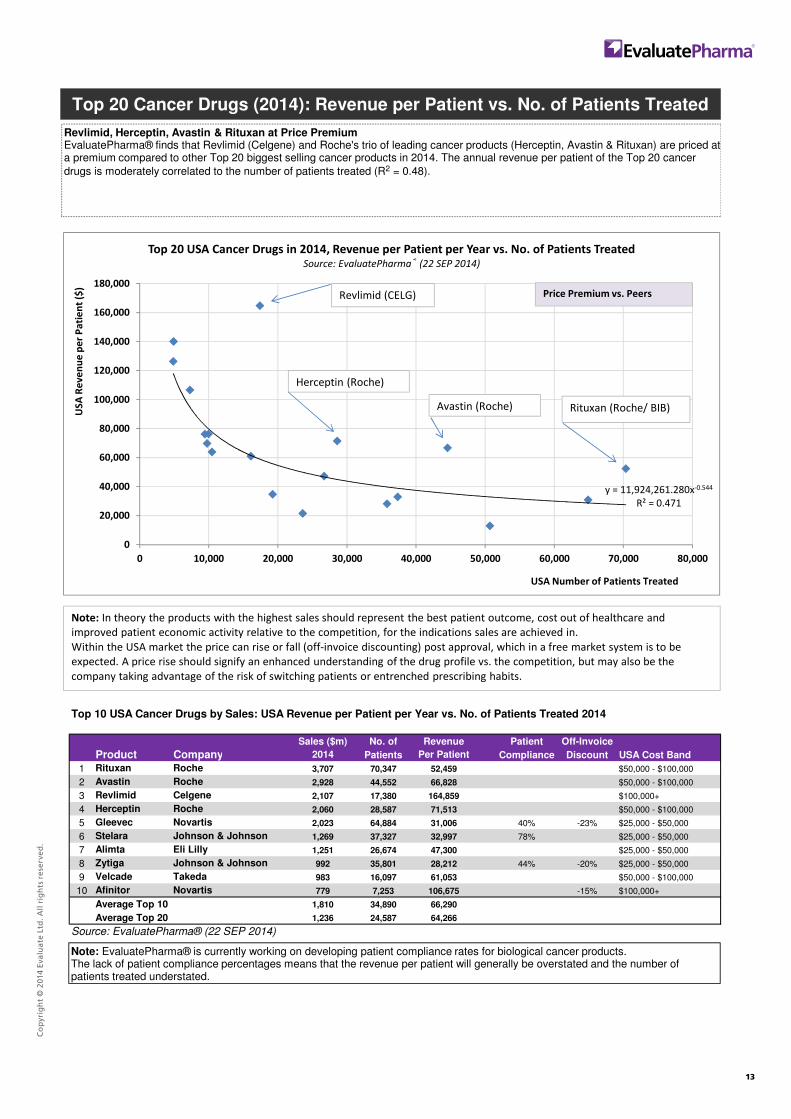
Revlimid, Herceptin, Avastin & Rituxan at Price PremiumEvaluatePharma® finds that Revlimid (Celgene) and Roche's trio of leading cancer products (Herceptin, Avastin & Rituxan) are priced at a premium compared to other Top 20 biggest selling cancer products in 2014. The annual revenue per patient of the Top 20 cancer
drugs is moderately correlated to the number of patients treated (R2 = 0.48).
y = 11,924,261.280x-0.544
R² = 0.471
0
20,000
40,000
60,000
80,000
100,000
120,000
140,000
160,000
180,000
0 10,000 20,000 30,000 40,000 50,000 60,000 70,000 80,000
USA
Rev
enue
per
Pat
ient
($)
USA Number of Patients Treated
Top 20 USA Cancer Drugs in 2014, Revenue per Patient per Year vs. No. of Patients TreatedSource: EvaluatePharma® (22 SEP 2014)
Revlimid (CELG)
Avastin (Roche) Rituxan (Roche/ BIB)
Herceptin (Roche)
Price Premium vs. Peers
Note: In theory the products with the highest sales should represent the best patient outcome, cost out of healthcare and improved patient economic activity relative to the competition, for the indications sales are achieved in. Within the USA market the price can rise or fall (off-invoice discounting) post approval, which in a free market system is to beexpected. A price rise should signify an enhanced understanding of the drug profile vs. the competition, but may also be the company taking advantage of the risk of switching patients or entrenched prescribing habits.
Note: EvaluatePharma® is currently working on developing patient compliance rates for biological cancer products. The lack of patient compliance percentages means that the revenue per patient will generally be overstated and the number of patients treated understated.
Co
pyr
igh
t ©
201
4 Ev
alu
ate
Ltd
. All
rig
hts
res
erve
d.

14
USA Primary Care (MEPS): Proprietary (NDA) vs. Generic (ANDA) 2005-12
USA Primary Care (MEPS) Retail Sales, Rx Volume & Cost per Rx: Proprietary (NDA) vs. Generic (ANDA) 2005-12
NDA ANDA
Year NDA ANDA Total % Chge as a % as a %
USA Retail Sales (MEPS) - $m
2005 143,228 41,222 193,327 77.7% 22.3%
2006 143,168 48,371 197,315 +2% 74.7% 25.3%
2007 167,167 35,847 207,010 +5% 82.3% 17.7%
2008 180,394 42,944 227,622 +10% 80.8% 19.2%
2009 178,822 44,454 234,454 +3% 80.1% 19.9%
2010 190,234 50,054 245,053 +5% 79.2% 20.8%
2011 192,037 52,374 255,852 +4% 78.6% 21.4%
2012 174,843 64,839 251,262 -2% 72.9% 27.1%
USA Prescription Volume (MEPS)
2005 1,616 1,023 2,664 61.2% 38.8%
2006 1,573 1,167 2,748 +3% 57.4% 42.6%
2007 1,445 1,275 2,725 -1% 53.1% 46.9%
2008 1,368 1,504 2,878 +6% 47.6% 52.4%
2009 1,307 1,638 2,951 +3% 44.4% 55.6%
2010 1,133 1,907 3,043 +3% 37.3% 62.7%
2011 1,038 2,040 3,083 +1% 33.7% 66.3%
2012 848 2,120 2,974 -4% 28.6% 71.4%
Average Cost Per Prescription
2005 89 40 73
2006 91 41 72 -1%
2007 116 28 76 +6%
2008 132 29 79 +4% Drug Inflation Analysis (2005-12)
2009 137 27 79 +0% Generic (ANDA) Retail Cost Inflation
2010 168 26 81 +1% -3.9%
2011 185 26 83 +3% Branded (NDA) Retail Cost Inflation
2012 206 31 84 +2% +12.8%
Generics Fill 71% of Primary Care Prescriptions in 2012, versus 39% in 2005EvaluatePharma®, based on analysis of the primary care MEPS survey, finds that generic drugs (ANDAs) filled 71% of prescriptions in 2012, versus 39% in 2005. The estimated average retail cost per prescription was $31 for a generic and $206 for a branded drug (NDA). The average retail cost of a generic prescription fell 4% per year between 2005 and 2012 to $31, whilst the average branded (NDA) drug increased 13% per year to $206, from $89 in 2005.The MEPS Survey recorded a decline in USA retail sales in 2012, down 2% to $251bn, with three trillion prescriptions filled.
61%57%
53%
48%44%
37%34%
29%
39%43%
47%
52%56%
63%66%
71%
0%
10%
20%
30%
40%
50%
60%
70%
80%
90%
100%
0
50,000
100,000
150,000
200,000
250,000
2005 2006 2007 2008 2009 2010 2011 2012
USA
Pre
scrip
tion
volu
me
%
USA
Ret
ail S
ales
(MEP
S) $
m
Year
Analysis of USA Retail Primary Care Sales: Proprietary (NDA) vs. Generic (ANDA) 2005-12Source: EvaluatePharma® (22 SEP 2014)
NDA ANDA NDA as a % ANDA as a %
Note: "Other" not shown, includes primary care dispensed BLAs.
About MEPS: The MEPS (Medical Expenditure Panel Survey), is an annual survey conducted and published by AHRQ (Agency for Healthcare Research and Quality), U.S. Department of Health & Human Services. It covers 13,000 families/ 35,000 individuals, andincludes a representative sample of prescription medicines in the USA, analysing approx. 350,000 prescriptions. The survey results are scaled-up to provide an estimate of total pharmaceutical drug consumption, retail sales and prescription volume, in the USA. The focus of the survey is primary care dispensing of prescriptions and does not cover hospital based drugs.
Co
pyr
igh
t ©
201
4 Ev
alu
ate
Ltd
. All
rig
hts
res
erve
d.

15
Top 100 USA Generic Drugs (MEPS): Retail Sales per Patient 2012
USA Generic Drugs by Retail Sales (MEPS) in 2012: Top 20
USA Retail Sales ($m) Retail Sales per Patient ($) New Generic
Generic name 2012 2012 2011/12
1 simvastatin 2,596 18,733,106 139
2 omeprazole 2,342 11,558,375 203
3 atorvastatin calcium 2,238 4,724,998 474 2011
4 acetaminophen; oxycodone hydrochloride 1,774 6,986,250 254
5 metformin hydrochloride 1,556 13,446,203 116
6 bupropion hydrochloride 1,397 4,313,127 324
7 gabapentin 1,391 5,566,061 250
8 acetaminophen; hydrocodone bitartrate 1,241 19,553,869 63
9 clopidogrel bisulfate 1,181 1,588,281 743 2012
10 lisinopril 1,130 19,048,099 59
11 amlodipine besylate 961 8,110,002 118
12 fentanyl 855 808,211 1,057
13 losartan potassium 825 4,902,328 168
14 isotretinoin 800 363,873 2,198
15 venlafaxine hydrochloride 776 2,117,086 366
16 metoprolol succinate 769 3,109,823 247
17 pravastatin sodium 766 7,009,623 109
18 tacrolimus 747 288,545 2,590
19 escitalopram oxalate 724 899,009 805 2012
20 zolpidem tartrate 654 4,655,282 140
Total Top 20 24,721 137,782,150 179
Total Generic Drugs 64,261.3 533,040,424 121
Source: EvaluatePharma® analysis of MEPS Survey (22 SEP 2014)
No. of Patients
Per Year
Note: Analysis based on 2012 AHRQ (Agency for Healthcare Research and Quality) Medical Expenditures Panel Survey (MEPS)2012 survey released August 2014.
y = 17,515,372.945768x-0.785390
R² = 0.727077
0
500
1,000
1,500
2,000
2,500
3,000
3,500
4,000
4,500
0 2,000,000 4,000,000 6,000,000 8,000,000 10,000,000 12,000,000 14,000,000 16,000,000 18,000,000 20,000,000
Reta
il Sa
les p
er P
atie
nt
No. of Patients
Top 100 USA Generic Drugs by Retail Sales (MEPS):Retail Sales per Patient per Year vs. No. of Patients Treated 2012
Source: EvaluatePharma® (22 SEP 2014)
-5%
+4% -2% -9%-0%
+12%
+2%
+2%
Simvastatin Tops MEPS Retail Sales Ranking for Primary Care Generic Drugs in 2012; Average Cost of $139 per YearEvaluatePharma®, based on analysis of the primary care MEPS survey, finds that generic simvastatin achieved the largest retail sales in the USA at $2.6bn in 2012. The average retail cost per patient was $139 per patient per year, including patient discontinuation. The annual retail sales per patient of the Top 100 generic drugs in the USA, by retail sales, were moderately correlated to the number of patients treated (R2 = 0.73).
Co
pyr
igh
t ©
201
4 Ev
alu
ate
Ltd
. All
rig
hts
res
erve
d.

16
Medicaid Generic Drugs: Generic Prescription Price Trend 2008 to 2014
USA Top 20 Generic Drugs by Prescription Volume (Medicaid) in 2013: Prescription Retail Price Trend 2008 to 2014
USA Rx Volume CAGR Retail Price Trend
Generic name* 2013 2008 2014 (08/14) 2008-14
1 acetaminophen; hydrocodone bitartrate 14,875,388 13.13 15.03 +2.3%
2 amoxicillin 12,668,753 10.26 7.53 -5.0%
3 ibuprofen 12,341,085 9.04 6.12 -6.3%
4 loratadine 8,048,186 11.63 6.17 -10.0%
5 omeprazole 7,551,832 34.03 11.39 -16.7%
6 lisinopril 7,512,410 11.78 4.74 -14.1%
7 cetirizine hydrochloride 6,833,522 15.71 8.36 -10.0%
8 metformin hydrochloride 6,352,548 16.25 7.40 -12.3%
9 albuterol sulfate 6,053,052 22.39 15.16 -6.3%
10 gabapentin 5,999,958 54.91 20.53 -15.1%
11 montelukast sodium 5,853,377 22.30
12 simvastatin 5,834,895 17.90 6.33 -15.9%
13 fluticasone propionate 5,565,945 33.07 18.11 -9.6%
14 acetaminophen; oxycodone hydrochloride 5,242,638 32.25 34.71 +1.2%
15 azithromycin 5,039,671 29.63 14.70 -11.0%
16 tramadol hydrochloride 4,978,809 13.99 7.24 -10.4%
17 ondansetron hydrochloride 4,606,949 70.49 25.22 -15.7%
18 trazodone hydrochloride 4,408,014 8.59 7.07 -3.2%
19 clonazepam 4,402,266 11.84 7.07 -8.2%
20 ergocalciferol 4,243,905 10.02 4.87 -11.3%
Average of Top 20 22.47 12.50 -9.3%
Source: EvaluatePharma® analysis of Medicaid Drug Expenditure (22 SEP 2014)
Retail Price per Rx ($)
Note: Prescription volume in 2013 based on Medicaid data. *Prescription volume and retail prices represent all generic products on theUSA market that are reimbursed by Medicaid.
+2%
Average Retail Price of Top 20 Medicaid Generics Drop on Average 9% per Year EvaluatePharma®, based on analysis of Medicaid data, finds the average retail prescription price paid for a Top 20 most prescribed USA generic fell on average 9% per year between 2008 and 2014, from $22.47 to $12.50.Acetaminophen; hydrocodone bitartrate was the most prescribed generic in 2013. It was also one of only two generics to register a retail price increase per prescription over 2008 and 2014, up 2.3% per year to $15.03.
-17% -16% -16% -15% -14%-12% -11% -11% -10% -10% -10% -10%
-8%-6% -6%
-5%-3%
+1% +2%
+5%
-0%
-5%
-10%
-15%
-20%
omep
razo
le
simva
stat
in
onda
nset
ron
hydr
ochl
orid
e
gaba
pent
in
lisin
opril
met
form
in h
ydro
chlo
ride
ergo
calc
ifero
l
azith
rom
ycin
tram
adol
hyd
roch
lorid
e
lora
tadi
ne
cetir
izine
hyd
roch
lorid
e
flutic
ason
e pr
opio
nate
clon
azep
am
ibup
rofe
n
albu
tero
l sul
fate
amox
icill
in
traz
odon
e hy
droc
hlor
ide
acet
amin
ophe
n; o
xyco
done
hydr
ochl
orid
eac
etam
inop
hen;
hyd
roco
done
bita
rtra
te
mon
telu
kast
sodi
um
Perc
enta
ge D
eclin
e in
Ret
ail P
rice
per R
x 20
08-1
4
Generic Name
Top 20 USA Generic Drugs by Prescription Volume (Medicaid): Price change 2008-14Source: EvaluatePharma® (22 SEP 2014)
Co
pyr
igh
t ©
201
4 Ev
alu
ate
Ltd
. All
rig
hts
res
erve
d.

Evaluate’s Solutions for the Life Science IndustryAt Evaluate, our focus is on the business success of our clients.Our services are delivered via online subscriptions and through custom solutions. Contact us today to find out more.
Leader in consensus forecasts and analysis of pharma and biotech
� Consensus sales forecasts of leading Wall Street analysts, currently to 2020
� Must-have insights in an integrated, standardized platform
� Interactive NPV discount cash flow model for asset valuation and Calendar of Events tool
A new standard in medtech industry analysis via a consensus view
� Consensus forecasts of leading Wall Street analysts, currently to 2020
� Simplified medtech classification system correlated to FDA and company specified segments
� Six integrated FDA databases and EU CE Mark approvals
High quality global clinical trial intelligence linked to essential commercial insights
� Full records of ClinicalTrials.gov, EudraCT and a Japanese Clinical Trials data source
� Integrated with in-depth EvaluatePharma product and indication information
� Unique search fields for custom analysis and reporting
Award-winning commentary and analysis by industry experts
� Daily round up of share price movements
� Future market events that will impact product value
� Searchable news and commentary powered by high quality Evaluate data
For more information please visit www.evaluate.com On Twitter: @evaluatepharma, @evaluatemedtech, @epclinicaltrial, @epvantage.
17
Co
pyr
igh
t ©
201
4 Ev
alu
ate
Ltd
. All
rig
hts
res
erve
d.

Evaluate – Headquarters – Evaluate Ltd, 11-29 Fashion Street, London E1 6PX United Kingdom
Tel: +44 (0)20 7377 0800 – Fax: +44 (0)20 7539 1801
Evaluate – North America – EvaluatePharma USA, Inc., 15 Broad Street, Suite 401, Boston, MA 02109 USA
Tel: 1-617 573-9450 – Fax: 1-617 573-9542
Evaluate – Japan – EvaluatePharma Japan KK, Tokyo, Japan
Tel: +81 (0) 80 1164 4754
www.evaluate.com
All intellectual property rights in this report remain that of Evaluate Ltd and/or its respective third party licensors. Whilst all reasonable steps have been taken to ensure that the datapresented are accurate, Evaluate Ltd cannot accept responsibility for errors or omissions. Neither does Evaluate Ltd warrant the accuracy, merchantability or fitness for a particular purpose of the data. Nothing in the reports shall constitute investment, financial or legal advice and the contents of the reports are provided for information purposes only. The data is not intended to amount to advice and should not be used as a determining factor in any investment decision. This report may not be lent, resold, hired out or otherwise disposed of by way of trade in any form of binding or cover other than that in which it is published, without the prior written consent of Evaluate Ltd. Copyright © 2014 Evaluate Ltd. All rights reserved.
Additional complimentary copies of this report can be downloaded at: www.evaluategroup.com/budget-busters
Established in 1996, Evaluate Ltd is the leader in high quality life science sector analysis. Evaluate’s team of expert analysts transform life science information into insights so companies can perform well. EvaluatePharma delivers exclusive consensus sales forecasts and trusted commercial insight into biotech and pharmaceutical performance. EvaluateMedTech sets a new standard in commercial analysis and consensus forecasts of the global medical device and diagnostic industry. EvaluateClinical Trials delivers unique clinical trial intelligence expertly curated to efficiently analyse the global clinical trial landscape. An award winning editorial team, EP Vantage, provides daily commentary and analysis with fresh perspectives and insight into current and future industry trends. The Evaluate services enable the life science community to make sound business decisions about value and opportunity.
EPSVP2014BB
For general inquires about this report: Christine Lindgren Tel: 1-617-573-9458 Email: [email protected]