Budget 2015 Summary - National Treasury budget...Budget 2015 Summary . Budget 2015 Summary 2 ......
18
Introduction The 2015 Budget is framed within the international and national context of ongoing economic and fiscal constraints. The downward revision to the global and South African growth forecasts for 2015 suggests that sluggish economic growth is forecast to continue. However, notwithstanding the current economic climate, key opportunities for South Africa and the Western Cape remain apparent. The 2015 Budget focuses on balancing public finances while managing risk and maintaining fiscal stability in a weak economic environment whilst giving effect to the 2014 - 2019 Provincial Strategic Plan (PSP). The Provincial Strategic Plan sets out the Western Cape Government’s (WCG’s) vision and strategic priorities for the next five years. The PSP incorporates 5 overarching Provincial Strategic Goals (PSGs) and introduces a number of “game changers” to catalyse the realisation of the PSGs. The 5 PSGs are as follows: PSG 1: Create opportunities for growth and jobs; PSG 2: Improve education outcomes and opportunities for youth development; PSG 3: Increase wellness, safety and tackle social ills; PSG 4: Enable a resilient, sustainable, quality and inclusive living environment; and PSG 5: Embed good governance and integrated service delivery through partnerships and spatial alignment. The 2015 Budget provides for total expenditure amounting to R52.022 billion in 2015/16, R54.458 billion in 2016/17 and R56.579 billion in 2017/18. Both at a national and provincial level, government continues to allocate resources to core social and economic priorities. Resources have been allocated from underperforming programmes to critical frontline services and continuing the trajectory of shifting from consumption to investment. The Western Cape Government, through its Budget is committed to public spending which is directed at increasing service delivery efficiency and achieving economic, governance and social objectives. Budget 2015 Summary
Transcript of Budget 2015 Summary - National Treasury budget...Budget 2015 Summary . Budget 2015 Summary 2 ......
Introduction
The 2015 Budget is framed within the international and national context of ongoing economic and fiscal constraints. The downward revision to the global and South African growth forecasts for 2015 suggests that sluggish economic growth is forecast to continue. However, notwithstanding the current economic climate, key opportunities for South Africa and the Western Cape remain apparent.
The 2015 Budget focuses on balancing public finances while managing risk and maintaining fiscal stability in a weak economic environment whilst giving effect to the 2014 - 2019 Provincial Strategic Plan (PSP). The Provincial Strategic Plan sets out the Western Cape Government’s (WCG’s) vision and strategic priorities for the next five years. The PSP incorporates 5 overarching Provincial Strategic Goals (PSGs) and introduces a number of “game changers” to catalyse the realisation of the PSGs. The 5 PSGs are as follows:
PSG 1: Create opportunities for growth and jobs;
PSG 2: Improve education outcomes and opportunities for youth development;
PSG 3: Increase wellness, safety and tackle social ills;
PSG 4: Enable a resilient, sustainable, quality and inclusive living environment; and
PSG 5: Embed good governance and integrated service delivery through partnerships and spatial alignment.
The 2015 Budget provides for total expenditure amounting to R52.022 billion in 2015/16, R54.458 billion in 2016/17 and R56.579 billion in 2017/18. Both at a national and provincial level, government continues to allocate resources to core social and economic priorities. Resources have been allocated from underperforming programmes to critical frontline services and continuing the trajectory of shifting from consumption to investment. The Western Cape Government, through its Budget is committed to public spending which is directed at increasing service delivery efficiency and achieving economic, governance and social objectives.
Budget 2015 Summary
Budget 2015 Summary 2
The 2015 Budget continues to invest in programmes aimed at the capacitation of the WCG to implement infrastructure projects whilst improving the quality and efficacy of infrastructure spending. In addition, the spatial and sectoral dispersion of the Province’s budget aims to address the prevailing socio-economic realities, policies and strategies that jointly confront the Province and municipalities.
Whilst budgets are allocated to provincial departments in terms of their legislative mandate, delivery requires collaboration and co-operation amongst departments and partnership development with key stakeholders. Supported by good governance, resources can be better leveraged to achieve the Provincial strategic priorities and deliver better public services for the people of the Western Cape.
Economic Outlook
The downward revision to the global and South African growth forecasts for 2015 suggests that slow economic growth is expected to persist. Global economic growth is projected to increase albeit it may remain at a sluggish pace as growth rates for advanced economies accelerates, while moderate economic growth is expected for emerging markets. Key risks to the global economic outlook include: earlier than expected US interest rate hikes and future oil price trends.
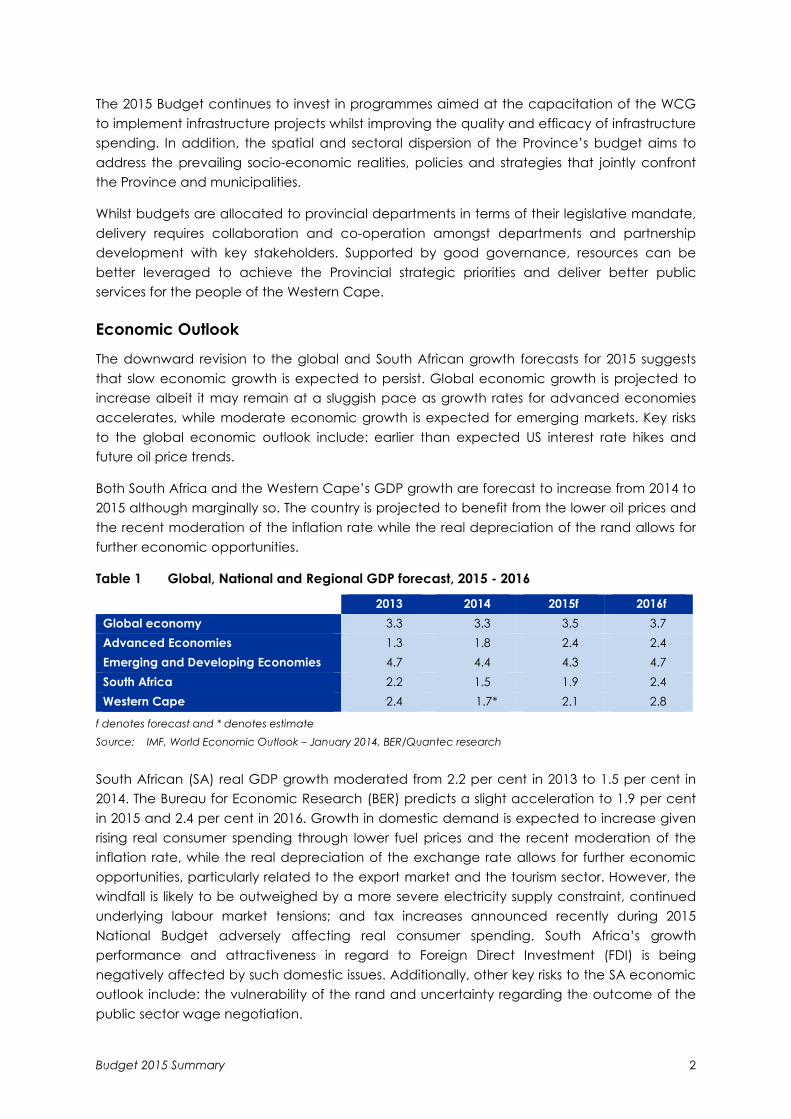
Both South Africa and the Western Cape’s GDP growth are forecast to increase from 2014 to 2015 although marginally so. The country is projected to benefit from the lower oil prices and the recent moderation of the inflation rate while the real depreciation of the rand allows for further economic opportunities.
Table 1 Global, National and Regional GDP forecast, 2015 - 2016
2013 2014 2015f 2016f Global economy 3.3 3.3 3.5 3.7 Advanced Economies 1.3 1.8 2.4 2.4 Emerging and Developing Economies 4.7 4.4 4.3 4.7 South Africa 2.2 1.5 1.9 2.4 Western Cape 2.4 1.7* 2.1 2.8
f denotes forecast and * denotes estimate Source: IMF, World Economic Outlook – January 2014, BER/Quantec research
South African (SA) real GDP growth moderated from 2.2 per cent in 2013 to 1.5 per cent in 2014. The Bureau for Economic Research (BER) predicts a slight acceleration to 1.9 per cent in 2015 and 2.4 per cent in 2016. Growth in domestic demand is expected to increase given rising real consumer spending through lower fuel prices and the recent moderation of the inflation rate, while the real depreciation of the exchange rate allows for further economic opportunities, particularly related to the export market and the tourism sector. However, the windfall is likely to be outweighed by a more severe electricity supply constraint, continued underlying labour market tensions; and tax increases announced recently during 2015 National Budget adversely affecting real consumer spending. South Africa’s growth performance and attractiveness in regard to Foreign Direct Investment (FDI) is being negatively affected by such domestic issues. Additionally, other key risks to the SA economic outlook include: the vulnerability of the rand and uncertainty regarding the outcome of the public sector wage negotiation.
Budget 2015 Summary 3
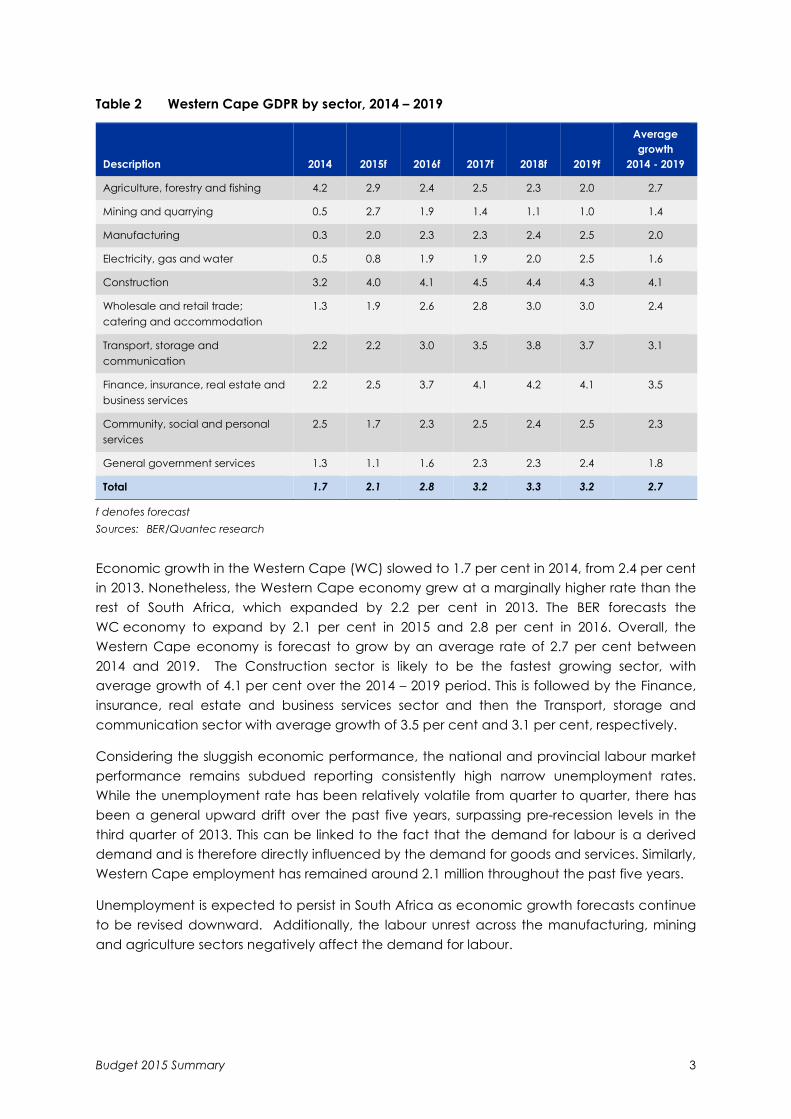
Table 2 Western Cape GDPR by sector, 2014 – 2019
Description 2014 2015f 2016f 2017f 2018f 2019f
Average growth
2014 - 2019
Agriculture, forestry and fishing 4.2 2.9 2.4 2.5 2.3 2.0 2.7
Mining and quarrying 0.5 2.7 1.9 1.4 1.1 1.0 1.4
Manufacturing 0.3 2.0 2.3 2.3 2.4 2.5 2.0
Electricity, gas and water 0.5 0.8 1.9 1.9 2.0 2.5 1.6
Construction 3.2 4.0 4.1 4.5 4.4 4.3 4.1
Wholesale and retail trade; catering and accommodation
1.3 1.9 2.6 2.8 3.0 3.0 2.4
Transport, storage and communication
2.2 2.2 3.0 3.5 3.8 3.7 3.1
Finance, insurance, real estate and business services
2.2 2.5 3.7 4.1 4.2 4.1 3.5
Community, social and personal services
2.5 1.7 2.3 2.5 2.4 2.5 2.3
General government services 1.3 1.1 1.6 2.3 2.3 2.4 1.8
Total 1.7 2.1 2.8 3.2 3.3 3.2 2.7
f denotes forecast Sources: BER/Quantec research
Economic growth in the Western Cape (WC) slowed to 1.7 per cent in 2014, from 2.4 per cent in 2013. Nonetheless, the Western Cape economy grew at a marginally higher rate than the rest of South Africa, which expanded by 2.2 per cent in 2013. The BER forecasts the WC economy to expand by 2.1 per cent in 2015 and 2.8 per cent in 2016. Overall, the Western Cape economy is forecast to grow by an average rate of 2.7 per cent between 2014 and 2019. The Construction sector is likely to be the fastest growing sector, with average growth of 4.1 per cent over the 2014 – 2019 period. This is followed by the Finance, insurance, real estate and business services sector and then the Transport, storage and communication sector with average growth of 3.5 per cent and 3.1 per cent, respectively.
Considering the sluggish economic performance, the national and provincial labour market performance remains subdued reporting consistently high narrow unemployment rates. While the unemployment rate has been relatively volatile from quarter to quarter, there has been a general upward drift over the past five years, surpassing pre-recession levels in the third quarter of 2013. This can be linked to the fact that the demand for labour is a derived demand and is therefore directly influenced by the demand for goods and services. Similarly, Western Cape employment has remained around 2.1 million throughout the past five years.
Unemployment is expected to persist in South Africa as economic growth forecasts continue to be revised downward. Additionally, the labour unrest across the manufacturing, mining and agriculture sectors negatively affect the demand for labour.
Budget 2015 Summary 4
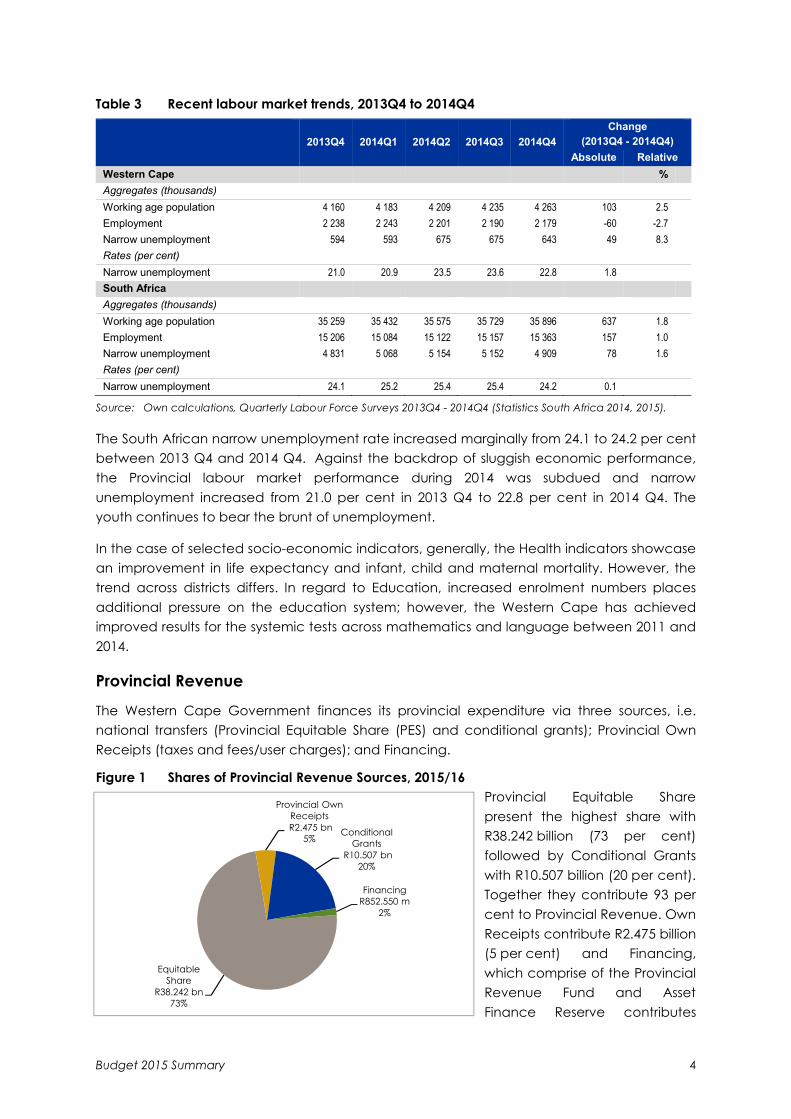
Table 3 Recent labour market trends, 2013Q4 to 2014Q4
2013Q4 2014Q1 2014Q2 2014Q3 2014Q4
Change (2013Q4 - 2014Q4)
Absolute Relative
Western Cape %
Aggregates (thousands)
Working age population 4 160 4 183 4 209 4 235 4 263 103 2.5
Employment 2 238 2 243 2 201 2 190 2 179 -60 -2.7
Narrow unemployment 594 593 675 675 643 49 8.3
Rates (per cent)
Narrow unemployment 21.0 20.9 23.5 23.6 22.8 1.8
South Africa
Aggregates (thousands)
Working age population 35 259 35 432 35 575 35 729 35 896 637 1.8
Employment 15 206 15 084 15 122 15 157 15 363 157 1.0
Narrow unemployment 4 831 5 068 5 154 5 152 4 909 78 1.6
Rates (per cent)
Narrow unemployment 24.1 25.2 25.4 25.4 24.2 0.1
Source: Own calculations, Quarterly Labour Force Surveys 2013Q4 - 2014Q4 (Statistics South Africa 2014, 2015).
The South African narrow unemployment rate increased marginally from 24.1 to 24.2 per cent between 2013 Q4 and 2014 Q4. Against the backdrop of sluggish economic performance, the Provincial labour market performance during 2014 was subdued and narrow unemployment increased from 21.0 per cent in 2013 Q4 to 22.8 per cent in 2014 Q4. The youth continues to bear the brunt of unemployment.
In the case of selected socio-economic indicators, generally, the Health indicators showcase an improvement in life expectancy and infant, child and maternal mortality. However, the trend across districts differs. In regard to Education, increased enrolment numbers places additional pressure on the education system; however, the Western Cape has achieved improved results for the systemic tests across mathematics and language between 2011 and 2014.
Provincial Revenue
The Western Cape Government finances its provincial expenditure via three sources, i.e. national transfers (Provincial Equitable Share (PES) and conditional grants); Provincial Own Receipts (taxes and fees/user charges); and Financing.
Figure 1 Shares of Provincial Revenue Sources, 2015/16 Provincial Equitable Share present the highest share with R38.242 billion (73 per cent) followed by Conditional Grants with R10.507 billion (20 per cent). Together they contribute 93 per cent to Provincial Revenue. Own Receipts contribute R2.475 billion (5 per cent) and Financing, which comprise of the Provincial Revenue Fund and Asset Finance Reserve contributes
Equitable Share
R38.242 bn73%
Provincial Own ReceiptsR2.475 bn
5%Conditional
GrantsR10.507 bn
20%
Financing R852.550 m
2%
Budget 2015 Summary 5
R852.550 million (2 per cent) in the 2015/16 financial year. Motor vehicle licence fees, casino taxes and hospital fees continue to be the major sources of provincial own receipts.
Transfers from National Government (i.e. PES and conditional grants) increase by R2.968 billion or 6.48 per cent from the Adjusted Appropriation of R45.781 billion in 2014/15 to R48.749 billion in 2015/16 and is estimated to grow to R51.159 billion in 2016/17 and R54.557 billion in 2017/18. The total resource envelope grows at an average annual growth rate of 6.02 per cent over the 2015 MTEF.
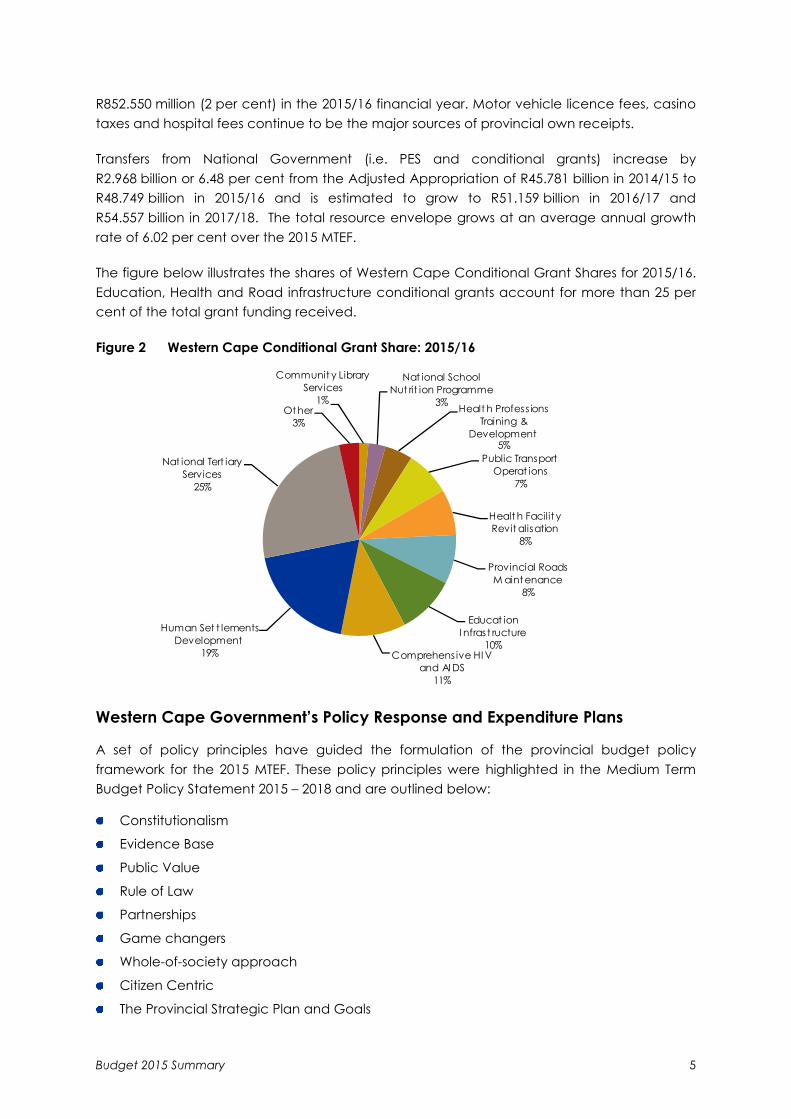
The figure below illustrates the shares of Western Cape Conditional Grant Shares for 2015/16. Education, Health and Road infrastructure conditional grants account for more than 25 per cent of the total grant funding received.
Figure 2 Western Cape Conditional Grant Share: 2015/16
Communit y LibraryServices
1%
Nat ional School Nut rit ion Programme
3% Healt h Profess ions Training &
Development5%
Public Transport Operat ions
7%
Healt h Facilit y Revit alisation
8%
Provincial Roads M aint enance
8%
Educat ion I nfras t ructure
10%Comprehens ive HI V
and AI DS 11%
Human Set t lements Development
19%
Nat ional Tert iary Services
25%
Ot her3%
Western Cape Government’s Policy Response and Expenditure Plans
A set of policy principles have guided the formulation of the provincial budget policy framework for the 2015 MTEF. These policy principles were highlighted in the Medium Term Budget Policy Statement 2015 – 2018 and are outlined below:
Constitutionalism
Evidence Base
Public Value
Rule of Law
Partnerships
Game changers
Whole-of-society approach
Citizen Centric
The Provincial Strategic Plan and Goals
Budget 2015 Summary 6
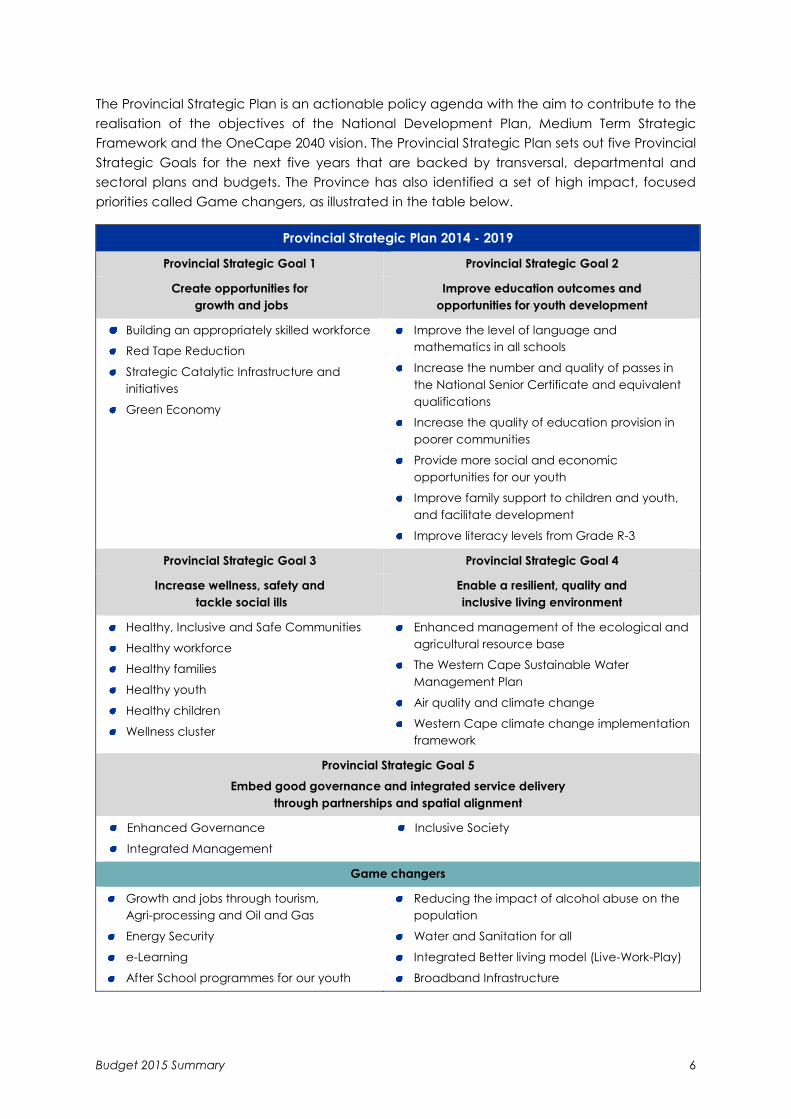
The Provincial Strategic Plan is an actionable policy agenda with the aim to contribute to the realisation of the objectives of the National Development Plan, Medium Term Strategic Framework and the OneCape 2040 vision. The Provincial Strategic Plan sets out five Provincial Strategic Goals for the next five years that are backed by transversal, departmental and sectoral plans and budgets. The Province has also identified a set of high impact, focused priorities called Game changers, as illustrated in the table below.
Provincial Strategic Plan 2014 - 2019
Provincial Strategic Goal 1 Provincial Strategic Goal 2
Create opportunities for growth and jobs
Improve education outcomes and opportunities for youth development
Building an appropriately skilled workforce
Red Tape Reduction
Strategic Catalytic Infrastructure and initiatives
Green Economy
Improve the level of language and mathematics in all schools
Increase the number and quality of passes in the National Senior Certificate and equivalent qualifications
Increase the quality of education provision in poorer communities
Provide more social and economic opportunities for our youth
Improve family support to children and youth, and facilitate development
Improve literacy levels from Grade R-3
Provincial Strategic Goal 3 Provincial Strategic Goal 4
Increase wellness, safety and tackle social ills
Enable a resilient, quality and inclusive living environment
Healthy, Inclusive and Safe Communities
Healthy workforce
Healthy families
Healthy youth
Healthy children
Wellness cluster
Enhanced management of the ecological and agricultural resource base
The Western Cape Sustainable Water Management Plan
Air quality and climate change
Western Cape climate change implementation framework
Provincial Strategic Goal 5 Embed good governance and integrated service delivery
through partnerships and spatial alignment
Enhanced Governance
Integrated Management
Inclusive Society
Game changers
Growth and jobs through tourism, Agri-processing and Oil and Gas
Energy Security
e-Learning
After School programmes for our youth
Reducing the impact of alcohol abuse on the population
Water and Sanitation for all
Integrated Better living model (Live-Work-Play)
Broadband Infrastructure
Budget 2015 Summary 7
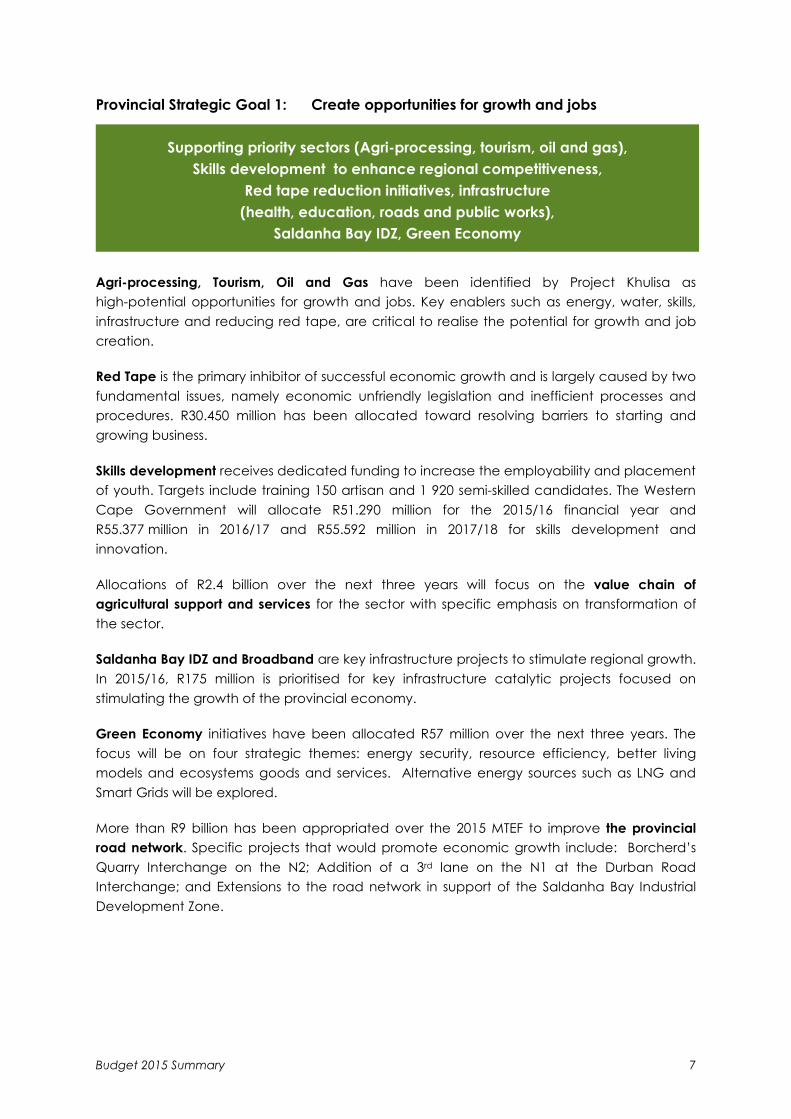
Provincial Strategic Goal 1: Create opportunities for growth and jobs
Agri-processing, Tourism, Oil and Gas have been identified by Project Khulisa as high-potential opportunities for growth and jobs. Key enablers such as energy, water, skills, infrastructure and reducing red tape, are critical to realise the potential for growth and job creation.
Red Tape is the primary inhibitor of successful economic growth and is largely caused by two fundamental issues, namely economic unfriendly legislation and inefficient processes and procedures. R30.450 million has been allocated toward resolving barriers to starting and growing business.
Skills development receives dedicated funding to increase the employability and placement of youth. Targets include training 150 artisan and 1 920 semi-skilled candidates. The Western Cape Government will allocate R51.290 million for the 2015/16 financial year and R55.377 million in 2016/17 and R55.592 million in 2017/18 for skills development and innovation.
Allocations of R2.4 billion over the next three years will focus on the value chain of agricultural support and services for the sector with specific emphasis on transformation of the sector.
Saldanha Bay IDZ and Broadband are key infrastructure projects to stimulate regional growth. In 2015/16, R175 million is prioritised for key infrastructure catalytic projects focused on stimulating the growth of the provincial economy.
Green Economy initiatives have been allocated R57 million over the next three years. The focus will be on four strategic themes: energy security, resource efficiency, better living models and ecosystems goods and services. Alternative energy sources such as LNG and Smart Grids will be explored.
More than R9 billion has been appropriated over the 2015 MTEF to improve the provincial road network. Specific projects that would promote economic growth include: Borcherd’s Quarry Interchange on the N2; Addition of a 3rd lane on the N1 at the Durban Road Interchange; and Extensions to the road network in support of the Saldanha Bay Industrial Development Zone.
Supporting priority sectors (Agri-processing, tourism, oil and gas), Skills development to enhance regional competitiveness,
Red tape reduction initiatives, infrastructure (health, education, roads and public works),
Saldanha Bay IDZ, Green Economy
Budget 2015 Summary 8
Provincial Strategic Goal 2: Improve education outcomes and opportunities for youth development
The Province has allocated a total of R55.751 billion over the next three years to the Western Cape Department of Education towards improving education outcomes. Key focus areas for the Department include: excellent administration boosted by online services; a five year teacher development plan; good school management; needs-based education provisioning; support for independent schools; a programme to minimise barriers to learning; social support and a platform for youth development which includes the school nutrition programme, fee relief and safe schools; an effective infrastructure programme to create an inspiring environment; quality Grade R; and provincial curriculum management strategies with a specific focus on Language and Mathematics Development Strategies.
Improving the quality of teaching and learning in the Western Cape through e-Learning is a key priority for the Western Cape Department of Education. Local Area Networks (LANs) will be installed in 610 schools over the next five years, 3 350 classrooms across 248 schools will benefit from the Smart Classroom Project over the same period and 500 of the Western Cape’s poorest schools will receive refreshed computer labs. R698.632 million has been allocated for the e-Learning initiative over the 2015 MTEF.
The Province will strive to improve family support to children and youth by establishing referral pathways between the Department of Social Development and the Western Cape Education Department. This will ensure that schools are better able to access Department of Social Development staff, funded organisations and other resources to assist children with special needs, including challenging behaviour. This in turn will contribute towards school retention by keeping children in school and assisting them in completing their education. This will be complemented by appropriate psychosocial support programmes including family strengthening, parenting education and cognitive behavioural programmes including substance abuse treatment where necessary.
The Province is supporting after-school programmes, in particular the 181 school-based Mass Opportunity and Development (MOD) Centres, where learners participate in after-school activities. R447.685 million has been allocated over the MTEF, which includes nutrition for participant learners and infrastructure to support the after-school programme. The Year Beyond programme, an after-school academic enrichment programme, is being rolled out at the beginning of 2015 to 16 schools. This programme aims to assist with the improvement of academic results.
The key focus area of the Western Cape Youth Development Strategy is the holistic skills development of young people to make them more employable, positive, healthy and well prepared for adulthood. Youth Cafés are an innovative initiative to empower and develop skills amongst youth, build networks and access additional opportunities in the form of bursaries and internships. Over the 2015 MTEF, R5.640 million will be allocated toward the current Youth Cafés in Mitchell’s Plain and Athlone and the establishment of an additional three Youth Cafés in George, Atlantis and Nyanga Junction.
Education, e-Learning, youth programmes, Improving family support to children and youth after-school programmes
Budget 2015 Summary 9
Provincial Strategic Goal 3: Increase wellness, safety and tackle social ills
To improve wellness, there is a need to strengthen the capability for early detection and treatment, the reduction of unhealthy lifestyles and the ability to address the underlying social determinants of disease. A total of R59.089 billion has been allocated to the Department of Health over the next three years to provide and improve the quality of health services in the Province. Rigorous immunisation, maternal and child health programmes will continue to reduce infant and child mortality. Health promotion activities will include strengthening antenatal and post-natal care and implementation of the parenting programme (first 1 000 days).
A budget of R5.999 billion is allocated to the Department of Social Development over the 2015 MTEF to provide services to the poor, the vulnerable and those with special needs. Social development services for the vulnerable will be enhanced by improving the quality of child care and protection services; care for older persons especially the expansion of independent and assisted living and frail care to meet the demands of our ageing population; substance abuse interventions, services to persons with disabilities, victim support, shelters for homeless adults, especially women and children and including, special accommodation for victims of human trafficking; probation services and diversion programmes will be prioritised over the next 3 years.
The promotion of the rights, well-being and socio-economic empowerment of people with disabilities and their families or caregivers will continue over the next 3 years. Establishment of a disabilities desk in the Ministry of Social Development, with a view to reforming the Provincial Government’s disability policies and providing a support resource for persons with disabilities. An additional R97.033 million has been allocated over the MTEF for services for persons with disabilities.
In 2015/16, 85 000 children up to the age of 4 years will be able to access Early Childhood Development programmes. The programme will continue to focus on increasing the quality of education, through providing safe environments and nutrition; and stimulation and exposure to language development. The provision of care and protection to all street children, coupled with family strengthening and parent education is the promotion of positive parenting will deepen the focus on wellness, safety and reducing social ills.
To promote arts, culture and heritage, the Department of Cultural Affairs and Sport is allocated an amount of R2.152 billion over the MTEF. This allocation is to support cultural affairs, library and archive services as well as sport and recreation. These services aim to promote social inclusion and improve the social fabric of Western Cape communities.
To promote safety, the Community Safety Improvement Partnership (CSIP) will be the key focus area over the next 3 years. Key elements of the CSIP include: monitoring police conduct, assessing the effectiveness of visible policing and overseeing the effectiveness and efficiency of the police service. This will be done in close cooperation with the National Secretariat of Police and the establishment of the Western Cape Police Ombudsman to deal with complaints of communities. An allocation of R729 million has been made over the 2015 MTEF toward increasing safety in the Province.
Increased wellness, social services to the most vulnerable (children, elderly, poor), persons with disabilities, increasing safety
Budget 2015 Summary 10
Provincial Strategic Goal 4: Enable a resilient, quality and inclusive living environment
The Provincial Spatial Development Framework (PSDF) serves to guide the location and form of public investment in the natural and built environments, so that the returns on these investments are consistent with the Province’s development objectives.
The Department of Environmental Affairs and Development Planning has been allocated a budget of R1.629 billion over the next three years. A system for collecting, analysing and disseminating spatial information and in support of regional and municipal planning is a key priority that this allocation supports.
Sustainable resource use and efficiency projects over the next three years include:
Expanding the Berg River Improvement Plan methodology to the Olifants/Doorn River and Breede River catchment areas;
Waste management programmes in support of the municipalities;
Driving Sustainable Public Procurement (with links to the Green Economy); and
Municipal support on climate change and other sustainability interventions.
The Department of Human Settlements has been allocated R7.155 billion over the 2015 MTEF toward increasing housing opportunities and improving settlement functionality, efficiencies and resilience. More resources will be shifted toward the upgrading of informal settlements to deal with problems of poor living conditions and insufficient access to basic services. The cleaning up of the Housing Demand Database in municipalities will continue to be prioritised to ensure that limited housing opportunities are allocated to the most deserving beneficiaries.
The Regional Socio-Economic Project (RSEP) and the Violence Prevention through Urban Upgrading (VPUU) programmes have been combined into a single programme. The main goal of the programme is to partner with active citizens to plan and implement upgrading and safety projects in poor neighbourhoods in the Province thereby improving safety in communities. The participating municipalities include Drakenstein, Theewaterskloof, Saldanha Bay and Breede Valley. Amounts of R21.3 million in 2015/16, R38.8 million in 2016/17 and R64.3 million in 2017/18 are allocated for this project.
Spatial and development planning, sustainable ecological and agricultural resource-base, integrated human settlements
Budget 2015 Summary 11
Provincial Strategic Goal 5: Embed good governance and integrated service delivery through partnerships and spatial alignment
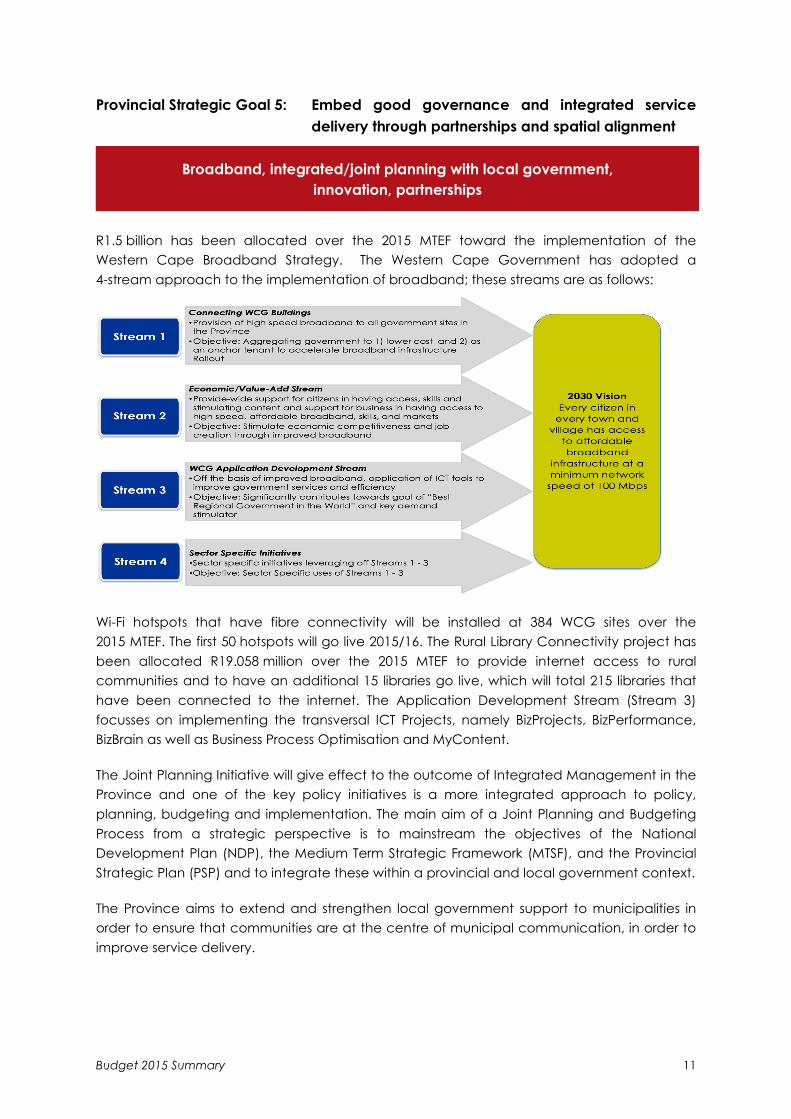
R1.5 billion has been allocated over the 2015 MTEF toward the implementation of the Western Cape Broadband Strategy. The Western Cape Government has adopted a 4-stream approach to the implementation of broadband; these streams are as follows:
Wi-Fi hotspots that have fibre connectivity will be installed at 384 WCG sites over the 2015 MTEF. The first 50 hotspots will go live 2015/16. The Rural Library Connectivity project has been allocated R19.058 million over the 2015 MTEF to provide internet access to rural communities and to have an additional 15 libraries go live, which will total 215 libraries that have been connected to the internet. The Application Development Stream (Stream 3) focusses on implementing the transversal ICT Projects, namely BizProjects, BizPerformance, BizBrain as well as Business Process Optimisation and MyContent.
The Joint Planning Initiative will give effect to the outcome of Integrated Management in the Province and one of the key policy initiatives is a more integrated approach to policy, planning, budgeting and implementation. The main aim of a Joint Planning and Budgeting Process from a strategic perspective is to mainstream the objectives of the National Development Plan (NDP), the Medium Term Strategic Framework (MTSF), and the Provincial Strategic Plan (PSP) and to integrate these within a provincial and local government context.
The Province aims to extend and strengthen local government support to municipalities in order to ensure that communities are at the centre of municipal communication, in order to improve service delivery.
Broadband, integrated/joint planning with local government, innovation, partnerships
Budget 2015 Summary 12
Education R1.4 bn
24%
HealthR826 m
14%
Environmental R29 m0.5%
Transport and Public Works
R3.7 bn62%
The WCG also has the responsibility to coordinate disaster preparedness; and ‘response’ in the Province will focus, on informal settlements. Over the past few years, the Thusong and the Community Development Workers (CDW) programmes have played a major role in bringing government services to where people live. The Thusong and CDW programmes will continue to ensure community accessibility to government services.
Partnerships are a direct result of today’s governance challenges, where an ever increasing expectation is placed on government to fulfil unlimited needs with limited resources. The development of a whole-of-society approach within the WCG highlights the importance of entering into partnerships with various role-players such as businesses and communities. The whole-of-society approach mobilises resources, knowledge, creativity and concerns of all role-players through partnerships.
Infrastructure Expenditure
The Western Cape Infrastructure Delivery Management System (WCIDMS) is being implemented to institutionalise standardised good practice methodologies, tools and systems to ensure the effective and efficient delivery and maintenance of infrastructure in the Province. The effective and efficient delivery of public infrastructure must create value through the economic and social activities it supports and is critical to promoting balanced economic development; unlocking economic opportunities; addressing socio-economic needs; promoting job creation and ensuring integrated human settlements.
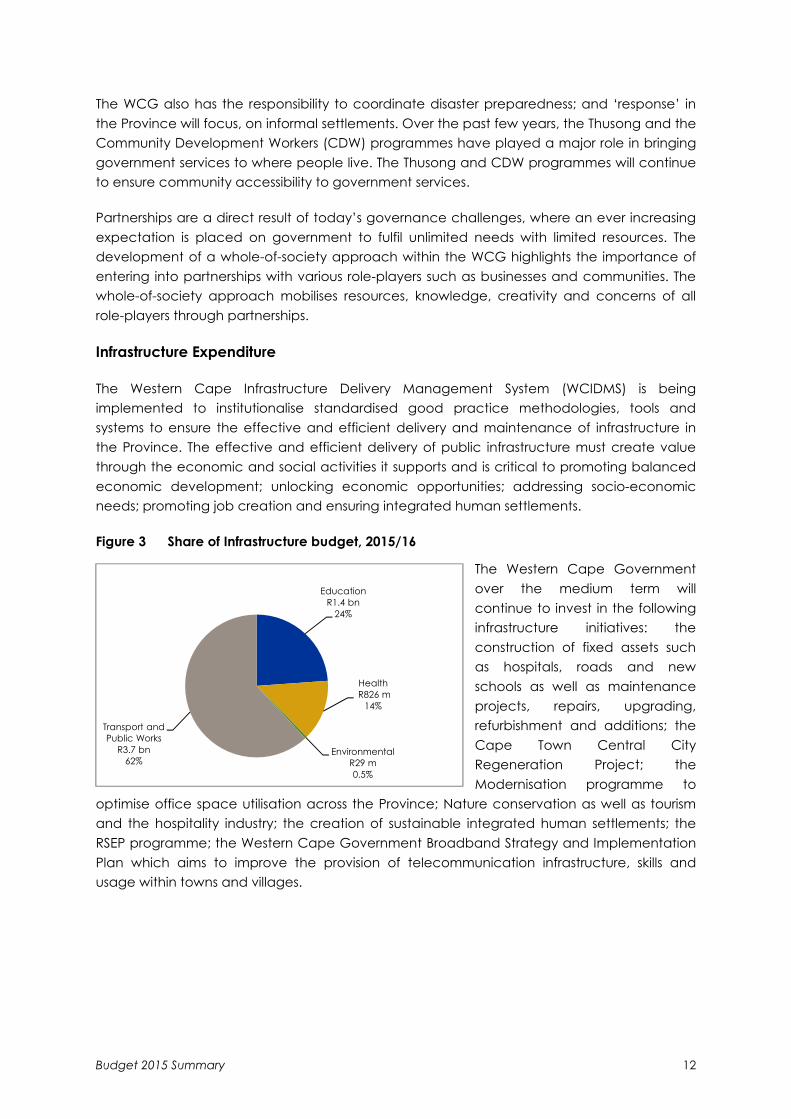
Figure 3 Share of Infrastructure budget, 2015/16
The Western Cape Government over the medium term will continue to invest in the following infrastructure initiatives: the construction of fixed assets such as hospitals, roads and new schools as well as maintenance projects, repairs, upgrading, refurbishment and additions; the Cape Town Central City Regeneration Project; the Modernisation programme to
optimise office space utilisation across the Province; Nature conservation as well as tourism and the hospitality industry; the creation of sustainable integrated human settlements; the RSEP programme; the Western Cape Government Broadband Strategy and Implementation Plan which aims to improve the provision of telecommunication infrastructure, skills and usage within towns and villages.
Budget 2015 Summary 13
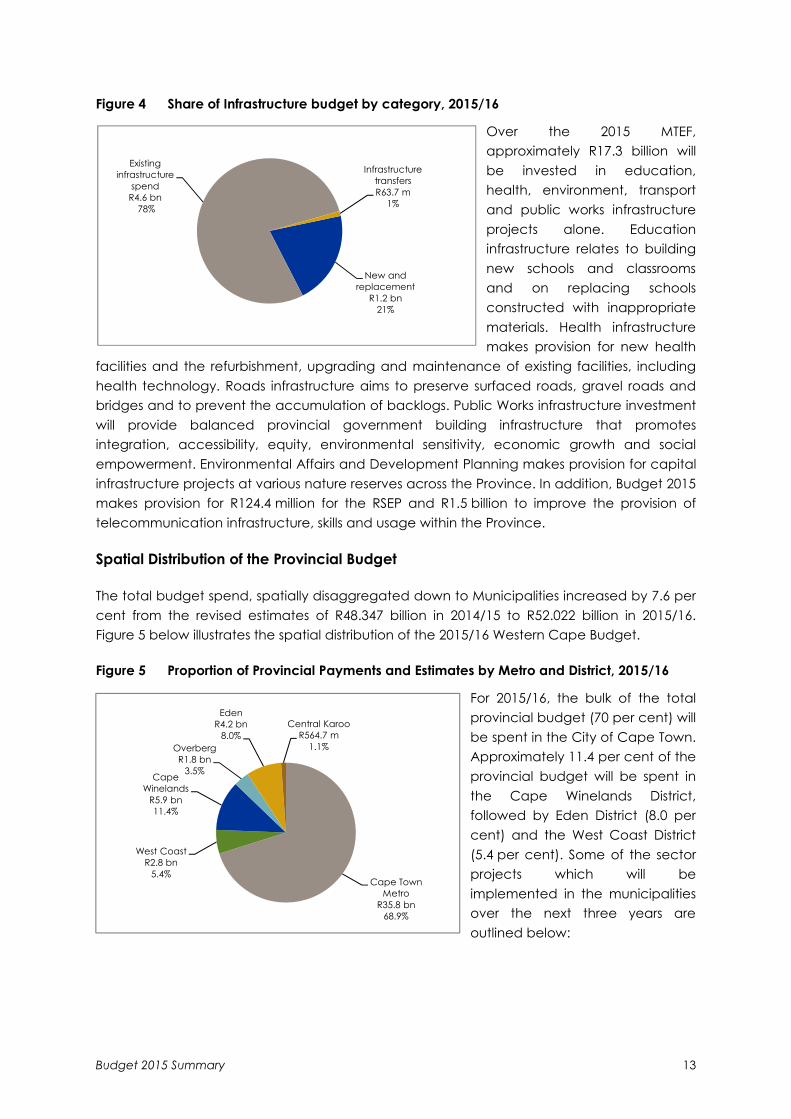
Figure 4 Share of Infrastructure budget by category, 2015/16
Over the 2015 MTEF, approximately R17.3 billion will be invested in education, health, environment, transport and public works infrastructure projects alone. Education infrastructure relates to building new schools and classrooms and on replacing schools constructed with inappropriate materials. Health infrastructure makes provision for new health
facilities and the refurbishment, upgrading and maintenance of existing facilities, including health technology. Roads infrastructure aims to preserve surfaced roads, gravel roads and bridges and to prevent the accumulation of backlogs. Public Works infrastructure investment will provide balanced provincial government building infrastructure that promotes integration, accessibility, equity, environmental sensitivity, economic growth and social empowerment. Environmental Affairs and Development Planning makes provision for capital infrastructure projects at various nature reserves across the Province. In addition, Budget 2015 makes provision for R124.4 million for the RSEP and R1.5 billion to improve the provision of telecommunication infrastructure, skills and usage within the Province.
Spatial Distribution of the Provincial Budget
The total budget spend, spatially disaggregated down to Municipalities increased by 7.6 per cent from the revised estimates of R48.347 billion in 2014/15 to R52.022 billion in 2015/16. Figure 5 below illustrates the spatial distribution of the 2015/16 Western Cape Budget.
Figure 5 Proportion of Provincial Payments and Estimates by Metro and District, 2015/16
For 2015/16, the bulk of the total provincial budget (70 per cent) will be spent in the City of Cape Town. Approximately 11.4 per cent of the provincial budget will be spent in the Cape Winelands District, followed by Eden District (8.0 per cent) and the West Coast District (5.4 per cent). Some of the sector projects which will be implemented in the municipalities over the next three years are outlined below:
New and replacement
R1.2 bn21%
Existing infrastructure
spend R4.6 bn
78%
Infrastructure transfers R63.7 m
1%
Cape Town Metro
R35.8 bn68.9%
West CoastR2.8 bn
5.4%
Cape Winelands
R5.9 bn11.4%
OverbergR1.8 bn
3.5%
EdenR4.2 bn
8.0%Central Karoo
R564.7 m1.1%
Budget 2015 Summary 14
Infrastructure and Built Environment
Water and air quality monitoring, waste management, biodiversity and climate change management;
Youth subsidy, projects to support small business and emerging contractors;
Informal settlement master planning, including the Leader Town Project;
Municipal Infrastructure Grant (MIG) project support, infrastructure growth planning, electricity master planning, asset management and water/electricity demand management; and
Integrated transport planning, transport policies and strategies; including transport operations, roads, property and EPWP.
Social and Governance
Sport development and promotion, arts/culture and language promotion, library services, heritage/museum services, geographical naming and archive services;
Land reform, engineering services and land care, land use/disaster risk management, farmer settlement and support, extension/advisory services, animal health and veterinary services, export control, agri-processing and skills development;
Expanded Partnership Programme, community/school safety and neighbourhood watch as well as forum development (with the emphasis on youth and religion);
Women’s health, health facility upgrading requirements and mobile clinics; and
Youth and crime prevention, Early Childhood Development (ECD) and partial care, addressing older/elderly person’s needs, substance abuse, family/youth development and victim empowerment.
Transfers to Public Entities
A total of R561.909 million will be transferred in 2015/16 from various provincial departments to mainly, provincial public entities and provincial government business enterprises.
Budget 2015 Summary 15
Provincial Expenditure by Economic Classification
What the actual budget buys is a representation of converting policy into an implementation plan. Departments are tasked with continuing efficiency measures and cost containment directives to ensure a stable fiscal foundation going forward. All public spending is directed at increasing service delivery efficiency and achieving economic, governance and social objectives.
It is within this context that the Western Cape Government remains committed with its focus on protecting the vulnerable of society and the continued creation of value for the public by ensuring fiscal stability, in particular the social sector (Health, Education and Social Development).
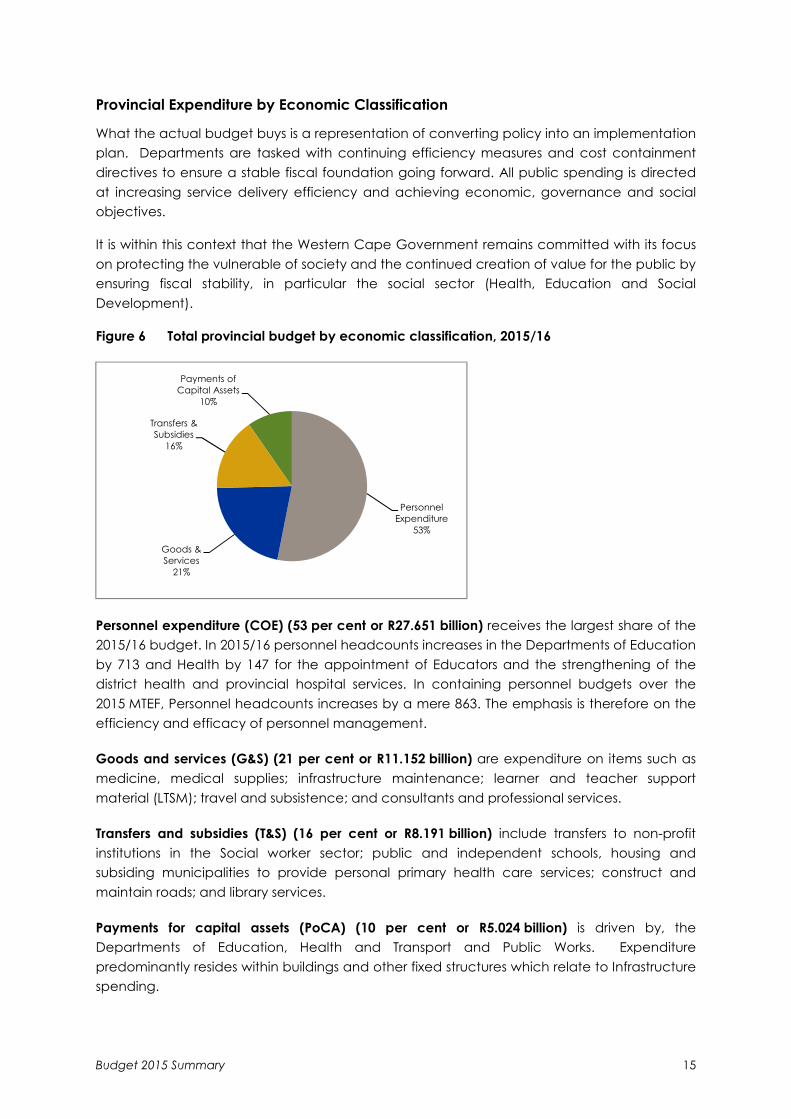
Figure 6 Total provincial budget by economic classification, 2015/16
Personnel expenditure (COE) (53 per cent or R27.651 billion) receives the largest share of the 2015/16 budget. In 2015/16 personnel headcounts increases in the Departments of Education by 713 and Health by 147 for the appointment of Educators and the strengthening of the district health and provincial hospital services. In containing personnel budgets over the 2015 MTEF, Personnel headcounts increases by a mere 863. The emphasis is therefore on the efficiency and efficacy of personnel management.
Goods and services (G&S) (21 per cent or R11.152 billion) are expenditure on items such as medicine, medical supplies; infrastructure maintenance; learner and teacher support material (LTSM); travel and subsistence; and consultants and professional services.
Transfers and subsidies (T&S) (16 per cent or R8.191 billion) include transfers to non-profit institutions in the Social worker sector; public and independent schools, housing and subsiding municipalities to provide personal primary health care services; construct and maintain roads; and library services.
Payments for capital assets (PoCA) (10 per cent or R5.024 billion) is driven by, the Departments of Education, Health and Transport and Public Works. Expenditure predominantly resides within buildings and other fixed structures which relate to Infrastructure spending.
Personnel Expenditure
53%
Goods & Services
21%
Transfers & Subsidies
16%
Payments of Capital Assets
10%
Budget 2015 Summary 16
Administration R695.453m |
3.7%
District Health Services
R7.335bn | 39%
Emergency Medical Services
R930.512m | 4.9%
Provincial Hospital Services
R2.968bn | 15.8%
Central Hospital Services
R5.317bn | 28.3%
Health Sciences and
Training R335.118m |
1.8%
Health Care Support Services
R405.397m | 2.2%
Health Facilities
Management R826.287 |
4.4%
Administration R1.410bn |
7.9%
Public Ordinary School
Education R12.854 bn |
72.4%
Independent School
Subsidies R95.384m |
0.5%
Public Special School
Education R1.059bn |
6.0%
Early Childhood
Development R619.191m |
3.5%
Infrastructure Development R1.427bn |
8.0%
Examination and Education
Related Services
R279.349m | 1.6%
Administration R174.375m |
9.2%
Social Welfare Services
R733.382m | 38.6%
Children and Families
R605.549m | 31.9%
Restorative Services
R304.332m | 16.0%
Development and Research
R80.347m | 4.2%
Administration R60 440m |
8.6%
Cultural Affairs
R110.013m | 15.6%
Library and Archive Services
R360.606m | 51.0%
Sport and Recreation R175 440 |
24.8%
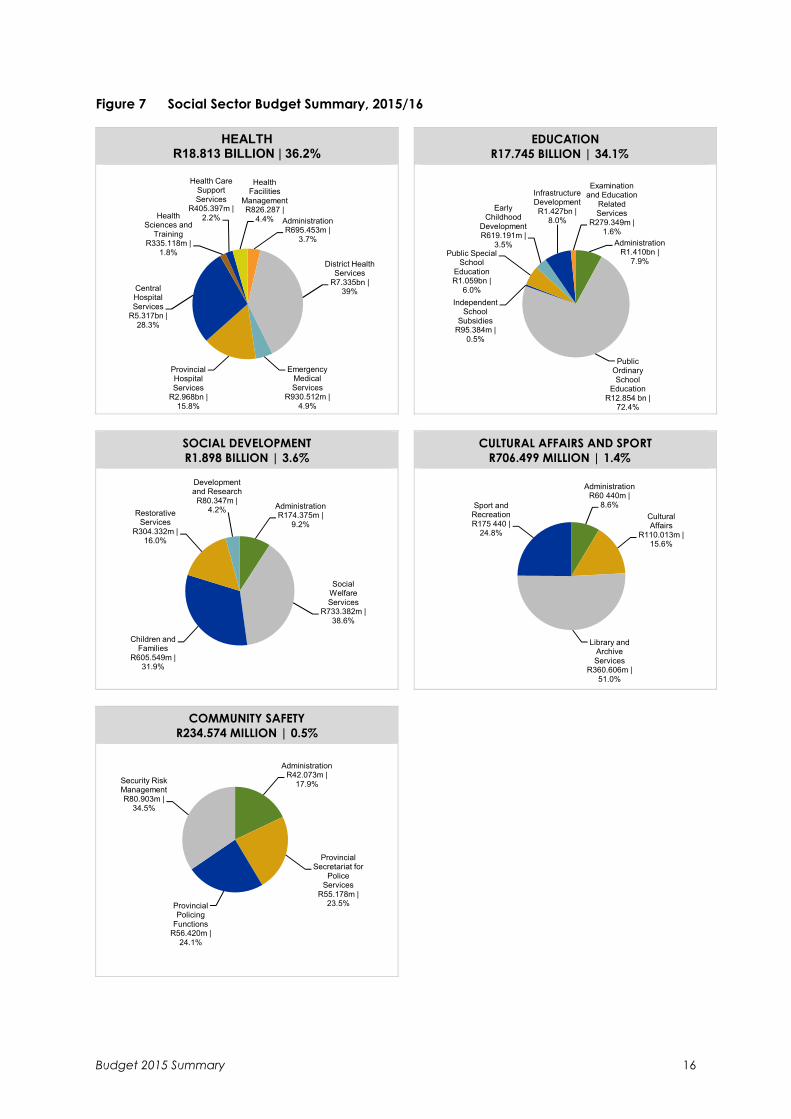
Figure 7 Social Sector Budget Summary, 2015/16
HEALTH R18.813 BILLION | 36.2%
EDUCATION R17.745 BILLION | 34.1%
SOCIAL DEVELOPMENT R1.898 BILLION | 3.6%
CULTURAL AFFAIRS AND SPORT R706.499 MILLION | 1.4%
COMMUNITY SAFETY
R234.574 MILLION | 0.5%
Administration R42.073m |
17.9%
Provincial Secretariat for
Police Services
R55.178m | 23.5% Provincial
Policing Functions
R56.420m | 24.1%
Security Risk Management R80.903m |
34.5%
Budget 2015 Summary 17
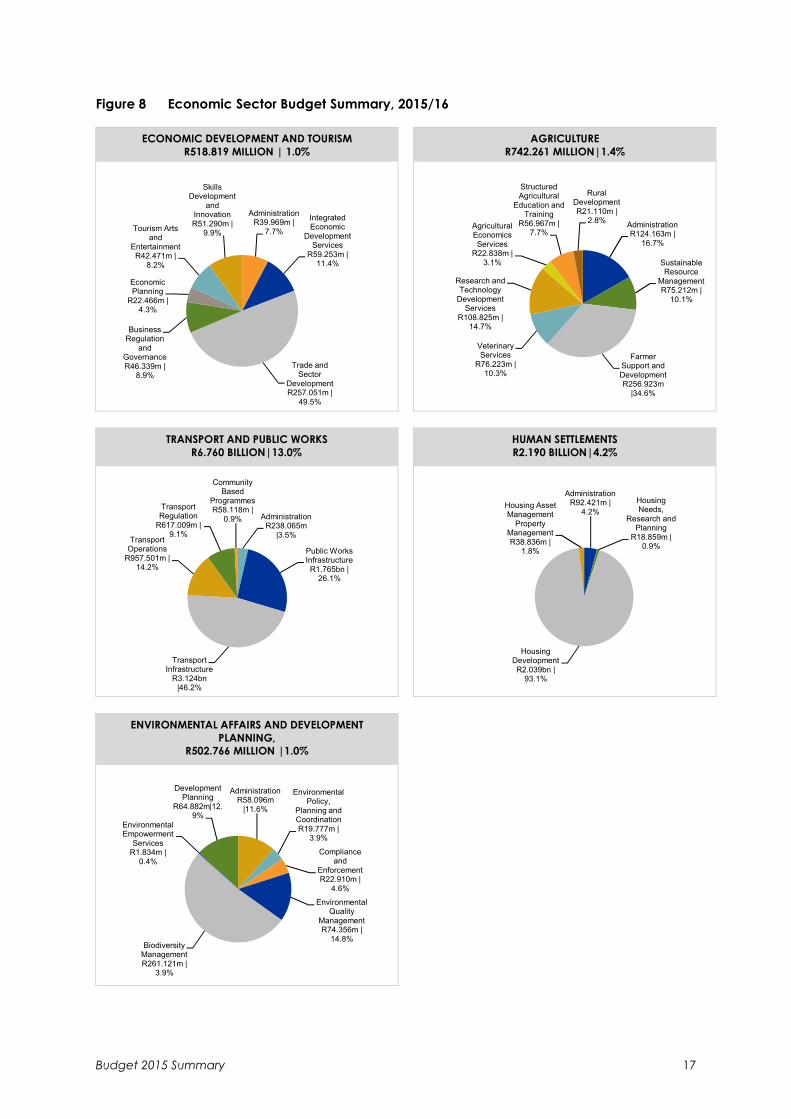
Administration R39.969m |
7.7%
Integrated Economic
Development Services
R59.253m | 11.4%
Trade and Sector
Development R257.051m |
49.5%
Business Regulation
and Governance R46.339m |
8.9%
Economic Planning
R22.466m | 4.3%
Tourism Arts and
Entertainment R42.471m |
8.2%
Skills Development
and Innovation R51.290m |
9.9%Administration R124.163m |
16.7%
Sustainable Resource
Management R75.212m |
10.1%
Farmer Support and Development R256.923m
|34.6%
Veterinary Services
R76.223m | 10.3%
Research and Technology
Development Services
R108.825m | 14.7%
Agricultural Economics Services
R22.838m | 3.1%
Structured Agricultural
Education and Training
R56.967m | 7.7%
Rural Development R21.110m |
2.8%
Administration R238.065m
|3.5%
Public Works Infrastructure R1.765bn |
26.1%
Transport Infrastructure
R3.124bn |46.2%
Transport Operations
R957.501m | 14.2%
Transport Regulation
R617.009m | 9.1%
Community Based
Programmes R58.118m |
0.9%
Administration R92.421m |
4.2%
Housing Needs,
Research and Planning
R18.859m | 0.9%
Housing Development R2.039bn |
93.1%
Housing Asset Management
Property Management R38.836m |
1.8%
Administration R58.096m
|11.6%
Environmental Policy,
Planning and Coordination R19.777m |
3.9%
Compliance and
Enforcement R22.910m |
4.6%
Environmental Quality
Management R74.356m |
14.8%Biodiversity
Management R261.121m |
3.9%
Environmental Empowerment
Services R1.834m |
0.4%
Development Planning
R64.882m|12.9%
Figure 8 Economic Sector Budget Summary, 2015/16
ECONOMIC DEVELOPMENT AND TOURISM R518.819 MILLION | 1.0%
AGRICULTURE R742.261 MILLION|1.4%
TRANSPORT AND PUBLIC WORKS R6.760 BILLION|13.0%
HUMAN SETTLEMENTS R2.190 BILLION|4.2%
ENVIRONMENTAL AFFAIRS AND DEVELOPMENT PLANNING,
R502.766 MILLION |1.0%
Budget 2015 Summary 18
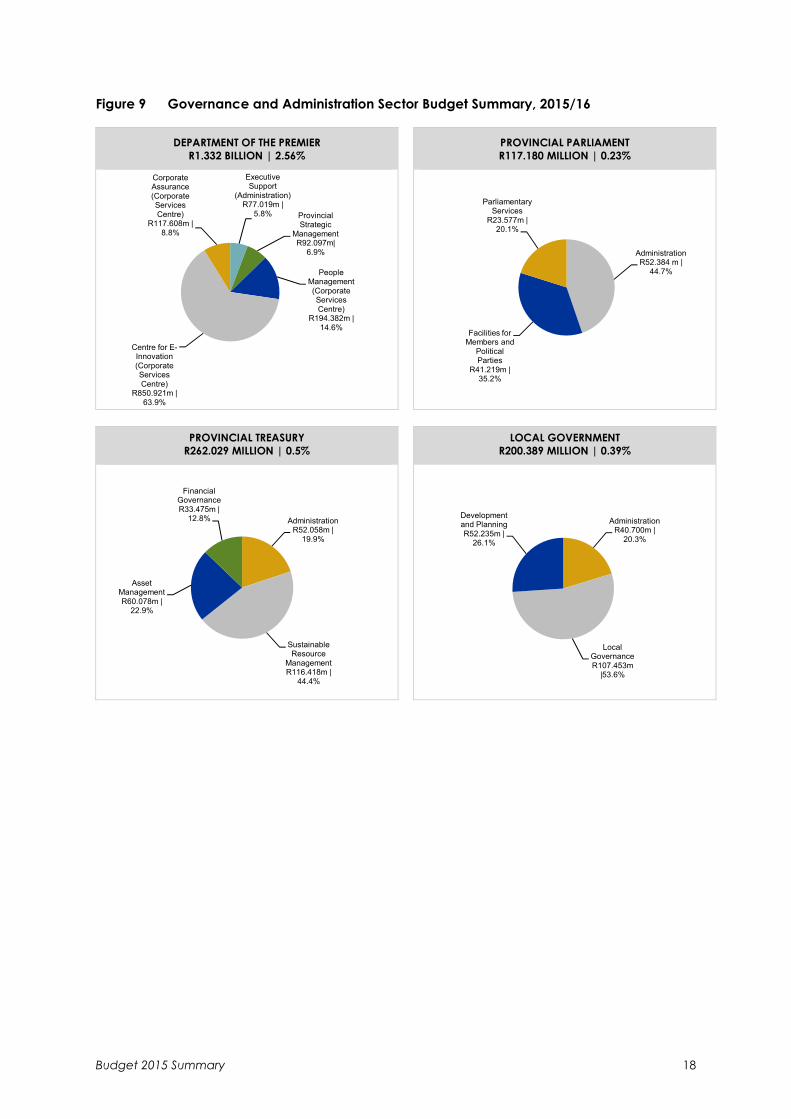
Executive Support
(Administration) R77.019m |
5.8% Provincial Strategic
Management R92.097m|
6.9%
People Management (Corporate Services Centre)
R194.382m | 14.6%
Centre for E-Innovation (Corporate Services Centre)
R850.921m | 63.9%
Corporate Assurance (Corporate Services Centre)
R117.608m | 8.8%
Administration R52.384 m |
44.7%
Facilities for Members and
Political Parties
R41.219m | 35.2%
Parliamentary Services
R23.577m | 20.1%
Administration R52.058m |
19.9%
Sustainable Resource
Management R116.418m |
44.4%
Asset Management R60.078m |
22.9%
Financial Governance R33.475m |
12.8% Administration R40.700m |
20.3%
Local Governance R107.453m
|53.6%
Development and Planning R52.235m |
26.1%
Figure 9 Governance and Administration Sector Budget Summary, 2015/16
DEPARTMENT OF THE PREMIER R1.332 BILLION | 2.56%
PROVINCIAL PARLIAMENT R117.180 MILLION | 0.23%
PROVINCIAL TREASURY
R262.029 MILLION | 0.5%
LOCAL GOVERNMENT R200.389 MILLION | 0.39%