Budget 2014 - Forsiden - regjeringen.no · 6 1) Effects ofanoilpriceincrease NOK10perbarrel. 2)...
24
• Key figures for the Norwegian economy • Main figures of the Fiscal Budget • Direct and indirect tax rates Budget 2014
Transcript of Budget 2014 - Forsiden - regjeringen.no · 6 1) Effects ofanoilpriceincrease NOK10perbarrel. 2)...
1
•Keyfiguresforthe Norwegianeconomy•Mainfiguresofthe FiscalBudget•Directandindirect taxrates
Budget 2014

2

3
Main figures of the Fiscal Budget and the Pension Fund Global excluding borrowing and lending transactions for 2013 and 2014 (NOK million)
Estimated accounts
2013
Adoptedbudget
2014
Total revenue of the Fiscal Budget 1289182 1293027Revenuefrompetroleumactivities 379731 344131Revenueexcludingpetroleumrevenue 909451 948896
Total expenditure of the Fiscal Budget 1059292 1116400Expenditureonpetroleumactivities 32502 30002Expenditureexcludingpetroleumexpenditure 1026790 1086398
=FiscalBudgetsurplusbeforetransferstothePensionFundGlobal 229890 176627
- Netcashflowfrompetroleumactivities 347229 314129
= Petroleumadjustedsurplus -117340 -137502+ TransferredfromthePensionFundGlobal 117340 137502
= FiscalBudgetsurplus 0 0+ NetallocatedtothePensionFundGlobal 229890 176627+ Fundrevenuefrominterestanddividends 128300 147900
=TotalsurplusoftheFiscalBudgetandthePensionFund 358190 324527
The borrowing and lending transactions and financing requirements of the Fiscal Budget for 2013 and 2014 (NOK million)
Estimated accounts
2013
Adoptedbudget
2014
Lending,subscriptionforshares,etc. 169970 150636- Repayment 95642 87846- FiscalBudgetsurplus 0 0
= Netfinancingrequirements 74328 62790+ Debtinstalments 66544 0
= GrossfinancingrequirementsoftheFiscalBudget 140872 62790

4
Market value of the Government Pension Fund GlobalNOKbillion.Endoftheyear
Expected real return on the Government Pension Fundand structural, non-oil deficit. NOKbillion.2014
Source:MinistryofFinance
Source:MinistryofFinance
0
1000
2000
3000
4000
5000
6000
1995 1999 2003 2007 2011 2014
0
25
50
75
100
125
150
175
200
2001 2003 2005 2007 2009 2011 2014
Structural deficit
4 pct. real return
5
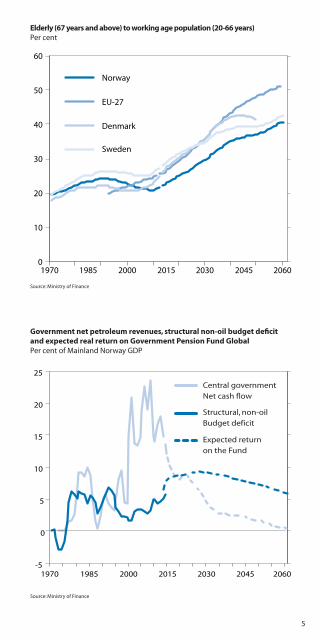
Elderly (67 years and above) to working age population (20-66 years) Percent
Government net petroleum revenues, structural non-oil budget deficit and expected real return on Government Pension Fund GlobalPercentofMainlandNorwayGDP
Source:MinistryofFinance
Source:MinistryofFinance
0
10
20
30
40
50
60
1970 1985 2000 2015 2030 2045 2060
Norway
EU-27
Denmark
Sweden
-5
0
5
10
15
20
25
1970 1985 2000 2015 2030 2045 2060
Central governmentNet cash flow
Structural, non-oilBudget deficit
Expected returnon the Fund

6
1)EffectsofanoilpriceincreaseofNOK10perbarrel.2)Incometaxandspecialtaxonpetroleumincome.AreafeeandtaxonCO
2emissionsetc.
3)Taxesandexciseduties.NetrevenuesfromSDØE(StateDirectFinancialInterest)anddividendsfromStatoil.
Sources:StatisticsNorway,MinistryofPetroleumandEnergy,MinistryofFinanceandMacrobond.
1)Applicableonlytosingleparentsreceivingtransitionalbenefit.2)From1stApril2014.3)From1stAugust2014.
Source:MinistryofFinance.
Ifthechildisnotinkindergarden,itisgivenfullcashbenefit.Ifthechildhaspartialdaycareinkindergardenat19hoursorlessperweek,thecashbenefitis50percentofthefullrate.
Key figures for the petroleum sector
2012 2013 2014 2015
Oil price sensitivity 20141
Assumptions:Crudeoilprice,NOKperbarrel 649 639 600 546- Crude oil and NLG 111 106 111 114-Naturalgas 115 107 110 111
NOKbillion:Paidtaxes2 233 207 187 164 2,5NetrevenuesfromSDØE 149 123 113 103 2,0Netcashflow3) 395 344 314 282 4,5
Child benefit and cash benefit for 2013 and 2014
2013-rules 2014-rulesChange
2013-2014
Annualchildbenefitrate NOK11640 NOK11640 -
Singleparentrate(children0-3yearsold)1 NOK7920 NOK7920 -
ExtrachildbenefitallowanceinFinnmark,NorthTromsandSvalbard NOK3840 NOK02 NOK-3840
Monthlyfullratecashbenefitforchildrenaged13-18months NOK5000 NOK60003 NOK1000
Monthlyfullratecashbenefitforchildrenaged19-23months NOK3303 NOK60003 NOK2697
7
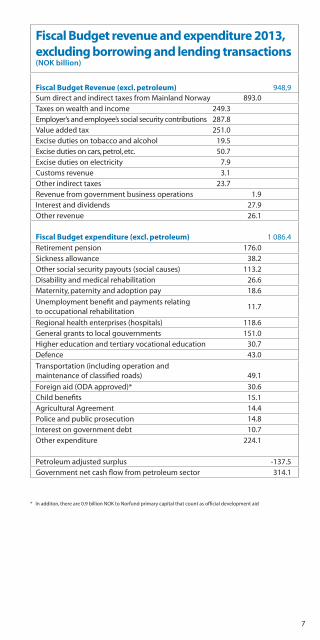
* Inadditon,thereare0.9billionNOKtoNorfundprimarycapitalthatcountasofficialdevelopmentaid
Fiscal Budget revenue and expenditure 2013, excluding borrowing and lending transactions (NOK billion)
Fiscal Budget Revenue (excl. petroleum) 948,9SumdirectandindirecttaxesfromMainlandNorway 893.0Taxesonwealthandincome 249.3Employer’sandemployee’ssocialsecuritycontributions 287.8Valueaddedtax 251.0Excisedutiesontobaccoandalcohol 19.5Excisedutiesoncars,petrol,etc. 50.7Excisedutiesonelectricity 7.9Customsrevenue 3.1Otherindirecttaxes 23.7Revenuefromgovernmentbusinessoperations 1.9Interestanddividends 27.9Otherrevenue 26.1
Fiscal Budget expenditure (excl. petroleum) 1086.4
Retirementpension 176.0Sicknessallowance 38.2Othersocialsecuritypayouts(socialcauses) 113.2Disabilityandmedicalrehabilitation 26.6Maternity,paternityandadoptionpay 18.6
Unemploymentbenefitandpaymentsrelatingtooccupationalrehabilitation
11.7
Regionalhealthenterprises(hospitals) 118.6Generalgrantstolocalgouvernments 151.0Highereducationandtertiaryvocationaleducation 30.7Defence 43.0
Transportation(includingoperationandmaintenanceofclassifiedroads) 49.1
Foreignaid(ODAapproved)* 30.6Childbenefits 15.1AgriculturalAgreement 14.4Policeandpublicprosecution 14.8Interestongovernmentdebt 10.7
Otherexpenditure 224.1
Petroleumadjustedsurplus -137.5Governmentnetcashflowfrompetroleumsector 314.1
8
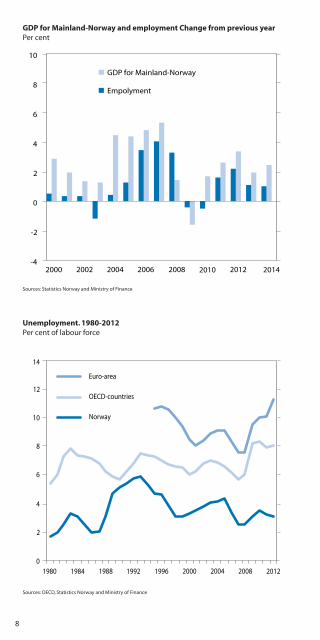
GDP for Mainland-Norway and employment Change from previous yearPercent
Unemployment. 1980-2012Percentoflabourforce
Sources:StatisticsNorwayandMinistryofFinance
Sources:OECD,StatisticsNorwayandMinistryofFinance
-4
-2
0
2
4
6
8
10
2000 2002 2004 2006 2008 2010 2012 2014
GDP for Mainland-Norway
Empolyment
0
2
4
6
8
10
12
14
1980 1984 1988 1992 1996 2000 2004 2008 2012
Euro-area
OECD-countries
Norway

9
Consumer prices. Jan. 2000-Nov. 2013Changefrompreviousyear.Percent
Oil adjusted Fiscal Budget surplus and overall Surplus of the Fiscal Budget and the Pension FundBillionNOK
Source:StatisticsNorway
Source:MinistryofFinance
-2
0
2
4
6
8
2000 2002 2004 2006 2008 2010 2012 2012
CPI (total)
CPI-ATE (adjusted for tax changes and execluding energy products)
-200
-100
0
100
200
300
400
500
600
1985 1990 1995 2000 2005 2010 2014
Oil adjusted surplus
Overall surplus of the Fiscal Budget on the Pension Fund

10
Expenditure and revenue for the fiscal year 2014 (1000 NOK)
Expenditure
Totalexpenditure Operationexpenditure
Newconstruction
Transferstoothers
Lendingandbor-rowingtransactions
RoyalHouse 201133 19153 - 181980 -
Government 328600 328600 - - -Parliament 1767700 1411400 176900 179400 -SupremeCourt 93158 93158 - - -MinistryofForeignAffairs 35618165 5742818 230187 28722300 922860MinistryofEducationandResearch 47340442 3669201 75117 43596124 -MinistryofCulture 12243247 3005116 35647 9202484 -MinistryofJusticeandPublicSecurity 33207806 28043562 1740942 3423302 -MinistryogLocalGov'tandModernisation 171223796 4726872 1251710 165245214 -MinistryofLabourandSocialInclusion 52554800 22215010 954960 10984830 18400000MinistryofHealthandCareServices 130987993 4717268 18859 126249366 2500MinistryofChildren,EqualityandSocialIncl. 35139499 7336049 60304 27743146 -MinistryofTrade,IndustryandFisheries 9528551 3695741 362000 5470810 -MinistryofAgricultureandFood 17420009 1594439 10215 15815355 -MinistryofTransportandCommunications 69639077 18750017 23198480 7690580 20000000MinistryofClimateandEnvironment 8202389 2455920 618950 5127519 -MinistryofFinance 41092311 8629911 228200 32234200 -MinistryofDefence 43029086 31516164 10859593 653329 -MinistryofPetroleumandEnergy 14357604 1393804 10000 4703800 8250000Variousexpenditure 10800000 10800000 - - -Statebanks 116555763 682691 118320 12693817 103060935Governmentpetroleumactivities 30002000 2000 30000000 - -Governmentbusinessoperations 1471205 -546949 2018154 - -NationalInsuranceScheme 384231920 - - 384231920 -GovernmentPensionFundGlobal 314129000 - - 314129000 -
Totalexpenditure 1581165254 160281945 71968538 1198278476 150636295
FiscalBudgetextheNational
InsuranceScheme
NationalInsuranceScheme
FiscalBudgetincl.theNational
InsuranceScheme
1.Revenue(exrepaymentsandtransfersfromtheGovernmentPensionFundGlobal) 1003218371 289808290 1293026661
2.Expenditure(exlending,debtinstalments) 1046297039 384231920 1430528959Operationexpenditure 160281945 - 160281945Newconstruction 71968538 - 71968538Transferstoothers 499917556 384231920 884149476TransferstotheGovernmentPensionFund 314129000 - 314129000
3.Surplusbeforeborrowingandlendingtransactionsbeforetransfer fromtheGovermentPensionFundGlobal(1-2) -43078668 -94423630 -137502298
4.TransfersfromtheGovernmentPensionFundGlobal 137502298 - 1375022985.Surplusbeforeborrowingandlendingtransactions(3+4) 94423630 -94423630 -

11
Expenditure and revenue for the fiscal year 2014 (1000 NOK)
Expenditure
Totalexpenditure Operationexpenditure
Newconstruction
Transferstoothers
Lendingandbor-rowingtransactions
RoyalHouse 201133 19153 - 181980 -
Government 328600 328600 - - -Parliament 1767700 1411400 176900 179400 -SupremeCourt 93158 93158 - - -MinistryofForeignAffairs 35618165 5742818 230187 28722300 922860MinistryofEducationandResearch 47340442 3669201 75117 43596124 -MinistryofCulture 12243247 3005116 35647 9202484 -MinistryofJusticeandPublicSecurity 33207806 28043562 1740942 3423302 -MinistryogLocalGov'tandModernisation 171223796 4726872 1251710 165245214 -MinistryofLabourandSocialInclusion 52554800 22215010 954960 10984830 18400000MinistryofHealthandCareServices 130987993 4717268 18859 126249366 2500MinistryofChildren,EqualityandSocialIncl. 35139499 7336049 60304 27743146 -MinistryofTrade,IndustryandFisheries 9528551 3695741 362000 5470810 -MinistryofAgricultureandFood 17420009 1594439 10215 15815355 -MinistryofTransportandCommunications 69639077 18750017 23198480 7690580 20000000MinistryofClimateandEnvironment 8202389 2455920 618950 5127519 -MinistryofFinance 41092311 8629911 228200 32234200 -MinistryofDefence 43029086 31516164 10859593 653329 -MinistryofPetroleumandEnergy 14357604 1393804 10000 4703800 8250000Variousexpenditure 10800000 10800000 - - -Statebanks 116555763 682691 118320 12693817 103060935Governmentpetroleumactivities 30002000 2000 30000000 - -Governmentbusinessoperations 1471205 -546949 2018154 - -NationalInsuranceScheme 384231920 - - 384231920 -GovernmentPensionFundGlobal 314129000 - - 314129000 -
Totalexpenditure 1581165254 160281945 71968538 1198278476 150636295
FiscalBudgetextheNational
InsuranceScheme
NationalInsuranceScheme
FiscalBudgetincl.theNational
InsuranceScheme
1.Revenue(exrepaymentsandtransfersfromtheGovernmentPensionFundGlobal) 1003218371 289808290 1293026661
2.Expenditure(exlending,debtinstalments) 1046297039 384231920 1430528959Operationexpenditure 160281945 - 160281945Newconstruction 71968538 - 71968538Transferstoothers 499917556 384231920 884149476TransferstotheGovernmentPensionFund 314129000 - 314129000
3.Surplusbeforeborrowingandlendingtransactionsbeforetransfer fromtheGovermentPensionFundGlobal(1-2) -43078668 -94423630 -137502298
4.TransfersfromtheGovernmentPensionFundGlobal 137502298 - 1375022985.Surplusbeforeborrowingandlendingtransactions(3+4) 94423630 -94423630 -

12
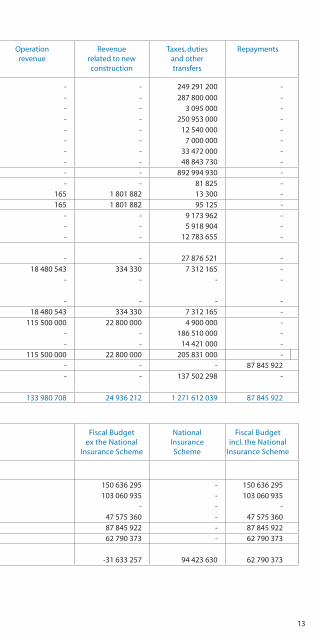
Revenue
Totalrevenue
Operationrevenue
Revenuerelatedtonewconstruction
Taxes,dutiesandothertransfers
Repayments
Taxesonwealthandincome 249291200 - - 249291200 -
Employer'sandemployee'ssocialsecuritycontributions 287800000 - - 287800000 -Customsrevenue 3095000 - - 3095000 -Valueaddedtax 250953000 - - 250953000 -Excisedutiesonalcohol 12540000 - - 12540000 -Excisedutiesontobacco 7000000 - - 7000000 -Excisedutiesoncars 33472000 - - 33472000 -Otherexciseduties 48843730 - - 48843730 -
Totaltaxesandduties 892994930 - - 892994930 -
Interestsfromgovernmentbusinessoperations 81825 - - 81825 -Otherrevenuefromgovernmentbusinessoperations 1815347 165 1801882 13300 -
Totalrevenuefromgovernmentbusinessoperations 1897172 165 1801882 95125 -
Interestsfromstatebanks 9173962 - - 9173962 -Interestsfromcashbalanceandother 5918904 - - 5918904 -DividendsexclusiveStatoil 12783655 - - 12783655 -
Interestsanddividends(exGovernmentbusinessoperationsandStatoil) 27876521 - - 27876521 -
Revenuefromtheministries 26127038 18480543 334330 7312165 -TransferfromNorgesBank - - - - -ReturnofassetsfromTheStateBankInsuranceFund - - - - -
Totalotherrevenue 26127038 18480543 334330 7312165 -
Revenuefromgovernmentpetroleumactivities 143200000 115500000 22800000 4900000 -Taxesanddutiesonextractionofpetroleum 186510000 - - 186510000 -DividendsfromStatoil 14421000 - - 14421000 -
Totalpetroleumrevenue 344131000 115500000 22800000 205831000 -Repayments 87845922 - - - 87845922
GovernmentPensionFundGlobal 137502298 - - 137502298 -
Totalrevenue 1518374881 133980708 24936212 1271612039 87845922
FiscalBudgetextheNational
InsuranceScheme
NationalInsuranceScheme
FiscalBudgetincl.theNational
InsuranceScheme
Borrowingandlendingtransactions:
6.Loans,debtinstalments,subscriptionofsharesoverall 150636295 - 150636295Loanstothestatebanks 103060935 - 103060935Debtinstalments - - -Otherloans,subscriptionofshares 47575360 - 47575360
7.Repayments 87845922 - 878459228.Loans(net)(6-7) 62790373 - 62790373
9.Overallfinancingrequirements–ofcashbalanceandborrowingandlendingassets(8-5) -31633257 94423630 62790373
13
Revenue
Totalrevenue
Operationrevenue
Revenuerelatedtonewconstruction
Taxes,dutiesandothertransfers
Repayments
Taxesonwealthandincome 249291200 - - 249291200 -
Employer'sandemployee'ssocialsecuritycontributions 287800000 - - 287800000 -Customsrevenue 3095000 - - 3095000 -Valueaddedtax 250953000 - - 250953000 -Excisedutiesonalcohol 12540000 - - 12540000 -Excisedutiesontobacco 7000000 - - 7000000 -Excisedutiesoncars 33472000 - - 33472000 -Otherexciseduties 48843730 - - 48843730 -
Totaltaxesandduties 892994930 - - 892994930 -
Interestsfromgovernmentbusinessoperations 81825 - - 81825 -Otherrevenuefromgovernmentbusinessoperations 1815347 165 1801882 13300 -
Totalrevenuefromgovernmentbusinessoperations 1897172 165 1801882 95125 -
Interestsfromstatebanks 9173962 - - 9173962 -Interestsfromcashbalanceandother 5918904 - - 5918904 -DividendsexclusiveStatoil 12783655 - - 12783655 -
Interestsanddividends(exGovernmentbusinessoperationsandStatoil) 27876521 - - 27876521 -
Revenuefromtheministries 26127038 18480543 334330 7312165 -TransferfromNorgesBank - - - - -ReturnofassetsfromTheStateBankInsuranceFund - - - - -
Totalotherrevenue 26127038 18480543 334330 7312165 -
Revenuefromgovernmentpetroleumactivities 143200000 115500000 22800000 4900000 -Taxesanddutiesonextractionofpetroleum 186510000 - - 186510000 -DividendsfromStatoil 14421000 - - 14421000 -
Totalpetroleumrevenue 344131000 115500000 22800000 205831000 -Repayments 87845922 - - - 87845922
GovernmentPensionFundGlobal 137502298 - - 137502298 -
Totalrevenue 1518374881 133980708 24936212 1271612039 87845922
FiscalBudgetextheNational
InsuranceScheme
NationalInsuranceScheme
FiscalBudgetincl.theNational
InsuranceScheme
Borrowingandlendingtransactions:
6.Loans,debtinstalments,subscriptionofsharesoverall 150636295 - 150636295Loanstothestatebanks 103060935 - 103060935Debtinstalments - - -Otherloans,subscriptionofshares 47575360 - 47575360
7.Repayments 87845922 - 878459228.Loans(net)(6-7) 62790373 - 62790373
9.Overallfinancingrequirements–ofcashbalanceandborrowingandlendingassets(8-5) -31633257 94423630 62790373
14
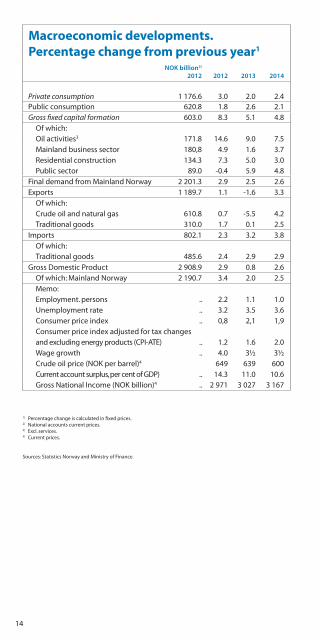
1)Percentagechangeiscalculatedinfixedprices.2)Nationalaccountscurrentprices.3)Excl.services.4)Currentprices.
Sources:StatisticsNorwayandMinistryofFinance.
Macroeconomic developments. Percentage change from previous year1
NOK billion2)
2012 2012 2013 2014
Private consumption 1176.6 3.0 2.0 2.4Publicconsumption 620.8 1.8 2.6 2.1Gross fixed capital formation 603.0 8.3 5.1 4.8
Ofwhich:Oilactivities3 171.8 14.6 9.0 7.5Mainlandbusinesssector 180,8 4.9 1.6 3.7Residentialconstruction 134.3 7.3 5.0 3.0Publicsector 89.0 -0.4 5.9 4.8
FinaldemandfromMainlandNorway 2201.3 2.9 2.5 2.6Exports 1189.7 1.1 -1.6 3.3
Ofwhich:Crudeoilandnaturalgas 610.8 0.7 -5.5 4.2Traditionalgoods 310.0 1.7 0.1 2.5
Imports 802.1 2.3 3.2 3.8
Ofwhich:Traditionalgoods 485.6 2.4 2.9 2.9
GrossDomesticProduct 2908.9 2.9 0.8 2.6Ofwhich:MainlandNorway 2190.7 3.4 2.0 2.5
Memo:Employment.persons .. 2.2 1.1 1.0Unemploymentrate .. 3.2 3.5 3.6Consumerpriceindex .. 0,8 2,1 1,9Consumerpriceindexadjustedfortaxchangesandexcludingenergyproducts(CPI-ATE) .. 1.2 1.6 2.0Wagegrowth .. 4.0 3½ 3½Crudeoilprice(NOKperbarrel)4 649 639 600Currentaccountsurplus,percentofGDP) .. 14.3 11.0 10.6GrossNationalIncome(NOKbillion)4 .. 2971 3027 3167

15
1 Therateis24.5pct.in2013and23.5pct.in2014fortaxpayersinNord-TromsandFinnmark.2 Thespecialtaxonpetroleumactivitiesandtheeconomicrenttaxonhydropowerplantsareincreasedbyonepercent-
agepointfrom2014,to51and31pct.,respectively.3 Therateis7pct.inbracket1fortaxpayersinNord-TromsandFinnmark.4 Incomefromself-employmentwithinfishingandhunting,aswellasfromchildmindinginownhome(childrenbelowtheage
of12yearsorwithspecialcareandnursingneeds),issubjecttoa7.8pct.socialsecuritycontributionin2013and8.2pct.in2014.Alowersocialsecuritycontributionrateforhuntingandfishinghastodowiththefactthatthesesectorspayaproducttaxintendedto,interalia,makeupthedifferencebetweenthe7.8/8.2pct.andthe11/11.4pct.socialsecuritycontributionrates.
5 NewEEAregulationsonregionalstateaidwillenterintoeffecton1July2014.Thesemayentailadjustmentstothesystemofregionallydifferentiatedemployers’socialsecuritycontributions,cf.Stortingdecisiononcontributions,etc.,totheNationalInsuranceSchemefor2014.
6 InzoneIa,employers’socialsecuritycontributionshallbepaidatarateof10.6pct.untilthedifferencebetweentheemployers’socialsecuritycontributionactuallypaidbytheenterpriseandtheemployers’socialsecuritycontributiontheenterprisewouldhavepaidatarateof14.1pct.equalsthedeminimisstateaidthreshold.For2014,thethresholdisNOK450,000percompany.ForroadtransportcompaniesinzoneIa,thethresholdisNOK225,000.
7 Rounded.8 Fordisabilitypensionrecipients,etc.,whoaresubjecttothetaxlimitationrule,themaximumeffectivemarginaltax
ratemaybeupto55pct.9 Including28pct.corporationtaxin2013and27pct.corporationtaxin2014.
Tax rates, allowances and thresholds in 2013 and in 2014
2013-rules
2014-rules
Change 2013-2014
Tax on ordinary income Individuals1 28pct. 27pct. -1percentagepoint
Enterprises3 28pct. 27pct. -1percentagepoint
SurtaxBracket 1 Threshold NOK509,600 NOK527,400 3.5pct. Rate3 9.0pct. 9.0pct. -Bracket 2 Threshold NOK828,300 NOK857,300 3.5pct. Rate 12.0pct. 12.0pct. -Employee’s social security contributionLowerthresholdforthepaymentofemployee’ssocialsecuritycontribution NOK39600 NOK39600 -Levellingrate 25.0pct. 25,0pct. -Rate
Wageincome 7.8pct. 8.2pct. 0.4percentagepoints
Fishing,huntingandchildminding4 7.8pct. 8.2pct. 0.4percentagepoints
Incomefromotherself-employment 11.0pct. 11.4pct. 0.4percentagepoints
Pensionincome,etc. 4.7pct. 5.1pct. 0.4percentagepoints
Employers’ social security contribution5
ZoneI 14.1pct. 14.1pct. - ZoneIa6 10.6pct. 10.6pct. - ZoneII 6.4pct. 6.4pct. - ZoneIII 5.1pct. 5.1pct. - ZoneIV 7.9pct. 7.9pct. - ZoneIVa 0.0pct. 0.0pct. - ZoneV 0.0pct. 0.0pst. -Maximum effective marginal tax rates
Wageincome,excl.employers’socialsecuritycontribution
47.8pct. 47.2pct. -0.6percentagepoints
Wageincome,incl.employers’socialsecuritycontribution
54.3pct. 53.7pct. -0.5percentagepoints
Pensionincome7 44.7pct. 44.1pct. -0.6percentagepoints
Incomefromself-employment4 51.0pct. 50.4pct. -0.6percentagepoints
Dividendsanddistributions8 48.2pct. 46.7pct. -1.5percentagepoints
Personal allowance Class1 NOK47.150 NOK48.800 3.5pct. Class29 NOK94.300 NOK72.000 -23.6pct.

16
10Thesumofthebasicallowanceagainstwageincomeandthebasicallowanceagainstpensionincomeshallnotexceedthemaximumbasicallowanceagainstwageincome,i.e.NOK84,150in2014.
11Ataxpayerearningwageincomeonlyqualifiesforthehigherofthebasicallowanceagainstwageincomeandthespecialwageincomeallowance.
12Thetaxlimitationrulealsoappliestosoleproviders,butonlyiftheyreceivetransitionalbenefit.Thetaxlimitationrulewillbeabolishedfornewtransitionalbenefitrecipientsfrom2014.
13Thetax-exemptednetincomeofmarrieddisabledpersonswhoreceiveaspousesupplementistwicethetax-exempt-ednetincomeofothermarriedpersons,i.e.NOK241,600for2014.
2013-rules
2014-rules
Change 2013-2014
Basic allowance against wage income and benefits Rate 40.0pct. 43.0pct. 3percentagepoints
Lowerlimit NOK4,000 NOK4,000 - Upperlimit10 NOK81,300 NOK84,150 3.5pct.
Basic allowance against pension income Rate 26.0pct. 27.0pct. 1percentagepoint
Lowerlimit NOK4,000 NOK4,000 - Upperlimit NOK68,050 NOK70,400 3.5pct.
Special wage income allowance11 NOK31,800 NOK31,800 -
Special disability allowance, etc NOK32,000 NOK32,000 -
Special allowance for sole providers NOK47,160 NOK48,804 3.5pct.
Special tax credit for pensionersMaximumamount NOK30,300 NOK30,000 -1.0pct.Downscaling, level 1 Threshold NOK170,750 NOK175,900 3.0pct. Rate 15.3pct. 15.3pct. -Downscaling, level 2 Threshold NOK259,800 NOK266,900 2.7pct. Rate 6.0pct. 6.0pct. -
The tax limitation rule for disability pension beneficiaries, etc.12
Levellingrate 55.0pct. 55.0pct. -Tax-exempted net income Singleperson NOK127,000NOK131,400 3.5pct. Marriedperson1313 NOK116,700 NOK120,800 3.5pct.Net wealth supplement Rate 1.5pct. 1.5pct. - Singleperson NOK200,000 NOK200,000 - Marriedperson NOK100,000 NOK100,000 -
Special allowance in Finnmark and Nord-Troms Class1 NOK15,000 NOK15,000 - Class2 NOK30,000 NOK15,000 -50pct.
Seamen’s allowance Rate 30.0pct. 30.0pct. - Upperlimit NOK80,000 NOK80,000 -
Fishermen’s allowance Rate 30.0pct. 30.0pct. - Upperlimit NOK150,000 NOK150,000 -

17
14Thespecialallowanceforhighexpensesduetoillnessiscontinuedin2014withsamerulesasin2013.15Thethresholdsapplytosingletaxpayers.Formarriedcoupleswhoareassessedjointlyforjointassets,thethresholds
aretwicethelevelsspecifiedinthetable.
2013-rules
2014-rules
Change 2013-2014
Special allowance against income from self-employment in agriculture, etc.Income-independentallowance NOK63,500 NOK63,500 -Rateapplicabletoamountsinexcessoftheincome-independentallowance 38.0pct. 38.0pct. -Maximumoverallallowance NOK166,400 NOK166,400 -
Special allowance for high expenses due to illness14
Lowerlimit NOK9,180 NOK9,180 -
Maximum annual allowance for payments to individual pension schemes NOK15000 NOK15000 -
Allowance for travel between home and workRateperkm NOK1.50/0.70 NOK1.50/0.70 -Lowerallowancelimit NOK13,950 NOK15,000 7.5pct.
Maximum allowance for donations to charities NOK12,000 NOK16,800 40pct.
Maximum allowance for paidtrade union subscriptions, etc NOK3,850 NOK3,850 -
Home investment savings scheme for people below the age of 34 years (BSU)Taxdeductionrate 20.0pct. 20.0pct. -Maximumannualsavings NOK20.000 NOK25.000 25pct.
Maximumtotalsavingsinthescheme NOK150.000 NOK200.000 33.3pct.
Parental allowance for documented childminding and childcare expensesUpper limit Onechild NOK25,000 NOK25,000 - Supplementperadditionalchild NOK15,000 NOK15,000 -
Allowance per kilometre of work-related travel using a private vehicle Allowanceperkilometre upto10,000km NOK4.05 NOK4.05 - Allowanceperkilometre inexcessof10,000km NOK3.40 NOK3.45 1.5pct.
Net wealth tax15
Local government Threshold NOK870,000 NOK1,000,000 15pct. Rate 0.7pct. 0.7pct. -Central government Threshold NOK870,000 NOK1,000,000 15pct. Rate 0.4pct. 0.3pct. -0.1percentagepoint
18
16 10pct.initialdepreciationforoperatingequipmentinassetgroupdfrom2014.17 Buildingswithadesignsosimplethattheireconomiclifemustbeassumednottoexceed20yearscanbedepreciat-
edatarateof10pct.The10pct.ratealsoappliestoinstallationswhoseeconomiclifemustbeassumednottoexceed20years.
Source:MinistryofFinance.
2013-rules
2014-rules
Change 2013-2014
Inheritance taxThreshold Level 1 NOK470,000 Abolished Abolished Level 1 NOK800,000 Abolished AbolishedRatesChildrenandparents Level 1 6pct. Abolished Abolished Level 1 10pct. Abolished AbolishedOtherbeneficiaries Level 1 8pct. Abolished Abolished Level 2 15pct. Abolished AbolishedDiscountapplicabletoshares 40pct. Abolished Abolished
Depreciation ratesAsset group a
(officeequipment,etc.) 30pct. 30pct. -Asset group b
(acquiredgoodwill) 20pct. 20pct. -Asset group c
(heavygoodsvehicles,lorries,buses,vans,etc.) 20pct. 20pct. -
Asset group d (passengercars,machineryandequipment,etc.)16 20pct. 20(30)pct. -
Asset group e(ships,vessels,rigs,etc.) 14pct. 14pct. -
Assetgroupf(aircraft,helicopters) 12pct. 12pct. -
Asset group g(facilitiesforthetransmissionanddistributionofelectricityandelectrotechnicalequipmentinpowercompanies) 5pct. 5pct. -
Assetgrouph(buildingsandinstallations,hotels,etc.)17.18 4(6/10)pct. 4(6/10)pct. -
Asset group i (officebuildings) 2pct. 2pct. -
Asset group j (technicalfacilitiesinofficebuildingsandothercommercialbuildings) 10pct. 10pct. -
Exemption card
Apersonwithincomesbelowtheexemptioncardlimitisexemptfrompay-ingtaxes.Theexemptioncardlimitfor2014is39950NOK.Theexemptioncardlimitisbasedonthelowerlimitforthepaymentofsocialsecuritycon-tributions,whichin2014is39600NOK.Sincetaxisnotcollectedifthetotaltaxpayableisbelow100NOK,thelowerlimitforpayingtaxis39950NOK.
19
1 Changestovalueaddedtaxratesarespecifiedinpercentagepoints.2 Groupa:Passengercars,class1vansandbusesshorterthan6metreswithupto17seats.Pistondisplacementisused
asthetaxcomponentforvehicleswhoseCO2emissionsarenotspecified.
Rates of indirect tax in 2013 and 2014Taxcategory 2013-
rules2014-rules
Changes in pct.
Value added tax, pct.ofsalesvalue1
Generalrate 25 25 -Reducedrate 15 15 -Lowrate 8 8 -
Tax on alcoholic beveragesSpirits-basedbeveragesinexcessof0.7pct.alcoholbyvolume,NOKperpct.alcoholandperlitre 6.85 6.98 1.9Otheralcoholicbeveragesfrom4.7to22pct.alcoholbyvolume,NOKperpct.alcoholandperlitre 4.46 4.54 1.8Otheralcoholicbeveragesupto4.7pct.alcoholbyvolume,NOKperlitre
a)0.0–0.7pct.alcoholbyvolume - - -b)0.7–2.7pct.alcoholbyvolume 3.06 3.12 2.0c)2.7–3.7pct.alcoholbyvolume 11.52 11.74 1.9d)3.7–4.7pct.alcoholbyvolume 19.96 20.34 1,9
Tax on tobacco products
Cigars,NOKper100grams 235 239 1.7Cigarettes,NOKper100units 235 239 1.7Smokingtobacco,NOKper100grams 235 239 1.7Snuff,NOKper100grams 95 97 2.1Chewingtobacco,NOKper100grams 95 97 2.1Cigarettepaper,NOKper100units 3.58 3.65 2.0
Motor vehicle registration taxPassenger cars, etc. Tax group a2
Weight,NOKperkgfirst1,150kg 37.59 38.30 1.9next250kg 81.94 83.50 1.9next100kg 163.90 167.01 1.9remainder 190.61 194.23 1.9
Enginepower,NOKperkWfirst70kW(65kWin2013) 0 0 -next30kW(25kWin2013) 275.00 240.00 -12.7next40kW 790.00 695.00 -12.0remainder 1960.00 1720.00 -12.2
NOXemissions,NOKpermg/km 35.00 46.14 31.8
CO2emissions,NOKperg/km
first105g/km(110g/kmin2013) 0 0 -next15g/km 764.00 779.00 2.0next40g/km 770.00 785.00 1.9next70g/km 1796.00 1830.00 1.9remainder 2883.00 2938.00 1.9

20
3 Groupb:Class2vans.Changespecifiedinpercentagepoints.ThehighestleveloftheCO2componentdoesnotapplyto
groupb,andthesecond-highestlevelwillremainat25pct.ofthetaxonpassengercarsin2014aswell.4 Groupc:Campervans.Changespecifiedinpercentagepoints.NoNO
Xcomponentapplicable.
5 Grouph:Taxisandvehiclesfordisabledpersons.Changespecifiedinpercentagepoints.ThetwohighestlevelsoftheCO
2componentdonotapplytogrouphin2014.
6 Groupj:Busesshorterthan6metreswithupto17seats,ofwhichatleast10areforward-facing.Changespecifiedinpercentagepoints.ThehighestleveloftheCO
2componentdoesnotapplytogroupj.NoNO
Xcomponentapplicable.
Taxcategory 2013-rules
2014-rules
Changesin pct.
allowanceforemissionsbelow105g/km(110g/kmin2013),applicabledownto50g/kmandonlytovehiclesemittinglessthan105g/km(110g/kmin2013) 814.00 829.00 1.8
allowanceforemissionsbelow50g/km,onlyapplicabletovehiclesemittinglessthan50g/km 966.00 984.00 1.9
Vans class 2. Tax group b.3
weight,pct.ofpassengercartax 22 22 -enginepower,pct.ofpassengercartax 22 22 -NO
Xemissions,pct.ofpassengercartax 25 30 5
CO2emissions,pct.ofpassengercartax 25 30 5
Camper vans. Tax group c.4
pct.ofpassengercartax 22 22 -Weasels. Tax group e,
pct.ofvaluetaxbase 36 36 -Motorbikes. Tax group f,
taxperunit,NOK 10837 11043 1.9Enginepowertax,NOKperkW
first11kW 0 0 -remainder 482.28 491.44 1.9
Pistondisplacementtax,NOKpercm3
first125cm3 0 0 -next775cm3 37.22 37.93 1.9remainder 81.62 83.17 1.9
Snowmobiles. Tax group gWeight,NOKperkg
first100kg 15.27 15.56 1.9next100kg 30.55 31.13 1.9remainder 61.07 62.23 1.9
Enginepower,NOKperkWfirst20kW 40.74 41.51 1.9next20kW 81.44 82.99 1.9remainder 162.87 165.96 1.9
Pistondisplacement,NOKpercm3first200cm3 3.19 3.25 1.9next200cm3 6.37 6.49 1.9remainder 12.73 12.97 1.9
Taxis. Tax group h.5
weight,pct.ofpassengercartax 40 40 -enginepower,pct.ofpassengercartax 40 40 -NO
Xemissions,pct.ofpassengercartax 100 100 -
CO2emissions,pct.ofpassengercartax 100 100 -
Vintage cars. Tax group i,taxperunit,NOK 3569 3637 1.9
Minibuses. Tax group j.6
pct.ofpassengercartax 40 40 -

21
7 Petrolwithasulphurcontentof10ppmorlower.8 Dieselwithasulphurcontentof10ppmorlower.Thisratealsoappliestobiodieselthatdoesnotmeetthesustaina-
bilitycriteria.
Taxcategory 2013-rules
2014-rules
Changesin pct.
Annual motor vehicle tax, NOKperyear Petrolvehiclesanddieselvehicleswithafactory-fittedparticlefilter 2940 2995 1.9
Dieselvehicleswithoutafactory-fittedparticlefilter 3425 3490 1.9Caravans 1100 1120 1.8Motorbikes 1800 1835 1.9Tractors,mopeds,etc. 415 425 2.4
Annual weight-based tax, NOKperyear variable variable 12.5
Re-registration tax variable variable -10.8
Marine engine tax, NOKperhp 158.50 161.50 1.9
Road usage tax on engine fuel,perlitre
Petrol7 4.78 4.87 1.9Autodiesel8 3.75 3.82 1.9Biodieselmeetingthesustainabilitycriteria 1.87 1.91 2.1
Electricity tax, NOKperkWh
Generalrate 11.61 12.39 6.7Reducedrate 0.45 0.45 -
Base tax on mineral oil, etc.Mineraloil,NOKperlitre 1.018 1.557 52.9
Mineraloilinthewood-processingindustry,productionofdyesandpigments,NOKperlitre 0.126 0.126 -
Tax on lubricating oil,NOKperlitre 1.90 1.94 2.1
CO2 tax
Petroleumactivities,NOKperlitreorSm3 0.96 0.98 2.1Mineraloil,generalrate,NOKperlitre 0.61 0.88 44.3Mineraloilsubjecttoroadusagetax,NOKperlitre 0.61 0.62 1.6
MineraloilfordomesticaviationcoveredbytheEUETS,NOKperlitre 0.43 0.56 30.2
Mineraloilforotherdomesticaviation,NOKperlitre 0.71 0.84 18.3
Mineraloilforthewood-processing,herringmealandfishmealindustries,NOKperlitre 0.31 0.31 -
Mineraloilforfishingandcatchingininshorewaters,NOKperlitre 0.13 0.26 100.0
Petrol,NOKperlitre 0.91 0.93 2.2Naturalgas,NOKperSm3 0.46 0.66 43.5LPG,NOKperkg 0.68 0.99 45.6Reducedratefornaturalgas,NOKperSm3 0.05 0.05 -

22
Source:MinistryofFinance.
Taxcategory 2013-rules
2014-rules
Changesin pct.
Sulphur tax,NOKperlitre 0.078 0.079 1.3
Tax on NOX emissions,NOKperkg 17.01 17.33 1.9
Tax on the final disposal of waste,NOKpertonne
Taxonbiodegradablewastedepositedpursuanttoanexemptiongrantedbythepollutioncontrolauthorities 479 488 1.9Taxonthedepositingofotherwaste 289 294 1.7
Tax on trichloroethene (TRI) and tetrachloroethene (PER), NOKperkg 65.41 66.65 1.9
Tax on hydrofluorocarbons (HFC) and perfluoro-carbons (PFC), NOKpertonneofCO2equivalents 229 330 44.1
Tax on chocolate and sugar products, etc., NOKperkg 18.56 18.91 1.9
Tax on non-alcoholic beverages
Finishedproducts,NOKperlitre 3.06 3.12 2.0Concentrate(syrup),NOKperlitre 18.68 19.03 1.9
Sugar tax,NOKperkg 7.18 7.32 1.9
Tax on beverage packaging,NOKperunit
Basetax,disposablepackaging 1.08 1.10 1.9Environmentaltax
a)Glassandmetals 5.24 5.34 1.9b)Plastics 3.16 3.22 1.9c)Cartonsandcardboard 1.30 1.32 1.5
Stamp duty,pct.ofsalesprice 2.5 2.5 -

23
Pho
to:JiriH
avran
The Norwegian Ministry of Finance is located in the Govern-ment Administration Complex, Akersgata 40, Oslo. The Ministry has 7 departments with a total of 314 employees.
AdministrativeAffairsDepartement 50AssetManagementDepartment 24BudgetDepartment 54FinancialMarketsDepartment 29TaxPolicyDepartment 75TaxLawDepartment 33EconomicPolicyDepartment 51
Theeductionalbackgroundofouremployeesisasfollows:
Wehire15–25newemployeeseachyearandarelookingforskilledeconomists,lawyersandsocialscientists.Ourvacanciesareadvertised(continually)atwww.jobbifinans.dep.no
Economy47%
Law29%
Socialscience8%
Otherhighereducation
8%
Lessthanthreeyearsofhigher
education4%
Nohighereducation
4%

Budget 2014
Keywebsites:
MinistryofFinance:http://www.regjeringen.no/fin
FiscalBudget:http://www.statsbudsjettet.no
TheTaxAdministration:http://www.skatteetaten.no
TheCustomsandExciseAuthorities:http://www.toll.no
EconomyforYouth:http://www.ungokonomi.no
Published by Ministry of FinanceMailingaddress:P.O.Box8008Dep,0030OsloVisitingaddress:Akersgt.40Telephone:22249090Internet:http://www.regjeringen.no/finE-mail:[email protected]
Public institutions may order additional copies from:NorwegianGovernmentSecurityandServiceOrganisationInternet:www.publikasjoner.dep.noE-mail:[email protected]:22242000
Publicationnumber:R-0638BISBN:978-82-91092-92-8
Print:DSS02/14-300
182 631 1 022 835 974 105 437 705 290 539 2
44 789 245 167 170 900 123 800 192 538 1196
78,9 553
4 069 146 629 6 609 415 866 264 717 220389 -11 797 -118 088 -153 780 8 370 118 153 780 +3 427 2341 84 144
1 532,3 1 593,8 1 743,0 1 945,7 2 159,6 2 277,1 2 548,3 101,0 1 155,1 1 256,3 1 455,0 1 626,6 1 697,8 1 946,4 307,7 319,0 37,7 494,6 578,9 553,0 718,5 281,0 251,4 361,3 465,3