
Fordham Intellectual Property, Media ... - Fordham University
Upload
david-de-wolfCategory
view
146download
5
Identifying Commodity Price BubblesPotential Risk and Rewards of Holding Commodities for Retail Investor
Portfolios
David De Wolf
Fordham University
June, 17 2016
David De Wolf (Fordham University) Identifying Commodity Price Bubbles June, 17 2016 1 / 27
Table of Contents
1 Research question
2 Data
3 Econometric testsSADF (PWY)GSADF (PSY)
4 ResultsBubble testsPortfolio creation
5 Conclusion
David De Wolf (Fordham University) Identifying Commodity Price Bubbles June, 17 2016 2 / 27
Research question
Research Question
1 Can we detect bubbles in commodity markets based on the PWY andPSY test during the past 26 years?
2 If we can detect bubbles, can we build pro�table trading strategiesbased on historical information that we have obtained?
David De Wolf (Fordham University) Identifying Commodity Price Bubbles June, 17 2016 3 / 27
Data
Data Selection
Source: Thompson Reuters Datastream
Four commodities: Gold, Oil, Corn and Soybean
Data frame: 03/04/1990 - 29/04/2016
Frequency: daily observations (6544 full sample)
Continuous Futures prices
David De Wolf (Fordham University) Identifying Commodity Price Bubbles June, 17 2016 4 / 27
Econometric tests SADF (PWY)
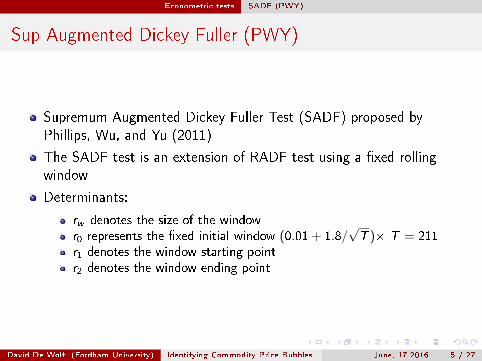
Sup Augmented Dickey Fuller (PWY)
Supremum Augmented Dickey Fuller Test (SADF) proposed byPhillips, Wu, and Yu (2011)
The SADF test is an extension of RADF test using a �xed rollingwindow
Determinants:
rw denotes the size of the windowr0 represents the �xed initial window (0.01 + 1.8/
√T )Ö T = 211
r1 denotes the window starting pointr2 denotes the window ending point
David De Wolf (Fordham University) Identifying Commodity Price Bubbles June, 17 2016 5 / 27
Econometric tests SADF (PWY)
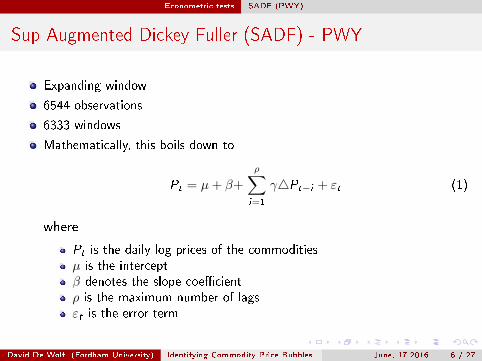
Sup Augmented Dickey Fuller (SADF) - PWY
Expanding window
6544 observations
6333 windows
Mathematically, this boils down to
Pt = µ+ β+
ρ∑i=1
γ4Pt−i + εt (1)
where
Pt is the daily log prices of the commoditiesµ is the interceptβ denotes the slope coe�cientρ is the maximum number of lagsεt is the error term
David De Wolf (Fordham University) Identifying Commodity Price Bubbles June, 17 2016 6 / 27
Econometric tests SADF (PWY)
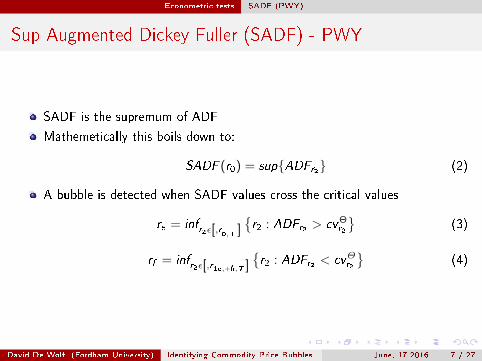
Sup Augmented Dickey Fuller (SADF) - PWY
SADF is the supremum of ADF
Mathemetically this boils down to:
SADF (r0) = sup{ADFr2} (2)
A bubble is detected when SADF values cross the critical values
re = infr2ε[,r
0,T ]{r2 : ADFr2 > cvΘ
r2
}(3)
rf = infr2ε[,r1e,+h,T ]
{r2 : ADFr2 < cvΘr2
}(4)
David De Wolf (Fordham University) Identifying Commodity Price Bubbles June, 17 2016 7 / 27
Econometric tests GSADF (PSY)
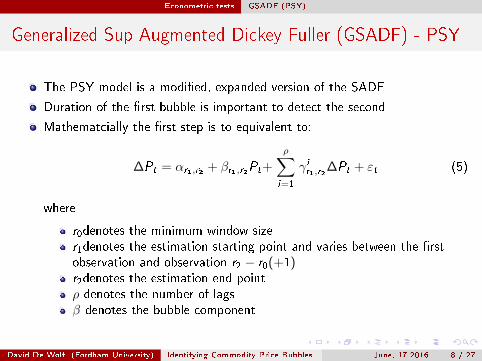
Generalized Sup Augmented Dickey Fuller (GSADF) - PSY
The PSY model is a modi�ed, expanded version of the SADF
Duration of the �rst bubble is important to detect the second
Mathematcially the �rst step is to equivalent to:
∆Pt = αr1,r2 + βr1,r2Pt+
ρ∑i=1
γ i
r1,r2∆Pt + εt (5)
where
r0denotes the minimum window sizer1denotes the estimation starting point and varies between the �rstobservation and observation r2 − r0(+1)r2denotes the estimation end pointρ denotes the number of lagsβ denotes the bubble component
David De Wolf (Fordham University) Identifying Commodity Price Bubbles June, 17 2016 8 / 27
Econometric tests GSADF (PSY)
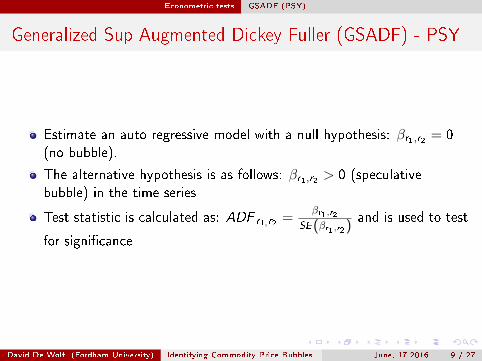
Generalized Sup Augmented Dickey Fuller (GSADF) - PSY
Estimate an auto regressive model with a null hypothesis: βr1,r2 = 0(no bubble).
The alternative hypothesis is as follows: βr1,r2 > 0 (speculativebubble) in the time series
Test statistic is calculated as: ADF r1,r2 =βr1,r2
SE(βr1,r2)and is used to test
for signi�cance
David De Wolf (Fordham University) Identifying Commodity Price Bubbles June, 17 2016 9 / 27
Econometric tests GSADF (PSY)
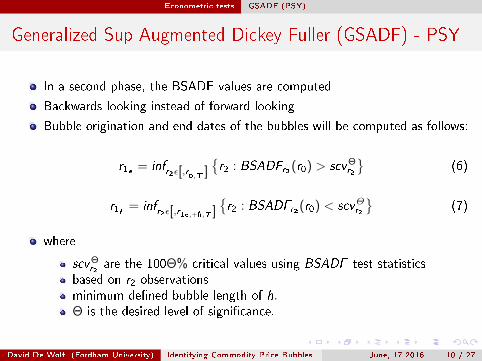
Generalized Sup Augmented Dickey Fuller (GSADF) - PSY
In a second phase, the BSADF values are computed
Backwards looking instead of forward looking
Bubble origination and end dates of the bubbles will be computed as follows:
r1e = infr2ε[,r
0,T ]{r2 : BSADFr2(r0) > scvΘ
r2
}(6)
r1f = infr2ε[,r1e,+h,T ]
{r2 : BSADFr2(r0) < scvΘr2
}(7)
where
scvΘr2
are the 100Θ% critical values using BSADF test statisticsbased on r2 observationsminimum de�ned bubble length of h.Θ is the desired level of signi�cance.
David De Wolf (Fordham University) Identifying Commodity Price Bubbles June, 17 2016 10 / 27
Econometric tests GSADF (PSY)
Generalized Sup Augmented Dickey Fuller (GSADF) - PSY
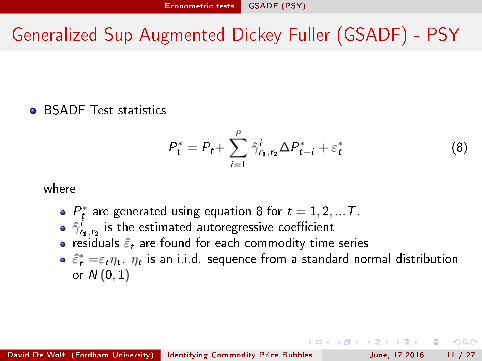
BSADF Test statistics
P∗t = Pt+
ρ∑i=1
γ̂ i
r1,r2∆P∗t−i + ε∗t (8)
where
P∗t are generated using equation 8 for t = 1, 2, ...T .γ̂ ir1,r2 is the estimated autoregressive coe�cientresiduals ε̂t are found for each commodity time seriesε̂∗t =εtηt . ηt is an i.i.d. sequence from a standard normal distributionor N (0, 1)
David De Wolf (Fordham University) Identifying Commodity Price Bubbles June, 17 2016 11 / 27
Econometric tests GSADF (PSY)
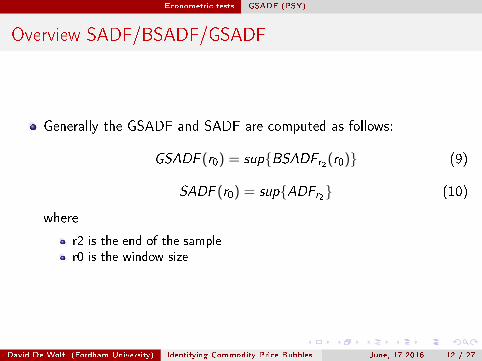
Overview SADF/BSADF/GSADF
Generally the GSADF and SADF are computed as follows:
GSADF (r0) = sup{BSADFr2(r0)} (9)
SADF (r0) = sup{ADFr2} (10)
where
r2 is the end of the sampler0 is the window size
David De Wolf (Fordham University) Identifying Commodity Price Bubbles June, 17 2016 12 / 27
Results Bubble tests
Introduction to the SADF and GSADF
SADF/ GSADF test statistics and critical values
lagged order of 1
95 % con�dence levels
200 and 500 bootstrapping iterations
Trade o� between daily and weekly observations
David De Wolf (Fordham University) Identifying Commodity Price Bubbles June, 17 2016 13 / 27
Results Bubble tests
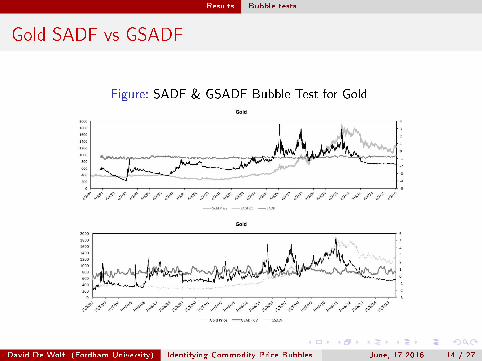
Gold SADF vs GSADF
Figure: SADF & GSADF Bubble Test for Gold
David De Wolf (Fordham University) Identifying Commodity Price Bubbles June, 17 2016 14 / 27
Results Bubble tests
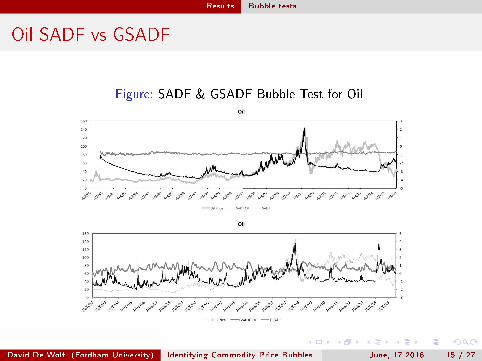
Oil SADF vs GSADF
Figure: SADF & GSADF Bubble Test for Oil
David De Wolf (Fordham University) Identifying Commodity Price Bubbles June, 17 2016 15 / 27
Results Bubble tests
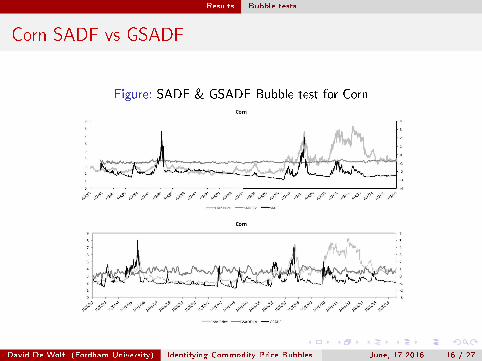
Corn SADF vs GSADF
Figure: SADF & GSADF Bubble test for Corn
David De Wolf (Fordham University) Identifying Commodity Price Bubbles June, 17 2016 16 / 27
Results Bubble tests
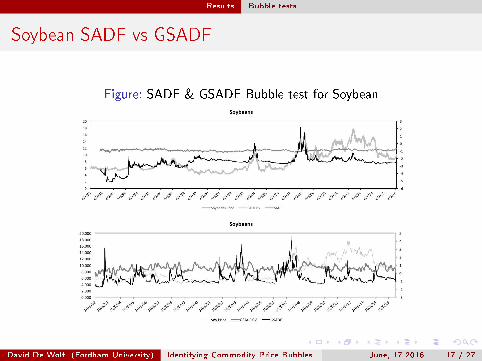
Soybean SADF vs GSADF
Figure: SADF & GSADF Bubble test for Soybean
David De Wolf (Fordham University) Identifying Commodity Price Bubbles June, 17 2016 17 / 27
Results Bubble tests
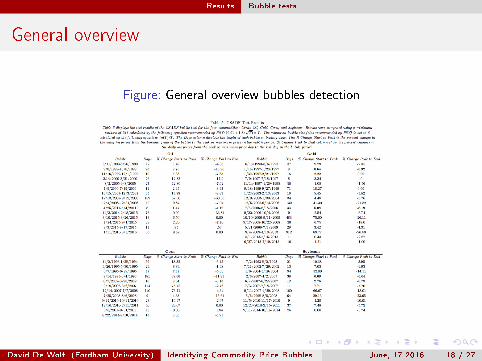
General overview
Figure: General overview bubbles detection
David De Wolf (Fordham University) Identifying Commodity Price Bubbles June, 17 2016 18 / 27
Results Portfolio creation
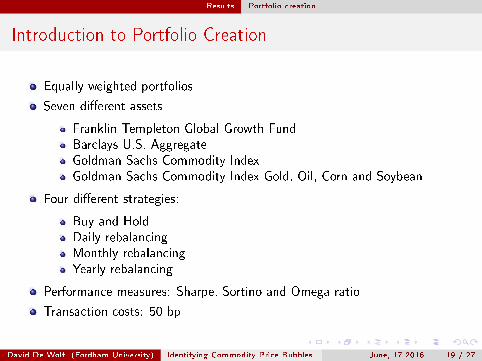
Introduction to Portfolio Creation
Equally weighted portfolios
Seven di�erent assets
Franklin Templeton Global Growth FundBarclays U.S. AggregateGoldman Sachs Commodity IndexGoldman Sachs Commodity Index Gold, Oil, Corn and Soybean
Four di�erent strategies:
Buy and HoldDaily rebalancingMonthly rebalancingYearly rebalancing
Performance measures: Sharpe, Sortino and Omega ratio
Transaction costs: 50 bp
David De Wolf (Fordham University) Identifying Commodity Price Bubbles June, 17 2016 19 / 27
Results Portfolio creation
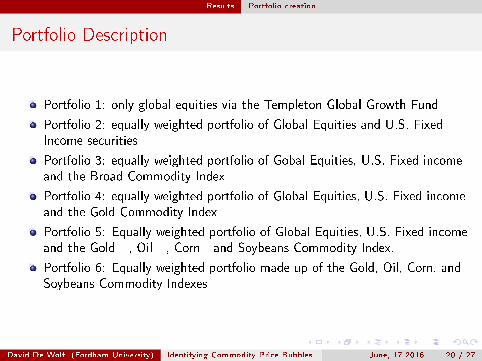
Portfolio Description
Portfolio 1: only global equities via the Templeton Global Growth Fund
Portfolio 2: equally weighted portfolio of Global Equities and U.S. FixedIncome securities
Portfolio 3: equally weighted portfolio of Gobal Equities, U.S. Fixed incomeand the Broad Commodity Index
Portfolio 4: equally weighted portfolio of Global Equities, U.S. Fixed incomeand the Gold Commodity Index
Portfolio 5: Equally weighted portfolio of Global Equities, U.S. Fixed incomeand the Gold - , Oil - , Corn - and Soybeans Commodity Index.
Portfolio 6: Equally weighted portfolio made up of the Gold, Oil, Corn, andSoybeans Commodity Indexes
David De Wolf (Fordham University) Identifying Commodity Price Bubbles June, 17 2016 20 / 27
Results Portfolio creation
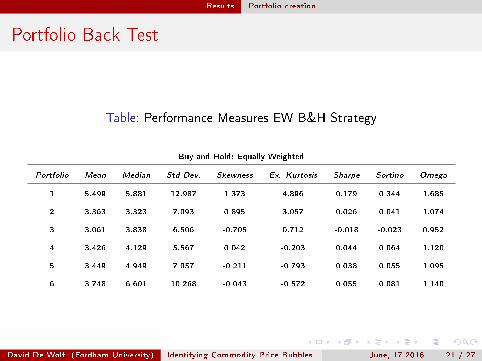
Portfolio Back Test
Table: Performance Measures EW B&H Strategy
Buy and Hold: Equally Weighted
Portfolio Mean Median Std Dev. Skewness Ex. Kurtosis Sharpe Sortino Omega
1 5.499 5.881 12.987 1.373 4.896 0.179 0.344 1.685
2 3.363 3.323 7.093 0.895 3.057 0.026 0.041 1.074
3 3.061 3.838 6.506 -0.705 0.712 -0.018 -0.023 0.952
4 3.426 4.129 5.567 0.042 -0.203 0.044 0.064 1.120
5 3.449 4.949 7.057 -0.211 -0.793 0.038 0.055 1.095
6 3.748 6.601 10.268 -0.043 -0.572 0.055 0.081 1.140
David De Wolf (Fordham University) Identifying Commodity Price Bubbles June, 17 2016 21 / 27
Results Portfolio creation
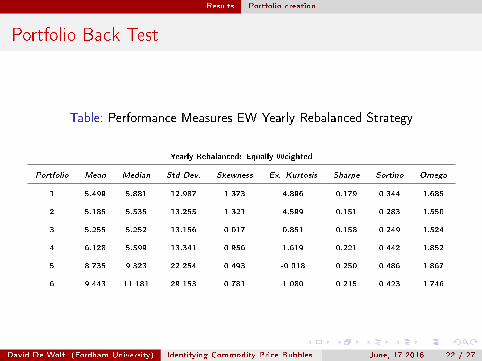
Portfolio Back Test
Table: Performance Measures EW Yearly Rebalanced Strategy
Yearly Rebalanced: Equally Weighted
Portfolio Mean Median Std Dev. Skewness Ex. Kurtosis Sharpe Sortino Omega
1 5.499 5.881 12.987 1.373 4.896 0.179 0.344 1.685
2 5.185 5.535 13.255 1.321 4.599 0.151 0.283 1.550
3 5.255 5.252 13.156 0.017 0.851 0.158 0.249 1.524
4 6.128 5.599 13.341 0.956 1.619 0.221 0.442 1.852
5 8.735 9.323 22.254 0.493 -0.018 0.250 0.486 1.867
6 9.443 11.181 29.153 0.781 1.080 0.215 0.423 1.746
David De Wolf (Fordham University) Identifying Commodity Price Bubbles June, 17 2016 22 / 27
Results Portfolio creation
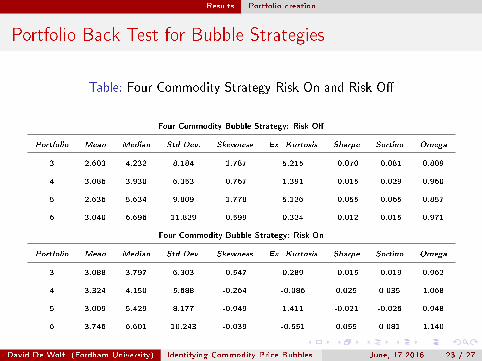
Portfolio Back Test for Bubble Strategies
Table: Four Commodity Strategy Risk On and Risk O�
Four Commodity Bubble Strategy: Risk O�
Portfolio Mean Median Std Dev. Skewness Ex. Kurtosis Sharpe Sortino Omega
3 2.603 4.232 8.184 -1.787 5.215 -0.070 -0.081 0.809
4 3.086 3.930 6.353 -0.767 1.391 -0.015 -0.029 0.960
5 2.636 5.634 9.809 -1.778 5.126 -0.055 -0.065 0.857
6 3.040 6.696 11.829 -0.599 0.324 -0.012 -0.015 0.971
Four Commodity Bubble Strategy: Risk On
Portfolio Mean Median Std Dev. Skewness Ex. Kurtosis Sharpe Sortino Omega
3 3.088 3.797 6.303 -0.547 0.289 -0.015 -0.019 0.962
4 3.324 4.150 5.688 -0.264 -0.086 0.025 0.035 1.068
5 3.009 5.429 8.177 -0.949 1.411 -0.021 -0.026 0.948
6 3.746 6.601 10.243 -0.039 -0.551 0.055 0.081 1.140
David De Wolf (Fordham University) Identifying Commodity Price Bubbles June, 17 2016 23 / 27
Results Portfolio creation
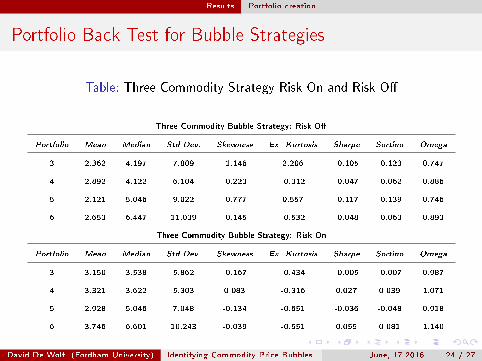
Portfolio Back Test for Bubble Strategies
Table: Three Commodity Strategy Risk On and Risk O�
Three Commodity Bubble Strategy: Risk O�
Portfolio Mean Median Std Dev. Skewness Ex. Kurtosis Sharpe Sortino Omega
3 2.362 4.197 7.809 -1.146 2.206 -0.105 -0.123 0.747
4 2.892 4.122 6.104 -0.223 -0.312 -0.047 -0.062 0.886
5 2.121 5.046 9.022 -0.777 0.557 -0.117 -0.139 0.746
6 2.653 6.447 11.039 -0.145 -0.532 -0.048 -0.063 0.893
Three Commodity Bubble Strategy: Risk On
Portfolio Mean Median Std Dev. Skewness Ex. Kurtosis Sharpe Sortino Omega
3 3.150 3.538 5.862 -0.167 -0.434 -0.005 -0.007 0.987
4 3.321 3.622 5.303 0.083 -0.316 0.027 0.039 1.071
5 2.928 5.046 7.048 -0.134 -0.651 -0.036 -0.048 0.918
6 3.746 6.601 10.243 -0.039 -0.551 0.055 0.081 1.140
David De Wolf (Fordham University) Identifying Commodity Price Bubbles June, 17 2016 24 / 27
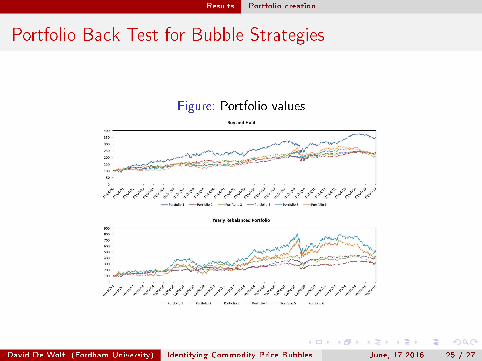
Results Portfolio creation
Portfolio Back Test for Bubble Strategies
Figure: Portfolio values
David De Wolf (Fordham University) Identifying Commodity Price Bubbles June, 17 2016 25 / 27
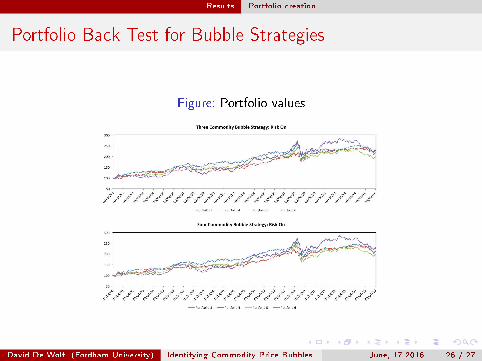
Results Portfolio creation
Portfolio Back Test for Bubble Strategies
Figure: Portfolio values
David De Wolf (Fordham University) Identifying Commodity Price Bubbles June, 17 2016 26 / 27
Conclusion
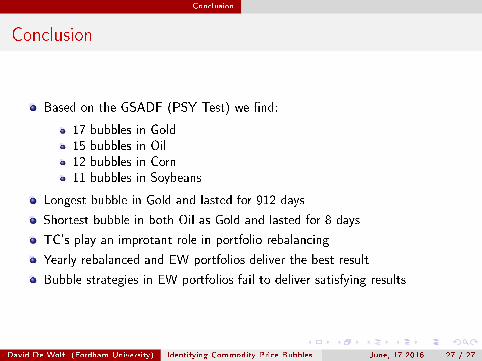
Conclusion
Based on the GSADF (PSY Test) we �nd:
17 bubbles in Gold15 bubbles in Oil12 bubbles in Corn11 bubbles in Soybeans
Longest bubble in Gold and lasted for 912 days
Shortest bubble in both Oil as Gold and lasted for 8 days
TC's play an improtant role in portfolio rebalancing
Yearly rebalanced and EW portfolios deliver the best result
Bubble strategies in EW portfolios fail to deliver satisfying results
David De Wolf (Fordham University) Identifying Commodity Price Bubbles June, 17 2016 27 / 27