BUA321 CH13 Capital Structure - TMC Business -...
14
BUA321 CH13 Capital Structure Content Coordinator: Dr. Lawrence Byerly Chapter 13 Study Guide 1. What is the risk return value rule? If risk increases, investors want more returns, so new investors would pay a lower price. Risk up, required return up, value down 2. What is capital structure? Long-term financing 3. What is leverage? The magnification of risk that is realized when we add fixed cost operations and financing to the corporation. a. Describe business risk. The chance that you will be unable to meet the operating obligations of the firm. Created by fixed costs of operations b. Describe financial risk. The chance that you will not be able to meet the financing obligations of the firm. Borrowing and using preferred stock 4. What does break-even mean? Find the point where profits (primarily EBIT) are zero. Helps analyze risk levels of current choices. Can also see what future decisions will have on risk. a. How does this relate to risk? Sets the level of must do performance to get to zero profit. The higher the level the harder to make profit. b. What is contribution margin? P – VC The profit per unit that first covers fixed costs, then designates the profit per unit after FC are covered.
Transcript of BUA321 CH13 Capital Structure - TMC Business -...

BUA321 CH13 Capital Structure
Content Coordinator: Dr. Lawrence Byerly
Chapter 13 Study Guide
1. What is the risk return value rule?
If risk increases, investors want more returns, so new investors would pay a lower price. Risk up, required return up, value down
2. What is capital structure?
Long-term financing
3. What is leverage?
The magnification of risk that is realized when we add fixed cost operations and financing to the corporation.
a. Describe business risk.
The chance that you will be unable to meet the operating obligations of the firm. Created by fixed costs of operations
b. Describe financial risk.
The chance that you will not be able to meet the financing obligations of the firm. Borrowing and using preferred stock
4. What does break-even mean?
Find the point where profits (primarily EBIT) are zero. Helps analyze risk levels of current choices. Can also see what future decisions will have on risk.
a. How does this relate to risk?
Sets the level of must do performance to get to zero profit. The higher the level the harder to make profit.
b. What is contribution margin?
P – VC The profit per unit that first covers fixed costs, then designates the profit per unit after FC are covered.

BUA321 CH13 Capital Structure
Content Coordinator: Dr. Lawrence Byerly
5. The company currently sells the Widget Pro for $17. The variable costs are $12 per
unit. The company currently has modest fixed costs of $500. The managers are
proposing the purchase of a new piece of machinery that will reduce variable
costs to $9. The fixed costs will increase to $2,000.
i. What is the break-even point currently?
100 units 100 * 17 - 100 * 12 -500 = 0
ii. What is the proposed break-even?
250 units
6. What is DOL? DFL? DTL?
Degree of operating leverage – business risk Degree of financial leverage – financial leverage Degree of total leverage – combined effect
17.00$
12.00$
500.00$
100.00
-
Break-Even Units 100.00
Price per Unit
Variable Cost per Unit
Fixed Costs of Operation
Units of Production
Interest Expense
Preferred Dividends
Tax Rate
EBIT

BUA321 CH13 Capital Structure
Content Coordinator: Dr. Lawrence Byerly
Assume that Don Donuts utilizes a new donut hole machine to create edible wonders. This machine will
reduce variable costs to 25 cents per hole. The fixed costs of the new operation is $4,000. The donut
holes currently sell for 75 cents each. In the last year, Don sold 12,000 Donut holes. What is the new
break-even point for the company? What is the estimated EBIT if sales repeat themselves? What is the
DOL?
0.75$
0.25$
4,000.00$
12,000.00
2,000.00$
15.00%
4,999.81
Break-Even Units 8,000.00
Price per Unit
Variable Cost per Unit
Fixed Costs of Operation
Units of Production
Interest Expense
Preferred Dividends
Tax Rate
EBIT
3.00
1.67
5.00
Degree of Operating Leverage
Degree of Financial Leverage
Degree of Total leverage
BUA321 CH13 Capital Structure
Content Coordinator: Dr. Lawrence Byerly
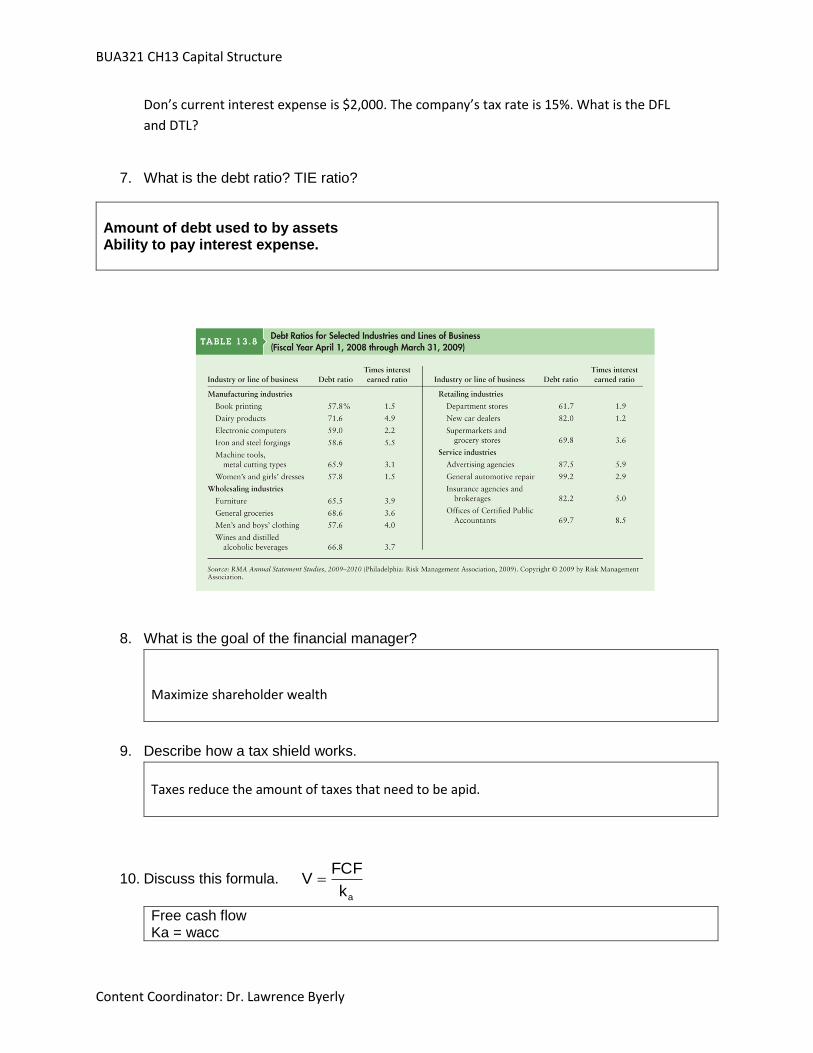
Don’s current interest expense is $2,000. The company’s tax rate is 15%. What is the DFL
and DTL?
7. What is the debt ratio? TIE ratio?
Amount of debt used to by assets Ability to pay interest expense.
8. What is the goal of the financial manager?
Maximize shareholder wealth
9. Describe how a tax shield works.
Taxes reduce the amount of taxes that need to be apid.
10. Discuss this formula. ak
FCFV
Free cash flow Ka = wacc

BUA321 CH13 Capital Structure
Content Coordinator: Dr. Lawrence Byerly
How can you increase the stock price?
11. Scenario
a. World with NO taxes
i. Who cares?
ii. What happens if we change the capital structure?
No one cares. No taxes. If a company pays you $100, do you care if they call it a dividend payment or an interest payment? What about the company? As we switch to less expensive debt, the cost of equity keeps pace and the WACC dos not change.
b. World with Corporate Taxes
i. Who cares?
ii. What happens if we change the capital structure?
Corporate taxes. If a company pays you $100, do you care if they call it a dividend payment or an interest payment? What about the company? The tax shield provides a benefit to the company.
12. How does the chance of bankruptcy change the amount of debt a company will take?
This adds a cost to borrowing. It increases as we borrow more.

BUA321 CH13 Capital Structure
Content Coordinator: Dr. Lawrence Byerly
13. Capital Structure problem
a. The Sunshine Vacation Company, is preparing to make a capital structure
decision. It has obtained estimates of sales and the associated levels of
earnings before interest and taxes (EBIT) from its forecasting group: There
is a 30% chance that sales will total $600,000, a 40% chance that sales will
total $900,000, and a 30% chance that sales will total $1,200,000. Fixed
operating costs total $300,000, and variable operating costs equal 40% of
sales. These data are summarized, and the resulting EBIT calculated, in the
following table:
b. Currently the company has no debt and $1,000,000 in common stock. There
are 40,000 shares selling at $25. Taxes are currently 40% at the margin.
What does the current capital structure look like?
c. Show the range of capital structures that are possible.
d. The company has been given the following interest rate structure for
borrowing. Prepare an interest expense schedule.
Debt ratio
Cost of debt
0 0%
10 6%
15 8%
30 10%
45 13%
50 15%
60 17%
Debt Ratio Total Assets Debt Equity Shares
0.00% $1,000,000 $0 $1,000,000 40000.00
10.00% $1,000,000 $100,000 $900,000 36000.00
15.00% $1,000,000 $150,000 $850,000 34000.00
30.00% $1,000,000 $300,000 $700,000 28000.00
45.00% $1,000,000 $450,000 $550,000 22000.00
50.00% $1,000,000 $500,000 $500,000 20000.00
60.00% $1,000,000 $600,000 $400,000 16000.00
Est Capital Structure (000's)

BUA321 CH13 Capital Structure
Content Coordinator: Dr. Lawrence Byerly
e. What is the worst-case scenario for EPS? Average? Best?
Interest Rates
Debt Ratio Debt Rate Interest Expense
0.00% $0 0.00% 0.000
10.00% $100,000 6.00% 6,000.000
15.00% $150,000 8.00% 12,000.000
30.00% $300,000 13.00% 39,000.000
45.00% $450,000 13.00% 58,500.000
50.00% $500,000 15.00% 75,000.000
60.00% $600,000 17.00% 102,000.000
Worst
Debt Ratio Interest Expense EBT Taxes NI EPS
0.00% $0 $60,000.00 $24,000.00 $36,000.00 $0.9000
10.00% $6,000 $54,000.00 $21,600.00 $32,400.00 $0.9000
15.00% $12,000 $48,000.00 $19,200.00 $28,800.00 $0.8471
30.00% $39,000 $21,000.00 $8,400.00 $12,600.00 $0.4500
45.00% $58,500 $1,500.00 $600.00 $900.00 $0.0409
50.00% $75,000 -$15,000.00 -$6,000.00 -$9,000.00 -$0.4500
60.00% $102,000 -$42,000.00 -$16,800.00 -$25,200.00 -$1.5750
Lawrence Byerly PhD © 2013 CTRL+SHIFT+B = MAIN MENU
Average
Debt Ratio Interest Expense EBT Taxes NI EPS
0.00% $0 $240,000.00 $96,000.00 $144,000.00 $3.60
10.00% $6,000 $234,000.00 $93,600.00 $140,400.00 $3.90
15.00% $12,000 $228,000.00 $91,200.00 $136,800.00 $4.02
30.00% $39,000 $201,000.00 $80,400.00 $120,600.00 $4.31
45.00% $58,500 $181,500.00 $72,600.00 $108,900.00 $4.95
50.00% $75,000 $165,000.00 $66,000.00 $99,000.00 $4.95
60.00% $102,000 $138,000.00 $55,200.00 $82,800.00 $5.18
Best
Debt Ratio Interest Expense EBT Taxes NI EPS
0.00% $0 $420,000.00 $168,000.00 $252,000.00 $6.30
10.00% $6,000 $414,000.00 $165,600.00 $248,400.00 $6.90
15.00% $12,000 $408,000.00 $163,200.00 $244,800.00 $7.20
30.00% $39,000 $381,000.00 $152,400.00 $228,600.00 $8.16
45.00% $58,500 $361,500.00 $144,600.00 $216,900.00 $9.86
50.00% $75,000 $345,000.00 $138,000.00 $207,000.00 $10.35
60.00% $102,000 $318,000.00 $127,200.00 $190,800.00 $11.93

BUA321 CH13 Capital Structure
Content Coordinator: Dr. Lawrence Byerly
f. Utilize the following table of costs of equity to complete the capital
structure question. The company has a steady cost of equity until a
breaking point at 30%.
g. What is the optimal capital structure for the firm? Is that level also the
maximum EPS? What is the risk level at that point?
This is an important table. What is the debt ratio for maximized profit? Maximized value? Shows that maximizing profit does not necessarily maximize stock price.
Debt ratio
Cost of equity
0 12%
10 12%
20 12%
30 13%
40 14%
50 16.5%
60 19%
EPS
Debt Ratio Worst Average Best
0.00% $0.90 $3.60 $6.30
10.00% $0.90 $3.90 $6.90
15.00% $0.85 $4.02 $7.20
30.00% $0.45 $4.31 $8.16
45.00% $0.04 $4.95 $9.86
50.00% -$0.45 $4.95 $10.35
60.00% -$1.58 $5.18 $11.93
Probability 0.30 0.40 0.30
Debt Ratio Expected EPS Standard Deviation Coefficient of Var. Est. Share Price
0.00% $3.60 2.091$ 0.581$ $30.000
10.00% $3.90 2.324$ 0.596$ $32.500
15.00% $4.02 2.460$ 0.612$ $33.529
30.00% $4.31 2.988$ 0.694$ $33.132
45.00% $4.95 3.803$ 0.768$ $35.357
50.00% $4.95 4.183$ 0.845$ $30.000
60.00% $5.18 5.229$ 1.010$ $27.237

BUA321 CH13 Capital Structure
Content Coordinator: Dr. Lawrence Byerly
14. Describe asymmetric information.
Unequal information. Who should know most about what goes on in the corporation. What things would we like to know but do not want to know??
15. How do managers send signals?
What does borrowing say about the future? What does issuing stock say?

BUA321 CH13 Capital Structure
Content Coordinator: Dr. Lawrence Byerly
BUA321 CH13 exercise HW (47 points) _______ Internet (15 points) ______
Use the EPS – EBIT worksheet to complete the information below:
VC is 40% of sales; fixed costs are $15,000
a. (3)
Interest Rates
Debt Ratio Rate
0.00% 0.00%
10.00% 6.00%
15.00% 8.00%
30.00% 10.00%
45.00% 13.00%
50.00% 15.00%
60.00% 17.00%
Worst Average Best
Probability 0.15 0.5 0.35
Sales $70,000 $100,000 $150,000
Long Term Debt $0
Common Stock $450,000
Book Value of Stock $5.50
Taxes 35.00%
Current Capital Structure (000's)
Debt Ratio (weight) Cost of Equity
0.00% 10.00%
10.00% 10.00%
15.00% 10.00%
30.00% 12.00%
45.00% 14.00%
50.00% 16.00%
60.00% 19.00%

BUA321 CH13 Capital Structure
Content Coordinator: Dr. Lawrence Byerly
Probability
0.30 0.40 0.30
EBIT
b. (5)
Debt Ratio
Amount
of Debt
Amount
of Equity
Number of Shares of
Common Stock*
0%
15%
30%
45%
60%
c (5)
Debt Ratio
Amount
of Debt
Before Tax
Cost of Debt
Annual Interest
0%
15%
30%
45%
60%
d. (9)
Cut and paste table from Excel
Worst Scenario
Average Scenario
Best Scenario

BUA321 CH13 Capital Structure
Content Coordinator: Dr. Lawrence Byerly
e. statistics and share price (5)
cut and paste from excel
Debt ratio Expected EPS Standard
deviation
CV Price
0
15
30
45
60
f. (10)
(1) copy and paste graph with EBIT and EPS
(2) create a graph showing the relationship between the debt ratio and the EPS. Copy and
paste here.
g) (10)
describe what the 2 graphs are illustrating.
BUA321 CH13 Capital Structure
Content Coordinator: Dr. Lawrence Byerly
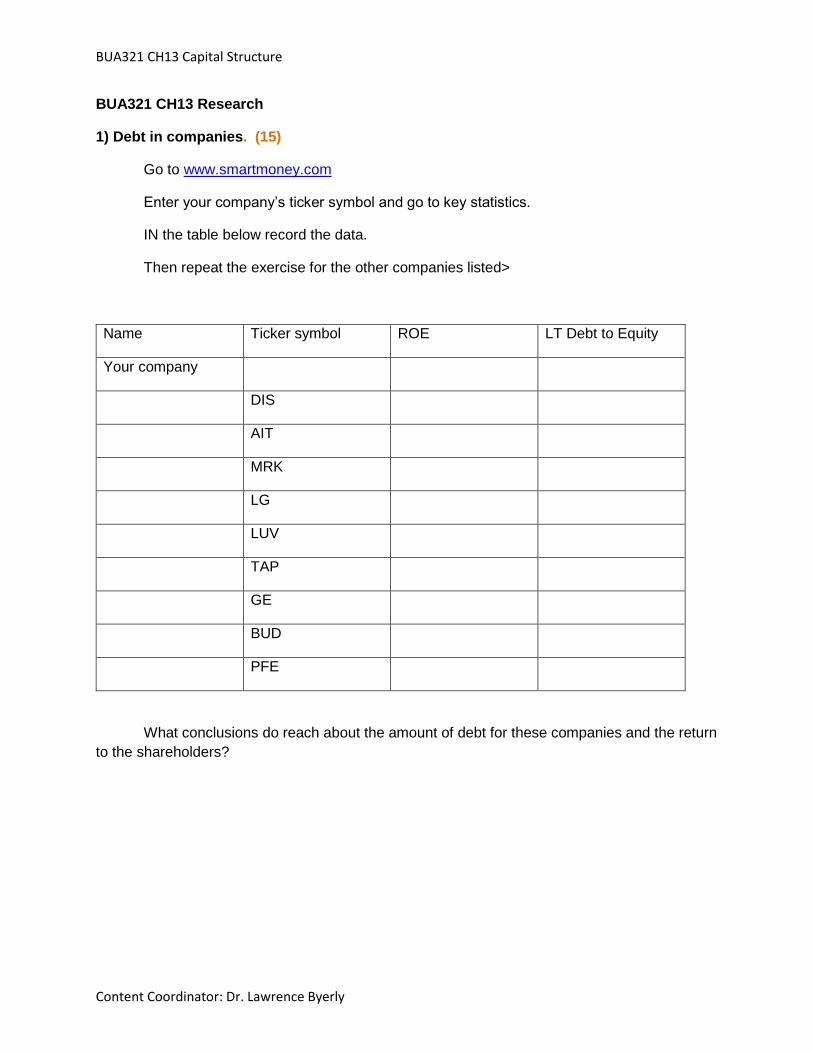
BUA321 CH13 Research
1) Debt in companies. (15)
Go to www.smartmoney.com
Enter your company’s ticker symbol and go to key statistics.
IN the table below record the data.
Then repeat the exercise for the other companies listed>
Name Ticker symbol ROE LT Debt to Equity
Your company
DIS
AIT
MRK
LG
LUV
TAP
GE
BUD
PFE
What conclusions do reach about the amount of debt for these companies and the return
to the shareholders?
BUA321 CH13 Capital Structure
Content Coordinator: Dr. Lawrence Byerly
2) Using the financial statements you gathered in Chapter 1. (6)
Company name Ticker Symbol
Calculate the company’s
DOL,
DFL
DTL