
Bti thursday-luncheon-strand-as-of-11-2
53
Looking Back at the last 50 Years and Forward Toward the Next 50 Bank and Capital Markets Tax Institute November 5, 2015 Rob Strand Senior Economist American Bankers Association
-
Upload
summit-professional-networks -
Category
Business
-
view
495 -
download
0
Transcript of Bti thursday-luncheon-strand-as-of-11-2

Looking Back at the last 50 Years and Forward Toward the Next 50
Bank and Capital Markets Tax Institute
November 5, 2015
Rob StrandSenior EconomistAmerican Bankers Association

Rock ‘n Roll in 1965

Rock ‘n Roll is here to stay!


Source: National Bureau of Economic Research-40
0
40
80
120
Post World War II Business Cycles
Months Expansions
Recessions
Current77 months
Average

Source: U.S. Bureau of Economic Analysis
-1%
0%
1%
2%
3%
4%
1960s 1980s 2000s 2011 2013 2015
Net ExportsGovernmentBusiness InventoriesBusiness InvestmentConsumers
Contributions to Inflation-Adjusted GDP Growth
3 Qtrs

Consumer Spending
-3%
0%
3%
6%
9%
12%
1965 1975 1985 1995 2005 2015
Source: U.S. Bureau of Economic Analysis
throughAugust
Annual Growth
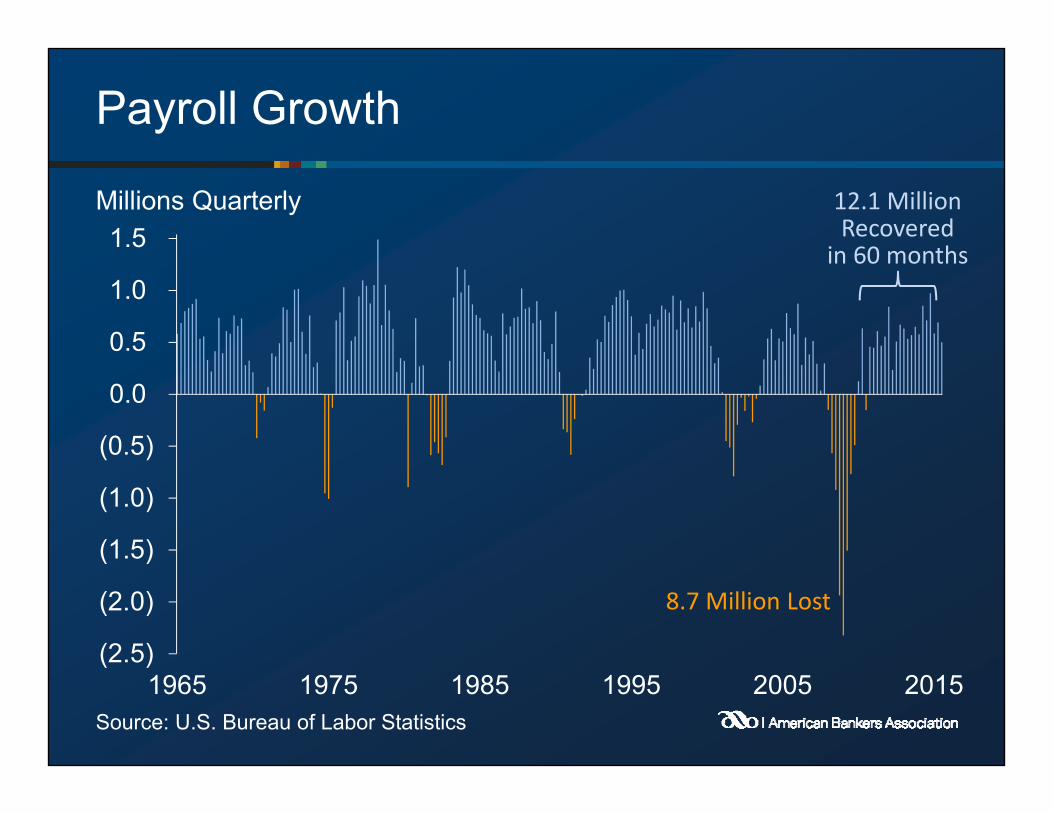
(2.5)
(2.0)
(1.5)
(1.0)
(0.5)
0.0
0.5
1.0
1.5
1965 1975 1985 1995 2005 2015Source: U.S. Bureau of Labor Statistics
8.7 Million Lost
12.1 Million Recovered
in 60 months
Payroll Growth
Millions Quarterly

0%
5%
10%
15%
1965 1975 1985 1995 2005 2015
Source: U.S. Bureau of Labor Statistics
Underemployed
10.0%
5.1%Unemployed
Unemployment Rate
10.8%


2¾%—4%
4%—5%
5%—6%
6%—7%
Unemployment Rate
Source: U.S. Bureau of Labor Statistics, September 2015
2.9%
2.8%
6.8%
6.7%
6.6%
5.9%
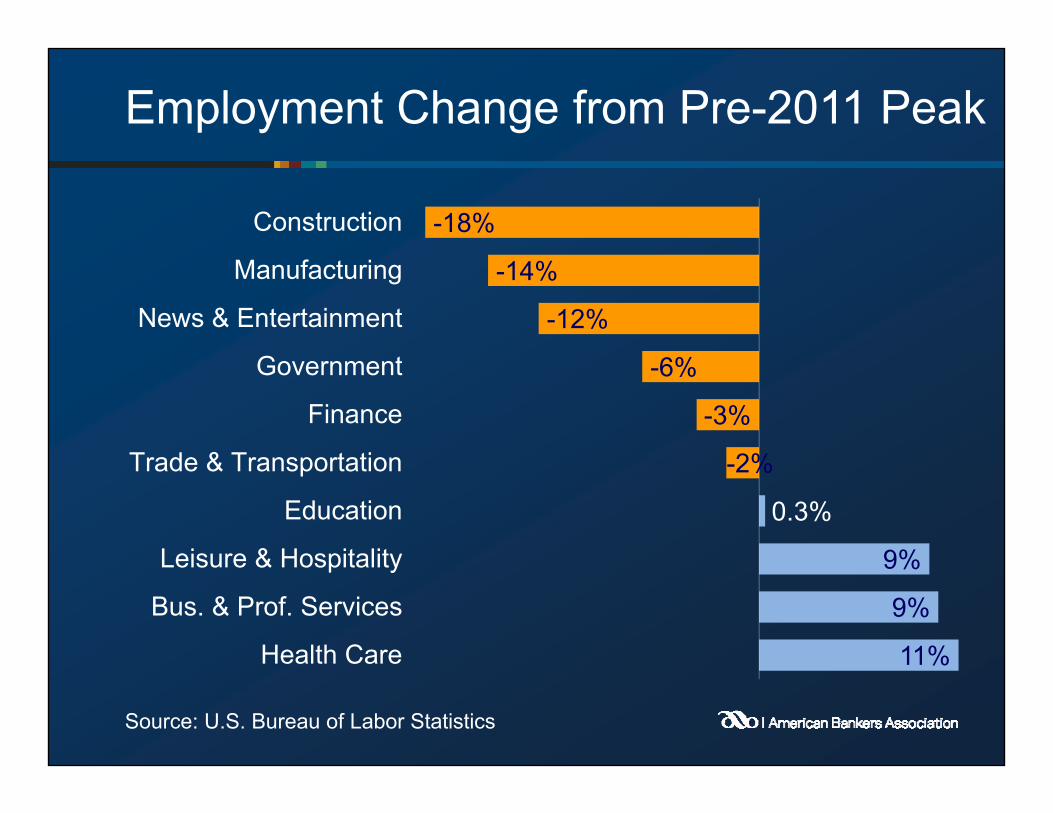
11%
9%
9%
0.3%
-2%
-3%
-6%
-12%
-14%
-18%
Health Care
Bus. & Prof. Services
Leisure & Hospitality
Education
Trade & Transportation
Finance
Government
News & Entertainment
Manufacturing
Construction
Employment Change from Pre-2011 Peak
Source: U.S. Bureau of Labor Statistics

Shifts in Employment Shares by Industry
GovernmentOther
TradeManufacturing
GovernmentOther
Trade
Manufacturing
1965 2015
Source: U.S. Bureau of Labor Statistics
Health Care

Median Annual U.S Household Income
$40,000
$45,000
$50,000
$55,000
$60,000
1965 1975 1985 1995 2005 2015
Source: U.S. Department of the Census
2014 $s

Quintiles of Annual Household Income
$0
$50,000
$100,000
$150,000
$200,000
1965 1975 1985 1995 2005 2015
Source: U.S. Department of the Census
2014 $sTop 5 Percent
Top Quintile
Fourth Quintile
Third QuintileSecond QuintileBottom Quintile

Price of a Gallon of Gas vs. Milk
$1
$2
$3
$4
1995 2000 2005 2010 2015
Premium Gas
Whole Milk
Source: Bureau of Labor Stats, Energy Information Administration

10%
15%
20%
1965 1975 1985 1995 2005 2015
Household Balance Sheets Strengthening
Source: Federal Reserve Flow of Funds
Debt / Assets
Financial Obligation Ratio
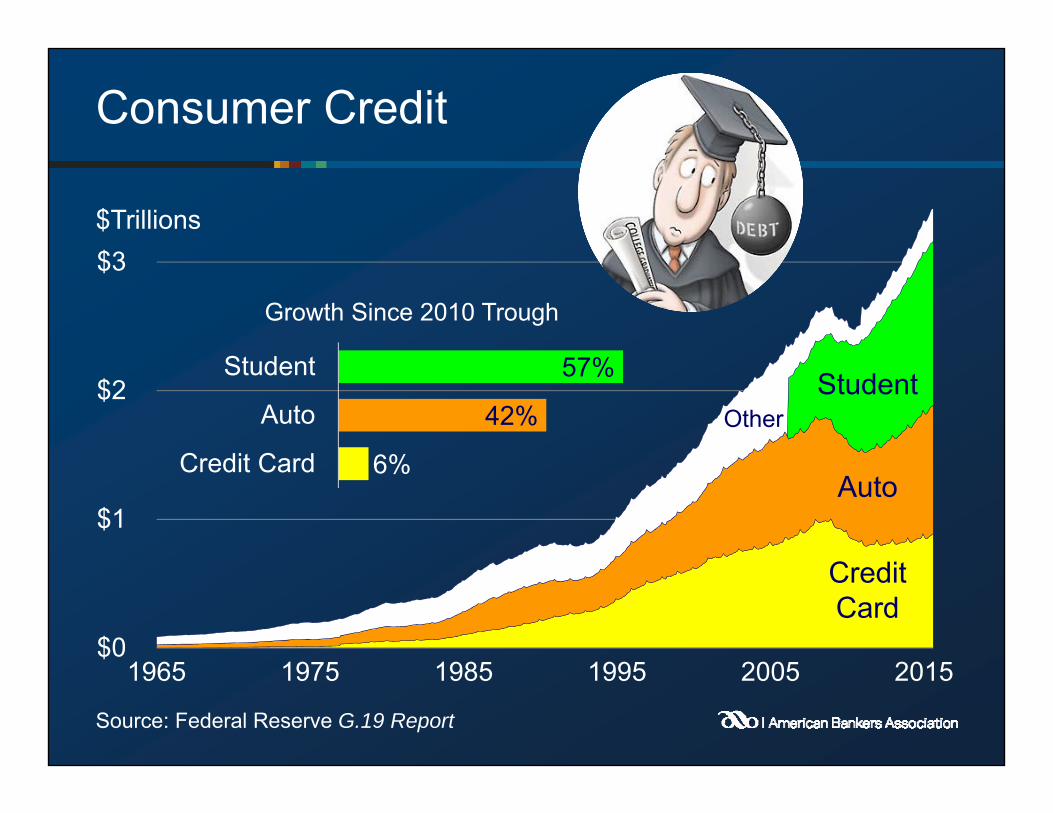
Consumer Credit
Source: Federal Reserve G.19 Report
$0
$1
$2
$3
1965 1975 1985 1995 2005 2015
CreditCard
Auto
StudentOther
6%
42%
57%
Credit Card
Auto
Student
Growth Since 2010 Trough
$Trillions

1965 Pontiac GTO
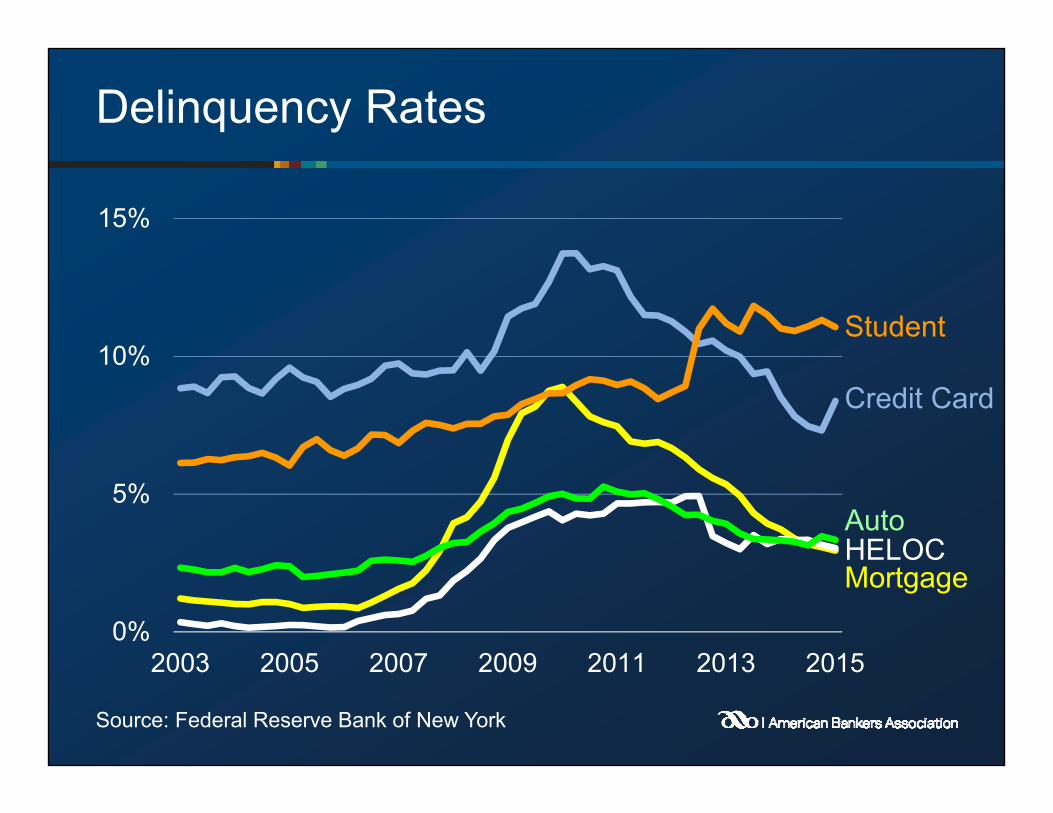
Delinquency Rates
0%
5%
10%
15%
2003 2005 2007 2009 2011 2013 2015
Source: Federal Reserve Bank of New York
Mortgage
Credit Card
HELOCAuto
Student
Presidential Election Issue
• Permit refinancing of student loans
• Increase tax deductions for tuition
• Incentivize colleges to lower costs
• Increase funding for higher education
• Increase competition with private sector loans
• Increase participation in existing programs
Source: Market Watch

-4%
0%
4%
8%
12%
16%
1965 1975 1985 1995 2005 2015
Target
Source: U.S. Bureau of Labor Statistics
Consumer Price Inflation

-1%
0%
1%
2%
3%
4%
2014 2015 2016 2017 2018
Federal Funds Rate Forecast (Year End)
Sources: Federal Reserve, Chicago Mercantile Exchange (10/23)
FF Futures

Periods of Major Federal Reserve Tightening
0%
1%
2%
3%
4%
5%
6%
7%
-1 1 3 5 7 9 11 13 15 17 19 21 23 25
Fed
Fund
s Ta
rget
Rat
e
Months Since Tightening Began
1994 2004
2000
Source: Federal Reserve

Yield Spreads Shrink when the Fed Tightens
0%
3%
6%
9%
1990 1995 2000 2005 2010 2015
Tightening Began
Source: Federal Reserve
10-Year Bonds
3-Month Bills

Conventional 30-Year Mortgage Rate
0%
5%
10%
15%
20%
1965 1975 1985 1995 2005 2015
Source: Federal Reserve
3.8%

Home Sales
0
3
6
9
2000 2005 2010 2015
Millions of UnitsSAAR
Sources: U.S. Census Bureau, National Association of Realtors
New Homes
Existing Homes

Home Price Changes
-12%
-8%
-4%
0%
4%
8%
12%
16%
1975 1980 1985 1990 1995 2000 2005 2010 2015
Source: Case-Shiller National Index
Through August

0.0
0.5
1.0
1.5
1965 1975 1985 1995 2005 2015
Housing Starts
Source: U.S. Census Bureau
Millions of Units
Single Family
Multi-Unit

Home Flipping
Source: Albuquerque Journal
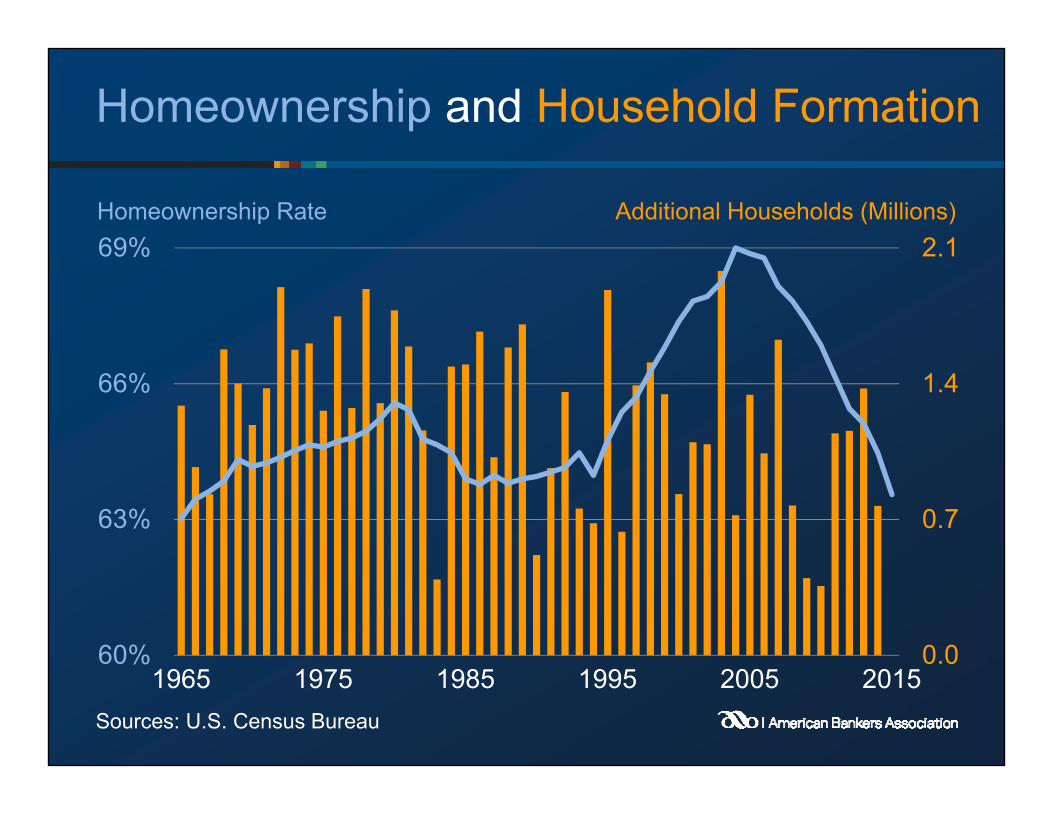
Homeownership and Household Formation
0.0
0.7
1.4
2.1
60%
63%
66%
69%
1965 1975 1985 1995 2005 2015Sources: U.S. Census Bureau
Additional Households (Millions)Homeownership Rate
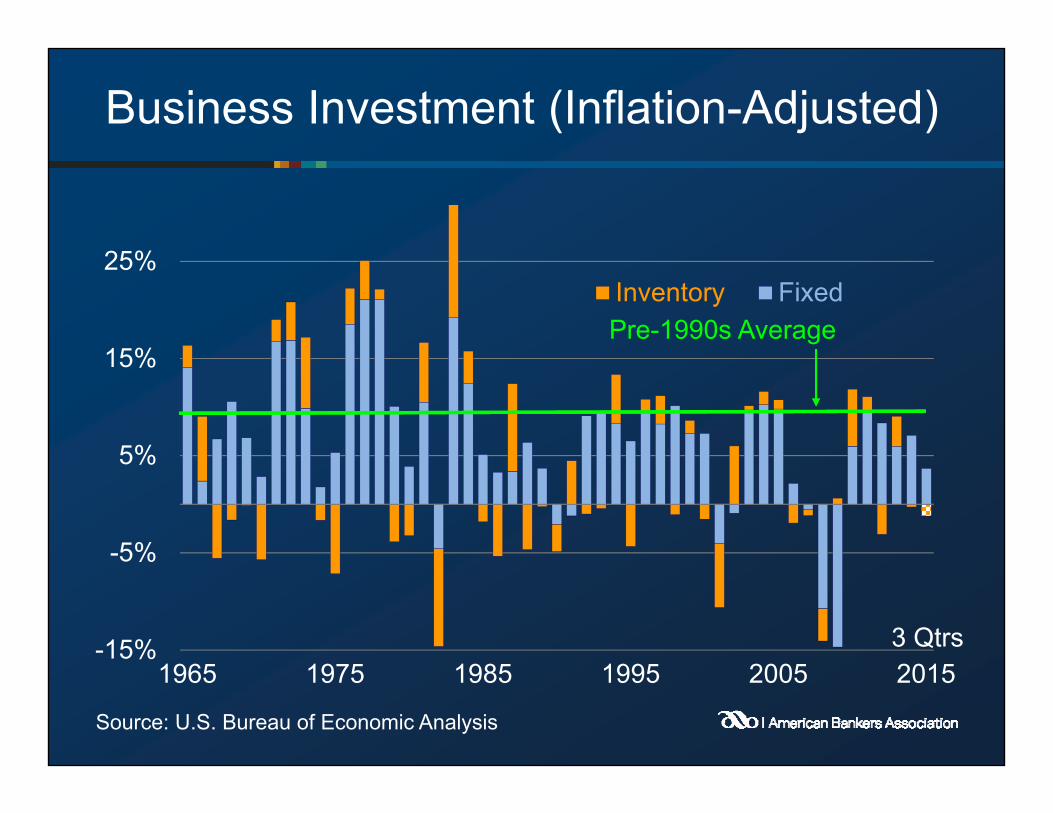
Business Investment (Inflation-Adjusted)
-15%
-5%
5%
15%
25%
1965 1975 1985 1995 2005 2015
Inventory Fixed
Source: U.S. Bureau of Economic Analysis
3 Qtrs
Pre-1990s Average

Labor Productivity Growth
-0.5%
0.0%
0.5%
1.0%
1.5%
2.0%
2.5%
3.0%
1960s 1980s 2000s 2011 2013 2015
Source: Bureau of Labor Statistics
FirstHalf

Business Indexes
20
40
60
80
100
120
25
35
45
55
65
75
1965 1975 1985 1995 2005 2015
Industrial Production
Contraction Expansion
ISM Manufacturing
Sources: Federal Reserve, Institute for Supply Management
ISM Non-Manufacturing
50

Growth of Corporate Profits
Source: U.S. Bureau of Economic Analysis
$0.0
$0.6
$1.2
$1.8
1965 1975 1985 1995 2005 2015
Other TradeFinancial Manufacturing
With inventory valuation and capital consumption adjustments, SAAR, $Trillions
First Half

Small Business Sentiment
0
10
20
30
40
0
30
60
90
120
1985 1990 1995 2000 2005 2010 2015
Sources: National Federation of Independent Business
Index of Small Business Optimism (left axis)
– Outlook for Expansion Chief Concern: – Regulations – Labor Quality (right axis)

Commercial Real Estate Price Index
Source: Green Tree Advisors Commercial Property Price Index
0
30
60
90
120
1998 2000 2002 2004 2006 2008 2010 2012 2014
11.6% Annual Growth Since Mid-2009
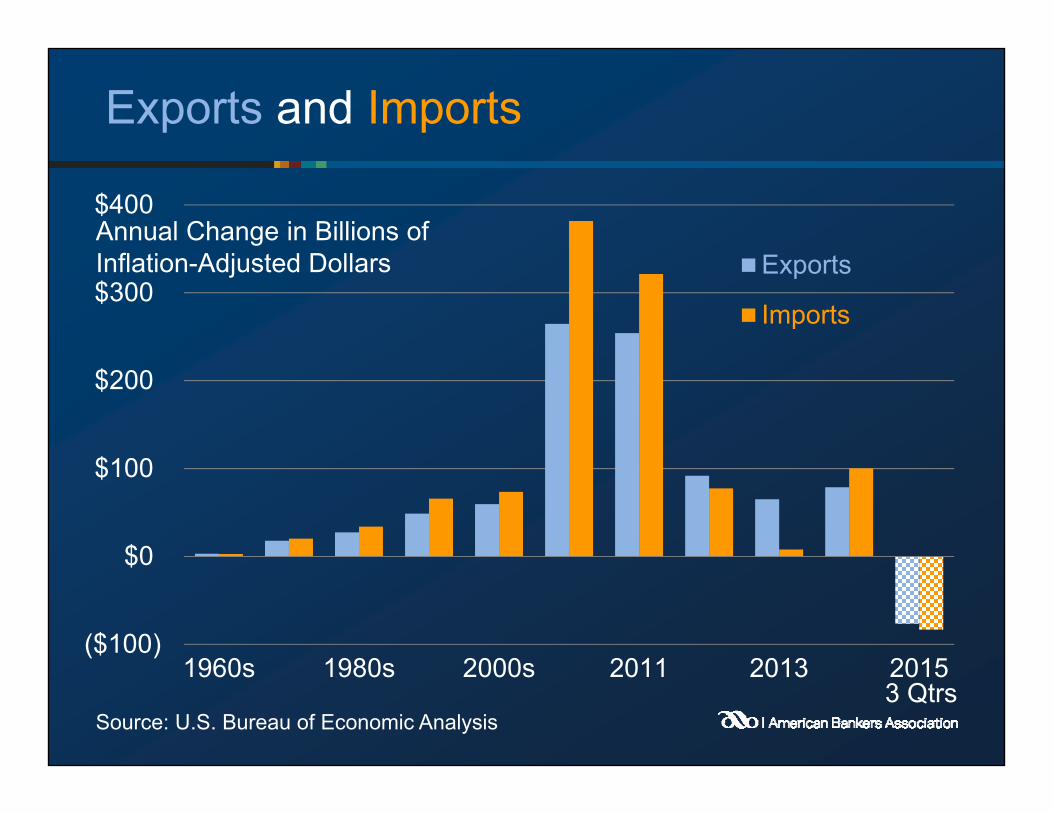
Exports and Imports
($100)
$0
$100
$200
$300
$400
1960s 1980s 2000s 2011 2013 2015
Exports
Imports
Source: U.S. Bureau of Economic Analysis3 Qtrs
Annual Change in Billions of Inflation-Adjusted Dollars

Crude Oil Exports
0
100
200
300
400
500
1965 1975 1985 1995 2005 2015
Source: U.S. Energy Information Administration
Thousands of Barrels per Day
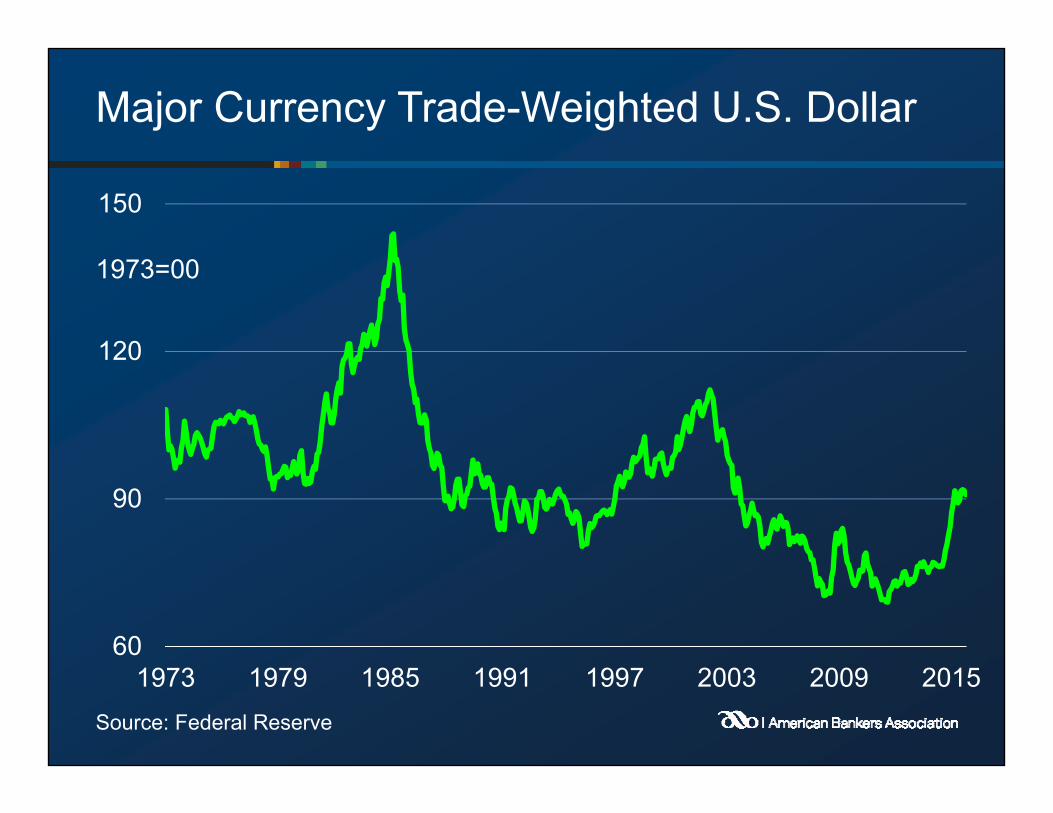
Major Currency Trade-Weighted U.S. Dollar
60
90
120
150
1973 1979 1985 1991 1997 2003 2009 2015Source: Federal Reserve
1973=00

U.S. Exports
$248
$172
$134
$82
$56
$33
$32
$19
European Union
Canada
Mexico
China
Japan
South Korea
Brazil
India
All other
U.K. Germ Fra IT
$466
Source: U.S. Bureau of Economic Analysis
Billions of Dollars in the First Half of 2015

100
120
140
160
180
1995 2000 2005 2010 2015
Gross Domestic Product (Inflation-Adjusted)
Sources: U.S. Bureau of Economic Analysis and OECD
Index (1995=100)
US
France
Japan
CanadaMexico
UK
Germany
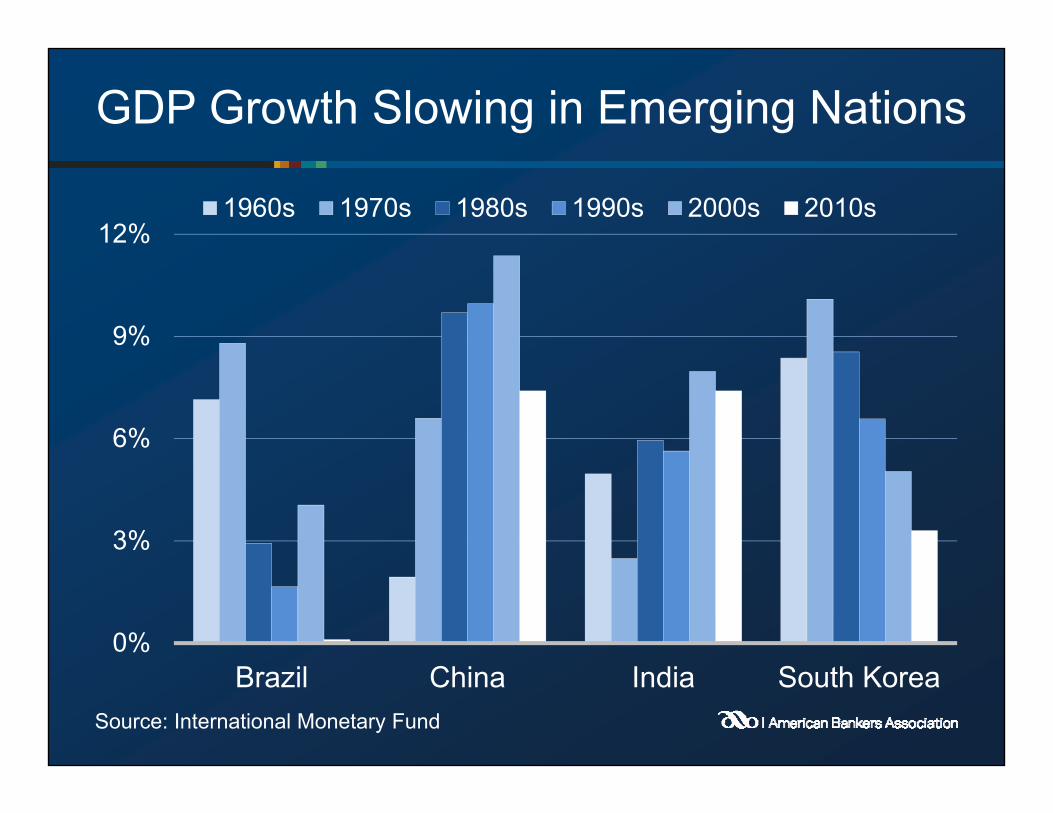
GDP Growth Slowing in Emerging Nations
0%
3%
6%
9%
12%
Brazil China India South Korea
1960s 1970s 1980s 1990s 2000s 2010s
Source: International Monetary Fund

Government Spending (Inflation-Adjusted)
-5%
0%
5%
10%
15%
1965 1975 1985 1995 2005 2015
State and Local Federal
Source: U.S. Bureau of Economic Analysis
3 Qtrs
Growth Rate

Federal Receipts, Outlays and Deficit
0%
20%
40%
60%
80%
1965 1975 1985 1995 2005 2015 2025
Receipts
Outlays
Forecast
Percent of GDP
Source: CBO Long-Term Budget Outlook (August 2015)
FederalDeficit

Medicare and Medicaid were chartered in 1965

Long-Term Structural Imbalance
The long-term fiscal problem cannot be solved by:
• a growing economy,
• eradicating fraud, waste and abuse,
• pulling U.S. troops out of the Middle East and cutting defense,
• restraining discretionary spending, and
• eliminating Congressional earmarks.
Source: U.S. Congressional Budget Office

Conclusion: Stress Points
• Concentration of Income and Wealth• Fed Lift-off and Interest Rates• Housing Recovery• Student Debt• Business Capital Formation• Foreign Economies• Government Finances

U.S. Inflation-Adjusted GDP Growth
‐3%
0%
3%
6%
9%
1965 1975 1985 1995 2005 2015
Source: U.S. Bureau of Economic Analysis
FirstHalf

0
500
1000
1500
2000
2005 2007 2009 2011 2013 2015
S&P 500 Index
Source: Standard & Poor’s
Up 167%in 6½ years

U.S. Traditional Advantages
• Highly diverse economy
• Robust entrepreneurial culture
• Flexible capital and labor markets
→ Technological leader
→ Strong global competitor

Patent Applications
0
200,000
400,000
600,000
1965 1975 1985 1995 2005
Source: U.S. Patent and Trademark Office
2015


![bti[1]- huka](https://static.fdocuments.us/doc/165x107/577d26f41a28ab4e1ea2a579/bti1-huka.jpg)
