BT Investment Management Limited ASX Code: BTT … · Business Summary BT Investment Management...
2
Business Summary BT Investment Management Limited (BTT) is an Australian company engaged in the provision of investment management services. The Company operates through two segments: investment management business in Australia (BTIM Australia) and investment management business outside of Australia (BTIM UK). Operations The Company operates in the funds management markets in the world, including the United States, the United Kingdom, Asia, Europe and Australia. The Company offers investment services in Australian equities, global equities, property, ethical, income and fixed interest and diversified strategies. Its Australian equities include a range of funds, such as BT Core Australian Share Fund, BT Focus Australian Share Fund, BT MicroCap Opportunities Fund, BT Smaller Companies Fund and BT MidCaps Fund. J O Hambro Capital Management (JOHCM), which operates as a boutique investment management business with offices in London, Singapore, New York and Boston specializing in the active management of equities Latest Research One down, two to go BTT has passed its first of three catalysts delivering a solid quarterly update in a difficult market environment. BTT was able to grow FUM by $900m over the period, despite unfavourable share market conditions, aided by favourable currency movements. Overall, the quarterly doesn’t distract from the investment case, with two further catalysts for the stock to get through, it’s pending 1H18 result due out on Thursday 10 May, and the anticipated WBC sell down of its remaining ~10% stake. We believe when these two remaining catalysts are passed and greater stability returns to the share market that BTT should be able to re-rate from historic trading lows, with the company on less than 15.0x FY18 PE, moving to ~12.0x in FY19. For more information see full research report 13 Apr 2018. GICS - Div. Financials BT Investment Management Limited ASX Code: BTT Price: $9.68 12 Mth Target Price: $15.00 Rating: Buy Important Disclaimer - This may affect your legal rights: Because this document has been prepared without consideration of any specific client's financial situation, particular needs and investment objectives, a Bell Potter Securities Limited investment adviser (or the financial services licensee, or the proper authority of such licensee, who has provided you with this report by arrangement with Bell Potter Securities Limited) should be consulted before any investment decision is made. While this document is based on the information from sources which are considered reliable, Bell Potter Securities Limited, its directors, employees and consultants do not represent, warrant or guarantee, expressly or impliedly, that the information contained in this document is complete or accurate. Nor does Bell Potter Securities Limited accept any responsibility to inform you of any matter that subsequently comes to its notice, which may affect any of the information contained in this document. This document is a private communication to clients and is not intended for public circulation or for the use of any third party, without the prior approval of Bell Potter Securities Limited. This is general investment advice only and does not constitute advice to any person. Disclosure of Interest: Bell Potter Securities Limited receives commission from dealing in securities and its authorised representatives, or introducers of business, may directly share in this commission. Bell Potter Securities and its associates may hold shares in the companies recommended. Snapshot Date Market Cap. Shares on issue 12 Month High 12 Month Low 8 May 2018 $3,066m 316.7m $13.26 $9.06 Rating Rating 12 Mth Target Price Capital Gain Gross Yield Implied Total Return Buy $15.00 NA% NA% NA% Investment Fundamentals FYE 30 Sep 2017A 2018F 2019F 2020F Profit $m 173.1 204.4 251.9 285.5 Profit (norm)* $m 173.1 204.4 251.9 285.5 EPS* ¢ 55.3 64.7 79.5 90.2 EPS Growth % 8.9 17.0 22.9 13.4 P/E* x 0.0 0.0 0.0 0.0 P/E Relative % 0.0 0.0 0.0 0.0 DPS ¢ 45.0 51.0 64.0 72.0 Yield % 0.0 0.0 0.0 0.0 Franking % 27.5 25.0 25.0 25.0 * Adjusted for goodwill and unusual items Source: Based on Bell Potter estimates Share Price Chart Total Return on $10,000 Investment
Transcript of BT Investment Management Limited ASX Code: BTT … · Business Summary BT Investment Management...
Business SummaryBT Investment Management Limited (BTT) is an Australian companyengaged in the provision of investment management services. The Companyoperates through two segments: investment management business inAustralia (BTIM Australia) and investment management business outside ofAustralia (BTIM UK).
Operations The Company operates in the funds management markets in theworld, including the United States, the United Kingdom, Asia, Europe andAustralia. The Company offers investment services in Australian equities,global equities, property, ethical, income and fixed interest and diversifiedstrategies. Its Australian equities include a range of funds, such as BT CoreAustralian Share Fund, BT Focus Australian Share Fund, BT MicroCapOpportunities Fund, BT Smaller Companies Fund and BT MidCaps Fund. J OHambro Capital Management (JOHCM), which operates as a boutiqueinvestment management business with offices in London, Singapore, NewYork and Boston specializing in the active management of equities
Latest ResearchOne down, two to go
BTT has passed its first of three catalysts delivering a solid quarterlyupdate in a difficult market environment. BTT was able to grow FUM by$900m over the period, despite unfavourable share market conditions,aided by favourable currency movements. Overall, the quarterly doesn’tdistract from the investment case, with two further catalysts for the stock toget through, it’s pending 1H18 result due out on Thursday 10 May, and theanticipated WBC sell down of its remaining ~10% stake. We believe
when these two remaining catalysts are passed and greater stabilityreturns to the share market that BTT should be able to re-rate from historictrading lows, with the company on less than 15.0x FY18 PE, moving to~12.0x in FY19.
For more information see full research report 13 Apr 2018.
GICS - Div. Financials
BT Investment Management Limited
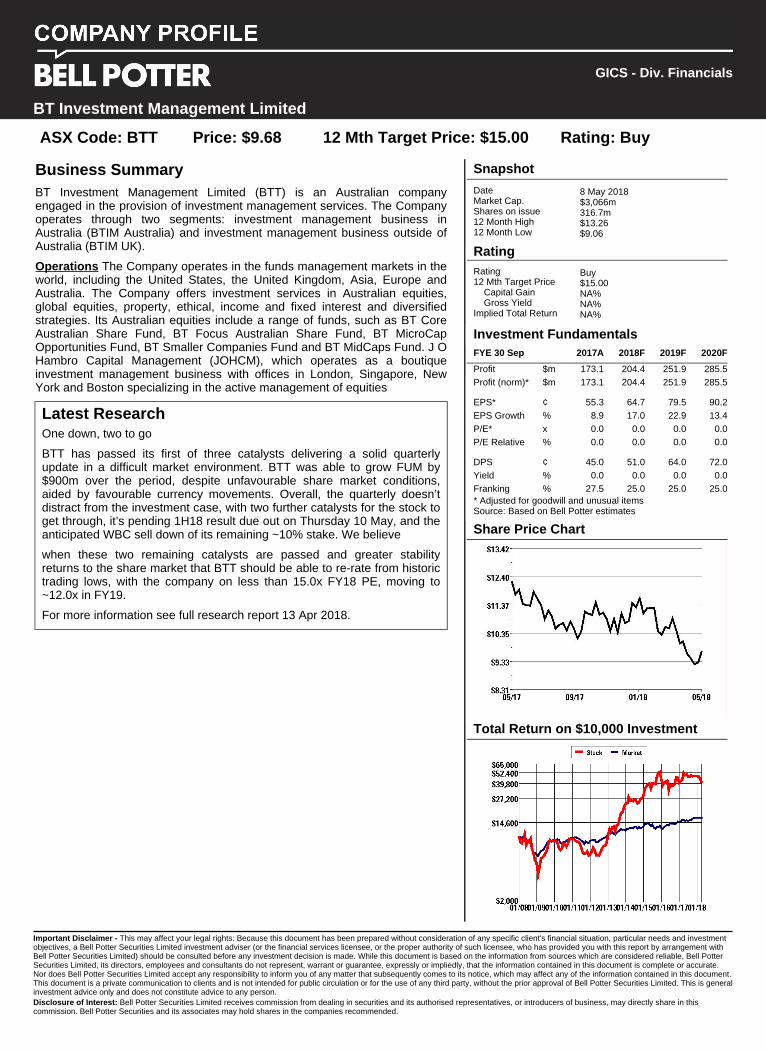
ASX Code: BTT Price: $9.68 12 Mth Target Price: $15.00 Rating: Buy
Important Disclaimer - This may affect your legal rights: Because this document has been prepared without consideration of any specific client's financial situation, particular needs and investmentobjectives, a Bell Potter Securities Limited investment adviser (or the financial services licensee, or the proper authority of such licensee, who has provided you with this report by arrangement withBell Potter Securities Limited) should be consulted before any investment decision is made. While this document is based on the information from sources which are considered reliable, Bell PotterSecurities Limited, its directors, employees and consultants do not represent, warrant or guarantee, expressly or impliedly, that the information contained in this document is complete or accurate.Nor does Bell Potter Securities Limited accept any responsibility to inform you of any matter that subsequently comes to its notice, which may affect any of the information contained in this document.This document is a private communication to clients and is not intended for public circulation or for the use of any third party, without the prior approval of Bell Potter Securities Limited. This is generalinvestment advice only and does not constitute advice to any person.Disclosure of Interest: Bell Potter Securities Limited receives commission from dealing in securities and its authorised representatives, or introducers of business, may directly share in thiscommission. Bell Potter Securities and its associates may hold shares in the companies recommended.
Snapshot
DateMarket Cap.Shares on issue12 Month High12 Month Low
8 May 2018$3,066m316.7m$13.26$9.06
RatingRating12 Mth Target Price
Capital GainGross Yield
Implied Total Return
Buy$15.00NA%NA%NA%
Investment FundamentalsFYE 30 Sep 2017A 2018F 2019F 2020F
Profit $m 173.1 204.4 251.9 285.5Profit (norm)* $m 173.1 204.4 251.9 285.5
EPS* ¢ 55.3 64.7 79.5 90.2EPS Growth % 8.9 17.0 22.9 13.4P/E* x 0.0 0.0 0.0 0.0P/E Relative % 0.0 0.0 0.0 0.0
DPS ¢ 45.0 51.0 64.0 72.0Yield % 0.0 0.0 0.0 0.0Franking % 27.5 25.0 25.0 25.0* Adjusted for goodwill and unusual itemsSource: Based on Bell Potter estimates
Share Price Chart
Total Return on $10,000 Investment
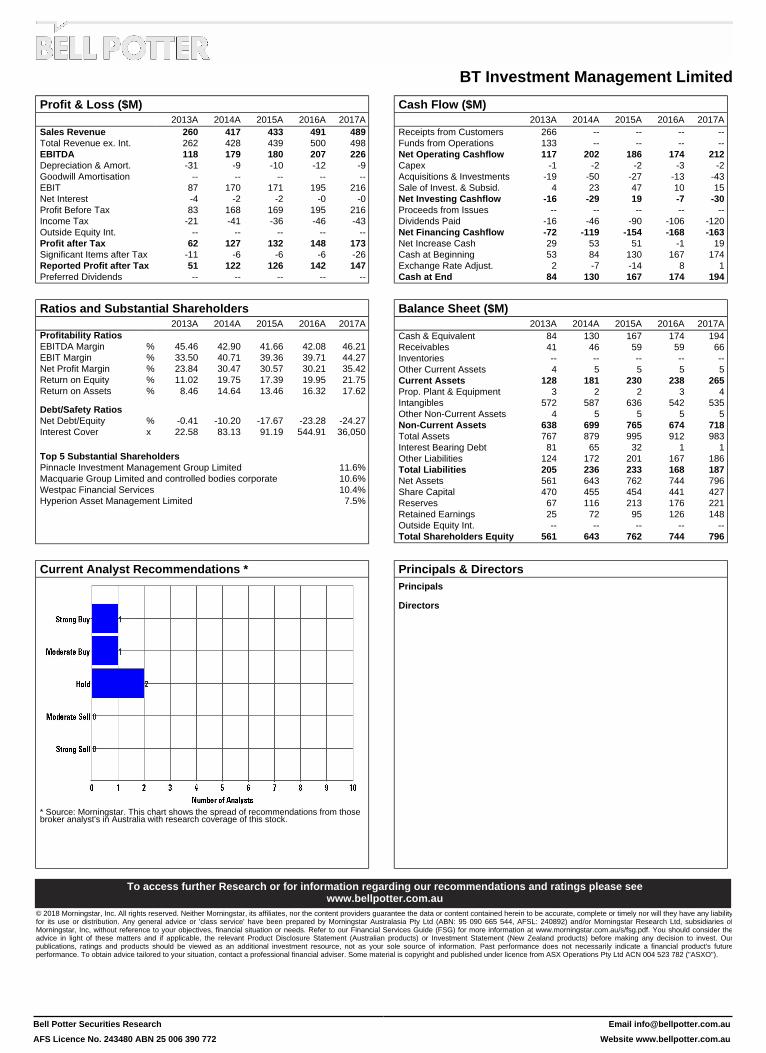
Profit & Loss ($M)2013A 2014A 2015A 2016A 2017A
Sales Revenue 260 417 433 491 489Total Revenue ex. Int. 262 428 439 500 498EBITDA 118 179 180 207 226Depreciation & Amort. -31 -9 -10 -12 -9Goodwill Amortisation -- -- -- -- --EBIT 87 170 171 195 216Net Interest -4 -2 -2 -0 -0Profit Before Tax 83 168 169 195 216Income Tax -21 -41 -36 -46 -43Outside Equity Int. -- -- -- -- --Profit after Tax 62 127 132 148 173Significant Items after Tax -11 -6 -6 -6 -26Reported Profit after Tax 51 122 126 142 147Preferred Dividends -- -- -- -- --
Cash Flow ($M)2013A 2014A 2015A 2016A 2017A
Receipts from Customers 266 -- -- -- --Funds from Operations 133 -- -- -- --Net Operating Cashflow 117 202 186 174 212Capex -1 -2 -2 -3 -2Acquisitions & Investments -19 -50 -27 -13 -43Sale of Invest. & Subsid. 4 23 47 10 15Net Investing Cashflow -16 -29 19 -7 -30Proceeds from Issues -- -- -- -- --Dividends Paid -16 -46 -90 -106 -120Net Financing Cashflow -72 -119 -154 -168 -163Net Increase Cash 29 53 51 -1 19Cash at Beginning 53 84 130 167 174Exchange Rate Adjust. 2 -7 -14 8 1Cash at End 84 130 167 174 194
Ratios and Substantial Shareholders2013A 2014A 2015A 2016A 2017A
Profitability RatiosEBITDA Margin % 45.46 42.90 41.66 42.08 46.21EBIT Margin % 33.50 40.71 39.36 39.71 44.27Net Profit Margin % 23.84 30.47 30.57 30.21 35.42Return on Equity % 11.02 19.75 17.39 19.95 21.75Return on Assets % 8.46 14.64 13.46 16.32 17.62
Debt/Safety RatiosNet Debt/Equity % -0.41 -10.20 -17.67 -23.28 -24.27Interest Cover x 22.58 83.13 91.19 544.91 36,050
Top 5 Substantial ShareholdersPinnacle Investment Management Group Limited 11.6%Macquarie Group Limited and controlled bodies corporate 10.6%Westpac Financial Services 10.4%Hyperion Asset Management Limited 7.5%
Balance Sheet ($M)2013A 2014A 2015A 2016A 2017A
Cash & Equivalent 84 130 167 174 194Receivables 41 46 59 59 66Inventories -- -- -- -- --Other Current Assets 4 5 5 5 5Current Assets 128 181 230 238 265Prop. Plant & Equipment 3 2 2 3 4Intangibles 572 587 636 542 535Other Non-Current Assets 4 5 5 5 5Non-Current Assets 638 699 765 674 718Total Assets 767 879 995 912 983Interest Bearing Debt 81 65 32 1 1Other Liabilities 124 172 201 167 186Total Liabilities 205 236 233 168 187Net Assets 561 643 762 744 796Share Capital 470 455 454 441 427Reserves 67 116 213 176 221Retained Earnings 25 72 95 126 148Outside Equity Int. -- -- -- -- --Total Shareholders Equity 561 643 762 744 796
Current Analyst Recommendations *
* Source: Morningstar. This chart shows the spread of recommendations from thosebroker analyst's in Australia with research coverage of this stock.
Principals & DirectorsPrincipals
Directors
To access further Research or for information regarding our recommendations and ratings please seewww.bellpotter.com.au
© 2018 Morningstar, Inc. All rights reserved. Neither Morningstar, its affiliates, nor the content providers guarantee the data or content contained herein to be accurate, complete or timely nor will they have any liabilityfor its use or distribution. Any general advice or 'class service' have been prepared by Morningstar Australasia Pty Ltd (ABN: 95 090 665 544, AFSL: 240892) and/or Morningstar Research Ltd, subsidiaries ofMorningstar, Inc, without reference to your objectives, financial situation or needs. Refer to our Financial Services Guide (FSG) for more information at www.morningstar.com.au/s/fsg.pdf. You should consider theadvice in light of these matters and if applicable, the relevant Product Disclosure Statement (Australian products) or Investment Statement (New Zealand products) before making any decision to invest. Ourpublications, ratings and products should be viewed as an additional investment resource, not as your sole source of information. Past performance does not necessarily indicate a financial product's futureperformance. To obtain advice tailored to your situation, contact a professional financial adviser. Some material is copyright and published under licence from ASX Operations Pty Ltd ACN 004 523 782 ("ASXO").
BT Investment Management Limited
Bell Potter Securities Research
AFS Licence No. 243480 ABN 25 006 390 772
Email [email protected]
Website www.bellpotter.com.au