
bSURE TimbangTara Manual_R8
38
Y Gamble if U Can bSURE? _______________________________________________________ bSURE TimbangTara Manual_R8 Page 1of 38 © Copyright Reserved 2007 bSure Solutions Sdn Bhd USER MANUAL: bSURE STRATEGIC DECISION SUPPORT AND GAP ANALYSIS TOOL By Razali Husain, Masters in Business Administration (W. Sydney, Australia), BSc Electronic and Computer Engineering (Birmingham, UK)
-
Upload
razali-husain -
Category
Documents
-
view
221 -
download
0
Transcript of bSURE TimbangTara Manual_R8
8/7/2019 bSURE TimbangTara Manual_R8
http://slidepdf.com/reader/full/bsure-timbangtara-manualr8 1/38
Y Gamble if U Can bSURE?
_______________________________________________________
bSURE TimbangTara Manual_R8 Page 1of 38 © Copyright Reserved 2007
bSure Solutions Sdn Bhd
USER MANUAL: bSURE STRATEGIC
DECISION SUPPORT AND GAP
ANALYSIS TOOL
By Razali Husain, Masters in Business Administration (W. Sydney, Australia), BScElectronic and Computer Engineering (Birmingham, UK)
8/7/2019 bSURE TimbangTara Manual_R8
http://slidepdf.com/reader/full/bsure-timbangtara-manualr8 2/38
Y Gamble if U Can bSURE?
_______________________________________________________
bSURE TimbangTara Manual_R8 Page 2of 38 © Copyright Reserved 2007
bSure Solutions Sdn Bhd
TABLES OF CONTENTS 1 Introduction to Decision Support System.......................................................3
2 Why AHP?.....................................................................................................3
3 Basic steps ....................................................................................................4 4 bSURE Strategic Decision Support Tool – TIMBANGTARA..........................4 4.1 Accessing the Menu............................................................................................ 5
4.2 Defining goal ...................................................................................................... 7
4.3 Treeview ............................................................................................................. 7
4.4 Comparing criteria or subcriteria ........................................................................ 84.4.1 Using the Survey mode to create the Pairwise Comparison Matrix ......... 13
4.5 Defining Alternatives........................................................................................ 14
4.6 Defining Rating for the each criterion .............................................................. 144.7 Score ................................................................................................................. 19
4.8 Analysis............................................................................................................. 21
4.8.1 Head-to-Head Analysis............................................................................. 224.8.2 Spider Chart .............................................................................................. 22
4.8.3 Synthesis ................................................................................................... 23
4.8.4 Button for switching between Performance and Gap Score Chart ........... 24
4.8.5 New Score Chart....................................................................................... 254.8.6 Weighted mode......................................................................................... 25
4.8.7 Gradient Analytical Tool .......................................................................... 26
4.8.8 Series......................................................................................................... 274.8.9 Alternate Format for Performance Chart .................................................. 27
4.9 Using Ideal Mode.............................................................................................. 284.10 End of Training Session.................................................................................... 29
4.11 Defining Levels of Scale................................................................................... 29
4.11.1 Add new and register new scale................................................................ 304.11.2 Assigning scales........................................................................................ 31
4.11.3 Menu ......................................................................................................... 31
4.11.4 Using ranged scale.................................................................................... 324.12 Linking to Data in Worksheets and databases .................................................. 33
4.12.1 Defining the data in worksheets and databases......................................... 34
4.12.2 Ranking alternatives.................................................................................. 36
4.13 Other Functions................................................................................................. 37
5 References ..................................................................................................37
8/7/2019 bSURE TimbangTara Manual_R8
http://slidepdf.com/reader/full/bsure-timbangtara-manualr8 3/38
Y Gamble if U Can bSURE?
_______________________________________________________
bSURE TimbangTara Manual_R8 Page 3of 38 © Copyright Reserved 2007
bSure Solutions Sdn Bhd
1 Introduction to Decision Support System
“Decision support systems couple the intellectual resources of individuals with the
capabilities of the computer to improve the quality of decisions. It is a computer-based
support system for management decision makers who dealt with semi structured
problems”. (Turban and Aronson, 2001)
As it is aptly called, the bSURE Strategic Decision Support Tool is a computerized information
system that combines data, analytical tools and models to support semi-structured and
unstructured management decision-making.
It can be used in the following stages of decision-making process.
o Identify and define potential problems and/or opportunities,
o Develop alternative solutions to the problem, and
o Select an alternative or a course of action.
As it is a decision support for a rationale decision maker, bSURE decision support tool or system
offers a substantial amount of analytical tools for user to evaluate the robustness of a decision
model.
2 Why AHP?
When evaluating complex issues, factors contributing to the issue are not always equally
contributing to the objective. Many a time, decision makers tend to make all factors equally
contributable making the final judgment skewed.
We use a known technique devised by Professor Thomas Saaty called Analytic Hierarchy
Process (AHP), which simplifies the calculation of weights for each action to the mission or
objective (Saaty, 2000 and Islam, 2003).
As these weights are ratio scales, they can therefore be used to leverage the weight of
contribution to the cost to the benefits in a BOCR (Benefits-Opportunities-Costs-Risks) decision
model, making decision making more systematic and justifiable (Saaty, 2005).
Making consensus decisions are now more systematic, objective, transparent, efficient and
effective.
For more details on this process, there are many websites that contain the relevant information.

8/7/2019 bSURE TimbangTara Manual_R8
http://slidepdf.com/reader/full/bsure-timbangtara-manualr8 4/38
Y Gamble if U Can bSURE?
_______________________________________________________
bSURE TimbangTara Manual_R8 Page 4of 38 © Copyright Reserved 2007
bSure Solutions Sdn Bhd
3 Basic steps
The following are the basic steps to using bSure Strategic Decision Support and Gap Analysis
Tool, namely:
1. Defining the goal or objectives of the evaluation,
2. Defining the criteria (and sub criteria),3. Selecting the alternatives or options
4. Compare all criteria within the same level and for all subcriteria,
5. Synthesize the decision model,
6. Defining the scales associated to the relevant criteria,
7. Ranking the alternatives, which can be optional depending on the type of evaluation
required. And
8. Analyze the robustness of the model using available analytic tools.
4 bSURE Strategic Decision Support Tool – TIMBANGTARA
bSURE TimbangTara are designed to be user friendly. Upon executing the application, the above
splash screen (in orange) will be displayed on top of the main screen. You would see the version
and details of your license; including the expiry date at the top right corner of the splash screen.Click any area inside the splash screen:
The main window can be resized according to individual user’s needs. Click the maximize button
for a bigger window:
8/7/2019 bSURE TimbangTara Manual_R8
http://slidepdf.com/reader/full/bsure-timbangtara-manualr8 5/38
Y Gamble if U Can bSURE?
_______________________________________________________
bSURE TimbangTara Manual_R8 Page 5of 38 © Copyright Reserved 2007
bSure Solutions Sdn Bhd
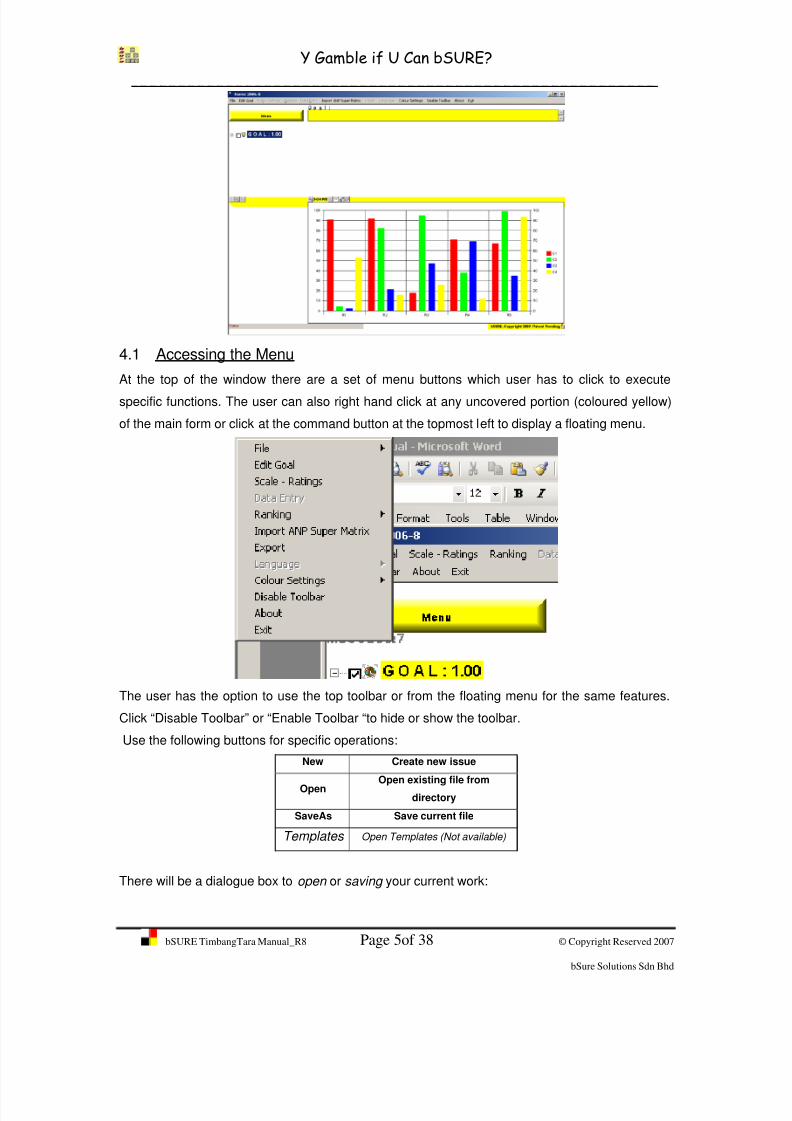
4.1 Accessing the Menu
At the top of the window there are a set of menu buttons which user has to click to execute
specific functions. The user can also right hand click at any uncovered portion (coloured yellow)
of the main form or click at the command button at the topmost left to display a floating menu.
The user has the option to use the top toolbar or from the floating menu for the same features.
Click “Disable Toolbar” or “Enable Toolbar “to hide or show the toolbar.
Use the following buttons for specific operations:
New Create new issue
OpenOpen existing file from
directory
SaveAs Save current file
Templates Open Templates (Not available)
There will be a dialogue box to open or saving your current work:

8/7/2019 bSURE TimbangTara Manual_R8
http://slidepdf.com/reader/full/bsure-timbangtara-manualr8 6/38
Y Gamble if U Can bSURE?
_______________________________________________________
bSURE TimbangTara Manual_R8 Page 6of 38 © Copyright Reserved 2007
bSure Solutions Sdn Bhd
In order to continue this user training better, let’s assume a problem. Let’s assume we want to
buy a car. Let’s assume a decision model that is based on the following hierarchy:
MissionChoose a Car
Reliability ComfortCosts Safety
Gen 2
Spektra
Honda City
Waja
Spektra
Waja
Honda City
Gen 2
Waja
Gen 2
Spektra
Honda City
Waja
Gen 2
Spektra
Honda City
As you notice, in this presentation, same list of Alternatives is repeated for all criteria, meaning no
scales are required for this model. The relative weights for each criterion are calculated with
respect to the criterion from relative comparison of each alternative against another on pairwise
or set of two-basis.
This is good because hard data are sometimes difficult to come by but we need to rely on
subjective parameters. Humans have a good sense of notion and can judge if a car is more
comfortable than the other by just taking a feel at a show room.
We could calculate the weights by substituting the hard data by comparing instead the
alternatives in respect to the criterion. This require us using the AHP technique.

8/7/2019 bSURE TimbangTara Manual_R8
http://slidepdf.com/reader/full/bsure-timbangtara-manualr8 7/38
Y Gamble if U Can bSURE?
_______________________________________________________
bSURE TimbangTara Manual_R8 Page 7of 38 © Copyright Reserved 2007
bSure Solutions Sdn Bhd
First, click menu File->New to clear the current workspace and prepare for the next problem
definition stage, where we need to define the goal.
4.2 Defining goal
When defining goal, ensure that we are clear in what we want to decide or evaluate on. This goal
will be later displayed throughout the weighing process to ensure user focus.From the menu tool click menu Edit Goal, and the following command button appears on the
right of Goal :
Type “Buy Best Car” and click the tick button to save.
4.3 Treeview
The Treeview is where we insert the criterion.
For a floating menu, you can right-hand click the root node (at the ‘Goal’ text) or at any nodes.
Select Add Node, to add the first criteria. Type “Cost” and click OK.
Type in the description of the criterion. These details will be displayed as Tool tip.
8/7/2019 bSURE TimbangTara Manual_R8
http://slidepdf.com/reader/full/bsure-timbangtara-manualr8 8/38
Y Gamble if U Can bSURE?
_______________________________________________________
bSURE TimbangTara Manual_R8 Page 8of 38 © Copyright Reserved 2007
bSure Solutions Sdn Bhd
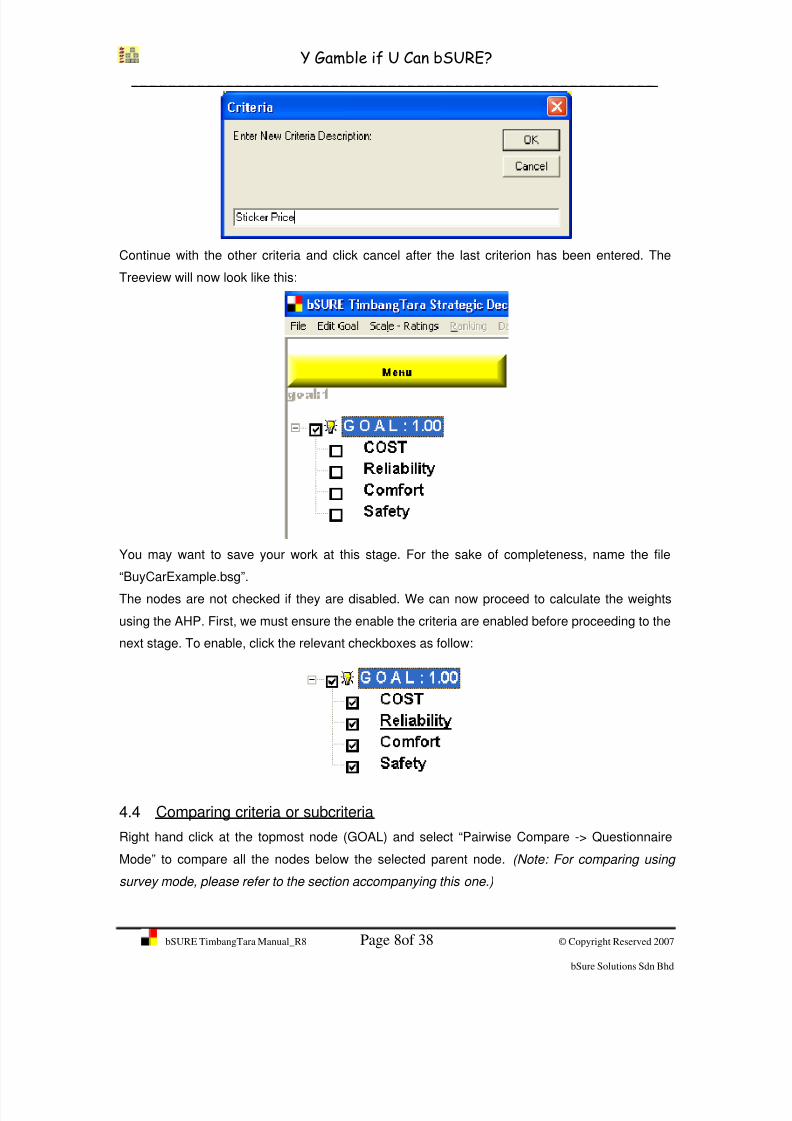
Continue with the other criteria and click cancel after the last criterion has been entered. The
Treeview will now look like this:
You may want to save your work at this stage. For the sake of completeness, name the file
“BuyCarExample.bsg”.
The nodes are not checked if they are disabled. We can now proceed to calculate the weights
using the AHP. First, we must ensure the enable the criteria are enabled before proceeding to the
next stage. To enable, click the relevant checkboxes as follow:
4.4 Comparing criteria or subcriteria
Right hand click at the topmost node (GOAL) and select “Pairwise Compare -> Questionnaire
Mode” to compare all the nodes below the selected parent node. (Note: For comparing using
survey mode, please refer to the section accompanying this one.)

8/7/2019 bSURE TimbangTara Manual_R8
http://slidepdf.com/reader/full/bsure-timbangtara-manualr8 9/38
Y Gamble if U Can bSURE?
_______________________________________________________
bSURE TimbangTara Manual_R8 Page 9of 38 © Copyright Reserved 2007
bSure Solutions Sdn Bhd
The following compare form will prompt you:
Select the level of importance of one criterion compare to the other based on the following scale:
The form displays many levels; described as follow:

8/7/2019 bSURE TimbangTara Manual_R8
http://slidepdf.com/reader/full/bsure-timbangtara-manualr8 10/38
Y Gamble if U Can bSURE?
_______________________________________________________
bSURE TimbangTara Manual_R8 Page 10of 38 © Copyright Reserved 2007
bSure Solutions Sdn Bhd
The user is prompted with 9 levels of relative values. These values signify the comparison
between two factors or a pair of factors. Hence, the term pairwise comparison where a set of
factors or criteria is compared two at a time with respect to the Goal.
1 – Equally important
3 – Factor A is moderately more important than Factor B
5 – A is strongly more important
7 – A is very strongly more important
9 – A is extremely more important
2,4,6,8 are intermediate levels.
A ‘0’ means no vote has been taken yet. All comparison must be completed before any analysis
can be done.
By default, the levels scope the following action to the following statement:
“With respect to a goal, compare the relative importance of Factor A to Factor B” or you can
rephrase it by pressing the Phrase->Save Phrase button.
Use button to invert the comparison. Inverting the comparison will change the way the
questionnaire is read, i.e.:Factor B, instead, is more important:
Use the following buttons for the specific operations of the form:
Next Comparison
End the Comparison
Back to Previous Comparison

8/7/2019 bSURE TimbangTara Manual_R8
http://slidepdf.com/reader/full/bsure-timbangtara-manualr8 11/38
Y Gamble if U Can bSURE?
_______________________________________________________
bSURE TimbangTara Manual_R8 Page 11of 38 © Copyright Reserved 2007
bSure Solutions Sdn Bhd
Skip the comparison process
Once either End button is clicked, the comparison process has basically ended, and the user is
then prompted with the following Analyze Pairwise Results form:
Clicking the Skip button will skip the comparison process and bring us to the same form.
The blue progress bars on the right display the corresponding weights:
The weights are displayed when the mouse hovers on top of the corresponding bar. The cells
represent the following Pairwise Comparison Matrix and should be equal to the levels selected
during the pairwise comparison process.
COS Rel Com Saf
COST 1 1/4 3 1
Reliability 4 1 2 2
Comfort 1/3 1/2 1 1
Safety 1 1/2 1 1

8/7/2019 bSURE TimbangTara Manual_R8
http://slidepdf.com/reader/full/bsure-timbangtara-manualr8 12/38
Y Gamble if U Can bSURE?
_______________________________________________________
bSURE TimbangTara Manual_R8 Page 12of 38 © Copyright Reserved 2007
bSure Solutions Sdn Bhd
The Pairwise Comparison Matrix (PCM) is colour coded. Except for the values along the
diagonal, a pair of reciprocals is grouped with the same colour. The degree of importance is read
horizontally from left to right; in this example, Reliability is between strongly and moderately
more important than COST.
Hover the mouse on top of the column title (in this example, COS ), for immediate details (tooltip)
of the criteria, on the progress bar for the detailed weights of the criteria.
If you notice, the consistency index (C.I) is coloured red since the value is greater than 0.1. For a
good comparison, the C.I should be less than 0.1. The software has a function that will advise the
user the specific cell that will give the most gain in terms of consistency when the value is
changed.
The values of the cells are not always based on integers (i.e. 1, 2, 3, etc) as you would see later.
These values can still be changed by double clicking the specific cell. Only the diagonal cells,
which are always 1, are not modifiable.
Use the following command or menu buttons for the specific operations:
Recalculate using the current matrix
Revert to old comparison matrix
values
Most Gain Copy value to coloured cell
2nd
Most
Gain
Copy value to coloured cell
SaveSave the current pairwise and weights
onto the file
Recalculate
Recalculate using the current matrixAnalysis
Reset
Revert to old matrix values
Quit Close form
Help Help (Currently not implemented)
To improve the consistency, recalculate the current matrix, by pressing . Nevertheless, the user
may want to proceed with the current values; only that the decision making process will beconsistently inconsistent ; so to speak.
The textbox at the bottom of the Matrix keeps the historical information of previous comparisons.
Once ‘Save’ is initiated, the weights are displayed at the main form as the cell Local Weights
(LW). The system will automatically calculate the Global Weights (GW):

8/7/2019 bSURE TimbangTara Manual_R8
http://slidepdf.com/reader/full/bsure-timbangtara-manualr8 13/38
Y Gamble if U Can bSURE?
_______________________________________________________
bSURE TimbangTara Manual_R8 Page 13of 38 © Copyright Reserved 2007
bSure Solutions Sdn Bhd
GW is calculated based on the following formula:
Local Weight X Parent Weight
In this case, the parent (Node Goal) weight is 1.
4.4.1 Using the Survey mode to create the Pairwise Comparison
Matrix
If survey mode were selected, the user will be prompted with different form. Depending on which
factors are more important, click the appropriate value towards the more important factor as
shown below.
The above implements the same following Pairwise Comparison Matrix. Take special note of the
fractional values and its position in the above input format.
COS Rel Com Saf
COST 1 1/4 3 1
Reliability 4 1 2 2
Comfort 1/3 1/2 1 1
Safety 1 1/2 1 1

8/7/2019 bSURE TimbangTara Manual_R8
http://slidepdf.com/reader/full/bsure-timbangtara-manualr8 14/38
Y Gamble if U Can bSURE?
_______________________________________________________
bSURE TimbangTara Manual_R8 Page 14of 38 © Copyright Reserved 2007
bSure Solutions Sdn Bhd
4.5 Defining Alternatives
Since there is no Scales used for this decision model, we will proceed with defining the
alternatives.
At the Alternatives Grid block, right-hand click for another floating menu:
Select “Add Option” to add the first alternative, “WAJA”. Continuously, add the rest and
terminate the list by selecting “Cancel” after the last alternative.
4.6 Defining Rating for the each criterion
To start defining the rating for each criterion, click scale-ratings . Please take note
that no scales are used for this particular model. We will show you another problem example with
will use scales for rating.

8/7/2019 bSURE TimbangTara Manual_R8
http://slidepdf.com/reader/full/bsure-timbangtara-manualr8 15/38
Y Gamble if U Can bSURE?
_______________________________________________________
bSURE TimbangTara Manual_R8 Page 15of 38 © Copyright Reserved 2007
bSure Solutions Sdn Bhd
There are 2 ways of doing the comparison; by relative pairwise comparison or by relative data
comparison. Suppose that we have the Sticker Prices from the ever eager salesmen, we could
directly put these values into the system.
From the left Criteria List Box, select “COST” and then from the form menu, select Relative-
>Data:
Insert the appropriate values (in this case, multiples of 10RMs):

8/7/2019 bSURE TimbangTara Manual_R8
http://slidepdf.com/reader/full/bsure-timbangtara-manualr8 16/38
Y Gamble if U Can bSURE?
_______________________________________________________
bSURE TimbangTara Manual_R8 Page 16of 38 © Copyright Reserved 2007
bSure Solutions Sdn Bhd
The contribution of inputs to the scale is calculated based on the actual
numerical data, e.g. price of a car, rental rate, and population divided by the total.
This method is called normalization. The software will automatically calculate the
normalized values.
You can select either normal or inverse mode. For this example, as it is cost
factor, where smaller value is better, select from the form menu, Evaluate-
>Inverse; and click OK to proceed.
8/7/2019 bSURE TimbangTara Manual_R8
http://slidepdf.com/reader/full/bsure-timbangtara-manualr8 17/38
Y Gamble if U Can bSURE?
_______________________________________________________
bSURE TimbangTara Manual_R8 Page 17of 38 © Copyright Reserved 2007
bSure Solutions Sdn Bhd
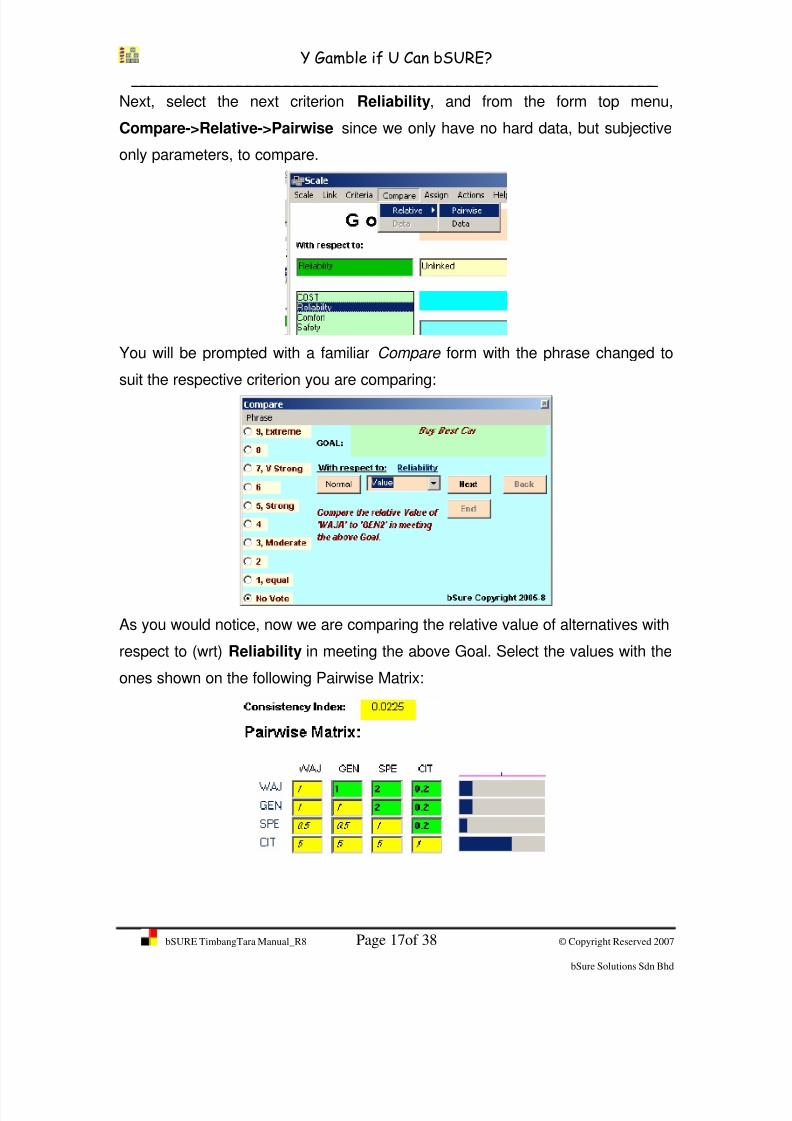
Next, select the next criterion Reliability, and from the form top menu,
Compare->Relative->Pairwise since we only have no hard data, but subjective
only parameters, to compare.
You will be prompted with a familiar Compare form with the phrase changed to
suit the respective criterion you are comparing:
As you would notice, now we are comparing the relative value of alternatives with
respect to (wrt) Reliability in meeting the above Goal. Select the values with the
ones shown on the following Pairwise Matrix:
8/7/2019 bSURE TimbangTara Manual_R8
http://slidepdf.com/reader/full/bsure-timbangtara-manualr8 18/38
Y Gamble if U Can bSURE?
_______________________________________________________
bSURE TimbangTara Manual_R8 Page 18of 38 © Copyright Reserved 2007
bSure Solutions Sdn Bhd
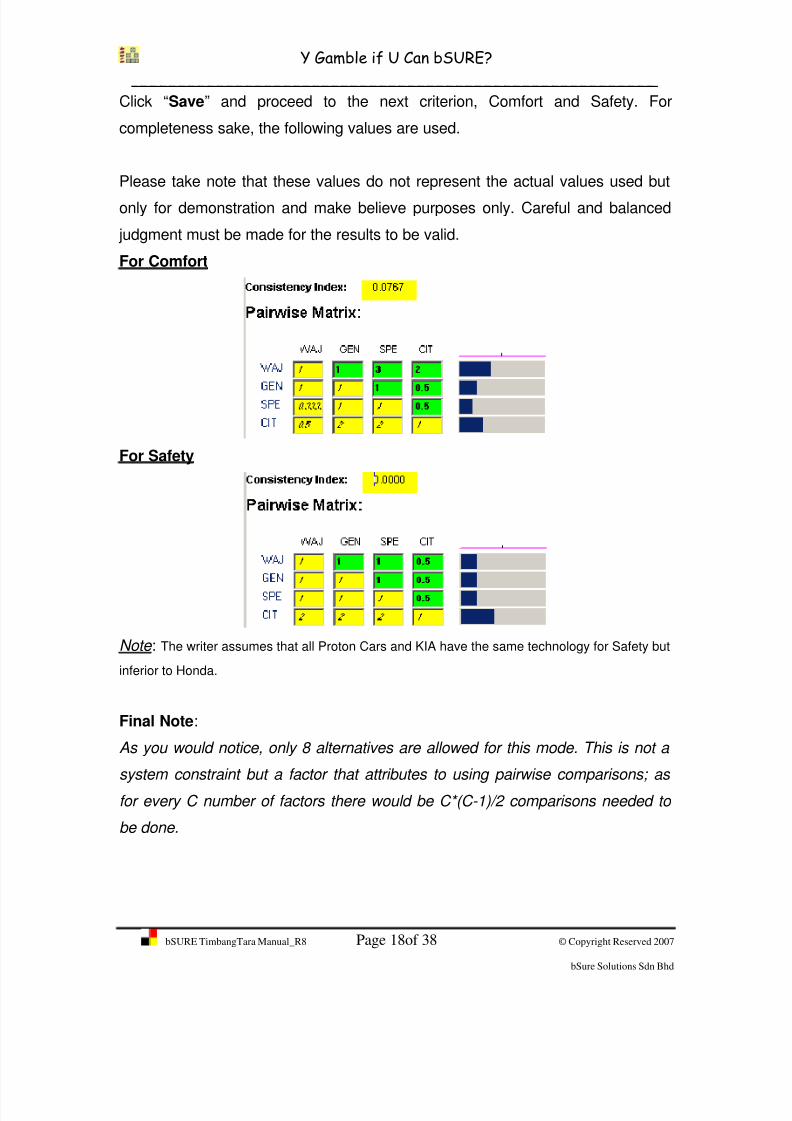
Click “Save” and proceed to the next criterion, Comfort and Safety. For
completeness sake, the following values are used.
Please take note that these values do not represent the actual values used but
only for demonstration and make believe purposes only. Careful and balanced
judgment must be made for the results to be valid.
For Comfort
For Safety
Note : The writer assumes that all Proton Cars and KIA have the same technology for Safety but
inferior to Honda.
Final Note:
As you would notice, only 8 alternatives are allowed for this mode. This is not a
system constraint but a factor that attributes to using pairwise comparisons; as
for every C number of factors there would be C*(C-1)/2 comparisons needed to
be done.
8/7/2019 bSURE TimbangTara Manual_R8
http://slidepdf.com/reader/full/bsure-timbangtara-manualr8 19/38
Y Gamble if U Can bSURE?
_______________________________________________________
bSURE TimbangTara Manual_R8 Page 19of 38 © Copyright Reserved 2007
bSure Solutions Sdn Bhd
For a 4 criteria problem, there would be 4*3/2 = 6 comparisons to do. It is
assumed that a user in the demo software can only have the physical mental
focus of making 8*7/2 = 28 comparisons, which can take more than 1 hour.
In future versions, we may increase this number if there is a need for it. For the
other mode, we do not restrict the number of alternatives.
At the Scale Form click OK to revert to Main form.
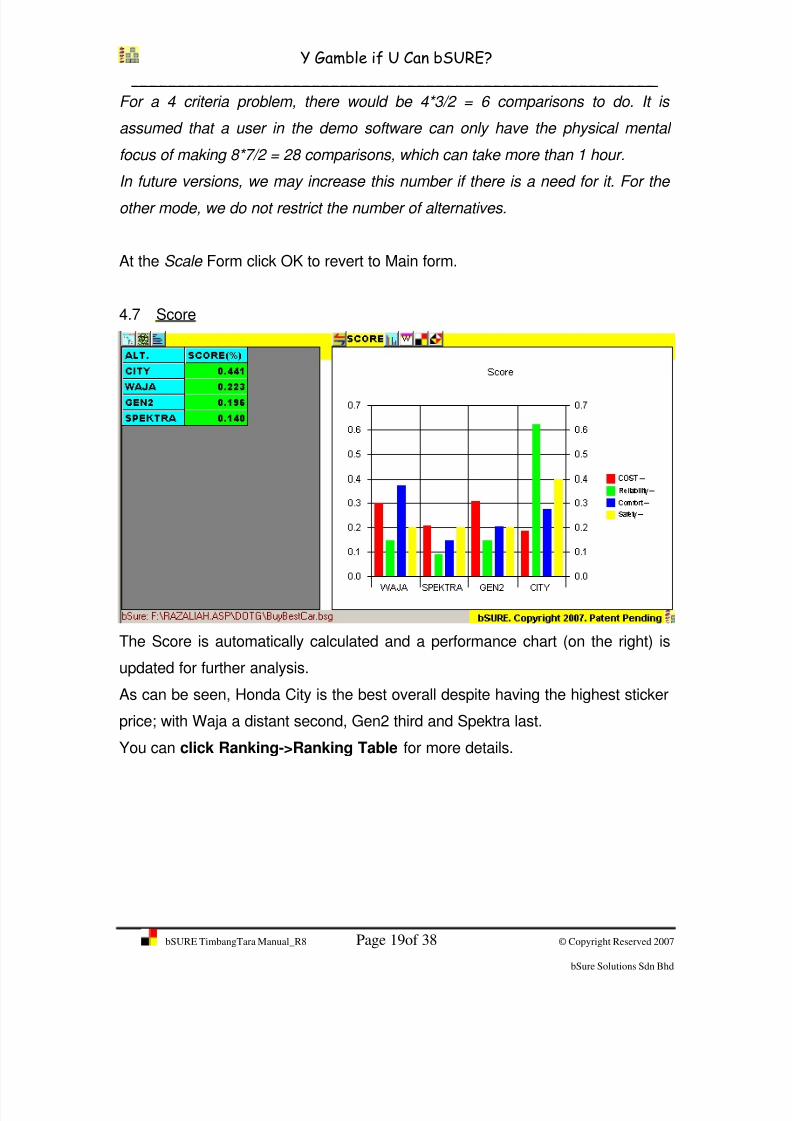
4.7 Score
The Score is automatically calculated and a performance chart (on the right) is
updated for further analysis.
As can be seen, Honda City is the best overall despite having the highest sticker
price; with Waja a distant second, Gen2 third and Spektra last.
You can click Ranking->Ranking Table for more details.

8/7/2019 bSURE TimbangTara Manual_R8
http://slidepdf.com/reader/full/bsure-timbangtara-manualr8 20/38
Y Gamble if U Can bSURE?
_______________________________________________________
bSURE TimbangTara Manual_R8 Page 20of 38 © Copyright Reserved 2007
bSure Solutions Sdn Bhd
SortTo sort the rank the alternative
according to score
Unsort To revert to previous display
Ideal Display score in Ideal mode
ClustersAlternative scoring format according
to group
Select Clusters for alternative format:
As calculated weights by AHP are basically ratio scales, we can do some handy
calculations. You can evaluate the scoring according to one of the following
format:
8/7/2019 bSURE TimbangTara Manual_R8
http://slidepdf.com/reader/full/bsure-timbangtara-manualr8 21/38
Y Gamble if U Can bSURE?
_______________________________________________________
bSURE TimbangTara Manual_R8 Page 21of 38 © Copyright Reserved 2007
bSure Solutions Sdn Bhd
o BO/CR, where the denominator (D) list are divided by numerator (N) list
according to the following formulation
Score of D1 * Score of D2 * ……Dn , etc / Score of N1 * N2 * …Nn
o B+O-(C+R)
Score of D1+D2 +….Dn – (N1+N2 +….Nn )
o B+O/(C+R)
Score of D1+D2 +….Dn / (N1+N2 +….Nn )
This type of formulas would come in handy in analyzing problems that require
evaluation of Benefits over Cost, Value for Money, etc.
Referring to our problem, the Honda City is proven to be a ‘Value for Money’ as it
gives more benefits over unit cost comparing to other brands. It also scores well
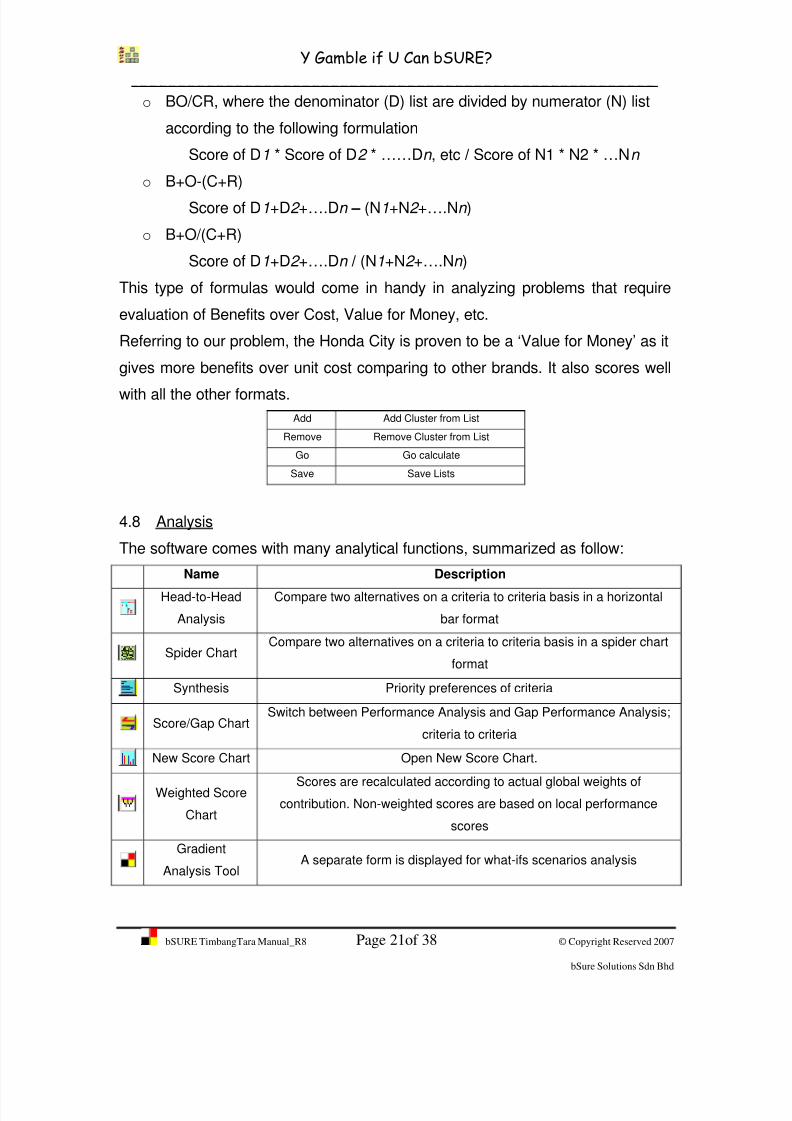
with all the other formats.Add Add Cluster from List
Remove Remove Cluster from List
Go Go calculate
Save Save Lists
4.8 Analysis
The software comes with many analytical functions, summarized as follow:
Name Description
Head-to-Head
Analysis
Compare two alternatives on a criteria to criteria basis in a horizontal
bar format
Spider ChartCompare two alternatives on a criteria to criteria basis in a spider chart
format
Synthesis Priority preferences of criteria
Score/Gap ChartSwitch between Performance Analysis and Gap Performance Analysis;
criteria to criteria
New Score Chart Open New Score Chart.
Weighted Score
Chart
Scores are recalculated according to actual global weights ofcontribution. Non-weighted scores are based on local performance
scores
Gradient
Analysis ToolA separate form is displayed for what-ifs scenarios analysis

8/7/2019 bSURE TimbangTara Manual_R8
http://slidepdf.com/reader/full/bsure-timbangtara-manualr8 22/38
Y Gamble if U Can bSURE?
_______________________________________________________
bSURE TimbangTara Manual_R8 Page 22of 38 © Copyright Reserved 2007
bSure Solutions Sdn Bhd
Overall Score
Chart
Overall score in vertical bar format without the detailed criteria
performance.
Alternative
PresentationDouble click chart for alternative chart in line format
Click the command button to activate the tool function.
4.8.1 Head-to-Head Analysis
Next Alternatives Pair
Previous Alternatives Pair
New Head-to-Head Window
4.8.2 Spider Chart
Spider Chart is a graphical way to compare data displayed in a “web-like” form. It
is used to evaluate multiple alternatives based on multiple criteria (Rogers,
Cephas B, 1995).

8/7/2019 bSURE TimbangTara Manual_R8
http://slidepdf.com/reader/full/bsure-timbangtara-manualr8 23/38
Y Gamble if U Can bSURE?
_______________________________________________________
bSURE TimbangTara Manual_R8 Page 23of 38 © Copyright Reserved 2007
bSure Solutions Sdn Bhd
Weighted
ViewRedisplay chart using weighted values
NewNew Chart. To select different set of
alternatives pair
4.8.3 Synthesis
The priorities of the criteria are displayed when the button is pressed. It is sorted
in descending order. The top 80% of criteria contributing to the goal is marked in
red by the last criterion.

8/7/2019 bSURE TimbangTara Manual_R8
http://slidepdf.com/reader/full/bsure-timbangtara-manualr8 24/38
Y Gamble if U Can bSURE?
_______________________________________________________
bSURE TimbangTara Manual_R8 Page 24of 38 © Copyright Reserved 2007
bSure Solutions Sdn Bhd
4.8.4 Button for switching between Performance and Gap ScoreChart
This button switches between rating performance and gaps in a criterion-to-
criterion.
The current chart will instead show a chart showing differences from the ideal
values.
8/7/2019 bSURE TimbangTara Manual_R8
http://slidepdf.com/reader/full/bsure-timbangtara-manualr8 25/38
Y Gamble if U Can bSURE?
_______________________________________________________
bSURE TimbangTara Manual_R8 Page 25of 38 © Copyright Reserved 2007
bSure Solutions Sdn Bhd
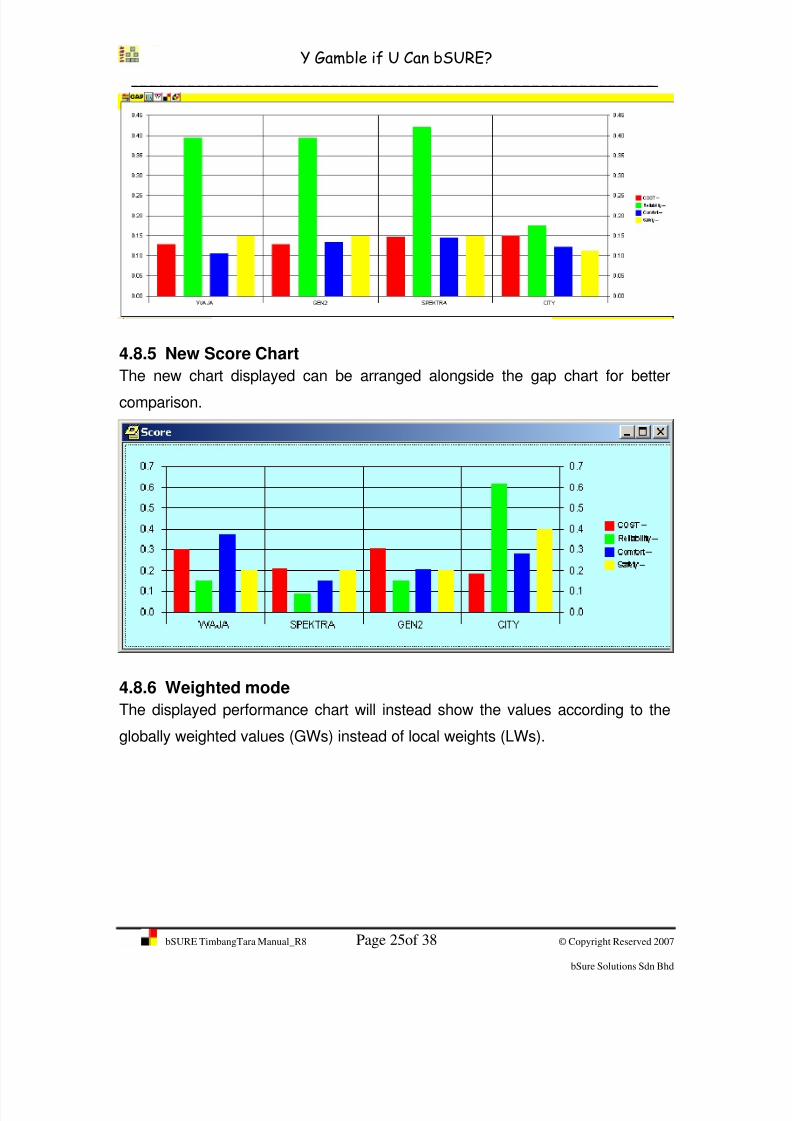
4.8.5 New Score Chart
The new chart displayed can be arranged alongside the gap chart for better
comparison.
4.8.6 Weighted mode
The displayed performance chart will instead show the values according to the
globally weighted values (GWs) instead of local weights (LWs).

8/7/2019 bSURE TimbangTara Manual_R8
http://slidepdf.com/reader/full/bsure-timbangtara-manualr8 26/38
Y Gamble if U Can bSURE?
_______________________________________________________
bSURE TimbangTara Manual_R8 Page 26of 38 © Copyright Reserved 2007
bSure Solutions Sdn Bhd
4.8.7 Gradient Analytical Tool
The tool has three sections. The left section consists of the set of bars,representing criteria and global weights of the top nodes in the hierarchy. Any
lower level nodes are clustered to the first level. (Goal is considered as root or
zero level.)
The right section represents the scores of the alternatives, whilst the lower line
graphs represent the gradient sensitivity when the value of a selected criterion is
varied.

8/7/2019 bSURE TimbangTara Manual_R8
http://slidepdf.com/reader/full/bsure-timbangtara-manualr8 27/38
Y Gamble if U Can bSURE?
_______________________________________________________
bSURE TimbangTara Manual_R8 Page 27of 38 © Copyright Reserved 2007
bSure Solutions Sdn Bhd
The colour of the central vertical line corresponds to the colour of the criteria at
the top left corner. To select the criterion and vary the value, click the criterion at
the top left section. An inversed coloured bar will appear and when the criterion
bar is moved, this new vertical line will also be varied along the horizontal axis.
The extrapolated value for each alternative new score is displayed at the top right
section. Click the specific criteria bar, press the shift button and use the mouse to
move the bar either left or right, for a new value.
We can deduce that even by varying the criterion substantially from a value of
0.1845 to almost over 0.71, will there be a change in ranking. In this case, WAJA
will overtake CITY and GEN2 come a close third. This basically tells us that only
if COST is changed to over 3.8 times will a rank reversal takes place. Or if an
error had happened during the first Pairwise Matrix judgement, WAJA will be the
right choice. But this is unlikely since the amount of change needed is very high.
So we can say that our decision model is sufficiently robust against a rank
reversal. This will frequently happen if the Consistency Index is very high.
4.8.8 Series
This button shows the overall scores in a simple ascending format.
4.8.9 Alternate Format for Performance Chart
Click the chart for the performance graph in a 2-D line format.

8/7/2019 bSURE TimbangTara Manual_R8
http://slidepdf.com/reader/full/bsure-timbangtara-manualr8 28/38

8/7/2019 bSURE TimbangTara Manual_R8
http://slidepdf.com/reader/full/bsure-timbangtara-manualr8 29/38
Y Gamble if U Can bSURE?
_______________________________________________________
bSURE TimbangTara Manual_R8 Page 29of 38 © Copyright Reserved 2007
bSure Solutions Sdn Bhd
This is has been made a brief explanation to a lengthy subject; the users need to
refer to appropriate literature on the origins of and the needs for Open System
(Ideal Synthesis) and Close System (Distributive Synthesis) to prevent or
allowing rank reversals in AHP.
bSURE TimbangTara has incorporated a mean to allow and avoid rank reversals
for closed and open system systems respectively.
A closed system is when there is a scarcity, for example distribution of a fixed
RND budget or a choice between 3 parliamentary candidates.
An open system is when there is no scarcity (or in abundance); where resources
can be added or removed.
4.10 End of Training SessionThis section ends the basic training session, using rating by absolute comparison
between defined strategic alternatives or options.
In many cases, specific scales are required for each criterion. In the next section
we will introduce how to define scale using this software.
4.11 Defining Levels of Scale
Revisiting scale form, you will see that on the right hand side, excluding 0, a
group of text boxes that can specify up to eight levels of scale.
To define scale, the chosen criterion must be assigned to a scale.

8/7/2019 bSURE TimbangTara Manual_R8
http://slidepdf.com/reader/full/bsure-timbangtara-manualr8 30/38
Y Gamble if U Can bSURE?
_______________________________________________________
bSURE TimbangTara Manual_R8 Page 30of 38 © Copyright Reserved 2007
bSure Solutions Sdn Bhd
To define scale, select scale from main menu to get the Scale form as follows:
There are 3 columns to work from, namely: - criteria, scale and question
columns.
4.11.1 Add new and register new scale
You have to register all scales before we can assign them to a particular
criterion. Select the New Menu, type the new Scale name at the textbox located
on top second list box, and select Register to confirm the scale:
Repeat the process until all scales are registered.

8/7/2019 bSURE TimbangTara Manual_R8
http://slidepdf.com/reader/full/bsure-timbangtara-manualr8 31/38
Y Gamble if U Can bSURE?
_______________________________________________________
bSURE TimbangTara Manual_R8 Page 31of 38 © Copyright Reserved 2007
bSure Solutions Sdn Bhd
4.11.2 Assigning scales
From Assign menu, you can have options to assign to specific criterion, all
criteria or un-assign the criterion. If a criterion is not assigned, it is considered
assigned for absolute comparison.
4.11.3 Menu
The menu commands are listed as follow:
Import ScaleImport Scale from other files. Function is not
available in this version
Create Generic
Scales
Create scales automatically from current
criteria but are not linked
Create Generic
Scales
Create Generic Scales and automatically link to
the criteria
New Create new scale
Register Register Scale
Scale
Save ScaleSave Scale locally. However, the scale is not
permanently saved in the file.
Link To Worksheet Link to Worksheet
Link to MapXLink to MapX. Function is not enabled in
this version Link
Link to ADO Link to ADO Compatible Databases
Link To Data Link Criteria to Data kept in external databaseCriteria
Unlink To Data Unlink criteria from database
Relative Relative Pairwise ComparisonCompare
Data Data Comparison
1 Assign Selected Scale to Selected CriterionAll Assign Selected Scale to All CriteriaAssign
Unassign Unassign selected criterion
Notes Function not available in this version.
Edit Levels Change Level names
Edit Ranges Change Range specifications
Edit Question Change Question associated with current scaleActions
Edit Scale
DescriptionChange Scale Description.
Help Function not available online in this version
Save Button
When this button appears, the text box is in
Edit mode. Click this button to save.
Range Text <= Select <= mode as range operator
>=Select >= mode as range operator. Function
not available in this version.
Construct Text Reconstruct Range Text

8/7/2019 bSURE TimbangTara Manual_R8
http://slidepdf.com/reader/full/bsure-timbangtara-manualr8 32/38
Y Gamble if U Can bSURE?
_______________________________________________________
bSURE TimbangTara Manual_R8 Page 32of 38 © Copyright Reserved 2007
bSure Solutions Sdn Bhd
4.11.4 Using ranged scale
We can specify ranged values to the scale as shown in the following example:
To edit a ranged scale, select Edit Ranges.
8/7/2019 bSURE TimbangTara Manual_R8
http://slidepdf.com/reader/full/bsure-timbangtara-manualr8 33/38
Y Gamble if U Can bSURE?
_______________________________________________________
bSURE TimbangTara Manual_R8 Page 33of 38 © Copyright Reserved 2007
bSure Solutions Sdn Bhd
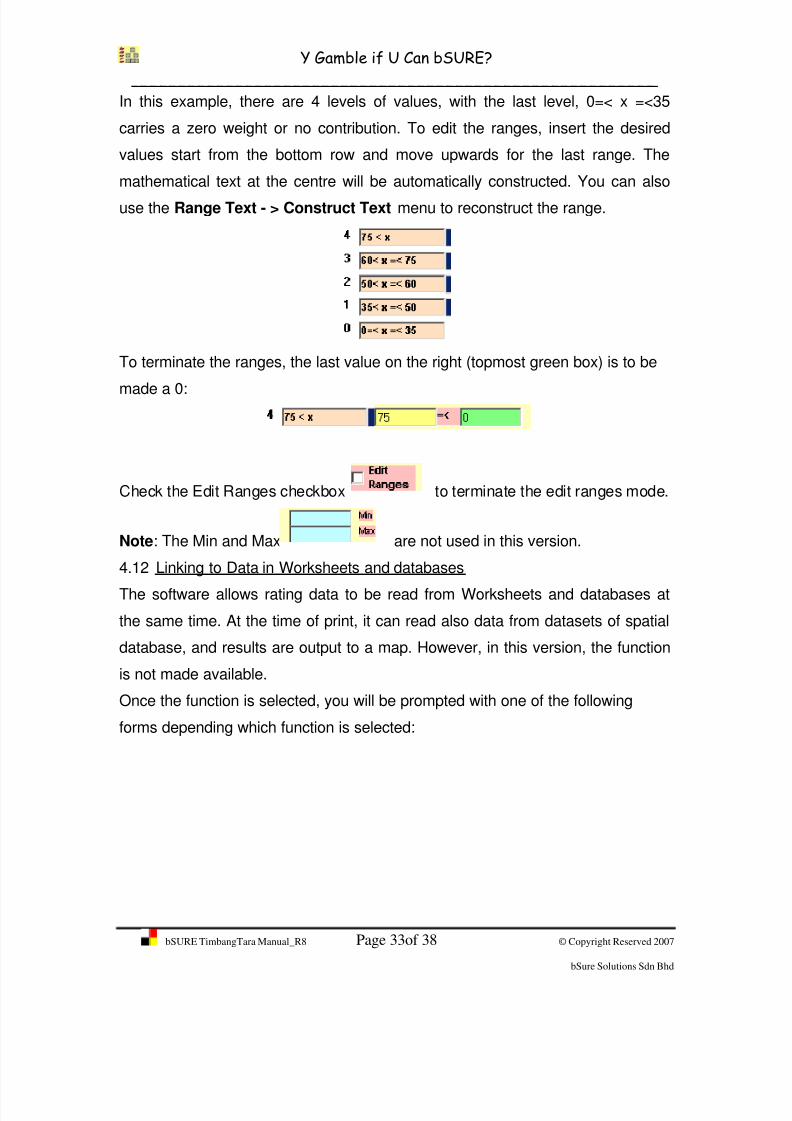
In this example, there are 4 levels of values, with the last level, 0=< x =<35
carries a zero weight or no contribution. To edit the ranges, insert the desired
values start from the bottom row and move upwards for the last range. The
mathematical text at the centre will be automatically constructed. You can also
use the Range Text - > Construct Text menu to reconstruct the range.
To terminate the ranges, the last value on the right (topmost green box) is to be
made a 0:
Check the Edit Ranges checkbox to terminate the edit ranges mode.
Note: The Min and Max are not used in this version.
4.12 Linking to Data in Worksheets and databases
The software allows rating data to be read from Worksheets and databases at
the same time. At the time of print, it can read also data from datasets of spatial
database, and results are output to a map. However, in this version, the function
is not made available.
Once the function is selected, you will be prompted with one of the following
forms depending which function is selected:
8/7/2019 bSURE TimbangTara Manual_R8
http://slidepdf.com/reader/full/bsure-timbangtara-manualr8 34/38
Y Gamble if U Can bSURE?
_______________________________________________________
bSURE TimbangTara Manual_R8 Page 34of 38 © Copyright Reserved 2007
bSure Solutions Sdn Bhd
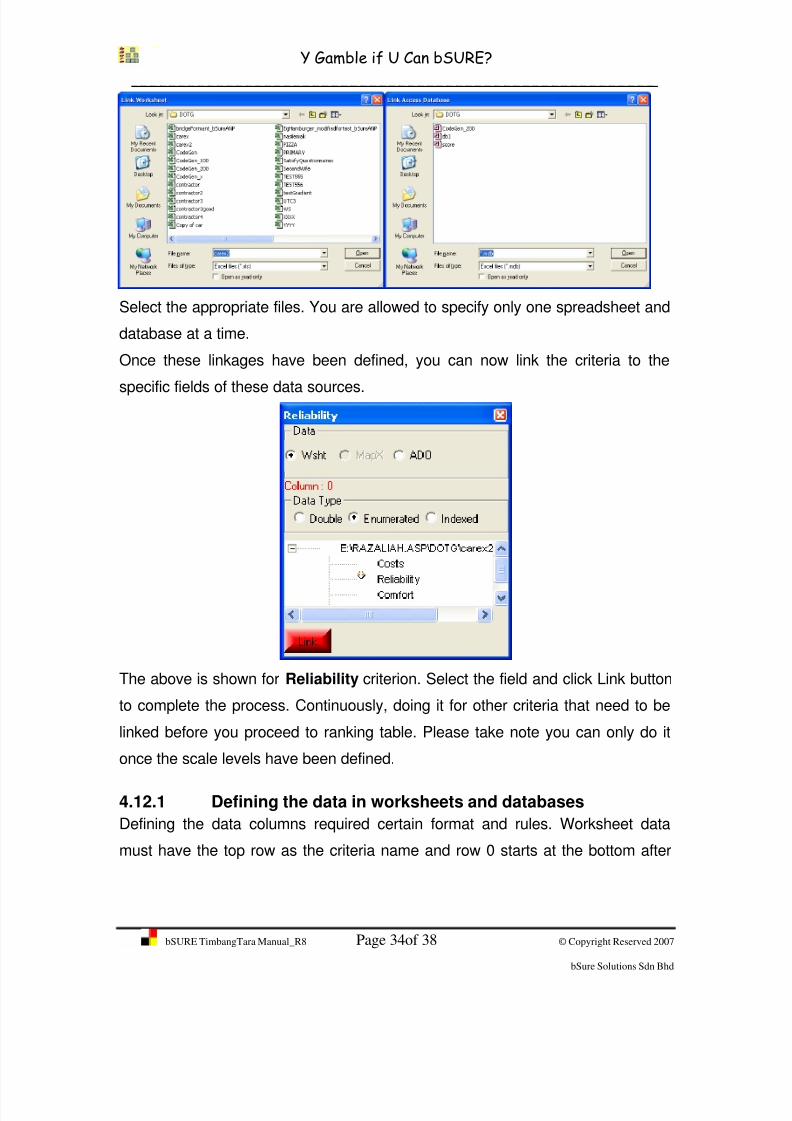
Select the appropriate files. You are allowed to specify only one spreadsheet and
database at a time.
Once these linkages have been defined, you can now link the criteria to the
specific fields of these data sources.
The above is shown for Reliability criterion. Select the field and click Link button
to complete the process. Continuously, doing it for other criteria that need to be
linked before you proceed to ranking table. Please take note you can only do it
once the scale levels have been defined.
4.12.1 Defining the data in worksheets and databases
Defining the data columns required certain format and rules. Worksheet data
must have the top row as the criteria name and row 0 starts at the bottom after

8/7/2019 bSURE TimbangTara Manual_R8
http://slidepdf.com/reader/full/bsure-timbangtara-manualr8 35/38
Y Gamble if U Can bSURE?
_______________________________________________________
bSURE TimbangTara Manual_R8 Page 35of 38 © Copyright Reserved 2007
bSure Solutions Sdn Bhd
that. The first column of the topmost row must have the text “OPTION”
embedded.
Practically, not all data are needed in the worksheet. Only those data that are
numerical or real values can be stored in the Excel worksheet or database.
You can also use indexed value of the scale; although care must be taken that
the index exists, otherwise a zero rating is returned instead. For text scale, like
“Average” must be stored exactly as it is spelled.
For Microsoft Access (*.mdb files) files, the linked table must be named “bSure”
and “OPTIONS” field is mandatory and must be correctly spelt.

8/7/2019 bSURE TimbangTara Manual_R8
http://slidepdf.com/reader/full/bsure-timbangtara-manualr8 36/38
Y Gamble if U Can bSURE?
_______________________________________________________
bSURE TimbangTara Manual_R8 Page 36of 38 © Copyright Reserved 2007
bSure Solutions Sdn Bhd
During ranking, all the data linked to worksheet or database will be automatically
filled in.
For unlinked criteria, the user is required to go through the combo box list to
select the rating.
4.12.2 Ranking alternatives
Once you have finished the scales, you can now proceed to ranking the
alternatives as normal.

8/7/2019 bSURE TimbangTara Manual_R8
http://slidepdf.com/reader/full/bsure-timbangtara-manualr8 37/38
Y Gamble if U Can bSURE?
_______________________________________________________
bSURE TimbangTara Manual_R8 Page 37of 38 © Copyright Reserved 2007
bSure Solutions Sdn Bhd
Ranking is done either by manually run through the alternatives by answering the
questions; or are automatically read from the worksheet or database.
The legends described at the top of the table describe the mode of entry of the
ratings. The background colour of the criteria cell signifies the type of comparison
while the foreground colour the manner data is entered or linked.
4.13 Other Functions
Import ANP
Super Matrix
Import a Super Matrix from an Excel
Spreadsheet
Export
Export weights, orphaned criteria list
and other variables to an ActiveX
Container. The Container must be
licensed to receive.
Another important feature of the software is that once all the criteria have been
compared, enabling or disabling a criterion will automatically recalculate the
overall scores.
5 References
• Rogers, Cephas B. The Spider Chart: A Unique Tool for Performance
Appraisal, ASQC, 1995
• Saaty, T. Theory and Applications of the Analytic Network Process:
Decision Making with Benefits, Opportunities, Costs and Risks, RWS
Publications, 2005

8/7/2019 bSURE TimbangTara Manual_R8
http://slidepdf.com/reader/full/bsure-timbangtara-manualr8 38/38
Y Gamble if U Can bSURE?
_______________________________________________________
• Islam, R. The Analytic Hierarchy Process: An Effective Multi-Criteria
Decision Making Tool, International Islamic University Malaysia, 2003
• Saaty, T. The Fundamentals of Decision Making and Priority Theory, RWS
Publications, 2000
• Turban, E and Aronson, J.E. Decision Support Systems and Intelligent
Systems, Prentice-Hall, 2001


![IN THE HIGH COURT IN MALAYA AT KUALA LUMPUR IN THE …menurut satu perjanjian timbangtara antara pihak-pihak menurut seksyen 10 Akta Timbangtara 2005” (emphasis added). [48] The](https://static.fdocuments.us/doc/165x107/5e374cb32dc092149540be4e/in-the-high-court-in-malaya-at-kuala-lumpur-in-the-menurut-satu-perjanjian-timbangtara.jpg)


