
BSERVATIONAL and calibrating for error in MEDICAL ...
14
OBSERVATIONAL MEDICAL OUTCOMES PARTNERSHIP An empirical approach to measuring and calibrating for error in observational analyses Patrick Ryan on behalf of the OMOP research team 25 April 2013
Transcript of BSERVATIONAL and calibrating for error in MEDICAL ...

OBSERVATIONAL MEDICAL OUTCOMES PARTNERSHIP
OBSERVATIONAL MEDICAL OUTCOMES PARTNERSHIP
An empirical approach to measuring and calibrating for error in
observational analyses
Patrick Ryan on behalf of the OMOP research team
25 April 2013

OBSERVATIONAL MEDICAL OUTCOMES PARTNERSHIP
2
Consider a typical observational database study: Exploring clopidogrel and upper gastrointestinal
bleeding
p<.001
Error = distance from the point estimate to the true effect How far away from truth is RR=2.07?
Bias = expected value of the error distribution
When applying this type of analysis to this type of data for this type of outcome, how far on average is the estimate from the true value?
Coverage = probability that true effect is contained within confidence interval
When applying this type of analysis to this type of data for this type of outcome, do the 95% confidence intervals (1.66 to 2.58 in this case) actually contain the true relative risk 95% of the time?

OBSERVATIONAL MEDICAL OUTCOMES PARTNERSHIP
3
• Their recommendation: Use 3-4 negative controls, in addition to target outcome, as a means of assessing the plausibility of an observational analysis result
• Our recommendation: Use a large sample of negative (and positive) controls to empirically measure analysis operating characteristics and use them to calibrate your study finding
Learning from what's already known
OBSERVATIONAL MEDICAL OUTCOMES PARTNERSHIP
4
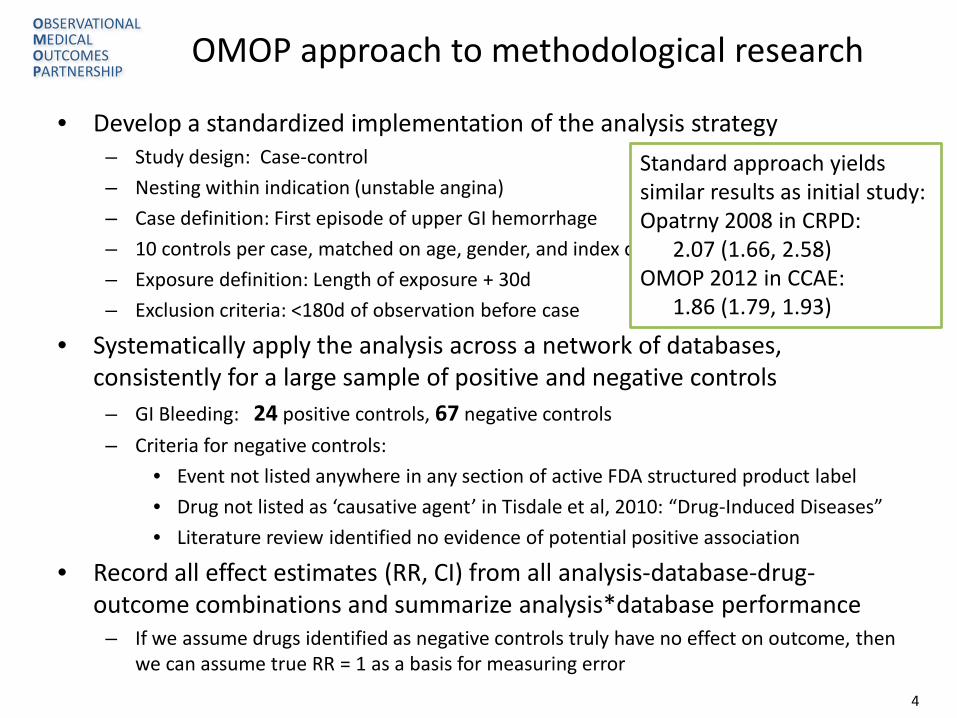
• Develop a standardized implementation of the analysis strategy – Study design: Case-control
– Nesting within indication (unstable angina)
– Case definition: First episode of upper GI hemorrhage
– 10 controls per case, matched on age, gender, and index date
– Exposure definition: Length of exposure + 30d
– Exclusion criteria: <180d of observation before case
• Systematically apply the analysis across a network of databases, consistently for a large sample of positive and negative controls
– GI Bleeding: 24 positive controls, 67 negative controls
– Criteria for negative controls:
• Event not listed anywhere in any section of active FDA structured product label
• Drug not listed as ‘causative agent’ in Tisdale et al, 2010: “Drug-Induced Diseases”
• Literature review identified no evidence of potential positive association
• Record all effect estimates (RR, CI) from all analysis-database-drug-outcome combinations and summarize analysis*database performance
– If we assume drugs identified as negative controls truly have no effect on outcome, then we can assume true RR = 1 as a basis for measuring error
OMOP approach to methodological research
Standard approach yields similar results as initial study: Opatrny 2008 in CRPD: 2.07 (1.66, 2.58) OMOP 2012 in CCAE: 1.86 (1.79, 1.93)
OBSERVATIONAL MEDICAL OUTCOMES PARTNERSHIP
5
CC
: 2000314, CC
AE
, GI B
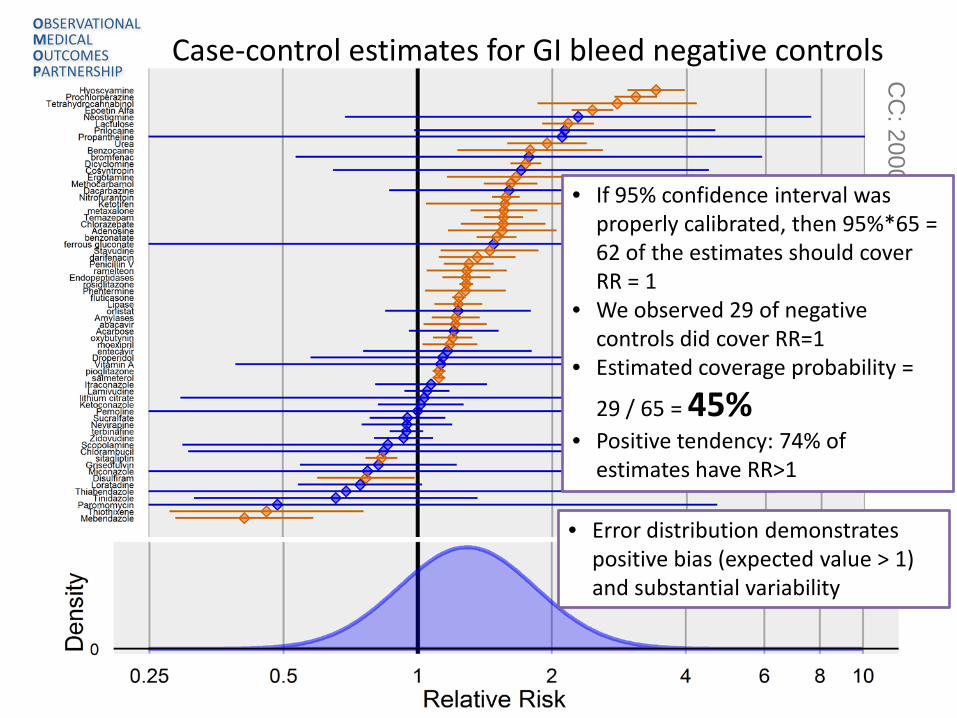
leed Case-control estimates for GI bleed negative controls
OBSERVATIONAL MEDICAL OUTCOMES PARTNERSHIP
• If 95% confidence interval was properly calibrated, then 95%*65 = 62 of the estimates should cover RR = 1
• We observed 29 of negative controls did cover RR=1
• Estimated coverage probability =
29 / 65 = 45% • Positive tendency: 74% of
estimates have RR>1
• Error distribution demonstrates positive bias (expected value > 1) and substantial variability

OBSERVATIONAL MEDICAL OUTCOMES PARTNERSHIP
6
• Bias – expected difference between true RR and estimated RR
• Mean squared error – sum of variance and squared bias of the estimated RR
• Coverage probability - % of drugs where true RR is contained within estimated 95% confidence interval
• Real data: negative controls, assume true RR = 1
• Can’t use positive controls in real data if you don’t know true RR
• Simulated data: positive controls, inject true RR = 1, 1.25, 1.5, 2, 4, 10
• Discrimination (AUC) – probability that estimate can distinguish between no effect and positive effect
• AUC can use any rank-order statistic (RR, p-value)
• AUC only assumes true RR should be bigger for positive controls than negative controls
• Can be/has been studied in both real and simulated data
• Sensitivity/specificity – expected operating characteristics of a procedure at a defined decision threshold
• Decision threshold can be any dichotomous criteria (ex: RR>2, p<0.05, LBRR>1.5)
• Sensitivity - % of positive controls that meet decision threshold
• Specificity - % of negative controls that do not meet decision threshold
• Can set desired sensitivity or specificity to determine decision threshold
• Can be/has been studied in both real and simulated data
Measures of accuracy used in OMOP’s evaluations

OBSERVATIONAL MEDICAL OUTCOMES PARTNERSHIP
CM: 21000214 New user cohort, propensity score stratification, with active comparator (drugs known to be negative controls for outcome)
Comparing accuracy of cohort and self-controlled designs Data: MarketScan Medicare Supplemental Beneficiaries (MDCR)
HOI: ‘GI Bleeding’ broad definition
Discrimination Error Coverage
SCCS: 1955010 Multivariate self-controlled case series, including all events, and defining time-at-risk as all-time post-exposure
OS: 403002 Self-controlled cohort design, including all exposures and outcomes, defining time-at-risk and control time as length of exposure + 30d
Observation: Analyses have different error distributions, but all methods have low coverage probability Potential solution: empirical calibration to adjust estimate/standard error for observed bias and residual error
Bias: -0.40
MSE: 0.31
Mean SE:
0.03
Bias: -0.32
MSE: 0.22
Mean SE:
0.05
Bias: -0.21
MSE: 0.31
Mean SE:
0.10
OBSERVATIONAL MEDICAL OUTCOMES PARTNERSHIP
8
OBSERVATIONAL MEDICAL OUTCOMES PARTNERSHIP C
C: 2000314, C
CA
E, G
I Bleed
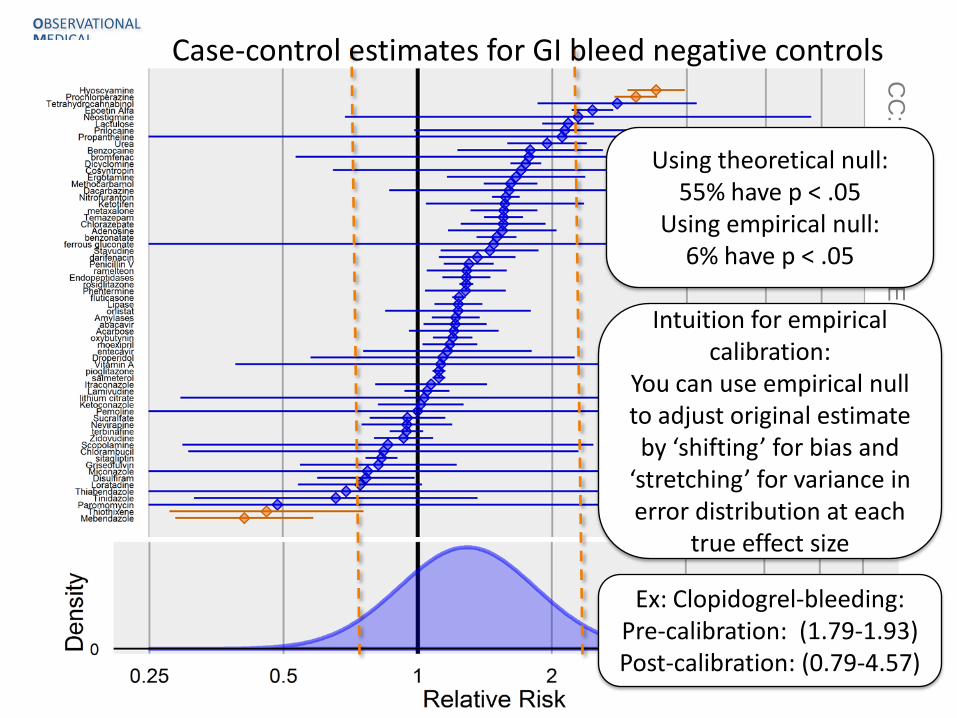
Using theoretical null: 55% have p < .05
Using empirical null: 6% have p < .05
Case-control estimates for GI bleed negative controls
Intuition for empirical calibration:
You can use empirical null to adjust original estimate by ‘shifting’ for bias and
‘stretching’ for variance in error distribution at each
true effect size
Ex: Clopidogrel-bleeding: Pre-calibration: (1.79-1.93) Post-calibration: (0.79-4.57)

OBSERVATIONAL MEDICAL OUTCOMES PARTNERSHIP
Original coverage probability = 75% Calibrated coverage probability = 96%
6 original estimates that did not contain true RR=1
After calibration, only 1 estimate does not contain true RR = 1
Applying case-control design and calibrating estimates of positive controls in simulated data, RR=1.00

OBSERVATIONAL MEDICAL OUTCOMES PARTNERSHIP
Original coverage probability = 54% Calibrated coverage probability = 96%
Applying case-control design and calibrating estimates of positive controls in simulated data, RR=1.25

OBSERVATIONAL MEDICAL OUTCOMES PARTNERSHIP
Original coverage probability = 46% Calibrated coverage probability = 92%
Applying case-control design and calibrating estimates of positive controls in simulated data, RR=1.50

OBSERVATIONAL MEDICAL OUTCOMES PARTNERSHIP
Original coverage probability = 42% Calibrated coverage probability = 92%
Applying case-control design and calibrating estimates of positive controls in simulated data, RR=2.00

OBSERVATIONAL MEDICAL OUTCOMES PARTNERSHIP
CM: 21000214 New user cohort, propensity score stratification, with active comparator (drugs known to be negative controls for outcome)
Comparing accuracy of cohort and self-controlled designs, after empirical calibration
Data: MDCR; HOI: ‘GI Bleeding’ broad
Discrimination Error Coverage
SCCS: 1955010 Multivariate self-controlled case series, including all events, and defining time-at-risk as all-time post-exposure
OS: 403002 Self-controlled cohort design, including all exposures and outcomes, defining time-at-risk and control time as length of exposure + 30d
Bias: 0.04
MSE: 0.33
Mean SE:
0.67
Bias: 0.00
MSE:
0.11
Mean SE: 0.25
Bias: -0.02
MSE: 0.38
Mean SE:
0.36
Observation: Calibration does not influence discrimination, but tends to improve bias, MSE, and coverage

OBSERVATIONAL MEDICAL OUTCOMES PARTNERSHIP
14
• Systematic exploration of negative and positive controls can be used to augment observational studies to measure analysis operating characteristics • Errors in observational studies were observed to be differential by analysis
design, data source, and outcome
• Magnitude and direction of bias varied, but all analyses had error distributions far from nominal
• Traditional interpretation of 95% confidence interval, that the CI covers the true effect size 95% of the time, may be misleading in the context of observational database studies – Coverage probability was much lower across all methods and all outcomes
– Sampling variability is small portion of the true uncertainty in any study
• Empirical calibration is one approach to attempt to account for residual error that should be expected within any observational analysis
Concluding thoughts