Bsc in Health Care
22
The balanced scorecard in health care: a multilevel latent variable approach Pietro Giorgio Lovaglio and Giorgio Vittadini CRISP and Department of Quantitative Methods, University of Bicocca-Milan, Milan, Italy Abstract Purpose – The purpose of this paper is to propose a practical conceptualization of the balanced scorecard (BSC) to describe the mechanism producing creation of monetary value for hospitals in the territorial context of Lombardy region (Italy). Design/methodology/approach – The authors propose a model-building strategy that assigns key indicators to key performance areas, and identifies causal relationships between key performance areas. Second, the authors utilize a suitable statistical approach to estimate causal relationships among involved latent variables, taking into account the hierarchical structure of data. Utilizing a suitable data decomposition, the causal model is applied separately to the within data (hospitals) and to the between data (local health agencies). Findings – In the measurement model a new latent construct (medical human capital) was found that resumes the amount of formal training and the performance of surgical staff in hospitals. The estimated causal models reflect the usual directional assumptions, supposed in a typical BSC causal scheme, with some differences. For local health agencies, fruits (financial measures) are strongly related to clinical processes (leaves) for which the medical human capital constitutes its unique trunk. However, for hospitals, fruits (financial measures) are directly linked to clinical processes and Patient Satisfaction. Research limitations/implications – The main limitations of this study are the lack of new independent data to validate the obtained causal structures and the limited number of indicators that reflect the deficiency of available information in regional administrative archives. Originality/value – The present study may be useful to guide further efforts which attempt to conceptualize BSC in the health sector. As more information can be made available, other performance indicators can prove to be linked with this structure using the same methodology. Keywords Italy, Balanced scorecard, Health care, Hospitals, Performance criteria, Latent variables, Partial least squares path modeling Paper type Research paper 1. Introduction Over the last two decades, the literature has identified a number of frameworks aimed at facilitating health structures in both improving quality and in designing and implementing performance measurement systems, such as Continuous Quality Improvement or the Balanced Scorecard (BSC) (Blumenthal, 1996; Øvretveit and Gustafson, 2003). Kaplan and Norton’s (1992) contribution is the proposal of a managerial model, called the BSC, to support the decision-making process in business in order to provide a multidimensional interpretation of economic performance. The BSC is a system of causal relationships among composite indicators (key performance areas (KPA)), which integrate and summarize large amounts of information (key performance indicators (KPI)) into an easily understood single metric. The BSC is typically proposed to assess to what extent The current issue and full text archive of this journal is available at www.emeraldinsight.com/1746-5664.htm JM2 7,1 38 Journal of Modelling in Management Vol. 7 No. 1, 2012 pp. 38-58 q Emerald Group Publishing Limited 1746-5664 DOI 10.1108/17465661211208802
Transcript of Bsc in Health Care

The balanced scorecardin health care: a multilevellatent variable approachPietro Giorgio Lovaglio and Giorgio Vittadini
CRISP and Department of Quantitative Methods,University of Bicocca-Milan, Milan, Italy
Abstract
Purpose – The purpose of this paper is to propose a practical conceptualization of the balancedscorecard (BSC) to describe the mechanism producing creation of monetary value for hospitals in theterritorial context of Lombardy region (Italy).
Design/methodology/approach – The authors propose a model-building strategy that assigns keyindicators to key performance areas, and identifies causal relationships between key performanceareas. Second, the authors utilize a suitable statistical approach to estimate causal relationships amonginvolved latent variables, taking into account the hierarchical structure of data. Utilizing a suitabledata decomposition, the causal model is applied separately to the within data (hospitals) and to thebetween data (local health agencies).
Findings – In the measurement model a new latent construct (medical human capital) was found thatresumes the amount of formal training and the performance of surgical staff in hospitals. The estimatedcausal models reflect the usual directional assumptions, supposed in a typical BSC causal scheme, withsome differences. For local health agencies, fruits (financial measures) are strongly related to clinicalprocesses (leaves) for which the medical human capital constitutes its unique trunk. However, forhospitals, fruits (financial measures) are directly linked to clinical processes and Patient Satisfaction.
Research limitations/implications – The main limitations of this study are the lack of newindependent data to validate the obtained causal structures and the limited number of indicators thatreflect the deficiency of available information in regional administrative archives.
Originality/value – The present study may be useful to guide further efforts which attempt toconceptualize BSC in the health sector. As more information can be made available, other performanceindicators can prove to be linked with this structure using the same methodology.
Keywords Italy, Balanced scorecard, Health care, Hospitals, Performance criteria, Latent variables,Partial least squares path modeling
Paper type Research paper
1. IntroductionOver the last two decades, the literature has identified a number of frameworks aimed atfacilitating health structures in both improving quality and in designing andimplementing performance measurement systems, such as Continuous QualityImprovement or the Balanced Scorecard (BSC) (Blumenthal, 1996; Øvretveit andGustafson, 2003).
Kaplan and Norton’s (1992) contribution is the proposal of a managerial model, called theBSC, to support the decision-making process in business in order to provide amultidimensional interpretation of economic performance. The BSC is a system of causalrelationships among composite indicators (key performance areas (KPA)), which integrateand summarize large amounts of information (key performance indicators (KPI)) into aneasily understood single metric. The BSC is typically proposed to assess to what extent
The current issue and full text archive of this journal is available at
www.emeraldinsight.com/1746-5664.htm
JM27,1
38
Journal of Modelling in ManagementVol. 7 No. 1, 2012pp. 38-58q Emerald Group Publishing Limited1746-5664DOI 10.1108/17465661211208802
specific areas best contribute to the prospective of the creation of monetary value forstatistical units (firms, companies, departments, etc). The conceptual scheme of BSC, whichimplements a balanced set of different types of indicators, has gained huge popularity as aneffective theoretical support tool in decisions regarding the multidimensionality ofevaluation processes, the identification of individual and group targets, as well as in theapplication of strategies concerning operational and organizational activities.
Specifically, the BSC identifies causal relations between principle dimensions ofinterest (KPA), once they are measured by observable indicators (KPI). A typical BSChas financial (monetary-physical indicator outputs and their productivity), learning andgrowth (the quality of human resources, Human Capital), internal processes (the amount,quality and efficiency of processes), and Customer KPA. The BSC is typically applied byorganizations and industries within the strategic management area. In the last decadehowever, the BSC approach has also been introduced in the Health sector, under theguidelines of accredited international institutions such as the World HealthOrganisation (WHO, 2000) and OECD (Hurst, 2000), establishing concreterequirements designed to implement, sustain and improve micro-economic efficiencyand macro-economic sustainability in national health systems.
Baker and Pink (1995) were among the first to argue that the theory and concepts ofthe BSC were relevant to hospitals. In their second book on the BSC, Kaplan and Norton(2001) introduced cases demonstrating how the BSC could be implemented in non-profit,governmental and health care organizations. Currently, the basic principles of the BSCare well documented in health care literature (Chow et al., 1998; Oliveira, 2001). The BSChas been widely applied in international health sectors, including hospitals Systems(Zelman et al., 2003; Sahney, 1998; Pink et al., 2001), National Healthcare Systems orOrganizations (Inamdar et al., 2002; Northcott and France, 2005).
In Italy, the Lombardy region has recently promoted a pilot study (Lauro, 2007),designed to describe the various implementations of the BSC system for themeasurement of hospital performance and productivity in the Lombardy Region Healthsector. Specifically, in 2007, the Lombardy Region Directorate of Health collaboratedwith a university-based research team in developing a report on the relative performanceof individual hospitals, utilizing the BSC framework advocated by Kaplan and Norton.Performance indicators were developed in four KPA: clinical process, patientsatisfaction, human capital and financial performance.
Despite the rapidly evolving use of the BSC, the concept of BSC as a strategicmanagement tool has had limited research coverage (Tuomela, 2005) for twomain reasons. First, moving from concept to practice has often proved difficult(Chow et al., 1998; Ahn, 2001): the BSC theoretical framework must evolve into ameasurement system using explicit objective formulas, which define causalrelationships among the areas analyzed then prescribing the weights to be attachedto each KPA (Ittner and Larcker, 1998; Kaplan and Norton, 1992).
Second, the lack of literature (government or academic publications) on causal-effectrelationships between different types of indicators makes it difficult to conceptualizedynamics and operations. Following the proposals of Kaplan and Norton (1996, 2001),the four KPA have established cause-and-effect relationships in a treelike fashion:cause-and-effect relationships amongst BSC dimensions imply how the fruit (financialperformance) in the tree is related to the leaves (customers), the trunk (processes) and theroots (Human Capital).
The BSC inhealth care
39

Unfortunately, the heterogeneity of health organizations may hinder reaping the fullbenefit of the BSC approach, suggesting the need for some key modifications to take theirunique characteristics into account (Zelman et al., 2003). In this perspective, the BSC hasbeen used by many health care organizations in the health care sector, which differ,namely in the units of analysis, purposes, audiences, methods, data, and results.Zelman et al. (2003) found that a variety of health care organizations use BSCs, althoughthe standard BSC is often customized to better reflect the industry and organization(e.g. acute care, long-term care, mental health care, managed care, and medical grouppractice). The authors conclude that the use of the BSC in health care has provided arelevant contribution; however, modification to reflect institutional missions andorganizational specifications is necessary. For example, Shortell and Kaluzny (2006)suggested that hospitals should make the shift to providing both public/community healthcare and institutional/traditional health care, and that doing so would impel hospitals toevaluate community health status in order to implement quality improvement measuresand provide services designed to meet specific community needs.
In this perspective, some authors argue that the assumptions of causalityrelationships between the four KPA in the health care framework remain subjectiveand may vary in different areas (Ittner and Larcker, 1998; Morard and Stancu, 2005;Kanji and Sa, 2002; Chow et al., 1998). Various empirical studies found no causalitybetween quality and financial results (Ittner and Larcker, 1998), while others (Kanji andSa, 2002; Morard and Stancu, 2005) threw doubt upon the causal structure among theKPA areas proposed by Kaplan and Norton (2001).
Moreover, another important methodological issue must be underlined. Given thathealth data typically presents a hierarchical structure (statistical units are nested ingradually more aggregated levels), a methodology aimed at estimating the causalrelations between latent variables (LVs) should not ignore the hierarchical structure ofthe data and thus the correlation between micro-level units (e.g. patients) belonging tothe same macro-level unit (e.g. hospital).
The purpose of this article is to present a conceptualization of the BSC in describingthe mechanism producing creation of (monetary) value for hospitals in a specifiedterritorial context (the Lombardy Region, Italy) utilizing a structural equationmodelling framework. As previously discussed, when knowledge is insufficient tobuild a robust and well-suited model, LVs and causal structures, rather than being onlyassumed, should be tested by a suitable building strategy. Furthermore, the estimationof the specified structural model must take into account the hierarchical structure ofthe available data (in our case, hospitals nested in Local Health Agencies). Specifically,we propose a model building strategy, which:
. assigns (key performance) hospital indicators to each KPA; and
. identifies the causal relationships between the involved KPA.
Second, we utilize an appropriate statistical approach to estimate the causalrelationships among the involved KPA in a multilevel perspective: in particular, theadopted structural model was applied separately to Local Health Agency data(structures that purchase and manage health services distributed by hospitals) and tothe Hospital data (monitoring the effect of nesting within Local Health Agencies),potentially revealing different causal structures which would have otherwise beenmasked had the nested structure of the observations been ignored.
JM27,1
40

2. Methodology: PLSPMIn the last decade, leading accounting journals have placed great emphasis on the futuredirections of management accounting research, including the structures of theoreticalmodelling and data analysis that can be used (Atkinson et al., 1997; Shields, 1997). Toconceptualize health quality systems, the use of structural equation models mayovercome some of the limitations imposed by the more traditional statistical techniquesused in management accounting (Hulland, 1999; Smith and Langfield-Smith, 2004).Since the KPAs specified in the BSC are unobservable multidimensional constructs(hypothetical or latent constructs) measurable with errors by means of blocks ofobserved indicators, the most natural methodological context for BSC conceptualizationand estimation deals with structural equation models with LVs.
In statistical literature, the first definition of an LV, sharing the factor analysisapproach, is supplied by the structural equation models or LInear Structural RELations(from here LISREL model, following the approach of Joreskog (1978)), stating that LVsare “true LVs” in the sense that the equations cannot be manipulated so as to beexpressed as a function of observed indicators only (Bentler, 1982). A second approacharises in literature, defining an LV as an “Unobservable Component Variable”(Kmenta, 1991), whose scores are estimated as linear combinations of their observedindicators. In this view, observed indicators appear as causes of an LV, whereas in theLISREL model they are effects of the underlying latent causes.
In this LV definition, partial least squares path modelling (PLSPM; Wold, 1982) isthe counterpart of the LISREL model. PLSPM is employed for path analysis withcomponents or weighted composites of observed variables: the relationships betweenmanifest and LVs form the outer or measurement model and the relationships betweenLVs form the inner or structural model. PLSPM defines LVs as latent components orweighted composites of observed variables. Observed indicators may be considered aseither the effects of an underlying LV or as the causes defining the “weightedcomposite”. Thus, each measurement model may identify either a formative scheme(the manifest variables contribute to the formation of the latent scores, following aprincipal component analysis (PCA) framework) or a reflective scheme (the manifestvariables constitute the effects of their LVs, following a factor analysis framework).
PLSPM proceeds in two stages (Wold, 1982). In the first stage, the LV scores areestimated as linear combinations of their own observed indicators by means of a cyclicalprocedure. After having estimated each LV (h0j) as a linear combination of its observedindicators, using arbitrary weights (w0j), LV scores are estimated iteratively by means ofan iterative algorithm with respect to both the inner and outer model. The inner modelupdates h0j (inner estimate, hþ
0j ) as a “weighted sum” of the LVs which, in the structural
model, are adjacent toh0j (previously estimated by the same criteria used forh0j). The sumof the adjacent LVs is weighted by the coefficients representing the correlation betweenthe adjacent LVs (factorial scheme) or simply their signs (centroid scheme) or theregression coefficients, following the specified structural model (structural scheme).Differently, in the outer model, the weights defining LV scores are updated depending onthe causal links between LVs and their manifest indicators: for reflective indicators,weights are obtained by simple regression of each manifest indicator on h1
0j, whereas forformative indicators, the weights are updated by multiple regression ofh0j
1 onto the matrixof observed indicators. By iterating the steps of this procedure, the convergence
The BSC inhealth care
41

of the algorithm presents the final estimation of the weights defining the LVs’ scores aslinear combinations of their observed indicators.
Finally, in the second stage of PLSPM, the parameters of the structural model (linksbetween LVs) and the measurement model (links between observed indicators andLVs) are achieved through simple and multiple regressions, utilizing the latent scoresestimated in the first stage. Thus, the structural model becomes a path analysis modelinvolving linear combinations of observed variables. Since the LVs are given by linearcombinations of the observed variables, PLSPM does not suffer from the impropersolutions (negative variance or standard errors, factor correlation estimates greaterthan ^1), identification problems and indeterminate factor scores which typicallyplague the covariance structure approach (Stelzl, 1986; Meredith and Millsap, 1985;Schonemann and Steiger, 1976; Vittadini, 1989).
An additional advantage is that PLSPM does not rely on stringent assumptions,such as complex theoretical structures specifying independence of measurement errorsand structural errors, which are often violated in non-experimental data (Wold, 1982).In fact, PLSPM requires no distributional assumption, and thus can treat all types ofdata, as long as the assumption of an underlying continuous distribution is maintained(when working with continuous data or ordinal grades on a 1-10 scale). PLSPM usesresampling methods such as the jackknife and the bootstrap methods (Efron, 1982) tocalculate robust standard errors of parameter estimates, test statistics, and to assessthe reliability of fit indices. It has been utilized with satisfactory results in literature forthe strategic management area (Hulland, 1999, for a complete review) as well as incustomer satisfaction (Fornell and Bookstein, 1982; Tenenhaus et al., 2005).
3. Structural models: a hierarchical perspectiveAs we have seen, the BSC is a structural model and thus suitable for estimation byPLSPM. However, as previously mentioned, data in the Health sector typically reflectsa hierarchical structure. Several methods have been proposed in literature to fit pathmodels allowing multigroup comparisons, such as multilevel factor analysis (Muthen,1991) or multilevel covariance structure analysis ( Joreskog, 1993; Muthen, 1994;Goldstein and McDonald, 1988). Nonetheless, these methods were all developed fromthe perspective of covariance structure analysis, hence, reflective indicators aretypically assumed with factor score indeterminacy remaining problematic.
Unfortunately, in the component analysis framework (substituting components forfactors), PLSPM is unable to perform multigroup comparison checks for hierarchicaldata structures, as that would require a single formulation of the models for manygroups. More specifically, PLSPM fits the same model to I groups separately (i¼1, . . . ,I),so that it is not viable for examining hypotheses on parameter stability or models acrossgroups. Hence, PLSPM does not allow the evaluation of the separate contribution ofgroups or of the contribution of the individual units in each group to the overallvariability of the model.
Alternatively, a recent technique, multilevel simultaneous component analysis (MSCA)(Timmerman, 2006), was proposed in the context of PCA and thus for a single block ofobserved variables in the multilevel perspective. MSCA reproduces as much of the overalldata variability as possible, obtaining two sets of orthogonal latent scores which underlie aformative set of indicators summarizing the variability between different groups(variability among second level units) and within groups (variability among first levelunits in each second level unit). Furthermore, MSCA has the fundamental property
JM27,1
42

of between-group and within-group components being orthogonal within each group andfor all groups.
3.1 Obtaining the MSCA model parametersLet Y (
PiKi £ J) be the total data matrix containing Ki individual measurements for
group i (i ¼ 1, . . . ,I) on J variables that are centered on the overall mean for variable jacross all groups (grand mean), where
Pi Ki is the total number of observations. Each
matrix Yi (Ki £ J), containing the part of Y with data from group i (i ¼ 1, . . . ,I) can bedecomposed as:
Yi ¼ Yc;i þ 1Kimiy0 ð1Þ
where miy0 is a (1 £ J) row vector containing the column means of matrix Yi and Yc,i is the
(Ki £ J) matrix containing only the within-group variation belonging to group i.The I vectorsmiy
0 can be concatenated into a (I £ J) matrixMy. MatrixMy now contains thedifferences between groups. In the case of an equal number of measurement occasions foreach group, the Between-group model can be determined by performing a PCA onMy. TheWithin component of MSCA is the basis for a range of methods. These methods differ inthe additional constraints on the Within-individual scores, incorporating assumptions onthe relationships between the Within-individual variations of different individuals. Whenno particular constraints are placed on the (covariances of the) Within-individual scores,the Within-group submodel can be calculated by fitting a PCA on Yc, where Yc is a(P
iKi £ J) matrix in which all Yc,i matrices are vertically concatenated (Timmerman,2006). As proven by Timmerman (2006), MSCA’s main property is the orthogonality of thetwo parts of the model, allowing the component scores and loadings to be separatelyestimated in both structures by using the My and Yc matrices.
4. PLSPM: a hierarchical perspectiveAs mentioned previously, MSCA has the main property of orthogonality of the two partsof the model. However, this property arises from the fact that, under the aforementionedconstraints on the Between and Within component scores (equation (1)), MSCA obtainslinear combinations in both structures which are mutually orthogonal in the samedimension and for all dimensions, given that these components are extracted from themutually orthogonal matrices My and Yc.
Unfortunately, PLSPM and MSCA cannot be easily or consistently integrated. First,both techniques have different criteria for extracting linear components: MSCAestimates PCs by maximizing the explained variability in each block, whereas PLSmaximizes the regression criteria specified by the structural model. Second, there is noguarantee that the final latent scores of the PLSPM algorithm in the Within andBetween structure will remain orthogonal, as occurs in MSCA. In fact, in the innermodel of PLSPM, latent scores are updated based on causal relationships with theiradjacent LVs, whereas in the outer model latent scores are updated based on the causalrelationships between LVs and their manifest variables (Tenenhaus et al., 2005).
To overcome these drawbacks, we follow a strategy that, instead of fully integratingboth techniques, selects suggestions provided by MSCA, and then applies PLSPM to thetwo orthogonal data matrices representing both structures. More specifically, startingfrom (column-wise mean) centered data matricesYk (referred to the kth block of manifestvariables defining the kth LV in the structural model, k ¼ 1, . . . ,K), first, we decompose
The BSC inhealth care
43

such data matrices in two orthogonal blocks, as suggested in equation (1) to obtain theBetween (Mk) and the Within (Yc,k) data matrices. Utilizing this decomposition, we canperform two different PLSPM analyses on two separate sets of matrices to obtain latentscores and parameters (causal links between LV) consistent with the supposedstructural model in the two separate domains. More specifically, the PLSPM algorithm isapplied separately to the Within data structure (usingYc,k matrices related to the K LVs)and to the Between data structure (using Mk matrices), potentially revealing differentcausal structures which would have otherwise been masked if the nested structure ofobservations had been ignored. Finally, the PLSPM latent components in the Within andin the Between structure are group centered, following the constraints suggested byMSCA. This guarantees that the PLSPM-latent scores of the Within structure areorthogonal to the PLSPM-latent scores of the Between-structure.
Following the strategy of decomposing the data matrix into two orthogonal blocks,taking into account the Between and the Within data structure (equation 1), in amultilevel perspective, we can generalize other statistical models involving latentcomponents (estimated as linear combinations of their observed indicators) in whichprojections are guided into meaningful directions. In this framework, componentscores can be obtained as projections guided into meaningful directions by a matrix ofanother set of symmetrical variables (e.g. Canonical correlations), by a matrix ofresponse variables (e.g. multivariate regression, redundancy analysis, partial leastsquares regression, etc.) or by other matrices, specified in a structural model (PLSPM).
5. Model building strategyAs explained in Section 1, the BSC proposed should be accompanied by an explorativephase that clarifies processes and hypotheses used for its development (Akkermans andvan Oorschot, 2005) and by a validation phase that confirms the identified structure. In theexplorative phase, where it is difficult to build the model on expert knowledge, datastructure may contain useful information to underline the relations of the model.
Our model building strategy explores two distinct steps. The first step consists ofbuilding the measurement models. Because the constructs are LVs, a rigorous procedureto ensure the psychometric adequacy of the resulting new multi-item measurementscales is required. The challenge is to develop a more robust construct of complexvariables through averaging several individual items by selecting a set of items thatcapture the essence of the construct with the desired reliability and validity. Thus, thefirst step in constructing new multi-item measurement scales is to generate or select setsof items that tap into the latent constructs and permit us to accurately assess thoseconstructs from a managerial perspective (Churchill, 1979; Hinkin, 1988).
Traditional approaches obtain blocks or clusters of related variables with specificproperties (internal consistency), then lump correlated variables together by means ofPCA, with or without rotation (e.g. Varimax rotation). Other non-parametric hierarchicalor non-hierarchical variable-clustering algorithms exist as well. One popular method is theVARCLUS algorithm, a procedure implemented in SAS (1999), which divides a set ofnumerical variables into disjointed clusters, maximizing the variance explained by thecluster components (composite variables), summed over all the clusters. The VARCLUSalgorithm works by joining variables which either present similarity in the first principalcomponent scores of the variables in the associated cluster or else demonstrate similarityin the centroid component, i.e. the unweighted averages of the standardized variables.
JM27,1
44

A recent variable-clustering strategy, Clustering around Latent Variables (CLV)(Vigneau and Qannari, 2003), appears more promising. CLV was proposed as ameasurement model building strategy, where LVs are approximated as compositevariables (linear aggregation). Like VARCLUS, CLV is characterized by the fact that itattempts to find homogeneous groups of variables by maximizing a criterion whichreflects the extent to which the variables in each cluster are related to a specific LV(component) associated with this cluster.
CLV functions by grouping the p manifest variables y1,y2, . . . ,yj, . . . ,yp into Kgroups where each group Gk (k ¼ 1, . . . , K) is represented by an LV (component) ck.The groups are determined in order to maximize the sum (across groups and variablesbelonging to groups) of the covariances between yj and ck, under the constraintck
0ck ¼ 1. The first step in hierarchical clustering is to consider that each variableforms a group in itself and then proceeds by iteratively merging two variables or twoclusters of variables. When the two groups of variables are merged, this results in adecrease of criterion T. The LV in each cluster is set to the standardized first principalcomponent of the cluster in question. Each variable is assigned to a group if its squaredcovariance (regardless of whether the correlation is positive or negative) with thelatent component of this group is higher than with any other latent component.
As a comparative measure of measurement model strategy, we use a criterion whichreflects how far the reproduced configuration using the constructed blocks is from theraw data matrix. Specifically, M2 ( ¼
Pk SSQ(Yk 2 zk
0ak), k ¼ 1, . . . ,4) expresses, ineach structure, the sum (over the four blocks) of differences between the data matrices(Yk) and the reproduced uni-dimensional matrices (zkak
0 ), given by the product of thefirst principal component (zk) and the loading vector (ak, obtained by singular valuedecomposition).
In regard to the structural model, we suppose causality directionsreflecting directional assumptions, handled in a typical BSC causal scheme: HumanCapital ! Processes ! Satisfaction ! Economy. In this framework, we enhancedthe causal scheme by allowing each endogenous construct to have more than oneexogenous construct.
In this phase of the model building strategy, in order to reveal the associationsbetween pairs of LVs, we measure the partial correlation coefficients (and theassociated statistical test) for each pair of the first principal components of each block(used as an estimate of each LV), net of remaining principal components. As the laststep, we evaluate the constructed models through the application of a data-drivenapproach, suggested by Jakobowicz and Derquenne (2007). To build directional causalrelationships (which direct the edges) the authors utilize a step-by-step algorithmwhich selects the best model in terms of predictive power, measured by the mean of theR 2 for the endogenous LVs. However, this approach discovers robust relationsbetween LVs only in a statistical framework: the results must then be investigated byqualified professionals and researchers to evaluate the relevance of the suggestedcausal relationships and their consistency with the supposed causal scheme.
6. ApplicationIn 2007, the Lombardy Directorate of Health promoted a pilot study (Lauro, 2007), withthe objective of assessing the impact of Health structure management and policies onbusiness results for health structures in a BSC framework. The health system
The BSC inhealth care
45

of the Lombardy Region involves four different hierarchical levels, designated tomanage and distribute health services to the population: the most aggregated levelrefers to the local health agency, collecting hospitals, health structures, ambulatorystructures, centers for mental health and for elderly patients in the relevantgeographical area. In the territorial context of each local health agency, health servicesare supplied by different public and private health agencies (second level), involvingvarious health structures, such as the Presidium of Health Agency and hospitals (thirdlevel). Finally, each Hospital may have one or more Operative unit engaged indistributing health services, incorporating an assortment of medical disciplines indifferent areas (fourth level).
In our application, we have considered Presidiums of Health Agencies (from here,hospitals) as the first level unit of analysis and Local Health Agencies (ASLs) as thesecond level. The choice of the first level is motivated by the consideration that privateHealth Agencies coincide de facto with private Presidiums (hospitals), and indicators,especially those in the economic and process area, are provided for public structures atthis level. The choice of ASLs is motivated by the consideration that they are strategicstructures which purchase and manage health services distributed by (private andpublic) hospitals in a specific territorial context.
The present application involves 163 public and private Lombardy Region Hospitals(34 hospitals present missing data for at least one indicator) belonging to 12 ALSs. Theprimary focus of the 2007 pilot study was to identify available regional information forthe implementation of the BSC system in the regional health sector. The available datawas collected by obtaining information from Hospital Discharge Records (the onlyroutinely collected administrative source available in the Italian Health sector), from theregional archives, collecting Official Regional Surveys on Patient Satisfaction(mandatory for all regional hospitals), and other various administrative archivespresent in the Lombardy Region Directorate of Healthcare.
Table I shows the list of 25 hospital indicators (key performance index, KPI), arisingfrom the previous pilot study. Each indicator, calculated at Hospital level, refers to theyear 2007. The first column, assigning each available indicator to different KPA areasin the BSC model, was filled in by qualified professionals in the Regional HealthcareDirectorate.
Patient Satisfaction indicators are mean scores of eight items (on a 0-10 ordinal scale)composing the official Regional Customer Satisfaction Questionnaire. Clinical Processindicators (drawn from regional Hospital Discharge Cards) refer to meaningfuldimensions in the quality process, identified in previous specific research studiespromoted by the Lombardy Directorate of Healthcare (Healthcare Directorateof Lombardy Region, 2004). Specifically, within the “Triennial Program for theimplementation of an evaluation system of Health structures and management of Healthstructures”, the CRISP Research Centre, in partnership with International JointCommission, carried out the subproject: “Study of Outcomes” with the aim of producinghealth structure performance indicators useful for monitoring the quality of care.
The indicators concerning Human Capital and Economic KPA were drawn fromavailable administrative archives of the Healthcare Directorate of the LombardyRegion. In particular, the indicators of the economy KPA were proposed by theInternational Joint Commission in the subproject “Economic Performance” (HealthcareDirectorate of Lombardy Region, 2004).
JM27,1
46
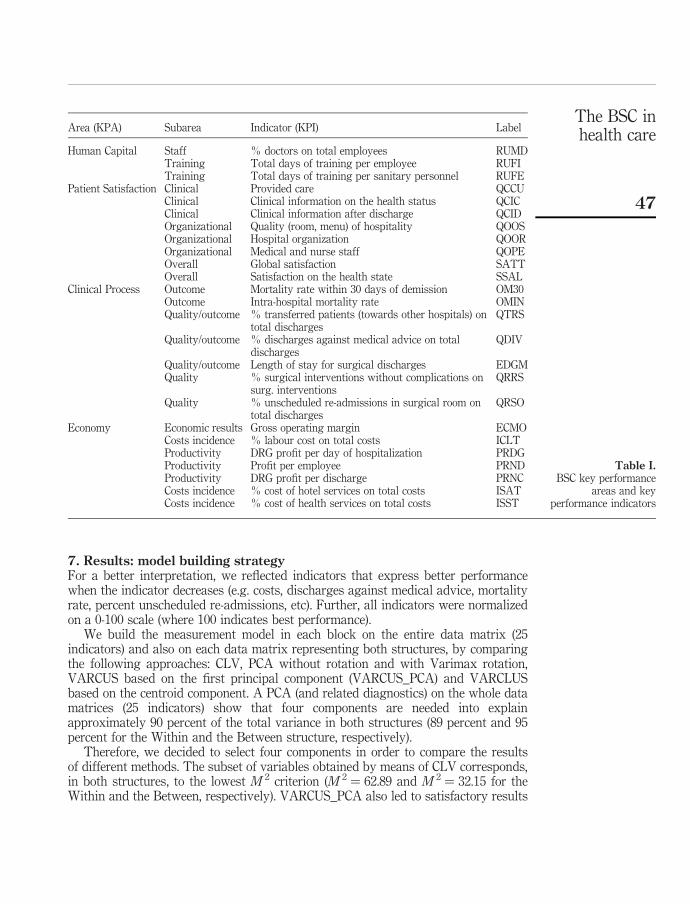
7. Results: model building strategyFor a better interpretation, we reflected indicators that express better performancewhen the indicator decreases (e.g. costs, discharges against medical advice, mortalityrate, percent unscheduled re-admissions, etc). Further, all indicators were normalizedon a 0-100 scale (where 100 indicates best performance).
We build the measurement model in each block on the entire data matrix (25indicators) and also on each data matrix representing both structures, by comparingthe following approaches: CLV, PCA without rotation and with Varimax rotation,VARCUS based on the first principal component (VARCUS_PCA) and VARCLUSbased on the centroid component. A PCA (and related diagnostics) on the whole datamatrices (25 indicators) show that four components are needed into explainapproximately 90 percent of the total variance in both structures (89 percent and 95percent for the Within and the Between structure, respectively).
Therefore, we decided to select four components in order to compare the resultsof different methods. The subset of variables obtained by means of CLV corresponds,in both structures, to the lowest M 2 criterion (M 2 ¼ 62.89 and M 2 ¼ 32.15 for theWithin and the Between, respectively). VARCUS_PCA also led to satisfactory results
Area (KPA) Subarea Indicator (KPI) Label
Human Capital Staff % doctors on total employees RUMDTraining Total days of training per employee RUFITraining Total days of training per sanitary personnel RUFE
Patient Satisfaction Clinical Provided care QCCUClinical Clinical information on the health status QCICClinical Clinical information after discharge QCIDOrganizational Quality (room, menu) of hospitality QOOSOrganizational Hospital organization QOOROrganizational Medical and nurse staff QOPEOverall Global satisfaction SATTOverall Satisfaction on the health state SSAL
Clinical Process Outcome Mortality rate within 30 days of demission OM30Outcome Intra-hospital mortality rate OMINQuality/outcome % transferred patients (towards other hospitals) on
total dischargesQTRS
Quality/outcome % discharges against medical advice on totaldischarges
QDIV
Quality/outcome Length of stay for surgical discharges EDGMQuality % surgical interventions without complications on
surg. interventionsQRRS
Quality % unscheduled re-admissions in surgical room ontotal discharges
QRSO
Economy Economic results Gross operating margin ECMOCosts incidence % labour cost on total costs ICLTProductivity DRG profit per day of hospitalization PRDGProductivity Profit per employee PRNDProductivity DRG profit per discharge PRNCCosts incidence % cost of hotel services on total costs ISATCosts incidence % cost of health services on total costs ISST
Table I.BSC key performance
areas and keyperformance indicators
The BSC inhealth care
47

(M 2 ¼ 69.34 and M 2 ¼ 38.25), whereas PCA (M 2 ¼ 98.73 and M 2 ¼ 42.50) and PCAwith Varimax rotation (M 2 ¼ 102.89 and M 2 ¼ 45.11, the same results as VARCLUSwith centroid option) led to poorer results. A result in common is that, in bothstructures, all strategies reject four indicators (ISAT, ISST, PRNC belonging to theEconomy KPA as well as RUMD, initially inserted in the Human Capital KPA).Additionally, these indicators present low communalities and, when aggregated in ablock (based on the highest loadings) with other indicators, contribute to a decrease inthe percentage of explained variance by the first principal component and the internalconsistency of that block (Cronbach’s a).
Table II shows the structure linking the four components to each indicator(measurement models), using the CLV criterion, for each structure. Additionally, thepercentage of total variance of a block, explained by its first principal component(percent 1PC), Cronbach’s a and the AVE (the average variance of the manifestindicator’s set explained by the construct, Fornell and Larcker, 1981) aresimultaneously shown, since these indices permit the investigation of internalconsistency (Cortina, 1993). The blocks present satisfactory internal consistency: allCronbach’s a and percentages of variance explained by the first PC reach valuesgreater than 0.79 and 0.70, respectively. Also mono-factorial validity (whencorrelations between observed indicators of a block and their LV are higher thancorrelations with other LVs) and discriminant validity hold (when more variance isshared between an LV and its block of indicators than with other LVs – not shown inTable II). If we compare the blocks suggested by CLV (Table II) with those compiled byqualified professionals (first column of Table I), the most significant result found isthat the original Clinical Process indicators have been separated into two differentblocks (KPA) referring to Clinical Process and Human Capital. The estimated ClinicalProcess block collected, for both structures, five clinical outcomes (OM30, OMIN,QDIV, QTRS, EDGM), which indirectly measure the quality of clinical processes thatpotentially trigger adverse events, reflecting malpractice (context outcomes). The“Human Capital area” collected two clinical indicators related to surgical interventionsand complications (QRRS, QRSO) and two training indicators. This dimensionmay reflect the quality of medical Human Capital in hospitals, measured by amountof training (RUFI, RUFE), and by clinical performance in high-risk specialties(QRRS, QRSO).
As additional aspect of construct validity, we assess discriminant validity, whichrepresents the extent to which measures of a given construct differ from measures ofother constructs in the same model. In a PLS context, one criterion for adequatediscriminant validity is that a construct should share more variance with its indicatorsthan it shares with other constructs in a given model. To assess discriminant validity,the AVE (the average variance shared between a construct and its indicators) shouldbe greater than the variance shared between the construct and other constructs in themodel. This can be demonstrated in Table III, which includes the correlations betweendifferent constructs in the lower left off-diagonal elements of the matrices (Between andWithin structures), and the square roots of the AVE values calculated for each of theconstructs along the diagonals. Since the diagonal elements are greater than theoff-diagonal elements in the corresponding rows and columns, Table III demonstratesadequate discriminant validity.
JM27,1
48

Wit
hin
stru
ctu
re(h
osp
ital
s)
Bet
wee
nst
ruct
ure
(Loc
alH
ealt
hA
gen
cies
)
Key
area
Lab
elIn
dic
ator
sL
oad
ing
%1P
Cal
ph
aA
VE
Loa
din
g
%1P
Cal
ph
aA
VE
Hu
man
Cap
ital
aR
UF
ID
ays
oftr
ain
ing
per
emp
loy
ee0.
906
0.80
30.
838
0.71
1R
UF
ED
ays
ofsa
nit
ary
per
son
nel
trai
nin
g0.
926
0.91
80.
837
0.79
0Q
RR
S%
surg
.op
erat
ion
sw
ith
out
com
pli
cati
ons
0.86
40.
804
0.77
60.
687
QR
SO
%u
nsc
hed
ule
dsu
rgic
alre
-ad
mis
sion
s0.
888
0.86
2P
atie
nt
Sat
isfa
ctio
nQ
CC
US
atis
fact
ion
for
pro
vid
edca
re0.
963
0.89
30.
980
0.85
5Q
CIC
Sat
isfa
ctio
nfo
rin
form
atio
non
hea
lth
stat
e0.
976
0.97
30.
976
0.96
8Q
CID
Sat
isfa
ctio
nfo
rin
form
atio
np
ost
dis
char
ge
0.86
70.
851
0.83
70.
854
QO
OR
Sat
isfa
ctio
nfo
rh
osp
ital
ity
0.92
00.
965
QO
OS
Sat
isfa
ctio
nfo
rh
osp
ital
org
aniz
atio
n0.
909
0.96
3Q
OP
ES
atis
fact
ion
for
med
ical
and
nu
rse
staf
f0.
927
0.94
8S
AT
TG
lob
alsa
tisf
acti
on0.
977
0.98
5S
SA
LS
atis
fact
ion
for
hea
lth
stat
e0.
829
0.70
6C
lin
ical
Pro
cess
OM
30M
orta
lity
rate
wit
hin
30d
ays
0.85
10.
766
0.88
80.
862
OM
INIn
tra-
hos
pit
alm
orta
lity
rate
0.77
30.
812
0.91
20.
792
QT
RS
%tr
ansf
erre
dp
atie
nts
inot
her
hos
pit
als
0.79
80.
593
0.73
20.
698
QD
IV%
dis
char
ges
agai
nst
med
ical
adv
ice
0.79
10.
692
EG
DM
Mea
nle
ng
thof
stay
0.61
70.
781
Eco
nom
yE
CM
OG
ross
oper
atin
gm
arg
in0.
770
0.70
20.
860
0.73
5IC
LT
%la
bou
rco
ston
tota
lco
sts
0.89
20.
799
0.78
20.
792
PR
DG
DR
Gp
rofi
tp
erd
ayof
hos
pit
aliz
atio
n0.
740
0.64
60.
879
0.73
4P
RN
DP
rofi
tp
erem
plo
yee
0.80
50.
901
Note:
aA
fter
the
dis
cuss
ion
(su
bse
ctio
n7.
1),
this
con
stru
ctw
asen
titl
ed“M
edic
alC
are
Qu
alit
y”
Table II.Results of the CLV
measurement modelsbuilding strategy:
Between-Within structure
The BSC inhealth care
49

Wit
hin
stru
ctu
reB
etw
een
stru
ctu
re
Con
stru
cts
Med
ical
care
qu
alit
yC
lin
ical
pro
cess
Pat
ien
tsa
tisf
acti
onE
con
omy
Med
ical
care
qu
alit
yC
lin
ical
pro
cess
Pat
ien
tsa
tisf
acti
onE
con
omy
Med
ical
care
qu
alit
y0.897
0.829
Cli
nic
alP
roce
ss0.
097
0.770
0.60
00.835
Pat
ien
tS
atis
fact
ion
0.00
20.
470
0.922
0.03
80.
165
0.924
Eco
nom
y0.
051
0.40
40.
583
0.804
0.49
60.
740
0.01
0
Note:
Cor
rela
tion
sb
etw
een
con
stru
cts
and
root
AV
Eon
the
dia
gon
al
Table III.Discriminant validity
JM27,1
50

The most surprising result of the measurement model building strategy is thecomposition of the “Human Capital KPA” (Table III) which, in the same block, includesthe process indicators related to surgical interventions and complications (QRRS,QRSO) and also training indicators (RUFI, RUFE).
Although it is fairly common in structural equation modelling to eliminateindicators with cross loadings (large loading on the “wrong” LV), this is not the case inthe presented application. Both process indicators presented weak correlations withother Clinical Process indicators, reducing mono-factorial validity and discriminantvalidity. On the contrary, their inclusion in the HC block improves the indices ofmono-factorial validity and discriminant validity of this construct.
Apart from statistical considerations, the rationale of the combined Human Capitalindicators may rest on the conceptual definition of “quality of medical care”, whichremains a remarkably difficult notion to define. In a classic formulation almost 45 yearsago, Donabedian (1966, 1985) asserted that quality of care includes: structure (viewedas the capacity to provide high quality care), process (currently often termed asperformance), and clinical outcomes.
Structural measures of quality measure the presumed capacity of the practitioner orprovider to deliver quality health care, and typically include the characteristics of theresources in the health care system, including individual practitioners, groups ofpractitioners, organizations and systems of care. For health care professionals, thisassessment may include licensure, specialty board certification, and types of training.With regard to process, performance measures are useful only if measured processescan be linked to outcomes that are important to patients. Hence, for a process to be avalid measure of quality, it must be closely related to an outcome that people careabout. Specifically, continuing attention has been given to the importance of combiningstructural aspects such as governance and the health care workforce with measures ofperformance and/or outcomes to assess the quality of care (Donabedian, 1985; Koran,1975). This consideration was taken into account by the Institute of Medicine whichstated in 1990 that “quality of care is the degree to which health services for individualsand populations increase the likelihood of desired health outcomes and are consistentwith current professional knowledge” (IOM, 1990, p. 21). This definition has beenwidely accepted and has proven to be a robust and useful reference in the formulationof practical approaches to quality assessment and improvement, emphasizing thatprocess of care increases the probability of outcomes that are desirable to the patient,reducing the probability of undesired outcomes. This underlines the responsibility ofhealth professionals to scrupulously revise and improve their approach by respondingto both patient feedback and the new developments in medicine and the sciences aimedat generating more effective knowledge processes in providing desirable patientoutcomes.
With regard to selected process indicators (surgical re-admissions, QRSO andcomplications, QRRS), both indicators are internationally considered as measures thatreflect the quality of care in a patient safety perspective (Phillips et al., 2004; IQIP,2004).
Differently, structural measures of quality typically include the characteristics ofthe resources in the health care system. Hence RUFI and RUFE are measures of thepresumed capacity of the practitioner or provider to deliver quality health care. Suchconsiderations, in our opinion, justify the inclusion in the same block of process
The BSC inhealth care
51

indicators related to surgical interventions and complications (QRRS, QRSO) andtraining indicators (RUFI, RUFE). Hence, we entitle this construct: “Medical CareQuality (MCQ)”. In contrast, the “Clinical process” construct of Table II, illustratesHealth care performance issues which are not closely related to quality of the care,reflecting instead the clinical context in which health care services were delivered.
8. Results: the structural modelOnce the blocks are constructed in the Between and the Within structures, we buildtwo structural models. Applying the proposed building approach in both structures,we found that the two structural models resulting from the building strategy aredifferent in nature and involve different KPA. Furthermore, these causal structures(associations and causality direction) were confirmed by the data-driven approach,proposed by Jakobowicz and Derquenne (2007). As the last step, we apply PLSPM toestimate the completed structural models in each structure. Throughout the estimationstep, we focus on the centroid scheme for the inner estimation steps and on theReflective scheme for the outer estimation of Patient Satisfaction (as CustomerSatisfaction indicators are typically reflective, see Johnson et al., 2001), utilizing theformative scheme for Economy, MCQ and Clinical Process. Figure 1 shows, for eachstructure, the estimated PLSPM causal models (significant relationships amonginvolved LVs) resulting from the building strategy. The significant relationships areshown together with standardized structural coefficients and robust t-statistics, basedon the bootstrap (using 500 replications) standard errors estimation.
The significant relationships in Figure 1 show two different causal structures in theBetween and in the Within structure. However, both causality directions reflectstandard directional assumptions of the typical BSC causal scheme (Kaplan andNorton, 1996), presented in the treelike fashion: Human Capital (Quality of the medicalcare) ! Processes ! Satisfaction ! Economy. However, when compared with thepath proposed by the previously cited authors, some causal links between LVsdisappear. More specifically, in the Between structure (Local Health Agencies),Economy and Process dimensions are still endogenous LVs. Also MCQ remains anexogenous dimension. Economy has only one explaining LV (Clinical Process).
Figure 1.BSC structural modelsin both structures(standardized coefficientsand robust t-statistics)
PatientSatisfaction
ClinicalProcess
Economy
ClinicalProcess
EconomyMedical care
Quality
Between Structure
Within Structure
β = 0.470t = 6.750
β = 0.441t = 6.913
β = 0.376t = 5.896
β = 0.843t = 5.640
β = 0.600t = 2.703
JM27,1
52

The causal link (and the direction) between quality of medical care and Clinical Processremains significant in the model, whereas Patient Satisfaction is not causally linked toany other dimensions. In the Within structure (hospitals), Patient Satisfaction becomesan endogenous dimension, whereas Clinical Process becomes exogenous. Economy hastwo explaining LVs (Clinical Process and Patient Satisfaction) while PatientSatisfaction has only one (Clinical Process), whereas quality of medical care is notcausally linked to any other dimensions. Additionally, the signs of the estimatedrelationships are in the expected direction.
Table IV summarizes the fit indices of PLSPM models for the Between and Withinstructures. Specifically, it shows, the R 2 for endogenous LVs and Redundancies thatmeasure the average variance of an indicator’s set, related to an endogenous LV,explained by the exogenous LV’s. The structural equation explaining the targetvariable (Economy area), shows discrete fit (R 2 ¼ 0.51) for the Within structure andsatisfactory fit (R 2 ¼ 0.71) in the Between structure. In contrast, other endogenous LVs(Patient Satisfaction, Clinical Process) are poorly explained by the exogenous LVs(Clinical Process, MCQ), in the Within and Between structure, respectively.
9. ConclusionFrameworks such as the BSC have proved useful as effective strategic tools for linkingvarious performance indicators to the performance management activities/processes of anorganization. However, their success depends on an accurate assessment of therelationships between the indicators as well a specific understanding of how theserelationships address long-term performance goals. Objective argument and consensuswould be facilitated by the development of a methodology to identify the cause and effectrelationships between the components in the BSC KPA. This paper has presented a two-stepapproach that integrates a model building strategy and a PLSPM-based estimation strategyin a hierarchical framework in order to conceptualize the use of the BSC in the health sector.
This building strategy has the advantage of being applicable in different kinds ofestimation strategies. In fact, it works with latent concepts that have not beenpreviously estimated by any other specific estimation methodology, implementing amore objective approach which utilizes LV scores, as they are linear combinations thatmaximally reproduce the total variance of their manifest indicators. Alternatively,other PLSPM building methods maximize either communalities or redundancies foreach block, or else the R 2 of (a priori established) endogenous LVs. As they use PLSMlatent scores, these methods are model-specific (valid only for PLSPM), and stronglydepend on the implied estimation method.
As far as empirical results are concerned, in the measurement models we found anew latent construct that we entitle “MCQ”, which summarizes the amount of formaltraining and the two process measures that reflect the performance of surgical staff in
Within model Between modelKey area Role R 2 F 2 Role R 2 F 2
Economy Endogenous 0.509 0.640 Endogenous 0.710 0.658Patient Satisfaction Endogenous 0.221 0.522 Not in the modelClinical Process Exogenous – – Endogenous 0.360 0.551Medical Care Quality Not in the model Exogenous – –
Table IV.Evaluation of the
structural model with R 2
and redundancies (F 2)
The BSC inhealth care
53

terms of unscheduled returns to surgery and the rate of surgery with no complications.At the end of Section 7 we discuss the rationale of this construct. One limitation of themeasurement process for this construct is that it simultaneously contains bothinvestment indicators (training) and measures that reflect the quality of the care,suggesting that different specifications allowing causes and indicators (e.g. as in aMIMIC model, Joreskog and Goldberger, 1975) of a latent construct can be proposed.
Relative to the structural model, the obtained causal paths (different in both levels ofthe hierarchy) have clarified cause-and-effect relationships among BSC dimensionsspecified by Kaplan and Norton (1996) in the tree metaphor. The estimated models inthe empirical application reflect the usual directional assumptions, handled andhypothesized in a typical BSC causal scheme; the resulting causal models are relativelyclose to the authors’ original proposal, with some significant differences. For LocalHealth Agencies (Between structure), fruits (financial measures) are strongly related toClinical Processes (leaves) for which the quality of the medical care constitutes itsunique trunk (or root). Differently, for hospitals (Within structure), fruits (financialmeasures) are directly linked to Clinical Processes and Patient Satisfaction. Thecontribution of Clinical Process dimension results as being particularly significant. Inaddition, Clinical Processes shows a significant effect on the Patient Satisfaction area.
The main difference between the two structures (Between and Within) is expressed asthe significant impact of the quality of the medical care (only for the Between structure)and Patient Satisfaction (only for the Within structure) on the Economy dimension.Qualified professionals (Health Managers and stakeholders of Lombardy Directorate ofHealth) have deemed that these findings realistically reflect Health care managementgoals. At the Within level (Hospital) where the “patient” perspective is predominant,constant improvement of clinical processes and ongoing research towards increasingPatient Satisfaction are indispensable conditions for achieving financial results.Statistically, since the differences in medical quality among hospitals are quite minimal,whereas the differences in Patient Satisfaction averages becomes more marked, theimprovement of clinical processes has a positive impact on Patient Satisfaction, whereasquality of medical care does not have a causal impact on the other dimensions.
In contrast, at the Between level (Local Health Agencies), where the “employee”perspective and “internal process” are predominant, Local Health Agency strategiesare striving to improve financial results by ensuring adequate stock of MCQ andmaximizing the performance of clinical processes. Specifically, MCQ constitutes asignificant exogenous dimension, exerting a causal impact on the quality of clinicalprocesses, whereas Patient Satisfaction is not causally linked to other dimensions.
Examining the explicative power of the specified models, the target variable R 2 ofthe Economy dimension, achieves satisfactory results in both structures. Nevertheless,one methodological note of caution must be mentioned concerning the estimated causalstructures. As previously mentioned, since the (measurement models) buildingstrategy is largely exploratory and optimizes a statistical criterion the selected modelscan be considered valid only in terms of statistical validity. This applies to what typeof measurement models are adopted (apart from Patient Satisfaction, relationshipslinking LVs and indicators followed the formative scheme). Moreover, the adoptionof formative schemes for Clinical Process and Economy has been guided, not only bystatistical indices, but also by remaining consistent with the methodologies presentedin this article. In fact, since both the model building strategy (CLV) and the estimation
JM27,1
54

method (PLSPM) define and estimate each LV as linear combinations of their observedindicators, they logically assume the indicators to be formative.
The present study has three inherent limitations. First, as previously mentioned, animperative step aimed at identifying a “true” causal structure in the resulting Withinand Between structures requires the implementation of a validation analysis usingfresh, independent data. Unfortunately, this step cannot be completed, as the pilotstudy has not yet planned the validation phase. Moreover, in the Lombardy region, thisexperimental study has not been replicated using new, recently drawn data.
Second, a further limitation in this study is the lack of selected indicators, reflectingthe lack of available information in regional administrative archives. The limitednumber of indicators is evidence of a persisting information gap in the LombardyHealth sector, despite its status as being one of most developed health systems in Italy.
This may explain the third limitation of this study, regarding the inclusion of QRRSand QRSO in a typical Human Capital KPA. Although Kaplan and Norton (1996)suggest that a typical BSC may employ 20-25 KPI, as in the presented case, the chosenindicators for the HC area fail to cover the complete landscape of the Regional Healthsystem, limiting its capacity to provide a realistic overall picture. This considerationsuggests that further research on measuring and modelling Human Capital KPA withadditional and more complete indicators should be considered.
These limitations notwithstanding, it is our sincere hope that the present study willprove useful in guiding further attempts to conceptualize the BSC in the arena of theItalian Health sector. We trust that as more information is made available, it willprovide new, independent data for the validation phase, and eventually furnish acomplete set of performance indicators relevant to measuring and improving keyHealthcare issues through the application of the BSC method.
References
Ahn, H. (2001), “Applying the balanced scorecard concept: an experience report”, Long RangePlanning, Vol. 34 No. 4, pp. 441-61.
Akkermans, H.A. and van Oorschot, K.E. (2005), “Relevance assumed: a case study of balancedscorecard development using system dynamics”, Journal of the Operational ResearchSociety, Vol. 56, pp. 931-41.
Atkinson, A.A., Balakrishnan, R., Booth, P., Cote, J., Groot, T., Malmi, T., Roberts, H., Uliana, E.and Wu, A. (1997), “New directions in management accounting research”, Journal ofManagement Accounting Research, Vol. 9, pp. 79-108.
Baker, G.R. and Pink, G.H. (1995), “A balanced scorecard for Canadian hospitals”, HealthcareManagement Forum, Vol. 8 No. 4, pp. 7-21.
Bentler, P.M. (1982), “Linear system with multiple levels and types of latent variables”,in Joreskog, K. and Wold, H. (Eds), Systems Under Indirect Observation: Causality,Structure, Prediction, North Holland, Amsterdam, pp. 101-30.
Blumenthal, D. (1996), “Quality of care – what is it?”, The New England Journal of Medicine,Vol. 335, pp. 891-4.
Chow, C.W., Ganulin, D., Teknika, O., Haddad, K. and Williamson, J. (1998), “The balancedscorecard: a potent tool for energizing and focusing healthcare organization management”,Journal of Healthcare Management, Vol. 43 No. 3, pp. 263-80.
Churchill, G.A. (1979), “A paradigm for developing better measures of marketing constructs”,Journal of Marketing Research, Vol. 16, pp. 64-73.
The BSC inhealth care
55

Cortina, J. (1993), “What is coefficient alpha? An examination of theory and applications”, Journalof Applied Psychology, Vol. 78, pp. 98-104.
Donabedian, A. (1966), “Evaluating the quality of medical care”, Milbank Memorial FundQuarterly, Vol. 44, pp. 166-203.
Donabedian, A. (1985), Explorations in Quality Assessment and Monitoring: The Definition ofQuality and Approaches to its Assessment. Vol. III. The Methods and Findings of QualityAssessment Measurement and Monitoring, Health Administration Press, Ann Arbor, MI.
Efron, B. (1982),The Jackknife, The Bootstrap andOther Resampling Plans, SIAM, Philadelphia, PA.
Fornell, C. and Bookstein, F.L. (1982), “Two structural equation models in LISREL and PLSapplied to consumer exit-voice theory”, Journal of Marketing Research, Vol. 19, pp. 440-52.
Fornell, C. and Larcker, D. (1981), “Structural equation models with unobservable variables andmeasurement error”, Journal of Marketing Research, Vol. 18, pp. 39-50.
Goldstein, H. and McDonald, R.P. (1988), “A general model for the analysis of multilevel data”,Psychometrika, Vol. 53, pp. 455-67.
Healthcare Directorate of Lombardy Region (2004),Triennial Program for the Implementation of anEvaluation System and Management of Health Structures, Lombardy Region Press, Milan.
Hinkin, T.R. (1988), “A brief tutorial on the development of measures for use in surveyquestionnaires”, Organizational Research Methods, Vol. 1, pp. 104-21.
Hulland, J. (1999), “Use of partial least squares (PLS) in strategic management research: a reviewof four recent studies”, Strategic Management Journal, Vol. 20 No. 1, pp. 195-204.
Hurst, J. (2000), “Challenges for health systems in member countries of the organisation for economicco-operation and development”, Bulletin of World Health Organization, Vol. 78, pp. 751-60.
Inamdar, N., Kaplan, R.S. and Bower, M. (2002), “Applying the balanced scorecard in healthcareprovider organizations”, Journal of Healthcare Management, Vol. 47 No. 3, pp. 179-95.
IOM, The Institute of Medicine (1990) in Lohr, N. (Ed.), Medicare: A Strategy for QualityAssurance, National Academy Press, Washington, DC, The Institute of Medicine.
IQIP (2004), International Quality Indicator Project, available at: www.internationalqip.com(accessed 2 June).
Ittner, C.D. and Larcker, D.F. (1998), “Innovations in performance measurement: trends andresearch implications”, Journal of Management Accounting Research, Vol. 10, pp. 205-38.
Jakobowicz, E. and Derquenne, C. (2007), “A modified PLS path modeling algorithm handlingreflective categorical variables and a new model building strategy”, ComputationalStatistics and Data Analysis, Vol. 51, pp. 3666-78.
Johnson, M., Gustafsson, A., Andreassen, T., Lervik, L. and Cha, J. (2001), “The evolution andfuture of national customer satisfaction index models”, Journal of Economic Psychology,Vol. 22, pp. 217-45.
Joreskog, K. (1978), “Structural analysis of covariance and correlation matrices”, Psychometrika,Vol. 43, pp. 443-77.
Joreskog, K.G. (1993), “Testing structural equation models”, in Bollen, K.A. and Long, S.J. (Eds),Testing Structural Equation Models, Sage, London, pp. 294-316.
Joreskog, K.G. and Goldberger, S. (1975), “Estimation of a model with multiple indicators andmultiple causes of a single latent variable”, Journal of American Statistical Association,Vol. 70, pp. 631-9.
Kanji, G.K. and Sa, P.M.E. (2002), “Kanji’s business scorecard”, Total Quality Management,Vol. 13 No. 1, pp. 13-27.
JM27,1
56

Kaplan, R.S. and Norton, D.P. (1992), “The balanced scorecard. The measures that driveperformance”, Harvard Business Review, Vol. 70 No. 1, pp. 171-9.
Kaplan, R.S. and Norton, D.P. (1996), The Balanced Scorecard: Translating Strategy into Action,Harvard Business School Press, Boston, MA.
Kaplan, R.S. and Norton, D.P. (2001), The Strategy-Focused Organization: How BalancedScorecard Companies Thrive in the New Business Environment, Harvard Business SchoolPress, Boston, MA.
Kmenta, J. (1991), “Latent variables in econometrics”, Statistica Neederlandica, Vol. 45, pp. 73-84.
Koran, L.M. (1975), “The reliability of clinical methods, data, and judgments, part I”,New England Journal of Medicine, Vol. 293, pp. 695-701.
Lauro, N.C. (2007), “Valutazione dell’impatto delle politiche. Realizzazione di un sistema pilota inambito sanitario”, IReR Publication, No. A023, Milano.
Meredith, W. and Millsap, R.E. (1985), “On component analysis”, Psvchometrika, Vol. 50,pp. 495-507.
Morard, B. and Stancu, A. (2005), “Structural equation modeling in a rationalization tentative ofbalanced scorecard”, Cahiers de Recherche, No. 09, Universite de Geneve, Geneve.
Muthen, B. (1991), “Multilevel factor analysis of class and student achievement components”,Journal of Education Measurement, Vol. 28, pp. 338-54.
Muthen, B. (1994), “Multilevel covariance structure analysis”, Sociological Methods & Research,Vol. 22, pp. 376-98.
Northcott, D. and France, N. (2005), “The balanced scorecard in New Zealand health sectorperformance management: dissemination to diffusion”, Australian Accounting Review,Vol. 15 No. 37, pp. 34-46.
Phillips, R.L. Jr, Bartholomew, L.A., Dovey, S.M., Fryer, G.E. Jr, Miyoshi, T.J. and Green, L.A.(2004), “Learning from malpractice claims about negligent, adverse events in primary carein the United States”, Quality & Safety in Health Care, Vol. 13, pp. 121-6.
Oliveira, J. (2001), “The balanced scorecard: an integrate approach to performance evaluation”,Healthcare Financial Management, Vol. 55 No. 5, pp. 42-6.
Øvretveit, J. and Gustafson, D. (2003), “Using research to inform quality programmes”, BritishMedical Journal, Vol. 326 No. 5, pp. 759-61.
Pink, G.H., McKillop, I., Schraa, E.G., Preyra, C., Montgomery, C. and Baker, G.R. (2001),“Creating a balanced scorecard for a hospital system”, Journal of Healthcare Finance,Vol. 27 No. 3, pp. 1-20.
Sahney, V.K. (1998), “Balanced scorecard as a framework for driving performance in managedcare organizations”, Managed Care Quarterly, Vol. 6 No. 2, pp. 1-8.
SAS (1999), SAS/STAT, User’s Guide, SAS Institute, Cary, NC, Version 8.
Schonemann, P. and Steiger, J. (1976), “Regression component analysis”, British Journal ofMathematical and Statistical Psychology, Vol. 29, pp. 175-89.
Shields, M.D. (1997), “Research in management accounting by North Americans in the 1990s”,Journal of Management Accounting Research, Vol. 9, pp. 3-61.
Shortell, S.M. and Kaluzny, A.D. (2006), Health Care Management: Organization Design andBehavior, 5th ed., Thomson Delmar Learning, Clifton Park, NY.
Smith, D. and Langfield-Smith, K. (2004), “Structural equation modeling in managementaccounting research: critical analysis and opportunities”, Journal of Accounting Literature,Vol. 23, pp. 49-86.
The BSC inhealth care
57

Stelzl, I. (1986), “Changing the causal hypothesis without changing the fit: some rules forgenerating equivalent path models”, Multivariate Behavioral Research, Vol. 21, pp. 309-31.
Tenenhaus, M., Vinzi, V., Chatelin, Y.M. and Lauro, C. (2005), “Partial least squares”,Computational Statistics & Data Analysis, Vol. 48 No. 1, pp. 159-205.
Timmerman, M.E. (2006), “Multilevel component analysis”, British Journal of Mathematical andStatistical Psychology, Vol. 59, pp. 301-20.
Tuomela, T.-S. (2005), “The interplay of different levers of control: a case study of introducing anew performance measurement system”, Management Accounting Research, Vol. 16 No. 3,pp. 293-320.
Vigneau, E. and Qannari, E. (2003), “Clustering of variables around latent components”,Communication in Statistics, Vol. 32, pp. 1131-50.
Vittadini, G. (1989), “Indeterminacy problems in the LISREL model”, Multivariate BehavioralResearch, Vol. 24 No. 4, pp. 397-414.
WHO (2000), The World Health Report 2000. Health Systems: Improving Performance,World Health Organization, Geneva.
Wold, H. (1982), “Soft modelling: the basic design and some extensions”, in Joreskog, K. andWold, H. (Eds), Systems Under Indirect Observation: Causality, Structure, Prediction,North-Holland, Amsterdam, pp. 1-54.
Zelman, W.N., Pink, G.H. and Matthias, C.B. (2003), “Use of the balanced scorecard in healthcare”, Journal of Healthcare Finance, Vol. 29 No. 4, pp. 1-16.
Further reading
Iezzoni, L.I. (1997), “Assessing quality using administrative data”, Annals of Internal Medicine,Vol. 127, pp. 666-74.
Zhan, C. and Miller, M.R. (2003), “Excess length of stay, charges, and mortality attributable to medicalinjuries during hospitalisation”, Journal ofAmericanMedicalAssociation, Vol. 290, pp. 1868-74.
About the authorsPietro Giorgio Lovaglio is an Associate Professor in the Department of Quantitative Methods,Faculty of Statistics, University of Milan-Bicocca (Italy) and Senior (Statistician) Researcher ofCRISP (Inter-University Research Center on the Service of Public Utility to the person) at Universityof Bicocca Milan. CRISP aims to promote and develop research programs on effectiveness,efficiency, equity, Customer Satisfaction). Recent publications refer to latent variable modelling andmethods of evaluation applied in the context of the services to the person (effectiveness andCustomer Satisfaction in health, human capital in labour market; impact analysis). Pietro GiorgioLovaglio is the corresponding author and can be contacted at: [email protected]
Giorgio Vittadini is a Full Professor in the Department of Quantitative Methods, Faculty ofStatistics, University of Milan-Bicocca (Italy) and Senior (Statistician) Researcher of CRISP(Inter-University Research Center on the Service of Public Utility to the person) at University ofBicocca Milan. Recent publications refer to latent variable modelling and methods of evaluationapplied in the context of health care and human capital.
JM27,1
58
To purchase reprints of this article please e-mail: [email protected] visit our web site for further details: www.emeraldinsight.com/reprints

Reproduced with permission of the copyright owner. Further reproduction prohibited without permission.