bs bs banner - researchgate.net · bs_bs_banner. mental health. Future study should test the...
22
See discussions, stats, and author profiles for this publication at: https://www.researchgate.net/publication/315575811 Profiles of Physical Function, Physical Activity, and Sedentary Behavior and their Associations with Mental Health in Residents of Assisted Living Facilities Article in Applied Psychology Health and Well-Being · March 2017 DOI: 10.1111/aphw.12085 CITATIONS 3 READS 179 6 authors, including: Some of the authors of this publication are also working on these related projects: HEalth, Aging and Retirement Transitions in Sweden (HEARTS) View project Narcissism and performance View project Cecilie Thøgersen-Ntoumani Curtin University 93 PUBLICATIONS 2,385 CITATIONS SEE PROFILE Nikos Ntoumanis Curtin University 275 PUBLICATIONS 11,706 CITATIONS SEE PROFILE Andreas Stenling Umeå University 43 PUBLICATIONS 286 CITATIONS SEE PROFILE Sally A.M. Fenton University of Birmingham 23 PUBLICATIONS 75 CITATIONS SEE PROFILE All content following this page was uploaded by Nikos Ntoumanis on 07 October 2017. The user has requested enhancement of the downloaded file.
-
Upload
nguyenkhanh -
Category
Documents
-
view
213 -
download
0
Transcript of bs bs banner - researchgate.net · bs_bs_banner. mental health. Future study should test the...

See discussions, stats, and author profiles for this publication at: https://www.researchgate.net/publication/315575811
Profiles of Physical Function, Physical Activity, and Sedentary Behavior and
their Associations with Mental Health in Residents of Assisted Living Facilities
Article in Applied Psychology Health and Well-Being · March 2017
DOI: 10.1111/aphw.12085
CITATIONS
3
READS
179
6 authors, including:
Some of the authors of this publication are also working on these related projects:
HEalth, Aging and Retirement Transitions in Sweden (HEARTS) View project
Narcissism and performance View project
Cecilie Thøgersen-Ntoumani
Curtin University
93 PUBLICATIONS 2,385 CITATIONS
SEE PROFILE
Nikos Ntoumanis
Curtin University
275 PUBLICATIONS 11,706 CITATIONS
SEE PROFILE
Andreas Stenling
Umeå University
43 PUBLICATIONS 286 CITATIONS
SEE PROFILE
Sally A.M. Fenton
University of Birmingham
23 PUBLICATIONS 75 CITATIONS
SEE PROFILE
All content following this page was uploaded by Nikos Ntoumanis on 07 October 2017.
The user has requested enhancement of the downloaded file.

Profiles of Physical Function, Physical Activity,and Sedentary Behavior and their Associationswith Mental Health in Residents of Assisted
Living Facilities
Saengryeol ParkUniversity of Birmingham, UK
Cecilie Thøgersen-Ntoumani and Nikos NtoumanisCurtin University, Perth, Western Australia
Andreas StenlingUmea Universitet, Sweden
Sally A.M. Fenton and Jet J.C.S. Veldhuijzen van Zanten*University of Birmingham, UK
Background: The current study used latent profile analyses to identify classes ofolder participants based on physical health, physical function, light physical activ-ity, moderate-to-vigorous physical activity, and sedentary behavior, and then exam-ined differences in mental health between these classes. Methods: Eighty-fiveresidents (M = 77.5 years old, SD = 8.2) from assisted living facilities partici-pated. Light physical activity, moderate-to-vigorous physical activity, and seden-tary behavior were assessed by accelerometers, physical function was measuredusing different tasks (mobility, grip strength, and spirometry), and body mass indexwas calculated. Mental and physical health (i.e. anxiety, depression, fatigue, vital-ity, and subjective mental and physical health) were assessed by question-naires. Results: Latent profile analyses revealed three classes: “Class 1: Lowphysical function and physical activity with a highly sedentary lifestyle” (27.1%),“Class 2: Moderate physical function and physical activity with a moderate seden-tary lifestyle” (41.2%), “Class 3: High physical function and physical activity withan active lifestyle” (31.8%). The results revealed that the latter class reported bettermental health than the other two classes. Conclusions: This study suggests thathealth promotion for older adults might benefit from identifying profiles of move-ment-related behaviors when examining the links between physical activity and
* Address for correspondence: Jet J.C.S. Veldhuijzen van Zanten, School of Sport, Exercise andRehabilitation Sciences, University of Birmingham, Edgbaston, Birmingham B15 2TT, UK. Email:[email protected]
APPLIED PSYCHOLOGY: HEALTH AND WELL-BEING, 2017, 9 (1), 60–80doi:10.1111/aphw.12085
© 2017 The International Association of Applied Psychology
bs_bs_banner

mental health. Future study should test the intervention potential of this profilingapproach.
Keywords: accelerometer, active lifestyle, latent profile analysis, older adults
INTRODUCTION
With an increasingly aging population, it is important to explore factors relatedto maintaining good physical and mental health in older age. Recent evi-dence indicates that approximately 15 per cent of older people (≥ 60 years)across the world are diagnosed with a mental health disorder (World HealthOrganizaion, 2016). This study examined mental health and some of itsmovement-related correlates in residents in assisted living facilities. Assistedliving facilities offer assistance with daily living activities, but the residents arelargely independent (Carder, 2002). Poor mental health is prevalent in olderadults residing in these settings and is related to transfers to nursing homes (Aud& Rantz, 2005; Watson, Garrett, Sloane, Gruber-Baldini, & Zimmerman, 2003)and such transfers have individual and societal costs (Hawes, Rose, & Phillips,1999).
A physically active lifestyle is central to maintaining mental health inolder adults. For example, engagement in objectively assessed daily moder-ate-to-vigorous physical activity is related to lower prevalence of depressivesymptoms (Vallance et al., 2011). Light physical activity, the most commonintensity of physical activity for older adults, can also be important forreaping mental health benefits (Buman et al., 2010; Song, Lee, Baek, &Miller, 2011). Recent evidence also indicates that sedentary behavior is neg-atively associated with psychological health in adults independently of phys-ical activity. For example, higher levels of sedentary behavior were relatedto depression or depressive symptoms (Hamer & Stamatakis, 2014; Kang,Basham, & Kim, 2013; Lucas et al., 2011); however, this has not beenfound in other studies (Rosenberg et al., 2016).
Older adults living in assisted living facilities are at greater risk of experienc-ing compromised psychological health (Watson et al., 2003), and have lowerlevels of light physical activity compared to those living independently (Moran,MacMillan, Smith-Merry, Kilbreath, & Merom, 2015). Given the important rolesof physical activity and sedentary behavior in mental health in community dwell-ing older adults, gaining more knowledge about these associations in people liv-ing in assisted living facilities might be informative to improve mental health inthis particular population of older adults.
Physical function is another factor related to physical and mental healthin older adults. For example, better physical function has been related to
LIFESTYLE ACTIVITY, PHYSICAL AND MENTAL HEALTH 61
© 2017 The International Association of Applied Psychology

less time spent being sedentary (Lee et al., 2015) and a smaller risk for re-hospitalisation (Soley-Bori et al., 2015). However, the reported associationsbetween physical function and mental health in people living in assisted liv-ing facilities are inconsistent. For example, a pilot study of assisted livingfacility residents revealed no associations between the use of a walking aidand depressive symptoms (Wyrick, Parker, Grabowski, Feuling, & Ng,2008), but grip strength and repeated chair rise were related to depressionin another study (Giuliani et al., 2008). Such inconsistent findings mightsuggest that when exploring the associations between functional ability andmental health, it is important to incorporate a range of measures of physicalfunction. Given that some of the measures have been reported to be influ-enced by physical activity, levels of physical activity should also be takeninto consideration. Unfortunately, studies that have reported on associationsbetween physical function and mental health in residents of assisted livingfacilities did not report on physical activity.
Latent profile analysis was used to identify such profiles. With thismethod, individuals are classified into distinct classes on the basis of theirhomogeneity of scores for different behaviors (i.e. light physical activity,moderate-to-vigorous physical activity, physical function, and sedentarybehavior; Soley-Bori et al., 2015). Subsequently, differences between theclasses of people on dependent variables of interest can be explored. Thisperson-centered model can be distinguished from a variable-centered model(e.g. regressions, ANOVAs) in which the aim is to explore relations betweenvariables, ignoring how these variables are combined within people. A per-son-centered model is more appropriate when individuals in a sample haveheterogeneous characteristics (Muth�en & Muth�en, 2000). As such, this modelis more suitable for use when considering the variable health status of resi-dents in assisted living facilities. Previous studies adopting latent profile ana-lysis revealed that different profiles reflecting mental health and health-relatedvariables were related to self-reported physical activity in middle-aged adults(Gerber & Jonsdottir, 2014). To date, latent profile analysis has not beenused to explore the associations between physical function, light physicalactivity, moderate-to-vigorous physical activity, sedentary behavior, and men-tal health in older adults. The primary aim of this study was, therefore, toexamine such associations using latent profile analysis. We hypothesised thata number of distinguishable profiles would be identified based on individuals’physical function, physical health, light physical activity, moderate-to-vigor-ous physical activity, and sedentary behavior proportions. Further, weexpected that the individuals in profiles with better physical function, morelight physical activity, more moderate-to-vigorous physical activity, and lesssedentary behavior would report better mental health than those individualsin profiles with worse physical function and less movement.
62 PARK ET AL.
© 2017 The International Association of Applied Psychology

METHODS
Participants
Participants were recruited from 13 assisted living facilities across England.Assisted living facilities were identified through either online searches or viawebsites (www.housingcare.org). Following approval from managers of inter-ested facilities, residents were informed of the study through their assisted livingfacilities newsletter or well-being staff, as well as during coffee mornings ormonthly meetings. A total of 85 residents (female = 68.2%, male = 31.8%,Mage = 77.5, SD = 8.2, age range = 65–99 years) took part in the study. Demo-graphic information and disease prevalence are reported in Table 1. Residentswho needed a wheelchair or scooter for their daily activities were excluded fromthe study. The majority of the participants did not use an assistive device forwalking (80%), only nine participants (10.6%) used a stick and eight participants(9.4%) used a walking frame. The study was approved by the Ethical ReviewCommittee of a UK university. All participants provided informed consentbefore participating.
Procedures
All assessments were carried out in a dedicated space in the participants’ assistedliving facilities. All participants completed two testing sessions, which werescheduled one week apart. At the beginning of the first session, research staffexplained all procedures to the participants. After this, body composition,spirometry, grip strength, and timed up and go assessments were conducted.These measurements took approximately 40 minutes and were carried outbetween 9 am and 4 pm. Following these measurements, a questionnaire packwas given to participants, who were asked to complete it during the next week.In addition, participants were given an accelerometer to wear during that week,and were asked to keep an activity diary to record the wear time of theaccelerometers.
Measures
Body Composition. A portable body composition monitor (TANITA BC-545N) was used to measure weight (kg). Height (m2) was measured using a sta-diometer (Seca Leicester Height Measure). Body mass index (BMI) was calcu-lated using the formula: weight [kg] / height [m2].
Lung Function. Spirometry was conducted to measure lung function usinga hand-held spirometer (Micro Medical Micro Ms03 spirometer). Participants
LIFESTYLE ACTIVITY, PHYSICAL AND MENTAL HEALTH 63
© 2017 The International Association of Applied Psychology

TABLE 1Demographics and Characteristics of Participants
Variable
Age, M (SD) 77.5 (�8.17)Sex, n (%) 85Male 27 (31.8%)Female 58 (68.2%)
EducationSecondary, n (%) 26 (30.6%)Higher, n (%) 8 (9.4%)Postgraduate, n (%) 1 (1.2%)Other, n (%) 8 (9.4%)None of above, n (%) 32 (37.6%)Missing 10 (11.8%)
Age left school, M (SD) 15.3 (SD 1.1)Missing, n (%) 3 (3.5%)
Marital statusMarried/co-habiting, n (%) 35 (41.2%)Widowed, n (%) 39 (45.9%)Single (never married), n (%) 2 (2.4%)Separated, n (%) 9 (10.6%)
No. of children, M (SD) 2.4 (SD 1.3)Missing, n (%) 2 (2.4%)
Alcohol consumptionCurrent, n (%) 51 (60.0%)Previous, n (%) 17 (20.0%)Never, n (%) 15 (17.6%)Missing, n (%) 2 (2.4%)
SmokingCurrently, n (%) 4 (4.7%)Previously, n (%) 43 (50.6%)Never, n (%) 37 (43.5%)Missing, n (%) 1 (1.2%)
EthnicityWhite British, n (%) 81 (95.3%)Irish, n (%) 2 (2.4%)Other white, n (%) 1 (1.2%)Asian, n (%) 1 (1.2%)
Annual income before retirement or current< £20,000, n (%) 50 (58.8%)£20,000–£35,000, n (%) 18 (21.2%)£35,000–£45,000, n (%) 2 (2.4%)> £45,000, n (%) 2 (2.4%)Missing, n (%) 13 (15.3%)
Self-reported diseaseDiabetes, n (%) 10 (12.0%)Cardiovascular disease, n (%) 53 (62.4%)Musculoskeletal disease, n (%) 46 (54.1%)Kidney/liver disease, n (%) 3 (3.5%)Lung disease, n (%) 12 (14.1%)Cancer, n (%) 8 (9.4%)Parkinson’s disease, n (%) 2 (2.4%)Other, n (%) 16 (18.8%)
64 PARK ET AL.
© 2017 The International Association of Applied Psychology

were seated for at least 5 minutes before the assessment was taken, and remainedseated throughout. First, a clip was placed on the nose of the participants to pre-vent exhaling or inhaling through the nose. All participants underwent thisassessment twice with a short break in between the assessments. Forced expira-tory volume in 1 second was provided and reported on the screen of the monitor.Forced expiratory volume in 1 second was recorded as the highest volume ofexhaling (Gardner & Hankinson, 1988). The mean of two forced expiratory vol-ume in 1 second results was taken and was standardised by height2 (forced expi-ratory volume in 1 second/ht2) (Miller, Pedersen, & Dirksen, 2007).
Grip Strength Test. Grip strength was measured using a digital dynamome-ter (TAKEI T.K.K. 5401 Grip-D, Japan). Participants were asked to stand upand grip the dynamometer as tightly as possible with their dominant hand (Shin-kai et al., 2003). The test was conducted twice, with the second test carried outapproximately 10 seconds after the first assessment. The average of the two mea-surements of grip strength was calculated and expressed in kg.
Mobility Test. The Timed Up and Go test was conducted to measuremobility, including the use of an assistive device, and balance (Podsiadlo &Richardson, 1991). Participants were asked to get up from their chair, walk 3meters and return to the chair. A researcher demonstrated the procedure and par-ticipants were given the opportunity to practice. Mobility was measured as thenumber of seconds taken to complete the task.
Subjective Physical and Mental Health. The SF-12 was used to measurephysical health and mental health of the participants (Ware, Kosinski, & Keller,1996). In this 12-item questionnaire (six items for each subscale) participantswere asked to respond to statements which asked about their general physicaland mental health over the last 4 weeks (e.g. “During the past 4 weeks, howmuch did pain interfere with your normal activities?”; “During the past 4 weeks,did you have a lot of energy?”). Items were weighted and summed according toexisting guidelines (Ware, Kosinski, & Keller, 1998). A higher score of subjec-tive physical health and mental health indicates better physical and mentalhealth, respectively.
Subjective Vitality. The five-item subjective vitality scale was selected(Ryan & Frederick, 1997). Items (e.g. “I felt alive and full of vitality”) wererated on a 7-point scale ranging from 1 (not at all true) to 7 (very true). Partici-pants’ responses across the five items were averaged to provide an overall scorefor subjective vitality.
Anxiety and Depression. The Hospital Anxiety and Depression Scale(HADS) was used to measure anxiety and depressive symptoms (Zigmond &
LIFESTYLE ACTIVITY, PHYSICAL AND MENTAL HEALTH 65
© 2017 The International Association of Applied Psychology

Snaith, 1983). This questionnaire comprises seven items to measure anxiety (e.g.“I can sit at ease and feel relaxed”) and seven items for depression (e.g. “I stillenjoy the things I used to enjoy”). The items were summed for analysis.
Fatigue. Feelings of “general fatigue”, “physical fatigue”, “reduced activ-ity”, “mental fatigue”, and “reduced motivation” were assessed using the Multi-ple Fatigue Index (MFI-20; Smets, Garssen, Bonke, De, & Haes, 1995). A 5-point scale was used ranging from (1) yes, that is true to (5) no, that is not trueto answer questions (e.g. “I feel fit”). For the purpose of latent profile analysis,individual subscales were calculated and all subscales were summed to representthe overall degree of fatigue experienced.
Quality of Life. Quality of life was measured using the Dartmouth CO-OPChart (Jenkinson, Mayou, Day, Garratt, & Juszczak, 2002). The scale identifiesnine domains relevant to quality of life (i.e. physical fitness, feelings, daily activ-ities, social activities, pain, change in health, overall health, social support, andquality of life), and a reference is made to the past 4 weeks (e.g. for emotionalproblems: “During the past 4 weeks, how much have you been bothered byemotional problems such as feeling anxious, depressed, irritable or downheartedand sad?”). A total score was used for the purposes of latent profile analysis.
Physical Activity and Sedentary Behavior. Activity monitors (models:GT3X+, WGT3X-BT; ActiGraph, Pensacola, FL, USA) were used to assesssedentary behavior, light physical activity, and moderate-to-vigorous physicalactivity. These two accelerometer models have demonstrated high intra-monitorreliability and have been validated with acceptable criteria (Miller, 2015). Themonitors were set to collect counts at 60-s epochs. An algorithm was adopted toclassify non-wear time (consecutive zeros: 90 minutes, tolerance allowance:2 minutes between 0 and < 100 counts; Choi, Ward, Schnelle, & Buchowski,2012). Participants were instructed to wear their monitor on their right hip and toremove it during sleep and water-based activities (e.g. showering, swimming).Based on the daily start and stop times of wearing accelerometers recorded in atime log by participants, we set a time frame to represent waking hours (7 am –10:30 pm). Data recorded during this time frame were extracted to determineminutes per day spent sedentary and in different intensities of physical activity.Inclusion criteria for valid accelerometer data were 10 hours of wear time perday, on a minimum of 3 days, including a weekend day. Data from participantsmeeting these criteria were retained for use in subsequent analyses (N = 101,accelerometer protocol compliance = 89, no questionnaire responses = 4). Thefinal sample, therefore, included N = 85 participants. Classification of theaccelerometer data was conducted using criteria by Matthews et al. (2008) forsedentary behavior, and Troiano et al. (2008) for light physical activity and mod-erate-to-vigorous physical activity: sedentary = 0 to 99 counts per minute (cpm),
66 PARK ET AL.
© 2017 The International Association of Applied Psychology

light physical activity = 100–2,019 cpm, moderate physical activity = 2,020–5,998 cpm, vigorous physical activity = ≥5,999 cpm. The sum of moderatephysical activity and vigorous physical activity represented moderate-to-vigor-ous physical activity.
Minutes spent sedentary, in light physical activity, and in moderate-to-vigor-ous physical activity recorded across all valid days were summed and divided bythe number of valid days to determine minutes/day spent in each activity. Forthe purpose of latent profile analysis, activities were expressed as a percentage ofwear time (calculated as minutes spent in each activity (min/day) / average wear-times (min/day) 9 100), in order to adjust for inter-participant variability inaccelerometer wear time (Booth et al., 2014).
Statistical Analysis
IBM SPSS version 22.0 was used to calculate descriptive statistics and estimatebivariate correlations. Missing data (26 items from different questionnaires weremissing) were imputed using the expectation maximisation (EM) algorithm(Enders, 2001). We ran LPA in Mplus version 7.4 (Muth�en & Muth�en, 2015)using the robust maximum likelihood (MLR) estimator. All physical functionvariables (continuous) were standardised into z-scores. The BCH method (Aspar-ouhov & Muth�en, 2014) was employed for class comparisons using the mentalhealth variables as (continuous) auxiliary distal outcomes. A nested model com-parison approach was used, comparing more complex models (k-class model)with simpler models (k�1 class model) to determine the number of classes toretain in the final model. We estimated models with one to four latent classes.When deciding on the final latent class solution, we used a number of statisticalcriteria, such as the Akaike information criterion (AIC), Bayesian informationcriterion (BIC), the sample-size adjusted BIC (SSA-BIC), Lo-Mendell-Rubinadjusted LRT test (adjusted LMR), bootstrapped likelihood ratio test (BLRT),entropy, and proportion of participants in each class. Lower AIC, BIC, and SSA-BIC values indicate better model fit. Statistically, significant adjusted LMR andBLRT values indicate that the k-class model provides a better fit to the data com-pared to the k�1 class model. In addition, higher entropy and the proportion ofparticipants in each class were also considered when comparing the nested mod-els. We took the class size into account because very small class sizes may resultin imprecision and low power (Berlin, Williams, & Parra, 2014). These statisticalcriteria, in combination with substantive meaning, guided the choice of the finalmodel (Marsh, L€udtke, Trautwein, & Morin, 2009). Finally, we conducted chi-square difference tests using the BCH method to examine differences amongstthe classes regarding mental health. Initially, 100 starting values were used withthe 20 best retained for the final solution. The final model was also replicatedusing 500 random start values.
LIFESTYLE ACTIVITY, PHYSICAL AND MENTAL HEALTH 67
© 2017 The International Association of Applied Psychology

RESULTS
Table 2 displays the descriptive statistics and bivariate correlations betweenthe study variables. The participants spent on average 201.13 min/day(SD = 71.96) in light physical activity, 9.74 min/day (SD = 9.62) in moderate-to-vigorous physical activity, and 511.93 min/day (SD = 105.72) in sedentarybehavior. As can be seen from Table 2, light physical activity, moderate-to-vigorous physical activity, subjective physical health, forced expiratory volumein 1 second, and mobility were positively correlated with mental health,whereas sedentary behavior was negatively correlated with mental health. Nostatistically significant correlations were found between grip strength, BMI,and mental health.
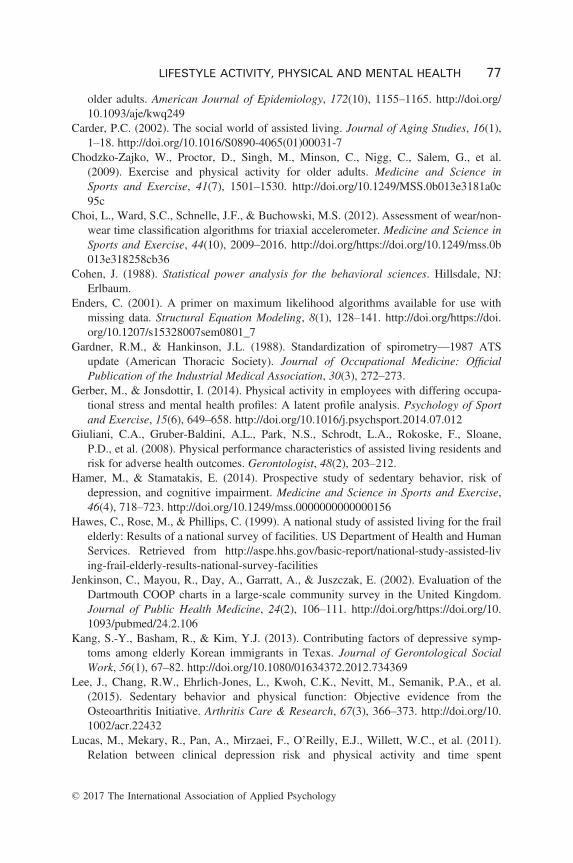
The statistical criteria indicated that the three-class model had a better modelfit compared to the two-class model (except for the lower entropy value;Table 3). Some model fit indices indicated a slightly better model fit for a four-class model compared to the three-class model. Adding a fourth class, however,did not provide a better understanding of the data and one of the classes in thefour-class solution was very small (n � 11). In line with recommendations byMarsh et al. (2009), we considered the theoretical and substantive meaning ofeach class and concluded that adding a fourth class did not contribute to a betterunderstanding of the data in the current study. The three latent classes are graphi-cally depicted in Figure 1. The first class (class 1) was labeled “low physicalfunction and physical activity (including light physical activity and moderate-to-vigorous physical activity) with a highly sedentary lifestyle” and contained 27.1per cent of the sample. Class 1 was characterised by people who were not veryphysically active, perceived their physical health as poor, and showed poor phys-ical functioning. The second class (class 2) was referred to as “moderate physicalfunction and physical activity with a moderate sedentary lifestyle” and consistedof 41.2 per cent of the sample. Class 2 was characterised by moderately activepeople who reported moderate levels of physical health and showed moderatephysical functioning. The third class (class 3) was labeled “high physical func-tion and physical activity with an active lifestyle” and included 31.8 per cent.Class 3 was characterised by physically active people who reported that theirphysical health was good and showed a high level of physical functioning. Thelargest mean differences across all profile indicators were found between class 1(low physical function and physical activity with a highly sedentary lifestyle)and class 3 (high physical function and physical activity with an active lifestyle).
Table 4 shows the latent profile characteristics of the three-class model. Largeeffect sizes (Cohen’s d ≥ 0.8; Cohen, 1988) were observed across all profileindicators between class 1 and class 3. In contrast, the effect sizes of the differ-ences between class 2 and class 1 ranged from medium to large, and thosebetween class 3 and class 2 ranged from small to large (small = 0.2,medium = 0.5; Cohen, 1988).
68 PARK ET AL.
© 2017 The International Association of Applied Psychology

The mental health scores of the three classes are presented in Table 5. Themeans of subjective mental health and vitality (higher values indicate better men-tal health) increased from class 1 to class 2 to class 3. The means of quality oflife, anxiety, depression, and fatigue (higher values indicate worse mental health)showed an opposite pattern and decreased from class 1 to class 2 to class 3(Table 5). The overall tests for the class comparisons were statistically signifi-cant for all mental health variables, except subjective mental health, indicatingan overall difference amongst the three classes. The specific class comparisonsshowed that people in class 1 reported lower quality of life, less vitality, andhigher levels of depression and fatigue, compared to individuals in classes 2 and3. People in class 1 also reported lower levels of subjective mental health andhigher levels of anxiety compared to individuals in class 3. In class 2 people alsoreported lower quality of life, less vitality, and higher levels of anxiety, depres-sion, and fatigue compared to individuals in class 3. Large effect sizes were
TABLE 2Descriptive Statistics and Bivariate Correlation Analyses
M SD Skew Kur a 2. 3. 4. 5.
1. Wear time(min/day)
722.79 68.71 0.46 �0.84 .30** �.30** �.21 �.24*
2. SB (%) 70.52 11.01 �0.08 0.23 �1.0** �.64** �.50**3. Light PA
(%)28.11 10.20 0.02 0.00 .55** .47**
4. MVPA (%) 1.37 1.37 1.52 3.91 .48**5. PCS-12 41.34 11.76 �0.30 �1.13 0.846. FEV1
(liter/m2)0.65 0.18 0.27 �0.07
7. Grip (kg) 21.45 10.85 1.13 1.538. BMI
(kg/m2)28.16 4.93 0.66 0.26
9. Mobility(seconds)
13.58 7.40 1.82 2.76
10. MCS-12 53.43 9.29 �1.40 2.20 0.8011. Vitality 4.23 1.40 �0.13 �0.39 0.9212. Anxiety 4.82 3.50 0.54 �0.25 0.8313. Depression 3.92 2.78 0.78 0.26 0.7014. Fatigue 48.80 16.60 0.37 �0.07 0.57�0.8215. QoL 21.78 6.34 0.61 �0.18 0.82
Note: *p < .05; **p < .01. Skew = Skewness, Kur = Kurtosis, a = Cronbach’s alpha reliability coefficients,Light PA = Light physical activity, MVPA = Moderate-to-vigorous physical activity, PCS-12 = Physical healthfrom SF-12, FEV1 = Forced expiratory volume in 1 second, Grip = Grip strength, BMI = Body mass index,SB = Sedentary behavior, MCS-12 = Mental health from SF-12, QoL = Quality of life from the COOPDartmouth chart. Descriptive statistics and bivariate correlation analyses were calculated after imputing missingdata points.
LIFESTYLE ACTIVITY, PHYSICAL AND MENTAL HEALTH 69
© 2017 The International Association of Applied Psychology

found between class 1 and class 3 for vitality (d = 1.24), fatigue (d = �1.89),depression (d = �1.67), anxiety (d = �1.02), and quality of life (d = �1.43).
Given the high correlation between sedentary behavior and light physicalactivity, an additional latent profile analysis was conducted without light physi-cal activity as one of the factors. These analyses revealed that taking out lightphysical activity did not significantly influence the number of participants ineach class (class 1: 28.2%, class 2: 42.4%, class 3: 29.4%). Importantly, thereported differences between the classes with regard to the mental health out-comes remained similar to the ones presented above.
DISCUSSION
The present study used latent profile analysis to classify individuals, based ontheir physical health, physical function, physical activity, and sedentary behavior
6. 7. 8. 9. 10. 11. 12. 13. 14. 15.
�.05 �.13 .00 .16 .05 .10 �.09 .05 .01 .07
�.30** �.22* .20 .56** �.20 .38** �.39** .28* .37** .51**.27* .19 �.17 �.53** .20 �.37** .39** �.27* �.37** �.49**
.35** .29** �.36** �.50** .10 �.35** .21* �.18 �.28** �.43**
.37** .08 �.38** �.59** .19 �.70** .57** �.43** �.54** �.66**.52** �.06 �.49** .27* �.39** .22* �.35** �.30** �.37**
.11 �.34** .02 �.07 .02 �.08 �.04 �.15.12 .05 .20 �.07 .03 .09 .09
�.39** .58** �.47** .36** .52** .59**
�.38** �.56** �.46** �.40** �.63**�.50** �.63** �.69** �.66**
.65** .55** .60**.65** .70**
.64**
70 PARK ET AL.
© 2017 The International Association of Applied Psychology

proportions, into one of three distinct classes. All class indicators were standard-ised and the classes were compared against each other on the basis of whethertheir mean score on each class indicator was around the mean (z = 0) of the
TABLE 3Classes Identified via Latent Profile Analyses
Fit statistics 1 Class 2 Classes 3 Classes 4 Classes
AIC 1961.76 1648.78 1591.90 1550.80BIC 2000.84 1729.38 1714.03 1714.46SSA-BIC 1950.36 1625.28 1556.29 1503.09Entropy – 0.97 0.92 0.93BLRT p-value – 0.000 0.000 0.000Percent of participantsper class (%)
100 28.2, 71.8 27.1, 41.2, 31.8 29.4, 30.6,27.1, 12.9
Note: AIC = Akaike information criterion, BIC = Bayesian information criterion, SSA-BIC = sample-sizeadjusted BIC, BLRT = Bootstrapped likelihood ratio test. Percent of participants per class (%) = the proportion ofparticipants in each of the classes in the model.
-1.5
-1
-0.5
0
0.5
1
1.5
L ig h t P A MV P A P C S - 1 2 F E V 1 G r ip B MI Mo b i l i t y S B
Sta
ndar
dise
d m
eans
Class 1 Low physical function and physical activity with a highly sedentary lifestyle
Class 2 Moderate physical function and physical activity with a moderate sedentary lifestyle
Class 3 High physical function and physical activity with an active lifestyle
FIGURE 1. Mean scores of profiles for the three-class model (standardised scores).Note : Light PA = Light physical activity, MVPA = Moderate-to-vigorous physicalactivity, PCS-12 = Physical health from SF-12, FEV1 = Forced expiratory volume in1 second, Grip = Grip strength, BMI = Body mass index, SB = Sedentary behavior.[Colour figure can be viewed at wileyonlinelibrary.com]
LIFESTYLE ACTIVITY, PHYSICAL AND MENTAL HEALTH 71
© 2017 The International Association of Applied Psychology

whole sample, above the mean (positive z-scores) or below (negative z-scores)the mean. The first class (27.1% of the sample) included individuals who, com-pared to the other two classes, had much lower levels of physical activity, higherlevels of sedentary behavior, were more overweight, and had poorer functionalhealth. The second class was the largest class (41.2%) and included individualswho had average scores, compared to the other two classes, on all class indica-tors. The third class (31.8%) included individuals who were substantially moreactive and less sedentary than the rest of the sample, were somewhat leaner, andhad somewhat better physical health and functioning.
The most notable differences between classes 1 and 3 were found in sedentarybehavior, light physical activity, moderate-to-vigorous physical activity, mobil-ity, and perceived physical health. The results showed a large effect size(Cohen`s d ≥ 0.8; Cohen, 1988) in mobility between classes 1 and 3 and 1 and2. Given that older adults spend a great amount of time engaging in light physi-cal activity (e.g. walking; Ainsworth et al., 2000; Westerterp, 2008), this sug-gests that walking might be particularly important in terms of supporting themental health of older adults in assisted living facilities. It is also worth notingthat sedentary behavior and light physical activity were highly correlated, andthat the associations between sedentary behavior and light physical activity withmental health and functional measures were the reverse of each other. This sug-gests that the message for residents of assisted living facilities would be to spendless time in sedentary behavior and more time in light physical activity. Indeed,the importance of replacing sedentary behavior with this “nonexercise” activity
TABLE 4Latent Profile Characteristics in the Three-class Model (Unstandardised Scores)
Class 1:(n � 23;27.1%)
Class 2:(n � 35;41.2%)
Class 3:(n � 27;31.8%)
M SD M SD M SD d2-1 d3-1 d3-2
SB (%) 81. 50 9.61 71.63 8.56 59.01 7.31 �1.04 �2.60 �1.57Light PA (%) 17.40 9.56 27.09 8.80 38.43 6.71 1.06 2.58 1.42MVPA (%) 0.09 0.08 1.29 1.02 2.56 1.64 1.50 2.05 0.96PCS-12 30.87 8.69 40.46 10.87 51.28 9.11 0.95 2.29 1.07FEV1 0.54 0.15 0.64 0.17 0.77 0.24 0.57 1.13 0.67Grip 16.11 10.01 22.01 14.01 25.20 11.14 0.47 0.86 0.25BMI 30.51 5.93 28.11 5.28 26.24 3.40 �0.43 �0.90 �0.41Mobility 23.14 8.05 10.51 3.01 9.52 2.98 �2.27 �2.31 �0.33
Note: SB = Sedentary behavior, Light PA = Light physical activity, MVPA = Moderate-to-vigorous physicalactivity, PCS-12 = Physical health from SF-12, FEV1 = Forced expiratory volume in 1 second, Grip = Gripstrength, BMI = Body mass index, d = Cohen’s d effect size statistic. Class 1: Low physical function and PA witha highly sedentary lifestyle, Class 2: Moderate physical function and PA with a moderate sedentary lifestyle, Class3: High physical function and PA with an active lifestyle.
72 PARK ET AL.
© 2017 The International Association of Applied Psychology

TABLE5
Desc
riptionoftheThreeLatentClass
esandv2
Test
forDifference
sbetw
eentheClass
esin
MentalHealth
MCS-12
Vita
lity
Anxiety
Depression
Fatigue
Qua
lityof
life
MSD
MSD
MSD
MSD
MSD
MSD
Class
149
.50
11.89
3.32
1.27
6.28
3.56
5.95
2.70
61.22
14.97
26.79
6.47
Class
254
.42
8.40
4.36
1.47
5.20
3.72
3.93
2.75
50.68
14.75
20.92
5.59
Class
355
.47
7.25
4.81
1.12
3.11
2.63
2.20
1.76
35.94
11.81
18.66
4.90
Class
comparisons
v2
pv2
Pv2
pv2
pv2
pv2
pOveralltest
4.50
.108
19.40
.000
14.15
.001
34.08
.000
46.03
.000
24.58
.000
1vs.2
2.91
.088
8.07
.004
1.20
.273
7.49
.006
6.83
.009
12.48
.000
1vs.3
4.40
.036
19.07
.000
12.39
.000
32.61
.000
42.91
.000
24.42
.000
2vs.3
0.26
.610
1.71
.191
6.26
.012
8.45
.004
17.94
.000
2.69
.101
Cohen’s
deffect
size
d 2-1
0.50
0.80
�0.30
�0.74
�0.71
�1.00
d 3-1
0.62
1.24
�1.02
�1.67
�1.89
�1.43
d 3-2
0.59
0.33
�0.63
�0.73
�1.09
�1.39
Note:
Vitality=MCS-12
=Mentalhealth
from
SF-12,
QoL
=Qualityof
lifefrom
theCOOPDartm
outh
chart,Vitality=Su
bjectiv
evitality.
Class
1:Low
physical
functio
nand
physicalactiv
itywith
ahighly
sedentarylifestyle(n
=23)27.1%,C
lass
2:Moderatephysicalfunctio
nandphysicalactiv
itywith
amoderatesedentarylifestyle(n
=35)41.2%,C
lass
3:Highphysicalfunctio
nandphysicalactiv
itywith
anactiv
elifestyle(n
=27)31.8%.
LIFESTYLE ACTIVITY, PHYSICAL AND MENTAL HEALTH 73
© 2017 The International Association of Applied Psychology

(light physical activity) has recently been reported to have a significant effect onmortality risk (Matthews et al., 2015).
However, the classes not only differentiate between health behaviors, there arealso notable differences in physical function, with lung function, grip strength,and mobility being substantially poorer in class 1 compared to class 3. From aclinical perspective, this suggests that those with poorer physical function couldalso be at higher risk of suffering from poorer mental health. Of particular inter-est is perceived physical health, given that poorer perceived physical health is astrong predictor of all-cause mortality (Phillips, Der, & Carroll, 2010).
The results of the present study also indicated differences between class 1 andclass 3 in several mental health indicators. These results are in line with previousstudies showing that lower anxiety and depression symptoms (Azevedo Da Silvaet al., 2012; Song et al., 2011), lower fatigue (Vallance, Boyle, Courneya, &Lynch, 2014), and higher walking speed (N�ı Mhaol�ain et al., 2012) were relatedto higher levels of physical activity.
These results further show that those with greater physical function and amore active and less sedentary lifestyle had better mental health compared tothose with poorer functional ability and low PA and highly sedentary lifestyle.This finding emphasises that interventions aimed at improving physical functionand encouraging an active lifestyle are likely to have an important impact onmental health. Despite the effect sizes being somewhat smaller, it is also worthnoting the differences in mental health between class 1 and class 2. This showsthat even those with moderate physical function and physical activity with amoderately sedentary lifestyle have better mental health compared to those withlow physical function and physical activity and a highly sedentary lifestyle. Thisimplies that a small change in lifestyle and physical function could lead toimprovements in mental health. This is in line with physical activity guidelineswhich state that even if older adults cannot achieve the recommended level ofphysical activity, some physical activity engagement is better than no physicalactivity engagement (Warburton & Bredin, 2016).
The present study incorporated a range of profiles based on movement-relatedbehaviors and functional abilities and examined differences amongst these pro-files in mental health outcomes. Importantly, our findings extend previous find-ings by taking a person-centered approach and examining how physical activity,sedentary behavior, physical function, and health combine into distinct profiles,instead of examining them as independent predictors of mental health. For exam-ple, inspecting the effect sizes of the differences between all three classes(Table 4) shows consistently high effect sizes in terms of levels of physicalactivity, sedentary behavior, and physical health. Differences in functional abilityand BMI are also important but smaller in size, depending on which classes arecompared. Identifying classes of individuals is important for reaching better con-clusions. For example, comparing individuals on the basis of their physical func-tioning scores, without taking into consideration how active these individuals
© 2017 The International Association of Applied Psychology
74 PARK ET AL.

are, is likely to give a false indication of how their functional ability relates totheir mental health.
This study is not without limitations. The cross-sectional study design does notallow for the assessment of temporal patterns or causal relations between the vari-ables in the profiles and the mental health variables. Further, the stability of theclass membership over time could not be tested. No information was availableregarding the medication taken by the participants; therefore, future studies couldexplore the impact of medication on the outcome measures and class profiles.Another limitation is the small sample size. In the current study we used manyand high-quality indicators (e.g. objectively assessed physical activity, sedentarybehavior, and physical function), two factors that can compensate for small sam-ple sizes, for example, by decreasing mean class proportion bias (Wurpts & Gei-ser, 2014). Small sample sizes in latent profile analysis with a moderate numberof classes can explain more variance compared to many classes derived fromlarge sample sizes (Marsh et al., 2009). However, future research with large sam-ple sizes should further examine the profiles and the associations found in thepresent study. Participants were recruited from different assisted living facilities.As the number of participants from each assisted living facility ranged from 1 to33 residents, it is not possible to conduct any meaningful comparisons betweenthe residents from the different assisted living facilities. Similarly, the majority ofthe participants did not use a walking aid, and therefore, it was not possible toexplore the influence of the use of walking aids on our results. In addition, nodata were collected considering the person-centered care activities in eachassisted living facility, which could have an impact on some of the outcome mea-sures. Therefore, future research is warranted to explore the impact of these kindsof activities on the associations reported in the current study.
Notwithstanding these limitations, the study makes several unique contribu-tions to the literature. Strengths of this study include objective assessments ofphysical function, physical activity, and sedentary behavior in assisted livingfacility residents. This is particularly relevant given the known underestimationof sedentary behavior and overestimation of physical activity when using self-reported measures (Tudor-Locke & Myers, 2001). Another strength is the inclu-sion of multiple mental health indices, both negative (e.g. depression) and posi-tive (e.g. vitality). The majority of the studies which assessed the associationsbetween physical activity, sedentary behavior, and functional ability have limitedtheir assessment to only a few measures of mental health (Biswas et al., 2015;Chodzko-Zajko et al., 2009; Turvey, Schultz, Beglinger, & Klein, 2009). Theperson-focused approach we used provides an alternative view to the traditionalvariable-centered approach utilised in the literature that examines activity-relatedcorrelates of mental health in older adults. Lastly, our research investigates olderadults in assisted living facilities, an under-researched group of older adults.
Findings from our study could be utilised to help these individuals remainmobile and mentally healthy, and avoid or put off the move to full care facilities.
LIFESTYLE ACTIVITY, PHYSICAL AND MENTAL HEALTH 75
© 2017 The International Association of Applied Psychology

Our findings can be useful for health promotion research and practice in terms ofdeveloping more targeted/profile-based interventions that take into account varia-tions in scores across a range of movement and functional abilities. Furtherresearch should develop targeted interventions (focusing on improving physicalfunctioning or levels of physical activity or both) based on individuals’ profilesto examine changes in means and proportions of each class, and whether suchchanges predict changes in mental health outcomes.
CONFLICT OF INTEREST
There are no conflicts of interest.
FUNDING
This work was supported by National Institute for International Education ofSouth Korea (2011-43).
REFERENCES
Ainsworth, B., Haskell, W., Whitt, M., Irwin, M., Swartz, A., Strath, S., et al. (2000).Compendium of physical activities: An update of activity codes and MET intensities.Medicine and Science in Sports and Exercise, 32(9), S498–S504.
Asparouhov, T., & Muth�en, B. (2014). Auxiliary variables in mixture modeling: Usingthe BCH method in Mplus to estimate a distal outcome model and an arbitrary secondmodel. Paper can be downloaded from Mplus Web Notes No. 21 (Vol. Mplus Web).
Aud, M., & Rantz, M. (2005). Admissions to skilled nursing facilities from assisted livingfacilities. Journal of Nursing Care Quality, 20(1), 16–25.
Azevedo Da Silva, M., Singh-Manoux, A., Brunner, E.J., Kaffashian, S., Shipley, M.J.,Kivim€aki, M., et al. (2012). Bidirectional association between physical activity andsymptoms of anxiety and depression: The Whitehall II study. European Journal ofEpidemiology, 27(7), 537–546. http://doi.org/10.1007/s10654-012-9692-8
Berlin, K.S., Williams, N.A., & Parra, G.R. (2014). An introduction to latent variablemixture modeling (part 1): Overview and cross-sectional latent class and latent profileanalyses. Journal of Pediatric Psychology, 39(2), 174–187. http://doi.org/10.1093/jpepsy/jst084
Biswas, A., Oh, P.I., Faulkner, G.E., Bajaj, R.R., Silver, M.A., Mitchell, M.S., et al.(2015). Sedentary time and its association with risk for disease incidence, mortality,and hospitalization in adults: A systematic review and meta-analysis. Annals ofInternal Medicine, 162(2), 123–132.
Booth, J.N., Leary, S.D., Joinson, C., Ness, A.R., Tomporowski, P.D., Boyle, J.M., et al.(2014). Associations between objectively measured physical activity and academicattainment in adolescents from a UK cohort. British Journal of Sports Medicine, 48(3), 265–270. http://doi.org/10.1136/bjsports-2013-092334
Buman, M.P., Hekler, E.B., Haskell, W.L., Pruitt, L., Conway, T.L., Cain, K.L., et al.(2010). Objective light-intensity physical activity associations with rated health in
76 PARK ET AL.
© 2017 The International Association of Applied Psychology
older adults. American Journal of Epidemiology, 172(10), 1155–1165. http://doi.org/10.1093/aje/kwq249
Carder, P.C. (2002). The social world of assisted living. Journal of Aging Studies, 16(1),1–18. http://doi.org/10.1016/S0890-4065(01)00031-7
Chodzko-Zajko, W., Proctor, D., Singh, M., Minson, C., Nigg, C., Salem, G., et al.(2009). Exercise and physical activity for older adults. Medicine and Science inSports and Exercise, 41(7), 1501–1530. http://doi.org/10.1249/MSS.0b013e3181a0c95c
Choi, L., Ward, S.C., Schnelle, J.F., & Buchowski, M.S. (2012). Assessment of wear/non-wear time classification algorithms for triaxial accelerometer. Medicine and Science inSports and Exercise, 44(10), 2009–2016. http://doi.org/https://doi.org/10.1249/mss.0b013e318258cb36
Cohen, J. (1988). Statistical power analysis for the behavioral sciences. Hillsdale, NJ:Erlbaum.
Enders, C. (2001). A primer on maximum likelihood algorithms available for use withmissing data. Structural Equation Modeling, 8(1), 128–141. http://doi.org/https://doi.org/10.1207/s15328007sem0801_7
Gardner, R.M., & Hankinson, J.L. (1988). Standardization of spirometry—1987 ATSupdate (American Thoracic Society). Journal of Occupational Medicine: OfficialPublication of the Industrial Medical Association, 30(3), 272–273.
Gerber, M., & Jonsdottir, I. (2014). Physical activity in employees with differing occupa-tional stress and mental health profiles: A latent profile analysis. Psychology of Sportand Exercise, 15(6), 649–658. http://doi.org/10.1016/j.psychsport.2014.07.012
Giuliani, C.A., Gruber-Baldini, A.L., Park, N.S., Schrodt, L.A., Rokoske, F., Sloane,P.D., et al. (2008). Physical performance characteristics of assisted living residents andrisk for adverse health outcomes. Gerontologist, 48(2), 203–212.
Hamer, M., & Stamatakis, E. (2014). Prospective study of sedentary behavior, risk ofdepression, and cognitive impairment. Medicine and Science in Sports and Exercise,46(4), 718–723. http://doi.org/10.1249/mss.0000000000000156
Hawes, C., Rose, M., & Phillips, C. (1999). A national study of assisted living for the frailelderly: Results of a national survey of facilities. US Department of Health and HumanServices. Retrieved from http://aspe.hhs.gov/basic-report/national-study-assisted-living-frail-elderly-results-national-survey-facilities
Jenkinson, C., Mayou, R., Day, A., Garratt, A., & Juszczak, E. (2002). Evaluation of theDartmouth COOP charts in a large-scale community survey in the United Kingdom.Journal of Public Health Medicine, 24(2), 106–111. http://doi.org/https://doi.org/10.1093/pubmed/24.2.106
Kang, S.-Y., Basham, R., & Kim, Y.J. (2013). Contributing factors of depressive symp-toms among elderly Korean immigrants in Texas. Journal of Gerontological SocialWork, 56(1), 67–82. http://doi.org/10.1080/01634372.2012.734369
Lee, J., Chang, R.W., Ehrlich-Jones, L., Kwoh, C.K., Nevitt, M., Semanik, P.A., et al.(2015). Sedentary behavior and physical function: Objective evidence from theOsteoarthritis Initiative. Arthritis Care & Research, 67(3), 366–373. http://doi.org/10.1002/acr.22432
Lucas, M., Mekary, R., Pan, A., Mirzaei, F., O’Reilly, E.J., Willett, W.C., et al. (2011).Relation between clinical depression risk and physical activity and time spent
LIFESTYLE ACTIVITY, PHYSICAL AND MENTAL HEALTH 77
© 2017 The International Association of Applied Psychology

watching television in older women: A 10-year prospective follow-up study. AmericanJournal of Epidemiology, 174(9), 1017–1027. http://doi.org/10.1093/aje/kwr218
Marsh, H., L€udtke, O., Trautwein, U., & Morin, A.J. (2009). Classical latent profile analy-sis of academic self-concept dimensions: Synergy of person- and variable-centeredapproaches to theoretical models of self-concept. Structural Equation Modeling, 16(2),191–225. http://doi.org/10.1080/10705510902751010
Matthews, C.E., Chen, K.Y., Freedson, P.S., Buchowski, M.S., Beech, B.M., Pate, R.R.,et al. (2008). Amount of time spent in sedentary behaviors in the United States, 2003–2004. American Journal of Epidemiology, 167(7), 875–881. http://doi.org/https://doi.org/10.1093/aje/kwm390
Matthews, C.E., Moore, S.C., Sampson, J., Blair, A., Xiao, Q., Keadle, S.K., et al.(2015). Mortality benefits for replacing sitting time with different physical activities.Medicine and Science in Sports and Exercise, 47(9), 1833–1840. http://doi.org/10.1249/MSS.0000000000000621
Miller, J. (2015). Cross-generation accuracy. Retrieved from http://actigraphcorp.com/wp-content/uploads/2015/04/cross-generation-accuracy.pdf
Miller, M., Pedersen, O., & Dirksen, A. (2007). A new staging strategy for chronicobstructive pulmonary disease. International Journal of Chronic ObstructivePulmonary Disease, 2(4), 657–663.
Moran, F., MacMillan, F., Smith-Merry, J., Kilbreath, S., & Merom, D. (2015). Perceivedbarriers, facilitators and patterns of physical activity of olderold adults living in assistedretirement accommodation: A qualitative and quantitative pilot research. Journal ofGerontology and Geriatric Research, 4, 255. http://doi.org/10.4172/2167-7182.1000255
Muth�en, B., & Muth�en, L.K. (2000). Integrating person-centered and variable-centeredanalyses: Growth mixture modeling with latent trajectory classes. Alcoholism: Clinicaland Experimental Research, 24(6), 882–891. http://doi.org/10.1111/j.1530-0277.2000.tb02070.x
Muth�en, L., & Muth�en, B. (2015). Mplus user’s guide, 7th edn. Los Angeles, CA:Muth�en & Muth�en.
N�ı Mhaol�ain, A.M., Fan, C.W., Romero-Ortuno, R., Cogan, L., Cunningham, C., Kenny,R.-A., et al. (2012). Frailty, depression, and anxiety in later life. InternationalPsychogeriatrics, 24(8), 1265–1274. http://doi.org/10.1017/S1041610211002110
Phillips, A.C., Der, G., & Carroll, D. (2010). Self-reported health, self-reported fitness, andall-cause mortality: Prospective cohort study. British Journal of Health Psychology, 15(Pt.2), 337–346. Retrieved from http://www.ncbi.nlm.nih.gov/pubmed/19619405
Podsiadlo, D., & Richardson, S. (1991). The timed “Up & Go”: A test of basic functionalmobility for frail elderly persons. Journal of the American Geriatrics Society, 39(2),142–148. http://doi.org/https://doi.org/10.1111/j.1532-5415.1991.tb01616.x
Rosenberg, D.E., Bellettiere, J., Gardiner, P.A., Villarreal, V.N., Crist, K., & Kerr, J.(2016). Independent associations between sedentary behaviors and mental, cognitive,physical, and functional health among older adults in retirement communities.Journals of Gerontology. Series A, Biological Sciences and Medical Sciences, 71(1),78–83. http://doi.org/10.1093/gerona/glv103
Ryan, R.M., & Frederick, C. (1997). On energy, personality, and health: Subjective vital-ity as a dynamic reflection of well-being. Journal of Personality, 65(3), 529–565.http://doi.org/https://doi.org/10.1111/j.1467-6494.1997.tb00326.x
78 PARK ET AL.
© 2017 The International Association of Applied Psychology

Shinkai, S., Kumagai, S., Fujiwara, Y., Amano, H., Yoshida, Y., Watanabe, S., et al.(2003). Predictors for the onset of functional decline among initially non-disabledolder people living in a community during a 6-year follow-up. Geriatrics andGerontology International, 3(S1), S31–S39. http://doi.org/https://doi.org/10.1111/j.1444-0594.2003.00094.x
Smets, E.M.A., Garssen, B., Bonke, B., De, M., & Haes, J.C.J. (1995). The multidimen-sional Fatigue Inventory (MFI) psychometric qualities of an instrument to assess fati-gue. Journal of Psychosomatic Research, 39(3), 315–325. http://doi.org/https://doi.org/10.1016/0022-3999(94)00125-o
Soley-Bori, M., Soria-Saucedo, R., Ryan, C.M., Schneider, J.C., Haynes, A.B., Gerrard,P., et al. (2015). Functional status and hospital readmissions using the Medical Expen-diture Panel Survey. Journal of General Internal Medicine, 30(7), 965–972. http://doi.org/10.1007/s11606-014-3170-9
Song, M.R., Lee, Y.-S., Baek, J.-D., & Miller, M. (2011). Physical activity status in adultswith depression in the National Health and Nutrition Examination Survey, 2005–2006.Public Health Nursing, 29(3), 208–217. http://doi.org/10.1111/j.1525-1446.2011.00986.x
Troiano, R.P., Berrigan, D., Dodd, K.W., Masse, L.C., Tilert, T., & McDowell, M.(2008). Physical activity in the United States measured by accelerometer. Medicineand Science in Sports and Exercise, 40(1), 181–188. http://doi.org/10.1249/mss.0b013e31815a51b3
Tudor-Locke, C., & Myers, A. (2001). Challenges and opportunities for measuring physi-cal activity in sedentary adults. Sports Medicine, 31(2), 91–100. http://doi.org/10.2165/00007256-200131020-00002
Turvey, C.L., Schultz, S.K., Beglinger, L., & Klein, D.M. (2009). A longitudinal commu-nity-based study of chronic illness, cognitive and physical function, and depression.American Journal of Geriatric Psychiatry: Official Journal of the AmericanAssociation for Geriatric Psychiatry, 17(8), 632–641. http://doi.org/10.1097/JGP.0b013e31819c498c
Vallance, J.K., Boyle, T., Courneya, K.S., & Lynch, B.M. (2014). Associations of objec-tively assessed physical activity and sedentary time with health-related quality of lifeamong colon cancer survivors. Cancer, 120(18), 2919–2926. http://doi.org/10.1002/cncr.28779
Vallance, J.K., Winkler, E.A.H., Gardiner, P.A., Healy, G.N., Lynch, B.M., & Owen, N.(2011). Associations of objectively-assessed physical activity and sedentary time withdepression: NHANES (2005–2006). Preventive Medicine, 53(4–5), 284–288. http://doi.org/10.1016/j.ypmed.2011.07.013
Warburton, D.E.R., & Bredin, S.S.D. (2016). Reflections on physical activity and health:What should we recommend? Canadian Journal of Cardiology, 32(4), 495–504.
Ware, J., Kosinski, M., & Keller, S. (1996). A 12-Item Short-Form Health Survey: Con-struction of scales and preliminary tests of reliability and validity. Medical Care, 34(3), 220–233. http://doi.org/10.1097/00005650-199603000-00003
Ware, J., Kosinski, M., & Keller, S. (1998). How to score the SF-12 physical and mentalhealth summary scales (2nd edn.). Lincoln, RI: QualityMetric.
Watson, L., Garrett, J., Sloane, P., Gruber-Baldini, A., & Zimmerman, S. (2003). Depres-sion in assisted living: Results from a four-state study. American Journal of GeriatricPsychiatry, 11(5), 534–542.
LIFESTYLE ACTIVITY, PHYSICAL AND MENTAL HEALTH 79
© 2017 The International Association of Applied Psychology

Westerterp, K.R. (2008). Physical activity as determinant of daily energy expenditure.Physiology & Behavior, 93(4–5), 1039–1043. http://doi.org/10.1016/j.physbeh.2008.01.021
World Health Organization (2016). WHO | Mental health and older adults. Retrieved 16June 2016, from http://www.who.int/mediacentre/factsheets/fs381/en/
Wurpts, I.C., & Geiser, C. (2014). Is adding more indicators to a latent class analysis ben-eficial or detrimental? Results of a Monte-Carlo study. Frontiers in Psychology, 5,920. http://doi.org/10.3389/fpsyg.2014.00920
Wyrick, S., Parker, D., Grabowski, D., Feuling, H.M., & Ng, A.V. (2008). Relationshipsamong walking aids, physical activity, depression, fatigue, and perceived health inassisted-living residents: A pilot study. Journal of Applied Gerontology, 27(4), 511–522. http://doi.org/10.1177/0733464808315288
Zigmond, A.S., & Snaith, R.P. (1983). The hospital anxiety and depression scale. ActaPsychiatrica Scandinavica, 67(6), 361–370. http://doi.org/https://doi.org/10.1111/j.1600-0447.1983.tb09716.x
80 PARK ET AL.
© 2017 The International Association of Applied Psychology
View publication statsView publication stats