Brussels Economic Review - VUB
186
Brussels Economic Review Cahiers Economiques de Bruxelles Special Issue Special Issue on Skilled Migration Edited by : Michel BEINE and Frédéric DOCQUIER Vol. 47 - n°1 Spring 2004 Editions du DULBEA asbl Département d’Economie Appliquée de l’Université Libre de Bruxelles
Transcript of Brussels Economic Review - VUB

Brussels Economic ReviewCahiers Economiques de Bruxelles
Special Issue
Special Issue on Skilled Migration
Edited by : Michel BEINE and Frédéric DOCQUIER
Vol. 47 - n°1Spring 2004
Editions du DULBEA asbl
Département d’Economie Appliquée de l’Université Libre de Bruxelles

2
Sommaire - Content
Which attitude should we adopt towards international
skilled migration? 5
Michel Beine and Frédéric Docquier
The economic impact of immigration for the host countries 9
Xavier Chojnicki
The brain drain: A review of theory and facts 29
Simon Commander, Mari Kangasniemi and L. Alan Winters
Selective immigration policy in Australia, Canada,
and the United States 45
Heather Antecol, Deborah A. Cobb-Clark and Stephen J. Trejo
The demand for high-skilled workers and immigration policy 57
Thomas K. Bauer and Astrid Kunze
The impact of temporary migration on human capital
accumulation and economic development 77
Manon Domingues Dos Santos and Fabien Postel-Vinay
Who is afraid of the brain drain? Human capital flight
and growth in developing countries 89
Hillel Rapoport
BRUSSELS ECONOMIC REVIEW - CAHIERS ECONOMIQUES DE BRUXELLESVOL. 47 - N°1 SPRING 2004
Brain drain and Remittances: Implications for the source country 103
Dilek Cinar and Frédéric Docquier
Temporary migration and self-employment: Evidence from Tunisia 119
Alice Mesnard
Immigration and aging in the Belgian regions 139
Marc Debuisson, Frédéric Docquier, Abdul Noury and Madeleine Nantcho
Brain drain, brain gain and brain exchange: The role of MNEs
in a small open economy 159
Michele Cincera
3


WHICH ATTITUDE SHOULD WE ADOPT TOWARDS
INTERNATIONAL SKILLED MIGRATION?
BY MICHEL BEINE
(CADRE UNIVERSITY OF LILLE 2 AND DULBEA,FREE UNIVERSITY OF BRUSSELS)
AND FREDERIC DOCQUIER
(CADRE UNIVERSITY OF LILLE 2, IWEPSREGIONAL GOVERNMENT OF WALLONIA AND IZA-BONN)
1. MOTIVATIONS
The international migration of skilled workers (the so-called brain drain) has attracteda considerable attention in the recent years. The reason is that, despite empirical con-troversies, there is a strong consensus that deficiency in human capital is a major causeof inequality between countries. Given recent developments of immigration policiesconducted in receiving countries and the booming demand for highly skilled workers,available evidence supports the view that the migration of the educated has intensifiedover the 1990s. Ranking point systems in Australia and Canada lead to a strong selec-tion of the potential immigrants. The increasing number of H1-B visas in the USA turnsout to raise the proportion of economic migrants. Publications of labor shortage occu-pation lists (UK, Ireland) and adaptations of recruitment policies towards high-potentialworkers (Germany, France, Norway, Korea) have obviously altered the composition ofinternational migration flows. By the next decades, the size of brain drain is unlikely tofall given the expansion of the high technology sector and the dark demographicprospects faced by most industrialized nations.
Today, industrial countries such as Canada, the UK or Germany are worrying about themagnitude of the emigration flows of skills. However, it is mainly for less developed coun-tries that the detrimental consequences of brain drain have been stressed in the literature.Can brain drain be considered as a major cause of low development? Which are the coun-tries affected? What are the policy responses, both from an internationalist and a nation-alist point of view. There is no clear and straightforward answer to these questions.
By reducing the number of educated remaining in the country, brain drain unambigu-ously generates a short-run loss for sending countries. The earlier literature on braindrain essentially focused on this ex-post effect and investigated all its consequences for
BRUSSELS ECONOMIC REVIEW - CAHIERS ECONOMIQUES DE BRUXELLESVOL. 47 - N°1 SPRING 2004
5
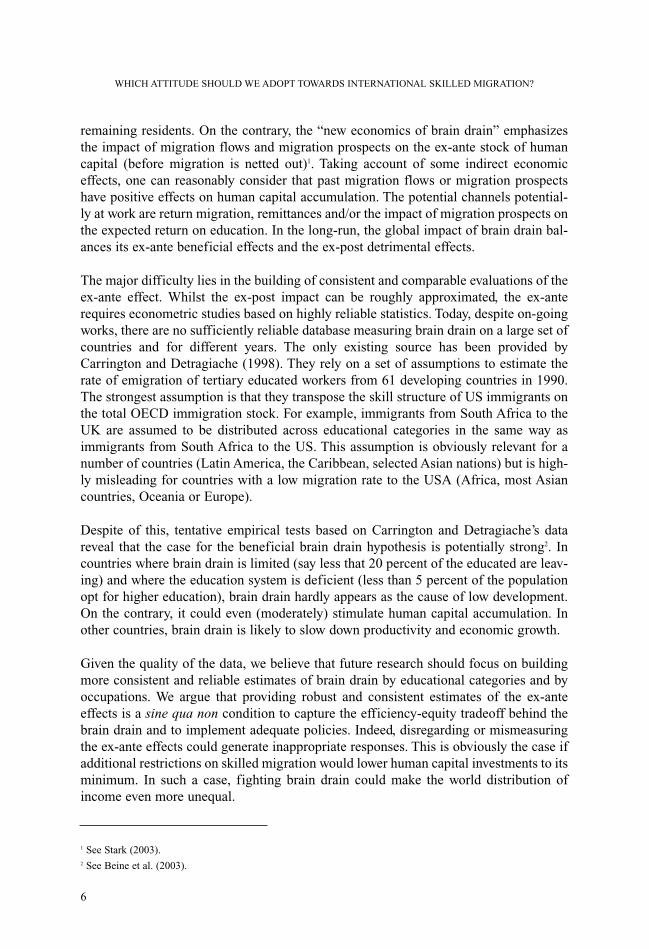
remaining residents. On the contrary, the “new economics of brain drain” emphasizesthe impact of migration flows and migration prospects on the ex-ante stock of humancapital (before migration is netted out)1. Taking account of some indirect economiceffects, one can reasonably consider that past migration flows or migration prospectshave positive effects on human capital accumulation. The potential channels potential-ly at work are return migration, remittances and/or the impact of migration prospects onthe expected return on education. In the long-run, the global impact of brain drain bal-ances its ex-ante beneficial effects and the ex-post detrimental effects.
The major difficulty lies in the building of consistent and comparable evaluations of theex-ante effect. Whilst the ex-post impact can be roughly approximated, the ex-anterequires econometric studies based on highly reliable statistics. Today, despite on-goingworks, there are no sufficiently reliable database measuring brain drain on a large set ofcountries and for different years. The only existing source has been provided byCarrington and Detragiache (1998). They rely on a set of assumptions to estimate therate of emigration of tertiary educated workers from 61 developing countries in 1990.The strongest assumption is that they transpose the skill structure of US immigrants onthe total OECD immigration stock. For example, immigrants from South Africa to theUK are assumed to be distributed across educational categories in the same way asimmigrants from South Africa to the US. This assumption is obviously relevant for anumber of countries (Latin America, the Caribbean, selected Asian nations) but is high-ly misleading for countries with a low migration rate to the USA (Africa, most Asiancountries, Oceania or Europe).
Despite of this, tentative empirical tests based on Carrington and Detragiache’s datareveal that the case for the beneficial brain drain hypothesis is potentially strong2. Incountries where brain drain is limited (say less that 20 percent of the educated are leav-ing) and where the education system is deficient (less than 5 percent of the populationopt for higher education), brain drain hardly appears as the cause of low development.On the contrary, it could even (moderately) stimulate human capital accumulation. Inother countries, brain drain is likely to slow down productivity and economic growth.
Given the quality of the data, we believe that future research should focus on buildingmore consistent and reliable estimates of brain drain by educational categories and byoccupations. We argue that providing robust and consistent estimates of the ex-anteeffects is a sine qua non condition to capture the efficiency-equity tradeoff behind thebrain drain and to implement adequate policies. Indeed, disregarding or mismeasuringthe ex-ante effects could generate inappropriate responses. This is obviously the case ifadditional restrictions on skilled migration would lower human capital investments to itsminimum. In such a case, fighting brain drain could make the world distribution ofincome even more unequal.
WHICH ATTITUDE SHOULD WE ADOPT TOWARDS INTERNATIONAL SKILLED MIGRATION?
1 See Stark (2003).2 See Beine et al. (2003).
6

2. STRUCTURE OF THE SPECIAL ISSUE
In this context, the purpose of this special issue is offer an up-to-date survey of themajor contributions regarding the international migration of skilled workers. Our panelof studies provides important insights on the recent policy decisions toward immigra-tion, on the composition of migration flows and on the economic consequences for bothsending and receiving countries.
The first two papers depict the literature on the economic consequences of skilledmigration. Xavier Chojnicki examines the impact on receiving countries, focusing onthe labor market and on public finance. He discusses the role of skilled migration in thedebate on aging and welfare reforms. Simon Commander, Mari Kangasmieni and AlanWinters present the consequences for sending countries. After reviewing earlier andrecent models, they summarize the conclusions of econometric studies based on UKindividual survey data for health workers and software specialists.
The next two contributions provide highly instructive information on the evolution andthe consequences of selective policies in industrialized countries. Heather Antecol,Deborah Cobb-Clark and Stephen Trejo compare selective immigration policies inAustralia, Canada and the USA over the 20th century. Then, they review the immigra-tion outcomes in regard of policy changes. Point tests systems implemented in Canadaand Australia have obviously altered the skill levels of immigrants. However, they con-clude that factors other than immigration policy are also important (social, historical orgeographic explanations). Thomas Bauer and Astrid Kunze describe the German policyinitiatives on temporary immigration of high-skilled workers. Using an internationalemployer survey, they argue that the temporary green cards system partly satisfies thedemand of firms for foreign specialists. They therefore point the need for a more com-prehensive policy involving permanent visas.
The third part of this issue is devoted to the presentation of original contributions tothe new literature of brain drain. Manon Dos Santos and Fabien Postel-Vinay build amodel in which temporary migration can be seen as a potential source of growth forthe emigrant’s country, since it allows migrants to acquire knowledge and skillsabroad. From the source country point of view, they derive the optimal mix of per-manent and temporary visas. Hillel Rapoport provides existing evidence on braindrain and presents the incentive mechanism. He argues that migration prospectsincrease the expected return to education in poor countries and foster domesticenrollment in education. When this “brain effect” dominates the observed emigration(or “drain”) effect, a brain drain with a brain gain is obtained. Dilek Cinar andFrédéric Docquier model the long-run impact of skilled migration when emigrantsremit a part of the income earned abroad. As remittances make liquidity constraintsless binding, a long-run gain can also be obtained. However, they argue that such abrain gain emerges under some restrictive conditions. Alice Mesnard empiricallydemonstrates, in the case of Tunisian workers, that temporary migration has con-tributed to the economic development of Tunisia via two main channels, remittances
MICHEL BEINE AND FREDERIC DOCQUIER
7

and return migration with repatriated savings. She convincingly shows that tempo-rary migration allows workers to overcome credit constraints for investments intosmall business projects.
The last two contributions deal with the Belgian particular case. The paper by MarcDebuisson, Frédéric Docquier, Abdul Noury and Madeleine Nantcho provides adescription of the structure of foreign population in Belgium. It analyses the assimila-tion of immigrants on the local labor markets and evaluates the regional need for migra-tion in the face of demographic changes. Finally, Michele Cincera illustrates the stronglinkages between human capital mobility and technology. Using worldwide patent sta-tistics, he measures the net foreign investment in the area of R&D and discusses theireffect on the demand for skilled workers in Belgium. The preliminary evidence suggeststhat R&D investments in Belgium might have reduced the importance of brain drain:They could furthermore generate a brain gain as new qualified personnel from theheadquarters of multinational firms are attracted in the country as well as brainexchange for the host country.
REFERENCES
Beine M., F. Docquier and H. Rapoport, 2003. “Brain drain and LDCs’ growth: win-ners and losers”, IZA discussion paper, n. 819.Carrington W.J. and E. Detragiache, 1998. “How big is the brain drain?”, IMF Staffpapers.Stark O., 2003. “Rethinking the brain drain”, World Development 32(1), 15-22.
WHICH ATTITUDE SHOULD WE ADOPT TOWARDS INTERNATIONAL SKILLED MIGRATION?
8
THE ECONOMIC IMPACT OF IMMIGRATION FOR THE HOST
COUNTRIES
XAVIER CHOJNICKI*(MEDEE, UNIVERSITY OF LILLE 1)
ABSTRACT:In this paper, we will investigate the economic consequences of immigration for the host countries.Recently, the debate has been centered on the role of immigration in the process of aging. A priori, theimmigration of workers is likely to affect the economic situation of the host country in multiple ways, bothpositive and negative. Most studies focused on the labor market reveal a weak net gain of immigrationwhose distribution depends on the skill structure of immigrants and domestic labor force. Empirical stud-ies show that past immigration had only a weak impact on native wages and unemployment rate. The neteffects on welfare benefits are not clear and are related to the composition of migrant flows. Studies ana-lyzing the relations between the labor force migrations and the dynamics of growth of the concerned areasput forward different mechanisms according to whether one uses exogenous or endogenous growth mod-els. However, whatever the theoretical framework considered, the immigrants’ skills will be the determi-nant variable.
JEL CLASSIFICATION: F22, J31, J61.
KEYWORDS: International Migration, Geographic Labor Mobility, Immigrant Workers.
BRUSSELS ECONOMIC REVIEW - CAHIERS ECONOMIQUES DE BRUXELLESVOL. 47 - N°1 SPRING 2004
* I am grateful to M. Beine, F. Docquier, H. Jayet, J. Hellier, L. Ragot and S. Jimerson for useful comments.
9

INTRODUCTION
For many reasons, international migrations have always been a subject of concern, bothfor the countries of origin and reception. Recently, the debate has been centered on therole of immigration in the process of aging (United Nations, 2000). Indeed, acting onimmigration rather than on the fertility rate in order to attenuate demographic trends hasthe advantage of having immediate effects. However, the extent of migratory flows toimplement largely depends on the demographic objectives. UN simulations reveal thata stabilization of the dependency ratio until 2050 imply migratory flows of an unrealis-tic size. Hence, Europe should annually accommodate 12,7 million immigrants, eitheron the whole 700 million from here to 2050 (for an initial population of 372 millioninhabitants) and the US 10,8 million, or nearly 600 million in 55 years.
Unrealistic as they may be, these projections lead us nonetheless to some interestingconclusions. On the one hand, it confirms that massive immigration cannot alone con-stitute a solution to aging in the long run. Indeed, as time goes by, the fertility behaviorof immigrants is aligned with that of the natives. On the other hand, as recently recalledby the European Commission, immigration can be used in order to alleviate sectorallabor shortages or to hire highly skilled foreign workforce. Therefore, this debate onreplacement migrations arrives at the same time as that of selective migrant policies.Several countries, such as the US, Australia or Canada, have already set up selectionprograms aiming at increasing the proportion of skilled foreign workers. These selec-tive policies allow these countries to face possible labor shortages in some sectors, suchas information technology1 and to create a flexible labor pool. In the context of skilledlabor shortages where recruitment difficulties can develop in just a few years as a resultof aging, many countries have to consider outlining a new migratory policy.
A priori, the immigration of workers is likely to affect the economic situation of the hostcountry in multiple ways, both positive and negative. Any serious evaluation must takeall the implemented mechanisms into account and evaluate their relative importance. Inthis article, our aim is to outline the economic effects of migratory flows from the hostcountry point of view. We will successively present the recent trends in internationalmigrations, the consequences of immigration on the labor market and on governmentbudgets, and finally the long-term economic implications.
1. TRENDS IN INTERNATIONAL MIGRATION
Despite difficulties in comparing international data, there are both a number of charac-teristics common to the majority of OECD countries and notable changes in the size andcomposition of migratory flows. Historically, the US have always been an immigrationcountry since they are the largest net recipients of immigrants (850 000 aliens entered
THE ECONOMIC IMPACT OF IMMIGRATION FOR THE HOST COUNTRIES
1 OECD (2002) estimated that roughly 850 000 technicians missed in the US and nearly 2 millions in Europe in 2001.
10

in 2000). Europe has experienced net flows of migration for four decades. This is par-ticularly the case of Germany (as well as France, Switzerland and the UK), whichreceives nearly four times more immigrants than the majority of other European coun-tries. In Japan, immigration has traditionally been negligible, even if the relaxation ofrestrictions aiming at temporary migrations allowed 346 000 arrivals in 2000.2 Since theearly 1980s, net migrations have constituted the main population growth factor for theEuropean Union taken as a whole as well as for the US.
Reflecting the increase in immigration over the last two decades, the stock of foreign-ers in OECD countries grew by over 13 million between 1988 and 1998, reachingapproximately 57 million people, i.e. 7 % of the total OECD population (OECD, 2001).On the whole, more than half of the migrants are accommodated by a limited group ofrich countries (Table 1). North America is in first place with more than 30 million immi-grants. Western Europe – The European Union and Switzerland - constitutes the secondof these poles. More than 20 million aliens are established there, of which two thirdscome from non EU countries. Finally, Australia accommodates 4,5 million immigrants.In Europe, the share of foreigners in the total population is relatively weaker (approxi-mately 5 % in 2000) in comparison with the much more important proportions in somecountries (reaching almost 20 % in Australia and Canada and 10 % in the US).
TABLE 1. FOREIGN OR FOREIGN BORN (a) POPULATION IN SELECTED OECD COUNTRIES
IN 2000
a) Data for the US, Canada and Australia refer to foreign-born population.
Source: Trends in International Migrations, OECD.
XAVIER CHOJNICKI
2 For more precisions, see the different editions of the OECD annual report, Trends in International Migrations.
11
GermanyAustraliaBelgiumCanadaFranceItalyJapanUKSwitzerlandUnited-States
Inflows of foreigners(Thousands)
673,992,368,6227,295,2271,5345,8288,887,4849,8
Stock of foreigners(Thousands)
7 2974 5178624 9713 2631 3881 6862 3421 38428 400
Share of thetotal popula-tion (%)
8,923,68,417,45,62,41,34,019,310,4
Foreign workers(Thousands)
3 4292 3653662 8391 5712461551 22071717 384
Share of theworking popu-lation (%)
8,824,58,419,26,11,10,24,218,312,4
The migration motivations of this foreign population have considerable importance inour debate. Even if they vary significantly from one country to another, family reunifi-cation prevails in the flows of entries of almost all OECD countries. In developed coun-tries, they generally represent nearly half of the new entries, even reaching 3/4 of thenew arrivals in the US and in France. Recently, the number of asylum seekers has alsoincreased, reaching relatively large proportions in some countries. Thus, the extrapola-tion of past trends would leave little room for a selective immigration policy.
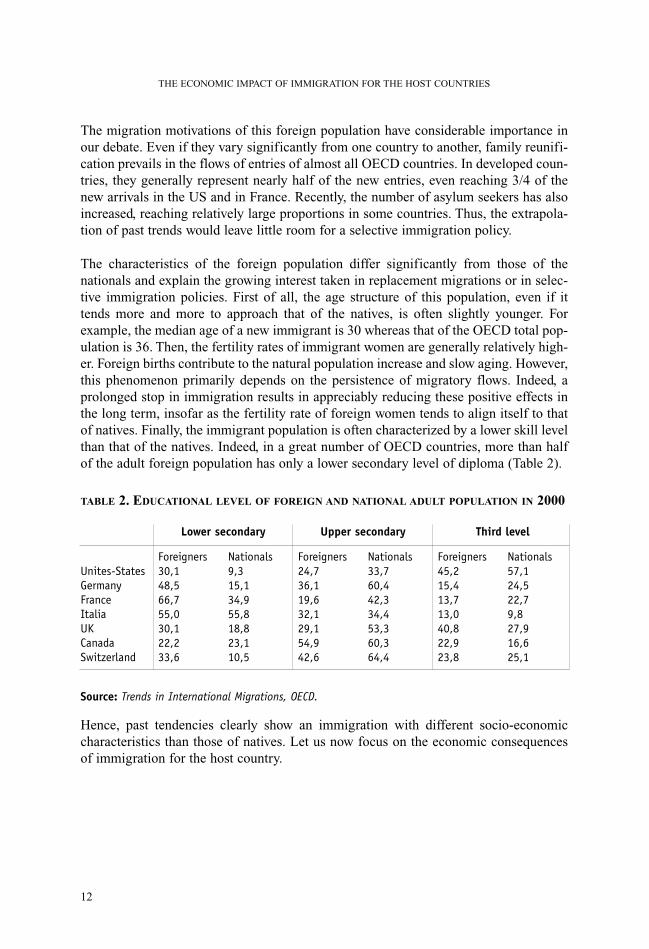
The characteristics of the foreign population differ significantly from those of thenationals and explain the growing interest taken in replacement migrations or in selec-tive immigration policies. First of all, the age structure of this population, even if ittends more and more to approach that of the natives, is often slightly younger. Forexample, the median age of a new immigrant is 30 whereas that of the OECD total pop-ulation is 36. Then, the fertility rates of immigrant women are generally relatively high-er. Foreign births contribute to the natural population increase and slow aging. However,this phenomenon primarily depends on the persistence of migratory flows. Indeed, aprolonged stop in immigration results in appreciably reducing these positive effects inthe long term, insofar as the fertility rate of foreign women tends to align itself to thatof natives. Finally, the immigrant population is often characterized by a lower skill levelthan that of the natives. Indeed, in a great number of OECD countries, more than halfof the adult foreign population has only a lower secondary level of diploma (Table 2).
TABLE 2. EDUCATIONAL LEVEL OF FOREIGN AND NATIONAL ADULT POPULATION IN 2000
Source: Trends in International Migrations, OECD.
Hence, past tendencies clearly show an immigration with different socio-economiccharacteristics than those of natives. Let us now focus on the economic consequencesof immigration for the host country.
THE ECONOMIC IMPACT OF IMMIGRATION FOR THE HOST COUNTRIES
12
Unites-StatesGermanyFranceItaliaUKCanadaSwitzerland
Foreigners30,148,566,755,030,122,233,6
Nationals9,315,134,955,818,823,110,5
Foreigners24,736,119,632,129,154,942,6
Nationals33,760,442,334,453,360,364,4
Foreigners45,215,413,713,040,822,923,8
Nationals57,124,522,79,827,916,625,1
Lower secondary Upper secondary Third level
2. IMMIGRATION AND LABOR MARKET
2.1. THEORETICAL DEVELOPMENTS
The theoretical analysis of the labor market does not lead to a clear answer to the impactof immigration on natives’ wages and unemployment. In standard models, the impact ofimmigration on the labor market is analyzed as a shock on a factor of production, i.e.labor supply or even low skilled labor supply. However, the effects are actually multi-ple: on total population, on final demand, on capital per worker, on employment andunemployment, and on income distribution.
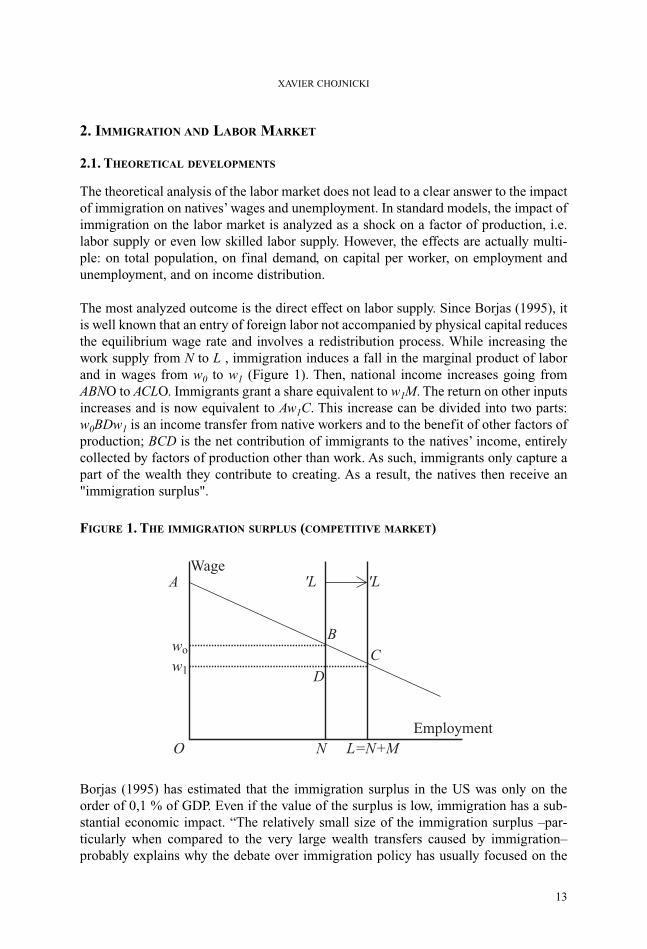
The most analyzed outcome is the direct effect on labor supply. Since Borjas (1995), itis well known that an entry of foreign labor not accompanied by physical capital reducesthe equilibrium wage rate and involves a redistribution process. While increasing thework supply from N to L , immigration induces a fall in the marginal product of laborand in wages from w0 to w1 (Figure 1). Then, national income increases going fromABNO to ACLO. Immigrants grant a share equivalent to w1M. The return on other inputsincreases and is now equivalent to Aw1C. This increase can be divided into two parts:w0BDw1 is an income transfer from native workers and to the benefit of other factors ofproduction; BCD is the net contribution of immigrants to the natives’ income, entirelycollected by factors of production other than work. As such, immigrants only capture apart of the wealth they contribute to creating. As a result, the natives then receive an"immigration surplus".
FIGURE 1. THE IMMIGRATION SURPLUS (COMPETITIVE MARKET)
Borjas (1995) has estimated that the immigration surplus in the US was only on theorder of 0,1 % of GDP. Even if the value of the surplus is low, immigration has a sub-stantial economic impact. “The relatively small size of the immigration surplus –par-ticularly when compared to the very large wealth transfers caused by immigration–probably explains why the debate over immigration policy has usually focused on the
XAVIER CHOJNICKI
13
potential harmful labor market impacts rather than on the overall increase of nativeincome. In other words, the debate stresses the distributional issues (the transfer ofwealth away from workers) rather than the efficiency gains (the positive immigrationsurplus).” (Borjas, 1995)
The consequences of a change in the labor supply structure are related to the degreeof complementarity or substitutability between immigrant labor and other categoriesof labor (and even other factors of production). Until now, we have considered that themigrant workers were perfectly substitutable with the domestic workers. However,many observations tend to show that this substitutability is imperfect and that migrantworkers with the same observable characteristics have lower wages than natives(Borjas, 1994). Hence, it is essential to consider the existence of several categories ofworkers, either by identifying the factors of production of which immigration modi-fies the total supply (Borjas, 1995) or by considering migrant workers as a specificfactor of production (Grossman, 1982; Greenwood and Hunt, 1995; Greenwood, Huntand Kohli, 1996). Such studies lead to the well-known result summarized byFriedberg and Hunt (1995): “In a closed economy model, immigrants will lower theprice of factors with which they are perfect substitutes, have an ambiguous effect onthe price of factors with which they are imperfect substitutes and raise the price offactors with which they are complements.”
Exclusively focused on labor markets, these studies disregard important channels whosepresence is likely to modify the results and their interpretation. A change of perspectiveis then necessary. According to Altonji and Card (1991), the use of a partial equilibri-um model can be erroneous. At the same time, migrations shift the labor supply and,through the demand for goods and services, the labor demand. As immigrants raise thescale of the economy, the marginal product of capital and labor increases. This addi-tional effect can enlarge the size of the immigration surplus in a substantial way. Thefinal consequences of a simultaneous increase in the labor supply and demand, inducedby a higher goods and services demand, strongly depend on the overall level of returnsin the economy. Beyond certain thresholds, it seems reasonable to consider that immi-gration increases the congestion and that the returns to scale are decreasing in the pres-ence of non-reproducible factors.
International mobility of goods and capital can modify the incidence of the immi-gration effects. Consequently, the analysis of the goods market channel must beundertaken at the same time as the relations between immigration and foreign trade(Borjas, Freeman and Katz, 1997). According to the Heckscher-Ohlin theorem, themobility of goods and factors induces a convergence of the factor price between thedifferent regions considered. Most of the argumentation rests on a possible substi-tutability between imports and domestic production, whose supply can be reinforcedby immigration. For some goods, the nationals can satisfy their demand by import-ing these goods from low-cost labor countries or they can "import" workers and pro-duce there.
THE ECONOMIC IMPACT OF IMMIGRATION FOR THE HOST COUNTRIES
14

If trade can be a substitute to factor mobility, particularly to the migration of workers,the mechanisms at work are complex and cannot be reduced to a one-to-one relation.Several theoretical contributions3 have established that while deviating, even marginal-ly, from the standard framework, free trade did not necessarily involve the equalizationof the factor prices. Trade and migration could then appear as complementary. Forexample, the existence of technological differences between countries (Markusen,1983) and of specific production factors (Jones, 1971) questions the idea of a substi-tutability between immigration and foreign trade, which is confirmed by the empiricalstudy of Collins, O' Rourke and Williamson (1997).
Furthermore, it seems inappropriate in the long term to assume the stability of nativesstock of production factors. Indeed, the change in the labor supply induced by the arrivalof immigrants is also the consequence of indirect effects through the reaction of theindigenous population. On the one hand, the fall of wages induced by immigration leadsnative workers to review the amount offered on the labor market derived from choicesbetween work and leisure. On the other hand, migrations can also influence the qualitativeaspects of the labor supply, particularly the skill choices. Indeed, the domestic populationcan react to the modification of relative wages through training, thereby decreasing themanpower of unskilled workers to increase the skilled worker supply (Chiswick, 1989).
Finally, taking into account natives’ migratory movements seems to be crucial. Nativemigration may attenuate the local impact of immigration. By migrating away from areasof relatively large immigrant concentration, or not migrating to such areas, natives avoidthe potentially adverse impacts that may be forthcoming through the production struc-ture channel. At the same time, these migratory movements may not be sufficient to pro-duce noticeably significant effects at the macro level. Thus, internal migrations coulddistort the estimation of the immigration consequences on the labor market.
2.2. EMPIRICAL STUDIES
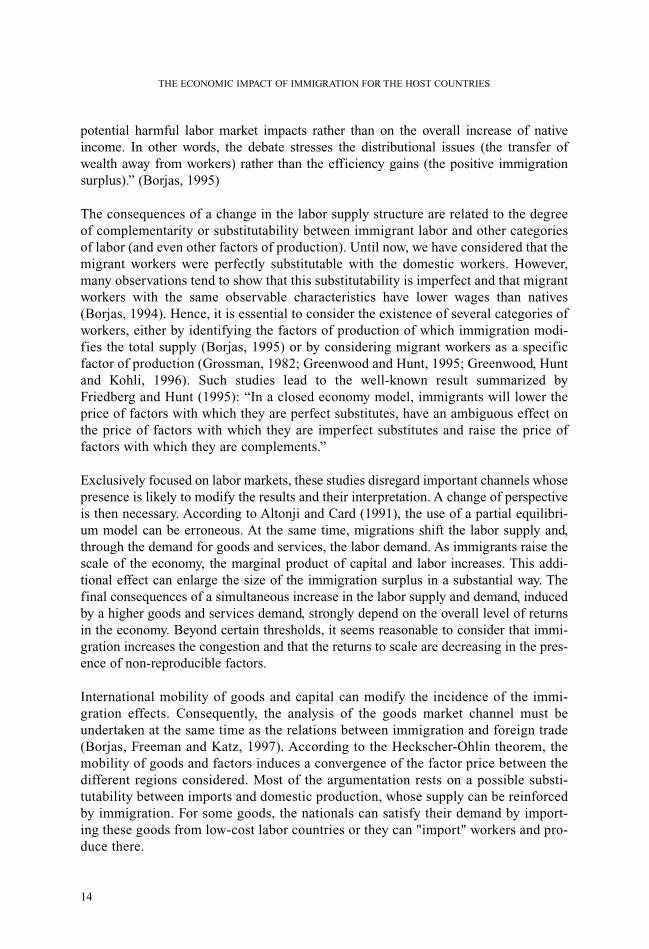
Although no clear relation between immigration and unemployment emerges (Figure 2),migratory flows remain perceived as tending to increase the unemployment rate ofnatives and decreasing their earnings. Measuring the effects of immigration on the labormarket gives rise to a vast literature. It is difficult to estimate the size and the nature ofthese effects since they depend on the volume of immigration, on the composition of thesuccessive waves and on the migrants’ assimilation. However, there is a consensus onthe effects of the immigrants’ arrival on the host labor market.
XAVIER CHOJNICKI
3 See Schiff (2000) for a detailed presentation of these works.
15
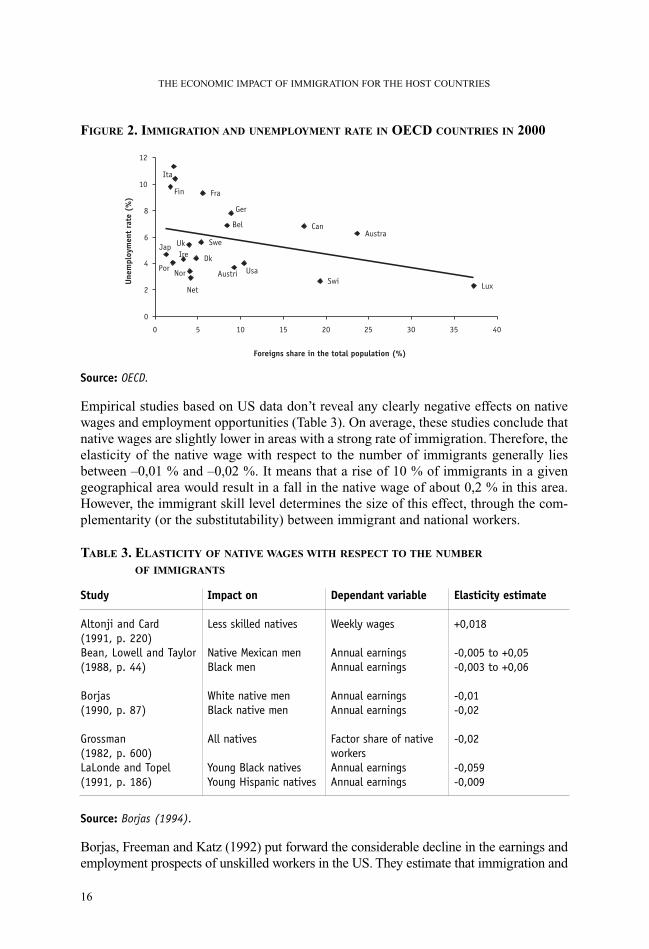
FIGURE 2. IMMIGRATION AND UNEMPLOYMENT RATE IN OECD COUNTRIES IN 2000
Source: OECD.
Empirical studies based on US data don’t reveal any clearly negative effects on nativewages and employment opportunities (Table 3). On average, these studies conclude thatnative wages are slightly lower in areas with a strong rate of immigration. Therefore, theelasticity of the native wage with respect to the number of immigrants generally liesbetween –0,01 % and –0,02 %. It means that a rise of 10 % of immigrants in a givengeographical area would result in a fall in the native wage of about 0,2 % in this area.However, the immigrant skill level determines the size of this effect, through the com-plementarity (or the substitutability) between immigrant and national workers.
TABLE 3. ELASTICITY OF NATIVE WAGES WITH RESPECT TO THE NUMBER
OF IMMIGRANTS
Source: Borjas (1994).
Borjas, Freeman and Katz (1992) put forward the considerable decline in the earnings andemployment prospects of unskilled workers in the US. They estimate that immigration and
THE ECONOMIC IMPACT OF IMMIGRATION FOR THE HOST COUNTRIES
16
Lux
AustraCan
SwiUsaAustri
Ita
Fin Fra
Ger
Bel
Nor
Net
Dk
SweIreUk
Por
Jap
0
2
4
6
8
10
12
0 5 10 15 20 25 30 35 40
Foreigns share in the total population (%)
Une
mpl
oym
ent
rate
(%
)
Study
Altonji and Card (1991, p. 220)Bean, Lowell and Taylor (1988, p. 44)
Borjas (1990, p. 87)
Grossman (1982, p. 600)LaLonde and Topel (1991, p. 186)
Impact on
Less skilled natives
Native Mexican menBlack men
White native menBlack native men
All natives
Young Black nativesYoung Hispanic natives
Dependant variable
Weekly wages
Annual earningsAnnual earnings
Annual earningsAnnual earnings
Factor share of nativeworkersAnnual earningsAnnual earnings
Elasticity estimate
+0,018
-0,005 to +0,05-0,003 to +0,06
-0,01-0,02
-0,02
-0,059-0,009

foreign trade accounted for 3 to 5 points of the 9 % fall in unskilled wages between 1980and 1988. According to them, the increase in the trade deficit in the 1980’s (representingan unskilled implicit supply) and the increase in immigration have raised the unskilledlabor supply by approximately 30 %. This shock on the work supply would explain 30 to50 % of the increase in inequalities in the US between 1980 and 1988. Similar results wereobtained in a more recent update (Borjas, Freeman and Katz, 1997) like in a similar studyundertaken by Jaeger (1996).
Borjas (1999) has advanced a more fundamental criticism on the empirical approach ofthese studies. Most attempts to estimate the impact of immigration on wage rates use aspatial correlation approach. However, when the mobility costs remain reasonable, theeconomic theory suggests that any factor generating interregional differences in welfareled to migrations from the weakest welfare areas towards the highest. Therefore, Filer(1992) and Card (1997) show that natives seem to leave the areas where immigrationsignificantly increases. This would spread out the immigration repercussions over theentire territory and would prevent the seizing of effects by an interregional comparison.Moreover, the reactions of the domestic population concentrate primarily on theunskilled, who are the closest substitutes for new immigrants.
Few studies focus on the impact of immigration on the native employment opportunities.Table 4 summarizes the representative results in the literature. The bulk of the work againrelates to the US labor market. Estimates such as those of Simon, Moore and Sullivan(1993) and Winegarden and Khor (1991) reveal a weak positive impact of immigration onthe US unemployment rate. Nevertheless, these results cannot be directly transposed to theEuropean case. Indeed, the labor markets in Europe are distinguished from the US marketfor three reasons: slower adjustment to economic differences, unemployment hysteresisand stronger imperfections. European studies of the immigration impact on labor marketare fewer but lead to the same conclusions as work on US data.
TABLE 4. ELASTICITY OF NATIVE EMPLOYMENT WITH RESPECT TO THE NUMBER
OF IMMIGRANTS
Source: Borjas (1994).
XAVIER CHOJNICKI
17
Study
Altonji and Card (1991, p. 220)Borjas (1990, p. 92)
Muller and Espenshade(1985, p. 100)
Simon, Moore and Sullivan(1993)
Winegarden and Khor(1991, p. 109)
Impact on
Less skilled natives
White native menBlack native men
Black natives
Natives
Young White nativesYoung Black natives
Dependant variable
Employment-population ratioWeeks workedLabor force participation rateLabor force participation rate
Unemployment rate
Unemployment rate
Unemployment rateUnemployment rate
Elasticity estimate
-0,038-0,062-0,01+0,04
-0,01
+0,001
+0,01-0,003
Although Winkelman and Zimmermann (1993) found that immigration contributedslightly to increasing unemployment in Germany in the 1970s, Muhleisen andZimmermann (1994) did not find any effect in the 1980s. In terms of wage effect, it isalso necessary to distinguish between skilled and unskilled domestic labor force. Forexample, DeNew and Zimmermann (1994) demonstrated that immigration appeared tohave depressed the wages of unskilled German workers but had an opposite effect onthose of the skilled workers. They suggested that a 1% increase in the number of immi-grants would result in a fall of 4,1 % of the average wages, a fall of 5,9 % of theunskilled wages and an increase in 3,5 % of the skilled one. Thus, the total effect seemsto be more significant than in the US case.
Over the period 1974-1994, Gross (1999) studies the impact of immigrant inflows onthe French labor market distinguishing between short and long-term consequences. Thisstudy proposes a negative relationship between long-term unemployment and immigra-tion, suggesting a compensation of the employment occupied by immigrants by theincreased demand they create. Alternatively, in the short term, an increase in the num-ber of immigrants temporarily raises unemployment. In addition, the estimates of Jayetand al. (2002) over the period 1990-1997 hardly reveal any negative effect on nativeemployment opportunities as well as on wage levels.
A comprehensive study of Gang and Rivera-Batiz (1994) on both the US and Europeanlabor markets aims to isolate the specific skill characteristics of the immigrant and thedomestic labor force. Amongst other results, they suggest that a 1 % increase in the laborforce related to Turkish immigration would reduce the average wages of a Dutch workerby 0,09 % whereas German workers would only experience a 0,01 % fall. A 1 % rise inAsian immigrants would reduce average UK wages by 0,08 % and French wages by 0,1% while North-African inflow would reduce French wages by 0,07 %. As recently point-ed out by Borjas (1999), the national origin mix of the immigrant flows is the main factoraccounting for the skill differences across the population of the source countries.
Other well-known studies analyzed the adjustments following "natural" migratoryshocks. Card (1990) observed the impact of the massive exodus of Cubans towardsMiami in the 1980s, Hunt (1992) the return to France of the "pieds-noirs" of Algeria andmore recently, Angrist and Krueger (2003), the migrations following the wars in Bosniaand Kosovo. Despite the importance of these migratory shocks, these studies showedtiny effects on labor markets since adjustments were partially facilitated by internalmigrations of natives and firms mobility.
The conclusions of these studies are convergent: the immigration impact on wages andemployment is minimal. It is suggested that the immigrants are usually complementaryrather than substitutable to the indigenous labor force. Therefore, the negative consequencesof immigration will initially be endured by unskilled indigenous workers, especially if thetwo groups tend to be concentrated in the same sector. These conclusions are all the morerobust as they are based on a large variety of data and methodological approaches.
THE ECONOMIC IMPACT OF IMMIGRATION FOR THE HOST COUNTRIES
18
3. IMMIGRATION AND GOVERNMENT BUDGETS
Another part of the debate focuses on the impact on government budgets. The compar-ison between the benefits drawn by immigrants from the public system (welfare expen-ditures, education, health, retirement) and the contribution they bring is not only impor-tant from the point of view of the public finance. It can also be a criterion for policymakers to encourage or, conversely, discourage immigration.
In the US, a vast literature attempts to explain the differences in behavior betweenimmigrants and natives in the use of social programs. Blau (1984) showed that immi-grant households had roughly the same probability as native households to receive pub-lic assistance in 1976. Nevertheless, with similar socio-economic characteristics, immi-grants received lower benefits than nationals. However, a recent study of Gustman andSteinmeier (2000) demonstrates that the likelihood for an immigrant to receive socialwelfare payments increased between the beginning of the 1970s and the late 1990s, inline with the declining skills of recent immigrants. Borjas (1994) finally displays theexistence of an adaptation period resulting in an increase in the welfare participationrate for a specific immigrant wave.
The most direct way to evaluate the consequences on net welfare benefits is to compareimmigrants’ taxes and transfers for a particular fiscal year. Most applied studies haveagain been carried out on US data. A first wave studied the effects at a local level (seeRothman and Espenshade (1992) and Vernez and McCarthy (1996) for a survey of thisliterature). Despite contrasting results according to the time-period, the geographicalarea and the method employed, these studies suggest that immigration represents a netload for the budgets of immigration states, whereas the balance is rather positive at thefederal level. However, these studies are not necessarily representative at the nationallevel because of the concentration of immigrants in some geographical areas.
In the early 1990s, the works of Huddle (1993), Passel (1994) and Borjas (1994) calcu-lated the overall net surplus for a particular year. Huddle claims that immigration rep-resents an annual net cost of $43 billion. Passel criticizes these conclusions, which over-estimate the real immigration costs, and ends at a fiscal surplus of roughly $30 billion.In view of these quite different conclusions, Borjas (1994) conducted his own estimatesin order to show the great sensitivity to the key parameters. Initially, he shows that thedifference between immigrants’ taxes and benefits represents a net surplus of $61,6 bil-lion. However, all taxes are only compared with means-tested entitlement programs,which largely distorts the calculations. Taking this argument into account, immigrantsrepresent a fiscal burden of $16,2 billion for social programs.
Hence, these studies cannot precisely evaluate the sign and the extent of migrants’ netcontribution to the welfare system. Indeed, their static nature cannot take of the futuretaxes and benefits generate by immigrants into account. Simon’s (1984) approach is sin-gle insofar as the calculated balance is quasi-longitudinal. The costs of successive immi-gration cohorts are measured so as to evaluate the configuration of taxes paid and benefits
XAVIER CHOJNICKI
19

received by immigrant households throughout their life. The author shows that all immi-grant cohorts that arrived in the US after 1950 are net contributors. But this attemptobviously questions whether the benefits associated with successive cohorts can beregarded as a life cycle estimate of the tax position of migrants. Hence, this study large-ly over-estimates the benefits related to recent immigration waves by including neitherthe costs associated with immigrants’ children nor the changes in age and skill profilessince the 1970s. Therefore, the only meaningful calculation is longitudinal. For exam-ple, one knows that immigrant incomes grow with time whereas benefits receiveddecrease; that a part will claim its old-age pension later like the natives, that another partwill return to its country of origin. Finally, these studies are not appropriate for evalu-ating the impact of a migratory policy change.
Using a partial equilibrium model, Lee and Miller (1997) projected the long-term fis-cal impact of immigration in the US. Using CPS (Current Population Survey) data, theyinitially built the age profiles of taxes and benefits of various immigrant generations in1994. The benefits profiles of natives and immigrants appear quite similar but immi-grants pay considerably lower taxes at each age. Then, they project the long-term impactand demonstrate that an immigrant has a positive average fiscal impact of $80 000(Table 5). The positive fiscal impact is strongest when immigrants are 10 to 30 years oldand highly depends on their skills (especially for the first immigrant generations).5
TABLE 5. AVERAGE LONG TERM FISCAL IMPACT OF AN IMMIGRANT BY EDUCATION
LEVEL IN THE US
Source: Lee and Miller (1997).
Other recent studies, based on generational accounting methodology, consider theimpact of changes in immigration policy on the average fiscal burden of different agecohorts. The results differ somewhat depending on whether they are carried out in theUS or in Europe. Auerbach and Oreopoulos (1999) show that the fiscal impact of USimmigration is small. Whether there is a gain or a loss relies on the extent to which theexisting fiscal imbalance will be borne by future generations. Moreover, the extent ofexpenditure unrelated to population size will largely determine the fiscal impact ofimmigration. Finally, a change in immigration policy that alters the composition rather
THE ECONOMIC IMPACT OF IMMIGRATION FOR THE HOST COUNTRIES
5 Similar results were obtained in a recent update (Lee and Miller, 2000) taking account of higher projected ratesof productivity, recent tax reform and last demographic projections.
20
Group
Immigrants onlyDescendantsImmigrants and descendants
1996 dollars
< High School
-89 000+ 76 000- 13 000
High School
- 31 000+ 82 000+ 51 000
> High school
+ 105 000+ 93 000+ 198 000
Overall
- 3 000+ 83 000+ 80 000
Education level of immigrant
than the level of migratory flows can potentially reduce the fiscal burden bequeathed tofuture generations. Conversely, Bonin and al. (2000) for Germany and Collado and al.(2003) for Spain, lead to a positive and significant effect of immigration on theintertemporal budget constraint, which can be substantially strengthened by a selectiveimmigration policy. These apparently contradictory results rely on the much more dra-matic nature of population aging in Europe compared to that in the US.
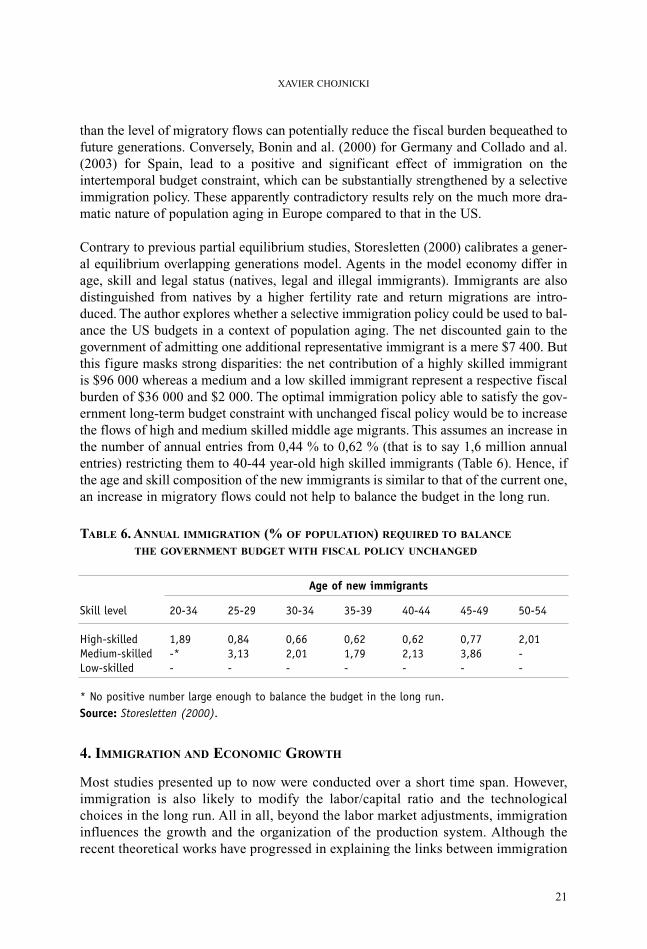
Contrary to previous partial equilibrium studies, Storesletten (2000) calibrates a gener-al equilibrium overlapping generations model. Agents in the model economy differ inage, skill and legal status (natives, legal and illegal immigrants). Immigrants are alsodistinguished from natives by a higher fertility rate and return migrations are intro-duced. The author explores whether a selective immigration policy could be used to bal-ance the US budgets in a context of population aging. The net discounted gain to thegovernment of admitting one additional representative immigrant is a mere $7 400. Butthis figure masks strong disparities: the net contribution of a highly skilled immigrantis $96 000 whereas a medium and a low skilled immigrant represent a respective fiscalburden of $36 000 and $2 000. The optimal immigration policy able to satisfy the gov-ernment long-term budget constraint with unchanged fiscal policy would be to increasethe flows of high and medium skilled middle age migrants. This assumes an increase inthe number of annual entries from 0,44 % to 0,62 % (that is to say 1,6 million annualentries) restricting them to 40-44 year-old high skilled immigrants (Table 6). Hence, ifthe age and skill composition of the new immigrants is similar to that of the current one,an increase in migratory flows could not help to balance the budget in the long run.
TABLE 6. ANNUAL IMMIGRATION (% OF POPULATION) REQUIRED TO BALANCE
THE GOVERNMENT BUDGET WITH FISCAL POLICY UNCHANGED
* No positive number large enough to balance the budget in the long run.Source: Storesletten (2000).
4. IMMIGRATION AND ECONOMIC GROWTH
Most studies presented up to now were conducted over a short time span. However,immigration is also likely to modify the labor/capital ratio and the technologicalchoices in the long run. All in all, beyond the labor market adjustments, immigrationinfluences the growth and the organization of the production system. Although therecent theoretical works have progressed in explaining the links between immigration
XAVIER CHOJNICKI
21
Skill level
High-skilledMedium-skilledLow-skilled
20-34
1,89-*-
25-29
0,843,13-
30-34
0,662,01-
35-39
0,621,79-
40-44
0,622,13-
45-49
0,773,86-
50-54
2,01--
Age of new immigrants

and economic growth, few empirical studies have been conducted. Moreover, theeffects can be different according to whether the force driving growth is endogenousor exogenous.
Solow’s model constitutes the starting point to study the links between immigration andgrowth. Widening the model to migrations implies a certain degree of mobility of workand human capital (but the economy remains closed with respect to foreign goods andassets). In such a model, the determinant variable will be the immigrant skills and there-fore the human capital quantity they bring. Along the balanced growth path, the percapita income is an increasing function of the capital stock per efficient unit of work.Consequently, when the migratory flows are composed of relatively low skill labor, theyintuitively imply5 a reduction of the per capita capital and of the per capita income ofthe host country. Hence, migrations induce a convergence in the living standards acrosscountries when, as predicted by the market forces, they are carried out from the poorestcountries towards the richest. Thus, migrations have an expansionist impact for the hostcountry if the migrants are relatively more skilled than the natives and a recessionnistimpact in the opposite case. Table 5 summarizes the results in a modified Solow model.
TABLE 7. IMMIGRATION EFFECTS IN EXOGENOUS GROWTH MODEL IF IMMIGRANTS ARE
LESS SKILLED THAN NATIVES
Source: Dolado, Goria and Ichino (1993).
Obviously, this kind of model has some drawbacks. First of all, the flows are determinedby an ad hoc migration function instead of an optimizing choice of households. Then, thecapital mobility is restricted to the human capital brought by the migrants. Braun (1993)proposed various extensions postulating variable degrees of capital mobility and a migra-tory function rising from optimizing decisions. Consequently, if we consider two countriesof different development levels, people and capital will move towards the economy with thebest technology. In order to prevent only one area from remaining populated in the long run,Braun introduced the concept of a natural resource subject to a congestion effect. However,the results are still similar except for the speed of convergence across economies that nowrelies on the degree of congestion of the fixed factor and on the sensitivity of the migrationrate to the remuneration gap between countries.
THE ECONOMIC IMPACT OF IMMIGRATION FOR THE HOST COUNTRIES
5 See Barro and Sala-I-Martin (1995) for a more detailed presentation.
22
Immigrants’ human capitalNet immigration rateSaving rateStandard capital requirement
Growth rate
+-+-
Speed of convergence
-+++
Steady stateoutput level
+-+-
Current outputlevel
+-==

Few studies have tried to empirically validate these results. The answers brought byempirical studies are sensitive to the period considered. Barro and Sala-I-Martin (1995)estimated the effect of migration on convergence for the US, Japan, Germany, Italy,France, Spain and the UK. When the migration rate is excluded from the list of explana-tory variables, the results obtained are close to the usual one. When the net migrationrate is included in the regressions, contrary to expectations, the estimate of � with anOLS specification does not decrease when the net rate of migration is held constant. Theresults are probably influenced by the endogeneity of the net migration rate. Then, theauthors try to isolate the exogenous shifts in migration by using the technique of instru-mental variables. Consequently, the net migration rate is explained by 3 explanatoryvariables: the log of per capita income, the population density (reflecting a possible con-gestion effect) and the average temperature (representing a pure amenity). The differ-ence between the convergence speed estimated while excluding and including themigration rate is weak. Hence, the uncertainty of the results indicates that migrationplays only a minor role in convergence.
Conversely, the studies covering the period 1850-1914 demonstrate the dominating roleof migrations in the convergence process (Taylor and Williamson, 1994; Williamson,1995). Migrations account for a very large share of the convergence in GDP per work-er and real wages. Therefore, the empirical validation of the exogenous growth modelresults seems limited and contradictory depending on the period considered. This miti-gated impact on convergence supposes that migration also induces divergent phenome-na not taken into account by the exogenous growth models.
The literature on labor migration and endogenous growth is mostly focused on the prob-lem of brain drain. Consequently, the main purpose is to study the consequences of themigrations of skilled workers from poor countries to rich countries. The endogenousgrowth theories highlight some interdependencies (a possible source of divergence)between the quantitative and the qualitative characteristics of the migratory flows and thetechnological development. Several works6, Miyagiwa (1991), Mountford (1994) andHaque and Kim (1995), take up the general framework of the Lucas model, includingmigrations. They assume the existence of two countries producing a homogeneous goodthrough human capital, which is the only production factor. These studies show that theimpact of immigration on the growth rate of host countries is rather ambiguous. It dependson the migrants’ and natives’ relative level of knowledge as well as the extent of the migra-tory flows. Indeed, when the flows are relatively important and the immigrants’ humancapital is relatively weak, immigration has a negative impact on the long-term growth rateof the host country. Only an entry of highly skilled labor would have a positive impact onthe long-term dynamics of the host country. In that case, immigration would be a poten-tial source of divergence between the host and the source countries.
Robertson (2002) confirms this negative impact of low skilled immigration. He modi-fies the growth model of Lucas in order to integrate unskilled labor as a separate factor.
XAVIER CHOJNICKI
6 See Domingues Dos Santos (1997) for a more detailed discussion.
23

He shows that an unanticipated rise in the stock of unskilled workers leads the econo-my on a transitional growth path with a slow growth of human capital relative to the bal-anced path. Indeed, in response to this exogenous rise of unskilled workers, the econo-my temporarily reduces the level of investment in human capital and increases goodsproduction. Intuitively, the desire for current consumption outweighs the loss of futureconsumption from a lower growth rate of human capital.
Lundborg and Segerstrom (2002) used the framework of a quality ladders growth modellike that of Grossman and Helpman. They consider two structurally different countries.The two areas are distinguished by the R&D capabilities of their workers. In equilibri-um, all "High Tech" production takes place in the North. Then, the authors simulate theeffect of a migration of southern workers towards the North equivalent to a 5 % rise ofthe North’s population. This policy increases the growth rate of per capita GNP in boththe North and the South but results in a reduction of the real wages of the northernworkers. Northern firms respond by allocating more resources to R&D activities,improving the probability of innovation. However, this higher rate of market turnovertends to reduce firms’ expected discounted profit. On the whole, immigration reducesthe discounted welfare of the northern population. But the growth rate only relies on theR&D activity that firms carry out. Indeed, this model does not take the externalitiesrelated to the human capital brought by immigrants into account (and therefore theimportance for the host country to follow a selective immigration policy).
CONCLUSION
The purpose of this article is to evaluate the main economic effects of immigration. Moststudies focused on the labor market propose a weak net gain of immigration whose distri-bution is related to the immigrants’ skills and to how those skills compare with the skills ofnatives. Empirical studies show that past immigration only had a weak impact on natives’wages and unemployment rate. The net effects on welfare transfers are unclear and strong-ly depend on the composition of the migration flows. Nevertheless, we have seen that aselective policy on age and skills could represent an alternative instrument to the tradition-al economic policies with regards to aging. The studies analyzing the relations betweenmigration and the dynamics of growth of the receiving and sending areas are of two types.Firstly, when the dynamic of growth is treated as exogenous, unskilled migratory flowsspeed up the convergence of wages and per capita GDP between the source and the hostcountries. Secondly, the endogenous growth theories highlight some interdependencies,maybe sources of divergence, between the quantitative and the qualitative characteristics ofthe migratory flows and the technological evolution.
To conclude, the skill composition of the immigrant population determines the socialand economic consequences of immigration for the country. Thus, the positive effectsstemming from future immigration mainly depend on the possibility of following aselective policy, as well as on the age and on the skill level of immigrants.
THE ECONOMIC IMPACT OF IMMIGRATION FOR THE HOST COUNTRIES
24

REFERENCES
Altonji J.G. and D. Card, 1991. “ The Effects of Immigration on the Labor MarketOutcomes of Less-skilled Natives”, In J. Abowd and R. Freeman, eds., 201-234.Angrist J. and A. Krueger, 2003. “Protective or Counter-Productive? Labor MarketInstitutions and the Effect of Immigration on EU Natives”, The Economic Journal,113, 488, 302-331.Auerbach A. and P. Oreopoulos, 1999. “Analysing the Fiscal Impact of USImmigration”, American Economic Review, 89, 2, 176-180.Barro R. and X. Sala-I-Martin, 1995. “ Economic Growth”, McGraw-Hill.Bean F.D., B.L. Lowell and J. Taylor, 1988. “ Undocumented Mexican Immigrantsand the Earnings of Other Workers in the United States”, Demography, 25, 1, 35-52.Blau F.D., 1984. “ The Use of Transfer Payments by Immigrants”, Industrial andLabor RelationsReview, 37, 2, 222-239.Bonin H., B. Raffelhüschen and J. Walliser, 2000. “ Can Immigration Alleviate theDemographic Burden”, FinanzArchiv, 57, 1, 1-21.Borjas G.J., 1990. “ Friends or Strangers : The Impact of Immigrants on the U.S.Economy”, New-York : Basic Books.Borjas G.J., 1994. “The Economics of Immigration”, Journal of EconomicLiterature, 32, 1667-1717.Borjas G.J., 1995. “The Economic Benefits from Immigration”, Journal ofEconomic Perspectives, 9, 2, 3-22.Borjas G. J., R.B. Freeman and L.F. Katz, 1992. “On the Labor Market Effects ofImmigration and Trade”, in Immigration and the Workforce: EconomicConsequences for the United States and Source Areas, G. J. Borjas et R. Freeman,eds., 213-244.Borjas G.J., R.B. Freeman and L.F. Katz, 1997. “How much do Immigration and Trade Affect Labor Market Outcomes”, Brooking Papers in Economic Activity,1, 1-85.Borjas G.J., 1999. “Heaven’s door: Immigration Policy and the American Economy”,Princeton University Press, Princeton/Oxford.Braun J., 1993. “Essays on Economic Growth and Migration”, Ph.D dissertation,Harvard University.Card D., 1990. “The Impact of the Mariel Boatlift on the Miami Labor Market »,Industrial and Labor Relations Review, 43, 2, 245-247.Card D., 1997. “Immigrant Inflows, Native Outflows, and the Local Labor MarketImpacts of Higher Immigration”, NBER Working Paper, 5927.Chiswick C.U., 1989. “The Impact of Immigration on the Human Capital ofNatives”, Journal of Labor Economics, 7, 4, 464-486.Collado D., I.I. Iturbe-Ormaetxe and G. Valera, 2003. “Quantifying the Impact ofImmigration in the Spanish Welfare State”, IVEI Working Paper.Collins W. J., K.H. O’Rourke and J.G. Williamson, 1997. “Were Trade and FactorMobility Substitute in History?”, NBER Working Paper, n° 6059.
XAVIER CHOJNICKI
25

DeNew J.P. and K.F. Zimmermann, 1994. “Native Wage Impacts of Foreign Labor:A Random Effects Panel Analysis”, Journal of Population Economics, 7, 2, 177-192.Dolado J.J., A. Goria and A. Ichino, 1993. “Immigration, Human Capital andGrowth in the Host Country: Evidence from Pooled Country Data”, CEPR DiscussionPaper, 875.Domingues Dos Santos M., 1997. “Migration, Chômage et Croissance”, Ph.D dis-sertation, University of Paris I.Filer R.W., 1992. “The Effect of Immigrant Arrivals on Migratory Patterns of NativeWorkers”, in Immigration and the Workforce: Economic Consequences for the UnitedStates and Source Areas, G. J. Borjas and R. Freeman, eds., 245-269. Friedberg R.M. and J. Hunt, 1995. “The Impact of Immigrants on Host CountryWages, Employment and Growth”, Journal of Economic Perspectives, 9, 2, 23-44.Gang I. and F. Rivera-Batiz, 1994. “Labor Market Effects of Immigration in theUnited-States and Europe: Substitution Vs. Complementarity”, Journal of PopulationEconomics, 7, 2, 157-175.Greenwood M.J. and G.L. Hunt, 1995. “Economic Effects of Immigrants on Nativeand Foreign-born Workers: Complementarity, Substituability and other Channels ofInfluence”, Southern Economic Journal, 61, 1076-1097.Greenwood M.J., G.L. Hunt and U. Kohli, 1996. “The Short-run and Long-runFactor-market Consequences of Immigration to the United States”, Journal ofRegional Science, 36, 43-66.Gross D.M., 1999. “Three Million Foreigners, Three Million Unemployed?Immigration and the French Labor Market”, IMF Working Paper, WP/99/124.Grossmann J.B., 1982. “The substituability of natives and immigrants in produc-tion”, Review of Economics and Statistics, 64, 4, 596-603.Gustman A. and T. Steinmeier, 2000. “Social Security Benefits of Immigrants andUS Born” in Issues in the Economics of Immigration, G. Borjas, eds., The Universityof Chicago Press.Haque N. and S. Kim, 1995. “Human Capital Flight: Impact of Migration on Incomeand Growth”, IMF Staff Papers, 42, 3, 577-607.Huddle D., 1993. “The Costs of Immigration”, Carrying Capacity Network,Washington, D.C.Hunt J., 1992. “The impact of the 1962 repatriates from Algeria on the French LaborMarket”, Industrial and Labor Relation Review, 45, 556-572.Jaeger D.A., 1996. “Skill Differences and the Effect of Immigrants on the Wages ofNatives”, US Department of Labor Working Paper 273.Jayet H., L. Ragot and D. Rajaonarison, 2001. “L’immigration : quels effetséconomiques?”, Revue d’Economie Politique, 111, 4, 565-596.Jones R.W., 1971. “A Three-factor Model in Theory, Trade and History”, in Trade,Balance of Payment and Growth, J. N. Bhagwati and al., eds., Amsterdam, North-Holland.LaLonde R.J. and R.H. Topel, 1991. “Labor Market Adjustments to IncreasedImmigration”, in Immigration, Trade and the Labor Market, J. Abowd et R. Freeman,eds., 167-199.
THE ECONOMIC IMPACT OF IMMIGRATION FOR THE HOST COUNTRIES
26
Lee R. and T. Miller, 1997. “The Future Fiscal Impacts of Current Immigrants”, inThe New Americans, J. Smith et B. Edmonston, eds., Washington, DC : NationalAcademy Press, 297-362.Lee R. and T. Miller, 2000. “Immigration, Social Security and Broader FiscalImpacts”, American Economic Review, 90, 2, 350-354.Lundborg P. and P.S. Segerstrom, 2002. “The Growth and Welfare Effects ofInternational Mass Migration”, Journal of International Economics, 56, 177-204.Markusen J.R., 1983. “Factor Movements and Commodity Trade as Complements”,Journal of International Economics, 13, 341-356.Miyagiwa K., 1991. “Scale Economies in Education and the Brain Drain Problem”,International Economic Review, 32, 743-759.Mountford A., 1994. “Can Brain Drain be Good for Growth?”, CEPR DiscussionPaper, n° 9508.Muhleisen M. and K.F. Zimmermann, 1994. “A Panel Analysis of Job Changesand Unemployment”, European Economic Review, 38, 793-801.Muller T. and T.J. Espenshade, 1985. The fourth wave, Washington, DC : UrbanInstitute Press.United Nations, 2000. “Replacement Migrations: Is it a Solution to Declining andAging Population?”, Population Division, Department of Economics and SocialAffairs, New York.OECD, “Trends in International Migrations”, Various editions, OECD editions,Paris.OECD, 2001. “Trends in Immigration and Economic Consequences”, EconomicsDepartement Working Papers N° 284.OECD, 2002. “International movement of the highly skilled”, OECD Editions,Paris.Passel J.S., 1994. “Immigrants and Taxes : A Reappraisal of Huddle’s ‘The Cost ofImmigrants’”, Washington DC, The Urban Institute, PRIP-UI-29.Robertson P.E., 2002. “Demographic Shocks and Human Capital Accumulation inthe Uzawa-Lucas Model”, Economics Letters, 74, 151-156.Rothman E. and T.J. Espenshade, 1992. “Fiscal Impacts of Immigration to theUnited-States”, Population Index, 58, 3, 381-415.Schiff M., 2000. “Migration Nord-Sud et Commerce : Une revue de littérature”,Revue d’économie du Développement, 3, 3-54.Simon J., 1984 “Immigrants, Taxes, and Welfare in the United States”, Populationand Development Review, 10, 1, 55-70.Simon J., S. Moore and R. Sullivan, 1993. “The Effect of Immigration on AgregateNative Unemployment : An Across-city Estimation”, Journal of Labor Resources,14, 3, 299-316.Storesletten K., 2000. “Sustaining Fiscal Policy through Immigration”, Journal ofPolitical Economy, 108, 2, 300-323.Taylor A. and J. Williamson, 1994. “Convergence in the Age of Mass Migration”,NBER Working Paper Series, n° 4711.
XAVIER CHOJNICKI
27

Vernez G. and K.F. McCarthy, 1996. “The Costs of Immigration to Taxpayers :Analytical and Policy Issues”, Center for Research on Immigration Policy, Rand,Santa Monica.Williamson J., 1995. “The Evolution of Global Labor Markets since 1830 :Background Evidence and Hypotheses”, Explorations in Economic History, 32,141-196.Winegarden C.R. and L.B. Khor, 1991. “Undocumented Immigration andUnemployment of U.S. Youth and Minority Workers: Econometric Evidence”,Review of Economics and Statistics, 73, 1, 105-112.Winkelmann R. and K.F. Zimmermann, 1993. “Aging, Migration and LaborMobility”, in Labor Markets in an Aging Europe, Johnson P. et Zimmermann K. F.,eds., 255-283, Cambridge University Press, Cambridge.
THE ECONOMIC IMPACT OF IMMIGRATION FOR THE HOST COUNTRIES
28

THE BRAIN DRAIN : A REVIEW OF THEORY AND FACTS
SIMON COMMANDER (LBS & EBRD), MARI KANGASNIEMI (LSE) AND L. ALAN WINTERS (UNIVERSITY OF SUSSEX)
ABSTRACT:Skilled migration has increased in recent years, often stimulated by the explicit use of targeted visa pro-grammes by developed countries. This paper examines the available analytical and empirical literature onthe brain drain to try and understand better whether skilled migration from developing countries mustalways be harmful to the country of origin. We show that early generation models – mostly dating to the1970s – found that such migration would be harmful, mostly though the impact on wages and employ-ment, as well as through fiscal costs. A more recent literature has argued that a beneficial brain drain canarise if migration has educational externatilities. As human capital rises, growth will also be positivelyaffected. However, we show that if screening is applied such benefits may disappear or become smaller.Recent empirical work on the health and software sectors provides some contrasting evidence.
JEL CLASSIFICATION: F22, I21, J61.
KEYWORDS: skilled migration, educational externalities, growth.
BRUSSELS ECONOMIC REVIEW - CAHIERS ECONOMIQUES DE BRUXELLESVOL. 47 - N°1 SPRING 2004
29

INTRODUCTION
The migration of skilled personnel has attracted considerable attention in recent yearsas the developed countries have increasingly and explicitly targeted the recruitment oftalented individuals from developing countries. Perhaps the most well known examplehas been the use by the USA of H1-B visas in the 1990s to import skilled workers –mostly from India – for the booming high technology sector. Other countries have alsopursued similar cherry-picking immigration policies. This in turn has opened up debateabout the economic and ethical consequences of such strategies. In particular, the viewthat skilled migration must necessarily be detrimental to developing countries – by def-inition relatively less well endowed in skills than the developed countries – has gainedwide currency, at least in the popular press.
While an earlier literature and policy analysis – dating back to the 1970s – did general-ly support the view that skilled migration was bad for the sending or developing coun-try, more recent analytical and empirical findings permit a rather more nuanced andpotentially different view of the consequences of skilled migration. In particular, it hasbeen argued that skilled migration can be beneficial if the possibility of migration inturn leads to individuals acquiring more skills or education. That acquisition will raisethe human capital stock of the sending country and could contribute positively togrowth and economic performance. Yet – in common with the earlier literature –attempts at empirical validation have been, as yet, very limited, and the evidence con-cerning the consequences of skilled migration for developing countries remains notonly limited but also largely inconclusive.
This paper provides an overview of the literature on the brain drain but it also adds find-ings from some recent empirical work that attempts to address some of the main issuesindicated above. It is organised as follows. Section 1 concentrates on reviewing an ear-lier generation of models and their key findings. Section 2 then turns to a more recentclass of models that can generate ‘beneficial’ brain drains and the empirical work thatthis research has prompted. Section 3 then briefly touches upon some of the associatedeffects of skilled migration, such as remittances, networks and the duration of migra-tion. Section 4 concludes.
1. EARLY MODELS OF BRAIN DRAIN
The welfare implications of brain drain in earlier generation static models cruciallydepended on the assumptions made about wage setting. Once distortions, such as a gapbetween social and private marginal product and/or a public subsidy for education, wereintroduced, a welfare loss for those who do not emigrate could result. Bhagwati andHamada (1974) – the seminal paper of this era - worked in general equilibrium andintroduced distortions in the wage setting and in the financing of education. The model– which was subsequently widely employed - can be boiled down to a fairly simple setof blocs.
THE BRAIN DRAIN: A REVIEW OF THEORY AND FACTS
30
The economy produces two outputs with skilled and unskilled labour. The two typesof labour are exclusively allocated to their respective sectors. The real wage forskilled workers is determined by unions and includes an element of international emu-lation whereby skilled wages are partly related to skilled wages abroad. Minimumunskilled wages are fixed by association with the skilled wage or ‘leap frogging’: arise in the skilled wage leading to an increase in the unskilled wage. In addition, thesupply side reflects the incentive for education to be acquired so long as the expect-ed wage for educated (skilled) labour exceeds the uneducated (unskilled) wage. Afixed educational cost is introduced. Unemployment enters the initial equilibrium.There is also an exogenous flow of educated emigrants. In this model the internationalintegration of the skilled labour market can affect both sectors’ wages through emu-lation and leap-frogging, as well as expected wages through the actual foreign wageand the probability of emigration. The latter will affect education decisions, and edu-cation in turn carries a fixed cost.
With respect to unemployment, emigration may act directly to lower skilled unemploy-ment, but it also exerts two other effects. First, it can raise the expected wage by low-ering unemployment (and hence may have a supply side effect) and this can be ampli-fied if the emigration wage enters the expected wage. The net result depends on the elas-ticity of demand for skilled labour which determines whether the skilled labour wagebill increases or not. If the elasticity is lower than unity, an x% increase in skilled wageswill increase the wage bill and thus be associated with a less than x% fall in employ-ment. Thus the expected wage will have increased and the supply of skilled workers willtend to rise as a result. To the extent that the acquisition of skills through education issubsidised, this will similarly raise the cost to the sending country.
Second, if the skilled wage increases because of emigration, this may also spill over intoother sectors and hence have an impact on unemployment in those other sectors. Wageleap-frogging – letting unskilled wages follow skilled wages – would simply tend toextend unemployment to the unskilled and amplify the welfare reducing consequencesof skilled labour migration. With respect to national income, a rise in the skilled wagetends to reduce national income because of the decline in the employment of skilledlabour without any offsetting effect from the unskilled sector (in the case of no associ-ated effect on unskilled wages), while the cost of education will also tend to increase.However, with the assumption of wage ‘leap-frogging’, the implications for nationalincome are not so clear cut. Further, to the extent that emigration raises the wage of theemigrant, this implies that emigrants were receiving less than their marginal product.This surplus – as measured over the group – would be lost to the sending country in theevent of emigration. The size of the loss depends on the extent to which such workersare replaceable.
Hamada and Bhagwati (1975) extended the model by introducing a number of refine-ments to labour markets in the sending countries. For example, if emigration induced aladder effect with remaining skilled workers now better matched to skilled, rather than
SIMON COMMANDER, MARI KANGASNIEMI AND L. ALAN WINTERS
31
unskilled, jobs thereby reducing unskilled unemployment – a variant of Harris-Todaro– then the effects of emigration could indeed be positive. By contrast, while emigrationof skilled workers – such as doctors - might reduce labour market slack, it could alsoreduce the flow of doctors from urban to rural areas and limit any positive diffusioneffect. To the extent that the external labour market is more efficient at screening work-ers, the result would be the loss of the most efficient to the sending country1.
These early generation models treat the demand side for emigrants as exogenous andhave a range of assumptions regarding education costs. At their heart, lies the specifi-cation of the sending country’s labour market: under wage rigidity, emigration tends tolower sending country employment with the distribution over sectors being contingenton relative wage setting and ex ante employment levels.
What were the empirical foundations for such models? With regard to wage differen-tials, the few extant (and generally biased) estimates of wage differentials across coun-tries signal substantial wage gaps for most categories of skilled workers. Indeed, otherevidence confirms that skilled workers systematically earn less – adjusted for purchas-ing power - in developing than in developed countries. A recent study of new immi-grants to the USA, for example, finds that the average immigrant realized major earn-ings gains over their last job abroad. For men this increase was 68 percent and 62 per-cent for women. New immigrants who came primarily for work reasons experienced byfar the largest increases in earnings2.
In terms of the impact of migration on labour markets in the sending countries, evidencehas remained even more limited. Arora et al (2001) and Kumar (2000) have found thatone of the major problems perceived by Indian ICT firms is a shortage of skilled labour.The late 1990s boom in the Indian software sector was clearly associated with increaseddemand for engineers and there is evidence of this forcing up skilled wages. But evenhere, the consequences may not have been that lasting or necessarily that widespread aswork reported in Commander et al (2004) indicates.
There is more information concerning lost educational investment. In most developingcountries at least some part of the cost of education is borne by the government, partlybecause the social return from education is higher than the private one. In recent times,there has been an increase in the provision of private educational services in manydeveloping countries where the cost is largely, if not exclusively, borne privately.However, even when this is the case, any additional social returns to education, as wellas public investment in primary and secondary education, are lost when an individualemigrates.
THE BRAIN DRAIN: A REVIEW OF THEORY AND FACTS
2 See also Arrow (1973) and Spence (1974).1 Jasso, Massey, Rosenzweig and Smith (2000); Jasso, Rosenzweig and Smith (2000).
32
Estimating the exact cost of education is very difficult and the result depends on theapproach that is taken in allocating fixed costs across outputs. There are some availablecost estimates. For example, the total cost of a medical degree in India has been esti-mated to be eight times annual GDP per capita (Jayaram 1995), and for an engineeringdegree four times annual GDP per capita (Salim 1996). World Bank/UNESCO datashow that average government expenditure per student on tertiary education varies a lot,but mostly lies in the range of 1000-3000 (international) dollars. In both China andIndia the expenditure is around 2000 dollars per student.
Yet simply assuming that the education costs in developing countries are largely pub-licly financed misses some important innovations in educational services supply andfinancing that has occurred in the 1990s. These may in turn have been positivelyinfluenced by the emigration of the skilled. For example, in India private institutionshave begun training specialists for the software industry. According to Arora et al(2001) while the supply of engineering graduates from the main public educationalinstitutions is relatively inelastic in the short run, privately the trained supply of soft-ware professionals has increased substantially, dampening the wage effect of thedemand side changes.
In China there is also a number of private institutions. It has been estimated that there hasbeen a strong expansion of private education since the 1980’s. According to the officialfigures in 1998 there were 1274 private tertiary institutions, the majority of which pre-pare students for national exams rather than confer degrees. However, an estimated 4million students study in private tertiary institutions, not recognised by the Ministry ofEducation. (Dahlman and Aubert 2001.)
Of course, such innovations have had little or no impact in sectors where certification andregulation have been tighter, as, for example, with healthcare and teaching. Indeed, it isstill broadly correct to assume that the bulk of doctors, nurses and teachers in develop-ing countries receive substantial public subsidy to their training. Although the questionof new methods of financing higher education has been raised strongly, in most devel-oping countries students’ own contributions to the costs of higher education are stillsmall (Johnstone et al, 1998; Tilak 1996 and Jayaram 1995).
This early literature on the brain drain lacked any significant empirical component.There was no attempt at disaggregation beyond skilled-unskilled categories. Sectoraldifferences were ignored and there was no attempt to take the analysis to the level ofthe firm. Finally, there was little attention to heterogeneity between sending countries.The literature also arguably over-emphasised the dichotomy between those who emi-grate and those who stay. Modern communications technology has had radical impli-cations for the ways in which work can be done across space. For example, the recentgrowth in software activity has been striking for its high network content, linkingfirms and individuals in developing and developed countries without necessarilyinducing migration or inducing only temporary mobility. Return migration can also
SIMON COMMANDER, MARI KANGASNIEMI AND L. ALAN WINTERS
33
be a significant source of positive effects. For example, Dos Santos and Postel-Vinay(2003) show that it is rational for some migrants to return having enhanced theirhuman capital and that this may be associated with narrowing the technological gapbetween developed and developing countries.
Finally, it is also worth mentioning that positive consequences of a brain drain for thesending country could arise from changes in the terms of trade as the sending econo-my’s output falls along with the decrease in its endowments. For example, Winters et al(2002) find these to be quite significant in a CGE model of migration. Davis andWeinstein (2002) point out that if a country has a Hicks-neutral technical advantage,there will be incentives for all factors to migrate towards it. If such migration left rela-tive factor abundance unchanged, incumbent factors from that country would lose astheir own physical marginal productivity would remain unchanged while the prices oftheir output fell.
2. ENDOGENOUS GROWTH AND THE ‘BENEFICIAL BRAIN-DRAIN’
A more recent literature has evolved following a decade and more of liberalisation. Thisliterature has located the brain-drain in explicitly dynamic models and has, on thewhole, come up with significantly more optimistic results than the earlier work. Thecentral proposition is that if the possibility of emigration encourages more skill-creationthan skill-loss, sending (or home) countries might increase their stocks of skills asopportunities to move or work abroad open up. If, in addition, this accumulation ofskills has beneficial effects beyond the strictly private gains anticipated by those whoacquire the skills, the whole economy can benefit. Examples of such benefits includeenhanced intergenerational transmission of skills and education (Vidal, 1998) andspillovers between skilled workers (Mountford, 1997).
There are two critical features of these models. The first is the nature of the socialbenefit resulting from higher skills, for which several approaches are evident. In thesimplest form Stark, Helmenstein and Prskawetz (1997, 1998) and Stark and Wang(2002) merely assume that increasing the average skill level of the sending economyis desirable. Mountford (1997) postulates a production externality whereby the pro-ductivity of current labour depends positively on the share of the population who hadeducation in the previous period. Beine, Docquier and Rapaport (2001a) formalisethis by allowing the average skill of one generation to pass directly to the next, whocan then build on it by taking education. In all these cases, emigration has a negativedirect effect by draining skilled labour out of the sending economy - a ‘drain’ effect- but a potentially beneficial effect in encouraging human capital formation - a‘brain’ effect.
Vidal (1998) assumes an intergenerational transfer whereby the higher the human capi-tal level of one generation, the more effective is the human capital formation of the nextgeneration. This too would seem to be a force for divergence, for skilled emigration
THE BRAIN DRAIN: A REVIEW OF THEORY AND FACTS
34
would appear to make future human capital acquisition cheaper in the receiving countryand dearer in the home country. But, in fact, Vidal prevents this by assuming that, for thepurposes of the spillover, migrants' human capital remains at home. This makes no sensefor permanent migration - the traditional and main concern of the brain-drain literature -but it may be plausible for temporary migration, an area of more recent interest – seeWinters et al (2002).
The second critical issue for the beneficial brain-drain is the mechanism that generatesan increased incentive to acquire education but leaves some skilled workers back athome. All the current literature starts with wages for given levels of skills/ability beinghigher abroad than at home. From there, the predominant approach – Mountford (1997),Stark, Helmenstein and Prskawetz (1998), Vidal (1998), Beine, Docquier and Rapaport(2001a) and Stark and Wang (2002) – has been to assume that there is uncertainty aboutthe ability to migrate, so that of N who acquire education only πN (π < 1) actually emi-grate. If π were unity, a permanent brain-drain could not be beneficial as all the incre-mental education would be lost. A further critical assumption is that the probability ofmigration is fixed and exogenously given for any individual educated would-be migrant.This implicitly arises because foreign firms cannot screen migrants to distinguish theable from the less able and it is this market failure that makes it possible for the brain-drain to be beneficial.
We can illustrate the importance of this assumption, using a highly simplified modelwhich nonetheless captures Mountford's (1997) insight. Following Beine, Docquierand Rapaport (2001a), assume that ability is uniformly distributed between Amin andAmax and that education yields private net returns that increase with ability, as in theline XX’ in Figure 1. With a given private cost of education, indicated by the hori-zontal line, people with ability between A* and Amax find it profitable to take edu-cation. At point A* private cost of education equals expected returns. Now, allow forthe possibility of migration for educated people. If an individual can migrate, her pri-vate returns increase to YY’. With a probability of migration 0 < π < 1, the expectedreturns to education lie between the domestic and emigration rates of return - sayalong ZZ’, and individuals between A** and Amax will take education. Of these, how-ever, a proportion, π, will emigrate leaving the domestic economy with (1 - π) (Amax- A**) educated people, which may or may not exceed (Amax - A*). Adding socialreturns to education is conceptually simple, because they have no immediate effect onprivate decisions. For simplicity, let social benefits be proportional to the stock ofeducated remaining at home, i.e. � (Amax - A*) with no migration, and � (1 - π) (Amax- A**) with migration.
SIMON COMMANDER, MARI KANGASNIEMI AND L. ALAN WINTERS
35

FIGURE 1. THE BENEFICIAL BRAIN DRAIN AND SCREENING
The possibility of migration raises expected welfare for anyone who takes education.Hence there is an increase in aggregate private income, although, of course, some indi-viduals who do not manage to emigrate will regret their education decisions ex post. Theuneducated see no direct change in private returns and welfare and consequently grossprivate income rises when migration is permitted. What happens to aggregate welfare,of course, also depends on the social benefits of education.
Fundamental to this story is that every educated individual has probability π of emi-grating - hence all of them experience the increase in expected returns, so that in ourlinear example line ZZ’ lies uniformly above XX’. But now suppose that the country ofimmigration can screen migrants perfectly for ability. They admit immigrants but onlyfrom the top echelons, so that if, say, they want M people from our target country, theyget the top M lying between AM and Amax in Figure 1. If this is known, the incentivesfor individuals with ability below AM are unchanged. The private returns to educationfollow the thick line XX”Y”Y. (Amax - A*) are educated, of whom (AM - A*) remain.The increment to total private income is larger than if the migrants had been randomlyselected, because the same number of migrants makes gains but no-one makes educa-tion decisions that they regret ex post. However, there is a loss of social welfare of �M,as M educated people are lost and the social welfare was proportion � of the number ofeducated individuals.
THE BRAIN DRAIN: A REVIEW OF THEORY AND FACTS
36
X ’
Y ’
Z ’
A min A** A* A maxA M

Clearly perfect screening is implausible, but even with imperfect screening all that wouldhappen is that the vertical section of XX”Y”Y would become sloped. But for so long asit meets XX” above A*, offering migration would affect no-one's education decisions.Thus, a necessary criterion for a beneficial brain drain to apply is that the marginal person in education has a positive probability of emigrating3.
The importance of effective screening is also evident in Stark, Helmenstein andPrskawetz (1997) who distinguish between education and innate ability. For them, theincreased incentive to acquire education among less able workers is that, while foreignfirms can recognise educational qualifications they cannot, at first, distinguish highfrom low ability workers. As a result, for a period they offer all migrants with a givenlevel of education the same wage (the mean level averaged over ability for that level ofeducation), with the consequence that less able workers are ‘over-paid’. Over time for-eign firms may discern workers' true ability and offer 'appropriate' wages, at which timethe benefits of emigration erode and, at least with finite probability, the workers returnhome. Even if they have acquired no skills or networks abroad, they are better educatedthan they would have been in the absence of migration. In this case it is the imperfec-tions in screening that create the incentives to acquire education.
A possible development of the screening model is that the sending or home country hassome unexploited capacity for education, in the sense that the returns to education areprimarily determined by the demand for skilled workers rather than the ability of thepopulation. In this case even a perfectly screened emigration would generate net bene-fits. Suppose that as the workers between AM and Amax migrated, they left openings fornewly educated workers to take jobs with precisely the same returns. The net effect onthe home economy would be to have the same number of educated workers as withoutmigration and hence the same spillovers, but M fewer uneducated workers. This wouldraise average incomes slightly (and average skill-levels). In addition, the migrantswould record positive private gains.
Empirical findings
An important step forward in the literature on the beneficial brain drain is due toBeine, Docquier and Rapaport (2001a, b) who test the model empirically using cross-sectional data. They suggest that the probability of emigration does appear to boosthuman capital formation and that the stock of human capital does appear to influencegrowth positively4.
SIMON COMMANDER, MARI KANGASNIEMI AND L. ALAN WINTERS
3 Of course, actual decisions about education are taken with respect to subjective probabilities of migration not expost observed probabilities. Thus, if individuals are overly optimistic about their prospects, marginal candidatesmay believe they face improved expected returns even when they do not.
4 This latter finding is, of course, rather different from the results of much of the empirical growth literature, seePritchett (2001).
37
They also decompose the effects of migration into a ‘brain’ effect - human capital accu-mulation - and a ‘drain’ effect - losses due to actual emigration. They identify severalcountries which would benefit from a decline in the stock of skilled emigration (i.e.reducing the outflow and receiving some nationals back). These countries typically havehigh rates of emigration coupled with relatively ineffective education and training sys-tems. Some would even benefit from a complete ban on skilled migration. Interestingly,however, the loss of growth due to emigration appears to be rather small, of the order of0.05% p.a. The obverse of these results is that countries would typically gain from high-er emigration if they currently have low rates of emigration and low levels of humancapital. (That is, where the costs of further emigration are relatively low and the bene-fits in terms of incentives relatively high.) There are limited numbers of countries in thisclass, but they include the larger developing countries, such as Brazil, China and India.
Cases of Health and Software
In Commander et al (2002) we review various data as they pertain to the beneficialbrain-drain hypothesis. We illustrate the increasing rate of skilled migration over the1990’s, resulting in quite large cumulative outflows in some cases. There is evidence ofsuch increased migration being accompanied by increased take up of education – espe-cially in technical areas (like ICT) where migration occurs - and often at privateexpense. We also find, however, prima facie evidence of strong screening mechanisms,which raises the possibility that the increased education is being substantially drainedaway. Further, we argue that there are likely to be important sector-specific effects atwork. As such, our work focusses on two distinct sectors, medicine and software.
In the case of medicine, our evidence is not generally supportive of a beneficial brain-drain through increased through increased incentives to obtain education5. Using a smalltelephone and postal survey of overseas doctors working in the UK to look at both theissue of screening and the influence of migration possibilities on educational decisions,we find that while there are clear grounds for supposing that screening is implemented,there is little evidence to suggest that migration possibilities have played any significantrole in driving educational decisions6. With respect to screening, evidence both withregard to the institutions in the sending countries in which they had trained, as well asinformation regarding subsequent – post-migration – ability to find a job, clearly supportthe view that screening in the case of migrant doctors is actively applied. Turning to theinfluence of migration on education decisions, survey responses do not support the viewthat migration has exerted a systematic, positive effect on education decisions. Nor doesthere appear to be any association between migration having an influence on educationand the individual characteristics of migrants. The negative effect will, if anything, be
THE BRAIN DRAIN: A REVIEW OF THEORY AND FACTS
5 See Kangasniemi et al (2003).6 The survey comprised 137 responses. Thus, not only is the survey size small but there are other shortcomings. We
are, for example, not able to compare migrant doctors with their peers who did not move. Nevertheless, the sur-vey provides some useful insights.
38
amplified by the fact that most of the doctors in the sample had received free or highlysubsidised education, thereby entailing a clear fiscal cost. In part offsetting these features,doctors – like most migrants – do generally send remittances back to their home countries.Under some plausible assumptions, we argue that the net benefit of migration may havebeen negative in the case of doctors. However, it should be taken into account that a fair-ly large proportion – arround half – of doctors from low income countries indiacted thatthey intended to return home. Further roughly three quarters of doctors from low incomecountries also believed that they were easy to replace. Indeed, 19% of Indian doctors inthe sample had actually experienced a unemployment spell prior to migrating. Theseresponses suggest migration does not necessarily run alongside skill shortages at home.
The software case provides a rather more nuanced example and one that appears gener-ally more supportive to the beneficial brain drain argument, although in a number ofways that go beyond the effect of migration on education decisions7. Drawing on a firmlevel survey of 225 firms in India and an additional 98 software firms in the USA, wefind that there is strong evidence of screening aimed at ensuring that the upper end ofthe talent distribution gets poached by US firms. Screening occurs through a variety ofmechanisms including repeated contact with a migrant’s prior employer but – crucially– screening has also gone alongside relatively large cross border movement of Indiansoftware workers. Although, it appears that part of the top talent in the sector has indeedmoved out of India, this has been accompanied by substantial temporary migration ofskilled workers. Indeed, the share of skilled workers with some foreign work experienceis strongly and positively correlated with the current and lagged incidence of skilledmigration in the Indian firms in the sample. This suggests the presence of networkeffects. Further, the data provide no evidence of any significant negative impact ofmigration on performance in the Indian firms. The survey also provides evidence thatmigrants send remittances, engage in return investment as well as firms benefiting fromenhanced commercial and other links with firms in developed countries. Putting thesefactors together suggests that despite the high skill content of software migration, thenet consequences have been positive for the sending country, India. Moreover, the sur-vey also provides some additional support for the view that the industry’s growth inIndia has been accompanied by a strong educational response, not least through theentry of new private providers targeting the provision of sector specific skills. Whilethis is not the same as relating migration directly to education decisions, it seems rea-sonable to suppose that migratory flows have played a positive role in raising educa-tional enrolments and supply. In short, the software example – unlike that of the doctors– provides a more positive view of the consequences of migration, as well as highlight-ing the different types of migration.
SIMON COMMANDER, MARI KANGASNIEMI AND L. ALAN WINTERS
7 See Commander et al (2004).
39

3. REMITTANCES, DIASPORAS AND RETURN FLOWS
It is has long been recognised that any adverse consequences of skilled emigration might bepartly or wholly offset by remittances, the creation of diasporas and return migration. Thesoftware case dealt with above provides an instance of why these factors may be important.However, to look at these questions more systematically is less easy, given data limitations.
Concerning remittances, aside from considerable imprecision in the aggregate numbers,it is not possible to separate out the volume of remittances coming from migrants of dif-ferent skill groups8. Such information as is available confirms that remittances varysystematically with respect to income, conditions in the sending country, planned dura-tion of stay and household attributes9. It is likely that remittances from highly skilledmigrants follow a very different pattern from those of low skilled migrants.
As to return migration, a positive channel would occur when migrants return with experi-ence, financial resources, links to networks and skills from a stay abroad that are then pro-ductively deployed at home. There is some evidence that return migrants tend to chooseself-employment or entrepreneurial activity not least because their savings diminish cred-it constraints. For example, Dustmann and Kirchkamp (2001) have studied returningTurkish migrants and their choice of activity and migration duration as a simultaneousdecision. They find that most returnees choose self-employment or non-employment, andthat highly educated individuals are more likely to be active after return. Ilahi (1999) findsthat the level of savings is positively correlated with the choice of self-employment onreturn, while McCormick and Wahba (2001) use survey data to show that duration of stayoverseas along with savings increases the probability of becoming an entrepreneur for lit-erate return migrants, which would suggest that skills obtained overseas have are usefulon return. Positive effects from return migration obviously also depend in part on a vari-ety of factors, including government policy in the sending or home country (see Castles(2000); Dustmann (1996), or concern for the offspring’s future, Dustmann (2001).
Another important aspect of return migration is the possibility that it is a result ofscreening of the migrants. Borjas and Bratsberg (1996) have studied the out-migrationdecisions of foreign-born people in the USA, and conclude that return migration accen-tuates the type of selection that generated the immigrant flow. In other words, if emi-grants represent the high end of the skill distribution in the source country, the returneesare the least skilled of the emigrants. Cohen and Haberfeld (2001) also find that Israeliimmigrants returning from the United States are likely to be negatively selected fromthose Israelis who emigrated in the first place. Reagan and Olsen (2000) on the otherhand do not find any skill bias in return migration in their study on the NationalLongitudinal Survey, when skill is measured with Armed Forces Qualifying Test.
THE BRAIN DRAIN: A REVIEW OF THEORY AND FACTS
8 Remittances are discussed in detail and existing research reviewed in Puri and Ritzema (2000). The World Bank(2001) offers some recent data and discussion.
9 For example, Straubhaar (1986) for a study of remittances to Turkey.
40

Other related research suggests that aspects that do not require return migration ofskilled individuals, can be of major importance. Such channels for beneficial effects areexports, business and network links related to diaspora populations. There is evidencethat such diaspora can have very beneficial effect on exports – for example, (Rauch1999, Rauch and Trinidade, 2000). Similarly, foreign direct investment and venturecapital – particularly in the recent period - have often been related to ethnic networks.An example of this is the Hsinchu Science park in Taipei, where a large fraction of com-panies have been started by returnees from the United States (Luo and Wang 2001).There is evidence – already alluded to - of these types of network effects being quitepowerful in the Indian software industry.
CONCLUSION
The brain drain and its consequences for developing countries continues to attract dis-cussion and debate. This paper has reviewed the ways in which economists have thoughtabout skilled migration over the last forty years. While early generation models weremostly static and focussed on the labour market consequences of migration, they alsoplaced emphasis on the fiscal implications of migrants having had their education pro-vided for by public funds. Depending on the precise structure of the model, both suchfinancing costs and labour market distortions could generate a negative effect of skilledmigration. Interestingly, however, this literature was largely devoid of empirical contentand validation. Proposals for the use of tax instruments to limit migration or, at the least,ensure that the benefits were not appropriated completely by the migrant and developedcountry, similarly found little, if any, application in practice.
The revival of discussion of the brain drain – mostly in the latter half of the 1990s –was prompted in part by the explicit use of visa and other programmes to encourageskilled workers to move to developed countries. However, the linking of migration toendogenous growth theory – through changes in education incentives and their impli-cations for human capital formation – also permitted new insights and suggested thatskilled migration need not necessarily be adverse for the sending country. However, thisliterature has also suffered from having limited empirical support or content.
A number of recent attempts to implement empirical work in this area are reported in thepaper. The findings – probably not surprisingly – are far from conclusive. They do how-ever strongly suggest that both sector and country size are likely to matter in determiningwhether skilled migration has had positive or negative consequences for the sending coun-try. At risk of simplification, smaller countries are likely to be hit harder than large onesby skilled migration. In terms of sector, the cases of health (doctors) and software giverather different results. In the first, it is hard to sustain the view that education incentivesare strong enough to offset other effects. In the software instance, this is not the case, notleast because the nature of the migration that is occurring has itself been changing. Thechallenge remains to give greater empirical content to this discussion.
SIMON COMMANDER, MARI KANGASNIEMI AND L. ALAN WINTERS
41
REFERENCES
Arora, A., V. Arunachalam, J. Asundi and R. Fernandes, 2001. “The Indian softwareservices industry”, Research Policy, 30, pp.1267-1287.Arrow, Kenneth J. 1973. “Higher Education as a Filter”, Journal of Public Economics,2(3), pp. 193-216.Beine M., F. Docquier and H. Rapoport, 2001a. “Brain drain and economic growth: the-ory and evidence”, Journal of Development Economics, 64(1) pp. 275-89.Beine M., F. Docquier and H. Rapoport, 2001b. “Brain drain and growth in LDCs:winners and losers”, Paper presented at European Economic Association Congress,August.Bhagwati J.N., Hamada Koichi, 1974. “The Brain Drain, International Integration ofMarkets for Professionals and Unemployment: A Theoretical Analysis”, Journal ofDevelopment Economics 1(1), pp.19-42.Borjas G. J. & B. Bratsberg, 1996. “Who leaves? The outmigration of the foreign-born”,Review of Economics and Statistics 78(1), pp. 165-76.Bratsberg B., 1995. “The incidence of non-return among foreign students in the UnitedStates”, Economics of Education Review 14(4), pp. 373-84.Castles S., 2000. “The Impacts of Emigration on Countries of Origin”, In Yusuf, Shahid,Wu, Weiping, and Evenett, Simon (eds.): “Local Dynamics in an Era of Globalisation”,The World Bank.Carrington W.J. and E. Detragiache, 1998. “How Big is the Brain Drain?”, IMFWorking paper no. 201.Cohen Y. and Haberfeld Yitchak, 2001. “Self-Selection and Return Migration: Israeli-Born Jews Returning Home from the United States During the 1980s”, Population Studies55(1), pp. 79-91.Commander S., M. Kangasniemi and L.A. Winters, 2004. “Who gains from skilledmigration? Evidence from the software industry”, London Business School, January.Dahlman C. J. and J.E.Aubert, 2001. “China and the Knowledge Economy. Seizing the21st Century”, WBI Development Studies, World Bank Institute.Dos Santos M. and F. Postel-Vinay, 2003. “Migration as a Source of Growth: ThePespective of a Developing Country”, Journal of Population Economics, 16(1) 161.Dustmann Ch., 2001. “Children and Return Migration”, University College, London,mimeo. Dustmann Ch. And O. Kirchkamp, 2001. “The Optimal Migration Duration andActivity Choice after Re-migration”, IZA Discussion Paper No. 266.Hamada K. and J.N. Bhagwati, 1975. “Domestic Distortions, Imperfect Information andthe Brain Drain”, Journal of Development Economics, 2(3), pp. 265-79.“Health information of India, 1998”. India, Central Bureau of Health Intelligence.“Health information of India, 1996”. India, Central Bureau of Health Intelligence.Ilahi N., 1999. “Return migration and occupational change”, Review of DevelopmentEconomics, 3(2), pp. 170-86.Immigration and Naturalization Service, U.S. Department of Justice, 1999.“Statistical Yearbook of the Immigration and Naturalization Service”.Immigration and Naturalization Service, U.S. Department of Justice, 1998.“Statistical Yearbook of the Immigration and Naturalization Service”.
THE BRAIN DRAIN: A REVIEW OF THEORY AND FACTS
42
Immigration and Naturalization Service, U.S. Department of Justice, 1996.“Statistical Yearbook of the Immigration and Naturalization Service”.Jasso G., M.R. Rosenzweig and J.P. Smith, 2000. “The Changing Skill of NewImmigrants to the United States: Recent Trends and Their Determinants”, Issues in theeconomics of immigration, pp. 185-255, National Bureau of Economic ResearchConference Report. Chicago and London: University of Chicago Press.Jasso G., D. S. Massey, M.R. Rosenzweig and J.P. Smith, 2000. “The New ImmigrantSurvey Pilot Study: Overview and New Findings About U.S. Legal Immigrants atAdmission,” Demography, 37, pp. 127-138.Jayaram N., 1995. “Political Economy of Medical Education in India”, Higher EducationPolicy, 8(2).Johnson H.G., 1967. “Some economic aspects of the brain drain”, PakistaniDevelopment Review, 7, pp. 379-411. Johnstone D.B., A. Arora and W. Experton, 1998. “The Financing and Management ofHigher Education: A Status Report on Worldwide Reforms”, World Bank.Kangasniemi M., L.A. Winters and S. Commander, 2003. “Is the Medical Brain DrainBeneficial? Evidence from Overseas Doctors in the UK”, Centre for EconomicPerformance Discussion Paper, London School of Economics.Kumar Nagesh, 2000. “Developing Countries in International Division of Labour inSoftware and Service Industries: Lessons from Indian Experience”. Background paperprepared for International Labour Organisation (2001): World Employment Report,Geneva.Luo Y.L. and W.J. Wang, 2001. “High-Skill Migration and Chinese Taipei’s IndustrialDevelopment”, In OECD (2001b).McCormick B. and J. Wahba, 2001. “Overseas work experience, savings and entrepre-neurship amongst return migrants to LDCs”, Scottish Journal of Political Economy, 48(2),pp. 164-78.Mountford A, 1997. “Can a brain drain be good for growth in the source economy?”,Journal of Development Economics, 53(2), pp. 287-303.OECD, 2001. “Trends in International Migration”, OECD, Paris.OECD, 2001b. “International Mobility of Highly Skilled”, OECD, Paris.Pritchett L., 2001. “Where has all the education gone?”, World Bank Economic Review,15(3), pp. 367-391.Puri S. and T. Ritzema, 2000. “Migrant Worker Remittances, Micro-finance and theInformal Economy: Prospects and Issues”, International Labour Office, Social FinanceUnit, Working Paper 21.Rauch J.E., 1999. “Networks vs. markets in international trade”, Journal of InternationalEconomics, 48(1), pp. 7-35.Rauch J.E. and V. Trindade, 1999. “Ethnic Chinese Networks in International Trade”,National Bureau of Economic Research Working Paper 7189.Reagan P.B. and R.J. Olsen, 2000. “You can go home again: evidence from longitudinaldata”, Demography, 37(3), pp. 339-50.Salim A.A., 1996. “Institutional cost of higher education – A case study of Kerala”,Manpower Journal, Vol. 32(1), pp. 1-14.Spence A.M, 1974. “Competitive and Optimal Responses to Signals: An Analysis ofEfficiency and Distribution”, Journal of Economic Theory, 7(3), pp.296-332.
SIMON COMMANDER, MARI KANGASNIEMI AND L. ALAN WINTERS
43
Stark O., C. Helmenstein and A. Prskawetz, 1997. “A brain gain with a brain drain”,Economics Letters, 55(3), 227-34.Stark O., C. Helmenstein and A. Prskawetz, 1998. “Human capital depletion, humancapital formation, and migration: a blessing or a curse?”, Economics Letters, v60, n3(September), pp. 363-67.Stark O. and Y. Wang, 2002. “Inducing Human Formation: migration as a substitute forsubsidies”, Journal of Public Economics, 86(1), 29-46.Straubhaar T., 1986. “The Determinants of Workers’ Remittances: The Case of Turkey”,Weltwirtschaftliches Archiv, 122(4), pp. 728-40.Tilak J.B.G., 1997. “The dilemma of reforms in financing higher education in India”,Higher Education Policy, 10(1), pp. 7-21.Vidal J.P., 1998. “The effect of emigration on human capital formation”, Journal ofPopulation Economics, 11(4), pp. 589-600.Winters L.A., T.L. Walmsley, Z.K. Wang and R. Grynberg, 2002. “Negotiating theLiberalisation of the Temporary Movement of Natural Persons”, CommonwealthSecretariat, London.World Bank, 2001. “World Development Indicators”, World Bank, Washington DC.
THE BRAIN DRAIN: A REVIEW OF THEORY AND FACTS
44
SELECTIVE IMMIGRATION POLICY IN AUSTRALIA,CANADA AND THE UNITED STATES
HEATHER ANTECOL* (CLAREMON MCKENNA COLLEGE),DEBORAH A. COBB-CLARK** (THE AUSTRALIAN NATIONAL UNIVERSITY)
AND STEPHEN J. TREJO*** (UNIVERSITY OF TEXAS)
ABSTRACT:We compare the selective immigration policies in Australia, Canada and the United States over the twen-tieth century and as they exist today. We then review existing information about the link between selectiveimmigration policy and immigration outcomes in the three countries. The literature reviewed suggests thatthere does seem to be potential for selective immigration policy to affect immigrant outcomes by alteringthe skill levels of immigrants. Still, it is clear that other forces are at work as well. Historical accidents,social forces, and simple geography may all have a hand in shaping traditional migration patterns, whilelabor market conditions—in particular the relative return to skill—are likely to be as important as policyin producing migration incentives.
JEL CLASSIFICATION: F22, J24, J61, J68.
KEYWORDS: skilled migration, immigration policy.
BRUSSELS ECONOMIC REVIEW - CAHIERS ECONOMIQUES DE BRUXELLESVOL. 47 - N°1 SPRING 2004
* Department of Economics, Claremont Mc Kenna College, Claremont, CA 91711, [email protected]
** Social Policy Research, Evaluation and Analysis Centre and Economics Program, Research School of SocialSciences, the Australian National University, Canberra, ACT 0200 Australia. [email protected]
*** Department of Economics, University of Texas at Austin, University Station C3100, Austin TX [email protected]
45

INTRODUCTION
Through the years Australia, Canada, and the United States have been the destinationsfor large numbers of immigrants. While the magnitude of the immigration flow and thecharacteristics of immigrants themselves have varied between these three nations andover time, it is hard to deny that immigration has had a major hand in shaping the iden-tity of each. The similarities (and dissimilarities) in the experiences of these countrieshave provided researchers with excellent opportunities to analyze the role of selectiveimmigration policy itself in influencing immigration outcomes. This has been an impor-tant area of policy-related research as immigration is the one component of populationand labor market growth that comes most directly under the control of policy makers.
This paper will begin by briefly comparing selective immigration policies in Australia,Canada, and the United States over the twentieth century. Although temporary migration hasbecome an increasingly important demographic and labor market phenomenon, our focuswill be on the selection of permanent residents. Emphasis will be placed on comparing theimplications of various regulations and policies for the skill composition of the immigrantstream. We are specifically interested in comparing the selective immigration programs ofthese three countries as they exist today. Finally, we review existing information about thelink between selective immigration policy and immigration outcomes in the three countries.
1. SELECTIVE IMMIGRATION POLICY THROUGH THE YEARS
Prior to the twentieth century both Canada and the United States essentially operated an‘open door’ immigration policy.1 Needing people to push back the frontier, populate thecountry and defend the borders, Canada and the United States stood ready to receive newimmigrants and, overcrowded, Europe stood ready to send them. Other than a few policiesto deny entry to the sick, destitute or criminal, immigration was essentially unrestricted.The primary exception to this was the Chinese Exclusion Act of 1882 that limited theentry of immigrants from that country to the United States and made national origin anexplicit condition of entry for the first time (Vialet, 1989).2 Similar legislation was passedin Canada in 1885 (Green, 1995). Enormous increases in the numbers of immigrants inthe early part of the twentieth century resulted in both Canada and the United States pass-ing legislation that established a process for regulating immigration (specifically limitingimmigration through the use of quotas in the case of the United States) and expanded theuse of national origin as a selection criterion. Canada made a distinction between “pre-ferred” (Britain, the United States, and northwest Europe) and “nonpreferred” countries(Green, 1995) while the United States distributed visas based on the national origin of theforeign-born population enumerated in the 1920 U.S. Census (Cobb-Clark, 1990).3
SELECTIVE IMMIGRATION POLICY IN AUSTRALIA, CANADA AND THE UNITED STATES
1 Much of the historical overview of immigration policy in this section is based on Vialet (1989) and Cobb-Clark(1990) for the United States, Green (1995) and Green and Green (1995; 1999) for Canada, and Lack andTempleton (1995) for Australia.
2 See Chiswick (1986) for a review of U.S. immigration policy with respect to Asia.3 Although this policy had been intended to maintain the ethnic balance, it failed to do so mainly because the coun-
tries with the largest quotas left them largely unused (Cobb-Clark, 1990).
46
Australia’s immigration policy evolved in much the same way as in the United Statesand Canada, although as expected given her relative youth, at somewhat later dates.Restrictions on Chinese migration following violence in the gold fields in the 1850’swere the origins of the “White Australia” policy (Miller, 1999). Between Federation in1901 and World War II (WWII), Australia’s focus was directed mainly towards retain-ing a British identity through British immigration. Australia lost a higher percentage ofher young men during WWII than any other participating nation (Parcell, et al., 1994),and this combined with a feeling of geographic isolation from Britain gave rise in 1945to a mass immigration campaign launched with the slogan “Populate or Perish” (Lackand Templeton, p. xiii, 1995). While British settlers who continued to be preferredwould receive passage assistance, it was also recognized that Britain alone was unlike-ly to meet the demand for new immigrants. Thus, the Government set out to expand theimmigrant base to include those from other European countries. There was little scope,however, for Asian immigration.
National origin continued to play an important role in the immigration policies of allthree countries until the 1960s when the discriminatory nature of the national originsphilosophy was called into question. Canada began turning away from national originand towards individual characteristics as selection criteria in 1962 (Green, 1995; Greenand Green, 1999), the United States followed in 1965 (Briggs, 1984), and Australia’s“White Australia Policy” ended in 1973 (CAAIP, 1987).
These changes in selection policies presented an important policy challenge forAustralia, Canada, and the United States because whereas the assessment of nationalorigin had been straightforward, the assessment of individual characteristics was not.Each country struggled to find the appropriate balance between the desire to first,reunite families, second, increase the skill base of the population, and third, meethumanitarian responsibilities through the acceptance of refugees. The U.S. systemgave more weight to the reunification of families, with relatively few visas (approxi-mately 20 percent) reserved for immigrants selected on the basis of their labor mar-ket skills. Australia and Canada placed relatively more weight on encouraging skilledmigration with Canada first introducing a points test for judging the admissibility ofskilled immigrants in 1967 (Green, 1995, Green and Green, 1995; 1999) andAustralia following in the late 1970s (Birrell, 1990). Though the intervening yearssaw many changes in the specifics of each country’s immigration program, the basicframework adopted by each country as selection on the basis of national origin endedremains today.
2. SELECTIVE IMMIGRATION POLICY TODAY
Australia’s immigration program is modeled on Canada’s and, with minor exceptions,the policies of the two countries are broadly the same (Clarke, 1994). Both Australia andCanada separate nonhumanitarian immigration into two components: one based onclose family relationships with citizens or permanent residents and the other based on
HEATHER ANTECOL, DEBORAH A. COBB-CLARK AND STEPHEN J. TREJO
47
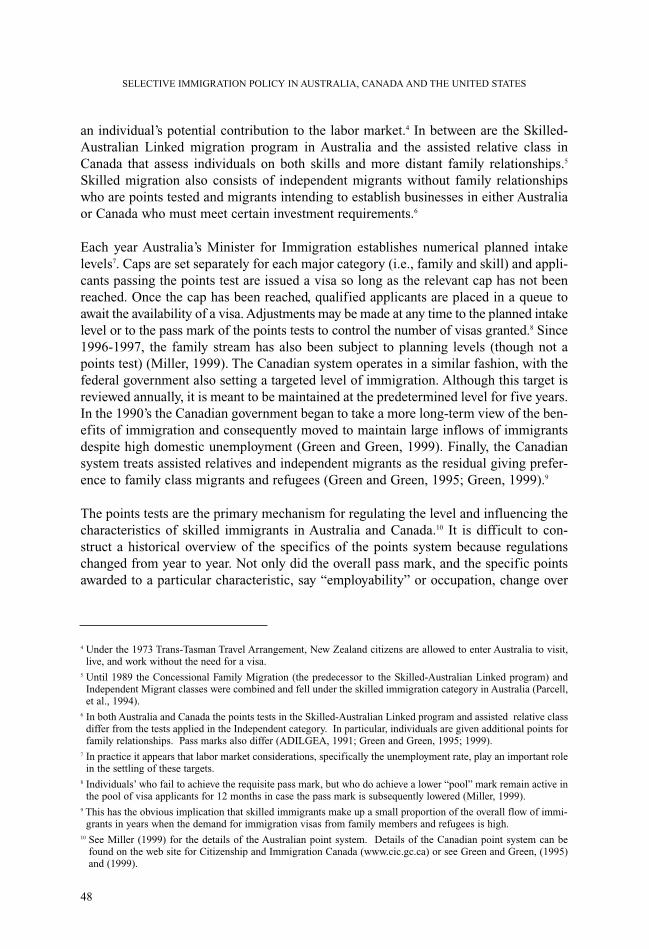
an individual’s potential contribution to the labor market.4 In between are the Skilled-Australian Linked migration program in Australia and the assisted relative class inCanada that assess individuals on both skills and more distant family relationships.5
Skilled migration also consists of independent migrants without family relationshipswho are points tested and migrants intending to establish businesses in either Australiaor Canada who must meet certain investment requirements.6
Each year Australia’s Minister for Immigration establishes numerical planned intakelevels7. Caps are set separately for each major category (i.e., family and skill) and appli-cants passing the points test are issued a visa so long as the relevant cap has not beenreached. Once the cap has been reached, qualified applicants are placed in a queue toawait the availability of a visa. Adjustments may be made at any time to the planned intakelevel or to the pass mark of the points tests to control the number of visas granted.8 Since1996-1997, the family stream has also been subject to planning levels (though not apoints test) (Miller, 1999). The Canadian system operates in a similar fashion, with thefederal government also setting a targeted level of immigration. Although this target isreviewed annually, it is meant to be maintained at the predetermined level for five years.In the 1990’s the Canadian government began to take a more long-term view of the ben-efits of immigration and consequently moved to maintain large inflows of immigrantsdespite high domestic unemployment (Green and Green, 1999). Finally, the Canadiansystem treats assisted relatives and independent migrants as the residual giving prefer-ence to family class migrants and refugees (Green and Green, 1995; Green, 1999).9
The points tests are the primary mechanism for regulating the level and influencing thecharacteristics of skilled immigrants in Australia and Canada.10 It is difficult to con-struct a historical overview of the specifics of the points system because regulationschanged from year to year. Not only did the overall pass mark, and the specific pointsawarded to a particular characteristic, say “employability” or occupation, change over
SELECTIVE IMMIGRATION POLICY IN AUSTRALIA, CANADA AND THE UNITED STATES
4 Under the 1973 Trans-Tasman Travel Arrangement, New Zealand citizens are allowed to enter Australia to visit,live, and work without the need for a visa.
5 Until 1989 the Concessional Family Migration (the predecessor to the Skilled-Australian Linked program) andIndependent Migrant classes were combined and fell under the skilled immigration category in Australia (Parcell,et al., 1994).
6 In both Australia and Canada the points tests in the Skilled-Australian Linked program and assisted relative classdiffer from the tests applied in the Independent category. In particular, individuals are given additional points forfamily relationships. Pass marks also differ (ADILGEA, 1991; Green and Green, 1995; 1999).
7 In practice it appears that labor market considerations, specifically the unemployment rate, play an important rolein the settling of these targets.
8 Individuals’ who fail to achieve the requisite pass mark, but who do achieve a lower “pool” mark remain active inthe pool of visa applicants for 12 months in case the pass mark is subsequently lowered (Miller, 1999).
9 This has the obvious implication that skilled immigrants make up a small proportion of the overall flow of immi-grants in years when the demand for immigration visas from family members and refugees is high.
10 See Miller (1999) for the details of the Australian point system. Details of the Canadian point system can befound on the web site for Citizenship and Immigration Canada (www.cic.gc.ca) or see Green and Green, (1995)and (1999).
48
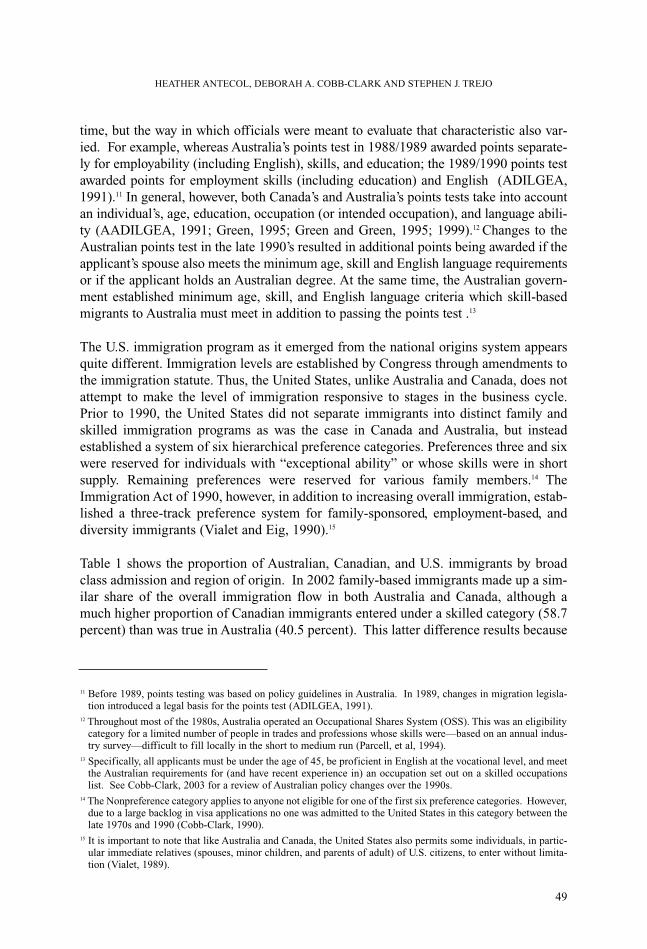
time, but the way in which officials were meant to evaluate that characteristic also var-ied. For example, whereas Australia’s points test in 1988/1989 awarded points separate-ly for employability (including English), skills, and education; the 1989/1990 points testawarded points for employment skills (including education) and English (ADILGEA,1991).11 In general, however, both Canada’s and Australia’s points tests take into accountan individual’s, age, education, occupation (or intended occupation), and language abili-ty (AADILGEA, 1991; Green, 1995; Green and Green, 1995; 1999).12 Changes to theAustralian points test in the late 1990’s resulted in additional points being awarded if theapplicant’s spouse also meets the minimum age, skill and English language requirementsor if the applicant holds an Australian degree. At the same time, the Australian govern-ment established minimum age, skill, and English language criteria which skill-basedmigrants to Australia must meet in addition to passing the points test .13
The U.S. immigration program as it emerged from the national origins system appearsquite different. Immigration levels are established by Congress through amendments tothe immigration statute. Thus, the United States, unlike Australia and Canada, does notattempt to make the level of immigration responsive to stages in the business cycle.Prior to 1990, the United States did not separate immigrants into distinct family andskilled immigration programs as was the case in Canada and Australia, but insteadestablished a system of six hierarchical preference categories. Preferences three and sixwere reserved for individuals with “exceptional ability” or whose skills were in shortsupply. Remaining preferences were reserved for various family members.14 TheImmigration Act of 1990, however, in addition to increasing overall immigration, estab-lished a three-track preference system for family-sponsored, employment-based, anddiversity immigrants (Vialet and Eig, 1990).15
Table 1 shows the proportion of Australian, Canadian, and U.S. immigrants by broadclass admission and region of origin. In 2002 family-based immigrants made up a sim-ilar share of the overall immigration flow in both Australia and Canada, although amuch higher proportion of Canadian immigrants entered under a skilled category (58.7percent) than was true in Australia (40.5 percent). This latter difference results because
HEATHER ANTECOL, DEBORAH A. COBB-CLARK AND STEPHEN J. TREJO
11 Before 1989, points testing was based on policy guidelines in Australia. In 1989, changes in migration legisla-tion introduced a legal basis for the points test (ADILGEA, 1991).
12 Throughout most of the 1980s, Australia operated an Occupational Shares System (OSS). This was an eligibilitycategory for a limited number of people in trades and professions whose skills were—based on an annual indus-try survey—difficult to fill locally in the short to medium run (Parcell, et al, 1994).
13 Specifically, all applicants must be under the age of 45, be proficient in English at the vocational level, and meetthe Australian requirements for (and have recent experience in) an occupation set out on a skilled occupationslist. See Cobb-Clark, 2003 for a review of Australian policy changes over the 1990s.
14 The Nonpreference category applies to anyone not eligible for one of the first six preference categories. However,due to a large backlog in visa applications no one was admitted to the United States in this category between thelate 1970s and 1990 (Cobb-Clark, 1990).
15 It is important to note that like Australia and Canada, the United States also permits some individuals, in partic-ular immediate relatives (spouses, minor children, and parents of adult) of U.S. citizens, to enter without limita-tion (Vialet, 1989).
49
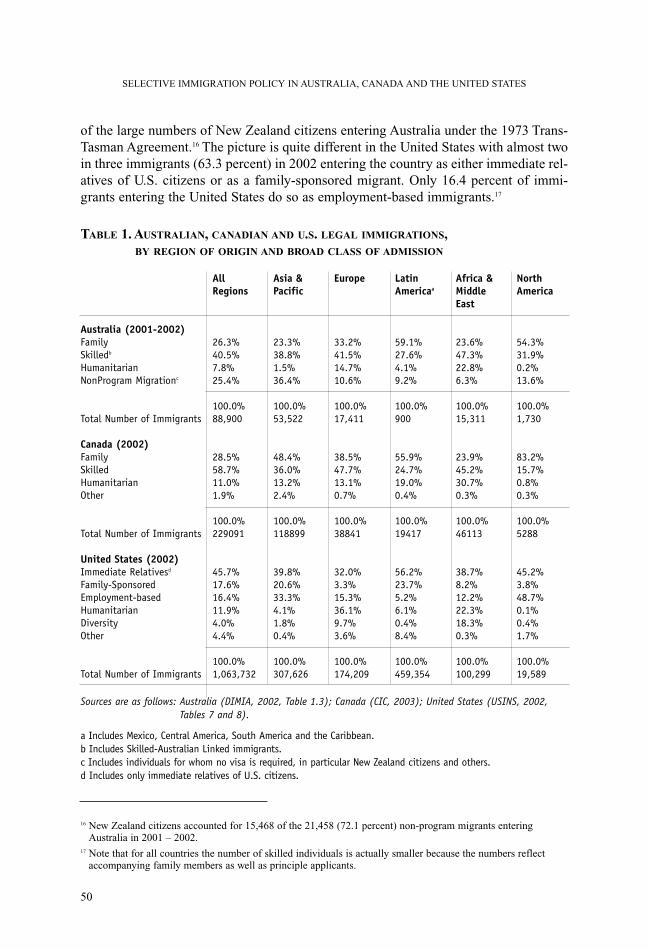
of the large numbers of New Zealand citizens entering Australia under the 1973 Trans-Tasman Agreement.16 The picture is quite different in the United States with almost twoin three immigrants (63.3 percent) in 2002 entering the country as either immediate rel-atives of U.S. citizens or as a family-sponsored migrant. Only 16.4 percent of immi-grants entering the United States do so as employment-based immigrants.17
TABLE 1. AUSTRALIAN, CANADIAN AND U.S. LEGAL IMMIGRATIONS,BY REGION OF ORIGIN AND BROAD CLASS OF ADMISSION
Sources are as follows: Australia (DIMIA, 2002, Table 1.3); Canada (CIC, 2003); United States (USINS, 2002,Tables 7 and 8).
a Includes Mexico, Central America, South America and the Caribbean.b Includes Skilled-Australian Linked immigrants. c Includes individuals for whom no visa is required, in particular New Zealand citizens and others.d Includes only immediate relatives of U.S. citizens.
SELECTIVE IMMIGRATION POLICY IN AUSTRALIA, CANADA AND THE UNITED STATES
16 New Zealand citizens accounted for 15,468 of the 21,458 (72.1 percent) non-program migrants enteringAustralia in 2001 – 2002.
17 Note that for all countries the number of skilled individuals is actually smaller because the numbers reflectaccompanying family members as well as principle applicants.
Australia (2001-2002)FamilySkilledb
HumanitarianNonProgram Migrationc
Total Number of Immigrants
Canada (2002)FamilySkilledHumanitarianOther
Total Number of Immigrants
United States (2002)Immediate Relativesd
Family-SponsoredEmployment-basedHumanitarianDiversityOther
Total Number of Immigrants
AllRegions
26.3%40.5%7.8%25.4%
100.0%88,900
28.5%58.7%11.0%1.9%
100.0%229091
45.7%17.6%16.4%11.9%4.0%4.4%
100.0%1,063,732
Asia & Pacific
23.3%38.8%1.5%36.4%
100.0%53,522
48.4%36.0%13.2%2.4%
100.0%118899
39.8%20.6%33.3%4.1%1.8%0.4%
100.0%307,626
Europe
33.2%41.5%14.7%10.6%
100.0%17,411
38.5%47.7%13.1%0.7%
100.0%38841
32.0%3.3%15.3%36.1%9.7%3.6%
100.0%174,209
LatinAmericaa
59.1%27.6%4.1%9.2%
100.0%900
55.9%24.7%19.0%0.4%
100.0%19417
56.2%23.7%5.2%6.1%0.4%8.4%
100.0%459,354
Africa & Middle East
23.6%47.3%22.8%6.3%
100.0%15,311
23.9%45.2%30.7%0.3%
100.0%46113
38.7%8.2%12.2%22.3%18.3%0.3%
100.0%100,299
NorthAmerica
54.3%31.9%0.2%13.6%
100.0%1,730
83.2%15.7%0.8%0.3%
100.0%5288
45.2%3.8%48.7%0.1%0.4%1.7%
100.0%19,589
50
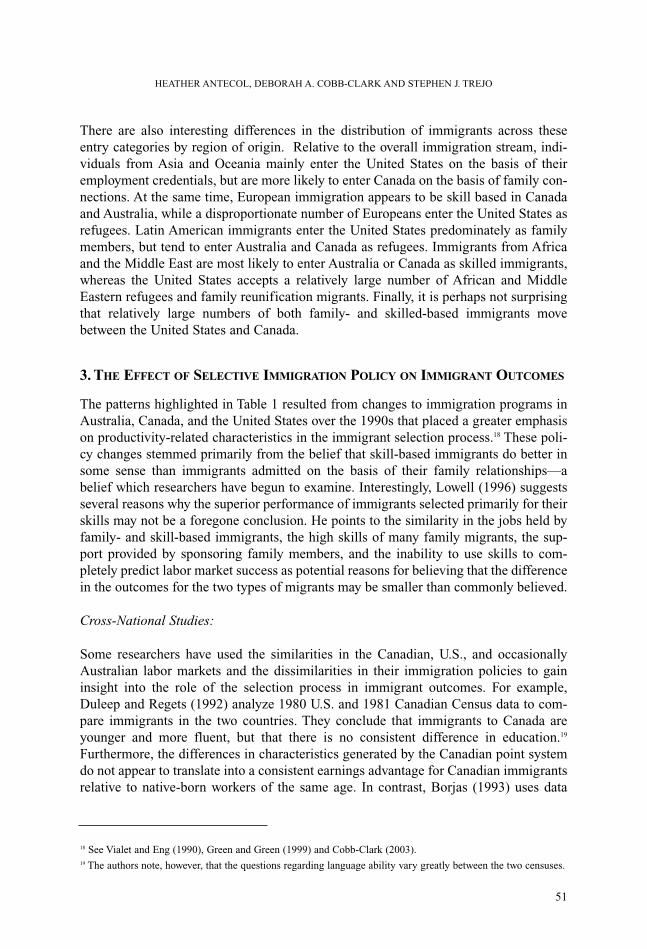
There are also interesting differences in the distribution of immigrants across theseentry categories by region of origin. Relative to the overall immigration stream, indi-viduals from Asia and Oceania mainly enter the United States on the basis of theiremployment credentials, but are more likely to enter Canada on the basis of family con-nections. At the same time, European immigration appears to be skill based in Canadaand Australia, while a disproportionate number of Europeans enter the United States asrefugees. Latin American immigrants enter the United States predominately as familymembers, but tend to enter Australia and Canada as refugees. Immigrants from Africaand the Middle East are most likely to enter Australia or Canada as skilled immigrants,whereas the United States accepts a relatively large number of African and MiddleEastern refugees and family reunification migrants. Finally, it is perhaps not surprisingthat relatively large numbers of both family- and skilled-based immigrants movebetween the United States and Canada.
3. THE EFFECT OF SELECTIVE IMMIGRATION POLICY ON IMMIGRANT OUTCOMES
The patterns highlighted in Table 1 resulted from changes to immigration programs inAustralia, Canada, and the United States over the 1990s that placed a greater emphasison productivity-related characteristics in the immigrant selection process.18 These poli-cy changes stemmed primarily from the belief that skill-based immigrants do better insome sense than immigrants admitted on the basis of their family relationships—abelief which researchers have begun to examine. Interestingly, Lowell (1996) suggestsseveral reasons why the superior performance of immigrants selected primarily for theirskills may not be a foregone conclusion. He points to the similarity in the jobs held byfamily- and skill-based immigrants, the high skills of many family migrants, the sup-port provided by sponsoring family members, and the inability to use skills to com-pletely predict labor market success as potential reasons for believing that the differencein the outcomes for the two types of migrants may be smaller than commonly believed.
Cross-National Studies:
Some researchers have used the similarities in the Canadian, U.S., and occasionallyAustralian labor markets and the dissimilarities in their immigration policies to gaininsight into the role of the selection process in immigrant outcomes. For example,Duleep and Regets (1992) analyze 1980 U.S. and 1981 Canadian Census data to com-pare immigrants in the two countries. They conclude that immigrants to Canada areyounger and more fluent, but that there is no consistent difference in education.19
Furthermore, the differences in characteristics generated by the Canadian point systemdo not appear to translate into a consistent earnings advantage for Canadian immigrantsrelative to native-born workers of the same age. In contrast, Borjas (1993) uses data
HEATHER ANTECOL, DEBORAH A. COBB-CLARK AND STEPHEN J. TREJO
18 See Vialet and Eng (1990), Green and Green (1999) and Cobb-Clark (2003).19 The authors note, however, that the questions regarding language ability vary greatly between the two censuses.
51

from two censuses for each country to compare the experiences of immigrants. As aresult, he is able to focus on the effects of structural changes in policy, in particular theintroduction of the point system in Canada, on immigrant characteristics. He concludesthat the point system “attracted” more educated immigrants, because it altered thenational origin mix of Canadian immigration not because the expected wages or skillsof any particular national origin group were higher in Canada.
Antecol, Cobb-Clark, and Trejo (2003a) and (2003b) re-examine this issue usingAustralian, Canadian, and U.S. data. Like Borjas (1993) they find that much of the dif-ference in the skills of immigrants across these countries lies in the large numbers ofrelatively unskilled individuals from Mexico, Central and South America in the U.S.immigration stream. Interestingly, the cross-national patterns are similar for men andwomen even though women are much less likely than men to gain immigrant statusthrough assessment of their labor-market skills. Thus, the authors conclude that factorsother than immigration policy per se—i.e., geographic, historical, and or social expla-nations—are also important in contributing to the observed cross-national differencesin immigrant skills.20
Longitudinal Evidence:
The difficulty with using the stock of immigrants to assess the impact of policy is thatthe skills of the immigrant population are the result of a complex interaction in thedemand for and supply of immigrants (Chiswick, 1987; Cobb-Clark, 1993; Cobb-Clarkand Connolly, 1997). While immigration policy (specifically, regulations regardingimmigrant selection or efforts to reduce illegal migration) may be thought of as thedemand for immigrants, other historical, social or economic forces (for example, wars,relative economic conditions, or the geographic location of ones relatives) determine thesupply of potential immigrants. The observed skills of the immigrant stock at a pointin time are determined by demand, supply, and selective remigration. Previous analy-ses of immigrant stocks often ignore the supply or remigration effects, attributing dif-ferences between immigrant populations in different countries to differences in demand(or policy).21
An alternative methodology uses time series data on immigrant flows to gauge theimpact of policy changes. Green and Green (1995) construct a series of quarterlydata on the intended occupations of Canadian immigrants. Their use of entry data
SELECTIVE IMMIGRATION POLICY IN AUSTRALIA, CANADA AND THE UNITED STATES
20 Chiswick (1987) also uses Census data for Australia, Canada, and the United States to analyze changes over timein the source countries of immigrants and in immigrant skills. He concludes that in general immigrants fromnewer source countries do less well than immigrants from more traditional sources. See Chiswick (1986) for amore detailed analysis for the United States.
21 To some extent, Duleep and Regets (1992; 1996) deal with this problem by explicitly incorporating demandmeasures, i.e., the proportion of the cohort who enter the United States under an occupational preference cate-gory, into the analysis. They find that groups admitted primarily on the basis of family relationships have lowerearnings than groups admitted on the basis of their skills, but have higher earnings growth.
52
avoids the selective remigration problem encountered in the previous studies. Theauthors conclude that the introduction of the Canadian points test in 1967 had a largeand direct effect on occupational distribution of the immigrant flow.22 Green (1995)follows the same basic methodology as in Green and Green (1995), but comparesboth Canada and the United States. He agrees with Borjas (1993) that the Canadianpoints test effectively allowed Canada to block the entry of unskilled immigrants.His interpretation, unlike that of Borjas, is that with the exception of migration fromLatin America, Canada and the United States draw mainly from the same sourcecountries, but the composition of immigrant skills in the two countries has been verydifferent.
Studies of Individual Migrants:
Finally, there have been a limited number of studies that make use of individual datato evaluate the impact of policy on immigrant outcomes. Jasso and Rosenzweig(1995) use individual-level U.S. data on a sample of immigrants who received legalpermanent residence status in 1977 and had chosen to naturalize by 1990. Althoughthe data do not contain wage information, the authors are able to compare the occu-pational attainment at entry and naturalization for two groups of immigrants: thoseentering as spouses of U.S. citizens and those entering under third or sixth preference.They suggest that the occupational distribution for the third and sixth preferenceimmigrants is more skilled at entry, but over time the skills between the two groupsbecome more similar. This occurs both because of downward mobility amongemployment immigrants and upward mobility among marital immigrants.
Other researchers have matched U.S. Social Security earnings information to a sam-ple of aliens registered in the 1980 Alien Address Registration Program for whomvisa status is known (Sorensen, et al., 1992). Overall the authors conclude thatemployment-based immigrant have higher earnings and are more likely to be work-ing as professionals or managers. Still, in many other ways family-based andemployment-based immigrants appear similar. The two groups have similar labormarket attachments, naturalize at the same rate, and tend to make locational deci-sions based on the same factors.
Australian individual-level survey data point to large differences in the labor marketoutcomes of individuals in different visa categories, though these differentials large-ly appear to reflect the underlying characteristics of immigrants themselves ratherthan immigrant categories per se (Miller, 1999; Cobb-Clark, 2000). This is especial-ly true for established—as opposed to recent—immigrants. While the observablecharacteristics of individuals within visa categories do seem to be correlated, there
HEATHER ANTECOL, DEBORAH A. COBB-CLARK AND STEPHEN J. TREJO
22 In related work, Wright and Maxim (1993) find that increases in the proportion of a cohort entering Canada asindependent migrants is related to increases in relative entry wages. They find similar (though smaller in mag-nitude) effects for the proportion of a cohort holding family reunification visas.
53

is little unobserved heterogeneity associated with visa category. To the extent thatmigration programs operate by selecting individuals on the basis of readily observ-able characteristics, this is perhaps not surprising.
Finally, Cobb-Clark (2003) considers the relative capacity of immigration policy tofacilitate the migrant settlement process. She compares two cohorts—enteringAustralia five years apart—with dramatically different labor market outcomes. Theresults indicate that while changes in selective immigration policy may have led toincreased human capital endowments, as much as half of the fall in unemploymentrates among women and one third the decline among men appears to have occurredas the result of changes in the labor market returns to demographic and human cap-ital characteristics.
CONCLUSION
As major immigrant receiving nations, Australia, Canada and the United States haveprovided researchers with many opportunities to assess the extent to which selectiveimmigration policies influence the migration process. The literature reviewed abovesuggests that there does seem to be potential for selective immigration policy to affectimmigrant outcomes by altering the skill levels of immigrants. Still, it is clear that otherforces are at work as well. Historical accidents, social forces, and simple geography mayall have a hand in shaping traditional migration patterns, while labor market condi-tions—in particular the relative return to skill—are likely to be as important as policyin producing migration incentives. Furthermore, immigration policy cannot be made ina vacuum as evidence suggests that demand for visas to one country may be affected bythe immigration policy of another (Cobb-Clark and Connolly, 1997).
SELECTIVE IMMIGRATION POLICY IN AUSTRALIA, CANADA AND THE UNITED STATES
54

REFERENCES
Antecol H., D.A. Cobb-Clark and S.J. Trejo, 2003a. “Immigration Policy and theSkills of Immigrants to Australia, Canada, and the United States”, Journal of HumanResources, 38(1), Winter 2003, pp. 192 – 21.--------, 2003b. “The Skills of Female Immigrants to Australia, Canada, and the UnitedStates”, Host Societies and the Reception of Immigrants, Jeffrey G. Reitz (ed.), SanDiego: Center for Comparative Immigration Studies, forthcoming.Australian Department of Immigration, Local Government and Ethnic Affairs(ADILGEA), 1991. Efficiency Audit, Department of Immigration, Local Governmentand Ethnic Affairs, Audit Report No. 11, 1991 - 1992. Canberra: Australian GovernmentPrinting Service.Birrell R., 1990. The Chains that Bind: Family Reunion Migration to Australia in the1980s. Canberra: Australian Government Printing Service.Borjas G.J., 1993. “Immigration Policy, National Origin, and Immigrant Skills: AComparison of Canada and the United States” in Small Differences that Matter: LaborMarkets and Income Maintenance in Canada and the United States. David Card andRichard Freeman, editors. Chicago: University of Chicago Press: 21 - 44.Briggs Vernon. M. Jr., 1984. Immigration Policy and the American Labor Force.Baltimore: The Johns Hopkins University Press.Chiswick B.R., 1986. “Is the New Immigration Less Skilled than the Old?” Journal ofLabor Economics, 4(2): 169 - 192.-------- 1987. “Immigration Policy, Source Countries, and Immigrant Skills: Australia,Canada, and the United States” in The Economics of Immigration. Proceedings ofConference held at the Australian National University. Canberra: AustralianGovernment Printing Service.Citizenship and Immigration Canada (CIC), 2003. Facts and Figures: ImmigrationOverview 2002, Ottawa: Citizenship and Immigration Canada.Clarke H., 1994. The Rationale for Forward Planning and Stability in the MigrationProgram. Canberra: Australian Government Printing Service.Cobb-Clark D.A., 1990. Immigrant Selectivity: The Roles of Household Structure andU.S. Immigration Policy. PhD dissertation, Economics Department, University ofMichigan. Ann Arbor: University of Michigan.-------- 1993. “Immigrant Selectivity and Wages: The Evidence for Women.” TheAmerican Economic Review 83(4): 986 - 993.-----, 2000. “Do Selection Criteria Make a Difference? Visa Category and the LaborMarket Status of Immigrants to Australia. The Economic Record, 76(232), March.--------- 2003. “Public Policy and the Labor Market Adjustment of New Immigrants toAustralia”, Journal of Population Economics, forthcoming.Cobb-Clark D.A. and M.D. Connolly, 1997. “The Worldwide Market for SkilledImmigrants: Can Australia Compete?”, International Migration Review, Fall 1997,31(3), pp. 670-690.Committee to Advise on Australia’s Immigration Policies (CAAIP), 1987.Understanding Immigration. Canberra: Australian Government Printing Service.
HEATHER ANTECOL, DEBORAH A. COBB-CLARK AND STEPHEN J. TREJO
55

Department of Immigration and Multicultural and Idigenous Affairs (DIMIA),2002. Immigration Update: 2001 – 2002, September 2002. Canberra: AustralianGovernment Printing Service.Duleep H.O. and M.C. Regets, 1992. “Some Evidence on the Effects of AdmissionsCriteria on Immigrant Assimilation” in Immigration, Language and Ethnic Issues:Canada and the United States. Barry R. Chiswick, editor. Washington: AmericanEnterprise Institute: 410 - 439.Green A.G., 1995. “A Comparison of Canadian and US Immigration Policy in theTwentieth Century” in Diminishing Returns: The Economics of Canada's RecentImmigration Policy. D. J. DeVortez, editor. Toronto and Vancouver: C.D. Howe Instituteand The Laurier Institution.Green D.A., 1999. "Immigrant Occupational Attainment: Assimilation and Mobilityover Time". Journal of Labor Economics, 17(1): 49 - 79.-------- 1996. “Admission Criteria and Immigrant Earnings Profiles.” InternationalMigration Review 30(2): 571 - 590.Green A.G. and D.A. Green, 1995. “Canadian Immigration Policy: The Effectivenessof the Point System and Other Instruments.” Canadian Journal of Economics 28(4b):1006 - 1041.-----, 1999. “The Economics Goals of Canada’s Immigration Policy: Past and Present”,Canadian Public Policy, Vol. XXV, No. 4, pp. 425 – 451.Jasso G. and M.R. Rosenzweig, 1995. “Do Immigrants Screened for Skills Do Betterthan Family Reunification Immigrants?” International Migration Review 29(1): 85 - 111.Lack J. and J. Templeton, 1995. Bold Experiment: A Documentary History ofAustralian Immigration Since 1945. Melbourne: Oxford University Press.Lowell B.L., 1996. “Skill and Family-Based Immigration: Principles and LaborMarkets” in Immigrants and Immigration Policy: Individual Skills, Family Ties, andGroup Identities Harriet Orcutt Duleep and P. Wunnava, editors. Greenwich: JAI Press.Miller P.W., 1999. “Immigration Policy and Immigrant Quality: The Australian PointSystem”, American Economic Review, Vol. 89(2), May, pp. 192 – 197.Parcell W., L. Sparkes and L.S. Williams, 1994. A Brief Historical Outline of SkillMigration in Australia, 1980 - 93. Canberra: Australian Government Printing Service.Sorensen E., F.D. Bean, L. Ku, and W. Zimmermann, 1992. Immigrant Categoriesand The U.S. Job Market: Do They Make a Difference? Washington: The UrbanInstitute Press.U.S. Immigration and Naturalization Service (USINS), 2003. 2002 Yearbook ofImmigration Statistics. Washington: U.S. Government Printing Office.Vialet J.C., 1989. Immigration: Numerical Limits and the Preference System.Washington: Congressional research Service, Library of Congress.Vialet J.C. and L.M. Eig, 1990. Immigration Act of 1990 (P.L. 101-649). Washington:Congressional Research Service, Library of Congress.Wright R.E. and P.S. Maxim, 1993. “Immigration Policy and Immigrant Quality:Empirical Evidence from Canada”, Journal of Population Economics, 6, pp. 337 – 352.
SELECTIVE IMMIGRATION POLICY IN AUSTRALIA, CANADA AND THE UNITED STATES
56
THE DEMAND FOR HIGH-SKILLED WORKERS
AND IMMIGRATION POLICY
THOMAS K. BAUER* (RWI ESSEN, UNIVERSITY OF BOCHUM, IZA, BONN,AND CEPR, LONDON) AND ASTRID KUNZE** (NORWEGIAN SCHOOL OF
ECONOMICS AND BUSINESS ADMINISTRATION, BERGEN, AND IZA, BONN)
ABSTRACT:This paper provides a descriptive analysis of the demand for high-skilled workers using a new firm dataset, the IZA International Employer Survey 2000. Our results suggest that while workers from EU-coun-tries are mainly complements to domestic high-skilled workers, workers from non-EU countries are hiredbecause of a shortage of high-skilled labour. The paper, furthermore, provides a short description of recentGerman policy initiatives regarding the temporary immigration of high-skilled labour. In view of ourdescriptive results these temporary immigration policies seem, however, to satisfy only partly the demandof firms interested in recruiting foreign high-skilled workers. A more comprehensive immigration policycovering also the permanent immigration of high-skilled workers appears to be necessary.
JEL CLASSIFICATION: C42, F22, J24, J68.
KEYWORDS: skilled migration, immigration policy.
BRUSSELS ECONOMIC REVIEW - CAHIERS ECONOMIQUES DE BRUXELLESVOL. 47 - N°1 SPRING 2004
* Corresponding authors, Prof. Dr. Thomas K. Bauer, University of Bochum, Department of Economics,Universitätsstraße 150, D-44780 Bochum, Germany. Tel.: +49-234-32-28341, Fax.: +49-234-32-14273, E-mail:[email protected]
** Astrid Kunze, Phd, Norwegian School of Economics and Business Administration, Department of Economics,Helleveien 30, N-5045 Bergen, Norway. Tel.: +47-55-959-754, E-mail: [email protected]
57
INTRODUCTION
In the last decade, an increasing demand for high skilled workers could be observed inmost developed countries. This development has been associated with the developmentof increasingly integrated labour markets and the appearance of skill-biased technolog-ical change which is often ascribed to the acceleration of technological developments inthe information and communication technology (ICT) and an increasing reorganizationof workplaces. The observed increase in the demand for high-skilled labour challengesnational education systems to produce a sufficiently large number of high skilled andlabour markets to absorb high skilled efficiently. Even though the supply of high-skilledworkers also strongly increased in the last decade, many countries experienced risingrelative wages for skilled labour, indicating that the increasing supply of skilled work-ers was not sufficient to meet the increasing demand for this type of labour.
In the last few years, employers in developed economies, in particular in the so-calledNew Economy, complained about a shortage of skilled workers, leading many countriesto take initiatives to admit more skilled foreign workers. Countries with existing immi-gration policies, such as the U.S., Canada, or Australia, increased their quotas for highskilled immigrants. Other countries, especially in Europe, introduced new immigrationpossibilities directed exclusively towards high skilled immigrants. Overall, these policyinitiatives suggest an increasing competition of developed countries for high skilledimmigrants (see, among others ROTHGANG und SCHMIDT, 2003).
Empirical evidence that documents the amount of international migration of highskilled is rather scarce. We are only aware of three studies collecting firm level data onhigh-skilled workers: LOWELL (1999) for the U.S., LIST (1996) for Germany and anEU Report (1992). A caveat of these studies is the low response rate and small samplesize. The EU Report, for example, uses data on 286 firms in the 12 EU member coun-tries.1 The report highlights Germany and France as the countries, and the engineeringand chemical sector the sectors with the highest recruitment rates of university gradu-ates in the EU. According to this report, large organisations are more likely to recruitgraduates across national boundaries and the bulk of international recruitment is intocommercial functions, technical positions, production and information technology (IT).The internationalisation of business is the most important reason given by firms forrecruitment of foreign graduates.
In this study we present evidence on the demand for high skilled workers using a newfirm data set, the IZA International Employer Survey 2000 (IZA IES). Covering fourcountries, Germany, France, the Netherlands, and the UK, the survey focuses on the fiveeconomic sectors – chemical, manufacturing, IT, research and development, and
THE DEMAND FOR HIGH-SKILLED WORKERS AND IMMIGRATION POLICY
1 In order to target firms recruiting graduates from other member states, a data base was created using the latestdirectories of recruits of graduates, where they existed, or by liaising with individuals or organizations, i.e. oneconsultant within each country. The goal of the sampling procedure was to have one observation per 1 million ofadult population. If possible, which was mostly not the case, selection should be proportional to sector size.
58

finance – that are most important for the employment of high skilled workers. Hence,the data is not representative on a country level, however, arguably representative with-in sectors. In addition to country, sector and employment characteristics, the data pro-vides a wealth of information on firm characteristics and why firms participate in glob-al labour markets, which makes it particular interesting for our study.
In the following section we provide a descriptive analysis of the demand for high-skilledof the firms covered by the IZA IES. Concentrating on the German sub-sample of thisdata set, we describe which firms recruit high skilled foreigners, the reasons why theyrecruit foreign workers, as well as the qualification profile of these foreign workers. Theaim of this analysis is to get a more detailed picture on two hypotheses regarding thedeterminants of the demand for foreign high skilled. Do firms recruit internationallymainly because they want to gain from knowledge spillover, i.e. they want to obtainknowledge on key technologies that are not nationally available yet or knowledge of for-eign markets? In this case the foreign high-skilled workers are complements to nativeworkers. Or do firms recruit internationally because of a domestic lack of skilled labour,in which case the foreign high-skilled are substitutes to native high-skilled? The answersto these hypotheses have important policy implications. In the first case, a more per-manent immigration policy is necessary that makes the country more attractive for high-skilled workers from abroad. In the second case, a temporary immigration policy focus-ing on a particular type of workers may be sufficient to reduce the temporary shortageof labour. The main task for policy in this case is the precise identification of a labourshortage, possibly well in advance (see WINKELMANN, 2002, and ZIMMERMANNET AL., 2002).
Based on the results of this descriptive analysis, Section 2 provides a short descriptionof recent German policy initiatives regarding the immigration of high skilled labour anddiscuss whether these policy initiatives are effective in meeting the demands of thefirms. The last Section gives a short summary of the findings.
1. THE DEMAND FOR HIGH-SKILLED WORKERS: EVIDENCE FROM
AN INTERNATIONAL EMPLOYER SURVEY
In this section we present descriptive statistics on the demand for foreign high-skilledworkers in West-Germany using data from the IZA IES.2 This survey has been con-ducted within four neighbouring European Countries: West Germany, France, the U.K.,and the Netherlands. In order to ensure a sufficiently large number of firms employinghigh-skilled foreign workers, the sampling strategy used to collect the data targeted onlyfirms with more than 100 employees. Additionally, the survey focused on the five mostimportant economic sectors for the employment of high-skilled workers: chemical,manufacturing, information technology (IT), research and development (R&D), and
THOMAS K. BAUER AND ASTRID KUNZE
2 For more details see WINKELMANN et al. (2001), WINKELMANN (2002), and KUNZE and WARD (2002).
59
finance.3 The data was collected through a telephone interview with the individualresponsible for the recruitment of high-skilled workers. In the survey, ‘high-skilled’ hasbeen defined as ‘holding a university degree’ and ‘foreign high-skilled’ as ‘workers witha university degree, who obtained their qualifications abroad and who are foreign citi-zens’. Workers that are not foreign are labelled ‘domestic’.4 Where the respondent wasin charge of recruitment for more than one country, he/she was asked to restrict answersto the domestic firm only, in order to exclude foreign based units of multinationals.Accordingly, the firm size in the survey refers to domestic units only. The total sampleof the survey contains 850 firms. Dropping firms for which there is missing informa-tion on the main variables reduces the sample to 527 firms, of which 234 firms arelocated in Germany, 99 in France, 76 in United Kingdom, and 118 in the Netherlands.In the following, we show the main results for the demand of high skilled and foreignskilled focusing our discussion on the Germany sub-sample.
1.1. THE DEMAND FOR HIGH SKILLED FOREIGNERS IN GERMANY
Table 1 shows some basic descriptive statistics of the IZA IES by country. Within thefive sectors covered by the data set, 36.3 percent of the German firms employ some for-eign workers. With an average size of 902 employees, these firms are quite large. 23.6percent of the employed workers within these firms are high-skilled and 3.33 percent ofthe high-skilled are foreign. Note that the figures for Germany are quite similar to thosefor France and the United Kingdom. Nevertheless, while firms in the Netherlands havehired fewer high-skilled, the fraction of foreigners among the high-skilled is higher thanin the other three countries.
Comparing firms with foreign high-skilled to those without foreign high-skilled work-ers shows that the skill structure between these groups differs. While German firms withforeign high-skilled workers have on average 33.8 percent high-skilled workers amongtheir employees, the share of high-skilled workers in firms without foreigners is only17.7 percent. Although the corresponding percentages vary slightly across the fourcountries the general findings are similar.
Breaking down figures further by country and sector shows that among the five sectorscovered by the survey, IT and R&D are the sectors with highest shares of high skilledworkers, followed by financial services (see Table 2). With 8 to 10 percent, the highestshare of foreigners among the high skilled is observed in the R&D-sector. In financialservices, foreign high skilled seem to be the exception, and for the remaining sectors thefractions vary between 2 and 7.5 percent.
THE DEMAND FOR HIGH-SKILLED WORKERS AND IMMIGRATION POLICY
3 These sectors were identified as particularly important for the recruitment of high-skilled workers through the useof a pre-test.
4 Hence, those with domestic citizenship and higher education from abroad or foreign citizenship and domestichigher education are included in the group of domestic high-skilled workers.
60
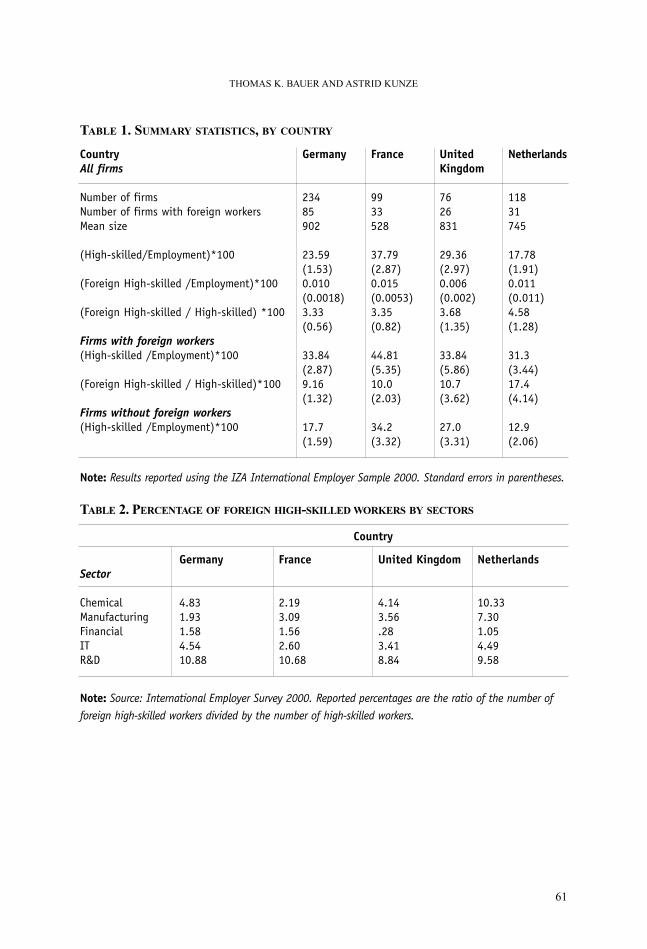
TABLE 1. SUMMARY STATISTICS, BY COUNTRY
Note: Results reported using the IZA International Employer Sample 2000. Standard errors in parentheses.
TABLE 2. PERCENTAGE OF FOREIGN HIGH-SKILLED WORKERS BY SECTORS
Note: Source: International Employer Survey 2000. Reported percentages are the ratio of the number offoreign high-skilled workers divided by the number of high-skilled workers.
THOMAS K. BAUER AND ASTRID KUNZE
61
CountryAll firms
Number of firmsNumber of firms with foreign workers Mean size
(High-skilled/Employment)*100
(Foreign High-skilled /Employment)*100
(Foreign High-skilled / High-skilled) *100
Firms with foreign workers(High-skilled /Employment)*100
(Foreign High-skilled / High-skilled)*100
Firms without foreign workers(High-skilled /Employment)*100
Germany
234 85902
23.59(1.53)0.010(0.0018)3.33(0.56)
33.84(2.87)9.16(1.32)
17.7(1.59)
France
99 33528
37.79(2.87)0.015(0.0053)3.35(0.82)
44.81(5.35)10.0(2.03)
34.2(3.32)
UnitedKingdom
7626831
29.36(2.97)0.006(0.002)3.68(1.35)
33.84(5.86)10.7(3.62)
27.0(3.31)
Netherlands
11831745
17.78(1.91)0.011(0.011)4.58(1.28)
31.3(3.44)17.4(4.14)
12.9(2.06)
Sector
ChemicalManufacturingFinancialITR&D
Germany
4.831.931.584.5410.88
France
2.193.091.562.6010.68
United Kingdom
4.143.56.283.418.84
Netherlands
10.337.301.054.499.58
Country

TABLE 3. SUMMARY STATISTICS FOR FIRMS WITHOUT FOREIGN HIGH-SKILLED
AND WITH FOREIGN HIGH-SKILLED WORKERS, PERCENTAGES
Note: Results reported using the German subsample from IZA International Employer Sample 2000.234 observations. 149 without and 85 with foreign high-skilled workers.
TABLE 4. REASONS FOR HIRING FOREIGN HIGH-SKILLED WORKERS, PERCENTAGES
Note: Results reported using German subsample from IZA International Employer Survey 2000.Proportion of firms responding that they agree (strongly agree) that a factor was a consideration inthe decision making process for hiring foreign employees with a university degree. Response fromfirms hiring foreign workers.
THE DEMAND FOR HIGH-SKILLED WORKERS AND IMMIGRATION POLICY
62
Factor
Language problemsSocio cultural differences e.g different mentality of habitsAcceptance by superiorsAcceptance by subordinatesAcceptance by customersDifficulties in evaluating foreign worker experienceLack of awareness of foreign education systems, grades and qualificationsHigh recruitment costsIs it difficult to obtain a work permit non EU workersNo applicantsNo need – vacancies filled with domestic workers
Firms withdomestic work-ers only
10.17
5.960.251.743.97
4.96
5.715.71
60.5338.91
22.08
Firms with for-eign workerswith foreigndegree
47.45
53.577.1412.7611.22
21.94
26.0219.39
65.96-
-
Firms employ-ing foreignworkers mainlyfrom the EU
44.44
54.729.4313.2 113.21
22.64
27.3616.98
60.61-
-
Firms employ-ing foreignworkers mainlyfrom the nonEU
41.30
56.526.5210.8710.87
28.26
28.3626.09
68.52-
-
EngineeringMaths and natural scienceITLawEconomicsMedicineOther
Total
Most common field of domestic employees
38.3212.1514.951.8721.52.88.41
100
Most common field of foreign employees
38.6815.0923.58013.212.836.6
100

TABLE 5. PROBLEMS WITH RECRUITING FOREIGN WORKERS, PERCENTAGES
Note: Results reported using the German subsample from IZA International Employer Sample 2000.Proportion of firms responding that a factor was potentially problematic when recruiting foreignemployees with a university degree.
TABLE 6. SUBJECTS OF STUDY OF HIGH-SKILLED WORKERS
Note: Results reported using the German subsample from IZA International Employer Sample 2000and only firms with foreign high-skilled in Germany.
THOMAS K. BAUER AND ASTRID KUNZE
63
Variable
Multinational firmShare of foreign businessForeign ownedForeign language importantExperience abroad importantChemical IndustryManufacturingFinancial ServcesData ProcessingResearch and Development Sector
Firms without for-eign high-skilled
15.933.434.667.326.717.038.324.113.96.5
Firms with foreignhigh-skilled
35.445.946.878.333.124.629.113.717.115.4
t-test
3.723.62.72.61.52.02.02.81.03.3
Factor‘We hire foreign employees because’
Overall they are the best candidatesThere is a lack of good domestic applicantsThey know foreign marketsThey speak foreign languagesThey speak EnglishThe type of knowledge required for these jobs isnot produced by the domestic education systemTheir skills better fit our work tastes
Agree
49.0755.4564.8671.1756.13
27.9351.35
Strongly agree
9.2610.9136.0447.7526.42
4.515.32
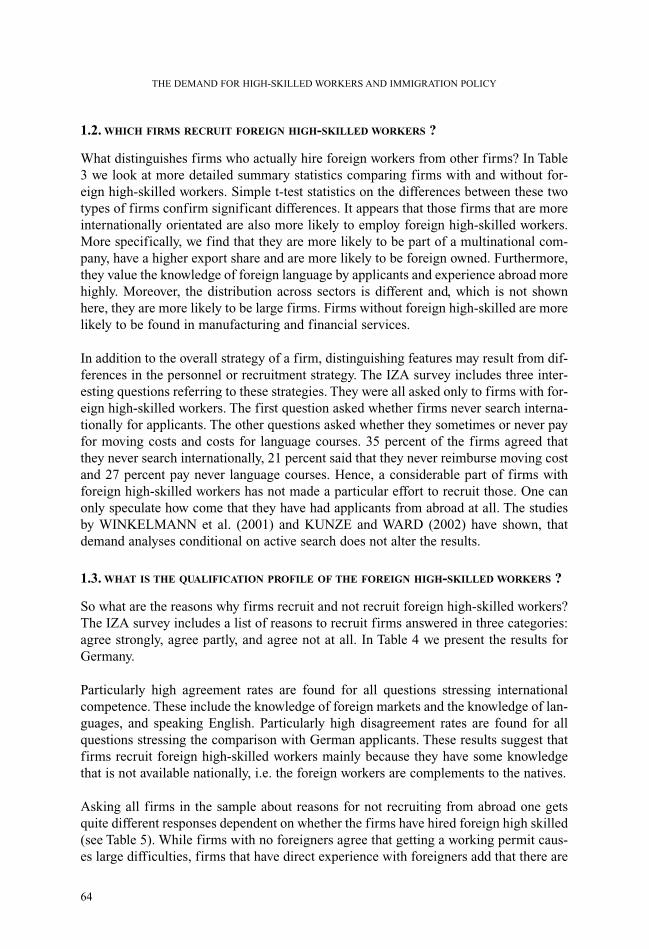
1.2. WHICH FIRMS RECRUIT FOREIGN HIGH-SKILLED WORKERS ?
What distinguishes firms who actually hire foreign workers from other firms? In Table3 we look at more detailed summary statistics comparing firms with and without for-eign high-skilled workers. Simple t-test statistics on the differences between these twotypes of firms confirm significant differences. It appears that those firms that are moreinternationally orientated are also more likely to employ foreign high-skilled workers.More specifically, we find that they are more likely to be part of a multinational com-pany, have a higher export share and are more likely to be foreign owned. Furthermore,they value the knowledge of foreign language by applicants and experience abroad morehighly. Moreover, the distribution across sectors is different and, which is not shownhere, they are more likely to be large firms. Firms without foreign high-skilled are morelikely to be found in manufacturing and financial services.
In addition to the overall strategy of a firm, distinguishing features may result from dif-ferences in the personnel or recruitment strategy. The IZA survey includes three inter-esting questions referring to these strategies. They were all asked only to firms with for-eign high-skilled workers. The first question asked whether firms never search interna-tionally for applicants. The other questions asked whether they sometimes or never payfor moving costs and costs for language courses. 35 percent of the firms agreed thatthey never search internationally, 21 percent said that they never reimburse moving costand 27 percent pay never language courses. Hence, a considerable part of firms withforeign high-skilled workers has not made a particular effort to recruit those. One canonly speculate how come that they have had applicants from abroad at all. The studiesby WINKELMANN et al. (2001) and KUNZE and WARD (2002) have shown, thatdemand analyses conditional on active search does not alter the results.
1.3. WHAT IS THE QUALIFICATION PROFILE OF THE FOREIGN HIGH-SKILLED WORKERS ?
So what are the reasons why firms recruit and not recruit foreign high-skilled workers?The IZA survey includes a list of reasons to recruit firms answered in three categories:agree strongly, agree partly, and agree not at all. In Table 4 we present the results forGermany.
Particularly high agreement rates are found for all questions stressing internationalcompetence. These include the knowledge of foreign markets and the knowledge of lan-guages, and speaking English. Particularly high disagreement rates are found for allquestions stressing the comparison with German applicants. These results suggest thatfirms recruit foreign high-skilled workers mainly because they have some knowledgethat is not available nationally, i.e. the foreign workers are complements to the natives.
Asking all firms in the sample about reasons for not recruiting from abroad one getsquite different responses dependent on whether the firms have hired foreign high skilled(see Table 5). While firms with no foreigners agree that getting a working permit caus-es large difficulties, firms that have direct experience with foreigners add that there are
THE DEMAND FOR HIGH-SKILLED WORKERS AND IMMIGRATION POLICY
64

much more specific difficulties, such as language problems, socio-cultural differ-ences and the lack of knowledge about the foreign education system. Especially thelatter suggests that firms may face difficulties in judging the qualification of foreignapplicants. Splitting the sample into firms with mainly employees from the EU andnon-EU countries, results remain virtually unchanged. This result may be restricteddue to the fact that the question in this firm survey concerning the country of originof the foreign workers is asked in a too general way in order to perform more detailedanalyses.
Consistent with the latter finding, the IZA IES shows that in fact the qualificationprofile of foreign and domestic applicants is not very different with respect to fieldof study. In Table 6 the distribution within firms with foreign high-skilled workersacross fields is shown.
Among domestic high-skilled the most important field is engineering (38 percent)followed by economics (22 percent). IT is third. The ranking and distribution amongforeigners is surprisingly quite similar to the one among domestic high skilled. Themain difference is that IT is second and economics third in the ranking. The latterresult may be biased due the fact that we pool hires from the EU and the non-EUcountries. Indeed, when one distinguishes these two groups one finds that whileengineering is still the most important field among foreigners from EU countries, ITis the most important one among foreigners from non-EU countries. More specifi-cally, looking at the countries of origin, firms recruit most often IT-workers fromEast European countries.
Information on the qualification or work experience of workers is provided by broadmeasures of the field of work and the position. Six fields of work are distinguished:research and development, IT technology, manufacture, marketing, administrationand others. Again the distribution for the two groups of workers, which are notreported here, are quite similar and suggest that domestic and foreign workers aresubstitutes. Workers are most likely to work in the R&D departments of the firms,followed by marketing and IT. Distinguishing again between hires from EU countriesand non-EU countries suggests that, however, EU nationals are more likely to be inthe marketing section. This may indicate that their foreign experience or languageproficiency are particularly valuable to the firms. For non-EU nationals we still findthat they are most likely to work in R&D, hence, are perhaps hired because of theirparticular qualification. Furthermore, the survey suggests that firms use foreignhigh-skilled in positions as specialists and as managers in the medium level.
THOMAS K. BAUER AND ASTRID KUNZE
65

2. IMMIGRATION POLICY TOWARDS HIGH-SKILLED LABOUR: THE GERMAN
EXAMPLE
2.1. INTERNATIONAL COMPETITION FOR HIGH-SKILLED WORKERS
In the last decade, increasing flows of high-skilled migrants could be observed.5 Thisincreasing mobility of high-skilled labour has been associated with the development ofincreasingly integrated labour and product markets, an increasing appearance of skill-biased technological change in developed economies which is often ascribed to the accel-eration of technological developments in the information and communication technologies(ICT) and the re-structuring of the organization of work. Increasing complaints of firms,especially in the so-called New Economy, about a reputed shortage of adequately skilledworkers led many developed countries to take new but modest initiatives to admit moreskilled labour migrants (ROTHGANG and SCHMIDT, 2003). At least for European coun-tries, these new initiatives mark an outstanding change in immigration policy, given the‘zero-immigration’ policy they followed since the first oil-price shock in the early 1970s.
In Western Europe, these new initiatives focus on a selective policy based on higherskills relevant for some specific industries, such as the information technology andhealth industries (OECD, 2002; IOM, 2003). This skill-based entry system in fact is cur-rently the main manner in which non-EU citizens can come to live and work in the EU.All these initiatives have in common, that they reduced existing restrictions for employ-ers to hire high-skilled foreign workers. Nevertheless, almost all of them require eitherthat the employers provide evidence that no appropriate native worker can be found orrestrict the facilitation of hiring foreign workers to specific industries. Furthermore, theconditions under which the foreign workers are employed must be identical to those ofthe native worker with respect to payment and general working conditions.
In the UK, for example, there was some reduction in the skills requirements for highlyeducated workers, such as little after-graduation labour market experience being required,to enable employers to gain access to a wider range of work permits. Currently, work per-mits can be applied for electronically in order to reduce transaction costs. Furthermore, ifa foreign worker were to change employers in the same field, the worker would not berequired to apply for a new work permit. In January 2002, France established a system toinduce high-skilled workers from outside the EU to live and work in France. The FrenchLabour Ministry handled the approval procedure and, if successful for the foreign appli-cant, the employer’s application was approved by the Labour Ministry and Ministry of theInterior promptly. Also several countries outside Europe entered the apparent global com-petition for high-skilled labor. The U.S. increased the number of H1B-visas (temporaryvisas for high skilled workers) issued every year several times, and Australia and Canadaincreased the number of immigration quotas issued through their point systems.6
THE DEMAND FOR HIGH-SKILLED WORKERS AND IMMIGRATION POLICY
5 See BAUER, HAISKEN-DENEW, and SCHMIDT (2003) for a brief survey of recent developments in interna-tional migration.
6 See BAUER, LOFSTRÖM and ZIMMERMANN (2000) for a brief description of the immigration policy inAustralia and Canada.
66

In the following, we provide a more detailed description of the German Green Card ini-tiative for IT-specialists from the summer 2000 for at least two reasons. First, this ini-tiative could be seen as being representative for similar initiatives in other Europeancountries. Second, the introduction of the Green Card started a heated debate on theGerman immigration policy, leading to the establishment of an immigration commis-sion that aimed to produce a report with recommendations on a more coherent and com-prehensive German immigration law. A short survey of the main recommendations andthe development of a German immigration law will also be described in this section.
2.2. THE GERMAN “GREEN CARD” INITIATIVE
Reacting to increasing complaints from firms in the ITC industry that they are unable to fillvacancies and that this shortage of appropriately skilled workers will harm innovations andthe competitiveness of the German industry, chancellor Schröder announced in February2000 that a so-called Green Card for foreign IT-specialists will be introduced.7 In August2001, the Green Card came into force, giving German IT-firms the opportunity to hire upto 20,000 non-EU IT-specialist for a maximum of five years.8 This quota stayed far behindthe 75,000 IT job vacancies announced by the industry.
In order to hire a foreign IT-specialist, the German IT firm had to apply for a work permitat the employment office. The employment office then verified within a week whether (i)no unemployed skilled German or an EU specialist could meet the requirements of the firm,(ii) the person a firm wanted to hire is qualified for the position, and (iii) the employer isoffering the foreign specialist the same working conditions and wage as a comparably qual-ified German specialist would receive. In order to assess the qualification of the foreign spe-cialist, it was required that foreign IT-specialist has a degree from a university or polytech-nic in the field of information and communication technology or the employer needed toconfirm that he is willing to pay an annual salary of at least Euro 51,000. The Green Cardalso applied to foreigners graduating from German universities and polytechnics, who hadto leave the country after their graduation before the Green Card came into force.9
THOMAS K. BAUER AND ASTRID KUNZE
7 The German Green Card should not be confounded with the Green Card issued in the United States. As will bedescribed in more detail, the former allows the immigration of high-skilled workers on a temporary basis where-as the Green Card in the US addresses permanent migrants. The German Green Card is rather more similar to theH1-B visa in the US, which represent temporary visas for high skilled workers.
8 IT-specialist are defined as specialist in software development, the development of circuits and IT systems, mul-timedia development and programming, and IT consulting, as well as system specialists, Internet specialists andnetwork specialists (WERNER, 2002).
9 See WERNER (2002) for a more detailed description of the regulations and procedures of the Green Card initiative.
67
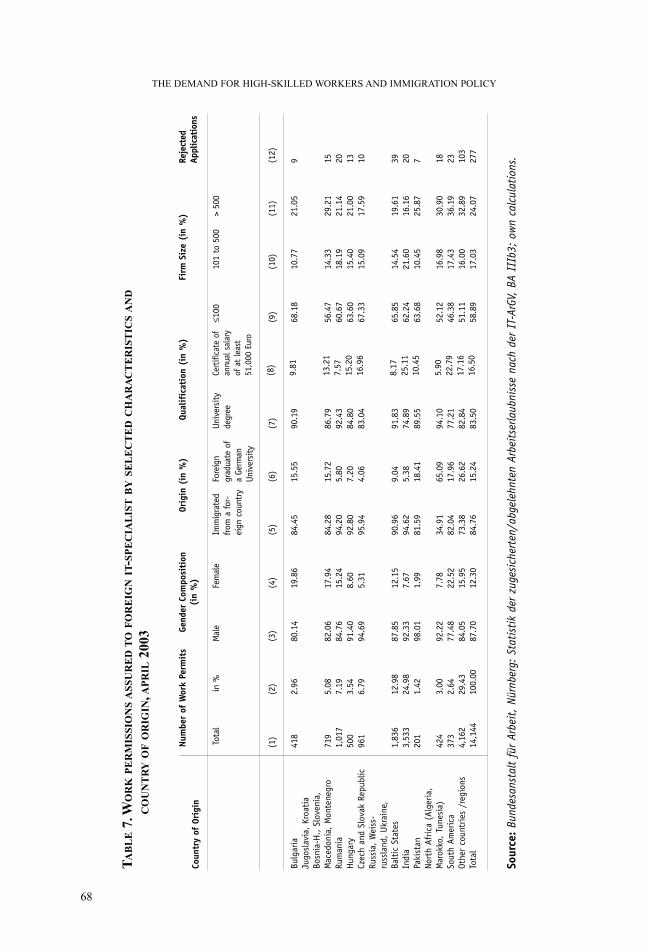
THE DEMAND FOR HIGH-SKILLED WORKERS AND IMMIGRATION POLICY
68
TA
BL
E7.
WO
RK
PE
RM
ISSI
ON
SA
SSU
RE
DT
OF
OR
EIG
NIT
-SP
EC
IAL
IST
BY
SEL
EC
TE
DC
HA
RA
CT
ER
IST
ICS
AN
D
CO
UN
TR
YO
FO
RIG
IN,A
PR
IL20
03
Bulg
aria
Jugo
slav
ia,
Kroa
tia
Bosn
ia-H
., S
love
nia,
Mac
edon
ia,
Mon
tene
gro
Rum
ania
Hun
gary
Czec
h an
d Sl
ovak
Rep
ublic
Russ
ia,
Wei
ss-
russ
land
, U
krai
ne,
Balt
ic S
tate
sIn
dia
Paki
stan
Nort
h Af
rica
(Alg
eria
, M
arok
ko,
Tune
sia)
Sout
h Am
eric
aOt
her
coun
trie
s /r
egio
nsTo
tal
Coun
try
of O
rigi
nN
umbe
r of
Wor
k Pe
rmit
sGe
nder
Com
posi
tion
(in
%)
Orig
in (
in %
)Qu
alif
icat
ion
(in
%)
Firm
Siz
e (i
n %
)
Tota
l
(1)
418
719
1,01
750
096
1
1,83
63,
533
201
424
373
4,16
214
,144
in %
(2)
2.96
5.08
7.19
3.54
6.79
12.9
824
.98
1.42
3.00
2.64
29.4
310
0.00
Mal
e
(3)
80.1
4
82.0
684
.76
91.4
094
.69
87.8
592
.33
98.0
1
92.2
277
.48
84.0
587
.70
Fem
ale
(4)
19.8
6
17.9
415
.24
8.60
5.31
12.1
57.
671.
99
7.78
22.5
215
.95
12.3
0
Imm
igra
ted
from
a fo
r-ei
gn c
ount
ry
(5)
84.4
5
84.2
894
.20
92.8
095
.94
90.9
694
.62
81.5
9
34.9
182
.04
73.3
884
.76
Fore
ign
grad
uate
of
a Ge
rman
Univ
ersi
ty
(6)
15.5
5
15.7
25.
807.
204.
06
9.04
5.38
18.4
1
65.0
917
.96
26.6
215
.24
Univ
ersi
tyde
gree
(7)
90.1
9
86.7
992
.43
84.8
083
.04
91.8
374
.89
89.5
5
94.1
077
.21
82.8
483
.50
Cert
ifica
te o
fan
nual
sal
ary
of a
t le
ast
51,0
00 E
uro
(8)
9.81
13.2
17.
5715
.20
16.9
6
8.17
25.1
110
.45
5.90
22.7
917
.16
16.5
0
≤100
(9)
68.1
8
56.4
760
.67
63.6
067
.33
65.8
562
.24
63.6
8
52.1
246
.38
51.1
158
.89
101
to 5
00
(10)
10.7
7
14.3
318
.19
15.4
015
.09
14.5
421
.60
10.4
5
16.9
817
.43
16.0
017
.03
> 50
0
(11)
21.0
5
29.2
121
.14
21.0
017
.59
19.6
116
.16
25.8
7
30.9
036
.19
32.8
924
.07
(12)
9 15 20 13 10 39 20 7 18 23 103
277
Reje
cted
Ap
plic
atio
ns
Sour
ce:
Bund
esan
stal
t fü
r Ar
beit,
Nürn
berg
: St
atis
tik
der
zuge
sich
erte
n/ab
gele
hnte
n Ar
beitse
rlaub
niss
e na
ch d
er I
T-Ar
GV,
BA I
IIb3
; ow
n ca
lcul
atio
ns.
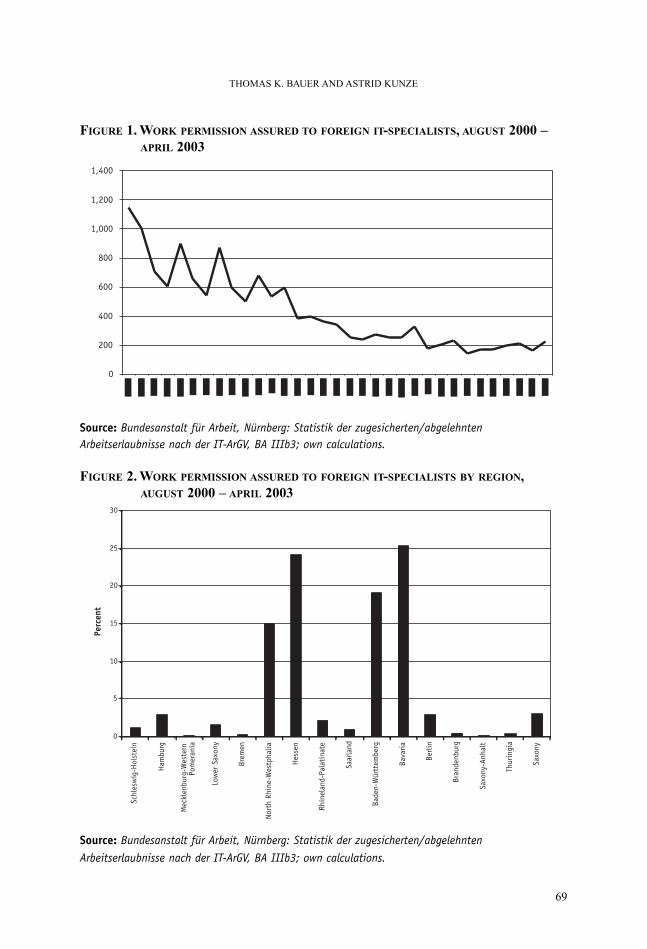
FIGURE 1. WORK PERMISSION ASSURED TO FOREIGN IT-SPECIALISTS, AUGUST 2000 –APRIL 2003
Source: Bundesanstalt für Arbeit, Nürnberg: Statistik der zugesicherten/abgelehntenArbeitserlaubnisse nach der IT-ArGV, BA IIIb3; own calculations.
FIGURE 2. WORK PERMISSION ASSURED TO FOREIGN IT-SPECIALISTS BY REGION,AUGUST 2000 – APRIL 2003
Source: Bundesanstalt für Arbeit, Nürnberg: Statistik der zugesicherten/abgelehnten
Arbeitserlaubnisse nach der IT-ArGV, BA IIIb3; own calculations.
THOMAS K. BAUER AND ASTRID KUNZE
69
0
200
400
600
800
1,000
1,200
1,400
0
5
10
15
20
25
30
Schl
esw
ig-H
olst
ein
Ham
burg
Mec
klen
burg
-Wes
tern
Pom
eran
ia
Low
er S
axon
y
Brem
en
Nort
h Rh
ine-
Wes
tpha
lia
Hes
sen
Rhin
elan
d-Pa
lati
nate
Saar
land
Bade
n-W
ürtt
embe
rg
Bava
ria
Berli
n
Bran
denb
urg
Saxo
ny-A
nhal
t
Thur
ingi
a
Saxo
ny
Perc
ent

During the validity of the Green Card, the foreign IT-specialist is allowed to change toanother IT job in another firm. Becoming self-employed is only possible under certaincircumstances. The spouses of the IT-specialists with a Green Card are able to obtain aworking permission in Germany after a waiting period of one year. Originally, the dead-line to apply for a working permission under the Green Card initiative for the first timewas on July 31, 2003. This deadline, however, has been extended by the German gov-ernment to the end of 2004, when a new immigration law is expected to regulate workand residency permits for high-skilled, non-European Union workers seeking employ-ment in the country.
Figure 1 shows the number of work permits assured to IT-specialist under the GreenCard initiative every month from August 2000 until April 2003. Note that this numbercould be higher than the actual number of IT-specialists immigrated, because, amongother reasons, firms could revise their demand for IT-specialists between the assuranceof the working permit and the time the work permit is actually granted or because sev-eral firms could apply for the assurance of the same foreign IT-specialist (SCHREYER,2003). Throughout the period, the number of assured work permits shows a downwardtrend, with peaks occurring every other quarter. In the first year of the initiative, 680work permits have been granted on average every month. A sharp drop of the numberof work permits could be observed in September 2001. Thereafter, the downward trendlevels out to about 200 work permits per month. From the introduction of the GreenCard in August 2000 until the end of April 2003, 14,144 Green Cards have been assuredto IT specialists from outside the EU (see Table 7).
Figure 1 and Table 7 shows that the total quota of 20,000 green cards has not been usedup by the German IT-industry and - given the current average number of 200 work per-mits per month - will also not be reached until the end of 2004. This seems rather sur-prising, given the estimated shortage of 75,000 IT-specialist announced by the industryin 2000 and the fact that that only about 6,000 German IT-specialists graduate everyyear from German universities. Several reasons may be responsible for this discrepan-cy. First, since the mid of year 2001 the new economy experienced a crisis, whichreduced the demand for IT-specialists. Even though there are no administrative statisticsavailable, surveys among Green Card-holders suggest that about 7% of them becomeunemployed while staying in Germany (SCHREYER, 2003). Furthermore, the sharpdrop of Green Cards assured in September 2001 indicates that the events of September11, 2001 had also an impact on the demand for foreign specialists.
Table 7 also reports some statistics on the characteristics of the IT-specialist whoobtained a German Green Card. Almost 88% of them are male, and about 15% hadgraduated from a German university of polytechnic. Slightly more than 16% receivedthe work permit as a result of an agreement concerning an annual salary of at least51,000 Euro and almost 60% of the Green Card holders are employed in firms withfewer than 100 employees. In the discussion around the introduction of the Green Card,the media and most politicians expected that the Green Card will be used mainly for
THE DEMAND FOR HIGH-SKILLED WORKERS AND IMMIGRATION POLICY
70

IT-specialist from India. Even though India is the single most important country forGreen Card holders, their share is far behind the initial expectations. This could beexplained with the preferences of Indians to migrate either to the United States or theUK. In both countries, English is spoken, and both have a large Indian community. Inaddition, the United States offers better opportunities to become self-employed and tosettle on a permanent basis. According to Table 7, more than one third of all Green Cardholders come from Central or Eastern European countries, which again could beexplained by a rather good migration network with Germany. Finally, Table 7 shows thatonly 1.6% of all applications for a Green Card have been rejected.
Figure 2 shows the number of assured work permits to foreign IT-specialists are regional-ly very concentrated. Almost 93% of all work permits have been assured to firms locatedin West Germany, and the federal states Bavaria, Baden-Württemberg, Hessian, and NorthRhine-Westphalia account for almost 84% of all Green Cards. Even these numbers, how-ever, deceive the true regional concentration of the Green Card-holders, because half ofthem are located in either Munich, Frankfurt, or the region of Bonn and Cologne.
2.3. THE NEW GERMAN IMMIGRATION LAW
The introduction of a “Green Card” for IT-specialists in Germany started a heateddebate on the German immigration policy. This debate resulted in the establishment ofan immigration commission, called the Süßmuth-Commission after the chairwomenRita Süßmuth, whose mission was to produce a report with recommendations on a morecoherent and comprehensive German immigration law. The commission published itsfinal report in July 2001 (INDEPENDENT COMMISSION ON MIGRATION TOGERMANY, 2001). It proposed that Germany should officially acknowledge itself asan immigration country. One of the main arguments of the commission for the need ofincreased immigration to Germany was the apparent demographic problems and theageing of the German population. The major recommendations of the commission wereto introduce a coherent flexible migration policy that allows both the immigration oftemporary and permanent labor migrants, to introduce measures to foster the integra-tion of immigrants, measures to speed up the German asylum procedure while recog-nizing Germany’s obligations arising from the Geneva Refugee Convention and theEuropean Human Rights Convention, and measures to combat illegal immigration.
Concerning labor migration, the Süßmuth-Commission differentiated six groups ofmigrants: (i) qualified permanent immigrants, (ii) students, (iii) trainees within theGerman apprenticeship system, (iv) temporary workers to cover labour shortages, (v)executives and key members of staff of firms, scientists, and academics, and (vi) start-up entrepreneurs. Qualified permanent immigrants are proposed to be selected follow-ing to a nationwide point system similar to the one use by Canada and Australia.10
Applicants must score a minimum number of points. Of the applicants who have scored
THOMAS K. BAUER AND ASTRID KUNZE
10 See ZIMMERMANN et al. (2002 for a detailed description of the Canadian and Australian immigration system.
71

more than this minimum number of points, those who have scored the highest numberof points should be chosen. The crucial selection criteria for which points are rewardedshould indicate an applicants’ ability to integrate into the labor market and the societywell. As main indicators the commission mentions a person’s age, qualification and theability to speak German. The commission further suggested setting an initial quota of20,000 permanent immigrants including their family members, which could be changedlater on according to the demographic development in Germany.
In addition to the permanent immigration of qualified workers, the commission sug-gested to allow also the temporary immigration of workers in order to react in a flexi-ble way to short-term shortages in the labour market under a system of strict quotas andlimits on the length of time. Two different methods of identifying labour shortagesshould be tested in an initial phase.11 According to the first method, labour shortagesshould be determined using statistical diagnoses. As ZIMMERMANN et al. (2002)show, however, this method is subject to potentially large errors and not able to identi-fy labour shortages in a reliable way. According to the second method, a fee paid by theemployers should identify labour shortages and guarantee that domestic applicants willcontinue to be attractive to the labour market. It could be questioned, however, that a feeto employers could really meet these goals, mainly because the fee will reflect the actu-al value of hiring a foreigner through that system only by chance. Because of these prob-lems scientists rather suggest to auction temporary immigration visa to domestic firms(see ZIMMERMANN et al., 2002).
For executives and managers of multinational firms, key staff of firms, scientists andacademics as well as start-up entrepreneurs the commission recommended to makeaccess to the German labour market much easier than for all other groups and to offerthem the best possible residence conditions. Executives, for example, are only requiredto prove that they earn twice as much as the income threshold for statutory health insur-ance12 in order to obtain full access to the labour market. In addition, start-up entrepre-neurs with a sound business idea should be given quick entrance to Germany. Selectionof these entrepreneurs should be based on certified business plans, which are reviewedby authorities - such as local chamber of industry and commerce, banks, or industrialdevelopment corporations - located in the region where the applicant wants to settle. Inaddition to having an equity or loan commitment to ensure that the business idea can beimplemented, the entrepreneur should not be older than 45, must certify that they are ofgood health, have a good reputation and can cover their subsistence for an initial peri-od. Finally, the commission suggested to implement a program that encourages youngforeigners to either study at a German University or to undergo training in the Germandual training system. For the latter they suggested an immigration quota of 10,000 visas.
THE DEMAND FOR HIGH-SKILLED WORKERS AND IMMIGRATION POLICY
11 A detailed discussion of how to identify labor shortages is given by ZIMMERMANN et al. (2002).12 Currently, this threshold is an annual income of 46.350 Euro.
72
The report by the commission formed the basis for a new German immigration act.13
Concerning the immigration of workers, this Immigration Act followed most of recom-mendations by the Süßmuth-Commission.14 Even though one of the main goals of thelaw is to select immigrants more according to the needs of the labour market and toincrease the share of skilled migrants, the Ministry of the Interior stresses that the pointsystem to select migrants will only be available to a very limited number of immigrantsin the beginning and will not be expanded before 2010. The Immigration Act passedboth chambers of the parliament, but was nullified by the Federal Constitutional Courtin December 2002 due to a procedural error during voting in the second chamber (theBundesrat) on March 22, 2002.15 Without changing the content of the Immigration Act,the government once again submitted the draft bill for adoption in January 2003 andpassed the first chamber (the German Bundestag) on 8 May 2003. In June 2003, theGerman Bundesrat rejected the Immigration Act. A mediation committee will nowexamine the bill.16
CONCLUSION
Using a newly available data set of German firms within five potentially high skilledlabour intensive sectors, the IZA International Employer Survey 2000, this paperprovides a descriptive analysis of the demand for high-skilled foreign labour. Theanalysis has shown that on average 3.3 percent of all high skilled workers are for-eigners. It seems that foreigners and domestic high skilled are quite similar withrespect to field of study, yet an important difference is the international experienceand knowledge of languages of the foreigners that are highly valued by the firms. Acomparison of the German figures with outcomes for France, the UK and theNetherlands has shown that sector differences are more important than country dif-ferences. Nevertheless, the size of the country and the labour market may be impor-tant as the case of the Netherlands suggests. This is the country with lowest shares
THOMAS K. BAUER AND ASTRID KUNZE
13 See http://www.bmi.bund.de/dokumente/Pressemitteilung/ix_59920.htm for more information.14 Concerning family reunification and asylum, the law envisages further restrictions on the possibility to immi-
grate. With regard to family reunification, the new law plans to give only children under the age of 12 (current-ly 16) a legal claim to enter the country in order to ensure that the children of immigrants integrate into Germansociety as soon as possible. Note that this restriction does not hold for children of refugees and foreigners whohave been granted a settlement permit as highly qualified persons or within the framework of the selection pro-cedure. The children of these groups of migrants will have a legal claim to enter the country until the age of 18.According to the new law, family members entering the country after their families will have the same possibil-ities of accessing the labour market as the persons they are joining. The current law allows most family membersto access the labour market only after a one-year waiting period. Finally, the new law includes many new regula-tions aiming at making the current asylum procedure more efficient and restricting the possibilities to claim asy-lum as well as the access to social security.
15 Six of the federal states led by the Christian Democratic Union party (CDU) had opposed passing the law inMarch 2002 and took their complaint to the highest court. The two representatives from the state of Brandenburg,which is governed by a coalition between the Social Democrats (SPD) and the CDU, had been unable to delivera unanimous vote. The German constitution however prescribes a uniform casting of votes of each state.
16 The task of the Mediation Committee is to find a compromise whenever there are differences of opinion betweenthe Bundestag and Bundesrat on a piece of legislation.
73
of high skilled within sectors and highest fractions of foreigners among those. Thismay be explained by the fact that the Netherlands is a small, very internationally ori-entated country.
One of the most important questions for policy concerning the immigration of skilled iswhether domestic and foreign workers complement or substitute each other. Thedescriptive analysis does not provide an unequivocal answer to this question, since wefind some support for both hypotheses. Even though the results point towards a com-plementary relationship between foreign and domestic high-skilled, the concentration offoreign high-skilled from non-EU countries in IT-related subjects and functions sug-gests that the employment of these workers may be driven by a shortage of skilledlabour in this area (Winkelmann, 2002). In addition, because those firms who hire for-eigners tend to have a lot of high-skilled in their work force overall, the above resultssupport the interpretation of a lack or scarcity of high-skilled workers in the short runat fixed prices in the domestic labour market (see Winkelmann, et al., 2001). The IZAIES further shows that the majority of firms who have hired foreign high skilled havepaid for moving cost and language courses. This could be interpreted as the payment ofefficiency wages to foreigners in order to extract more effort from the employed highskilled (EPSTEIN et al., 2002).
Furthermore, we give a detailed description of the German Green Card initiative thatstarted in 2001 and gives German firms the opportunity to hire IT-specialists from non-EU countries on a temporary basis. This initiative is surely effective in reducing part ofthe shortage of skilled IT specialist which has been announced by employers in the NewEconomy and partly confirmed by our descriptive analysis. However, our descriptiveanalysis also indicates, that such a temporary immigration policy satisfies the demandof firms interested in recruiting foreign high-skilled workers only partly. The analysisof the IZA International Employer Survey 2000 has shown that German firms hire to alarge extent foreign workers that are complements to domestic high-skilled, i.e. theyrecruit foreign high-skilled mainly because of their knowledge of foreign markets andlanguages and because of the transfer of new technological skills that are yet not avail-able domestically. An immigration policy that satisfies these types of demand mustmake Germany more attractive for foreign high-skilled workers in the long term. Thisincludes the reduction of institutional barriers to international mobility not only forhigh-skilled workers but also for their family members. In addition, smooth and rapidintegration should be promoted. Despite some weaknesses, the proposed new immigra-tion law for Germany, which has been described in more detail in section 3 of this paper,is a first step towards reaching this goal. However, the law still awaits its ratification. Inview of the importance of globalized product and labour markets and rapid technologi-cal progress in modern economies, a fast adoption of this law appears to be necessaryfor Germany not to fall behind in the global competition for high-skilled labour.
THE DEMAND FOR HIGH-SKILLED WORKERS AND IMMIGRATION POLICY
74
REFERENCES
Bauer T., J.P. Haisken-DeNew and C.M. Schmidt, 2003. “International LabourMigration, Economic Growth and Labour Markets: The Dynamics ofInterrelationships,” mimeo., University of Bochum.Bauer T., M. Lofström and K.F. Zimmermann, 2000. “Immigration Policy,Assimilation of Immigrants and Natives’ Sentiments towards Immigrants: Evidencefrom 12 OECD-countries”, Swedish Economic Policy Review, 7(2), 11-53. Epstein G.S.,A. Kunze and M. Ward, 2002. “High Skilled Migration and the Exertionof Effort by the Local Population,” IZA Discussion Paper No. 540, IZA: Bonn.Independent Commission on Migration to Germany, 2001. Structuring Immigration,Fostering Integration. http://www.bmi.bund.de/Annex/en_14625/Download.pdfIOM, 2003. World Migration 2003 – Managing Migration: Challenges and Responsesfor People on the Move. Geneva: International Organization for Migration (IOM).Kunze A. and M. Ward, 2001. “Firms’ Prepardness for the Global Labor Market:Evidence from a Survey of Large Firms Employing Highly Skilled Workers,” mimeo.OECD, 2002. International Mobility of the High-skilled. Organisation for EconomicCo-Operation and Development: Paris.Rothgang M. and C.M. Schmidt, 2003. “The New Economy, the Impact ofImmigration, and the Brain Drain,” in D.C. Jones (ed.), New Economy Handbook.Amsterdam, New York and Tokyo: Elsevier Science.Schreyer F., 2003. “Von der Green Card zur Red Card?” IAB Kurzbericht No. 7.Nürnberg: Institut zur Arbeitsmarkt und Berufsforschung (IAB).Werner H., 2002. “The Current ‘Green Card’ Initiative for Foreign IT Specialists inGermany,” in OECD (ed.): International Mobility of the High-skilled. OECD: Paris,321-326.Winkelmann R., 2002. “Why Do Firms Recruit Internationally? Results from the IZAInternational Employer Survey 2000,” Schmollers Jahrbuch, 122, 155-178.Winkelmann R., A. Kunze, L. Locher and M. Ward, 2001. “Die Nachfrage nachinternationalen hochqualifizierten Beschäftigten. Gutachten im Auftrag desBundesministeriums für Bildung und Forschung,” IZA Report No. 4, IZA: Bonn.Zimmermann K.F., T. Bauer, H. Bonin, R. Fahr and H. Hinte, 2002. Arbeits-kräftebedarf bei hoher Arbeitslosigkeit. Heidelberg: Springer-Verlag.
THOMAS K. BAUER AND ASTRID KUNZE
75


THE IMPACT OF TEMPORARY MIGRATION ON HUMAN CAPITAL
ACCUMULATION AND ECONOMIC DEVELOPMENT
MANON DOMINGUES DOS SANTOS*(UNIVERSITE DE MARNE LA VALLEE AND
CREST-INSEE) AND FABIEN POSTEL-VINAY** (INRA-PARIS JOURDAN,CREST-INSEE AND CEPR)
ABSTRACT:We study the long-run growth impact on the emigrants' country of origin of a change in immigration pol-icy implemented by the host country. The policy change takes the form of an increase in the ratio of tem-porary to permanent visas issued. This policy change has two counteracting effects on the source country:first, it discourages human capital accumulation (which is harmful for development), and second, it facil-itates the diffusion of knowledge (which encourages growth). We are able to analyze the determinants ofan “optimal” (i.e. growth-maximizing) share of temporary visas.
JEL CLASSIFICATION: F22, J24, J68.
KEYWORDS: skilled migration, immigration policy, human capital, growth.
BRUSSELS ECONOMIC REVIEW - CAHIERS ECONOMIQUES DE BRUXELLESVOL. 47 - N°1 SPRING 2004
77

INTRODUCTION
As OECD (1998) points out, many of the traditional “host” countries have recently redi-rected their immigration policy toward stricter conditions of admission for candidateimmigrants. The general trend is an increase in the share of temporary visas issued (rel-ative to permanent visas). From the host country's viewpoint, this shift in migrationquotas---another aspect of which is to favor the immigration of skilled workers---isclearly aimed at facilitating the economy's response to aggregate fluctuations in eco-nomic activity. What is less clear, and will be the issue addressed in this paper, is theimpact of this shift on the source countries.
Specifically, we show that exogenously raising the proportion of returnees amongmigrants has a generally ambiguous impact on long-run growth in the source country ina model where the engine of growth is knowledge accumulation. This ambiguous over-all impact is the sum of two counteracting forces: a reduction in the educational effortput forth by locals in the source country, and an increase in knowledge diffusion. Onone hand, assuming that individual skills are complementary to the economy's overalllevel of technological development, natives of developing countries are induced toinvest more into education, the higher the probability that they can combine their skillswith the more productive technology available abroad. Thus, a higher probability ofonly getting a temporary visa (as opposed to a permanent one) reduces the returns toeducation from the source countries' natives' point of view, which in turn reduces theaggregate level of educational effort undertaken in the developing economies and hasan adverse effect on growth. On the other hand, assuming that returning emigrants con-tribute to knowledge diffusion, their higher number also has a positive impact on knowl-edge accumulation in their country of origin through this particular channel.
Many existing contributions already explore the causes and consequences of returnmigration. A very brief overview follows.
First, return migration can either be chosen or it can be constrained. For instance, somecandidate immigrants only manage to receive a temporary visa (where they would havepreferred a permanent one), and are therefore obliged to return to their country of ori-gin against their will. Recent trends in the migration policies implemented in many tra-ditional “host” countries clearly tend to amplify this phenomenon. On the other hand,some emigrants freely choose to return to their country of origin for a variety of rea-sons. For instance, they may have made their initial decision to emigrate based on erro-neous information (Borjas and Bratsberg 1996). Return migration may also have beenplanned as part of an optimal life-cycle relocation sequence (Borjas and Bratsberg 1996,Djajic and Milbourne 1988, Stark et al., 1997).
Second, the perspective of being able (or even forced) to return to one's country of ori-gin after a stay abroad is likely to influence some of the typical migrant's economicchoices. For example, migrants who expect to return to their country of origin in thefuture tend to participate more than the locals in the labor market (Dustmann 1996).
THE IMPACT OF TEMPORARY MIGRATION ON HUMAN CAPITAL ACCUMULATION AND ECONOMIC DEVELOPMENT
78

However, contributions analyzing the impact of migration opportunities on the behav-ior of potential migrants before they leave their country of origin only address the issueof incentives to acquire education. What those contributions show is that being able toemigrate raises the expected returns to education and induce workers to train themselvesmore (Mountford, 1997). Subsequent work by Beine et al. (2001) brings some empiri-cal support to this latter idea. One limitation of those contributions, though, is that theyall consider that migration can only be permanent, and are completely silent on theimpact of return migration.
Finally, the return of emigrants can be seen as a potential source of growth for the emi-grants' home country, to the extent that they contribute to the diffusion of the moreadvanced skills that they have acquired during their stay abroad (Domingues Dos Santosand Postel-Vinay, 2003). Limited empirical evidence exists to support this idea, includ-ing Co, Gang and Yun (2000) who show that Hungarian migrants enjoy a wage premi-um when returning home, and Barrett and O'Connell (2000) who reach similar conclu-sions in their study of Irish migrants. However, all migration decisions are made freelyin the model of Domingues Dos Santos and Postel-Vinay (2003). In other words, theycompletely shut down any possible constraint imposed by binding migration quotas, orany sort of migration policy. The aim of this contribution is precisely to incorporate con-straining migration policy into a simple model of return migration.
This is organized as follows: the next section presents the economic framework. Section 2looks at the long-run equilibrium with a particular focus on the long-run consequencesfor economic groth in the source country of the migration policy implemented in thehost country. Section 3 concludes.
1. THE MODEL
We consider a dynamic two-country model – the foreign country, labelled by A and thehome country, labelled by B – each country being populated by overlapping generationsof two-period lived consumers.
1.1. TECHNOLOGY
Both countries produce one homogeneous consumption good thanks to a continuum ofcompetitive firms with one worker each. Firms can freely enter or exit the market, sothat any agent can start a firm and work in any period. Production requires two inputs:A certain amount of efficient labor, , and a country-specific, publicly available stockof knowledge. The stock of knowledge available at date t in country A ( B ) is denotedby at ( bt ). Per period output is simply the product of both inputs, so that using unitsof labor in period t returns units of good in country A and unitsof good in country B.
MANON DOMINGUES DOS SANTOS AND FABIEN POSTEL-VINAY
79
The first key assumption that we make is that the foreign country is technologicallymore advanced than the home country. To model this, we adopt the extreme assumptionthat, if both countries stay in autarchy, the technology in country B stagnates at someinitial level b, whereas the technology in country A grows at some positive rate g:at+1/at=1+g. Since we only want to focus on the consequences of this assumption, weshall keep g an exogenous constant: The developing country has no engine of growth ofits own whereas the developed country benefits from an exogenous source of techno-logical progress.1
1.2. PREFERENCES
Generations are of fixed, unit mass in each country. Upon being born, natives of thehome country are endowed with one unit of labor, =1. All agents have identical pref-erences over consumption, independently of their country of origin, given by:
U(c1, c2)=c1+c2 (1)
where c1 and c2 respectively denote consumption in youth and old age. For simplicity,we assume that agents don't discount the future and only care about total consumptionover their life cycle.
At the beginning of their life, natives of country B face an educational choice whichtakes the form of choosing the fraction ��[0, 1] of their youth that they will spend atschool. The cost of education is an opportunity cost (they will only spend a fraction (1-�)of their youth working and earning an income), while the reward to education isenhanced productivity. Specifically, an agent having spent � at school ends up withunits of efficient labor to supply per unit time. The parameter h thus loosely measures(1+h�) the efficiency of the schooling system in country B.
After their training period, workers are given the possibility to migrate to the moreadvanced country A with probability m. Moreover, conditional on getting a migrant'svisa, the visa is permanent with conditional probability p/m and temporary with condi-tional probability r/m=(m-p)/m. Temporary visas only allow migrants to stay in countryduring their youth, while permanent visas allow them to stay until they die. Temporaryvisa holders thus return to their home country, B, in their old age.
Given negligible migration costs (which we shall assume), natives of country B alwayswant to migrate to country A if offered the opportunity to do so provided that labor pro-ductivity is higher in country A than in country B. Throughout the paper, we shall
THE IMPACT OF TEMPORARY MIGRATION ON HUMAN CAPITAL ACCUMULATION AND ECONOMIC DEVELOPMENT
1 The way growth and migration dynamics would be modified under the assumption that both countries have anendogenous source of growth (based on human capital accumulation for instance) is left for later exploration. Theinterplay between endogenous growth, migration and knowledge diffusion is the issue in Domingues Dos Santos(1999), in a model where knowledge diffusion occurs through sheer technological imitation.
80
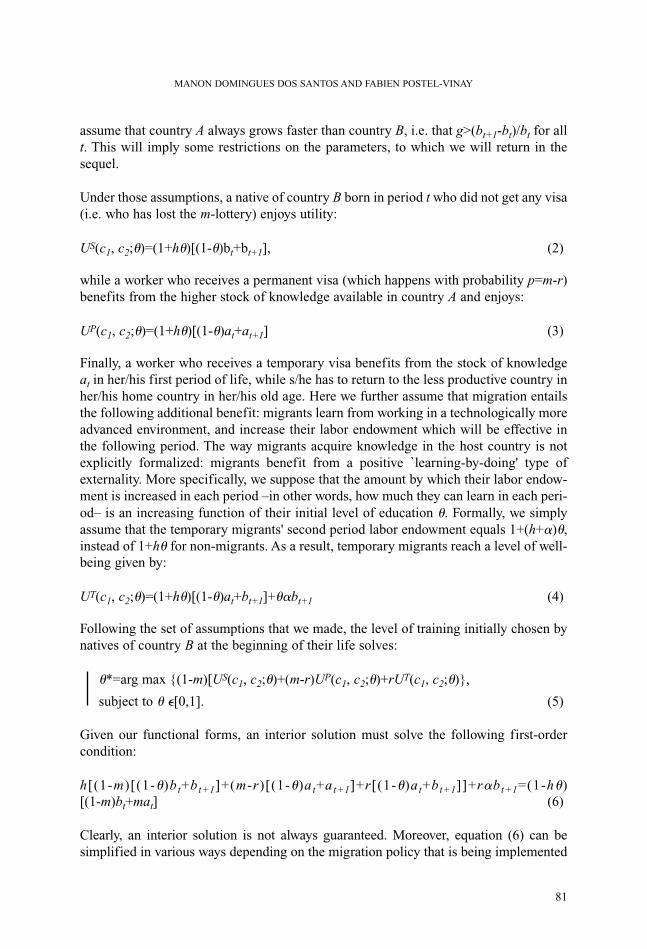
assume that country A always grows faster than country B, i.e. that g>(bt+1-bt)/bt for allt. This will imply some restrictions on the parameters, to which we will return in thesequel.
Under those assumptions, a native of country B born in period t who did not get any visa(i.e. who has lost the m-lottery) enjoys utility:
US(c1, c2;�)=(1+h�)[(1-�)bt+bt+1], (2)
while a worker who receives a permanent visa (which happens with probability p=m-r)benefits from the higher stock of knowledge available in country A and enjoys:
UP(c1, c2;�)=(1+h�)[(1-�)at+at+1] (3)
Finally, a worker who receives a temporary visa benefits from the stock of knowledgeat in her/his first period of life, while s/he has to return to the less productive country inher/his home country in her/his old age. Here we further assume that migration entailsthe following additional benefit: migrants learn from working in a technologically moreadvanced environment, and increase their labor endowment which will be effective inthe following period. The way migrants acquire knowledge in the host country is notexplicitly formalized: migrants benefit from a positive `learning-by-doing' type ofexternality. More specifically, we suppose that the amount by which their labor endow-ment is increased in each period –in other words, how much they can learn in each peri-od– is an increasing function of their initial level of education �. Formally, we simplyassume that the temporary migrants' second period labor endowment equals 1+(h+�)�,instead of 1+h� for non-migrants. As a result, temporary migrants reach a level of well-being given by:
UT(c1, c2;�)=(1+h�)[(1-�)at+bt+1]+��bt+1 (4)
Following the set of assumptions that we made, the level of training initially chosen bynatives of country B at the beginning of their life solves:
�*=arg max {(1-m)[US(c1, c2;�)+(m-r)UP(c1, c2;�)+rUT(c1, c2;�)},
subject to � �[0,1]. (5)
Given our functional forms, an interior solution must solve the following first-ordercondition:
h[(1-m)[(1-�)bt+bt+1]+(m-r)[(1-�)at+at+1]+r[(1-�)at+bt+1]]+r�bt+1=(1-h�)[(1-m)bt+mat] (6)
Clearly, an interior solution is not always guaranteed. Moreover, equation (6) can be simplified in various ways depending on the migration policy that is being implemented
MANON DOMINGUES DOS SANTOS AND FABIEN POSTEL-VINAY
81

(the parameters m and r). In the following section we will carry out an exhaustive analy-sis of all possible situations. Before we do this, however, we must define the law ofmotion of bt, the stock of knowledge in country B.
1.3. KNOWLEDGE ACCUMULATION
Here we simply assume that bt+1 (the stock of knowledge available in country B at datet+1) equals the output per old worker residing in country B. This assumption has twoparts. First, saying that next period productivity is proportional to output per worker inthis period is akin to a standard “learning-by-doing” hypothesis and probably needs nofurther comment. The second part of the assumption is that only old workers “count” inknowledge accumulation. This can be loosely justified by saying that only experiencedworkers effectively diffuse knowledge to their fellow workers. Here we will only saythat we make this assumption for analytical simplicity.2
Formally, we thus have:
(7)
where the last (approximate) equality stems from the fact that m and r, which are sharesof migrants in a generation, are typically small numbers. One thus sees that productiv-ity growth in country B has two sources: one is the direct effect on mean productivityof the initial education that workers choose to take ( h� ), and the other is the diffusionof knowledge due to temporary migrants returning from coutnry A in their old age.
2. EQUILIBRIUM CONFIGURATIONS
We now go through all the possible long-run equilibrium situations, the occurrence ofwhich depends on migration policy parameters m and r. We start with the simplest pos-sible case, which is autarky.
2.1. AUTARKY (m = 0)
Absent any migratory flows (m=0), the only source of knowledge accumulation in coun-try B is education. In this case it is easy to show, using (6) and (7), that the equilibriumvalues of �* and gB are as follows:
(8)
THE IMPACT OF TEMPORARY MIGRATION ON HUMAN CAPITAL ACCUMULATION AND ECONOMIC DEVELOPMENT
4 Assuming that young workers also contribute to knowledge accumulation is a straightforward extension of thissetting. It only leads to analytical complications without changing the main results.
82

The growth rate of country B thus only depends on the productivity of the educationalsystem, as measured by h. If it is low (h≤1/2), then the gains in terms of productivity(which are only proportional to the low technological stock bt in the absence of anyopportunity to migrate) are not enough to compensate for the opportunity cost of educ-tion. In this case, country B stagnates and its natives do not acquire any training.
As the efficiency of training rises (h>1/2), it becomes worthwhile for young workers toget some education, which increases their productivity and guarantees a positive growthrate for the economy B, through sheer learning by doing. Note in this case that ourassumption that country B always lags behind country A amounts to assuming that g>h,which is the maximum rate of growth attainable by country B.
2.2. POSITIVE MIGRATORY FLOWS (m > 0)
From the moment when some natives of country B are allowed to migrate (be it onlytemporarily) to country A, then the productivity level of country A, at, enters the typicalagent's arbitrage equation (6). Focusing on the long-run, and given the assumption thatcountry A always grows faster than country B, one can then simplify (6) if m>0 by notic-ing that bt becomes negligible compared to at as . Specifically, (6) simplifiesinto:
(9)
This formula gives the long-run equilibrium educational choice of country B natives,provided that it is an interior solution (i.e. it has to lie between 0 and 1).
This equilibrium value (and its consequences on the growth rate of economy B) againdepend on the particular migration policy that is being implemented. In this paper wewill be interested in the effects of r given a value of m, i.e. we want to analyze the impactof changing the proportion of temporary visas given a fixed total number of entry visas, m.Also, for expositional clarity, we start with the simple case where r=0, i.e. where allmigration is permanent.
2.2.1. PERMANENT VISAS ONLY: r = 0
In this case, keeping in mind that � cannot be outside of [0, 1], equations (7) and (9)imply the following equilibrium pattern:
(10)
MANON DOMINGUES DOS SANTOS AND FABIEN POSTEL-VINAY
83

The minimum value of h ensuring a positive growth rate for economy B now becomes1/(2+g), which is less than 1/2, the corresponding threshold in autarky. Otherwise stat-ed, allowing some people to migrate makes it more likely that the source economyexhibits sustained growth in the long-run. In particular, whenever 1/(2+g)<h≤1/2, coun-try B stagnated in autarky and grows under positive probability of migration. The rea-son is clearly that a positive probability of migration increases the private returns to edu-cation by a considerable amount —really an infinite amount, in the long-run. Natives ofcountry B thus get more training. Some of the benefits of this increased educationaleffort go to country A, as a share m of country B natives migrate and stay abroad for-ever. But since a share (1-m) of each generation is forced to stay in their home country,their educational effort contributes to increasing the productivity in country B. Ourmodel thus reproduces a stylized version of the mechanism originally pointed out byMountford (1997).
2.2.2. PERMANENT AND TEMPORARY VISAS (r > 0)
We now turn to the situation on which this paper is focused, i.e. the case where tempo-rary visas are issued, together with permanent ones. In order to stick to one single, “real-istic” case, we do this under the following restriction on the parameters:
Assumption 1. Country B stagnates in the “autarky” regime and sustains positive long-run growth with in the “permanent visas only” regime, i.e.
Clearly, this assumption is not necessary for the upcoming analysis. We only adopt it inorder not to have to distinguish between several degenerate sub-cases5. The lower boundh≥ 1/(2+g) ensures that (and thus ) are positive. The restriction h≤1/2 ensuresthat : country B stagnates in autarky. Finally, the condition h≤1/g ensures that
, i.e. country B natives spend at least some of their youth working (as opposedto getting educated). Note in passing that the bounds thus imposed on h are not as tightas it might first seem: since the time unit here is half the aldult life of a native of coun-try B (say, somewhere in the vicinity of 20 years), g is likely to be a fairly large num-ber. For instance, assuming that country A grows at 1.5 percent per annum, then1+g=1.01520~ 1.35, implying g~0.35. As a by-product of this quick look at reasonableorders of magnitude, one sees that the upper bound h≤1/g is not likely to place any addi-tional restriction on top of h≤1/2.
Formally, the analysis doesn't differ from the r=0 case: again using equations (7) and(9), we get:
THE IMPACT OF TEMPORARY MIGRATION ON HUMAN CAPITAL ACCUMULATION AND ECONOMIC DEVELOPMENT
5 A complete analysis is available upon request to the authors.
84
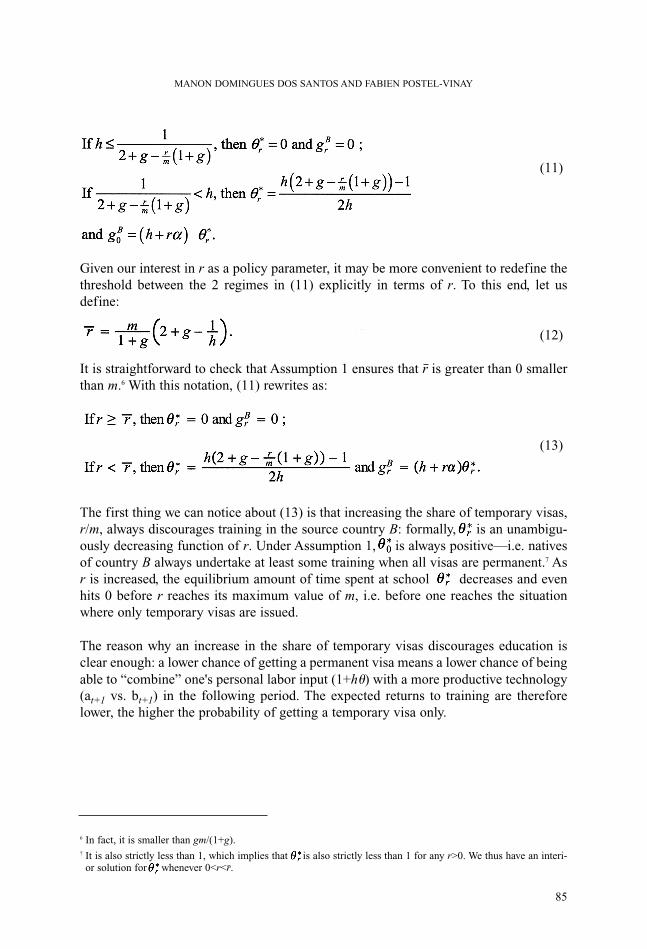
(11)
Given our interest in r as a policy parameter, it may be more convenient to redefine thethreshold between the 2 regimes in (11) explicitly in terms of r. To this end, let usdefine:
(12)
It is straightforward to check that Assumption 1 ensures that r is greater than 0 smallerthan m.6 With this notation, (11) rewrites as:
(13)
The first thing we can notice about (13) is that increasing the share of temporary visas,r/m, always discourages training in the source country B: formally, is an unambigu-ously decreasing function of r. Under Assumption 1, is always positive—i.e. nativesof country B always undertake at least some training when all visas are permanent.7 Asr is increased, the equilibrium amount of time spent at school decreases and evenhits 0 before r reaches its maximum value of m, i.e. before one reaches the situationwhere only temporary visas are issued.
The reason why an increase in the share of temporary visas discourages education isclear enough: a lower chance of getting a permanent visa means a lower chance of beingable to “combine” one's personal labor input (1+h�) with a more productive technology(at+1 vs. bt+1) in the following period. The expected returns to training are thereforelower, the higher the probability of getting a temporary visa only.
MANON DOMINGUES DOS SANTOS AND FABIEN POSTEL-VINAY
6 In fact, it is smaller than gm/(1+g).7 It is also strictly less than 1, which implies that is also strictly less than 1 for any r>0. We thus have an interi-
or solution for whenever 0<r<r.
85
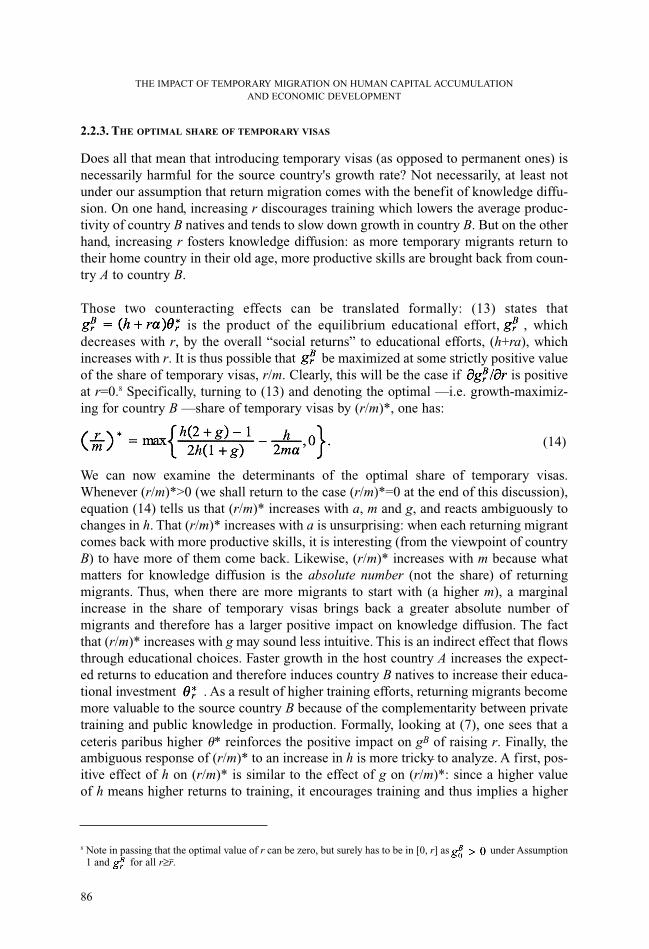
2.2.3. THE OPTIMAL SHARE OF TEMPORARY VISAS
Does all that mean that introducing temporary visas (as opposed to permanent ones) isnecessarily harmful for the source country's growth rate? Not necessarily, at least notunder our assumption that return migration comes with the benefit of knowledge diffu-sion. On one hand, increasing r discourages training which lowers the average produc-tivity of country B natives and tends to slow down growth in country B. But on the otherhand, increasing r fosters knowledge diffusion: as more temporary migrants return totheir home country in their old age, more productive skills are brought back from coun-try A to country B.
Those two counteracting effects can be translated formally: (13) states thatis the product of the equilibrium educational effort, , which
decreases with r, by the overall “social returns” to educational efforts, (h+ra), whichincreases with r. It is thus possible that be maximized at some strictly positive valueof the share of temporary visas, r/m. Clearly, this will be the case if is positiveat r=0.8 Specifically, turning to (13) and denoting the optimal —i.e. growth-maximiz-ing for country B —share of temporary visas by (r/m)*, one has:
(14)
We can now examine the determinants of the optimal share of temporary visas.Whenever (r/m)*>0 (we shall return to the case (r/m)*=0 at the end of this discussion),equation (14) tells us that (r/m)* increases with a, m and g, and reacts ambiguously tochanges in h. That (r/m)* increases with a is unsurprising: when each returning migrantcomes back with more productive skills, it is interesting (from the viewpoint of countryB) to have more of them come back. Likewise, (r/m)* increases with m because whatmatters for knowledge diffusion is the absolute number (not the share) of returningmigrants. Thus, when there are more migrants to start with (a higher m), a marginalincrease in the share of temporary visas brings back a greater absolute number ofmigrants and therefore has a larger positive impact on knowledge diffusion. The factthat (r/m)* increases with g may sound less intuitive. This is an indirect effect that flowsthrough educational choices. Faster growth in the host country A increases the expect-ed returns to education and therefore induces country B natives to increase their educa-tional investment . As a result of higher training efforts, returning migrants becomemore valuable to the source country B because of the complementarity between privatetraining and public knowledge in production. Formally, looking at (7), one sees that aceteris paribus higher �* reinforces the positive impact on gB of raising r. Finally, theambiguous response of (r/m)* to an increase in h is more tricky to analyze. A first, pos-itive effect of h on (r/m)* is similar to the effect of g on (r/m)*: since a higher value of h means higher returns to training, it encourages training and thus implies a higher
THE IMPACT OF TEMPORARY MIGRATION ON HUMAN CAPITAL ACCUMULATION AND ECONOMIC DEVELOPMENT
8 Note in passing that the optimal value of r can be zero, but surely has to be in [0, r] as under Assumption1 and for all r≥r.
86
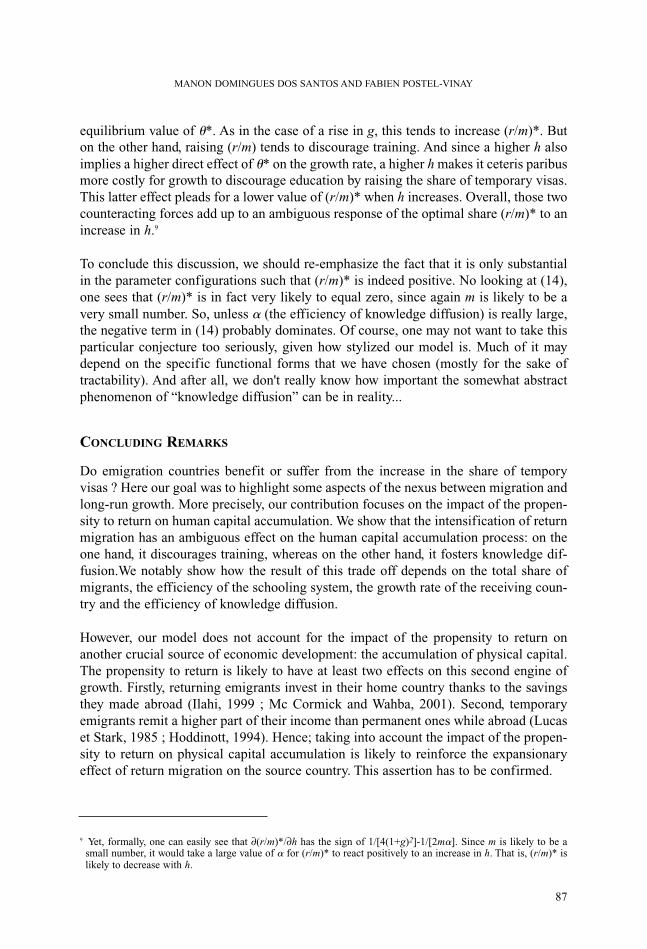
equilibrium value of �*. As in the case of a rise in g, this tends to increase (r/m)*. Buton the other hand, raising (r/m) tends to discourage training. And since a higher h alsoimplies a higher direct effect of �* on the growth rate, a higher h makes it ceteris paribusmore costly for growth to discourage education by raising the share of temporary visas.This latter effect pleads for a lower value of (r/m)* when h increases. Overall, those twocounteracting forces add up to an ambiguous response of the optimal share (r/m)* to anincrease in h.9
To conclude this discussion, we should re-emphasize the fact that it is only substantialin the parameter configurations such that (r/m)* is indeed positive. No looking at (14),one sees that (r/m)* is in fact very likely to equal zero, since again m is likely to be avery small number. So, unless � (the efficiency of knowledge diffusion) is really large,the negative term in (14) probably dominates. Of course, one may not want to take thisparticular conjecture too seriously, given how stylized our model is. Much of it maydepend on the specific functional forms that we have chosen (mostly for the sake oftractability). And after all, we don't really know how important the somewhat abstractphenomenon of “knowledge diffusion” can be in reality...
CONCLUDING REMARKS
Do emigration countries benefit or suffer from the increase in the share of temporyvisas ? Here our goal was to highlight some aspects of the nexus between migration andlong-run growth. More precisely, our contribution focuses on the impact of the propen-sity to return on human capital accumulation. We show that the intensification of returnmigration has an ambiguous effect on the human capital accumulation process: on theone hand, it discourages training, whereas on the other hand, it fosters knowledge dif-fusion.We notably show how the result of this trade off depends on the total share ofmigrants, the efficiency of the schooling system, the growth rate of the receiving coun-try and the efficiency of knowledge diffusion.
However, our model does not account for the impact of the propensity to return onanother crucial source of economic development: the accumulation of physical capital.The propensity to return is likely to have at least two effects on this second engine ofgrowth. Firstly, returning emigrants invest in their home country thanks to the savingsthey made abroad (Ilahi, 1999 ; Mc Cormick and Wahba, 2001). Second, temporaryemigrants remit a higher part of their income than permanent ones while abroad (Lucaset Stark, 1985 ; Hoddinott, 1994). Hence; taking into account the impact of the propen-sity to return on physical capital accumulation is likely to reinforce the expansionaryeffect of return migration on the source country. This assertion has to be confirmed.
MANON DOMINGUES DOS SANTOS AND FABIEN POSTEL-VINAY
9 Yet, formally, one can easily see that ∂(r/m)*/∂h has the sign of 1/[4(1+g)2]-1/[2m�]. Since m is likely to be asmall number, it would take a large value of � for (r/m)* to react positively to an increase in h. That is, (r/m)* islikely to decrease with h.
87

REFERENCES
Barrett A. and P. O'Connell, 2000. “Is there a wage premium for returning Irishmigrants?”, IZA Discussion Papers No 135.Barro R. and X. Sala-I-Martin, 1995. Economic Growth. McGraw-Hill.Beine M., F. Docquier and H. Rapoport, 2001. “Brain drain and economic growth:theory and evidence”, Journal of Development Economics, 64(1), 275-289.Borjas G. and B. Bratsberg, 1996. “Who leaves? The outmigration of the foreignborn”, Review of Economics and Statistics, 78(1), 165-176.Co C., I. Gang and M. Yun, 2000. “Returns to returning: who went abroad and whatdoes it matter?”, Journal of Population Economics, 13(1), 57-79.Djajic S. and R. Milbourne, 1988. “A general equilibrium model of guest-workermigration”, Journal of international Economics, 25, 335-351.Domingues Dos Santos M. and F. Postel-Vinay, 2003. “Migration as a source ofgrowth: The perspective of a developing country”, Journal of Population Economics,16, 161-175.Dustmann C., 1996. “Return migration: the European experience”, Economic Policy,215-250.Hoddinott J., 1994. “A model of migration and remittances applied to western Kenya”,Oxford Economic Papers, 46, 459-476.Ilahi N., 1999. “Return migration and occupational change”, Review of DevelopmentEconomics, 3, 170-186.Lucas R. and O. Stark, 1985. “Motivations to remit: evidence from Bostwana”,Journal of Political Economy, 93, 901-918.McCormick B. and J. Wahba, 2000. “Overseas work experience, savings and entre-preneurship amongs return migrants to LDCs”, Scottish Journal of Political Economy,48, 105-133.Mountford A., 1997. “Can a brain drain be good for growth in the source economy”,Journal of Development Economics, 53, 287-303.OECD, 1999. Trends in International Migration, OECD.Stark O., C. Helmenstein and A. Prskawetz, 1997. “A brain drain with a brain gain”Economics Letters, 55, 227-234.
THE IMPACT OF TEMPORARY MIGRATION ON HUMAN CAPITAL ACCUMULATION AND ECONOMIC DEVELOPMENT
88

WHO IS AFRAID OF THE BRAIN DRAIN?HUMAN CAPITAL FLIGHT AND GROWTH IN DEVELOPING
COUNTRIES*
HILLEL RAPOPORT
(DEPARTMENT OF ECONOMICS, BAR-ILAN UNIVERSITY, CADRE, UNIVERSITY
OF LILLE II, AND STANFORD CENTER FOR INTERNATIONAL DEVELOPMENT
(SCID), STANFORD UNIVERSITY)
ABSTRACT:This paper presents a non-technical review of the recent theoretical and empirical literature on thegrowth effects of the brain drain in developing countries. It focuses on the idea that migration prospectsmay foster human capital formation at home even after emigration is netted out. Channels throughwhich highly-skilled migrants continue to impact on their home country's economy are also reviewed,remittances, return migration, and the role of migrants' networks in promoting bilateral trade andknowledge diffusion.
JEL CLASSIFICATION: F22, J24, J68.
KEYWORDS: skilled migration, immigration policy, human capital, growth.
BRUSSELS ECONOMIC REVIEW - CAHIERS ECONOMIQUES DE BRUXELLESVOL. 47 - N°1 SPRING 2004
* This paper is the extended version of a policy brief written for SIEPR, the Stanford Institute for Economic PolicyResearch, in April 2002 (Rapoport, 2002). It draws on joint work with Michel Beine and Frederic Docquier(Beine et al., 2001 and 2003) and Ravi Kanbur (Kanbur and Rapoport, 2004). Correspondance: Hillel Rapoport,Department of Economics, Bar-Ilan University, 52900 Ramat Gan, Israel. Email: [email protected].
89

INTRODUCTION
The term “'brain drain” was first popularized in the 1950s with reference to the immi-gration to the US of first-rank scientists from countries such as the U.K., Canada, or theformer Soviet Union; it is now used in a more general sense to designate the interna-tional transfer of human capital (people with tertiary education) from developing todeveloped countries. During the 1970s, it was taken for granted that the emigration ofhighly-skilled people was detrimental to the origin countries. Many prestigious aca-demic economists (notably Jagdish Bhagwati) were part of this consensus and deliveredmore or less the following message: i) the brain drain is basically a negative externali-ty imposed on those left behind in developing countries; it amounts to a zero-sum game,with the rich countries getting richer and the poor countries getting poorer; and, iii) at apolicy level, the international community should implement a mechanism wherebyinternational transfers could compensate the origin countries for the losses incurred asa result of the brain drain, for example in the form of an income "tax on brains" (latercoined "Bhagwati Tax") to be redistributed internationally.1 This view is perfectly illus-trated in the following citation:
“In contrast to the case of foreign investment, where the gain from the internationalfactor movement is divided by the two countries, the developed country gains now atthe cost of those left behind in the less-developed country. The emigrants similarlyare seen to gain at the sacrifice of those left behind'' (Hamada, 1977, p. 20)
During the last two decades, there has been a tremendous increase in the magnitude of thebrain drain. However, as I explain below, it may well be that some developing countries,if not the majority of them, have experienced a social gain from this brain drain. The mainreason for this is that migration prospects increase the expected return to education in poorcountries and, hence, foster domestic enrollment in education. When this incentive (or"brain") effect dominates the observed emigration (or "drain") effect, the origin countrymay in fact end up with more human capital than its erstwhile no-migration human capi-tal stock. I first summarize in Section 1 the data on the magnitude of the brain drain, andthen consider in Section 2 the possible positive feedbacks for the origin country, showingthat these are unlikely to compensate for potential losses. The central idea of the new braindrain theoretical literature, namely, that migration prospects may foster human capital for-mation in developing countries even after actual emigration is netted out, is exposed inSection 3. Section 4 summarizes the results from recent empirical studies who found sup-portive evidence for the beneficial brain drain hypothesis. The last Section concludes.
1. HOW BIG IS THE BRAIN DRAIN ?
Although the numbers may be disputable, it is clear that the brain drain has increaseddramatically since the 1970s. Indeed, nearly thirty years ago, the United Nations estimated
WHO IS AFRAID OF THE BRAIN DRAIN?HUMAN CAPITAL FLIGHT AND GROWTH IN DEVELOPING COUNTRIES
1 See the special issue of the Journal of Public Economics edited by Bhagwati on “Income taxation in the pres-ence of international personal mobility”, August 1982.
90

the total number of highly-skilled South-North migrants for 1961-72 at only 300,000(UNCTAD, 1975); less than a generation later, in 1990, the U.S. Census revealed thatthere were more than 2.5 million highly educated immigrants from developing countriesresiding in the U.S. alone, excluding people under the age of 25 (that is, without count-ing most foreign students). Country studies commissioned by the International LaborOrganization also showed that nearly 40% of Philippines' emigrants are college educat-ed, and, more surprisingly, that Mexico in 1990 was the world's third largest exporter ofcollege-educated migrants (Lowell and Findlay, 2001).
Until recently, there were no comparative data on the magnitude of the brain drain. Suchdata are now available thanks to William Carrington and Enrica Detragiache from theInternational Monetary Fund, who used US 1990 Census data and other OECD data toconstruct estimates of emigration rates at three educational levels (primary, secondaryand tertiary) for about 50 developing countries (Carrington and Detragiache, 1998 –henceforth CD). The CD estimates, however, suffer from four main shortcomings. First,it is assumed for each country that the skill composition of its emigration to non-USOECD countries is identical to that of its emigration to the US; consequently, the CDestimates are reliable only for countries for which the US is the main migration desti-nation. Second, at the time Carrington and Detragiache conducted their study, the EUimmigration data did not allow for a full decomposition of the immigrants' origin-mix;more precisely, most EU countries used to publish statistics indicating the country oforigin only for the top 5 or 10 sending countries. For small countries not captured inthese statistics, the figures reported in the CD data set are therefore clearly biased: thetotal number of emigrants is under-estimated, and one is (mis)led to conclude that 100%of those who immigrated to countries belonging to the OECD immigrated to the US; asacknowledged by Carrington and Detragiache, this may approximate the reality forLatin America, but is clearly erroneous, for example, in the case of Africa. Third, theCD data set excludes South-South migration, which may be significant in some cases(e.g., migration to the Gulf States from Arab and Islamic countries).
The CD data set is an important step towards building a fully-harmonized data set onmigration rates by education levels. However, it must be used with caution because thereliability of the CD estimates for a given country depends on whether the US immi-gration data gives a good quantitative and qualitative approximation of overall migra-tion outflows from that country. In an effort to reflect the limitations of the CD data,Table 1 thus splits the Carrington and Detragiache estimates into three groups of coun-tries: it is only for group A, composed mainly of Latin American countries, that the CDestimates may be considered reliable.
Finally, due to the definition of immigrants as foreign-born individuals, children arriv-ing with their parents and who acquired higher education in the host country later on arecounted as highly-skilled immigrants; this is a source of over-estimation of the braindrain, which is potentially important for some countries.
HILLEL RAPOPORT
91

TABLE 1. MIGRATION RATE OF SKILLED WORKERS PER COUNTRY OF ORIGIN
WHO IS AFRAID OF THE BRAIN DRAIN?HUMAN CAPITAL FLIGHT AND GROWTH IN DEVELOPING COUNTRIES
Code Country Brain drain Migration rate US Immigrants US Immigrants(in %) (in %) (in volume) (in % of OECD)
PART A: Limited sample with highly reliable countries (30 countries)Guy Guyana 77,5 14,5 61936 100,0Jam Jamaica 77,4 20,3 159913 61,0Tat Trinitad-Tobago 57,8 9,5 65810 100,0Sal El Salvador 26,1 11,3 263625 100,0Gha Ghana 25,7 0,4 12544 53,3Pan Panama 19,6 6,7 68583 100,0Nic Nicaragua 18,8 4,7 61168 100,0Hon Honduras 15,7 3 54346 100,0Kor South Korea 14,9 4,2 377940 36,0Dom Dominican Rep. 14,7 6,5 187871 96,7Gua Guatemala 13,5 3,4 127346 100,0Mex Mexico 10,3 7,7 2743638 100,0Phi Philippines 9 3,1 728454 71,6CR Costa Rica 7,1 2,4 28784 100,0Pak Pakistan 6,7 0,3 52717 35,2Chl Chile 6 1,1 36252 54,3Col Colombia 5,8 1,1 162739 96,9Egy Egypt 5 0,5 53261 50,6Bol Bolivia 4,2 0,7 18772 100,0Ecu Ecuador 3,8 1,9 89336 100,0Uru Uruguay 3,8 1,1 15716 100,0Per Peru 3,4 1 86323 87,1Chn China 3 0,1 404579 51,5Arg Argentina 2,7 0,6 64080 72,3Ind India 2,6 0,2 304030 44,1Ven Venezuela 2,1 0,4 22634 77,4Par Paraguay 2 0,2 4313 100,0Indo Indonesia 1,5 na 32172 90,5Tha Thailand 1,5 0,2 53118 87,6Bra Brazil 1,4 0,2 53904 44,0
Part B: Small countries with missing non-US immigration data (21 countries)Gam Gambia 61,4 0,2 747 100,0SL Sierra Leone 24,3 0,3 4155 100,0Fi Fiji 21,3 3,6 11420 100,0Ug Uganda 15,5 0,1 5060 100,0Ken Kenya 10 0,1 8372 100,0Moz Mozambique 8,6 na 920 100,0Mau Mauritius 7,2 0,2 1100 100,0Zam Zambia 5 0,1 1613 100,0Zim Zimbabwe 4,7 0,1 3161 100,0Cam Cameroon 3,2 na 1694 100,0Syr Syria 3 0,7 27504 100,0Les Lesotho 2,9 na 160 100,0Png Papua-NG 2,2 na 480 100,0Rwa Rwanda 2,2 na 200 100,0Malw Malawi 2 na 381 100,0Sud Sudan 1,8 na 2496 100,0CAR Central African Rep. 1,7 na 160 100,0Tog Togo 1,3 na 460 100,0Mali Mali 0,9 na 220 100,0Con Congo 0,5 na 200 100,0Ben Benin 0,4 na 180 100,0
Part C: Countries with a share of US emigrants lower than 30% (8 countries)Tun Tunisia 63,3 8,6 2816 1,1Alg Algeria 55 6,3 3904 0,6Sen Senegal 47,7 2,4 1370 2,0Tur Turkey 46,2 8,5 43605 1,9SrL Sri Lanka 23,6 0,8 8751 14,1Mal Malaysia 22,7 1,2 15261 18,2
92
Table 1 reveals that the brain drain is a general phenomenon, at work for all types of developing countries (large and small), from all regions of the developing world:from the CD figures, it comes that the total cumulative loss of “brains” by region maybe set at approximately 15% (of the remaining stock of people with tertiary education)for Central America, 6% for Africa, 3% for South America, and 5% for Asia.
Since 1990, the chief causes of the brain drain have gained in strength and it is there-fore likely that the trends described above have been confirmed. Indeed, selectiveimmigration policies first introduced in Australia and Canada in the 1980s havespread to other OECD countries: the Immigration Act of 1990 as well as the substan-tial relaxation of the quota for highly-skilled professionals (H1-B visas) in the US cer-tainly constitute the most influential change in immigration policy over the lastdecade; in addition, a growing number of EU countries (notably France, Germany andthe UK) have recently introduced similar programs aiming at attracting a qualifiedworkforce (OECD, 2002). In the current context of globalization, such selectiveimmigration policies can only reinforce the natural tendency for human capital toagglomerate where it is already abundant.
What are the consequences for sending countries? To the same extent that immigrationof a skilled labor force is seen as beneficial to receiving countries, it would seem thatdepriving developing countries from one of their most scarce resources can only affecttheir growth prospects negatively. In fact, such a pessimistic view may be mitigated intwo ways: first, there could be positive feedbacks for the source country in terms ofremittances or technology transfers; second, one has to correctly qualify the no-migra-tion scenario and wonder about the right counterfactual when it comes to evaluating thegrowth effects of the brain drain.
2. WHAT FEEDBACK EFFECTS ?
Obviously, the brain drain may induce positive feedback effects as emigrants contin-ue to affect the economy of their origin countries. Such possible feedbacks includemigrants' remittances, return migration after additional skills have been acquiredabroad, and the creation of networks that facilitate trade, capital flows and knowl-edge diffusion.2
In the case of migrants' transfers, we know from the remittances literature that the twomain motivations to remit are altruism, on the one hand, and exchange, on the otherhand. It is well-known that altruism is primarily directed towards one's immediate family,and then decreases in intensity with social distance. By contrast, in principle, no suchproximity is required in the case of exchange; the exchange-based theory of remittances
HILLEL RAPOPORT
2 See Rapoport and Docquier (2003) for a review of the remittances literature, and Domingues Dos Santos andPostel Vinay (2003) on return migration and knowledge diffusion.
93
posits that remittances simply buy various types of services such as taking care of themigrant’s assets (e.g., land, cattle) or relatives (children, elderly parents) at home. Suchtransfers are typically observed in case of a temporary migration and signal themigrants’ intention to return. Hence, someone moving with his or her immediate fami-ly on a permanent basis is less likely to remit (or is likely to remit less) than someonemoving alone on a temporary basis. And indeed, we know from household surveys thatdespite their higher earnings potential, educated migrants tend to remit relatively lessthan their unskilled compatriots, precisely because they migrate on a more permanentbasis (with family). This is confirmed at an aggregate level by Faini (2002), who showsthat migrants’ remittances decrease with the proportion of skilled individuals amongemigrants and concludes that “this result suggests that the negative impact of the braindrain cannot be counterbalanced by higher remittances”.
As to return migration, we also know that in general, return migration is not signif-icant among the highly educated unless sustained growth preceded return. For example, less than a fifth of Taiwanese PhDs who graduated from US universities inthe 1970s in the fields of Science and Engineering returned to Taiwan (Kwok andLeland, 1982) or Korea, a proportion that rose to about one half to two-thirds in the course of the 1990s, after two decades of impressive growth in these countries.Interestingly, the figures for Chinese and Indian PhDs graduating from US univer-sities in the same fields during the period 1990-99 are fairly identical to what they were for Taiwan or Korea 20 years ago (stay rates of 87% and 82%, respec-tively) (OECD, 2002). In the case of India, Saxeenian (2001) shows that despite thequick rise of the Indian software industry, only a fraction of Indian engineers inBangalore are returnees. Hence, there seems to be no room for optimism on thisfront either, return skilled migration appearing more as a consequence than has atrigger of growth.
Another channel whereby the brain drain may positively affect the source country isthrough the creation of business and trade networks; such a “Diaspora externality” haslong been recognized in the sociological literature3 and, more recently, by economists inthe field of international trade. In many instances indeed, and contrarily to what onewould expect in a standard trade-theoretic framework, trade and migration appear to becomplements rather than substitutes (e.g., Gould, 1994). Interestingly, such a comple-mentarity has been shown to prevail mostly for trade in heterogeneous goods, where eth-nic networks help overcoming information problems linked to the very nature of thegoods exchanged (Rauch and Casella, 2002, Rauch and Trindade, 2003). How is therelationship of substitutability or complementary between trade and migration impact-ed by the skill composition of migration, however, remains unclear. In the same vein,whether FDI and migration are substitutes (as one would expect) or complementsremains an unanswered question. On the whole, the evidence on the exact role played
WHO IS AFRAID OF THE BRAIN DRAIN?HUMAN CAPITAL FLIGHT AND GROWTH IN DEVELOPING COUNTRIES
3 Gaillard and Gaillard (1997), and Lowell and Findlay (2001), review this literature.
94
by the highly educated in the creation of trade, business and scientific networks has sofar been too anecdotal and limited to undermine the strongly negative view of the braindrain that has prevailed until recently.
3. AN OPTIMAL BRAIN DRAIN ? THEORY
Modern theories of endogenous growth have considerably renewed the analysis of therelations between education, migration and growth. Unsurprisingly, the first models toaddress the issue of the brain drain in an endogenous growth framework all emphasizedits negative effects (e.g., Miyagiwa, 1991, Haque and Kim, 1995). At the same time,however, a series of studies have tried to promote the simple idea that one should alsolook at how a given stock of human capital is built up. In particular, it is likely that inthe presence of huge inter-country wage differentials, as is the case between developingand developed countries, the prospect for migration deeply modifies the incentive struc-ture faced by developing countries’ residents when making their education decisions.
The idea that education investments are impacted by migration prospects is not new,however, and may be traced back in the brain drain literature at least to Bhagwati andHamada (1974) and McCullock and Yellen (1977). The novelty in the more recent liter-ature lays primarily in the introduction of uncertainty into the migration process, creat-ing the possibility of a gain for the source country. The conditions required for this pos-sibility to materialize have been the subject of a number of theoretical contributions(Mountford, 1997, Stark et al., 1998, Vidal, 1998, Docquier and Rapoport, 1999, Beineet al., 2001). Using a slightly different perspective, Stark et al. (1997) elaborated on thepossibility of a brain gain associated with a brain drain in a context of imperfect infor-mation with return migration. McCormick and Wahba (2000) also obtained the resultthat more highly-skilled migration may benefit to those left behind, but in a trade-theo-retic model where migration, remittances and domestic labor-market outcomes arejointly determined and multiple equilibria arise, with the high-migration equilibriumpareto-dominating the low-migration equilibrium. Finally, holding wage differentialsconstant but allowing for differences in the variability of the rate of return to humancapital, Katz and Rapoport (2001, 2003) argued that migration imparts education withan option value and showed that increased variability may well increase the expected(post migration) stock of human capital at origin.
The basic mechanisms at work in these models are best illustrated through a numericalexample. Assume, for example, that the expected annual wage premium for someonewith tertiary education is $5,000 in the home country and $30,000 in the U.S.; then,even a relatively small probability of immigration to the US, of, say, 20%, has a hugeeffect on the expected return to human capital (in this numerical example, it is exactlydoubled assuming a zero emigration probability for an unskilled individual) and, there-fore, is likely to foster domestic enrollment in education significantly even after emi-gration is netted out.
HILLEL RAPOPORT
95

For this to occur it is essential to assume that education is a necessary but insufficientcondition for migration. In other words, the education decision made during one's youthis made under uncertainty regarding future migration, with educated agents facing aprobability p to be allowed to migrate and a probability (1-p) to stay home once adults.Such uncertainty may be due to personal or external factors, the most obvious justifi-cation for the context of uncertainty being that international mobility is restricted byimmigration authorities at destination, and is so with some arbitrariness. To account forthis, assume that the probability of migration depends solely on the achievement of agiven educational requirement, which is observable, and not on individuals' ability,which are not (i.e., migrants are assumed to be randomly selected among those who sat-isfy some kind of prerequisite with informational content regarding their ability - in ourcase, education). This is clearly a simplification, however; in reality, immigrationauthorities may be combining education with other selection devices such as tests of IQor host-country language fluency. Would IQ be a perfect signal of ability and the onlycriterion retained, migration could only be detrimental to human capital formation athome (since the ability distribution is assumed to be given). Still, and to the extent thatIQ or other tests are imperfect signals of ability, introducing them into these modelswould not affect the quality of the results. Indeed, their main effect would be to intro-duce a probability, q(a), q'>0, that an educated applicant would receive an entry visa. Inthis setting, migration prospects still increase the expected return to education (even forindividuals with relatively low success probability), with the expected impact on humancapital formation at home depending on the steepness of the success profile at differentability levels.
Figure 1 provides a simple diagrammatic interpretation of the essence of the resultsfrom these models. Assume that individual ability is uniformly distributed on the space[a, a] with people above a certain ability threshold choosing to invest in education andpeople below that threshold choosing not to invest in education. Assume also thathuman capital is the sole engine of growth, with the rate of growth depending on theproportion of educated in the country. In increasing the expected return to education,the effect of migration prospects is then to move the critical ability to the left. Figure 1shows very clearly the two effects of migration on human capital formation (i.e., thatskilled emigrants are drawn out of a larger pool of educated people when the economyis opened to migration). Denoting by aF and aE the ability of the individual who is indif-ferent as to whether to invest in education in the closed and the open economy, respec-tively, one can see from Figure 1 that the proportion of educated among the remainingpopulation (the proportion B/A+B) may well be higher in the latter case:4
WHO IS AFRAID OF THE BRAIN DRAIN?HUMAN CAPITAL FLIGHT AND GROWTH IN DEVELOPING COUNTRIES
4 Note that for diagrammatic convenience, we represented the partition of the population between groups A (theuneducated), B (the remaining educated) and C (the educated emigrants) as if the migrants were self-selectedinstead of being randomly selected among the educated.
96

FIGURE 1. THE PARTITION OF THE POPULATION INTO DIFFERENT SUB-GROUPS
4. WHO LOSES, WHO WINS, AND HOW MUCH ? EVIDENCE
To the best of our knowledge, the first study to attempt at estimating the growth effectsof the brain drain using cross-country comparisons is our joint work with Michel Beineand Frederic Docquier (Beine et al., 2001); in a cross-section of 37 developing coun-tries, we found that migration prospects have a positive and significant impact onhuman capital formation at origin, especially for countries with low initial GDP percapita levels. This was a first but imperfect try because, at the time the study was writ-ten (in 1998), we had no comparative data on international migration by education lev-els and therefore used gross migration rates as a proxy measure for the brain drain.Thanks to Carrington and Detragiache (1998), such comparative data became availablelater and in a subsequent study, we used the CD estimates on emigration rates for thehighest (tertiary) education level as our brain drain measure; again, we found a positiveand highly significant effect of migration prospects on human capital formation, thistime in a cross-section of 50 developing countries (Beine et al., 2003).
We also computed country specific effects, with the following results. First, countriesthat experienced a positive growth effect (the ‘winners’) generally combined low levelsof human capital and low migration rates, whereas the ‘losers’ were typically charac-terized by high migration rates and/or high enrollment rates in higher education (this isquite intuitive, since in this case most migrants are picked up from a stock of people thatwould have engaged in education even without contemplating emigration). Second, weshowed that except for extreme cases such as Guyana and Jamaica, the growth effectsof the brain drain were relatively limited: around plus or minus a maximum of 0.20% interms of annual GDP per capita growth; this is not negligible, however, in a dynamicperspective. Finally, it was also striking that while there were more losers than winners,the latter included the largest countries in terms of demographic size (China, India,Indonesia, Brazil) and represented more than 80% of the total population of the sample.
Although it is a simplification, our results are suggestive of an inverse U-shaped rela-tionship between migration and growth: too much migration is detrimental, but too lit-tle is sub-optimal. Interestingly, the within-country result predicted by the theory out-lined above (i.e., that some migration should be good as long as it is not excessive) is
HILLEL RAPOPORT
97
a aaF
A B
a aaE
A B C

what comes out at the cross-country level apparent on Figure 2. The X-axis gives theCarrington-Detragiache migration rates for the highly educated and the Y-axis gives thenet growth effect of the brain drain as computed by Beine et al. (2003). The variabilityacross countries at given migration rates is due to the impact of other right hand sidevariables, and the curve itself is adjusted using a second-order polynomial.
FIGURE 2. BRAIN DRAIN AND LDC'S GROWTH
CONCLUSION
The main conclusion to draw from the above analysis is that for any given developingcountry, the optimal migration rate of its highly educated population is likely to be pos-itive. Whether the current rate is greater or lower than this optimum is an empiricalquestion that must be addressed country by country. This implies that countries thatwould impose restrictions on the international mobility of their educated residents,arguing for example that emigrants' human capital has been largely publicly financed,could in fact decrease the long-run level of their human capital stock. This also suggeststhat rich countries should not necessarily see themselves as free riding on poor coun-tries’ educational efforts. The difficulty is then to design quality-selective immigrationpolicies that would address the differentiated effects of the brain drain across origincountries without distorting too much the whole immigration system; this could beachieved, at least partly, by designing specific incentives to return migration to thosecountries most negatively affected by the brain drain, and promote international coop-eration aiming at more brain circulation.
WHO IS AFRAID OF THE BRAIN DRAIN?HUMAN CAPITAL FLIGHT AND GROWTH IN DEVELOPING COUNTRIES
98
Egypt
South Korea
Dominican Rep Nicaragua
HondurasGuatemala
Mexico
Philippines
Costa Rica
ArgentinaChile
BoliviaUruguayPeruEcuador
Brazil ColombiaThailand
IndonesiaPakistan
China
India
Venezuela
Paraguay
-0,04
-0,02
0,00
0,02
0,04
0 2 4 6 8 10 12 14 16 18 20
Emigration rate of tertiary educated workers (in %)
Net
eff
ect
on a
nnua
l GDP
gro
wth
rat
e (i
n %
)

On a final note, it may be appropriate to emphasize that we are well aware of the factthat our empirical findings need to be confirmed before we may seriously challenge theconventional view on the brain drain. As explained above, our results are based oncross-section regressions, meaning that we neglect the dynamics of migration rates aswell as the dynamics of education levels and that, due to the absence of a time seriesdimension, it is impossible to control for individual-country effects in the regressionestimates. Given the strong heterogeneity of the sample (in terms of countries' sizes,levels of development, etc.), such country-fixed effects are likely to play some role inthe value of the estimates. The underlying drawbacks of the methodology used so fartherefore call for the collection of additional data: improving the Carrington-Detragiache observations for the year 1990 and combining them with new data pointsfor each country of the sample would make it possible not only to extend the time frameof our research but also to address some of its methodological limitations.
HILLEL RAPOPORT
99

REFERENCES
Beine M., F. Docquier and H. Rapoport, 2001. “Brain Drain and Economic Growth:Theory and Evidence”, Journal of Development Economics, 64(1), 275-89.Beine M., F. Docquier and H. Rapoport, 2003. Brain Drain and LDCs’ Growth:Winners and Losers, IZA Discussion Papers No 819, July.Bhagwati J.N. and K. Hamada, 1974. “The brain drain, international integration ofmarkets for professionals and unemployment”, Journal of Development Economics, 1(1),19-42.Carrington W.J. and E. Detragiache, 1998. “How Big is the Brain Drain?”, IMFWorking Paper No 98.Docquier F. and H. Rapoport, 1999. “Fuite des cerveaux et formation de capitalhumain”, Economie Internationale, 79, 63-71.Domingues Dos Santos M. and F. Postel-Vinay, 2003. “Migration as a source ofgrowth: The perspective of a developing country”, Journal of Population Economics,16(1), 161-75.Faini R., 2002. “Dévelopement, commerce international et migrations”, Revued’Economie du Développement, 2, 85-116.Gaillard J. and A.M. Gaillard, 1997. “The international migration of brains: Exodusor circulation?”, Science, Technology and Society, 2(2).Hamada K., 1977. “Taxing the brain drain: A global point of view”, in Jagdish N.Bhagwati, ed.: The New International Order, Cambridge, Mass.: M.I.T. Press.Haque N.U. and S.-J. Kim, 1995. “'Human capital flight': impact of migration onincome and growth”, IMF Staff Papers, 42(3), 577-607.Kanbur R. and H. Rapoport, 2004. “Migration selectivity and the evolution of spa-tial inequality”, Journal of Economic Geography, forthcoming.Katz E and H. Rapoport, 2001. Macroeconomic instability, migration and the optionvalue of education, CREDPR Working Paper No 121, Stanford University, October.Katz E. and H. Rapoport, 2003. “On human capital formation with exit options”,Journal of Populations Economics, forthcoming.Kwok V. and H. Leland, 1982. “An economic model of the brain drain”, AmericanEconomic Review, 72(1), 91-100.Lowell L.B. and A.M. Findlay, 2001. “Migration of highly-skilled persons from evel-oping countries: impact and policy responses”, Geneva: International Labour Office,Draft Synthesis Report.McCormick B. and J. Wahba, 2000. “Overseas unemployment and remittances to adual economy”, Economic Journal, 110, 509-34.McCullock R. and J.T. Yellen, 1977. “Factor mobility, regional development and thedistribution of income”, Journal of Political Economy, 85(1), 79-96.Miyagiwa K., 1991. “Scale economies in education and the brain drain problem”,International Economic Review, 32(3), 743-59.Mountford A., 1997. “Can a brain drain be good for growth in the source economy?”,Journal of Development Economics, 53(2), 287-303.OECD, 2002. International mobility of the highly-skilled, OECD Policy Brief, Paris, July.
WHO IS AFRAID OF THE BRAIN DRAIN?HUMAN CAPITAL FLIGHT AND GROWTH IN DEVELOPING COUNTRIES
100

Rapoport H., 2002. Who is afraid of the brain drain? Human capital flight and growthin developing countries. SIEPR Policy Brief, Stanford University, April.Rapoport H. and F. Docquier, 2003. The economics of migrants' remittances; in L.-A.Gerard-Varet, S.-C. Kolm and J. Mercier Ythier, eds.: Handbook of the Economics ofReciprocity, Giving and Altruism, Amsterdam: North-Holland, forthcoming.Saxeenian A., 2001. Bangalore, the Silicon Valley of India?, CREDPR Working PaperNo 91, Stanford University.Stark O., C. Helmenstein and A. Prskawetz, 1997. “A brain gain with a brain drain”,Economics Letters, 55, 227-34.Stark O., C. Helmenstein and A. Prskawetz, 1998. Human capital depletion, humancapital formation, and migration: A blessing or a 'curse'?, Economics Letters, 60(3),363-7.UNCTAD, 1975. The reverse transfer of technology: Its dimensions, economic effects,and policy implications, New York: United Nations Conference on Trade andDevelopment.Vidal J.-P., 1998. “The effect of emigration on human capital formation”, Journal ofPopulation Economics, 11(4), 589-600.
HILLEL RAPOPORT
101

BRAIN DRAIN AND REMITTANCES: IMPLICATIONS FOR THE
SOURCE COUNTRY*
DILEK CINAR (CADRE, UNIVERSITY OF LILLE) AND FREDERIC DOCQUIER
(CADRE, IZA BONN, IWEPS)
ABSTRACT:In this paper, we model a developing economy in which individual decisions about education and migra-tion are constrained by capital market imperfections (liquidity constraints). We examine the joint impactof brain drain and international remittances on human capital accumulation in the emigration country. Wederive the condition under which the emigration of the most talented workers stimulates the economy-wideaverage stock of human capital in the sending country (compared to the closed economy benchmark). Sucha BBD outcome (beneficial brain drain) is obtained (i) when the return to education is high compared tothe costs of education and migration and (ii) when remittances received by each young are important.Unlike recent papers in that literature, the BBD cannot be obtained if emigration rates are small.
JEL CLASSIFICATION: F22, J24, J61, J68.
KEYWORDS: skilled migration, immigration policy, human capital, growth.
BRUSSELS ECONOMIC REVIEW - CAHIERS ECONOMIQUES DE BRUXELLESVOL. 47 - N°1 SPRING 2004
* We thank Michele Cincera, Hillel Rapoport, Abdeslam Marfouk and Mouna Aguir for useful comments. Theusual disclaimer applies.
103

INTRODUCTION
This paper mixes two strands of the literature on international migration, i.e. the eco-nomics of international remittances and the economics of the brain drain. Our purpose isto analyze the effects of increasingly “quality-selective” immigration policies on humancapital in the source countries when talented emigrants remit a part of their earnings.Clearly, the joint impact of brain drain and international remittances is ambiguous. Onthe one hand, international remittances increase ceteris paribus the welfare of remainingresidents. On the other hand, the brain drain resulting from the quality selection is usu-ally seen as a detrimental phenomenon for the sending country. We combine these twointerrelated facts and examine their global impact on human capital formation.
Regarding international transfers, it is well documented that workers’ remittances oftenmake a significant contribution to GNP and are a major source of income in manydeveloping countries. For labor-exporting countries such as Egypt, Pakistan, Turkey,Caribbean or Pacific countries, it is not uncommon to observe flows of remittances thatequal about half the value of their exports or 10% of their GDP. These remittances mayhave a short-run macroeconomic impact through their effects on price or exchange ratelevels (see Djajic, 1986). The long run implications of remittances are also likely to besignificant. They impinge on households’ decisions in terms of labor supply, invest-ment, education, migration, occupational choice, fertility with potentially importantaggregated effects1. This is especially the case in poor countries where capital marketimperfections (liquidity constraints) reduce investment possibilities in low-incomeclasses. Since dollars are fungible and education has a relatively high income-elasticity,one would expect remittances to have significant positive effects on the educationalattainments of children from households with emigrants. Few studies have looked for -and found - clear evidence on this potential link between remittances and education.Hanson and Woodruff (2002) use the 2000 Mexican Census and show that children inhouseholds with a migrant member complete significantly more years of schooling,with an estimated increase that ranges from 0.7 to 1.6 years of schooling. Interestingly,the gain is the highest for the categories of children traditionally at risk of being droppedfrom school, i.e. girls and older children (13 to 15 year-olds). In their study on ElSalvador, Cox Edwards and Ureta (2003) show that remittances significantly contributeto lower the hazard of leaving school.
Regarding brain drain, there is a fair amount of evidence suggesting that the brain drainis now much more extensive than, say, 25 years ago. Since 1984, Australia's immigra-tion policy has officially privileged skilled workers, with the candidates selectedaccording to their prospective ''contribution to the Australian economy''. The Canadianimmigration policy follows along similar lines, resulting in an increasing share of high-ly educated people among the immigrants selected. In the US, the Immigration Act of
BRAIN DRAIN AND REMITTANCES: IMPLICATIONS FOR THE SOURCE COUNTRY
104
1 See Rapoport and Docquier (2003) for a survey.
1990 established the selection of highly skilled workers through a system favoring can-didates with academic degrees and/or specific professional skills. Immigration policiesin EU countries are less clear and still oriented towards traditional targets such as asy-lum seeking and family reunion. However, there is some evidence suggesting thatEuropean countries (such as Germany) are also leaning towards becoming quality-selective2.
The classical literature on the economic impact of brain drain emphasizes that the wel-fare of those left behind would fall if migrants' contribution to the economy is greaterthan their marginal product (this is obviously the case when the social return to educa-tion exceeds its private return)3. However, recent studies suggest that migrationprospects can boost human capital accumulation4, or that some gain can be associatedwith imperfect information and return migration5.
This paper belongs to the literature on the economic impact of brain drain for the sourcecountries. We show that brain drain can boost the stock of human capital per capitawhen the resulting remittances are sufficiently high. To demonstrate this result, we builda simple theoretical supply-side model examining the enhancing effect of remittanceson human capital formation.
Along the lines suggested by Perotti (1993), we consider that liquidity constraintsimpede educational investment and migration within the low and medium income class-es. Since education is a prerequisite for migration, emigrants belongs to the most tal-ented class (those who can afford paying for both education and migration costs). Thisassumption seems particularly realistic for developing countries. Such a brain drain hasa negative direct impact on the stock of human capital per capita. Skilled emigrants thenremit a part of the migration gains. There are evidence reveal that remittances increasewith remitters' income. In the UK, Kangasmieni et al (2004) show that 45 percent ofdoctors send remittances to their home country (on average, these transfers amount to16 percent of their income in the UK). In our framework, remittances enable some liq-uidity constrained agents to pay for education costs.
Our results reveal that the global effect of brain drain can be positive under some spe-cific conditions. The return to education must be high, compared to the costs of educa-tion and migration, remittances received by each young must be high. Hence, unlikemost recent papers on the beneficial effect of brain drain, a positive impact can beobtained if the number of skilled emigrants is sufficiently large.
DILEK CINAR AND FREDERIC DOCQUIER
105
2 See the contribution of Bauer and Kunze in this special issue.3 See Haque and Kim (1995) or Grubel and Scott (1996).4 See Mountford (1997), Vidal (1998), Beine et al (2001).5 See Stark et al. (1997).

The remainder of this paper is organized as follows. Section 1 presents our assumptions.The closed economy solution is briefly described in Section 2. The open economy equi-librium is characterized in Section 3. Then, Section 4 provides the conditions underwhich a beneficial brain drain is obtained. Finally, the last Section concludes.
1. ASSUMPTIONS
Our model depicts a small developing economy with overlapping generations of house-holds. Individuals live for two periods, youth and adulthood. At the beginning of theirlife, they decide whether to invest in education or not, by maximizing their life-cycleincome. Education is modeled as a “take it or leave it” decision.
We introduce heterogeneity by considering that the inherited level of human capital ofthe young (denoted by yi) is exogenously distributed on the domain [0,y]. Low skill andhigh skill workers are perfect substitutes on the local labor market6. The wage rate perefficiency unit of human capital is constant and normalized to unity. Hence, yi alsomeasures individual's income.
For the sake of simplicity, we consider a stationary uniform density function:
(1)
If he opts for education, each young agent faces a fixed cost ye and expects to get a rateof return to education, R. The cost of educational service is fully borne privately. Thishypothesis clearly holds in most developing countries. As in Perotti (1993), the returnto education is higher than its cost for all individuals: R>ye (see assumption A1 below).However, liquidity constraints impede human capital investment within low-incomeclasses. Individuals whose income is lower than the education cost cannot borrow to payfor human capital formation.
At the end of the first period of life, educated agents have the possibility to emigrate toa richer country at an exogenous migration cost ym. As in Mountford (1999), Vidal(1999) and Beine et al. (2001), a central assumption of our model is that education is anecessary prerequisite for migration (emigrants are partly out-selected). However, weassume that education is also a sufficient condition. By migrating, educated agents selltheir human capital at a higher price: they get a higher rate of return than in the domes-tic country (R*>R). The return gap exceeds migration cost: migration always increaseslifetime income (see assumption A2 below). However, liquidity constraints are imped-ing migration within middle income classes: agents cannot borrow to pay for migrationcosts (emigrants are partly self-selected).
Consequently, the effective migrants belong to the upper-income class of the population(those who can afford paying for education and migration costs). Our model thus repro-duces the brain drain phenomenon.
BRAIN DRAIN AND REMITTANCES: IMPLICATIONS FOR THE SOURCE COUNTRY
106

Our purpose is to examine the effect of brain drain on the average level of human cap-ital of remaining members. We do not formalize the externalities associated to humancapital but consider them as a crucial by-product of our analysis. At this stage, braindrain is unambiguously detrimental for human capital accumulation. However, if weconsider that migrants remit a constant fraction of their foreign wage, these remittancesenable some liquidity-constrained agents to pay for the education cost in the sourcecountry: a higher share of the population has an access to human capital formation. Thisbeneficial effect must then be compared to the detrimental effect sketched above.
For altruistic reasons that we do not explicitly formalize here, we consider that migrantsremit a fraction � of the return gap on human capital (R*-R ) to their origin country. Thisassumption is made for analytical convenience. Similar results would be obtained byassuming that migrants remit a constant fraction of their income. The source country issmall and cannot influence the size of the return gap.
Young agents from generation t (young at time t) receive an amount of altruistic trans-fers �t from the previous generation of emigrants. We do not deal with intergenerationalmobility in the ability scale and with endogenous differences in the amount transferred.For simplicity, we assume that each young receives an identical amount of remittances 7.
The decision to educate for agent i is denoted by a discrete variable eit (eit=1 denotesinvesting in education and eit=0 denotes no access to education). Similarly, the decisionto migrate is denoted by a discrete variable mit (mit=1 denotes opting for migration andmit=0 denotes not to migrate). Individuals choose eit and mit so as to maximize lifetimeincome W(eit,mit ) subject to a non-negativity constraint on saving, i.e.
(2)
subject to: yi+�t- eit ye-mitym≥0
Our set of assumptions can be written as follows:
A1: For each agent i, the rate of return on education exceeds the education cost: Wit (1,0)>Wit(0,0). Formally, this requires R>ye.
A2: For each educated agent i, migration always induces a gain in lifetime income: Wit (1,1)>Wit(1,0). Formally, this requires (R*-R) (1-�)>ym.
DILEK CINAR AND FREDERIC DOCQUIER
6 Introducing imperfect substitution would not change the nature of our effects.7 Galor and Zeira (1993) examine the inequality effects of the transmission of wealth within families.
[ ]( )( ) ( )[ ])(1
),(
**
,
RReReymReym
ymyeymeWMax
it mititiititiit
mit
eittiititit
me itit
−−+++−+
−−+≡
θ
τ
107
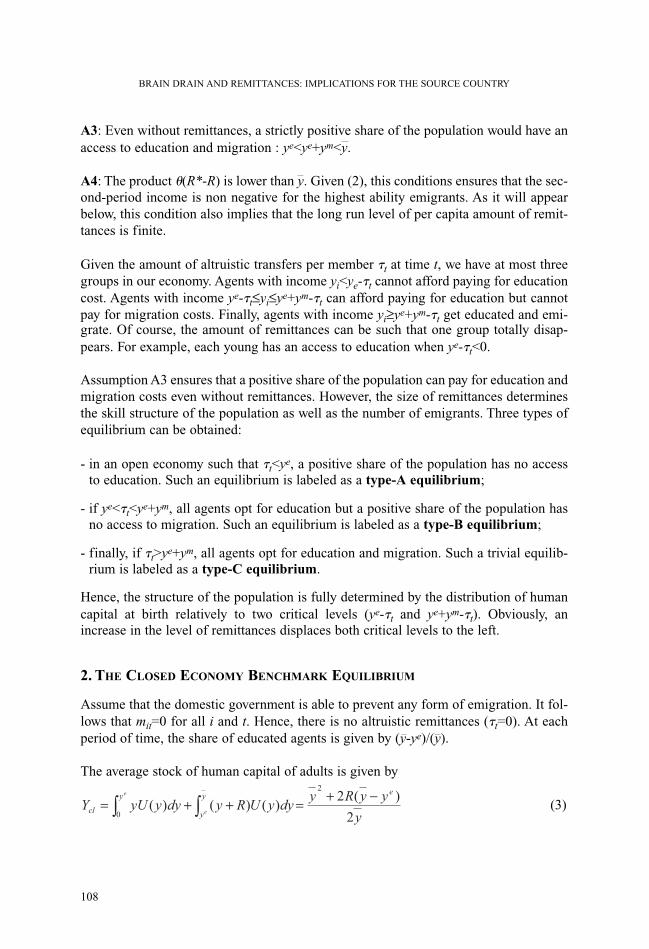
A3: Even without remittances, a strictly positive share of the population would have anaccess to education and migration : ye<ye+ym<y.
A4: The product �(R*-R) is lower than y. Given (2), this conditions ensures that the sec-ond-period income is non negative for the highest ability emigrants. As it will appearbelow, this condition also implies that the long run level of per capita amount of remit-tances is finite.
Given the amount of altruistic transfers per member �t at time t, we have at most threegroups in our economy. Agents with income yi<ye-�t cannot afford paying for educationcost. Agents with income ye-�t≤yi≤ye+ym-�t can afford paying for education but cannotpay for migration costs. Finally, agents with income yi≥ye+ym-�t get educated and emi-grate. Of course, the amount of remittances can be such that one group totally disap-pears. For example, each young has an access to education when ye-�t<0.
Assumption A3 ensures that a positive share of the population can pay for education andmigration costs even without remittances. However, the size of remittances determinesthe skill structure of the population as well as the number of emigrants. Three types ofequilibrium can be obtained:
- in an open economy such that �t<ye, a positive share of the population has no accessto education. Such an equilibrium is labeled as a type-A equilibrium;
- if ye<�t<ye+ym, all agents opt for education but a positive share of the population hasno access to migration. Such an equilibrium is labeled as a type-B equilibrium;
- finally, if �t>ye+ym, all agents opt for education and migration. Such a trivial equilib-rium is labeled as a type-C equilibrium.
Hence, the structure of the population is fully determined by the distribution of humancapital at birth relatively to two critical levels (ye-�t and ye+ym-�t). Obviously, anincrease in the level of remittances displaces both critical levels to the left.
2. THE CLOSED ECONOMY BENCHMARK EQUILIBRIUM
Assume that the domestic government is able to prevent any form of emigration. It fol-lows that mit=0 for all i and t. Hence, there is no altruistic remittances (�t=0). At eachperiod of time, the share of educated agents is given by (y-ye)/(y).
The average stock of human capital of adults is given by
(3)
BRAIN DRAIN AND REMITTANCES: IMPLICATIONS FOR THE SOURCE COUNTRY
108
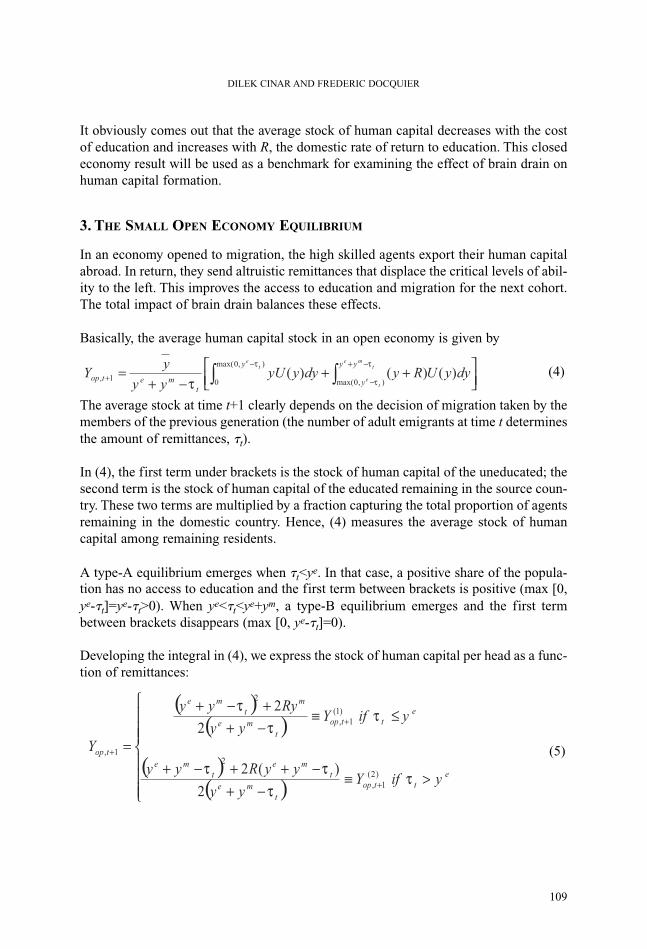
It obviously comes out that the average stock of human capital decreases with the costof education and increases with R, the domestic rate of return to education. This closedeconomy result will be used as a benchmark for examining the effect of brain drain onhuman capital formation.
3. THE SMALL OPEN ECONOMY EQUILIBRIUM
In an economy opened to migration, the high skilled agents export their human capitalabroad. In return, they send altruistic remittances that displace the critical levels of abil-ity to the left. This improves the access to education and migration for the next cohort.The total impact of brain drain balances these effects.
Basically, the average human capital stock in an open economy is given by
(4)
The average stock at time t+1 clearly depends on the decision of migration taken by themembers of the previous generation (the number of adult emigrants at time t determinesthe amount of remittances, �t).
In (4), the first term under brackets is the stock of human capital of the uneducated; thesecond term is the stock of human capital of the educated remaining in the source coun-try. These two terms are multiplied by a fraction capturing the total proportion of agentsremaining in the domestic country. Hence, (4) measures the average stock of humancapital among remaining residents.
A type-A equilibrium emerges when �t<ye. In that case, a positive share of the popula-tion has no access to education and the first term between brackets is positive (max [0,ye-�t]=ye-�t>0). When ye<�t<ye+ym, a type-B equilibrium emerges and the first termbetween brackets disappears (max [0, ye-�t]=0).
Developing the integral in (4), we express the stock of human capital per head as a func-tion of remittances:
(5)
DILEK CINAR AND FREDERIC DOCQUIER
109

The general function Yop,t+1 is determined by or by according to the sign of�t-ye. Obviously, when �t-ye=0, and coincide. Hence, the analysis of the smallopen economy solution requires a complete description of the dynamics of altruisticremittances.
Clearly, the current level of altruistic remittances is related to the number of emigrantswithin the previous generation. Since liquidity constraints are restricting migrationopportunities, the past flow of emigration is itself related to the past amount of remit-tances. The small open economy problem is intertemporal: the amount remitted at timet depends on the amount remitted at time t-1.
Remember that each young receives an identical amount of transfers (there is no spe-cific wealth transmission rule). It follows that the aggregate amount of remittances isequally shared among the young:
(6)
This dynamic equation �t=�(�t-1) fully describes the time path of altruistic transfers and,given (5), the time path of the average human capital stock per adult. Let us now focuson the steady state equilibrium of our small open economy. The following result isobtained:
Proposition 1. The steady state level of altruistic transfers is given by
.
Using assumption A4, this long run solution is strictly positive and globally stable.
Proof: Using �t=�t-1=� in (6) clearly gives �SS. The stability property of this steady statecan be studied by examining the derivative �'.
One obtains .
Given A4, the steady state is globally stable.
Figure 1 illustrates how changes in �(R*-R), determining both
and the slope of the dynamic locus, affect the type of equilibrium. In each case, theunique intersection wit the 45° line corresponds to a steady state.
BRAIN DRAIN AND REMITTANCES: IMPLICATIONS FOR THE SOURCE COUNTRY
110
( )( )( )RRy
yyyRR mess
−−−−−=
*
*
θθτ
1)(
'0*
1
<−=∂∂
=<− y
RR
t
t θττ
φ
( ) ( ) ( )me yyyy
RR −−−=*
0θφ

FIGURE 1. ALTRUISM AND THE STEADY STATE AMOUNT OF TRANSFERS – DYNAMIC REPRESENTATION
• For small values of �(R*-R), the steady state is depicted by point A. The long-runamount of remittances ( ) is lower than : a positive share of the population has noaccess to education (type-A equilibrium).
• For intermediate values of �(R*-R), the steady state is depicted by point B. The long-run amount of remittances ( ) lies between ye and ye+ym: all agents have an accessto education and a positive fraction of the population is staying put (type-B equilibrium).
• For high values of �(R*-R), the steady state is depicted by point C. The long-run amountof remittances ( ) is above ye+ym: all agents educate and emigrate so that the popula-tion size tends to zero (type-C equilibrium).
Let us now determine the type of equilibrium as a function of the parameters of our model:
Corollary 1. A type-A solution emerges when �(R*-R)< .
A type-B solution emerges when <�(R*-R)<ye+ym .
A type-C solution emerges when �(R*-R)>ye+ym.
Proof. The condition for a type-A equilibrium is �SS<ye . Conditions for a type-B equi-librium are �SS>ye together with �SS<ye+ym. A condition for a type-C equilibrium isye+ym<�SS<y.
DILEK CINAR AND FREDERIC DOCQUIER
111
�t
�A ye ye+ym
A
B
C
45°
SS
�ASS
�BSS
�BSS
�CSS
�CSS �t-1
m
e
yy
yy
−
m
e
yy
yy
−
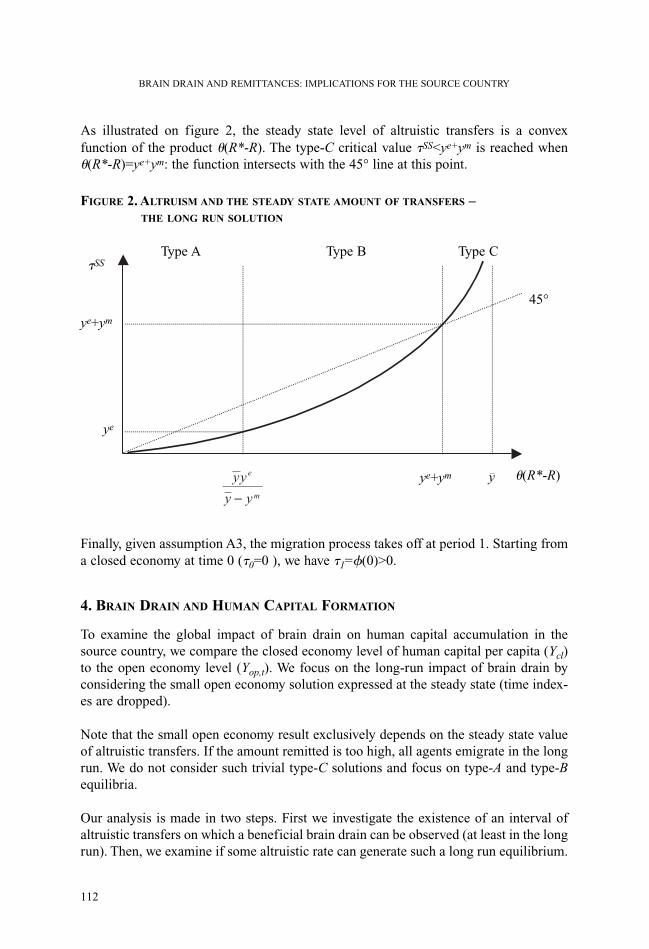
As illustrated on figure 2, the steady state level of altruistic transfers is a convex function of the product �(R*-R). The type-C critical value �SS<ye+ym is reached when�(R*-R)=ye+ym: the function intersects with the 45° line at this point.
FIGURE 2. ALTRUISM AND THE STEADY STATE AMOUNT OF TRANSFERS – THE LONG RUN SOLUTION
Finally, given assumption A3, the migration process takes off at period 1. Starting froma closed economy at time 0 (�0=0 ), we have �1=�(0)>0.
4. BRAIN DRAIN AND HUMAN CAPITAL FORMATION
To examine the global impact of brain drain on human capital accumulation in thesource country, we compare the closed economy level of human capital per capita (Ycl)to the open economy level (Yop,t). We focus on the long-run impact of brain drain byconsidering the small open economy solution expressed at the steady state (time index-es are dropped).
Note that the small open economy result exclusively depends on the steady state valueof altruistic transfers. If the amount remitted is too high, all agents emigrate in the longrun. We do not consider such trivial type-C solutions and focus on type-A and type-Bequilibria.
Our analysis is made in two steps. First we investigate the existence of an interval ofaltruistic transfers on which a beneficial brain drain can be observed (at least in the longrun). Then, we examine if some altruistic rate can generate such a long run equilibrium.
BRAIN DRAIN AND REMITTANCES: IMPLICATIONS FOR THE SOURCE COUNTRY
112
�SS
ye+ym
ye+ym y
ye
Type A Type B Type C
45°
m
e
yy
yy
−
�(R*-R)
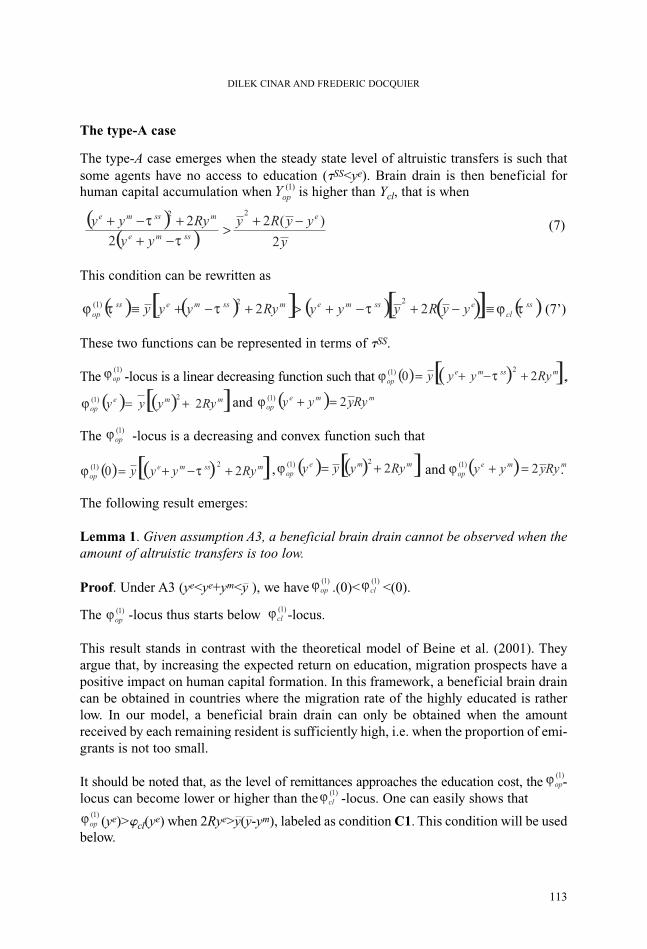
The type-A case
The type-A case emerges when the steady state level of altruistic transfers is such thatsome agents have no access to education (�SS<ye). Brain drain is then beneficial forhuman capital accumulation when is higher than Ycl, that is when
(7)
This condition can be rewritten as
(7’)
These two functions can be represented in terms of �SS.
The -locus is a linear decreasing function such that ,
and .
The -locus is a decreasing and convex function such that
, and .
The following result emerges:
Lemma 1. Given assumption A3, a beneficial brain drain cannot be observed when theamount of altruistic transfers is too low.
Proof. Under A3 (ye<ye+ym<y ), we have .(0)< <(0).
The -locus thus starts below -locus.
This result stands in contrast with the theoretical model of Beine et al. (2001). Theyargue that, by increasing the expected return on education, migration prospects have apositive impact on human capital formation. In this framework, a beneficial brain draincan be obtained in countries where the migration rate of the highly educated is ratherlow. In our model, a beneficial brain drain can only be obtained when the amountreceived by each remaining resident is sufficiently high, i.e. when the proportion of emi-grants is not too small.
It should be noted that, as the level of remittances approaches the education cost, the -locus can become lower or higher than the -locus. One can easily shows that
(ye)>�cl(ye) when 2Rye>y(y-ym), labeled as condition C1. This condition will be usedbelow.
DILEK CINAR AND FREDERIC DOCQUIER
113
)1(
opY

The type-B case
The type-B case emerges when the steady state level of remittances is such that allagents become educated (�SS>ye). Brain drain is then beneficial for human capital for-mation when is higher than Ycl, that is
(8)
This may be rewritten as
(8’)
These two functions can be represented in terms of �SS. The �cl-locus is identical to thatobtained in the type-A case. The -locus is also a decreasing and convex function such
that and
.
Graphically, the -locus intersects with the -locus when the amount remitted isequal to the education cost. Then it decreases and intersects with the �cl-locus when�SS=ye+ym. Does the -locus approach the �cl-locus from above of from below? Toanswer this question, one has to compare the derivatives at �SS=ye+ym. Given is aconvex and decreasing function, it approaches �cl from above when its derivative issmaller, i.e. when 2Rye>y, labeled as condition C2. This condition will be used below.
Global result
Let us now combine type-A and type-B equilibria. Three possible cases can be distin-guished according to inequality C1 and inequality C2.
• In case (a), we consider that C1 does not hold. This implies (ye)< �cl(ye), i.e.2Rye<y(y-ym). It follows that C2 does not hold too, i.e. 2Rye<y. The �op-locus isalways below the �cl-locus and brain drain is always detrimental for human capitalaccumulation.
• In case (b), we consider that C1 holds (2Rye>y(y-ym)) but C2 does not hold (2Rye<y).The �op-locus is above the �cl-locus for intermediate values of remittances, i.e. forintermediate migration rates. The possibility of beneficial brain drain exists if theemigration rate is not too small and not too large.
• In case (c), we consider that both C1 and C2 hold (2Rye>y(y-ym) and 2Rye>y), the�op-locus is above the �cl-locus for sufficiently high values of remittances. The pos-sibility of beneficial brain drain exists if the emigration rate is sufficiently high.
BRAIN DRAIN AND REMITTANCES: IMPLICATIONS FOR THE SOURCE COUNTRY
114
)1(opY
( ) ( )( )
( )y
yyRy
yy
yyRyy e
ssme
ssmessme
2
2
2
222 −+>
−+−++−+
τττ
( ) ( ) ( )[ ] ( )sscl
ssmessmessop yyRyyy τϕτττϕ >−++−+≡ 2
2)2(
)2(opϕ
)2(opϕ
)2(opϕ
)2(opϕ
)1(opϕ
)1(opϕ
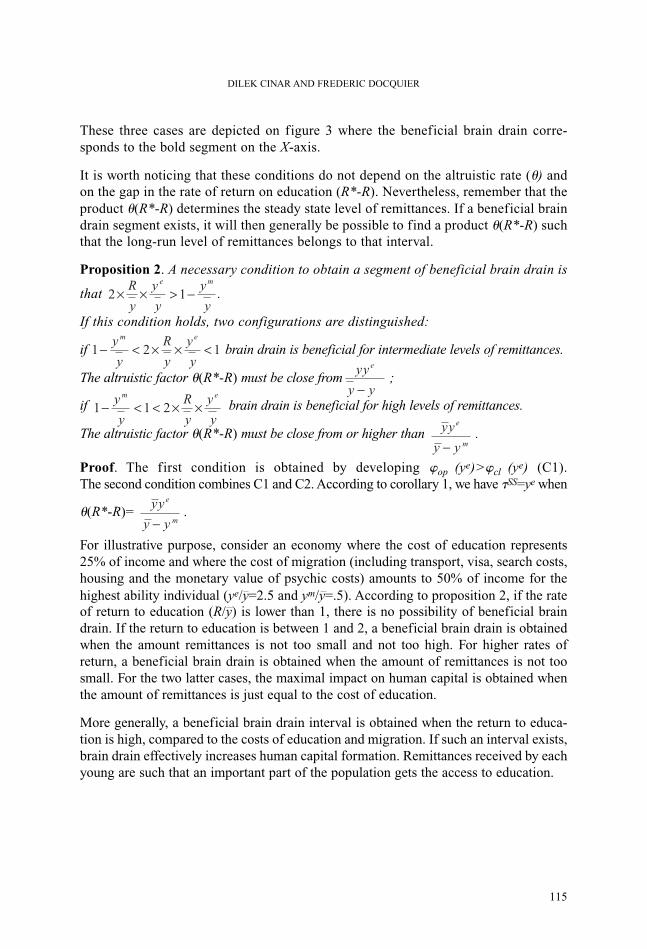
These three cases are depicted on figure 3 where the beneficial brain drain corre-sponds to the bold segment on the X-axis.
It is worth noticing that these conditions do not depend on the altruistic rate (�) andon the gap in the rate of return on education (R*-R). Nevertheless, remember that theproduct �(R*-R) determines the steady state level of remittances. If a beneficial braindrain segment exists, it will then generally be possible to find a product �(R*-R) suchthat the long-run level of remittances belongs to that interval.
Proposition 2. A necessary condition to obtain a segment of beneficial brain drain is
that .
If this condition holds, two configurations are distinguished:
if brain drain is beneficial for intermediate levels of remittances.
The altruistic factor �(R*-R) must be close from ;
if brain drain is beneficial for high levels of remittances.
The altruistic factor �(R*-R) must be close from or higher than .
Proof. The first condition is obtained by developing �op (ye)>�cl (ye) (C1). The second condition combines C1 and C2. According to corollary 1, we have �SS=ye when
�(R*-R)= .
For illustrative purpose, consider an economy where the cost of education represents25% of income and where the cost of migration (including transport, visa, search costs,housing and the monetary value of psychic costs) amounts to 50% of income for thehighest ability individual (ye/y=2.5 and ym/y=.5). According to proposition 2, if the rateof return to education (R/y) is lower than 1, there is no possibility of beneficial braindrain. If the return to education is between 1 and 2, a beneficial brain drain is obtainedwhen the amount remittances is not too small and not too high. For higher rates ofreturn, a beneficial brain drain is obtained when the amount of remittances is not toosmall. For the two latter cases, the maximal impact on human capital is obtained whenthe amount of remittances is just equal to the cost of education.
More generally, a beneficial brain drain interval is obtained when the return to educa-tion is high, compared to the costs of education and migration. If such an interval exists,brain drain effectively increases human capital formation. Remittances received by eachyoung are such that an important part of the population gets the access to education.
DILEK CINAR AND FREDERIC DOCQUIER
115
y
y
y
y
y
R me
−>×× 12
121 <××<−y
y
y
R
y
y em
e
yy
yy
−
m
e
yy
yy
−
y
y
y
R
y
y em
××<<− 211
m
e
yy
yy
−

FIGURE 3. ON THE POSSIBILITY OF A BENEFICIAL BRAIN DRAIN
Case (a): Detrimental brain drain
Case (b): Beneficial brain drain for intermediate migration rates
Case (c): Beneficial brain drain for high migration rates
BRAIN DRAIN AND REMITTANCES: IMPLICATIONS FOR THE SOURCE COUNTRY
�op(1)
�op(1)
�op(1)
�op(2)
�op(2)
�op(2)
�cl
�cl
�cl
ye ye+ym �SS
ye ye+ym �SS
ye ye+ym �SS
BBD
BBD
116
CONCLUSION
In this paper, we examine the consequences of the migration of skilled workers onhuman capital accumulation in the source country. Our model relies on two majorassumptions: (i) liquidity constraints impede human capital investment in low-incomeclasses and (ii) migrants altruistically remit a part of their earnings into the source coun-try. In the long-run, brain drain involves two opposite effects on human capital forma-tion:
- the most educated (those who can afford paying for both education and migrationcosts) are leaving the source country, reducing the average level of human capital forthose staying put (traditional effect);
- international remittances enable some liquidity constrained agents to pay for educa-tion costs, raising the proportion of agents opting for education (better access toschooling).
A beneficial brain drain can be obtained when the better access to schooling dominatesthe traditional effect: the migration of skilled workers associated to altruistic transferscan then be beneficial for human capital accumulation.
We thus explore the theoretical conditions under which such an outcome appears. It isshown that a beneficial brain drain is obtained under some restricted conditions. Moreprecisely, it requires that the level of altruistic transfers per capita must be such that alarge share of population gets the access to education. Such a condition does not holdin developing countries. Hence, despite the fact that remittances is a major source ofincome for remaining residents, they should not be large enough to stimulate the econ-omy-wide average level of education. Once negative spillover effects are considered(intergenerational and intragenerational externalities associated to human capital), thenet impact on remaining residents' welfare is ambiguous.
DILEK CINAR AND FREDERIC DOCQUIER
117
REFERENCES
Beine M., F. Docquier and H. Rapoport, 2001. “Brain drain and Economic devel-opment: theory and evidence”, Journal of Development Economics, 64, 275-289.Cox Edwards A. and M. Ureta, 2003. “International migration, remittances andschooling: Evidence from El Salvador”, Journal of Development Economics, forthcoming.Djajic S., 1986. “International migration, remittances and welfare in a dependenteconomy”, Journal of Development Economics, 21, 229-34.Galor O. and J. Zeira, 1993. “Income distribution and macroeconomics”, Review ofEconomic Studies, 60, 35-52.Grubel H.G. and A. Scott, 1996. “The international flow of human capital”, AmericanEconomic Review, 56, 268-74.Hanson G.H. and C. Woodruff, 2002. “Emigration and educational attainment inMexico”, Mimeo., University of California at San Diego.Haque N.U. and S.-J. Kim, 1995. “Human capital flight: Impact of migration onincome and growth”, IMF Staff Papers, 42(3), 577-607.Kangasmieni M., L.A. Winters and S. Commander, 2004. “Is the medical brain drainbeneficial? Evidence from overseas doctors in the UK”, Mimeo, CNEM, LondonBusiness School.Mountford A., 1997. “Can a brain drain be good for growth in the source economy?”,Journal of Development Economics, 53(2), 287-303.Perotti R., 1993. “Political equilibrium, income distribution and growth”, Review ofEconomic Studies, 60, 755-776.Rapoport H. and F. Docquier, 2004. “The economics of migrants' remittances”, inL.A. Gerard-Varet, S.C. Kolm and J. Mercier Ythier (eds), Handbook of the Economicsof Reciprocity, Giving and Altruism, Amsterdam: North-Holland, forthcoming.Stark O., C. Helmenstein and A. Prskawetz, 1997. “A brain gain with a brain drain”,Economic Letters, 55, 227-234.Vidal J.-P., 1998. “The effect of emigration on human capital formation”, Journal ofPopulation Economics, 11(4), 589-600.
BRAIN DRAIN AND REMITTANCES: IMPLICATIONS FOR THE SOURCE COUNTRY
118
TEMPORARY MIGRATION AND SELF-EMPLOYMENT :EVIDENCE FROM TUNISIA
ALICE MESNARD
(INSTITUTE OF FISCAL STUDIES, LONDON)
ABSTRACT:Based on statistics from the Central bank of Tunisia and on a survey describing Tunisian workers who havereturned from migration, this paper shows that temporary migration has potentially important conse-quences for sending countries like Tunisia. The effects operate through at least two channels. On one hand,transfers sent by migrants to their origin country represent a sizeable source of foreign currency andincome. On the other, savings repatriated upon return under different types of goods allow poor workersto overcome credit constraints for investment into small projects.
JEL CLASSIFICATION: E22, F22, H81.
KEYWORDS: international migration, investment, credit constraints.
BRUSSELS ECONOMIC REVIEW - CAHIERS ECONOMIQUES DE BRUXELLESVOL. 47 - N°1 SPRING 2004
119

INTRODUCTION
It has long been recognised that the effects on the countries of migrant workers of remit-tances sent home by them depend crucially on whether they are used for consumptionor investment. In the 1970s, most socioeconomic studies outlined the strong negativeeffects of remittances used for conspicuous consumption (e.g. expensive houses) withlimited dynamic effects (see for example Rempel and Lodbell (1978). Remittances mayalso increase relative deprivation of non migrants or discourage labour-supply effort forrecipients, thus increasing dependency and postponing rural development (see Durandet al (1996) for a critical review of these arguments). At the same time, a few studiesfollowing Griffin (1976) and Stark (1978, 1991) started challenging this view, by stress-ing the positive effects of remittances on development. They showed that remittancescontribute also to finance investments in production, in particular in poor rural areascharacterised by very limited access to credit markets and that they may provide coin-surance to household members, hence permitting poor households to invest into riskyprojects.
Recently, capital market failures have been emphasized extensively as an aid to under-standing barriers to development. Because of limited commitment or moral hasard prob-lems, poor workers do not have free access to credit when they want to invest, implyinglong run effects on economic growth1. This gave rise to several empirical papers, show-ing that liquidity constraints are important in explaining occupational choices of work-ers. A flourishing literature emphasized the positive effect of individual wealth on entre-preneurship in developed countries (see for examples Evans and Jovanovic (1989), Evansand Leighton (1989), Holtz-Eakin, Jouflaian and Rosen (1994), Magnac and Robin(1996), Lindh and Ohlsson (1996), Blanchflower and Oswald (1998)). More recently,empirical evidence on developing countries has started to accumulate, with a specialfocus on return migrants. For example, Ilahi (1999) for Pakistan, Mesnard (1999, 2003)for Tunisia, Mc Cormick and Wahba (2001) for Egypt, show that savings repatriated bymigrants are used for investment into small businesses.
Under these conditions, we understand quite easily that temporary migration may be away out of a development trap for a poor, liquidity constrained economy, as developedby Mesnard (2001). If workers from a poor economy have the choice to migrate intohigh wages countries, a new equilibrium on the labour market may follow from largereturn migration flows. This happens if a proportion of workers who would not haveinvested without migration overcome their liquidity constraints and invest in their homecountry with their savings accumulated abroad.
In practice, both migration flows and transfers sent by migrants are difficult to observe.Apart from obvious reasons linked to the illegality of a large part of migration and theimportance of the informal economy that is very difficult to measure through official
TEMPORARY MIGRATION AND SELF-EMPLOYMENT : EVIDENCE FROM TUNISIA
1 See, for examples, Banerjee and Newman (1993) and Aghion and Bolton (1997).
120

statistics, there are also problems in gathering information both in the countries of ori-gin and destination in order to have a complete picture of migration. Nevertheless, sev-eral sources of statistics exist on these flows and already a few attempts have been madeto study empirically the effects of migration for the countries of origin of the migrantworkers2. This paper contributes to the empirical knowledge of capital flows linked tolabour migration, by quantifying the importance of these flows for a developing coun-try like Tunisia and stressing their significant role in increasing self-employment.
Studying migration flows of Tunisian workers over the period 1974-1986 is of particu-lar interest, since many of them have chosen to return to Tunisia after having workedabroad, given the particular historical background outlined in Section 1. Section 2describes the characteristics and activities of these workers, using an original data setbelonging to the Arabic League3. Section 3 investigates whether savings accumulatedabroad by temporary migrants allow them to overcome liquidity constraints and start upprojects in Tunisia after return.
1. IMPORTANCE OF MIGRATION FLOWS AND FINANCIAL TRANSFERS FROM
MIGRANTS TO TUNISIA
1.1. HISTORICAL BACKGROUND
After the second world war, the chaotic history of international migration of Tunisianworkers results in a heterogenous population of migrants who have returned to Tunisiabefore 1986, the date of the TSAO survey. Two periods may be broadly distinguished inthis process, before and after 1974.
Before 1974, outmigration flows towards European countries increased continuously.Indeed bad economic conditions in Tunisia generate rising unemployment problems, at thesame time as European countries have high labour demands in sectors with low levels ofqualification. In order to control these flows, several agreements were signed by theTunisian government, firstly with France in 1963, then with Germany in 1965, withBelgium in 1969, and other countries like Hungary and Holland. In 1967 the Tunisian gov-ernment created an agency called “Office de l'Emploi et de la Formation Professionnelle”that organised the direct recruitment of unskilled Tunisian workers for industry and build-ing sectors in European countries. Implicitly, these agreements expected that individualswill migrate temporarily to work abroad and eventually return to Tunisia to live with theirfamilies. During the same period, outmigration started to expand towards Libya, veryoften illegally, due to good prospects linked to the exploitation of new oilfields.
ALICE MESNARD
121
2 For example Woodruff and Zenteno (2001) study the effects of remittances on the creation of microenterprises inthe urban areas of Mexico combining the population Census, the data of the Bank of England on remittances anda national survey on microenterprises.
3 I am indebted to R.Ben Jelili, H. Mzali, and the OTTE (Office des Travailleurs Tunisiens à l'Etranger) who pro-vided the data and help in using them.
1974 was a turning point in the evolution of Tunisian migration for two main reasons.Firstly, most of European countries closed their borders and started to encourage work-ers to return home. For example, RFA was officially closed to new migrants in 1973 andFrance restricted immigration to family members joining already settled migrants, whileencouraging workers to return to their home country. As a consequence, temporarymigration of single workers was transformed into a permanent migration of family set-tlement. Moreover, in most host countries, migrants had to face severe problems ofunemployment. Secondly, in the same period, political problems between Libya andTunisia led to the breakdown of the migration expansion towards Libya. A chaotic peri-od developed after 1974, characterised by more irregular out-and return migrationbetween Tunisia and traditional host countries and by a new political orientation ofTunisian migration towards the Gulf countries. In particular after 1983, when Tunisianworkers were massively expelled from Libya, many of them migrated towards otherArabic countries but also towards new European countries (like Spain, Italy, Greece,etc...) where illegal migration continued to rise.
1.2. EVOLUTION OF TUNISIAN MIGRATION FLOWS
It is difficult to estimate precisely the number of migrants because many of themmigrate either illegally or temporarily and the legal situation of individuals leavingTunisia for different purposes can change over time. Official sources of informationcome mainly from the National Institute of Statistics, based on the reports from thepolice at the border, as well as from the consular services in foreign countries. Tocomplete this information, a survey was conducted in 1986 by the Tunisian SettledAbroad Office (TSAO) in the Ministry of Foreign Affairs in collaboration with theArabic League. This survey enquires about living conditions of a representative sam-ple of workers living in rural and urban areas, with particular focus on an over-sam-pled group of individuals who have worked abroad between 1974 and 1986 and, sub-sequently, have returned to Tunisia4. Based on this survey, Zaiem (1992) estimates thataround 316,000 Tunisian workers have worked in a foreign country between 1974 and1986. This includes 214,000 migrants who have already returned to settle in Tunisia,16,000 migrants still living abroad but who were temporarily visiting Tunisia at thedate of survey, and 86,000 workers who are still abroad at the date of survey. Thus,according to this source, around one third of the workers who have migrated abroadbetween 1974 and 1987 were still living abroad. Note, however, that these statisticsdo not take into any individuals accompanying Tunisian workers like spouses andchildren. Adding them, Zaiem estimates the total number to be between 535,000 and570,000 individuals5. Furthermore, these estimates reported by households surveyed
TEMPORARY MIGRATION AND SELF-EMPLOYMENT : EVIDENCE FROM TUNISIA
4 This very rich survey was initially designed in order to understand better the reasons why Tunisian workers want-ed to migrate and their difficulties of insertion that they had to face upon return, as well as economic conse-quences of migration for Tunisia.
5 These estimates are quite close to estimates by consular services, who find that around 512,000 Tunisians haveleft Tunisia before 1989, whereas the police at the border estimates that 320,000 workers have left Tunisia to workabroad before 1986.
122
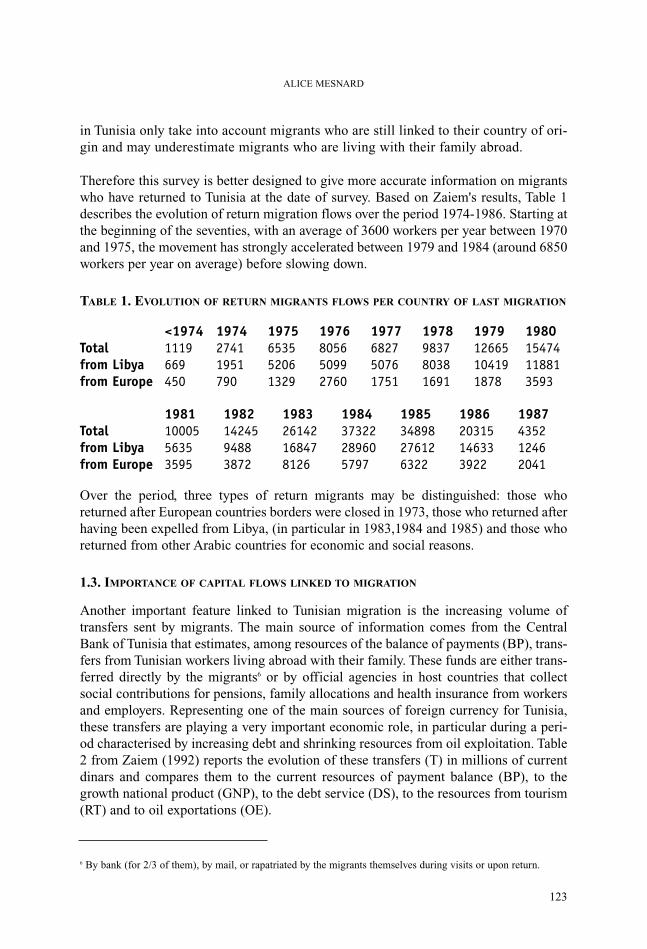
in Tunisia only take into account migrants who are still linked to their country of ori-gin and may underestimate migrants who are living with their family abroad.
Therefore this survey is better designed to give more accurate information on migrantswho have returned to Tunisia at the date of survey. Based on Zaiem's results, Table 1describes the evolution of return migration flows over the period 1974-1986. Starting atthe beginning of the seventies, with an average of 3600 workers per year between 1970and 1975, the movement has strongly accelerated between 1979 and 1984 (around 6850workers per year on average) before slowing down.
TABLE 1. EVOLUTION OF RETURN MIGRANTS FLOWS PER COUNTRY OF LAST MIGRATION
Over the period, three types of return migrants may be distinguished: those whoreturned after European countries borders were closed in 1973, those who returned afterhaving been expelled from Libya, (in particular in 1983,1984 and 1985) and those whoreturned from other Arabic countries for economic and social reasons.
1.3. IMPORTANCE OF CAPITAL FLOWS LINKED TO MIGRATION
Another important feature linked to Tunisian migration is the increasing volume oftransfers sent by migrants. The main source of information comes from the CentralBank of Tunisia that estimates, among resources of the balance of payments (BP), trans-fers from Tunisian workers living abroad with their family. These funds are either trans-ferred directly by the migrants6 or by official agencies in host countries that collectsocial contributions for pensions, family allocations and health insurance from workersand employers. Representing one of the main sources of foreign currency for Tunisia,these transfers are playing a very important economic role, in particular during a peri-od characterised by increasing debt and shrinking resources from oil exploitation. Table2 from Zaiem (1992) reports the evolution of these transfers (T) in millions of currentdinars and compares them to the current resources of payment balance (BP), to thegrowth national product (GNP), to the debt service (DS), to the resources from tourism(RT) and to oil exportations (OE).
ALICE MESNARD
6 By bank (for 2/3 of them), by mail, or rapatriated by the migrants themselves during visits or upon return.
<19741119669450
197427411951790
1975653552061329
1976805650992760
1977682750761751
1978983780381691
197912665104191878
198015474118813593
Totalfrom Libyafrom Europe
19811000556353595
19821424594883872
198326142168478126
198437322289605797
198534898276126322
198620315146333922
1987435212462041
Totalfrom Libyafrom Europe
123

TABLE 2. EVOLUTION OF TRANSFERS IN MILLIONS OF CURRENT DINARS (A) OR IN PERCENT
Over the period 1960-1990 these transfers represent on average around 4% of GNP,more than half of the debt service, and 10% of the current resources of the balance ofpayment, being the third most important resource after resources from oil exploitationand resources from tourism. Note that these statistics from the Central Bank underesti-mate strongly the total amount of transfers from Tunisian migrants. Indeed strong reg-ulations limit the convertibility of foreign currency to Tunisian dinars. To overcomethese barriers, an informal compensation system has been set up by workers. Duringvisits in their family, many migrants bring back goods bought in foreign countries (likeequipment for agriculture, cars, furniture, electro appliances, etc.) that are eventuallyexchanged against Tunisian dinars, with typically big mark-ups. This became very pop-ular after 1981, when the currency from Libya was no longer convertible in Tunisia.
The saving efforts made by migrants abroad to transfer money back home appear verysubstantial over this period. Computing the ratio of total transfers estimated by theCentral Bank to the total population of Tunisians working abroad, Zaiem reports theevolution of average transfer per worker in the following Table:
TABLE 3. AVERAGE TRANSFERS PER MIGRANT (IN CONSTANT DINARS IN 1990)
Transfers per worker (estimated in constant dinars in 1990) have tripled between 1977and 1987. These transfers respond strongly to economic and political backgrounds inhost countries and in Tunisia, as shown by big downturns during 1982-1984 and after1987. Over 1987-1990, the yearly mean amount transferred per worker reached 1000Tunisian dinars, representing over 80% of GNP per capita.
2. WHO ARE THE MIGRANTS WHO HAVE RETURNED TO TUNISIA ?
Already established as considerable in the previous section, transfers from migration andmigration flows of return migrants may have very different consequences on development,depending on what migrants do after return and how transfers are used in their origin coun-try. In the following, we will describe findings from the TSAO survey providing rich infor-mation at individual level on workers' migration history and labour market outcomes.
TEMPORARY MIGRATION AND SELF-EMPLOYMENT : EVIDENCE FROM TUNISIA
124
Ta
75,4829,73080,83985,9
T/BP5,49,510,510,1
T/GNP1,33,74,64,2
T/DS32874852
T/RT42,754,158,657,2
T/OE684074,461,4
1960-19701970-19801980-1990TOTAL
1977371
1978420
1979469
1980539
1982796
1983746
1984703
1985715
19871179
1989952
1990937

2.1. SELECTION OF THE SAMPLE
From the survey, two samples of workers living in rural and urban areas can be distin-guished. One sample consists of a group of workers living in Tunisia and having migrat-ed to work in a foreign country at least once since 1974 (hereafter, the migrants). Theother sample consists of workers who have never migrated in the past and will be usedas a control group (hereafter, the non migrants). In view of having more homogeneoussamples of workers, in our final samples we kept only male workers, aged between 20and 60 in 1986: 1168 workers who have returned from migrating and 944 workers whohave never migrated7.
The double selection through migration and return explains a few differences betweenthe two groups as shown in Table (). Migrants are on average older than non migrants(37.3 versus 35.9 years old), having spent on average 4.1 years abroad and 4.2 years inTunisia after return before being surveyed. They are also more often married (81%) thannon migrants (59%). This difference observed between the two groups may beexplained by life-cycle reasons and the fact that 22% of migrants have returned for fam-ily motives, in particular to get married in Tunisia (see the Appendix for the list of othermotives). Moreover, return-migrants have larger households with 1.3 more dependentson average than non migrants.
Interestingly, in the survey workers report the legal or illegal status of their migra-tion. 64% of them left Tunisia with a tourist visa and 31% with a work visa, whereas5% migrated illegally. Also 85 % of these workers lived abroad without any family,while 63 % were married before migrating. Only 2.6 % of them left Tunisia with theirwife and children, 7.8% migrated with other relatives or siblings, and 4.6% had someof their children joining them abroad during migration. A simple explanation is thatthese migrants were planning to return to Tunisia. Indeed, we have to bear in mindthat these statistics do not represent the whole set of migrants and we have no infor-mation on workers who were still living abroad at the date of survey, possibly withtheir family.
2.2. HUMAN CAPITAL
It is also questionable whether temporary migration has led to a brain drain process inTunisia8. Indeed, migration models based on human capital accumulation predict thathighly (lowly) educated individuals may gain more (less) from migration than lowly(highly) educated workers depending on the returns to the skills differential between thetwo economies (Borjas, 1987). For example, applying this selection model twice,
ALICE MESNARD
7 Surveyed return migrants in the initial sample are predominantly male since most of women having migratedbetween 1974 and 1986 were following their husband. The women (numbered 12) who had migrated to work aredropped out of the sample of return migrants.
8 See the recent controversy on effects of outmigration for human capital accumulation in source countries, Haqueand Kim (1995), Stark, Helmenstein and Prskawetz (1997), Vidal (1998), Beine, Docquier and Rapoport (2001).
125

Ramos (1991) shows that return-migration reinforces this auto-selection mechanism9. Inour sample, we observe that return migrants have significant lower education levels thannon migrants. 84% (73%) of migrants (non migrants) have less than a primary schoollevel. 36% (32%) have no schooling and 48% (41%) have a primary education level.Only 4% (7%) of migrants (non migrants) have a short secondary degree and 12%(20%) have a higher education level. Again these statistics should be interpreted withcare since workers are selected through migration and return and, in contrast to Ramos,we have no information on workers staying abroad.
Nevertheless, there is very little evidence of human capital accumulation throughmigration. Less than 20% of migrants report to have acquired new skills in the foreigncountry10 and, for those who have, less than 8% of them report to use these skills in theirjob after return. Also note that 35% of migrants claim to have a job similar to the jobthey had before migrating. Workers also describe how working experience abroad hasaffected the job they have after return. For 15% of them quality and efficiency on thejob have improved. For 15% of them, speed in work after migration is higher than beforemigration, and 7% (respectively 6%) of them claim that organization (respectively man-agement) of work has improved, and only 3% claim to have a better control of tools andmachine or to have improved creativity in working. Hence, migration experience seemsto have improved the rationalization of work more than having brought any particulartechnical skills or engineering knowledge. Of course since all these statistics are basedon self-reported information, they could be biased in which case we would need betterinformation to give a more conclusive answer.11
This stands in contrast to the traditional literature on migration, which often considersmigration as a way to acquire human capital as, for example, in the case of students'migration. This may not be too surprising since the migrants with very low school levelscorrespond to the flows of workers who were massively hired by firms in European and,later on, Arabic countries, as a response to labour shortages of unskilled labour force.
2.3. SAVINGS ACCUMULATED ABROAD
The survey gives interesting information on the amount of savings brought back to Tunisiaat return and on transfers made during migration. However the amounts of transfersreported by migrants themselves suffer from too many missing answers (only 83 answerswere given). This can be explained by strong social norms existing in Tunisia that makethe reporting of how much one earns or transfers to one's family frowned upon.
TEMPORARY MIGRATION AND SELF-EMPLOYMENT : EVIDENCE FROM TUNISIA
9 In particular he observes that the highest skilled among the low skilled Puerto Rican immigrants in the UnitedStates return to Puerto Rico.
10 Skills were acquired on the job for 83% of them, through special training for 13.5% of them, and through othermethods for the rest of the respondents.
11 Unfortunately we do not have better measures of human capital accumulation during migration. Although migra-tion duration could be considered as a proxy for human capital accumulation abroad, this variable is potentiallyendogenous for different reasons, which would be very difficult to disentangle (see, for example, Mesnard, 2004).
126
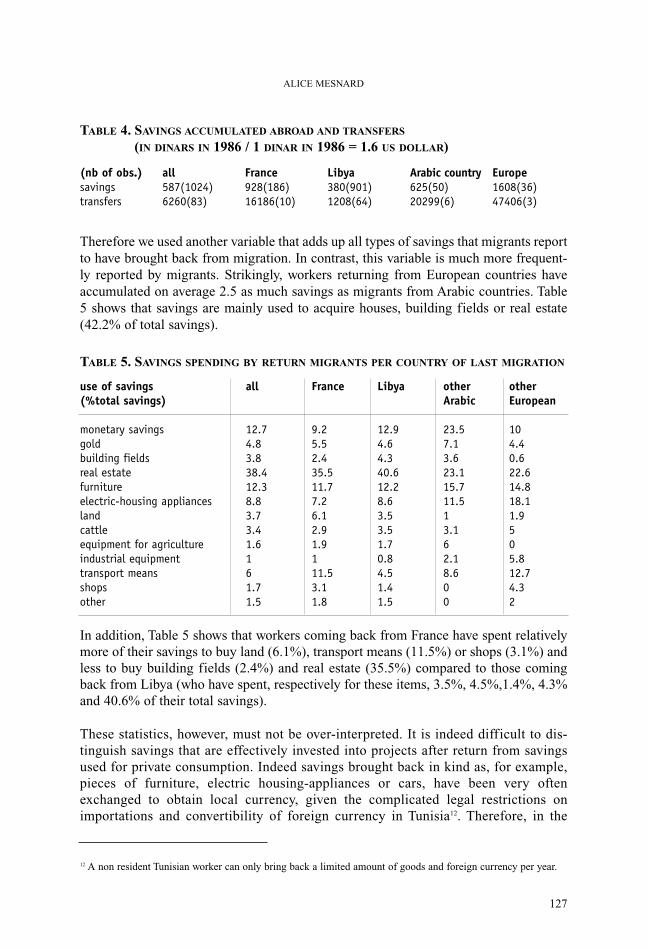
TABLE 4. SAVINGS ACCUMULATED ABROAD AND TRANSFERS
(IN DINARS IN 1986 / 1 DINAR IN 1986 = 1.6 US DOLLAR)
Therefore we used another variable that adds up all types of savings that migrants reportto have brought back from migration. In contrast, this variable is much more frequent-ly reported by migrants. Strikingly, workers returning from European countries haveaccumulated on average 2.5 as much savings as migrants from Arabic countries. Table5 shows that savings are mainly used to acquire houses, building fields or real estate(42.2% of total savings).
TABLE 5. SAVINGS SPENDING BY RETURN MIGRANTS PER COUNTRY OF LAST MIGRATION
In addition, Table 5 shows that workers coming back from France have spent relativelymore of their savings to buy land (6.1%), transport means (11.5%) or shops (3.1%) andless to buy building fields (2.4%) and real estate (35.5%) compared to those comingback from Libya (who have spent, respectively for these items, 3.5%, 4.5%,1.4%, 4.3%and 40.6% of their total savings).
These statistics, however, must not be over-interpreted. It is indeed difficult to dis-tinguish savings that are effectively invested into projects after return from savingsused for private consumption. Indeed savings brought back in kind as, for example,pieces of furniture, electric housing-appliances or cars, have been very oftenexchanged to obtain local currency, given the complicated legal restrictions onimportations and convertibility of foreign currency in Tunisia12. Therefore, in the
ALICE MESNARD
127
12 A non resident Tunisian worker can only bring back a limited amount of goods and foreign currency per year.
(nb of obs.)savingstransfers
all587(1024)6260(83)
France928(186)16186(10)
Libya380(901)1208(64)
Arabic country625(50)20299(6)
Europe1608(36)47406(3)
use of savings (%total savings)
monetary savingsgoldbuilding fieldsreal estatefurnitureelectric-housing applianceslandcattleequipment for agricultureindustrial equipmenttransport meansshopsother
all
12.74.83.838.412.38.83.73.41.6161.71.5
France
9.25.52.435.511.77.26.12.91.9111.53.11.8
Libya
12.94.64.340.612.28.63.53.51.70.84.51.41.5
otherArabic
23.57.13.623.115.711.513.162.18.600
otherEuropean
104.40.622.614.818.11.9505.812.74.32

remaining of the paper, we will use the total amount of savings accumulated abroad,either in kind or monetary, as a proxy for individual wealth at the date of return.
3. WHAT DO THEY DO AFTER RETURN ?
Comparing activities of migrants to non migrants is not easy since the questions usedin the survey are different for the two samples. While workers who have returned frommigration are asked about their activities after return and about the last activity theyhad before migrating, workers who have never migrated are asked about their lastactivity and their activity in 197413. Studying how temporary migration affects activi-ties chosen by workers would require at least to have homogenous spells for the twogroups, which is not the case in our data. However, the following description of theactivities chosen by the two groups of workers suggests interesting features linked totemporary migration.
3.1. IN WHICH SECTOR DO THEY WORK ?
Do migrants work after return in the same sectors as before migration? Table 6 showsthat, on average, migrants are less likely to work in the building sector after return thanbefore they left, and are significantly more likely to work in the trade and transport sec-tors. Table 7 shows that these changes correspond to a general trend in economic activ-ity of Tunisia. However, we cannot push too far our comparison between the two sam-ples, since the period of analysis varies for migrants and, in most of the case, is muchshorter than for non migrants (they migrated, on average, 8.3 years before the surveyand returned 4.2 years before the survey). This might also explain why migrants aremuch more frequently employed in the building sector before migrating than nonmigrants, and less employed in the agriculture sector.
Interestingly the proportion of migrants working in the trade sector is twice as high afterreturn compared to before migrating. This may not be surprising since 70% of workersin this sector are self-employed, as compared to 25% of workers in other sectors.Moreover, although the proportion of non migrants working in industry increasedbetween 1974 and 1986, return migrants were still less often employed in this sector, ascompared to before they migrated.
TEMPORARY MIGRATION AND SELF-EMPLOYMENT : EVIDENCE FROM TUNISIA
13 Therefore all non migrants report having a job, whereas, in the initial sample, a few migrants report to be unem-ployed or retired but we chose to drop them out of the sample, for comparison.
128
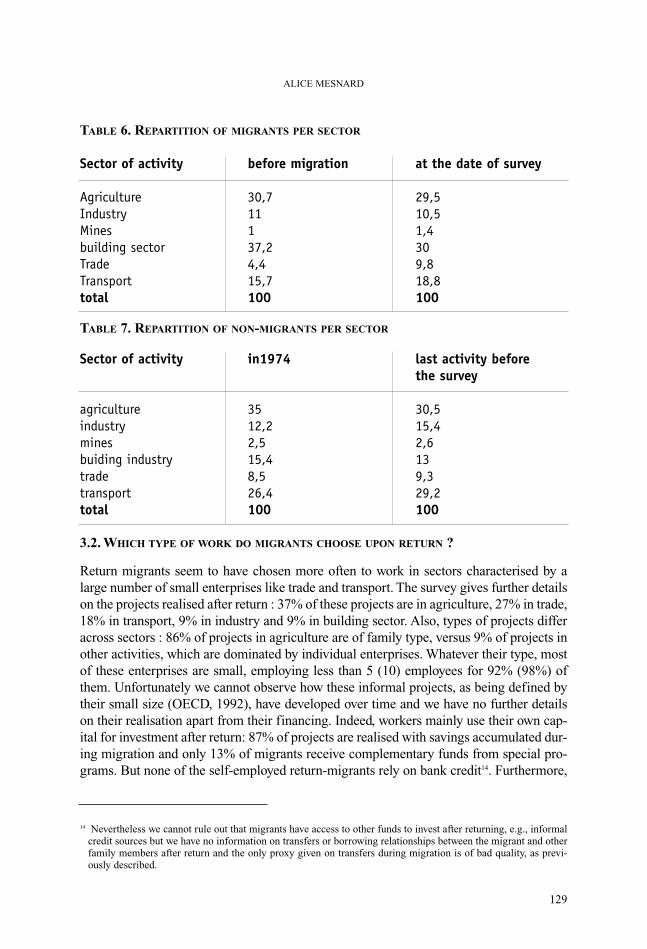
TABLE 6. REPARTITION OF MIGRANTS PER SECTOR
TABLE 7. REPARTITION OF NON-MIGRANTS PER SECTOR
3.2. WHICH TYPE OF WORK DO MIGRANTS CHOOSE UPON RETURN ?
Return migrants seem to have chosen more often to work in sectors characterised by alarge number of small enterprises like trade and transport. The survey gives further detailson the projects realised after return : 37% of these projects are in agriculture, 27% in trade,18% in transport, 9% in industry and 9% in building sector. Also, types of projects differacross sectors : 86% of projects in agriculture are of family type, versus 9% of projects inother activities, which are dominated by individual enterprises. Whatever their type, mostof these enterprises are small, employing less than 5 (10) employees for 92% (98%) ofthem. Unfortunately we cannot observe how these informal projects, as being defined bytheir small size (OECD, 1992), have developed over time and we have no further detailson their realisation apart from their financing. Indeed, workers mainly use their own cap-ital for investment after return: 87% of projects are realised with savings accumulated dur-ing migration and only 13% of migrants receive complementary funds from special pro-grams. But none of the self-employed return-migrants rely on bank credit14. Furthermore,
ALICE MESNARD
129
Sector of activity
AgricultureIndustryMinesbuilding sectorTradeTransporttotal
before migration
30,711137,24,415,7100
at the date of survey
29,510,51,4309,818,8100
Sector of activity
agricultureindustryminesbuiding industrytradetransporttotal
in1974
3512,22,515,48,526,4100
last activity before the survey
30,515,42,6139,329,2100
14 Nevertheless we cannot rule out that migrants have access to other funds to invest after returning, e.g., informalcredit sources but we have no information on transfers or borrowing relationships between the migrant and otherfamily members after return and the only proxy given on transfers during migration is of bad quality, as previ-ously described.

when surveyed about the main obstacles workers had to face in starting up their projects,they explicitly mentioned their difficulties in getting access to credit markets.
We may then ask whether temporary migration has increased self-employment inTunisia. Although the proportion of self-employed workers among return migrants(26.3%) is not significantly different from the proportion of self-employed workersamong non migrants (23.8%), self-employment has increased among return migrants,since only 15.6% of them were self-employed before migrating.15 This increase couldbe due to an age effect. However, comparing self-employment rates before migrationand after return for individuals in same age cells, the differences remain important.
Hence we would like to understand which factors determine the decision to start up abusiness after return for workers who were not self-employed before migration. Afterselecting these workers, we compare workers who started up a project at return tosalaried workers. As shown in Table 8, only a couple of characteristics appear signifi-cantly different between these two groups.
TABLE 8. CHARACTERISTICS OF RETURN MIGRANTS
* significantly different from the mean in column (1), t-test. Standard errors in parenthesis.
TEMPORARY MIGRATION AND SELF-EMPLOYMENT : EVIDENCE FROM TUNISIA
Return migrants not self-employed before migration
Age in 1986Age at returnno education (%)Primary school (%)Short secondary school (%)Long secondary school (%)Number of dependents Married (%)Born in area of Tunis (%)Born in Center East (%)Born in Center West (%)Born in Southern East (%) Born in Southern West (%)Born in Northern East (%)Born in Northern West (%)Migration duration (months)France (%)Libya (%)Europe (%)Arabic (%)
Savings accumulated abroad (1 dinar in 1986 = $US1.6)
38.92 34.87 36.446.44.312.95.0 81.45.323.32 2115.7107.617.175.4 276643
1086(1539.13)
(10.92)(10.60)
(2.94)
(69.4)
36.75* 32.44* 33.350.24.711.84.55 804.918.62423.1*10.66.112.746.64* 13 *80 *25
442.35*(951.77)
(11.07)(10.66)
(2.93)
(49.72)
37.18 32.93 33.949.54.6124.64 80.3519.523.421.610.56.413.652.63 157834
580.52(1134.70)
(11.07)(10.69)
(2.93)
(55.6)
(1)Took up self-employ-ment on return(n=210)
(2)Did not take up self-employment(n=840)
Full sample
(n=1050)
15 For comparison, 26.8% of non migrants were self-employed in 1974, which is not significantly different from theproportion in 1986.
130

Strikingly, workers who are self-employed after return, have accumulated much larg-er amounts of savings during migration (more than twice as much). Even after con-trolling for other individual characteristics, the amount of savings repatriated bythose who enter self-employment is significantly higher than that brought back bysalaried return-migrants. Also, workers who start a business after return have stayedabroad, on average, for 6.3 years, whereas salaried workers returned after 3.9 yearsspent abroad. Finally, migrants who invest into projects after return come more oftenfrom European countries and less frequently from Arabic countries than salariedreturn migrants. All these descriptives suggest a story where migrants choose theirmigration duration, migration destination and effort of saving abroad according tothe occupation they intend to have after return, as developed in Mesnard (2004). Itappears likely that credit constrained workers migrated to high wages countries untilthey accumulated enough savings in order to invest in their origin country. However,we cannot push too far the interpretation of these correlations, since, very likely,workers with different abilities have chosen different destination countries, differentoccupations and different migration durations, and these heterogeneous abilities can-not be observed. Therefore, in the following section, we propose an econometric testof whether savings accumulated abroad determine occupational choice at return,once controlling for potential endogeneity problems and other determinants of self-employment.
3.3. DOES SAVINGS ACCUMULATED ABROAD INCREASE SELF-EMPLOYMENT AT RETURN ?
Following Mesnard and Ravallion (2001), we use savings accumulated abroad as aproxy for workers' wealth at the date of return and test to which extent this variableincreases the probability to start up projects at return for workers who were not self-employed before migration. As compared to the traditional literature on liquidityconstraints and self-employment, an obvious advantage is that our savings variableis predetermined at the date of occupational choice. Hence, from this viewpoint, itis less likely to be endogenous than any variable capturing individual wealth at thedate of survey16. A second advantage is that we built this variable by adding up alltypes of goods repatriated at return, and thus obtained much fewer missing answers,compared to using any self-reported measure of individual wealth or income inTunisia.
Yet, being predetermined does not guarantee exogeneity of the savings variable.Indeed there are several potential sources of endogeneity that could cloud the sav-ings effect, if not properly tackled empirically. In particular, temporary migrantsmay be selected on their wealth level and abilities to accumulate wealth abroad, ifmigration is a way to overcome liquidity constraints in the origin country. Hence, wereplicated for our selected sample of return migrants the test for exogeneity of sav-ings developed in Mesnard (2004) and could not reject that savings are statistically
ALICE MESNARD
16 This is also the reason why we could not perform similar regressions for the sample of non migrants for whomwe only have a proxy of their savings at the date of survey.
131
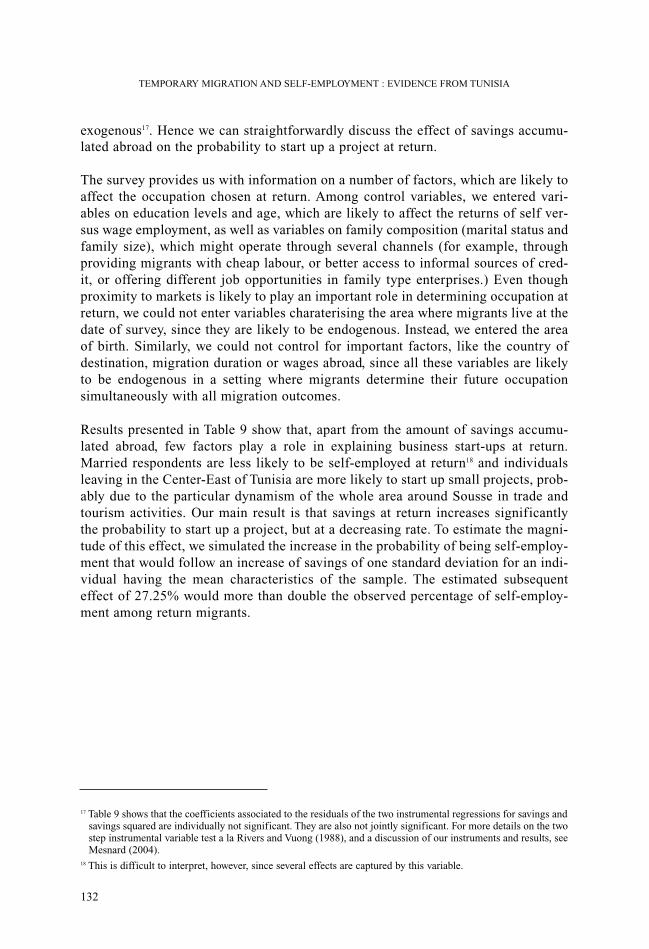
exogenous17. Hence we can straightforwardly discuss the effect of savings accumu-lated abroad on the probability to start up a project at return.
The survey provides us with information on a number of factors, which are likely toaffect the occupation chosen at return. Among control variables, we entered vari-ables on education levels and age, which are likely to affect the returns of self ver-sus wage employment, as well as variables on family composition (marital status andfamily size), which might operate through several channels (for example, throughproviding migrants with cheap labour, or better access to informal sources of cred-it, or offering different job opportunities in family type enterprises.) Even thoughproximity to markets is likely to play an important role in determining occupation atreturn, we could not enter variables charaterising the area where migrants live at thedate of survey, since they are likely to be endogenous. Instead, we entered the areaof birth. Similarly, we could not control for important factors, like the country ofdestination, migration duration or wages abroad, since all these variables are likelyto be endogenous in a setting where migrants determine their future occupationsimultaneously with all migration outcomes.
Results presented in Table 9 show that, apart from the amount of savings accumu-lated abroad, few factors play a role in explaining business start-ups at return.Married respondents are less likely to be self-employed at return18 and individualsleaving in the Center-East of Tunisia are more likely to start up small projects, prob-ably due to the particular dynamism of the whole area around Sousse in trade andtourism activities. Our main result is that savings at return increases significantlythe probability to start up a project, but at a decreasing rate. To estimate the magni-tude of this effect, we simulated the increase in the probability of being self-employ-ment that would follow an increase of savings of one standard deviation for an indi-vidual having the mean characteristics of the sample. The estimated subsequenteffect of 27.25% would more than double the observed percentage of self-employ-ment among return migrants.
TEMPORARY MIGRATION AND SELF-EMPLOYMENT : EVIDENCE FROM TUNISIA
17 Table 9 shows that the coefficients associated to the residuals of the two instrumental regressions for savings andsavings squared are individually not significant. They are also not jointly significant. For more details on the twostep instrumental variable test a la Rivers and Vuong (1988), and a discussion of our instruments and results, seeMesnard (2004).
18 This is difficult to interpret, however, since several effects are captured by this variable.
132
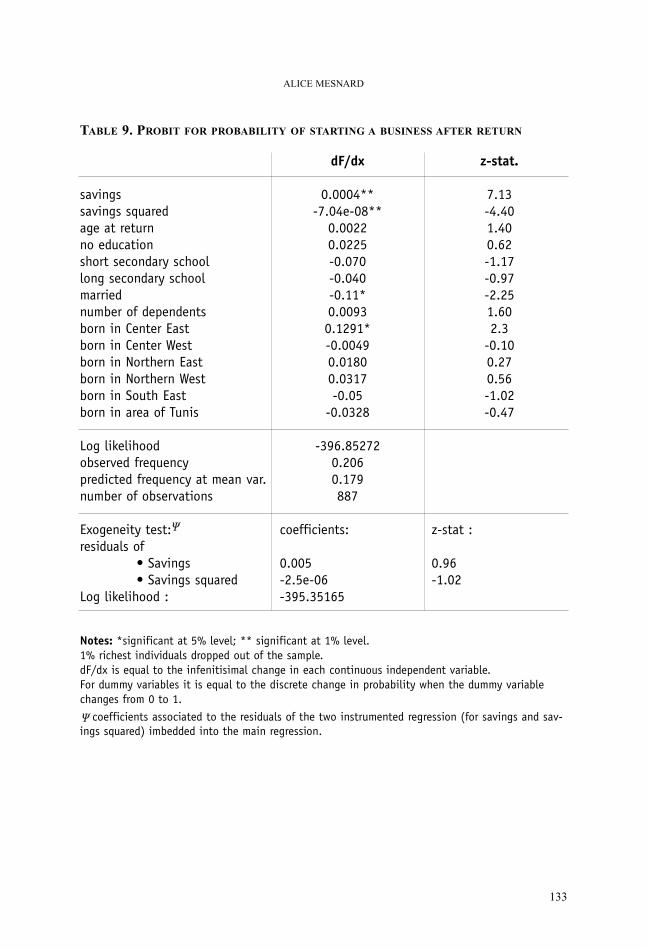
TABLE 9. PROBIT FOR PROBABILITY OF STARTING A BUSINESS AFTER RETURN
Notes: *significant at 5% level; ** significant at 1% level.1% richest individuals dropped out of the sample.dF/dx is equal to the infenitisimal change in each continuous independent variable.For dummy variables it is equal to the discrete change in probability when the dummy variablechanges from 0 to 1.
coefficients associated to the residuals of the two instrumented regression (for savings and sav-ings squared) imbedded into the main regression.
ALICE MESNARD
133
savingssavings squaredage at returnno educationshort secondary schoollong secondary schoolmarriednumber of dependentsborn in Center Eastborn in Center Westborn in Northern Eastborn in Northern Westborn in South Eastborn in area of Tunis
Log likelihoodobserved frequencypredicted frequency at mean var.number of observations
Exogeneity test:residuals of
• Savings• Savings squared
Log likelihood :
dF/dx
0.0004**-7.04e-08**
0.00220.0225-0.070-0.040-0.11*0.00930.1291*-0.00490.01800.0317-0.05
-0.0328
-396.852720.2060.179887
coefficients:
0.005-2.5e-06-395.35165
z-stat.
7.13-4.401.400.62-1.17-0.97-2.251.602.3
-0.100.270.56-1.02-0.47
z-stat :
0.96-1.02

CONCLUSION
Based on statistics from the Central bank of Tunisia and on a survey describingTunisian workers who have returned from migration, this paper shows that tempo-rary migration has potentially important consequences for sending countries likeTunisia, that are playing through the flows of physical capital linked to labourmigration. Even though we found very little evidence of human capital accumula-tion in Tunisia through temporary migration, as could be explained by the particu-larity of these migration flows responding mainly to labour shortages of unskilledlabour in receiving countries, and even though the effects from selective migrationare very difficult to assess given the limited data we have, the paper concludes thattemporary migration has contributed to economic development of Tunisia through atleast two channels.
On one hand, transfers sent by migrants to their origin country represent a sizeablesource of foreign currency and income for developing countries. This may be cru-cial for highly indebted countries and has often been recognised through policymeasures aimed at attracting remittances19. On the other hand, savings repatriatedupon return under different types of goods allow poor workers to overcome creditconstraints for investment into small projects.
TEMPORARY MIGRATION AND SELF-EMPLOYMENT : EVIDENCE FROM TUNISIA
19 For more details on these measures, see Mesnard (1999).
134

REFERENCES
Banerjee A.V. and A.F. Newman, 1993. “Occupational Choice and the Process ofDevelopment”, Journal of Political Economy, 101, 274-98.Beine M., F. Docquier and H. Rapoport, 2001. “Brain drain and economic growth:theory and evidence”, Journal of Development Economics, 64(1), 275-89.Blanchflower D.G. and A.J. Oswald, 1998. “What Makes an Entrepreneur? Evidenceon Inheritance and Capital Constraints”, Journal of Labor Economics 16(1), 26-60.Borjas G.J., 1987. “Self-selection and the earnings of immigrants”, AmericanEconomic Review, 77, 531-53.Durand J., W. Kandel, E.A. Parrado and D.S. Massey, 1996. International migrationand development in Mexican communities, Demography, 33(2), 249-64.Evans D. and B. Jovanovic, 1989. “An estimated model of entrepreneurial choiceunder liquidity constraints”. Journal of Political Economy, 97, 808-27.Evans D.S. and L.S. Leighton, 1989. “Some Empirical Aspects of Entrepreneurship”,American Economic Review, 79, 519-35.Galor O. and J. Zeira, 1993. “Income distribution and macroeconomics”, Review ofEconomic Studies, 60, 35-62.Griffin K., 1976. On the emigration of the peasantry, World Development, 4(5),353-61.Haque N.U. and S. Kim, 1995. “Human capital flight: impact of migration on incomeand growth”IMF Staff Papers, 42(3), 577-607.Holtz-Eakin D., D. Joulfaian and H.S. Rosen, 1994. “Entrepreneurial decisions andliquidity constraints”, RAND Journal of Economics, 25, 334-47.Ilahi N., 1999. “Return Migration and Occupational change”, Review of DevelopmentEconomics, 3, 170-86.Magnac T. and J.M. Robin, 1996. “Occupational choice and liquidity constraints”,Ricerche Economiche, 50, 105-133.McCornick B. and J. Wahba, 2000. Overseas work experience, savings and entrepre-neurship amongst return migrants to LDCs, Scottish Journal of Political Economy,Special Conference Issue, 48, 164-78.Mesnard A., 1999. “Migration internationale, accumulation d'épargne et retour des tra-vailleurs” PhD. dissertation, Ecole des Hautes Etudes en Sciences Sociales, Paris, 380p.Mesnard A., 2001. “Temporary migration and intergenerational mobility”, LouvainEconomic Review, 67, 59-88.Mesnard A. and M. Ravallion, 2001. “Wealth distribution and self-employment in adeveloping country”, CEPR Discussion Paper DP3026.Mesnard A., 2004. Temporary migration and Capital Market Imperfections, OxfordEconomic Papers, 56, 1-21.OECD, 1992. Secteur informel en Tunisie : cas reglementaire et pratique courante,Documents techniques, 80.Ramos F.A., 1991. “Out-migration and return migration of Puerto-Ricans” in Abowdand Freeman Immigration, trade and the labor market University of Chicago Press.Rempel H. and R. Lobdell, 1978. “The role of urban-rural remittances in rural devel-opment”, Journal of Development Studies, 14, 324-41.
ALICE MESNARD
135

Rivers D. and Q.H.Vuong, 1988. “Limited information estimators and exogeneity testsfor simultaneous probit models”, Journal of Econometrics, 39, 347-86.Stark O., 1978. “Economic-demographic interaction in agricultural development: thecase of rural-to-urban migration”, Rome: UN Food and Agriculture Organization.Stark O., 1991. The migration of labor, Oxford and Cambridge, MA: Basil Blackwell.Stark O., C. Helmenstein and A. Prskawetz, 1997. “A brain gain with a brain drain”,Economics Letters, 55, 227-234.Vidal J.P., 1998. “The effect of emigration on human capital formation”, Journal ofPopulation Economics, 11, 589-600.Zaiem, 1993. “Rapport sur l'enquête OTTE”, mimeo, Office des Travailleurs Tunisiensà l'Etranger, Tunis.Woodruff C. and R. Zenteno, 2002. “Remittances and Microenterprises in Mexico”UCSD working paper.
TEMPORARY MIGRATION AND SELF-EMPLOYMENT : EVIDENCE FROM TUNISIA
136

APPENDIX. REASONS FOR RETURNING
The main reason to return was given as family motives, reported by 22% of the surveyedworkers. Other frequently reported motive is the legal situation of the migrant abroad,either because migrants were not able to normalise their legal situation or because theirtourist visa or job contract expired. Other frequently cited motives involve working con-ditions abroad (eg, the end of a job contract, unemployment problems, insufficientincome abroad), or related to working conditions in origin country (eg, realisation of aproject, job offer, end of a leave for absence, retirement). Interestingly very few respon-dents mention the special policy schemes aimed at encouraging return migration thatwere offered after 1974 by host countries like France or Germany to migrants, condi-tionally on their returning to Tunisia (on these measures, see Mesnard, (1999)).
TABLE A.1. REASONS FOR RETURNING
Reasons related to accumulation of savings also appear important since 5.62% of work-ers report to have returned to Tunisia once they had accumulated enough savings, and7.23% of them because they had difficulties to transfer money through banks.
The motives of migrants coming back from European or Arabic countries are slightlydifferent in emphasis. Unemployment problems, non renewal of job contracts or diffi-culties to transfer money explain more frequently the decision to return from Europeancountries than from Arabic countries. On the other hand, migrants in Arabic countrieshave more often returned because of insufficient income than migrants in Europeancountries. Indeed workers migrating to different destination countries correspond to dif-ferent waves of migrants and different working conditions abroad.
ALICE MESNARD
137
sufficient amount of savingsend of job contractunemploymentillegal situationretirementillnessinsufficient income abroaddifficulties to transfer savingsend of a touristic periodracial discriminationspecial policy schemesrealisation of a projectjob offer in Tunisiafamily reasonshomesicknessend of leave for absence
all
5.628.563.9311.421.164.192.417.234.910.890.453.210.8921.867.141.16
Arabic countries
5.708.163.5811.401.454.472.576.705.030.890.563.240.8922.127.151.34
Europ. countries
5.3310.225.3311.5603.111.789.334.440.8503.110.8920.897.110.44

TABLE A.2. SAMPLE CHARACTERISTICS
* For return migrants, savings are accumulated during migration and this variable measures thestock of savings brought back at return.** For non-migrants savings variable measures the stock of savings at the date of survey.
TEMPORARY MIGRATION AND SELF-EMPLOYMENT : EVIDENCE FROM TUNISIA
138
Characteristics
age at survey dateno education(%)Primary school level(%)short secondary school level(%)long sec.sch. level or more(%)Number of dependentsMarried (%)age at returnmigrated to:France (%)Libya (%)other Arab countries(%)other European countr.(%)duration since returnmigration durationself-employment(%)born in area of Tunis(%)born in Center East(%)born in Center West(%)born in Northern East(%)born in Northern West(%)born in South East(%)born in South West(%)accumulated savingsincomemigrated before 1974(%)
Migrantsmean37.336484124.98132.8
1677344.174.126.3521246142010586* 569320.8
1168s.d.10.2
3
9.7
3.374.7
11116908
Non-migrants
35.932417203.659
23.8920198151910510**172
944s.d.12.8
3.2
940269

IMMIGRATION AND AGING IN THE BELGIAN REGIONS*
MARC DEBUISSON (IWEPS, REGION WALLONNE), FREDERIC DOCQUIER
(CADRE, IWEPS, UNIVERSITY OF LILLE 2, IZA BONN), ABDUL NOURY
(ECARES AND DULBEA) AND MADELEINE NANTCHO (UNIVERSITY OF
LIEGE)
ABSTRACT:In this note, we first depict the structure of the foreign population (When did they come? From where?What about their skills?) and discuss its assimilation on the domestic labor market. Then we evaluate thedemand for skilled immigration in the Belgian regions raised by domestic population changes. We demon-strate that replacement immigration is a sustainable policy in Flanders but not in Wallonia and Brussels,where it would jeopardize demographic stability. Using a projection methodology that takes into accountthe changes in the demand and supply of labor, we then show that an additional flow ranging from 500 to9,000 skilled immigrants would be necessary to stabilize the Flemish dependency ratio.
JEL CLASSIFICATION: F22, J11, J61, J62.
KEYWORDS: skilled migration, immigration policy, replacement, aging.
BRUSSELS ECONOMIC REVIEW - CAHIERS ECONOMIQUES DE BRUXELLESVOL. 47 - N°1 SPRING 2004
* We thank Cecilly Defoort, Jean Houard and Nathalie Tousignant for their comments. The usual disclaimer applies.
139

INTRODUCTION
Over the last years, economists and policymakers have discussed the opportunity todefine a new labor-market oriented policy of immigration. Such a policy would be espe-cially useful in the face of massive demand and supply shocks on the labor market (suchas changes in the age structure of the population). Immigration increasingly appears asa potential solution against aging.
In their report on replacement migration, the United Nations (2000) demonstrate thatkeeping the dependency ratio constant over the period 2000-2050 requires multiplyingEuropean annual immigration flows by 50 (by 15 in the United States). Here, by takinginto account both demographic and economic dimensions of the issue, we provide analternative methodology to evaluate immigration needs. Our methodology is applied tothe Belgian regions.
Compared to the United Nations (2000), the following elements are incorporated in ouranalysis:
• first of all, analyzing replacement immigration requires considering the human capi-tal characteristics of natives and immigrants. As shown in several studies1, the immi-grants' level of education determines their contribution to the national economy. If nonselected immigration is obviously justified from humanitarian and political points ofview, we argue that replacement migration only makes sense if new immigrants pro-duce more than they consume, i.e. are selected according to their skills;
• secondly, replacement immigration should not be seen as an exclusive way of balanc-ing the adverse effects of aging on dependency. In addition to necessary socialreforms2 , we argue that a consistent measure of immigration needs should take intoaccount the potential rise in natives’ participation rates on the labor market (especial-ly female’ participation rates) as well as the evolution of their employability;
• thirdly, dealing with the relative skills of immigrants requires a projection of thedemand for skilled and unskilled workers. In countries such as the USA or UK, thedemand for skilled labor has hugely increased over the last decades. A skill biasedtechnical change has pushed the return to education upwards. In European continen-tal countries, the skill premium has remained constant or has slightly decreased. Thiscan be due to differences in labor market institutions or to differences in technicalbiases themselves. It is relevant to evaluate immigration needs in regards of the poten-tial changes in technology;
IMMIGRATION AND AGING IN THE BELGIAN REGIONS
1 See Auerbach and Oreopoulos (2000), Bonin et alii (2000) or Storesletten (2000).2 Which are not explicitly modeled here.
140

• finally, replacement immigration should not jeopardize the demographic stability ofreceiving regions, i.e. it should not generate an explosive growth of working age pop-ulation. Demographic constraints must be introduced.
The paper is organized as follows. Section 1 describes the features of the Belgian immi-gration with a particular emphasis on the regional characteristics of immigrants. CurrentBelgian immigrants are less skilled and less “employable” than natives. Hence, a pureexpansion of current flows would not reduce the burden of aging. Section 2 presents theflows of skilled immigrants required to stabilize the dependency ratio under several sce-narios. We show that an additional flow ranging from 500 to 9,000 entrants would be sus-tainable. Finally, section 3 provides a discussion of the outstanding issues determiningthe stakes for sending countries, for natives and for the immigrants themselves.
1. IMMIGRATION AND IMMIGRANTS IN THE BELGIAN REGIONS
Let us first mention how an immigrant is defined in our analysis. There are several waysone can define an immigrant (place of birth, nationality or both). In the remainder ofthis paper, we use nationality or citizenship, which is an often-used criterion in Europeto define an immigrant. As a result, foreigners are considered as immigrants.
Since 1945, Belgium has been a country of immigration. In the late nineties, foreignersrepresented about 9% of the total population. This section describes the evolution andthe structure of immigration flows as well as the way immigrants become integrated intothe regional labor markets.
1.1.THE SIZE OF BELGIAN IMMIGRATION
As depicted on Figure 1, the annual number of immigrants ranged from a maximum of85,000 entries in the early sixties to a minimum of 20,000 entries in 1980. Over the 50last years, the average immigration flow has amounted to 50,000 persons per year.Given that Belgium is a small country with large borders proportionally to its size, mostof the foreigners come from bordering countries. Nationals from the other EU memberstates are also largely represented3.
In the past, an important part of these flows were oriented toward the labor market.After 1918, foreign manpower was recruited from Eastern Europe and Italy. Theseimmigrants worked in the building sector, in the textile industry and in the coal min-ing industry4. The 1930s economic depression and the resulting restrictions to foreignimmigration reduced the size of immigration between 1930 and 1939. After World War
MARC DEBUISSON, FREDERIC DOCQUIER, ABDUL NOURY AND MADELEINE NANTCHO
3 On figure 1, it obviously appears that the dynamics of total immigration is ruled by the number of European immi-grants. However, the proportion of Europeans in the total flow has declined from about 100% in the fifties to 70%in the late nineties.
4 It was an economic immigration but also a political one, an antifascist one (Morelli, 1992).
141

II, immigration started again, but the flows were collectively ruled by internationalagreements. The labor demand was strong in the coal industry and in the nationalreconstruction. In 1948, annual flows reached a maximum of 84,000 people (mainlyItalians). In 1956, the disaster at “Bois du Casier” caused many deaths among Italianminers. This dramatic event led to stop Italian immigration, as Italy asked for bettersecurity conditions for its nationals. Consequently, agreements were signed with Spainand Greece. Between 1958 and 1961, trade unions pleaded to reduce immigrationflows. However, new agreements were negotiated with Morocco and Turkey in 1964.The newcomers mainly originated from rural regions with low skills (see Lewin,1997).
Immigration flows were strongly linked to the economic context in Belgium.Governments tend to rule much more severely immigration during depression periods.This explains why immigration stopped in 1974. Due to the oil crisis, the foreign pop-ulation structure progressively changed. Between 1974 and 1980, the number of new-comers declined. Family reunion became an important motive. Since the late 1980s,the number of asylum seekers and refugees has increased.
FIGURE 1. BELGIAN IMMIGRATION FLOWS BY COUNTRY OF ORIGIN 1955-1995
Source: INS.
Over the last two decades, the average flow has amounted to 50,000. Today, about 70percent of the Belgian immigrants come from other European countries. The share ofNorth Americans reaches 8%. The share of immigrants coming from less developedcountries (mainly from North Africa) amounts to 22%. The Moroccan colony is largelyrepresented.
IMMIGRATION AND AGING IN THE BELGIAN REGIONS
142
0
10 000
20 000
30 000
40 000
50 000
60 000
70 000
80 000
90 000
1955 1959 1963 1966 1969 1972 1975 1978 1981 1984 1987 1990 1993
Total Europe Africa & Asia America and Oceania

1.2. REGIONAL DISPARITIES
Between WW2 and the 1960s, the Walloon industrial basins (mining, iron and steelindustries) were privileged sites to host immigrants. During the years 1962-1966, eco-nomic prosperity increased the need for foreign workers in large urban areas (Brussels,Antwerp, Ghent). Source countries were very heterogeneous5.
As the Walloon industrial basins drastically declined in the 1970s, immigrant flowsoriginated from Italy, Spain, Turkey and Maghreb were reoriented to large cities (espe-cially Brussels).
As shown in Figure 2, Brussels accounts for about 35% of Belgian immigrants (whilstits population share amounts to 12%). Wallonia and Flanders respectively draw 24 and41% of the national flows. Due to history, network effects and language differences, theorigin of immigrants differs across regions. In Brussels, immigrants mainly come fromPortugal. In Flanders, they come from the Netherlands, United Kingdom, Turkey, andthe United States. In Wallonia, they come from Germany and Italy. Note that immi-grants from France and Morocco are well represented in all Belgian regions.
FIGURE 2. IMMIGRATION FLOWS BY REGION OF DESTINATION 1994-2001
Source: INS.
MARC DEBUISSON, FREDERIC DOCQUIER, ABDUL NOURY AND MADELEINE NANTCHO
5 See Grimmeau (1984) and Martens (1976).
143
0
10 000
20 000
30 000
40 000
50 000
60 000
70 000
1994 1995 1996 1997 1998 1999 2000 2001
BelgiumWallonia
FlandersBrussels
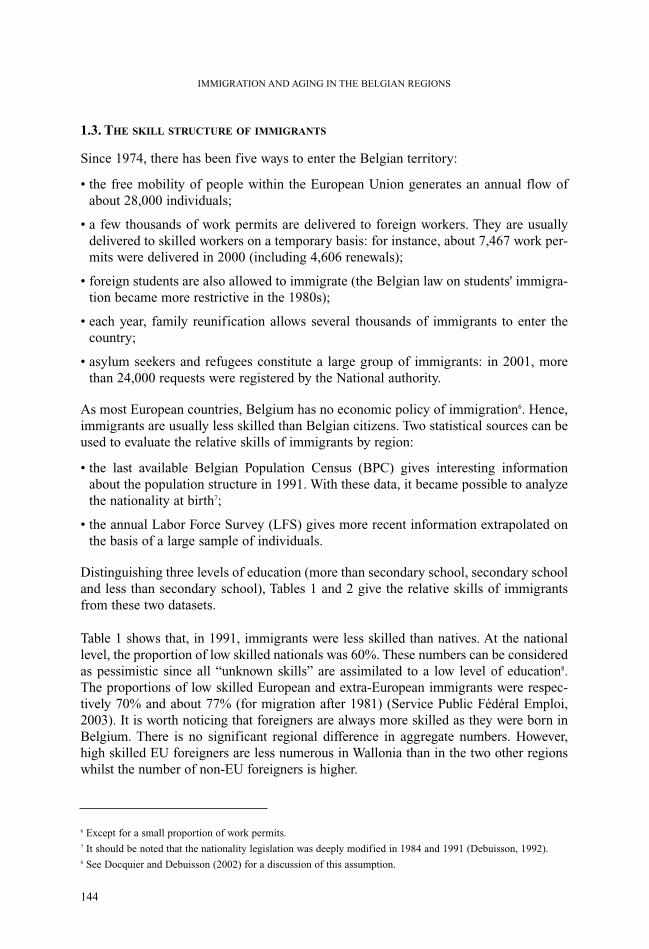
1.3. THE SKILL STRUCTURE OF IMMIGRANTS
Since 1974, there has been five ways to enter the Belgian territory:
• the free mobility of people within the European Union generates an annual flow ofabout 28,000 individuals;
• a few thousands of work permits are delivered to foreign workers. They are usuallydelivered to skilled workers on a temporary basis: for instance, about 7,467 work per-mits were delivered in 2000 (including 4,606 renewals);
• foreign students are also allowed to immigrate (the Belgian law on students' immigra-tion became more restrictive in the 1980s);
• each year, family reunification allows several thousands of immigrants to enter thecountry;
• asylum seekers and refugees constitute a large group of immigrants: in 2001, morethan 24,000 requests were registered by the National authority.
As most European countries, Belgium has no economic policy of immigration6. Hence,immigrants are usually less skilled than Belgian citizens. Two statistical sources can beused to evaluate the relative skills of immigrants by region:
• the last available Belgian Population Census (BPC) gives interesting informationabout the population structure in 1991. With these data, it became possible to analyzethe nationality at birth7;
• the annual Labor Force Survey (LFS) gives more recent information extrapolated onthe basis of a large sample of individuals.
Distinguishing three levels of education (more than secondary school, secondary schooland less than secondary school), Tables 1 and 2 give the relative skills of immigrantsfrom these two datasets.
Table 1 shows that, in 1991, immigrants were less skilled than natives. At the nationallevel, the proportion of low skilled nationals was 60%. These numbers can be consideredas pessimistic since all “unknown skills” are assimilated to a low level of education8. The proportions of low skilled European and extra-European immigrants were respec-tively 70% and about 77% (for migration after 1981) (Service Public Fédéral Emploi,2003). It is worth noticing that foreigners are always more skilled as they were born inBelgium. There is no significant regional difference in aggregate numbers. However,high skilled EU foreigners are less numerous in Wallonia than in the two other regionswhilst the number of non-EU foreigners is higher.
IMMIGRATION AND AGING IN THE BELGIAN REGIONS
6 Except for a small proportion of work permits.7 It should be noted that the nationality legislation was deeply modified in 1984 and 1991 (Debuisson, 1992).8 See Docquier and Debuisson (2002) for a discussion of this assumption.
144

Based on the LFS, Table 2 depicts the situation almost ten years after. To obtain significantinformation about immigrants, we aggregate 6 annual waves of data from 1996 to 2002.Hence, our average LFS dataset broadly refers to the year 1999. Regarding nationals, oneobtains more optimistic results than with the BPS dataset. The discrepancy between BPSand LFS can be explained (i) by more optimistic assumptions about the treatment of the “noanswers”, (ii) by differences in the survey questions and (iii) by high education investmentsamong young cohorts. The share of low skilled workers falls to 40% among citizens. Overthe period 1992-2002, there is a constant decrease of 2% per year in the share of unskilled.
TABLE 1. SKILL STRUCTURE OF POPULATION AGED 25-64 - CENSUS 1991
Note: The percentage distributions were scaled on the 1991 “Census Monography on Education”(Mainguet, 1998).Source : Population Census, 1991, INS and Point d’appui démographie VUB.
MARC DEBUISSON, FREDERIC DOCQUIER, ABDUL NOURY AND MADELEINE NANTCHO
Belgium In percent of the population In percent of the groupCitizenship at birth Low Medium High Total Low Medium HighNationals 87.4 90.8 94.0 89.3 60.6 20.8 18.6European Union non immigration 1.6 2.2 1.4 1.7 59.0 26.7 14.3
After 1980 1.6 1.2 0.9 1.4 70.3 18.2 11.51974-1980 0.8 0.6 0.4 0.7 70.8 19.7 9.5Before 1974 4.6 2.7 1.4 3.6 77.9 15.5 6.6
Other countries non immigration 0.4 0.4 0.3 0.4 61.1 24.0 15.0After 1980 1.2 0.6 0.6 1.0 75.6 13.6 10.81974-1980 1.0 0.5 0.4 0.8 78.4 12.3 9.2Before 1974 1.5 0.8 0.7 1.2 76.7 13.9 9.4
Total 100 100 100 100 61.9 20.5 17.7Wallonia In percent of the population In percent of the groupCitizenship at birth Low Medium High Total Low Medium HighNationals 81.4 84.5 91.6 83.7 61.8 20.4 17.8European Union non immigration 3.5 5.2 3.0 3.7 59.3 27.8 12.9
After 1980 2.0 1.6 0.8 1.7 74.3 18.3 7.41974-1980 1.2 1.0 0.4 1.0 73.6 20.1 6.3Before 1974 8.3 5.0 2.0 6.6 80.0 15.1 4.9
Other countries non immigration 0.7 0.9 0.6 0.7 61.8 24.8 13.3After 1980 0.9 0.6 0.6 0.8 72.7 15.1 12.21974-1980 0.7 0.4 0.4 0.6 74.0 14.7 11.4Before 1974 1.3 0.9 0.7 1.1 73.3 16.1 10.6
Total 100 100 100 100 62.6 20.8 16.6Flanders In percent of the population In percent of the groupCitizenship at birth Low Medium High Total Low Medium HighNationals 93.9 95.8 97.0 94.9 60.2 21.5 18.3European Union non immigration 0.5 0.6 0.4 0.5 62.2 23.7 14.1
After 1980 0.9 0.8 0.7 0.9 65.2 20.6 14.21974-1980 0.4 0.4 0.3 0.4 66.8 21.1 12.0Before 1974 1.8 1.2 0.7 1.5 74.2 16.8 8.9
Other countries non immigration 0.1 0.1 0.1 0.1 66.0 21.9 12.0After 1980 0.7 0.4 0.3 0.6 76.2 13.4 10.41974-1980 0.6 0.3 0.2 0.5 81.6 12.0 6.4Before 1974 0.9 0.4 0.3 0.7 79.4 13.2 7.4
Total 100 100 100 100 60.8 21.2 17.9Brussels In percent of the population In percent of the groupCitizenship at birth Low Medium High Total Low Medium HighNationals 68.2 75.8 84.3 72.8 58.7 17.3 24.0European Union non immigration 1.8 3.2 2.4 2.1 52.0 24.7 23.4
After 1980 3.9 3.0 2.4 3.4 71.3 14.3 14.41974-1980 1.5 1.3 0.8 1.4 70.8 16.4 12.8Before 1974 8.2 6.1 3.0 6.8 76.0 14.9 9.1
Other countries non immigration 0.6 1.0 0.8 0.7 53.1 23.0 23.8After 1980 4.9 3.1 2.0 4.0 77.0 12.7 10.21974-1980 4.3 2.3 1.7 3.4 78.2 11.3 10.5Before 1974 6.6 4.2 2.6 5.3 77.0 12.9 10.1
Total 100 100 100 100 61.5 16.0 22.5
145
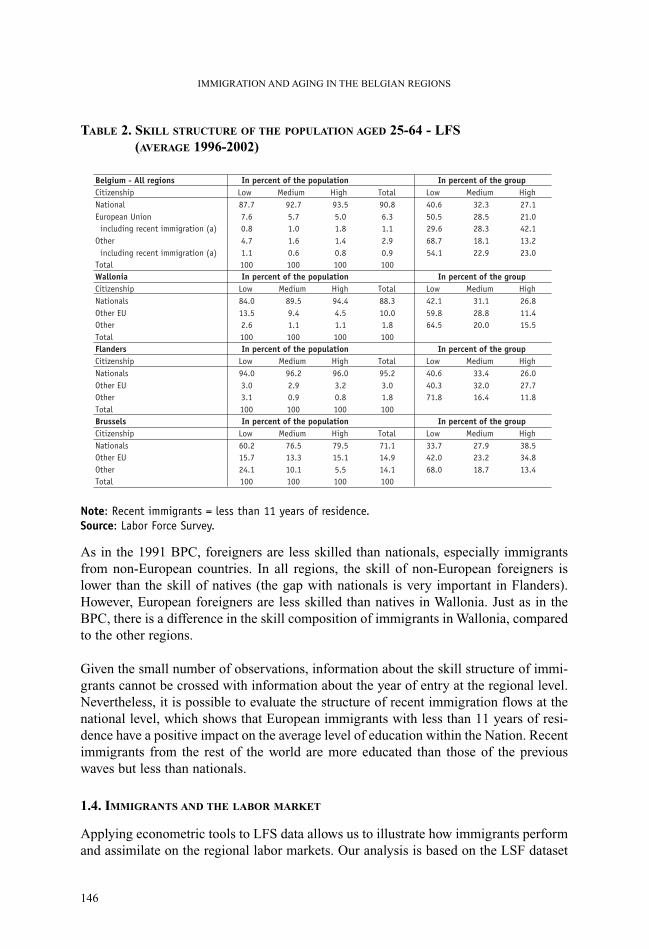
TABLE 2. SKILL STRUCTURE OF THE POPULATION AGED 25-64 - LFS (AVERAGE 1996-2002)
Note: Recent immigrants = less than 11 years of residence.Source: Labor Force Survey.
As in the 1991 BPC, foreigners are less skilled than nationals, especially immigrantsfrom non-European countries. In all regions, the skill of non-European foreigners islower than the skill of natives (the gap with nationals is very important in Flanders).However, European foreigners are less skilled than natives in Wallonia. Just as in theBPC, there is a difference in the skill composition of immigrants in Wallonia, comparedto the other regions.
Given the small number of observations, information about the skill structure of immi-grants cannot be crossed with information about the year of entry at the regional level.Nevertheless, it is possible to evaluate the structure of recent immigration flows at thenational level, which shows that European immigrants with less than 11 years of resi-dence have a positive impact on the average level of education within the Nation. Recentimmigrants from the rest of the world are more educated than those of the previouswaves but less than nationals.
1.4. IMMIGRANTS AND THE LABOR MARKET
Applying econometric tools to LFS data allows us to illustrate how immigrants performand assimilate on the regional labor markets. Our analysis is based on the LSF dataset
IMMIGRATION AND AGING IN THE BELGIAN REGIONS
Belgium - All regions In percent of the population In percent of the groupCitizenship Low Medium High Total Low Medium HighNational 87.7 92.7 93.5 90.8 40.6 32.3 27.1European Union 7.6 5.7 5.0 6.3 50.5 28.5 21.0 including recent immigration (a) 0.8 1.0 1.8 1.1 29.6 28.3 42.1Other 4.7 1.6 1.4 2.9 68.7 18.1 13.2 including recent immigration (a) 1.1 0.6 0.8 0.9 54.1 22.9 23.0Total 100 100 100 100Wallonia In percent of the population In percent of the groupCitizenship Low Medium High Total Low Medium HighNationals 84.0 89.5 94.4 88.3 42.1 31.1 26.8Other EU 13.5 9.4 4.5 10.0 59.8 28.8 11.4Other 2.6 1.1 1.1 1.8 64.5 20.0 15.5Total 100 100 100 100Flanders In percent of the population In percent of the groupCitizenship Low Medium High Total Low Medium HighNationals 94.0 96.2 96.0 95.2 40.6 33.4 26.0Other EU 3.0 2.9 3.2 3.0 40.3 32.0 27.7Other 3.1 0.9 0.8 1.8 71.8 16.4 11.8Total 100 100 100 100Brussels In percent of the population In percent of the groupCitizenship Low Medium High Total Low Medium HighNationals 60.2 76.5 79.5 71.1 33.7 27.9 38.5Other EU 15.7 13.3 15.1 14.9 42.0 23.2 34.8Other 24.1 10.1 5.5 14.1 68.0 18.7 13.4Total 100 100 100 100
146

over the period 1992-20019, which delivers information about individual labor marketstatus (inactive, unemployed or employed) and characteristics (such as education, sex,age, region of residence, years of residence, country of birth and citizenship). Regardingcitizenship, we distinguish between nationals from EU and North America and nation-als from the rest of the world. As a result, the variable “IMMIGRANT” is defined to besomeone who is not a national from Belgium, EU or North America.
To analyze discrimination and assimilation we estimate a very simple model specifiedas follows:
(1)
where yijt* is the underlying response variable measuring the employability of individ-ual i in region j at period t; yijt is a dummy variable indicating whether the individual isemployed, xijt denotes personal characteristics, and �ijt is the error term. Our main vari-able of interest is zijt, which indicates whether the individual is an immigrant. As is clearfrom equation (1), the model contains time dummies (year dummies), which control forthe effect of common shocks that occur during a given period to a given region.Assuming that the error term has a logit distribution and denoting pijt= Pr(yijt=1) theprobability that individual i in region j at period t is employed, we end up with the fol-lowing equation to be estimated:
(2)
We use an error component logit model10 to perform two tests. First we test whetherthere is any evidence of discrimination against immigrants in Belgium. To that end, weestimate our model with “IMMIGRANT” as the main variable of interest. If the coeffi-cient associated to this variable is statistically significant then one can conclude that there is some empirical evidence of discrimination against immigrant in Belgium.Note however that our data do not allow us to discriminate between statistical discrim-ination and pure discrimination. Second we analyze the question of immigrant assimi-lation in Belgium. That is, we analyze the extent to which the probability that an immi-grant is employed increases as a function of the number of years of residence in
MARC DEBUISSON, FREDERIC DOCQUIER, ABDUL NOURY AND MADELEINE NANTCHO
147
ijttjijtijtijt zxy ετµγβα +++++= ''*
>
==
otherwise
yify
y ijt
ijt
ijt 00
1 *
tjijtijtijt
ijte zx
p
pτµγβα ++++=
−'')
1(log
9 Descriptive statistics are provided in Table A1 in the appendix.10 To be precise, the procedure just described applies to panel data. Strictly speaking, this methodology cannot be
applied in our case because the data at hand are not a panel or even rotating panel. In particular, one cannot usethe standard panel data econometric tools to control for unobserved heterogeneity or measuring dynamics, whichis one of the main attractions of panel data. Instead of standard panel or rotating panel we have repeated cross-sectional observations. Despite the different nature of these data, one can use the panel data framework in orderto control for the effect of location (i.e. region, country) and time (business cycle).
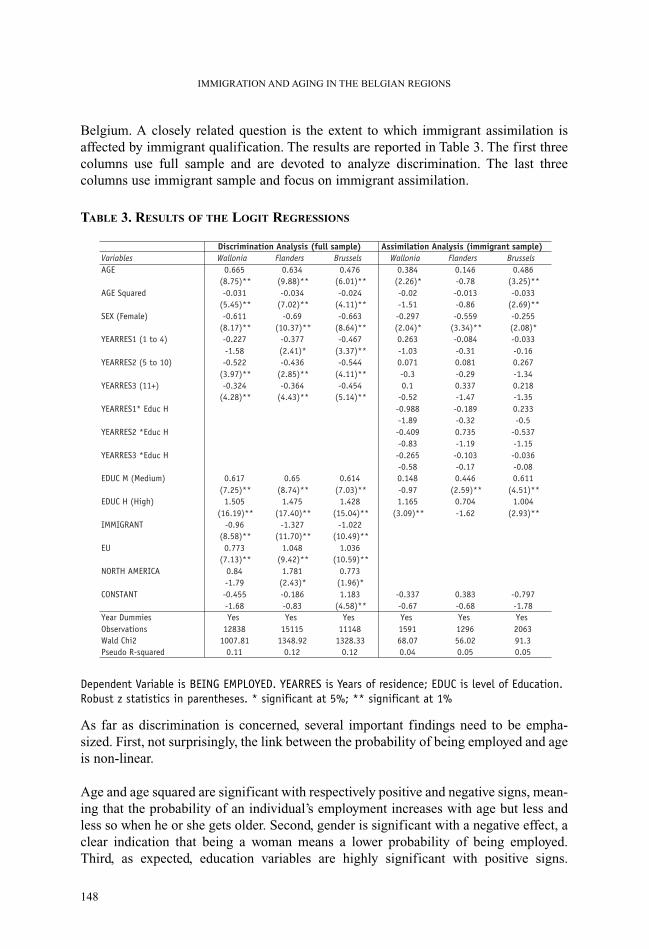
Belgium. A closely related question is the extent to which immigrant assimilation isaffected by immigrant qualification. The results are reported in Table 3. The first threecolumns use full sample and are devoted to analyze discrimination. The last threecolumns use immigrant sample and focus on immigrant assimilation.
TABLE 3. RESULTS OF THE LOGIT REGRESSIONS
Dependent Variable is BEING EMPLOYED. YEARRES is Years of residence; EDUC is level of Education.Robust z statistics in parentheses. * significant at 5%; ** significant at 1%
As far as discrimination is concerned, several important findings need to be empha-sized. First, not surprisingly, the link between the probability of being employed and ageis non-linear.
Age and age squared are significant with respectively positive and negative signs, mean-ing that the probability of an individual’s employment increases with age but less andless so when he or she gets older. Second, gender is significant with a negative effect, aclear indication that being a woman means a lower probability of being employed.Third, as expected, education variables are highly significant with positive signs.
IMMIGRATION AND AGING IN THE BELGIAN REGIONS
148
Discrimination Analysis (full sample) Assimilation Analysis (immigrant sample)Variables Wallonia Flanders Brussels Wallonia Flanders BrusselsAGE 0.665 0.634 0.476 0.384 0.146 0.486
(8.75)** (9.88)** (6.01)** (2.26)* -0.78 (3.25)**AGE Squared -0.031 -0.034 -0.024 -0.02 -0.013 -0.033
(5.45)** (7.02)** (4.11)** -1.51 -0.86 (2.69)**SEX (Female) -0.611 -0.69 -0.663 -0.297 -0.559 -0.255
(8.17)** (10.37)** (8.64)** (2.04)* (3.34)** (2.08)*YEARRES1 (1 to 4) -0.227 -0.377 -0.467 0.263 -0.084 -0.033
-1.58 (2.41)* (3.37)** -1.03 -0.31 -0.16YEARRES2 (5 to 10) -0.522 -0.436 -0.544 0.071 0.081 0.267
(3.97)** (2.85)** (4.11)** -0.3 -0.29 -1.34YEARRES3 (11+) -0.324 -0.364 -0.454 0.1 0.337 0.218
(4.28)** (4.43)** (5.14)** -0.52 -1.47 -1.35YEARRES1* Educ H -0.988 -0.189 0.233
-1.89 -0.32 -0.5YEARRES2 *Educ H -0.409 0.735 -0.537
-0.83 -1.19 -1.15YEARRES3 *Educ H -0.265 -0.103 -0.036
-0.58 -0.17 -0.08EDUC M (Medium) 0.617 0.65 0.614 0.148 0.446 0.611
(7.25)** (8.74)** (7.03)** -0.97 (2.59)** (4.51)**EDUC H (High) 1.505 1.475 1.428 1.165 0.704 1.004
(16.19)** (17.40)** (15.04)** (3.09)** -1.62 (2.93)**IMMIGRANT -0.96 -1.327 -1.022
(8.58)** (11.70)** (10.49)**EU 0.773 1.048 1.036
(7.13)** (9.42)** (10.59)**NORTH AMERICA 0.84 1.781 0.773
-1.79 (2.43)* (1.96)*CONSTANT -0.455 -0.186 1.183 -0.337 0.383 -0.797
-1.68 -0.83 (4.58)** -0.67 -0.68 -1.78Year Dummies Yes Yes Yes Yes Yes YesObservations 12838 15115 11148 1591 1296 2063Wald Chi2 1007.81 1348.92 1328.33 68.07 56.02 91.3Pseudo R-squared 0.11 0.12 0.12 0.04 0.05 0.05
Finally, and more importantly being an immigrant is significant and has a negative signcapturing the fact that there is some evidence for discrimination against immigrants. Asalready mentioned it is important to note that here the lack of relevant data prevents usfrom being more precise on the nature of discrimination. In particular, we cannot dis-criminate between statistical and pure discriminations. The results also show that an EUnational or a national from North America has a higher probability of being employed.That is, they face a positive discrimination. This finding is not surprising given thatthese ‘immigrants’ are employed either by the EU institutions like the EuropeanCommission or by multinational firms. Overall, the results are highly similar across allregions of Belgium.
After concluding that some discrimination exists against immigrants in Belgium wefocus our attention on the important question of assimilation. To do that, we considerthe sample containing only immigrants and examine whether years of residence inBelgium reduce the level of discrimination. The results regarding assimilation arereported in the last third columns of Table 3. As far as age, sex and education is con-cerned, the results are essentially similar to those obtained with the full sample. Themost striking finding that emerges from the analysis is that there is no evidence forassimilation. That is, the probability that an immigrant is employed does not increasewith the years of residence. This result remains true even when looking at the behaviorof high skilled immigrants. Controlling for the skill or education level, the years of res-idence do not have any explanatory power. Several explanations can be provided regard-ing this finding. First, the variables measuring the years of residence are potentiallyendogenous. Second, other important relevant factors such as type of education are notavailable in this database. As a result, care must be taken to interpret our econometricanalysis on immigrant discrimination and assimilation.
2. EVALUATING REPLACEMENT IMMIGRATION NEEDS
In this section, we evaluate the need for replacement immigration in the Belgianregions. We define the maximal immigration stock resulting from a simple demograph-ic constraint. Then we compute the number of new immigrants required to stabilize thedependency ratio.
2.1. PROJECTION METHODOLOGY
The demographic constraint. Demographers usually emphasize the dangers of resort-ing to replacement immigration policies. The reason is simple: in many industrializedcountries, a policy of mass immigration is likely to generate a dynamically explosivepath of population size. Such an issue is discussed by Blanchet (2002), who distin-guishes two opposite patterns of aging:
• under scenario A, changes in the number of retirees are small while, on the contrary,the working age population falls. Aging is essentially due to the drop in fertility rates.
MARC DEBUISSON, FREDERIC DOCQUIER, ABDUL NOURY AND MADELEINE NANTCHO
149

In that case, stabilizing the working age population through immigration does notjeopardize the dynamics of the population;
• under scenario B, changes in the working age population are relatively small but, onthe contrary, the number of retirees strongly increases. Aging is essentially due to thedisplacement of large baby boom cohorts in the age pyramid and to the rise in lifeexpectancy. In that case, a replacement immigration policy requires the working agepopulation to grow at the same pace as the old-age population. The size of immigra-tion flows can be very important. Such a policy is likely to generate an unsustainablegrowth of the population size: if the working age group must be doubled by 2030, itwill have to be quadruplicated by 2070.
As it will appear below, a replacement immigration policy is demographically sustain-able in Flanders. On the contrary, resorting to mass immigration would jeopardize thedemographic stability in Brussels and in Wallonia11.
Aging and dependency. To capture the impact of aging on the economy, we use variousmeasures of the dependency ratio (i.e. the ratio of total population to the working aged).We start from demographic forecasts and introduce economic features in the analysis.At the numerator, individuals are weighted by consumption needs depending on theirage. At the denominator, individuals are weighted by their employability and by theirproductivity at work. Hence, our analysis incorporates assumptions about the evolutionof participation rates, skill levels and unemployment rates. Basically, our dependencyratio at time t can be written as
(3)
where measures the number of individuals of age a, gender g (males or females),skill level s (low skills, intermediate skills or high skills) at year t; is their labor par-ticipation rate; and are the unemployment rate and the marginal productivity oflabor; ca is a parameter measuring the relative consumption needs at age a.
Given official population forecasts (INS, 2001), equation (3) contains the key trendsdetermining the burden of aging and the benefits of a selective immigration. Thesetrends concern participation rates, unemployment rates and the marginal productivity oflabor. In this paper, we use a simple mechanical approach based on a set of scenarios.
IMMIGRATION AND AGING IN THE BELGIAN REGIONS
11 It is worth noticing that, in the rest of the world, scenario B is dominant. In large immigration countries such asAustralia, Canada and the US, the working age population keeps increasing between 2000 and 2050. Scenario Aapplies in some European countries and in Japan.
150
∑ ∑ ∑∑ ∑ ∑
= = =
= = =
−=∆
100
1 , ,,
,,,
,,
100
1 , ,,
,,
)1(a fmg hils
st
sgt
sgta
sgta
a fmg hils asg
ta
twuN
cN
α

- as for participation rates per gender and per age12, we assume that the Belgianregions will catch up the EU-15 maximal rates between 2000 and 2005, in part (25,50 or 75% of the gap) or in totality (full convergence). The convergence process islinear;
- as for unemployment rates, we use the LFS data to compute the rates by gender andskill levels for each region in 2000 as well as the minimal unemployment ratesobtained at the European level. Then we consider two alternative scenarios. The statusquo scenario considers that the regional unemployment rates remain constant overtime. The optimistic scenario considers a progressive convergence towards the mini-mal European rates at the horizon 2050. The convergence process is linear;
- as for the population structure per skill level, we use the LFS data to compute the shareof low, intermediate and high skilled individuals in each region by the year 2000.Then, for age groups above 25 (those who have completed their education), we extrap-olate these cohort shares on the basis of the observations for 2000. For future cohortsof younger cohorts (aged 15-29), we use the average shares observed over the recentperiod 1990-2000 and keep them constant over time. Since young cohorts are moreeducated than older cohorts, our assumption induces a progressive rise in the educa-tional attainment of the labor force;
- the marginal productivity of labor is projected using a production function that distin-guishes low and high skilled workers (medium skilled and low skilled are aggregated)and allows for skill biased technical change, Yt={[(1-�t)Lt]� + [�tHt]�}1/�. In this equa-tion, L and H are the stock of skilled and unskilled workers (determined by participa-tion rates and unemployment rates), � captures a skill biased technical change and �determines the elasticity of substitution between low skilled and high skilled workers13.The marginal productivity of workers is given by the partial derivatives. The wageratio is clearly depending on technical change and the stocks of skilled and unskilledworkers. In our simulation, we calibrate � in such a way that the wage ratio corre-sponds to 1.5 in 2000. Then we consider two alternative scenarios. A scenario of con-stant technology keeps � as constant. A scenario of skill bias considers an exogenousimpulse in � raising the wage ratio by 25% between 2000 and 2050.
- in each scenario, the parameter of consumption need is taken from the US study ofCutler et al. (1990), i.e. 0.7 for individuals aged 0-24, 1.0 for those aged 25-64 and 1.3for those aged 65 and more.
How many skilled immigrants? Clearly, the impact of a new immigrant on the ratiodepends on his characteristics (in terms of gender, skill level and age), on the labor mar-ket situation (captured by the unemployment rate and the marginal productivity of
MARC DEBUISSON, FREDERIC DOCQUIER, ABDUL NOURY AND MADELEINE NANTCHO
12 Data for 2000 are taken for the Labor Force Survey. See appendix.13 According to the empirical literature, the elasticity of substitution lies between 1 and 2 (L and H are gross sub-
stitutes). We opt for 1.5.
151

labor) and on the current state of dependency. We assume that new skilled immigrantsare not discriminated against. That is, we assume that on the job market they performexactly as well as natives. The impact of immigration on dependency is given by
(4)
A new immigrant makes the ratio decreasing if and only if his own consumption/wageratio (ca / (1- ) ) is lower than the aggregate dependency ratio (�t). For eachscenario, we estimate the number of skilled immigrants required to stabilize the depend-ency ratio. To simplify, we consider that new immigrants are high skilled males aged 35.
2.2. RESULTS
The simulated dependency ratios are given in Table 4. At the national level, the mostoptimistic scenario is the one with full convergence of participation rates, decreasingunemployment rate and no skill bias. In that case, the dependency ratio falls by 8%. Inthe most pessimistic case (constant unemployment rate, slow convergence in participa-tion rates and skill biased technical change), the rise in dependency reaches 20%.
TABLE 4. SIMULATED DEPENDENCY RATIO UNDER VARIOUS ASSUMPTIONS
Source: Authors' calculations.
IMMIGRATION AND AGING IN THE BELGIAN REGIONS
152
∑ ∑ ∑= = =−
∆−−=
∂∆∂
100
1 , ,,
,,,,
,,
,,,,
,, )1(
)1(
a fmg hils
sgt
sgt
sgta
sgta
tsg
tsg
tsg
taa
sgta
t
wuN
wuc
N α
α
,,
sgtaα ,sg
tu ,sgtw
Participation rates (25% convergence) Wallonia Flanders Brussels BelgiumNo skill bias 2000 2030 2050 2000 2030 2050 2000 2030 2050 2000 2030 2050Constant unemployment rate 1.000 1.073 1.097 1.000 1.147 1.183 1.000 0.982 1.007 1.000 1.117 1.148Decreasing unemployment rate 1.000 0.994 0.970 1.000 1.129 1.153 1.000 0.897 0.871 1.000 1.090 1.102Skill biasConstant unemployment rate 1.000 1.090 1.141 1.000 1.165 1.231 1.000 1.016 1.083 1.000 1.142 1.207Decreasing unemployment rate 1.000 1.012 1.017 1.000 1.148 1.201 1.000 0.931 0.944 1.000 1.115 1.161Participation rates (50% convergence) Wallonia Flanders Brussels BelgiumNo skill bias 2000 2030 2050 2000 2030 2050 2000 2030 2050 2000 2030 2050Constant unemployment rate 1.000 1.038 1.039 1.000 1.113 1.129 1.000 0.955 0.963 1.000 1.083 1.092Decreasing unemployment rate 1.000 0.961 0.918 1.000 1.096 1.100 1.000 0.872 0.832 1.000 1.057 1.048Skill biasConstant unemployment rate 1.000 1.055 1.080 1.000 1.131 1.173 1.000 0.989 1.034 1.000 1.107 1.147Decreasing unemployment rate 1.000 0.979 0.962 1.000 1.114 1.145 1.000 0.905 0.902 1.000 1.081 1.104Participation rates (75% convergence) Wallonia Flanders Brussels BelgiumNo skill bias 2000 2030 2050 2000 2030 2050 2000 2030 2050 2000 2030 2050Constant unemployment rate 1.000 0.938 0.976 1.000 1.016 1.066 1.000 0.880 0.917 1.000 0.985 1.030Decreasing unemployment rate 1.000 0.868 0.862 1.000 0.999 1.039 1.000 0.804 0.793 1.000 0.960 0.988Skill biasConstant unemployment rate 1.000 0.953 1.014 1.000 1.031 1.107 1.000 0.910 0.985 1.000 1.006 1.081Decreasing unemployment rate 1.000 0.884 0.902 1.000 1.015 1.080 1.000 0.834 0.859 1.000 0.982 1.040Participation rates (full convergence) Wallonia Flanders Brussels BelgiumNo skill bias 2000 2030 2050 2000 2030 2050 2000 2030 2050 2000 2030 2050Constant unemployment rate 1.000 0.953 0.908 1.000 1.025 0.993 1.000 0.896 0.869 1.000 0.998 0.960Decreasing unemployment rate 1.000 0.882 0.801 1.000 1.009 0.968 1.000 0.818 0.751 1.000 0.973 0.920Skill biasConstant unemployment rate 1.000 0.968 0.943 1.000 1.041 1.031 1.000 0.927 0.933 1.000 1.019 1.007Decreasing unemployment rate 1.000 0.898 0.838 1.000 1.025 1.005 1.000 0.849 0.813 1.000 0.994 0.968
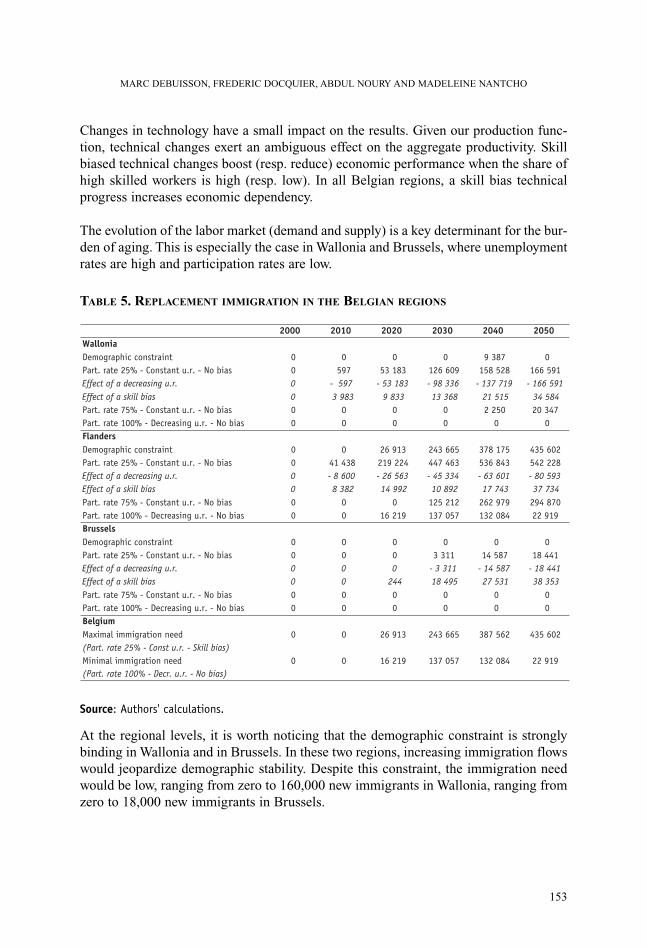
Changes in technology have a small impact on the results. Given our production func-tion, technical changes exert an ambiguous effect on the aggregate productivity. Skillbiased technical changes boost (resp. reduce) economic performance when the share ofhigh skilled workers is high (resp. low). In all Belgian regions, a skill bias technicalprogress increases economic dependency.
The evolution of the labor market (demand and supply) is a key determinant for the bur-den of aging. This is especially the case in Wallonia and Brussels, where unemploymentrates are high and participation rates are low.
TABLE 5. REPLACEMENT IMMIGRATION IN THE BELGIAN REGIONS
Source: Authors' calculations.
At the regional levels, it is worth noticing that the demographic constraint is stronglybinding in Wallonia and in Brussels. In these two regions, increasing immigration flowswould jeopardize demographic stability. Despite this constraint, the immigration needwould be low, ranging from zero to 160,000 new immigrants in Wallonia, ranging fromzero to 18,000 new immigrants in Brussels.
MARC DEBUISSON, FREDERIC DOCQUIER, ABDUL NOURY AND MADELEINE NANTCHO
153
2000 2010 2020 2030 2040 2050WalloniaDemographic constraint 0 0 0 0 9 387 0Part. rate 25% - Constant u.r. - No bias 0 597 53 183 126 609 158 528 166 591Effect of a decreasing u.r. 0 - 597 - 53 183 - 98 336 - 137 719 - 166 591Effect of a skill bias 0 3 983 9 833 13 368 21 515 34 584Part. rate 75% - Constant u.r. - No bias 0 0 0 0 2 250 20 347Part. rate 100% - Decreasing u.r. - No bias 0 0 0 0 0 0FlandersDemographic constraint 0 0 26 913 243 665 378 175 435 602Part. rate 25% - Constant u.r. - No bias 0 41 438 219 224 447 463 536 843 542 228Effect of a decreasing u.r. 0 - 8 600 - 26 563 - 45 334 - 63 601 - 80 593Effect of a skill bias 0 8 382 14 992 10 892 17 743 37 734Part. rate 75% - Constant u.r. - No bias 0 0 0 125 212 262 979 294 870Part. rate 100% - Decreasing u.r. - No bias 0 0 16 219 137 057 132 084 22 919BrusselsDemographic constraint 0 0 0 0 0 0Part. rate 25% - Constant u.r. - No bias 0 0 0 3 311 14 587 18 441Effect of a decreasing u.r. 0 0 0 - 3 311 - 14 587 - 18 441Effect of a skill bias 0 0 244 18 495 27 531 38 353Part. rate 75% - Constant u.r. - No bias 0 0 0 0 0 0Part. rate 100% - Decreasing u.r. - No bias 0 0 0 0 0 0BelgiumMaximal immigration need 0 0 26 913 243 665 387 562 435 602(Part. rate 25% - Const u.r. - Skill bias)Minimal immigration need 0 0 16 219 137 057 132 084 22 919(Part. rate 100% - Decr. u.r. - No bias)
The demand for skilled immigration is larger in Flanders, ranging from 23,000 to542,000 individuals according to the set of assumptions. In annual flows, these numberscorrespond to the entry of 500 to 10,000 new skilled immigrants. The evolution ofunemployment and technology explains a small proportion of this range. Changes inparticipation rates are very important.
The last part of the table gives the range of replacement (skilled) immigration neededfor Belgium as a whole. Taking into account the demographic constraint, the total num-ber of new immigrants goes from 23,000 to 435,000 in 2050. Over 50 years, this rough-ly represents an additional flow of 500 to 9,000 selected immigrants per year. This num-ber must be compared to the current unselected flow of 55,000 individuals, includingabout 11,000 high skilled workers (see table 2). The additional flows would only con-cern the Flemish region where the current annual flows amount to 25,000 immigrants(including about 6,000 skilled workers).
3. DISCUSSION
Immigration is usually seen as a partial solution to reduce the burden of aging. In thisnote, we evaluate the demand for skilled immigration in the Belgian regions. Wedevelop a simple projection methodology that takes into account the dynamics ofpopulation, the changes in the demand and supply of labor and the technologicalprogress.
We show that replacement immigration is a sustainable policy in Flanders, but not inWallonia and Brussels, where it would jeopardize demographic stability. Compared tothe official projections, an additional flow ranging from 500 to 9,000 skilled immigrantswould be necessary to stabilize the economic dependency ratio. Of course, such achange in selected immigration would increase, through family reunification, the num-ber of unselected candidates.
Despite the simplicity of our analysis, we would like to emphasize that replacementimmigration still raises many outstanding issues:
• how to reduce labor market discrimination against foreign workers? Table 3 revealsthat the probability to be employed is lower for immigrants than nationals, even aftercontrolling for individual characteristics. Resorting to immigration is sustainable ifassimilation and integration raise no problem;
• what would be the short-run costs of an increased immigration? Can immigrationreduce the wage of natives or, in the presence of labor market rigidities, can it increasethe equilibrium unemployment rate in the receiving region? There is a large literatureon this issue (see Borjas, 1995), with controversial results;
• have the European regions the capacity to select immigrants? This question is espe-cially relevant given the perspectives of enlargement of the European Union to Eastern
IMMIGRATION AND AGING IN THE BELGIAN REGIONS
154

countries with lower income per capita. The importance of welfare programs is alsolikely to generate self-selection within migration networks;
• is there a sufficient supply of skilled labor at the world level? If large immigrationcountries such as Canada, Australia and the United States resort to replacement immi-gration, a shortage of skilled workers is likely to be observed14;
• what would be the consequence for emigration countries? If several industrializedcountries resort to replacement migration, this will increase the brain drain flows fromthe South to the North. This can be detrimental for international inequality (seeCommander et al. for a survey).
We argue that these questions should be clearly addressed before implementing anyreplacement policy. International cooperation between sending and receiving countriesis also necessary to share the gain between the parties concerned.
MARC DEBUISSON, FREDERIC DOCQUIER, ABDUL NOURY AND MADELEINE NANTCHO
14 A quick glance at population forecasts reveals that mass immigration would jeopardize the demographic stabilityin these three immigration countries. Interestingly, replacement immigration seems mainly sustainable in someEuropean countries and Japan.
155

REFERENCES
Auerbach A.J. and P. Oreopoulos, 2000. “The fiscal impact of US immigration: Agenerational accounting perspective”, in: J. Poterba (ed.), Tax policy and the economy,Vol. 14, MIT Press: Cambridge.Blanchet D., 2002. “Immigration et avenir démographique”, in: Commissariat généraldu Plan, Immigration, marché du travail, intégration, La Documentation française:Paris.Bonin H., B. Raffelhüschen and K.J. Walliser, 2000. “Can immigration alleviate thedemographic burden?”, FinanzArchiv, 57(1).Borjas G.J., 1995. “The economic benefits from immigration”, Journal of EconomicPerspectives, 9(2), 3-22.Debuisson M. and M. Poulain, 1992. “Des étrangers, des immigrés, combien sont-ilsen Belgique?”, Migrations et Espaces 2, Academia: Louvain-la-Neuve.Docquier F. and M. Debuisson, 2002. Marché du travail et immigration sélective.Bilan et perspectives en Belgique, Capital humain et marché du travail : perspectivesrégionales et européennes, Commission 1 Discriminations et inadéquations de l’offre etde la demande sur le marché du travail, p.103-126. (Quinzième Congrès des écono-mistes belges de langue française, Namur)Grimmeau J.P., 1984. “Soixante ans d'immigration étrangère en Belgique”, in L'AnnéeSociale, 214-221.Institut national de statistique (INS). Démographie mathématique. Perspectives depopulation 2000-2050 par arrondissement. Bruxelles, Ministère des affaireséconomiques, 2001. 358 p.Martens A., 1976. Les immigrés. Flux et reflux d'une main-d'oeuvre d'appoint, Presseuniversitaire de Louvain.Morelli A., 1992. Histoire des étrangers et de l’immigration en Belgique, de la préhis-toire à nos jours, EVO/CBAIService public fédéral Emploi, Travail et Concertation sociale, 2003. “L'immigrationen Belgique. Effectifs, mouvements et marché du travail”, Rapport 2001.Mainguet C. and M. Demeuse, 1998. “Scolarisation, niveau d'instruction et insertionprofessionnelle”, Monographie 9, INS.Lewin R., 1997. Balises pour l’avant 1974, dans La Belgique et ses immigrés, Lespolitiques manquées, De Boeck Université.Storesletten K., 2000. “Sustaining fiscal policy through immigration”, Journal ofPolitical Economy, 108(2), 300-323.United Nations, 2000. Replacement migration, UN report.
IMMIGRATION AND AGING IN THE BELGIAN REGIONS
156

APPENDIX. DATA FROM THE EUROPEAN LABOR FORCE SURVEY
TABLE A1. DESCRIPTIVE STATISTICS LFS (NUMBER OF OBS. = 39 295)
Source: Authors' calculations.
TABLE A2. PARTICIPATION RATES AND UNEMPLOYMENT RATES IN THE BELGIAN REGIONS
Source: Labor Force Survey - Authors' calculations.
MARC DEBUISSON, FREDERIC DOCQUIER, ABDUL NOURY AND MADELEINE NANTCHO
157
Variables Est. Mean Std. Err. [95% Conf. interval]BEING EMPLOYED 0.9171 0.0016 0.9140 0.9202AGE 7.0726 0.0370 7.0001 7.1450AGE Squared 60.7260 0.5642 59.6200 61.8320SEX (Female) 0.5111 0.0073 0.4968 0.5255EDUC L (Low) 0.4270 0.0068 0.4136 0.4403EDUC M (Medium) 0.2396 0.0046 0.2306 0.2485EDUC H (High) 0.1543 0.0033 0.1478 0.1608YEARRES1 (1 to 4) 0.0094 0.0002 0.0090 0.0098YEARRES2 (5 to 10) 0.0101 0.0002 0.0096 0.0105YEARRES3 (11+) 0.0601 0.0011 0.0580 0.0622Belgian Nationals 0.9161 0.0016 0.9130 0.9192EU Nationals 0.0506 0.0010 0.0487 0.0526North American Nationals 0.0008 0.0000 0.0007 0.0009IMMIGRANT 0.0312 0.0009 0.0294 0.0330
Participation rate profile per gender and per region (in %)
Males Wallonia Flanders Brussels Min EU Mean EU Max EU
15-19 9.6% 11.6% 7.7% 9.7% 31.0% 65.3%20-24 58.3% 66.0% 49.0% 60.8% 71.2% 84.2%25-29 92.0% 94.7% 84.9% 81.4% 90.0% 93.7%30-34 93.6% 96.3% 91.8% 91.2% 94.8% 97.2%35-39 93.9% 95.9% 91.7% 91.8% 95.1% 97.3%40-44 91.5% 94.4% 91.6% 91.2% 94.4% 96.8%45-49 89.8% 92.1% 87.6% 88.2% 92.5% 94.7%50-54 78.0% 83.2% 81.2% 80.2% 86.8% 90.7%55-59 49.6% 53.5% 57.8% 51.8% 68.2% 84.5%60-64 18.4% 17.2% 26.5% 11.1% 34.4% 56.4%Females Wallonia Flanders Brussels Min EU Mean EU Max EU
15-19 5.0% 8.0% 4.4% 6.4% 27.2% 63.1%20-24 50.0% 57.8% 42.2% 48.8% 62.6% 77.0%25-29 79.9% 86.6% 76.0% 61.1% 76.2% 82.8%30-34 76.8% 82.9% 76.0% 62.9% 74.4% 84.1%35-39 73.6% 79.2% 74.2% 60.3% 73.7% 87.0%40-44 70.5% 72.5% 73.2% 56.9% 73.1% 89.1%45-49 61.3% 61.7% 68.4% 49.0% 68.5% 89.1%50-54 46.0% 43.0% 60.4% 38.0% 58.9% 87.1%55-59 26.1% 21.7% 38.7% 20.2% 41.2% 78.4%60-64 6.1% 5.0% 9.7% 5.5% 17.8% 48.9%
Unemployment rate per gender, per skill level and per region (in %)
Males Wallonia Flanders Brussels Min EU Mean EU Max EU
Low skilled 22.0% 7.7% 26.8% 4.7% 10.2% 19.5%Medium skilled 9.9% 4.4% 17.6% 2.4% 7.0% 13.4%High skilled 4.0% 2.9% 9.0% 2.1% 4.0% 9.2%Females Wallonia Flanders Brussels Min EU Mean EU Max EU
Low skilled 39.2% 15.8% 36.3% 6.8% 13.1% 27.2%Medium skilled 21.2% 8.1% 20.0% 4.2% 10.5% 26.3%High skilled 6.1% 3.5% 7.5% 2.4% 5.8% 18.9%


BRAIN DRAIN, BRAIN GAIN AND BRAIN EXCHANGE :THE ROLE OF MNES IN A SMALL OPEN ECONOMY*
MICHELE CINCERA
(UNIVERSITE LIBRE DE BRUXELLES, DULBEA-CERT AND CEPR**)
ABSTRACT:Based on European and US patent statistics, this paper is an empirical analysis of R&D activities carriedout by foreign MNEs in Belgium over the last two decades. The paper investigates the role of demand-pulland technology-push determinants of the MNE’s decision to delocalise its R&D in a host country as wellas the impact of these activities on any brain drain of Belgian R&D personnel. The results suggest thatMNEs invest in R&D in Belgium mainly in order to gain access to the local science base. The presence ofthese companies positively affects the demand for highly skilled workers and hence reduces the impor-tance of brain drain.
JEL CLASSIFICATION: F23, O31, O32, O34.
KEYWORDS: Brain drain, R&D, US and EPO patents, MNEs, Belgian economy.
BRUSSELS ECONOMIC REVIEW - CAHIERS ECONOMIQUES DE BRUXELLESVOL. 47 - N°1 SPRINGER 2004
* The author is grateful to the guest editors of this special issue as well as to Lydia Greunz for comments and help-ful discussions on earlier drafts. Helpful suggestions were also received from seminar participants at INNO-tec,University of Munich and the AEA Conference on “Innovation and Intellectual Property: Economic andManagerial Perspectives”, Singapore July 15-16, 2004. This Paper is produced as part of a CEPR research net-work on ‘Product Markets, Financial Markets and the Pace of Innovation in Europe’, funded by the EuropeanCommission under the Research Training Network Programme (Contract No: HPRN-CT-2000-00061). Theusual disclaim applies.
** DULBEA CP140, 50 av. F.D. Roosevelt, B-1050 Brussels. Email: [email protected]
159

INTRODUCTION
Over the recent years, European policy makers have been more and more concernedabout emigration flows for qualified scientists beyond Europe's borders. This so-called scientific ‘brain drain’ is on the rise and could represent a threat to Europe'sknowledge-based economy. A recent report of the European Commission (2003) givesevidence that the brain drain of people born in the EU is increasing. For instance,about 75% of EU-born US doctorate recipients who graduated between 1991 and2000 had no specific plans to return to the EU, and more and more are choosing tostay in the US. The most important reasons keeping EU-born scientists and engineersabroad relate to the quality of work. Better prospects and projects, and easier accessto leading technologies were most often cited as reasons behind plans to work abroad.Another factor for explaining emigration flows of highly skilled workers is that pro-duction factors used in the production process, which include besides traditionalinputs, human and knowledge capital, are increasingly mobile across national bor-ders. These factors play an important role in economic growth and international com-petition for these inputs has increased their cross-border mobility. It is thereforeimportant to have a better understanding of the main determinants that affect thedirection and the magnitude of these flows of inputs as well as their economic impactfor both the origin and destination countries. In the economic literature on multina-tional enterprises (MNEs), forces such as scale economies, trade and transactioncosts, as well as factor abundance are often mentioned to explain the location andinvestment decisions of workers, firms and in particular MNEs.
The purpose of this paper is to shed some light on one aspect of this internationalmobility of factors by examining the interactions between the emigration of highlyskilled workers and the presence of subsidiaries of foreign MNEs in a small openeconomy like Belgium. Most empirical evidence indicates that inward Foreign DirectInvestment (FDI) in R&D has a positive impact on the demand of highly skilled work-ers in the host country. As a result, high levels of inward FDI can be expected todiminish the importance of brain drain, i.e. the net emigration rate of highly educat-ed people. In that case, we can talk about a reduced brain drain. Furthermore, MNEs’investment decisions bring to the host economy new qualified personnel from theheadquarters. In that case we can talk about a ‘brain gain’. Finally, ‘brain exchange’between MNEs affiliates and local firms can arise through a variety of direct and indi-rect channels such as for instance knowledge spillovers, patent licensing, formal R&Dcollaborative agreements or informal contacts between scientists and engineers andtraining of the R&D personnel hired in the host country. A second objective of thepaper is to assess the main determinants, i.e. market driven and technology-push fac-tors, that affect the delocalisation of MNEs’ R&D activities in a host economy. On theone hand, the core activity of MNEs’ foreign subsidiaries may consist in adaptingproducts and processes developed in the first place at the headquarters to the need oflocal markets. On the other hand, a well trained and educated workforce may not onlyretain domestic firms but also attract foreign MNEs, which in turn invest in physicalcapital, R&D and training activities. These questions are investigated by means of
BRAIN DRAIN, BRAIN GAIN AND BRAIN EXCHANGE : THE ROLE OF MNES IN A SMALL OPEN ECONOMY
160
descriptive statistics and indicators based on patent statistics from the two main patentoffices in the world, the European Patent Office (EPO) and its US homologue(USPTO).
The plan of the paper is as follows. Section 1 reviews the main impacts of MNEs’ R&Dactivities in host countries as well as the main determinants that affect their investmentand location decisions. Section 2 presents the data set and derives the main hypothesisof the paper. The main empirical findings are reported in Section 3. Some concludingremarks and policy implications are discussed in the last section.
1. R&D ACTIVITIES OF MNES
FDI in the area of R&D is an increasing phenomenon that has already been subjected tovarious research. As far as Belgium is concerned, MNEs largely dominate the Belgianinnovation system and a first question that is worth examining is what are the impacts ofthis high internationalisation of Science and Technology activities for the local economy.
1.1. IMPACTS OF MNES R&D ACTIVITIES
In a survey, Blomström and Kokko (1998) examine the effects of knowledge spilloversgenerated by the R&D activities of MNEs’ subsidiaries. From the host country’s per-spective, these externalities not only influence the R&D of domestic firms operating inthe same MNE’s industry but also the R&D of firms located in other industry sectors.According to the studies surveyed, these effects have in general a positive impact ondomestic R&D. However, they systematically vary across countries and industries andincrease with the local capability and the level of competition1. On the other hand theeffects of MNEs’ R&D activities on the home country are more difficult to identify. Asfar as the Belgian economy is concerned, there have been only a few studies examiningthe impact of international spillovers in the local economy. Veugelers and Vanden Houte(1990), in an analysis based on Belgian R&D firms, find that the higher the presence ofmultinationals in an industry, the weaker is the innovative efforts of domestic firms inthe same industry. Cincera (2003) reports a similar result though the variable of interestif not the level of R&D effort but the output of this activity as measured by the numberof patent applications. Fecher (1990) estimates a positive impact of domestic R&Dspillovers on Belgian firms’ productivity performance, while no effect of internationalspillovers is found. More recently, Veugelers and Cassiman (1999), find that MNEs aremore likely to transfer technology to the Belgian economy. However the main conclu-sion of the study is that it is not so much the international character of the firm, butrather its access to the international technology market that is important for generatingexternal knowledge transfers to the local economy.
MICHELE CINCERA
1 As emphasised by Jaffe (1986: p. 984), “From a purely technological point of view, R&D spillovers constitute anunambiguous positive externality. Unfortunately, we can only observe various economic manifestations of thefirm’s R&D success. For this reason, the positive technologically externality is potentially confounded with a neg-ative effect of other’s research due to competition”.
161

MNEs activities can also affect the labour market in host countries, in particular thedemand for and the supply of highly skilled workers (Slaughter, 2002). According to theauthor, on the demand side, inward FDI stimulates the demand for more skilled work-ers in host countries through several channels. Demand for highly skilled workers mayincrease when (direct) technology transfer from the MNE to subsidiaries take place. Buteven more indirect mechanisms such as knowledge spillovers, market driven technolo-gy flows or investment in capital related to technology innovations may increase thedemand for highly skilled workers. On the supply side, MNEs can facilitate investmentsin human capital via short-term firm level activities such as training or via long-termcountry level activities that collectively contribute to the overall macro environment inwhich fiscal policy can support education policy.
1.2. DETERMINANTS OF MNES R&D ACTIVITIES
As regards the degree of internationalisation of R&D, technology production has usu-ally been centralised in the host country of MNEs. The reduction of the costs related tocommunications and control, economies of scale in R&D and a better coordinationbetween central and peripheral research labs are often mentioned in the literature toexplain this situation (Terpstra, 1985)2. However, during the past decade, the involve-ment of MNEs in overseas R&D has increased significantly. Companies all over theworld are investing more and more in overseas R&D as a tool to increase their compet-itive advantages and to exploit their resources in order to create higher quality products3.MNEs have accelerated the pace of their direct investments in overseas R&D, and haveestablished or acquired multiple R&D laboratories abroad and are increasingly inte-grating these laboratories into global R&D networks4.
According to Granstrand et al. (1992), the reasons for the ongoing process of increaseddecentralisation and internationalisation of R&D activities can be explained by threemain categories of factors: demand-side, supply-side and environmental or institutionalrelated factors. The demand-side factors include a greater adaptation of products andtechnologies to the needs of local markets, a higher proximity to customers, an increaseof competitiveness through the transfer of technology and the pressures of subsidiariesto enhance their status within a corporation. Among the main supply-side factors, themonitoring of technology developed abroad and the hiring of a foreign and barelymobile highly skilled labour can be mentioned. Finally, the environmental factorsinclude the legislation on intellectual property, the provision of R&D incentives by the
BRAIN DRAIN, BRAIN GAIN AND BRAIN EXCHANGE : THE ROLE OF MNES IN A SMALL OPEN ECONOMY
2 As pointed out by Cantwell and Santagelo (1999), non-codified technological activities that necessitate highlytacit capabilities will in general require a higher proximity.
3 Angel and Savage (1996) and Belderbos (2001) among others, analyse the determinants of the localisation ofJapanese R&D labs abroad; Cantwell and Harding (1998) measure the R&D internationalisation of German firms;Dunning and Narula (1995) and Florida (1997) examine the R&D activities of foreign firms in the US and Pearceand Papanastasiou (1999) in the UK.
4 Research joint ventures, firm’s acquisitions and the establishment of greenfield units are the three main ways toaccess a foreign market.
162

domestic government, such as tax advantages and R&D subsidies, and governmentalpressures to improve the subsidiary’s capabilities beyond the simple assembly of provenproducts to innovative activities.
Belderbos (2001) identifies two different motives for overseas R&D activities. The firstmotive, which consists in the exploitation of the firm’s technology abroad, means thatcompanies adapt their products and processes to suit the local market and manufactur-ing processes and to fulfil local standards or manufacturing conditions. The secondmotive is the sourcing of foreign technology, which explains the founding of basic R&Dfor the world market. In this case, firms attempt to gain access to specific expertise inthe local science base and hire foreign skilled engineers and researchers5. New estab-lished subsidiaries generally focus on the design and the development of products tomeet local markets needs in exploiting the mother company’s existing technologies,while R&D activities of acquired subsidiaries are more concerned with applied researchand scanning of local technologies.
2. DATA AND HYPOTHESES
Among the main indicators of Science and Technology activities available to econo-mists, patent statistics have probably been the most extensively used6. However, likeother technological indicators, patent statistics have their own weaknesses. The sameweight given to patents by simply counting them is an important drawback of this indi-cator. In fact, the pure technical content as well as the intrinsic economic value of apatent may vary widely among patents. Moreover, not all inventions are patented, norall are patentable, and other existing methods in appropriating the outcomes of R&Dactivities may be preferred7. The propensity to patent may change substantially overtime, across countries and among technological sectors. For example, it is generallyrecognised that the propensity to patent is important in sectors such as machinery orchemicals but very weak in aerospace and in software since in the latter industries,inventions can be more easily imitated
2.1. DATA
The European Patent Office (EPO) and its US homologue (USPTO) are the mainsources of information in this study. All patents with at least one Belgian inventor havebeen extracted from the ESPACE-BULLETIN database for European patents and from
MICHELE CINCERA
5 The notions of Home Base Augmenting (HBA) and Home Base Exploiting (HBE) are often used to characterisethese motives. For Kuemmerle (1999), HBA sites are more likely to be located near universities or public researchand technology organisations. HBA units have increasingly been used as part of the MNE’s strategy to build upand exploit S&T know-how located beyond the boundaries of the group while the activities of HBE sites are moreaimed at transferring the knowledge developed within the group.
6 For the relevance of patent statistics as an indicator of Science and Technology activities, see for instance Boundet al. (1984), Basberg (1987), Glisman and Horn (1988), Griliches (1990) or Archibuggi and Pianta (1992).
7 Industrial secrecy or lead time are two well-known examples.
163

the dataset published by Hall et al. (2001) on the NBER website for US patents8. Table1 lists the main variables available for each patent document which are subsequentlyused in the descriptive analysis.
TABLE 1. LIST OF VARIABLES FOR PATENT DATA
Notes: IPC = International Patents Classification; USPC = US Patent Classification.
A main difference between these two databases is that European patents refer to patentapplications while for the US, the patents are the ones that are granted9. Another differ-ence is that information on patent citations is only used for US patents. The year inwhich the patent has been applied rather than granted is considered for both datasources. According to Jaffe (1986) and Tong and Frame (1994), patents classified bydate of application are preferable because they reflect the moment when a firm realisesan innovation and because of the existence of long lags between the filing of a patentapplication and a patent grant10.
Three categories of patent applicants can be distinguished according to the criterionof whether the patent owner is a Belgian firm, a Belgian subsidiary of a foreignMNE or a foreign company11. The latter category represents patents involving at leastone inventor residing in Belgium but which were applied by non Belgian firms. Thiscan happen when the output of the R&D performed by the subsidiary is directlypatented by the multinational in its home country. Several factors can explain this
BRAIN DRAIN, BRAIN GAIN AND BRAIN EXCHANGE : THE ROLE OF MNES IN A SMALL OPEN ECONOMY
8 www.nber.org/patents. See also http://www.bl.uk/services/information/patents/spec.html#des for more informa-tion on the contents of a patent specification.
9 The share of patents granted as a percentage of filed applications was 67% for European patents and 68% for USones over the period 1995-1999 (Quillen and Webster, 2001).
10 On average, according to the EPO, it takes just over three years between the filing of the patent application andthe patent grant.
11 Information gathered by the Belgian central balance sheet office contains the composition of the shareholders.When more than 50% of shareholders are from abroad, the firm is considered as a subsidiary of a foreign group.
164
Variables
Application yearName of the applicantCountry of residence of the applicantApplicant is part of a foreign groupName of the inventor(s)Country of residence of the inventor(s)Technological sectorNumber of claimsNumber of citations receivedShare of self-citations madewith respect to total number of citations
EPO
xxx
xxIPC
USPTO
xxxxxxUSPCxxx

strategy. First, the IP department of a large firm with important patenting activitiesis generally located at the headquarters of the MNE and not in its foreign sub-sidiaries. Second, contrary to other countries like the US or the UK (Bertin andWyatt, 1988), the Belgian patent law does not request a first filing in Belgium if aninvention has been generated on the domestic territory. Third, the geographic dis-tance between the MNE’s home base and the host country can be another reasonexplaining a lower patenting propensity. Maskus (1998) for instance, finds that thenumber of patents filed by US subsidiaries in host countries positively depends onthe strength of intellectual property rights’ protection of the latter as well as on thegeographic distance to the US.
2.2. HYPOTHESES
The objectives of the paper are twofold. First, it aims at investigating the main determi-nants of the delocalisation of MNEs’ R&D investments. Second, it seeks to assess theimpact of MNEs’ foreign subsidiaries R&D activities on the local labour market forhighly skilled workers. To that end six hypotheses are formulated.
H1: Home-Base Augmenting (HBA) R&D activities are more important in technologi-cal sectors in which Belgium holds scientific comparative advantages;
H2: Patents resulting from HBA activities have a higher technological and economicvalue;
H3: Patents resulting from Home-Base Exploiting (HBE) R&D activities have a lowertechnological and economic value;
H4: Brain drain is negatively correlated with the importance of MNEs’ R&D activitiesin the local innovation system;
H5: MNEs’ R&D delocalisation increases the demand for local researchers (brain gain);
H6: MNEs’ R&D delocalisation stimulates the exchange of ideas and knowledgebetween local and foreign researchers and inventors (brain exchange).
Hypotheses 1-3 are concerned with the first objective, hypotheses 4-6 with the second.As regards Hypothesis 1, if the main reasons for MNEs to delocalise are the access tothe local science base, and to benefit from the availability of a highly educated labourforce in order to augment its own knowledge base, then we can expect a positive corre-lation between the scientific fields where the host economy holds scientific relativecomparative advantages and R&D (and as result patents) activities carried out by theMNEs subsidiaries in the host country. In order to test this hypothesis, the ScientificRevealed Comparative Advantage (SRCA) index has been constructed on the basis ofthe number of scientific publications contained in the ISI-web of science database. Asecond indicator based on citations has been considered as well. The number of citationsper scientific publication can be used as a proxy for its quality and importance.
MICHELE CINCERA
165

Therefore, if scientific publications in a given scientific field are more cited on averagein a country or a region as compared to a reference group, the relative strength of theregion’s scientific base can be expected to be high.
As previously discussed, MNEs will invest in HBA R&D activities in order to increasethe group’s knowledge base as a result of potential spillovers arising from local produc-tive R&D organisations such as universities, publicly funded research institutes and inno-vative competitors, or to make effective use of the general strong local technological andresearch infrastructures. On the other hand, MNEs will engage in HBE R&D activitiesabroad to further exploit their own research capabilities in a foreign environment. Theseactivities typically concern the development and adaptation of existing technologies tothe local market conditions such as consumer tastes, environmental legislation or stan-dards. Given the different nature of these two types of research activities, the technolog-ical and economic value of HBA R&D output as measured by patenting can be expect-ed to be higher as compared to HBE ones (Hypotheses 2 and 3). Therefore the value ofpatents related to HBA R&D should be higher when compared to the one generated byHBE R&D. Several indicators have been suggested in the literature to assess the value ofa patent12. For instance, the claims provide a definition of what the patent protects. Thescope of protection will be higher, the higher the number of claims and several studieshave found a significant correlation between the number of claims and the patent value(Lanjouw and Schankerman, 1999). As for scientific publications, the number of cita-tions by subsequent patents is another well known indicator for assessing the value ofpatent (Hall et al., 2000)13. Citations that come from patents assigned to a same firm orMNE refer to previous patented inventions of that firm. These so-called self-citations aretherefore more likely to be linked with home-based exploiting R&D activities aimed atimproving and adapting existing protected inventions.
As far as the impact of MNEs’ R&D activities on the labour market in the host countryis concerned, three effects are investigated. The first effect refers to the idea that thehigher the presence of foreign R&D MNEs in a host country the less important is thebrain drain or the emigration of highly skilled workers from that country. In order to testthis assumption (Hypothesis 4), the degree of internationalisation of R&D activities, asmeasured by the share of patents with at least one Belgian inventor and applied byBelgian subsidiaries of foreign MNEs and foreign firms in the host country’s total countof patents is compared to the rate of emigration of highly educated persons. Hypothesis5 examines whether FDI in R&D are associated with a ‘brain gain’, i.e. an increase ofthe demand for local researchers by the foreign MNEs. This hypothesis can be tested bycomparing the number of new inventors in patent documents applied by foreign sub-sidiaries and domestic firms. Finally, Hypothesis 6 tests whether the MNE’s R&D delo-
BRAIN DRAIN, BRAIN GAIN AND BRAIN EXCHANGE : THE ROLE OF MNES IN A SMALL OPEN ECONOMY
12 See Harhoff et al. (2003) for a recent review of studies on various indicators used to estimate the economic valueof patents.
13 The authors find a positive correlation between the firm market value and the stock of citation-weighted patents.
166

calisation stimulates the exchange of ideas and knowledge between local and foreignresearchers and inventors. This ‘brain exchange’ can be assessed by identifying theinventors’ residence country documented in co-invented patents.
3. EMPIRICAL FINDINGS
3.1. THE HIGH CONCENTRATION OF THE BELGIAN TECHNOLOGICAL BASE
A major feature of the Belgian technological landscape is the high concentration ofinnovation activities among a few large firms. Figure 1 sheds some light on the patent-ing activities of the top 50 Belgian firms over the last two decades. As can be observed,this activity is quite concentrated. Indeed, in terms of European patents, the two firmswith the highest number of patent applications hold 15.6% and 6.4% respectively of thetotal number of patents applied for by Belgian applicants between 1980 and 2000. Interms of US patents, these shares are even higher (24.4% and 10.3% respectively). Thecumulated share of US patents of the top 50 Belgian firms is about 78% against 61%for European patents suggesting that mainly the largest firms have patenting activitiesoutside the European market.
FIGURE 1. CUMULATED DISTRIBUTION OF THE NUMBER OF PATENT APPLICATIONS
OF THE TOP 50 BELGIAN FIRMS (EPO AND USPTO, 1980-2000)
Sources: EPO and USPTO databases; own calculations.
MICHELE CINCERA
167
0
10
20
30
40
50
60
70
80
90
1 2 3 4 5 6-10 11-15 16-20 21-25 26-30 31-35 36-40 41-45 46-50
number of fims
cum
ulat
ed s
hare
(%
)
EPOUSPTO

TABLE 2. THE TOP 20 BELGIAN FIRMS IN TERMS OF EUROPEAN AND US PATENT
APPLICATIONS, 1980-2000
Note: C% = cumulative share; the companies in italics are in only one of the top 20 rankings.Sources: EPO and USPTO databases; own calculations.
Table 2 gives the list of the 20 largest companies in terms of patents. As can be seen,three companies (Agfa-Gevaert, Solvay and Janssen Pharmaceutica) concentrate25.4% and 42.2% of the patent applications at the EPO and the USPTO respective-ly. Globally, Belgian patent activity is highly dependent on a few companies.Another specificity of Belgian patenting activities is that a significant number ofthese companies are subsidiaries of foreign MNEs. This is particularly the case forAgfa-Gevaert, Janssen Pharmaceutica, and Alcatel-Bell, which account for morethan 20% of all Belgian applications at the EPO.
3.2. THE HIGH INTERNATIONALISATION OF THE BELGIAN TECHNOLOGICAL BASE
The share of foreign companies and subsidiaries of foreign MNEs in national inno-vative activities as measured by patents with at least one Belgian inventor representsmore than 80% of the total number of patents at the end of the nineties. This shareis by far the largest among the industrialised countries (Patel and Pavitt, 1991) and,as can been seen in Figure 2, it has steadily increased over the past two decades. Inthe eighties, the share was about 60%, which suggests that since a long time therehave been strong linkages between MNEs and the Belgian science and technologybase. Because of the relative small size of the country and the ensuing need for a
BRAIN DRAIN, BRAIN GAIN AND BRAIN EXCHANGE : THE ROLE OF MNES IN A SMALL OPEN ECONOMY
168
Rank
1234567891011121314151617181920
C%
15.622.025.427.729.831.633.435.237.038.640.041.342.343.344.245.145.946.747.548.2
C%
24.434.742.244.947.650.152.454.656.458.059.760.961.962.963.864.765.666.567.267.9
EPO
Agfa-GevaertSolvayJanssen PharmaceuticaFina ResearchBekaert Alcatel/Bell TelephoneIMECFord New HollandPicanolRaychemSmithkline BiologicalsCentre de Recherches MetallurgiquesInnogeneticsHeraeus Electro-Nite InternationalACECEsselteUCBSofitechXeikonMichel Van de Wiele
USPTO
Agfa-GevaertSolvayJanssen PharmaceuticaBekaert Fina ResearchPicanol GlaverbelRaychemStaarCentre de Recherches MetallurgiquesUCBIMECPlant Genetic SystemsMichel Van de WieleDow CorningEsselteMetallurgie Hoboken-Overpelt Fabrique National HerstalTexaco BelgiumInnogenetics
high degree of specialisation, the internationalisation of the Belgian technologybase is indisputable. Another feature that emerges from Figure 2 is the higher impor-tance of foreign companies as compared to Belgian subsidiaries of foreign MNEs interms of patent applications. The share of the former represents about 70% of thetotal number of patents applied by these two categories of applicants. This indicatesthat patents are mostly applied in the headquarters of the local subsidiaries’ mothercompanies.
Figure 3 shows the geographic origin of foreign companies and subsidiaries of for-eign MNEs that applied for patents involving at least one Belgian inventor over theperiod 1983-1999. As a whole, for both European and American patents, two coun-tries namely Germany and the US, largely dominate the picture. Belgium’s maintrade partners and neighbours, France, The Netherlands and the United Kingdom,also appear to be important. All in all, these five countries represent 87.0% forEuropean patents and 92.8% for US patents of the total number of patents withBelgian inventors applied for by foreign applicants (Belgian subsidiaries of foreignMNEs and foreign firms).
On the basis of the technological class of each patent, it is possible to examine themain technological fields in which foreign applicants are most present, as well astheir relative importance as compared to the Belgian applicants14. The main techno-logical fields in which foreign applicants are the most active are reported in Tables3, 4 and 515. In terms of European patents (Table 3), chemistry (42.8%) is by far themost important technological class in terms of patents applied for by foreign com-panies. Electrical materials and equipment and technologies related to material pro-cessing in textiles and paper (6.4% each) are the other major technological fields. Interms of US patents, subsidiaries of foreign companies (Table 4) and foreign com-panies (Table 5) appear to be again specialised in the chemical and pharmaceuticalsectors (54.2%).
MICHELE CINCERA
14 Unfortunately, technological classes according to which European and US patents are classified are not directlycomparable. European patents are classified according to the International Patent Classification. US patents areclassified according to IPC and according to the US patent classification (USPC). Only the latter is available inthe database of Hall et al.
15 Full results are reported in Table A1 and A2 in the appendix.
169
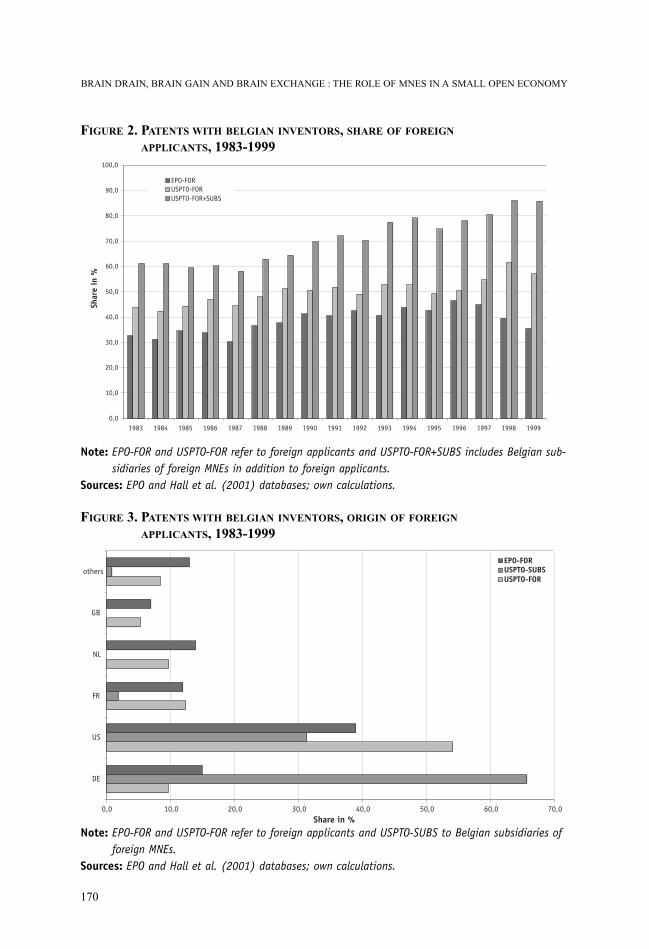
FIGURE 2. PATENTS WITH BELGIAN INVENTORS, SHARE OF FOREIGN
APPLICANTS, 1983-1999
Note: EPO-FOR and USPTO-FOR refer to foreign applicants and USPTO-FOR+SUBS includes Belgian sub-sidiaries of foreign MNEs in addition to foreign applicants.
Sources: EPO and Hall et al. (2001) databases; own calculations.
FIGURE 3. PATENTS WITH BELGIAN INVENTORS, ORIGIN OF FOREIGN
APPLICANTS, 1983-1999
Note: EPO-FOR and USPTO-FOR refer to foreign applicants and USPTO-SUBS to Belgian subsidiaries offoreign MNEs.
Sources: EPO and Hall et al. (2001) databases; own calculations.
BRAIN DRAIN, BRAIN GAIN AND BRAIN EXCHANGE : THE ROLE OF MNES IN A SMALL OPEN ECONOMY
0,0
10,0
20,0
30,0
40,0
50,0
60,0
70,0
80,0
90,0
100,0
1983 1984 1985 1986 1987 1988 1989 1990 1991 1992 1993 1994 1995 1996 1997 1998 1999
Shar
e in
%
EPO-FORUSPTO-FORUSPTO-FOR+SUBS
0,0 10,0 20,0 30,0 40,0 50,0 60,0 70,0
DE
US
FR
NL
GB
others
Share in %
EPO-FORUSPTO-SUBSUSPTO-FOR
170

TABLE 3. PATENTS WITH BELGIAN INVENTORS BY TECHNOLOGY CLASS,EPO APPLICATIONS BY FOREIGN COMPANIES, 1983-1999
Notes: % tot col = % of patents by technological class with respect to total number of patents;% tot row = % of patents applied by foreign firms in a given technological class with respectto total number of patents applied in that class.
Sources: EPO database; own calculations.
TABLE 4. PATENTS WITH BELGIAN INVENTORS BY TECHNOLOGY CLASS, USPTO
APPLICATIONS BY BELGIAN SUBSIDIARIES OF FOREIGN MNES, 1983-1999
Notes: % tot col = % of patents by technological class with respect to total number of patents;% tot row = % of patents applied by MNEs’ subsidiaries in a given technological classwith respect to total number of patents applied in that class.
Sources: Hall et al. (2001) database; own calculations.
MICHELE CINCERA
171
Technology sector
Chemical and petrol industry, basic materials chemistryMacromolecular chemistry, polymersOrganic fine chemistryElectrical machinery and apparatus, electrical energyMaterials processing, textiles, paperHandling, printingTelecommunicationsBiotechnologyPharmaceuticals, cosmeticsMaterials, metallurgy
Total
% tot col
14.913.36.76.46.45.85.54.33.63.5
100.0
% tot row
74.062.245.055.434.333.556.943.544.736.8
40.0
Technology sector
19 Miscellaneous-chemical31 Drugs69 Miscellaneous-Others14 Organic Compounds54 Optics44 Nuclear & X-rays51 Materials Processing. & Handling15 Resins21 Communications23 Computer Peripherals
Total
% tot col
40.014.28.66.24.93.73.13.02.32.2
100.0
% tot row
36.042.624.224.560.349.711.67.015.579.2
21.2

TABLE 5. PATENTS WITH BELGIAN INVENTORS BY TECHNOLOGY CLASS, USPTO
APPLICATIONS BY FOREIGN COMPANIES, 1983-1999
Notes: % tot col = % of patents by technological class with respect to total number of patents;% tot row = % of patents applied by foreign firms in a given technological classwith respect to total number of patents applied in that class.
Sources: Hall et al. (2001) database; own calculations.
3.3. MARKET DRIVEN VS. TECHNOLOGY-PUSH FACTORS
The high dependence of the Belgian innovation system with respect to foreign MNEscould be an important reason for its lower propensity to patent16. Subsidiaries can bespecialised in the adaptation to the Belgian market of products and services developedand patented in the first place in the research labs of the multinational. These sub-sidiaries could also be involved in HBA research activities, the local availability of ahighly qualified workforce and an appealing knowledge base being the main reasons fortheir presence in the foreign country. In the first case, one can expect a lower propensi-ty to patent for a given amount of R&D since the original invention is already protect-ed. Then, in both cases the output of R&D performed by the subsidiary can be directlypatented by the multinational in its home country and not in Belgium. Finally, the geo-graphic distance between the MNE’s home base and the host country can be another rea-son explaining a lower patenting propensity.
BRAIN DRAIN, BRAIN GAIN AND BRAIN EXCHANGE : THE ROLE OF MNES IN A SMALL OPEN ECONOMY
Technology sector
19 Miscellaneous-chemical15 Resins51 Materials Processing & Handling69 Miscellaneous-Others21 Communications31 Drugs14 Organic Compounds41 Electrical Devices33 Biotechnology61 Agriculture, Husbandry, Food
Total
% tot col
21.112.55.55.45.14.94.13.43.33.2
100.0
% tot row
40.862.344.732.472.831.834.475.054.268.0
45.5
16 As shown in Capron and Cincera (2000), the R&D productivity index as measured by the ratio of patents onR&D expenditures was 95 for Belgium in 1995 against 100 for the EU average.
172

Table 6 analyses the SRCA index of Belgium as regards scientific publications acrossscientific fields:
where nij is the number of publications of the jth country in the ith scientific field.
Three reference groups are considered: the world, the OECD and the EU-15. Table 6also reports for each scientific field the difference of the average number of citationsto scientific papers between Belgium and the three reference groups. With respect tothe OECD reference group, Belgium appears to hold strong comparative advantagesin scientific fields closely related to agriculture (agricultural sciences, plant and ani-mal science), bio-chemistry (immunology, microbiology, pharmacology and toxicol-ogy) and clinical medicine. Though, there is no direct correspondence between thepatent technological classification and the one for scientific publications, the scien-tific areas where Belgium appears to be better positioned could explain the relativehigh importance of (both EPO an USPTO) patents applied by foreign subsidiaries andforeign firms in related technological areas such as drugs, organic fine chemistry orbiotechnology. The main reasons for the delocalisation of R&D activities in that casemay be the benefits associated in accessing the local scientific base and know-howavailable in these technological fields. However, this hypothesis does not appear tohold for the patents applied in electrical devices, material processing and handling,communications and computers, as Belgium’s scientific position in material and com-puter sciences, mathematics and engineering appears to be relatively less favourable.However, for the last three scientific fields, the average number of citations per pub-lication is significantly higher in Belgium as compared to the OECD reference group.
An alternative way to examine this question is to look at the relative value of patentsapplied for by foreign subsidiaries and foreign firms as compared to domestic ones.Patents associated with research activities aimed at increasing the knowledge base of theforeign group can be expected to be of higher value as compared to the ones related tothe development and adaptation of existing technologies to the needs of the local econ-omy. As previously discussed, patents characterised by an above than average number ofclaims, a high frequency of citations received and a low frequency of self-citations, canbe expected to be of higher value. Therefore, these patents should more reflect researchactivities aimed at increasing the knowledge base of the mother company. Table 7 sum-marises these three indicators for the US patents with at least one Belgian inventorapplied for by Belgian firms, foreign subsidiaries and foreign firms. With regards to theaverage number of self-citations, we observe that the patents of foreign firms and sub-sidiaries have systematically more self-citations. This can be explained by the fact that the average size of the patent’s portfolio of the foreign companies is much more
MICHELE CINCERA
173
=
∑∑
∑j,i
ij
jij
iij
ijij
n
n
n
nSRCA

important as compared to the domestic firms17. As a result, the probability of being self-cited is much higher. With respect to the domestic firms, this indicator has however amuch higher value for the foreign patents assigned to organic compounds, drugs andbiotechnology. Conversely, the value of this indicator is relatively lower for patents inelectrical devices and material processing and handling. According to the average num-ber of claims and the average number of citations received, foreign firms and sub-sidiaries appear to better perform in four technological sectors, namely chemicals, com-munications, electrical devices and optics. Except for chemicals, the number of self-citations is also relatively lower. Consequently, the patents assigned to these technolog-ical classes should have a higher economic value and as such may reflect the outcomesof R&D activities of the HBA type. On the other hand, patents assigned to organic com-pounds and biotechnology have on average a lower number of claims and are more self-cited. Therefore, these patents can be expected to have a lower value and may be morerelated to R&D activities aimed at adapting or improving existing inventions carried outin the mother company’s research labs. For the other technology classes, it is more dif-ficult to identify the type of R&D carried out by the foreign firms and subsidiaries asno clear-cut patterns emerge from the values taken by the three indicators.
On the whole, the indicators reported in Table 7 give a somewhat different picture thanthe conclusions based on the scientific comparative advantages of Belgium. Patentsrelated to biotechnology, organic compounds and fine chemistry have a relative lowertechnical and economic value but corresponds to scientific fields where Belgium iscomparatively better positioned, i.e. the importance of scientific activities in terms ofpublications is relatively more important as compared to the OECD average. Foreignfirms could therefore be interested in investing in HBE R&D activities to benefit fromthe availability of a highly qualified local workforce. At the other end, patents classifiedin electrical devices, communications and computers appear to have a relative highereconomic value. While Belgium does not hold particular scientific comparative advan-tages in the corresponding scientific fields, their performance in terms of citations iswell above the average score observed at the OECD level. Therefore, the local expert-ise and scientific excellence could be one of the main driving force explaining theMNEs’ decision to invest in R&D in the foreign economy.
BRAIN DRAIN, BRAIN GAIN AND BRAIN EXCHANGE : THE ROLE OF MNES IN A SMALL OPEN ECONOMY
17 The average total number of patents (irrespective of the country of residence of the inventor) applied (at theUSPTO) by Belgian firms is 14.6 against 1459.1 for foreign companies and subsidiaries (with at least one patentinvolving at least one Belgian inventor).
174
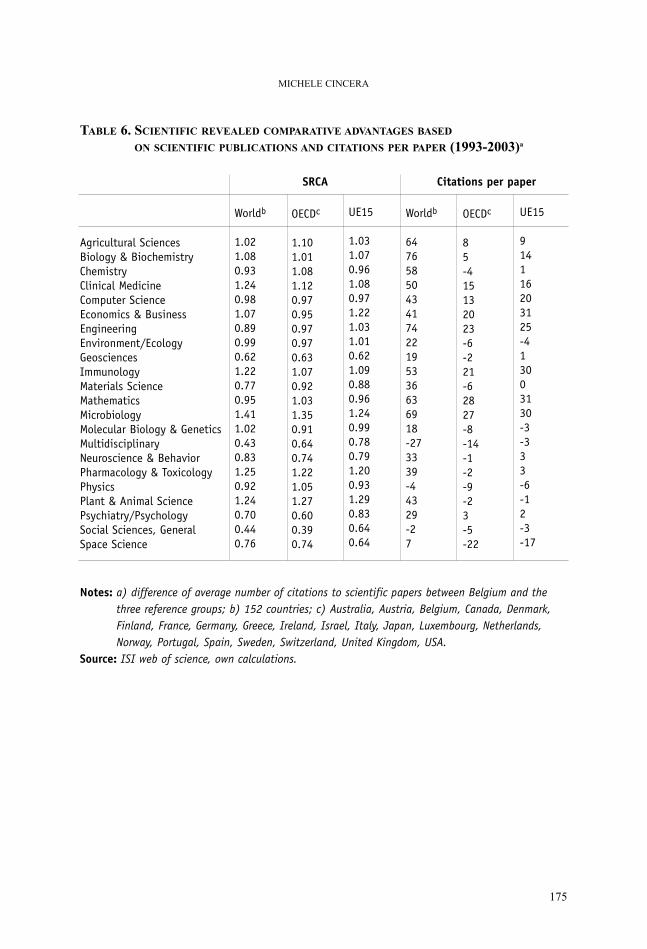
TABLE 6. SCIENTIFIC REVEALED COMPARATIVE ADVANTAGES BASED
ON SCIENTIFIC PUBLICATIONS AND CITATIONS PER PAPER (1993-2003)a
Notes: a) difference of average number of citations to scientific papers between Belgium and thethree reference groups; b) 152 countries; c) Australia, Austria, Belgium, Canada, Denmark,Finland, France, Germany, Greece, Ireland, Israel, Italy, Japan, Luxembourg, Netherlands,Norway, Portugal, Spain, Sweden, Switzerland, United Kingdom, USA.
Source: ISI web of science, own calculations.
MICHELE CINCERA
175
Agricultural Sciences Biology & Biochemistry Chemistry Clinical Medicine Computer Science Economics & Business Engineering Environment/Ecology Geosciences Immunology Materials Science Mathematics Microbiology Molecular Biology & Genetics Multidisciplinary Neuroscience & Behavior Pharmacology & Toxicology Physics Plant & Animal Science Psychiatry/Psychology Social Sciences, General Space Science
Worldb
1.021.080.931.240.981.070.890.990.621.220.770.951.411.020.430.831.250.921.240.700.440.76
OECDc
1.101.011.081.120.970.950.970.970.631.070.921.031.350.910.640.741.221.051.270.600.390.74
UE15
1.031.070.961.080.971.221.031.010.621.090.880.961.240.990.780.791.200.931.290.830.640.64
Worldb
6476585043417422195336636918-273339-44329-27
OECDc
85-415132023-6-221-62827-8-14-1-2-9-23-5-22
UE15
914116203125-413003130-3-333-6-12-3-17
SRCA Citations per paper
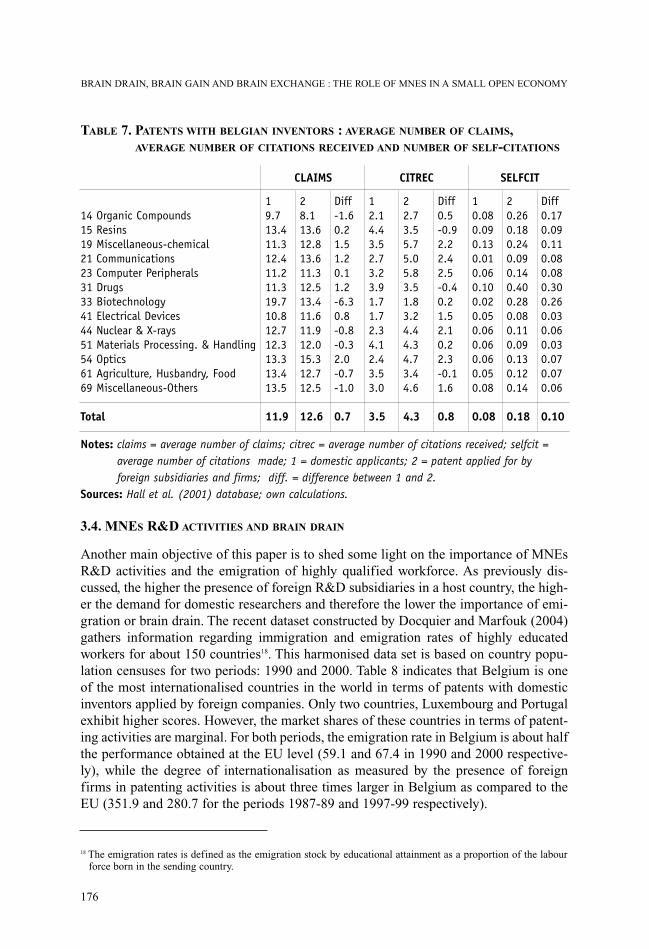
TABLE 7. PATENTS WITH BELGIAN INVENTORS : AVERAGE NUMBER OF CLAIMS,AVERAGE NUMBER OF CITATIONS RECEIVED AND NUMBER OF SELF-CITATIONS
Notes: claims = average number of claims; citrec = average number of citations received; selfcit =average number of citations made; 1 = domestic applicants; 2 = patent applied for by foreign subsidiaries and firms; diff. = difference between 1 and 2.
Sources: Hall et al. (2001) database; own calculations.
3.4. MNES R&D ACTIVITIES AND BRAIN DRAIN
Another main objective of this paper is to shed some light on the importance of MNEsR&D activities and the emigration of highly qualified workforce. As previously dis-cussed, the higher the presence of foreign R&D subsidiaries in a host country, the high-er the demand for domestic researchers and therefore the lower the importance of emi-gration or brain drain. The recent dataset constructed by Docquier and Marfouk (2004)gathers information regarding immigration and emigration rates of highly educatedworkers for about 150 countries18. This harmonised data set is based on country popu-lation censuses for two periods: 1990 and 2000. Table 8 indicates that Belgium is oneof the most internationalised countries in the world in terms of patents with domesticinventors applied by foreign companies. Only two countries, Luxembourg and Portugalexhibit higher scores. However, the market shares of these countries in terms of patent-ing activities are marginal. For both periods, the emigration rate in Belgium is about halfthe performance obtained at the EU level (59.1 and 67.4 in 1990 and 2000 respective-ly), while the degree of internationalisation as measured by the presence of foreignfirms in patenting activities is about three times larger in Belgium as compared to theEU (351.9 and 280.7 for the periods 1987-89 and 1997-99 respectively).
BRAIN DRAIN, BRAIN GAIN AND BRAIN EXCHANGE : THE ROLE OF MNES IN A SMALL OPEN ECONOMY
14 Organic Compounds15 Resins19 Miscellaneous-chemical21 Communications23 Computer Peripherals31 Drugs33 Biotechnology41 Electrical Devices44 Nuclear & X-rays51 Materials Processing. & Handling54 Optics61 Agriculture, Husbandry, Food69 Miscellaneous-Others
Total
19.713.411.312.411.211.319.710.812.712.313.313.413.5
11.9
28.113.612.813.611.312.513.411.611.912.015.312.712.5
12.6
Diff-1.60.21.51.20.11.2-6.30.8-0.8-0.32.0-0.7-1.0
0.7
12.14.43.52.73.23.91.71.72.34.12.43.53.0
3.5
22.73.55.75.05.83.51.83.24.44.34.73.44.6
4.3
Diff0.5-0.92.22.42.5-0.40.21.52.10.22.3-0.11.6
0.8
10.080.090.130.010.060.100.020.050.060.060.060.050.08
0.08
20.260.180.240.090.140.400.280.080.110.090.130.120.14
0.18
Diff0.170.090.110.080.080.300.260.030.060.030.070.070.06
0.10
CLAIMS CITREC SELFCIT
18 The emigration rates is defined as the emigration stock by educational attainment as a proportion of the labourforce born in the sending country.
176
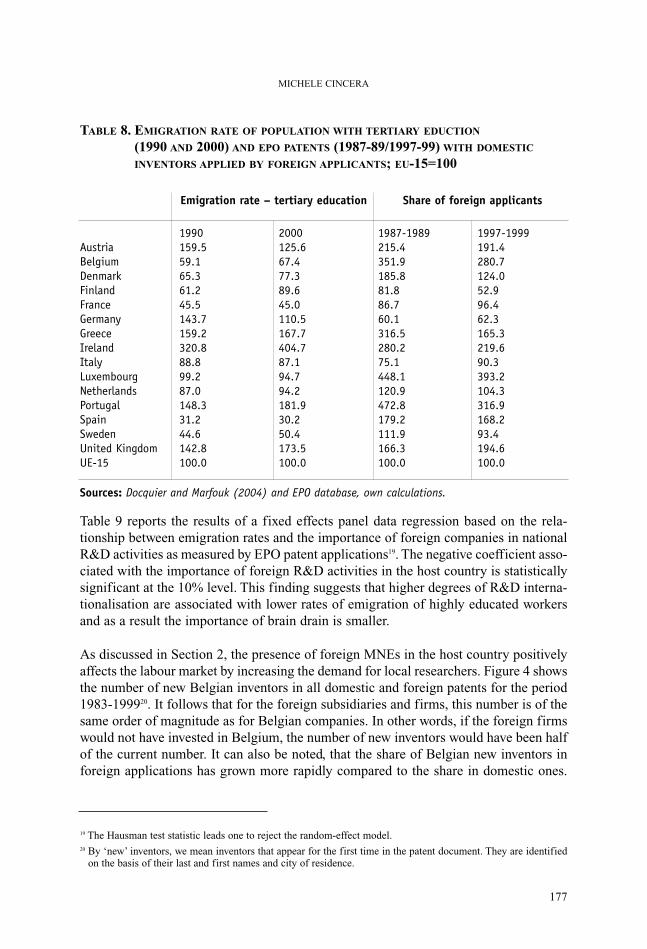
TABLE 8. EMIGRATION RATE OF POPULATION WITH TERTIARY EDUCTION
(1990 AND 2000) AND EPO PATENTS (1987-89/1997-99) WITH DOMESTIC
INVENTORS APPLIED BY FOREIGN APPLICANTS; EU-15=100
Sources: Docquier and Marfouk (2004) and EPO database, own calculations.
Table 9 reports the results of a fixed effects panel data regression based on the rela-tionship between emigration rates and the importance of foreign companies in nationalR&D activities as measured by EPO patent applications19. The negative coefficient asso-ciated with the importance of foreign R&D activities in the host country is statisticallysignificant at the 10% level. This finding suggests that higher degrees of R&D interna-tionalisation are associated with lower rates of emigration of highly educated workersand as a result the importance of brain drain is smaller.
As discussed in Section 2, the presence of foreign MNEs in the host country positivelyaffects the labour market by increasing the demand for local researchers. Figure 4 showsthe number of new Belgian inventors in all domestic and foreign patents for the period1983-199920. It follows that for the foreign subsidiaries and firms, this number is of thesame order of magnitude as for Belgian companies. In other words, if the foreign firmswould not have invested in Belgium, the number of new inventors would have been halfof the current number. It can also be noted, that the share of Belgian new inventors inforeign applications has grown more rapidly compared to the share in domestic ones.
MICHELE CINCERA
AustriaBelgiumDenmarkFinlandFranceGermanyGreeceIrelandItalyLuxembourgNetherlandsPortugalSpainSwedenUnited KingdomUE-15
1990159.559.165.361.245.5143.7159.2320.888.899.287.0148.331.244.6142.8100.0
2000125.667.477.389.645.0110.5167.7404.787.194.794.2181.930.250.4173.5100.0
1987-1989215.4351.9185.881.886.760.1316.5280.275.1448.1120.9472.8179.2111.9166.3100.0
1997-1999191.4280.7124.052.996.462.3165.3219.690.3393.2104.3316.9168.293.4194.6100.0
Emigration rate – tertiary education Share of foreign applicants
19 The Hausman test statistic leads one to reject the random-effect model.20 By ‘new’ inventors, we mean inventors that appear for the first time in the patent document. They are identified
on the basis of their last and first names and city of residence.
177

The term Belgian inventor refers to the country of residence of the inventor and not toits citizenship. It is unfortunately not possible to identify the nationality of these Belgianinventors, but it can be assumed that a non-negligible share of them are researchers ofthe MNEs’ mother company that moved to Belgium when the subsidiary was estab-lished. Therefore, this additional availability of ‘imported’ human-capital produces a‘brain gain’ for the host country.
TABLE 9. RELATIONSHIP BETWEEN EMIGRATION RATE OF PEOPLE WITH TERTIARY
EDUCTION AND INTERNATIONALISATION OF R&D ACTIVITIES (SHARE OF
FOREIGN APPLICANTS IN PATENTS WITH AT LEAST ONE DOMESTIC INVENTOR)
Notes: standard error in brackets; P-value in square brackets; F-test for fixed effects (H0: �1 =…= �15 = 0); Hausman test (H0: �random effects - �fixed effects ~ 0)
FIGURE 4. NUMBER OF ‘DIFFERENT’ INVENTORS IN US PATENTS APPLIED BY BELGIAN
AND FOREIGN FIRMS (1983-1999)
Notes: DOM = domestic applications; FOR = foreign applications.Sources: Hall et al. (2001) database; own calculations.
BRAIN DRAIN, BRAIN GAIN AND BRAIN EXCHANGE : THE ROLE OF MNES IN A SMALL OPEN ECONOMY
178
Constant% of foreign firmsin domestic patents# of obs.F-testHausman testR2
Estimated coefficient
150.21 (20.41)-0.1840 (0.1057)
3033.67 [0.0000]4.89 [0.0271]0.0723
0
50
100
150
200
250
300
1983 1984 1985 1986 1987 1988 1989 1990 1991 1992 1993 1994 1995 1996 1997 1998 1999
DOMFOR

TABLE 10. SHARE OF CO-INVENTORS BY COUNTRY OF RESIDENCE AND BY TYPE
OF APPLICANTS (BELGIAN FIRM, FOREIGN SUBSIDIARY AND FOREIGN FIRM),USPTO, 1983-1999
Sources: Hall et al. (2001) database; own calculations.
CONCLUSION
Based on European and US patent statistics, this paper attempts to identify the main deter-minants explaining the decision of MNEs to delocalise their R&D in a small open econ-omy. The impact of these activities on the local labour market for highly skilled workersis examined as well. Regarding the first question, the scientific fields where Belgiumholds comparative advantages with respect to the OECD, i.e. agriculture, bio-chemistryand clinical medicine, appear to be positively correlated with the technological classes inwhich the number of patents applied for by foreign subsidiaries and firms are relativelythe most important. It could therefore be concluded that the main motive for R&D MNEsto invest in Belgium is to gain access to specific knowledge resources which are abundantin the local economy. The indicators based on the patent scope, the number of receivedcitations and the number of self-citations reveal a relatively low value of the patentsapplied by the foreign subsidiaries and assigned to these technological classes, which sug-gests that the main objective of the MNEs’ R&D units operating in these sectors may bethe transfer and adaptation of existing knowledge to the host country. At the other end, thesourcing of foreign technologies and competencies within the local S&T base appear tobe the main driving force of foreign firms and subsidiaries’ R&D activities (as measuredby patents) in electrical devices, communications and computers sectors. In terms of com-parative advantages, Belgium is not particularly well positioned in the scientific fieldscorresponding to these technological sectors. Yet, the importance and quality of the out-put of these scientific fields as measured by citations is relatively higher as compared tothe OECD reference group. Furthermore, the patents assigned to these technologicalclasses and applied by the foreign firms and MNEs’ subsidiaries appear to have a relativehigher economic value. As regards the effects of MNEs on the demand for local R&D per-sonnel, the results suggest a reduced brain drain (negative correlation between the rate ofemigration of highly educated people and the level of internationalisation of R&D activi-ties), a positive ‘brain gain’ (higher number of new inventors in patents applied by foreignsubsidiaries and MNEs as compared to domestic firms) and an important ‘brainexchange’ (higher number of foreign inventors in co-invented patents applied by foreignsubsidiaries and firms) in the host country.
MICHELE CINCERA
179
BelgiumUSAGermanyFranceThe NetherlandsUnited Kingdom
Belgian firms
94.00.81.91.20.70.2
Belgian subsidiariesof foreign firms
91.51.90.62.10.31.0
Foreign firms
62.113.78.33.84.22.6
The results of this study lead to several important policy implications although one hasto be cautious in drawing any firm conclusions at this stage of the research.
Firstly, MNE’s R&D activities abroad indisputably generate positive spillovers in thehost country through a positive demand of highly qualified people in the host country.As a result, a strengthening of policies designed to attract FDI in research and innova-tion activities is highly desirable. Among these policies, we can mention financialincentives such as R&D tax concession and subsidies, the improvement of the localinfrastructure and quality of the workforce or measures directed at decreasing theimportance of administrative burdens and easing the starting of new businesses.
Secondly, S&T collaborations are another important source of spillovers brought by for-eign R&D subsidiaries in the local economy. Such formal and informal agreementsbetween scientists from different companies and research organisations represent an effi-cient mean by which partners can exchange ideas, acquire new technological capabilitiesand improve their innovative performances. Technology policies aimed at promoting col-laborative agreements should therefore be encouraged and further strengthened.
Thirdly, the development by multinationals of external networks of relationships with localcounterparts can also be a source of knowledge spillovers from the subsidiary to the parentcompany, foreign affiliates gaining access to external knowledge sources and applicationabilities in the host country. This ‘repatriation’ of local research results and the exploitationof their commercial outcomes in the MNE’s home country may represent a serious loss ofincome from the point of view of the host country. It is therefore important to correctlyassess the trade-off between the gains of FDI-induced knowledge spillovers and the bene-fits of research activities that spill out outside the domestic borders. With that respect, poli-cies aimed at better internalising the fruits of foreign affiliates R&D and at anchoring theireconomic exploitation in the domestic economy deserve a particular attention.
Given these preliminary results, further analysis and data collections would be helpfulin order to better identify and support the policy implications implied by the high degreeof internationalisation of R&D investment in Belgium. Among the main questions to beaddressed in future research, we can mention:What forces determine the location decisions of MNEs R&D activities? What are thebenefits of MNEs’ R&D activities in the host/home countries? What are the reasons ofR&D clusters in economic hubs (role of public research organisations and universitiesas key drivers)? What kind of cost-effective policy instruments can be implemented toattract foreign and to retain domestic MNEs R&D activities (R&D direct and indirectsupport, education policies)? What policies are likely to attract and retain highly skilledworkers (language training, citizenship policies)?
As far as the last question is concerned, two recent initiatives at the EU level are worthbeing mentioned (European Commission 2003): the launch of the development of the“European Researcher’s Charter” and the outline of a “Code of conduct for the recruit-ment of researchers”. The first initiative consists of a framework for the career man-agement of human R&D resources, based on voluntary regulation and the second isbased on best practises to improve recruitment methods.
BRAIN DRAIN, BRAIN GAIN AND BRAIN EXCHANGE : THE ROLE OF MNES IN A SMALL OPEN ECONOMY
180
REFERENCES
Angel D.P. and L.A. Savage, 1996. “Global localization? Japanese research and devel-opment laboratories in the USA”, Environment and Planning, 28(5), 819-833.Arrow K., 1962. “Economic welfare and the allocation of resources for invention”, inR. Nelson (ed.), The Rate and Direction of Inventive Activity, Princeton, 609-626.Belderbos R., 2001. “Overseas innovations by Japanese firms: An analysis of patentand subsidiary data”, Research Policy, 30(2), 313-332.Bertin G. and S. Wyatt, 1988. Multinationals and Industrial Property: The Control ofthe World’s Technology, Hemel Hempstead, UK: Harvester Wheatsheaf.Blomström M. and A. Kokko, 1998. “Multinational corporations and spillovers”,Journal of Economic Surveys, 12(2), 247-277.Bound J., C. Cummins, Z. Griliches, B.H. Hall and A.B. Jaffe, 1984. “Who doesR&D and who patents?”, in Z. Griliches (ed.), R&D, Patents and Productivity, Chicago:University of Chicago.Cantwell J. and R. Harding, 1998. “The internationalisation of German companies’R&D”, National Institute Economic Review, 0(163), 99-125.Cantwell J. and G.D. Santangelo, 1999. “The frontier of international technology net-works: Sourcing abroad the most highly tacit capabilities”, Information Economics andPolicy, 11(1), 101-123.Cincera M., 2003. “The determinants of patenting activities: Some Evidence fromBelgian manufacturing firms”, mimeo.Cohen W.M., 1995. “Empirical studies of innovative activities”, in P. Stoneman (ed.),Handbook of the Economics of Innovation and Technological Change, Oxford, UK:Blackwell Publishers Ltd, 182-264.Docquier F. and A. Marfouk, 2004. “Measuring the International Mobility of SkilledWorkers (1990–2000): Release 1.0”, Worldbank Policy Research Working Papers, No.3381.Dunning J.H. and R. Narula, 1995. “The R&D activities of foreign firms in the UnitedStates”, International Studies of Management and Organisation, (25), 39-73.European Commission, 2003. “The brain drain - emigration flows for qualified scientists”.Fecher F., 1990. “Effets directs et indirects de la R&D sur la productivité: une analysede l’industrie manufacturière belge’, Cahiers Economiques de Bruxelles, 128, 459-482.Florida R., 1997. “The globalization of R&D: Results of a survey of foreign-affiliatedR&D laboratories in the USA”, Research Policy, 26(1), 85-103.Geroski P., 1995. “Markets for Technology: Knowledge, Innovation andAppropriability”, in P. Stoneman (ed.), Handbook of the Economics of Innovation andTechnological Change, Blackwell publishers.Granstrand O., 1999. The Economics and Management of Intellectual Property,Towards Intellectual Capitalism, Edward Edgar Publishing Ltd.Granstrand O., L. Hakanson and S. Sjolander, 1992. Technology Management andInternational Business, Wiley, Chichester.Hall B.H., A. Jaffe and M. Trajtenberg, 2000. “Market value and patent citations: Afirst look”, NBER Working Paper 7741.
MICHELE CINCERA
181
Hall B.H., A. Jaffee and M. Trajtenberg, 2001. “The NBER patent citations data file:Lessons, insights and methodological tools”, NBER Working Paper #8498.Harhoff D., M. Scherer and K.Vopel, 2003. “Citations, family size, opposition and thevalue of patent rights”, Research Policy, 32(8), 1343-1363.Jaffe A., 1986. “Technological opportunity and spillovers of R&D”, AmericanEconomic Review, 76, 984-1001.Kuemmerle W., 1999. “Foreign direct investment in industrial research in the pharma-ceutical and electronics industries - Results from a survey of multinational firms”,Research Policy, 28(2-3), 179-93.Lanjouw J. and M. Schankerman, 1999. “The quality of ideas: Measuring innovationwith multiple indicators”, NBER Working Paper 7345.Maskus K., 1998. “The international regulation of intellectual property”,Weltwirtschaftliches Archiv, 123(2), 186-208.Patel P. and K. Pavitt, 1991. “Large firms in the production of the world’s technology:An important case of non-globalization”, Journal of International Business Studies, 22,1-20.Pearce R. and M. Papanastassiou, 1999. “Overseas R&D and the strategic evolutionof MNEs: evidence from laboratories in the UK”, Research Policy, 28(1), 23-41.Quillen C. and O. Webster, 2001. “Continuing patent applications and performance ofthe US patent office”, Federal Circuit Bar Journal, 1, 1-21.Slaughter M., 2002. “Does inward foreign direct investment contribute to skill upgrad-ing in developing countries?”, CEPA Working Paper 2002-08.Terpstra V., 1985. “International product policy: the role of foreign R&D”, in H.V.Wortzel and L.V. Wortzel, (Eds.), Strategic management of multinational corporations:The essentials, New York: Wiley.Veugelers R. and B. Cassiman, 1999. “Importance of international linkages for localknow-how flows: Some econometric evidence from Belgium”, CEPR Discussion Paper #DP2337.Veugelers R. and P. Vanden Houte, 1990. “Domestic R&D in the presence of multi-national enterprises”, International Journal of Industrial Organization, 8, 1-15.
BRAIN DRAIN, BRAIN GAIN AND BRAIN EXCHANGE : THE ROLE OF MNES IN A SMALL OPEN ECONOMY
182

APPENDIX
TABLE A1. EPO PATENTS WITH BELGIAN INVENTORS BY TECHNOLOGY CLASS,1983-1999
Notes: % tot col = % of patents by technological class with respect to total number of patents;% tot row = % of patents applied by foreign firms in a given technological classwith respect to total number of patents applied in that class.
Sources: EPO database; own calculations.
MICHELE CINCERA
183
# pat
2448327177247
234119348305
232606751792124360545271125132558743671977346178186108167
6704
% col
3.61.24.01.13.7
3.51.85.24.5
3.50.91.07.71.41.85.48.14.01.92.00.813.05.52.91.10.72.72.81.62.5
100.0
% row
83.850.368.672.056.5
26.060.176.572.8
44.672.364.466.564.869.337.865.763.266.551.074.393.255.055.376.088.562.543.176.156.0
60.0
# pat
478212430190
66579107114
2882337261505559228515863127196430015923610724634131
4466
% col
1.11.82.80.74.3
14.91.82.42.6
6.40.50.85.81.11.213.36.43.51.42.80.41.46.73.60.50.12.45.50.82.9
100.0
% row
16.249.731.428.043.5
74.039.923.527.2
55.427.735.633.535.230.762.234.336.833.549.025.76.845.044.724.011.537.556.923.944.0
40.0
Total
291165395107437
899198455419
52083104778142179952830429188259749386673569652285432142298
11170
EPO-BE EPO-FOR
Technology sector
Agricultural and food processing, machinery and apparatusAgriculture, food chemistryAnalysis, measurement, technologyAudio-visual technologyBiotechnologyChemical and petrol industry, basic materials chemistryChemical engineeringCivil engineering, building, miningConsumer goods and equipmentElectrical machinery and apparatus, electrical energyEngines, pumpes, turbinesEnvironmental technologyHandling, printingInformation technologyMachine toolsMacromolecular chemistry, polymersMaterials processing, textiles, paperMaterials, mettalurgyMechanical elementsMedical technologyNuclear engineeringOpticsOrganic fine chemistryPharmaceuticals, cosöeticsSemiconductorsSpace technology, weaponsSurface technology, coatingTelecommunicationsThermal processes and apparatusTransport
Total
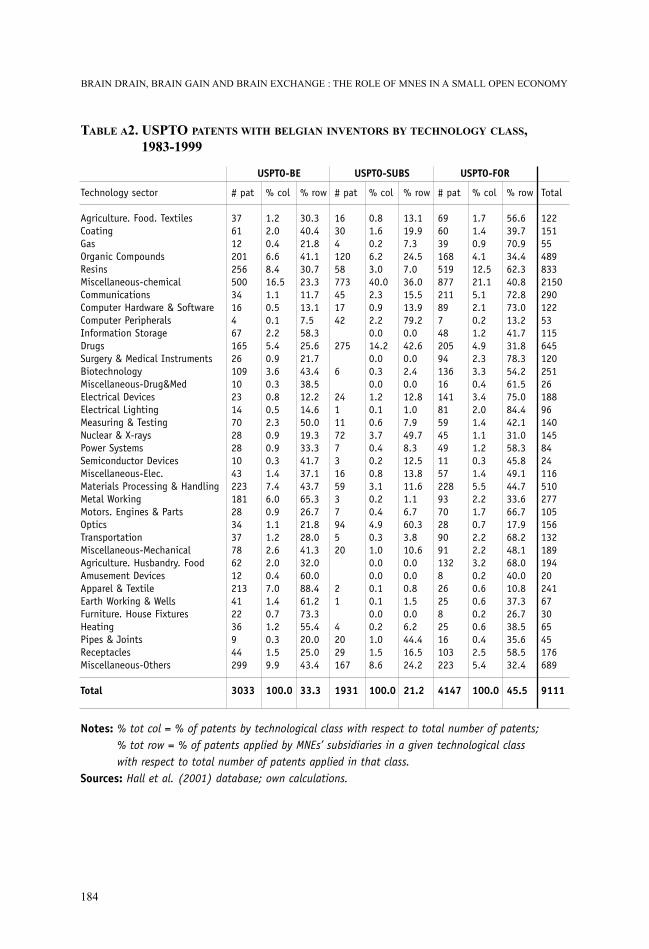
TABLE A2. USPTO PATENTS WITH BELGIAN INVENTORS BY TECHNOLOGY CLASS,1983-1999
Notes: % tot col = % of patents by technological class with respect to total number of patents;% tot row = % of patents applied by MNEs’ subsidiaries in a given technological classwith respect to total number of patents applied in that class.
Sources: Hall et al. (2001) database; own calculations.
BRAIN DRAIN, BRAIN GAIN AND BRAIN EXCHANGE : THE ROLE OF MNES IN A SMALL OPEN ECONOMY
184
Technology sector
Agriculture. Food. TextilesCoatingGasOrganic CompoundsResinsMiscellaneous-chemicalCommunicationsComputer Hardware & SoftwareComputer PeripheralsInformation StorageDrugsSurgery & Medical InstrumentsBiotechnologyMiscellaneous-Drug&MedElectrical DevicesElectrical LightingMeasuring & TestingNuclear & X-raysPower SystemsSemiconductor DevicesMiscellaneous-Elec.Materials Processing & HandlingMetal WorkingMotors. Engines & PartsOpticsTransportationMiscellaneous-MechanicalAgriculture. Husbandry. FoodAmusement DevicesApparel & TextileEarth Working & WellsFurniture. House FixturesHeatingPipes & JointsReceptaclesMiscellaneous-Others
Total
# pat
3761122012565003416467165261091023147028281043223181283437786212213412236944299
3033
% col
1.22.00.46.68.416.51.10.50.12.25.40.93.60.30.80.52.30.90.90.31.47.46.00.91.11.22.62.00.47.01.40.71.20.31.59.9
100.0
% row
30.340.421.841.130.723.311.713.17.558.325.621.743.438.512.214.650.019.333.341.737.143.765.326.721.828.041.332.060.088.461.273.355.420.025.043.4
33.3
# pat
1630412058773451742
275
6
24111727316593794520
21
42029167
1931
% col
0.81.60.26.23.040.02.30.92.20.014.20.00.30.01.20.10.63.70.40.20.83.10.20.44.90.31.00.00.00.10.10.00.21.01.58.6
100.0
% row
13.119.97.324.57.036.015.513.979.20.042.60.02.40.012.81.07.949.78.312.513.811.61.16.760.33.810.60.00.00.81.50.06.244.416.524.2
21.2
# pat
69603916851987721189748205941361614181594549115722893702890911328262582516103223
4147
% col
1.71.40.94.112.521.15.12.10.21.24.92.33.30.43.42.01.41.11.20.31.45.52.21.70.72.22.23.20.20.60.60.20.60.42.55.4
100.0
% row
56.639.770.934.462.340.872.873.013.241.731.878.354.261.575.084.442.131.058.345.849.144.733.666.717.968.248.168.040.010.837.326.738.535.658.532.4
45.5
Total
12215155489833215029012253115645120251261889614014584241165102771051561321891942024167306545176689
9111
USPTO-BE USPTO-SUBS USPTO-FOR


Order Form: 2005, 4 issues
Person
Institution
Belgium Other Countries
35 € * 50 € *
85 € * 100 € *
Name: ................................................................................................First Name: .......................................................................................Institution: ........................................................................................Adress: ..............................................................................................VAT Number**: ..................................................................................Tel: ....................................................................................................Fax: ...................................................................................................E-mail: ...............................................................................................
* all inclusive** if applicable
Payment Method❐ Bank transfer
Fortis Bank - Account nr. 001-1221515IBAN BE60 0011 2215 1570BIC GEBA BEBBCommunication: B.E.R. 2004 subscriptionIxelles Université, ch. de Boondael, 466 B-1050 Brussels
❐ VisaName: ................................................................................................Credit Card Nr: ..................................................................................Expiration date: ..................................................................................Signature: ...........................................................................................Date: ..................................................................................................
❐ On receipt of the invoice
✂