Brunswick Corporation Form 10-K€¦ · The acquisition of Harris Kayot, a builder of pontoon...
105
UNITED STATES SECURITIES AND EXCHANGE COMMISSION Washington, D.C. 20549 _______________ Form 10-K [X] Annual report pursuant to Section 13 or 15(d) of the Securities Exchange Act of 1934 For the fiscal year ended December 31, 2005, or [ ] Transition Report Pursuant to Section 13 or 15(d) of the Securities Exchange Act of 1934 Commission file number 1-1043 _______________ Brunswick Corporation (Exact name of registrant in its charter) Delaware 36-0848180 (State of incorporation) (I.R.S. Employer Identification No.) 1 N. Field Ct., Lake Forest, Illinois 60045-4811 (Address of principal executive offices) (zip code) (847) 735-4700 (Registrant’s telephone number, including area code) Securities Registered pursuant to Section 12(b) of the Act: Title of each class Name of each exchange on which registered Common Stock ($0.75 par value) New York, Chicago, Pacific Preferred Stock Purchase Rights and London Stock Exchanges Securities registered Pursuant to Section 12(g) of the Act: None ______________ Indicate by check mark if the registrant is a well-known seasoned issuer, as defined in Rule 405 of the Securities Act. Yes [X] No [ ] Indicate by check mark if the registrant is not required to file reports pursuant to Section 13 or Section 15(d) of the Act. Yes [ ] No [X] Indicate by check mark whether the registrant (1) has filed all reports required to be filed by Section 13 or 15(d) of the Securities Exchange Act of 1934 during the preceding 12 months (or for such shorter period that the registrant was required to file such reports), and (2) has been subject to such filing requirements for the past 90 days. Yes [X] No [ ] Indicate by check mark if disclosure of delinquent filers pursuant to Item 405 of Regulation S-K is not contained herein, and will not be contained, to the best of the registrant’s knowledge, in the definitive proxy or information statements incorporated by reference in Part III of this Form 10-K or any amendment to this Form 10-K. [X] Indicate by check mark whether the registrant is a large accelerated filer, an accelerated file, or a non-accelerated filer. See definition of “accelerated filer and large accelerated filer” in Rule 12b-2 of the Exchange Act. (Check one): Large accelerated filer [X] Accelerated filer [ ] Non-accelerated filer [ ] Indicate by check mark whether the registrant is a shell company (as defined in Rule 12b-2 of the Exchange Act). Yes [ ] No [X] As of July 1, 2005, the aggregate market value of the voting stock of the registrant held by non-affiliates was $4,282,184,888. Such number excludes stock beneficially owned by officers and directors. This does not constitute an admission that they are affiliates. The number of shares of Common Stock ($0.75 par value) of the registrant outstanding as of February 24, 2006, was 95,021,811. DOCUMENTS INCORPORATED BY REFERENCE
Transcript of Brunswick Corporation Form 10-K€¦ · The acquisition of Harris Kayot, a builder of pontoon...

UNITED STATESSECURITIES AND EXCHANGE COMMISSION
Washington, D.C. 20549_______________
Form 10-K[X] Annual report pursuant to Section 13 or 15(d) of
the Securities Exchange Act of 1934For the fiscal year ended December 31, 2005, or
[ ] Transition Report Pursuant to Section 13 or 15(d)of the Securities Exchange Act of 1934
Commission file number 1-1043_______________
Brunswick Corporation(Exact name of registrant in its charter)
Delaware 36-0848180(State of incorporation) (I.R.S. Employer Identification No.)
1 N. Field Ct., Lake Forest, Illinois 60045-4811(Address of principal executive offices) (zip code)
(847) 735-4700(Registrant’s telephone number, including area code)
Securities Registered pursuant to Section 12(b) of the Act:
Title of each class Name of each exchange
on which registered Common Stock ($0.75 par value) New York, Chicago, PacificPreferred Stock Purchase Rights and London Stock Exchanges
Securities registered Pursuant to Section 12(g) of the Act:None
______________Indicate by check mark if the registrant is a well-known seasoned issuer, as defined in Rule 405 of the Securities Act. Yes [X] No [ ]
Indicate by check mark if the registrant is not required to file reports pursuant to Section 13 or Section 15(d) of the Act. Yes [ ] No [X]
Indicate by check mark whether the registrant (1) has filed all reports required to be filed by Section 13 or 15(d) of the SecuritiesExchange Act of 1934 during the preceding 12 months (or for such shorter period that the registrant was required to file such reports), and(2) has been subject to such filing requirements for the past 90 days. Yes [X] No [ ]
Indicate by check mark if disclosure of delinquent filers pursuant to Item 405 of Regulation S-K is not contained herein, and will notbe contained, to the best of the registrant’s knowledge, in the definitive proxy or information statements incorporated by reference in PartIII of this Form 10-K or any amendment to this Form 10-K. [X]
Indicate by check mark whether the registrant is a large accelerated filer, an accelerated file, or a non-accelerated filer. See definitionof “accelerated filer and large accelerated filer” in Rule 12b-2 of the Exchange Act. (Check one): Large accelerated filer [X] Acceleratedfiler [ ] Non-accelerated filer [ ]
Indicate by check mark whether the registrant is a shell company (as defined in Rule 12b-2 of the Exchange Act). Yes [ ] No [X]
As of July 1, 2005, the aggregate market value of the voting stock of the registrant held by non-affiliates was $4,282,184,888. Suchnumber excludes stock beneficially owned by officers and directors. This does not constitute an admission that they are affiliates.
The number of shares of Common Stock ($0.75 par value) of the registrant outstanding as of February 24, 2006, was 95,021,811.
DOCUMENTS INCORPORATED BY REFERENCE

Part III of this Report on Form 10-K incorporates by reference certain information that will be set forth in the Company’sdefinitive Proxy Statement for the Annual
Meeting of Shareholders scheduled to be held on May 3, 2006.

ANNUAL REPORT ON FORM 10-K
TABLE OF CONTENTS
Page
Part I Item 1. Business 1Item 1A. Risk Factors 8Item 1B. Unresolved Staff Comments 10Item 2. Properties 10Item 3. Legal Proceedings 11Item 4. Submission of Matters to a Vote of Security Holders 12 Part II Item 5. Market for Registrant’s Common Equity, Related Stockholder Matters and Issuer Purchases of Equity Securities 14Item 6. Selected Financial Data 15Item 7. Management’s Discussion and Analysis of Financial Condition and Results of Operations 17Item 7A. Quantitative and Qualitative Disclosures About Market Risk 35Item 8. Financial Statements and Supplementary Data 37Item 9. C h a n g e s in and Disagreements with Accountants on
Accounting
and Financial Disclosure 37Item 9A. Controls and Procedures 37
Part III Item 10. Directors and Executive Officers of the Registrant 38Item 11. Executive Compensation 38Item 12. Security Ownership of Certain Beneficial Owners and Management and Related Stockholder Matters 38Item 13. Certain Relationships and Related Transactions 38Item 14. Principal Accountant Fees and Services 38 Part IV Item 15. Exhibits and Financial Statement Schedules 39

PART I
Item 1. Business
Brunswick Corporation (the Company) is a leading global manufacturer and marketer of boats, including fiberglass pleasure boats;luxury sportfishing convertibles and motoryachts; high-performance boats; offshore fishing boats; aluminum fishing, deck and pontoonboats; rigid inflatable boats; and marine parts and accessories; of outboard, sterndrive and inboard engines; trolling motors; propellers;marine dealer management systems; engine control systems; global positioning systems products and marine electronics and navigationsystems; o f fitness equipment; and of bowling products, including capital equipment and consumer products; billiards tables andaccessories; and Air Hockey and foosball tables. The Company also owns and operates Brunswick bowling centers in the United Statesand internationally, and retail billiards stores in the United States.
T h e Company’s strategy is to achieve growth by developing innovative products, identifying and deploying leading-edgetechnologies, pursuing aggressive marketing and brand-building activities, enhancing its distribution channels, seizing internationalopportunities, improving the efficiency of its supply chain and leveraging core competencies. In addition, growth will come fromexpansion of existing businesses and from acquisitions. Further, the Company focuses on enhancing its operating margins througheffective cost management and investments in technology. The Company’s objective is to enhance shareholder value by achieving returnson investments that exceed its cost of capital.
See Note 4. Segment Information in the Notes to Consolidated Financial Statements for additional information, including operatingearnings and total assets by segment for 2005, 2004 and 2003.
Boat Segment
The Boat segment consists of the Brunswick Boat Group (Boat Group), which markets and manufactures fiberglass pleasure boats,high-performance boats, offshore fishing boats, and aluminum fishing, pontoon and deck boats, and manufactures and distributes marineparts and accessories. The Company believes its Boat Group, which had net sales of $2,769.8 million during 2005, has the largest dollarsales and unit volume of pleasure boats in the world.
The Boat Group manages most of the Company’s boat brands, evaluates and increases the Company’s boat portfolio by acquiringrecreational boat companies that serve product segments in which the Company is not participating, expands the Company’s involvementin recreational boating services and activities to enhance the consumer experience and dealer profitability, speeds the introduction of newtechnologies into boat manufacturing processes and the Company’s boat products, and leverages the Company’s extensive knowledge andinvolvement in boat design, manufacturing and distribution.
The Boat Group is headquartered in Knoxville, Tennessee, and is comprised of the following boat brands: Albemarle, Cabo andHatteras luxury sportfishing convertibles and motoryachts; Sea Ray and Sealine yachts, sport yachts, cruisers and runabouts; Bayliner andMaxum cruisers and runabouts; Meridian motoryachts; Boston Whaler, Sea Pro, Sea Boss, Palmetto, Triton and Trophy fishing boats;Baja high-performance boats; and Crestliner, Harris, Kayot, Lowe, Lund and Princecraft aluminum fishing, pontoon and deck boats. TheBoat Group also operates a commercial and governmental sales unit that sells products to the United States Government and state, localand foreign governments. The Boat Group procures most of its outboard engines, gasoline sterndrive engines and gasoline inboardengines from the Company’s Marine Engine segment. The Boat Group also purchases a portion of its diesel engines from CumminsMerCruiser Diesel Marine LLC (CMD), a joint venture of the Company’s Mercury Marine division with Cummins Marine, a division ofCummins Inc.
The Boat Group has manufacturing facilities in California, Florida, Indiana, Maryland, Michigan, Minnesota, Mississippi, Missouri,North Carolina, Ohio, Oregon, South Carolina, Tennessee and Washington, as well as international manufacturing facilities in Canada,Mexico and the United Kingdom. The Boat Group also utilizes contract manufacturing facilities in Eastern Europe. In 2005, theCompany acquired a facility to manufacture sportfishing convertibles and motoryachts in Swansboro, North Carolina. Since 2002, theCompany has been manufacturing entry-level runabouts at a new facility in Reynosa, Mexico. I n 2005, the Company expanded thisfacility, which doubled its capacity, allowing the Company to increase production of its Bayliner and Maxum runabouts. Also in 2005, theCompany expanded its Vonore, Tennessee, facility to increase capacity for its closed-mold operations. Closed molding is an improvedmanufacturing process that limits emissions more effectively when compared with the traditional open mold process, allows for increasedcapacity and produces more precise and consistent fiberglass parts, hulls and decks.
1

In 2005, the Company purchased the Albemarle, Triton, Harris and Kayot boat brands. Albemarle produces offshore sportfishingboats ranging in length from 24 to 41 feet. The acquisition of Albemarle provides the Company with the opportunity to offer a morecomplete range of offshore sportfishing boats and complements the sportfishing convertibles offered by Hatteras, where products start at50 feet. Triton is a manufacturer of fiberglass bass and saltwater fishing boats, and aluminum fishing boats ranging in length from 12 to 35feet. The acquisition of Triton adds bass boats to the Company’s product lineup, as well as a broader range of saltwater fishing andaluminum fishing boats. The acquisition of Harris Kayot, a builder of pontoon boats, fiberglass runabouts and deckboats ranging in lengthfrom 20 to 26 feet, will advance the Company’s position in the pontoon market and complement the Company’s existing boat portfoliowith premium runabout and deckboat product lines.
The Company’s 2003 acquisitions of Land ‘N’ Sea Corporation (a marine parts and accessories distributor) and Attwood Corporation(a manufacturer of marine hardware and accessories) form the backbone of the Company’s initiative to develop its boat parts andaccessories business to better serve boat dealers and consumers. In 2005, the Company purchased Kellogg Marine, a leading marine partsand accessories dealer in the northeastern United States, and certain assets of Benrock, Inc., a distributor of marine parts serving thecentral and southern United States markets. Working with its boat dealer network, the Company will continue to strive to improve quality,distribution and delivery of parts and accessories to enhance the boating customers’ experience.
In February 2006, the Company purchased Cabo Yachts, which builds offshore sportfishing boats ranging in length from 31 to 52feet. The acquisition of Cabo complements the Company’s previous acquisitions of Albemarle and Hatteras. Also in February 2006, theCompany acquired Great American Marina, a 95-slip marina near St. Petersburg, Florida, in partnership with MarineMax, Inc.(MarineMax), which will operate the service portion of the property.
The Boat Group’s products are sold to end users through a global network of approximately 2,300 dealers and distributors, each ofwhich carries one or more of the Company’s boat brands. Sales to the Boat Group’s largest dealer, MarineMax, which has multiplelocations and carries a number of the Boat Group’s product lines, represented approximately 18 percent of Boat Group sales in 2005.
Domestic retail demand for pleasure boats is seasonal, with sales generally highest in the second quarter.
Marine Engine Segment
The Marine Engine segment, which had net sales of $2,638.7 million in 2005, consists of the Mercury Marine Group and BrunswickNew Technologies. The Company believes its Marine Engine segment has the largest dollar sales volume of recreational marine enginesin the world.
Mercury Marine manufactures and markets a full range of sterndrive engines, inboard engines, outboard engines and water-jetpropulsion systems under the Mercury, Mercury MerCruiser, Mariner, Mercury Racing, Mercury SportJet and Mercury Jet Drive brandnames. Mercury Marine’s sterndrives, inboard engines, water-jet propulsion systems and a substantial number of its outboard engines aresold either to independent boatbuilders or to the Company’s Brunswick Boat Group. In addition, Mercury Marine’s outboard engines andparts and accessories, including marine electronics and control integration systems, steering systems, instruments, controls, propellers,trolling motors, service aids and marine lubricants, are sold to end-users through a global network of approximately 7,000 marine dealersand distributors, specialty marine retailers and marine service centers. Mercury Marine, through CMD, supplies integrated dieselpropulsion systems to the worldwide recreational and commercial marine markets, including the Brunswick Boat Group.
Mercury Marine manufactures two-stroke OptiMax outboard engines, ranging from 75 to 250 horsepower, all of which featureMercury’s direct fuel injection (DFI) technology. DFI is part of Mercury’s plan to comply with U.S. Environmental Protection Agency(EPA) requirements and reduce outboard engine emissions by 75 percent over a nine-year period, beginning with the 1998 model yearand ending with the 2006 model year. Mercury’s product line of low-emission engines includes four-stroke outboard engine modelsranging from 2.5 to 275 horsepower. In 2004, Mercury Marine introduced Verado, a new series of high-horsepower outboard engines tocomplement its existing four-stroke product line. Mercury currently offers Verado engines ranging from 135 to 275 horsepower, andintroduced naturally aspirated 75, 90 and 115 horsepower outboard engines based on Verado technology in February 2006. Mercury’sOptiMax and four-stroke outboards already achieve the EPA’s mandated 2006 emission levels.
Mercury Marine’s sterndrive and outboard engines are produced primarily in Oklahoma and Wisconsin, respectively. Certain smalloutboard engines are manufactured i n Japan by a Mercury Marine joint venture. Mercury and its joint venture partner, TohatsuCorporation, expanded this manufacturing facility in 2004, completing a new plant that began production in early 2005. Mercury opened anew four-stroke engine plant in Suzhou, China in March 2005 that will produce 40 to 60 horsepower outboard engines when fullyoperational. In addition, Mercury Marine sources some engine components from Asian suppliers. Mercury Marine also manufacturesengine component parts at plants in Florida and Mexico, and has a facility in Belgium that customizes engines for sale into Europe. Dieselmarine propulsion systems are manufactured in South Carolina by CMD.
2

In addition to its marine engine operations, Mercury Marine offers international markets a wide range of aluminum, fiberglass and
inflatable boats produced either by, or for, Mercury in Australia, China, Poland, Portugal, Russia and Sweden. These boats, which aremarketed under the brand names Armor, Arvor, Bermuda, Legend, Mercury, Örnvik, Quicksilver, Savage, Uttern and Valiant, aretypically equipped with engines manufactured by Mercury Marine and often include other parts and accessories supplied by MercuryMarine. In January 2006, the Company began manufacturing boats at a new facility in Zhuhai, China, that the Company has establishedinitially to serve the Asia-Pacific region. Mercury Marine also has equity ownership interests in companies that manufacture boats underthe brand names Aquador, Bella and Flipper in Finland; Askeladden in Norway; and Legend, Protector and Rayglass in New Zealand.Mercury Marine also manufactures custom and standard propellers and underwater stern gear for inboard-powered vessels, under thename Teignbridge, in the United Kingdom.
The Company established Brunswick New Technologies (BNT) during 2002 to develop the Company’s product offerings in marineelectronics, engine controls, navigation systems, dealer management systems and related equipment for use in both marine and non-marine applications. BNT is comprised of Navman, a New Zealand-based producer of global positioning systems-based products andmarine electronics; MotoTron, which leverages the Company’s expertise in engine controls to non-marine markets; BNT MarineElectronics, a leader in premium aftermarket and commercial marine navigation electronics sold under the Northstar, Navman and MXMarine brands; Monolith Corporation/Integrated Dealer Systems, a leading developer of management systems for dealers of marineproducts and recreational vehicles; and BNT Asia, a development center focusing on wireless and embedded sensor technologies forapplications primarily in the sports and wellness markets. In 2005, the Company purchased certain assets of MX Marine, a manufacturerof global-positioning systems, navigation systems and other marine electronics for the commercial market, and the stock of TechArt, aGerman provider of customized aftermarket infotainment products to the automotive industry.
Domestic retail demand for the Marine Engine segment’s products is seasonal, with sales generally highest in the second quarter forMercury Marine and the fourth quarter for BNT.
Fitness Segment
The Company’s Fitness segment is comprised of the Life Fitness division, which designs, markets and manufactures a full line ofreliable, high-quality cardiovascular fitness equipment (including treadmills, total body cross trainers, stair climbers and stationaryexercise bicycles) and strength-training equipment under the Life Fitness, Hammer Strength and ParaBody brands.
The Company believes that its Fitness segment, which had net sales of $551.3 million during 2005, has the largest dollar sales volumeof commercial fitness equipment in the world. Life Fitness’ commercial sales are primarily to private health clubs and fitness facilitiesoperated by professional sports teams, the military, governmental agencies, corporations, hotels, schools and universities. Commercialsales are made to customers either directly, through domestic dealers or through international distributors.
The Fitness segment’s principal manufacturing facilities are located in Illinois, Kentucky, Minnesota and Hungary.
During 2005, Life Fitness introduced a number of new fitness products, including new commercial or consumer elliptical crosstrainers, treadmills, stationary bikes and home gym products, as well as additional commercial selectorized and core strength trainingequipment.
The Company distributes fitness products worldwide from regional warehouses and factory stocks of merchandise. Domestic retail demand for Life Fitness' products is seasonal, with sales generally highest in the first and fourth quarters.
Bowling & Billiards Segment
The Bowling & Billiards segment is comprised of the Brunswick Bowling & Billiards division (BB&B), which had net sales of$464.5 million during 2005. BB&B is the leading full-line designer and producer of bowling products, including bowling balls andbowling pins, aftermarket products and parts, and capital equipment, which includes bowling lanes and related equipment, automaticpinsetters, ball returns, furniture units, and scoring and center management systems. Through licensing arrangements, BB&B also offers anarray of bowling consumer products, including bowling shoes, bags and accessories. BB&B also designs, manufactures and markets a fullline of high-quality consumer and commercial billiards tables, Air Hockey table games, foosball tables and related accessories.
3

BB&B operates 113 bowling centers in the United States, Canada and Europe, and with its joint venture partner operates 15
additional centers in Japan. These bowling centers offer bowling and, depending on size and location, the following activities andservices: billiards, video games, pro shops, meeting and party rooms, children’s playrooms, restaurants and cocktail lounges. All of theNorth American centers offer Cosmic Bowling, an enhanced form of bowling with integrated sound systems and glow-in-the-dark effects.To date, 46 of BB&B’s centers have been converted into Brunswick Zones, which are modernized bowling centers that offer a full arrayof family-oriented entertainment activities. The entertainment offerings available at Brunswick Zones are designed to appeal to a broadaudience, including families and other recreational bowlers, as well a s traditional league bowlers. In 2005 and 2004, BB&B furtherenhanced the Brunswick Zone concept with the opening of three additional showcase Brunswick Zones in the Chicago, Denver andMinneapolis markets. Brunswick’s four showcase Brunswick Zones are approximately 50 percent larger than typical Brunswick Zonesand feature multiple-venue entertainment offerings such as laser tag games and expanded game rooms. BB&B intends to continue to usethis enhanced model for many of its new centers.
BB&B’s billiards business was established in 1845, and is the oldest business operated by the Company. BB&B designs and marketsbilliards tables, balls and cues, as well as billiards furniture and related accessories, under the Brunswick and Contender by Brunswickbrands. These products are sold worldwide into both commercial and consumer billiards markets. The Company also owns Valley-Dynamo, a leading manufacturer of commercial and consumer billiards, Air Hockey table games and foosball tables. The Companybelieves it has the largest dollar sales volume of billiards tables in the world. In 2003, BB&B opened Brunswick Home & Billiard, its firstretail store, in a northern suburb of Chicago, and, in 2005, BB&B expanded this concept by opening three new stores in the Boston andDenver markets. These stores feature billiards products and other products for the home, and utilize marketing and merchandisingconcepts targeted to both women and men. Brunswick Home & Billiard provides opportunities to enhance the retail experience of billiardscustomers and to share those learnings with BB&B’s retail billiards dealers nationwide. Additional stores are planned for 2006.
BB&B’s primary manufacturing and distribution locations are in Michigan, Texas, Wisconsin and Hungary. In June 2005, theCompany announced plans to move bowling ball production from Muskegon, Michigan, to Reynosa, Mexico, where the Companyexpects to begin production in late 2006.
T h e Company’s bowling and billiards products are sold through a variety of channels, including distributors, dealers, massmerchandisers, bowling centers and retailers, and directly to consumers. BB&B products are distributed worldwide from regionalwarehouses, sales offices and factory stocks of merchandise.
Domestic retail demand for BB&B's products is seasonal, with sales generally highest in the first and fourth quarters.
Financial Services
The Company has a 49 percent ownership interest in a joint venture, Brunswick Acceptance Company, LLC (BAC) with GECommercial Finance, which provides secured wholesale floor-plan financing to the Company’s boat and engine dealers. BAC alsopurchases and services a portion of Mercury Marine’s domestic accounts receivable relating to its boatbuilder and dealer customers. SeeNote 7. Financial Services in the Notes to Consolidated Financial Statements for more information about BAC.
Distribution
The Company depends on distributors, dealers and retailers (Dealers) for the majority of its recreational boat sales, and significantportions of its marine engine, fitness and bowling and billiards products. The Company has approximately 7,000 Dealers serving itsbusiness segments worldwide. The Company’s marine Dealers typically carry boats, engines and related parts and accessories.
The Company’s Dealers are independent companies or proprietors that range in size from small, family-owned dealerships to large,publicly traded organizations with substantial revenues and multiple locations. Some of the Company’s Dealers sell the Company’sproducts exclusively, while others also carry competitors’ products.
In 2005, the Company sold its minority interest in MarineMax, the Boat Group’s largest dealer, which has multiple locations andcarries a number of the Boat Group’s product lines, as part of a registered public offering by MarineMax. See Note 6. Investments in theNotes to Consolidated Financial Statements for more information about the sale of this investment.
4

T h e Company owns Land ‘N’ Sea and Kellogg Marine, parts and accessories distribution platforms for the Brunswick BoatGroup. The Boat Group, with 19 distribution centers throughout North America, is the largest wholesale distributor of marine parts andaccessories in the world and provides the ability to move parts quickly and accurately to dealers, repair shops and the do-it-yourselfconsumer.
Demand for a significant portion of the Company’s products is seasonal, and a number of the Company’s Dealers are relatively smallor often highly leveraged. As a result, many of the Company’s Dealers require financial assistance to support their business and provide astable channel for the Company’s products. In addition to BAC, the Company provides its Dealers with assistance, including incentiveprograms, loans, loan guarantees and inventory repurchase commitments, under which the Company is obligated to repurchase inventoryfrom a finance company in the event of a Dealer’s default. The Company believes that these arrangements are in the Company’s bestinterest, but its financial support of its Dealers does expose the Company to credit and business risk. The Company’s business unitsmaintain active credit operations to manage this financial exposure on an ongoing basis, and the Company continues to seek opportunitiesto improve and sustain its various distribution channels. See Note 9. Commitments and Contingencies in the Notes to ConsolidatedFinancial Statements for further discussion of these arrangements.
International Operations
The Company’s sales to customers in international markets were $2,049.2 million (35 percent of net sales) and $1,689.2 million (32percent of net sales) in 2005 and 2004, respectively. The Company transacts most of its sales in international markets in local currencies,and the costs of its products are generally denominated in U.S. dollars. Future strengthening or weakening of the U.S. dollar can affect therevenues of the Company’s international operations.
The Company’s international sales are set forth in Note 4. Segment Information in the Notes to Consolidated Financial Statementsand are also included in the table below, which details the Company’s international sales by region for 2005, 2004 and 2003:
2005 2004 2003 (In millions) Europe $ 1,154.3 $ 945.5 $ 700.4 Pacific Rim 372.6 313.1 220.7 Canada 312.3 273.8 200.5 Latin America 134.6 102.0 79.2 Other 75.4 54.8 41.4
$ 2,049.2 $ 1,689.2 $ 1,242.2
Boat segment sales comprised approximately 29 percent of the Company’s total international sales in 2005. The Boat Group’sproducts are manufactured or assembled in the United States, Canada, Mexico, Poland and the United Kingdom, and are sold worldwidethrough dealers. The Boat Group has international sales offices in France and the Netherlands.
Marine Engine segment sales represented approximately 52 percent of the Company’s total international sales in 2005. The segment’sprimary international operations include the following:
– A marine engine product customization plant and distribution center in Belgium serving Europe, Africa and the Middle East;
– A propeller and underwater stern-gear manufacturing plant in the United Kingdom;
– Sales offices and distribution centers in Australia, Brazil, Canada, China, Japan, Malaysia, Mexico, New Zealand andSingapore;
– Sales offices in Belgium, Denmark, France, Germany, Italy, the Netherlands, Norway, Sweden, Switzerland and the
United Kingdom;
– Boat manufacturing plants in Australia, China, Portugal and Sweden;
– A research and development office in Singapore and New Zealand and a manufacturing plant in New Zealand;
– An outboard engine assembly plant in Suzhou, China; and
– A marina-boat club in Suzhou, China, on Lake Tai. Fitness segment sales comprised approximately 12 percent of the Company’s total international sales in 2005. Life Fitness sells its
products worldwide and has sales and distribution centers in Brazil, Germany, Hong Kong, Japan, the Netherlands, Spain and the UnitedKingdom, as well as sales offices in Austria and Italy. The Fitness segment also manufactures strength training equipment and select linesof cardiovascular equipment in Hungary for the European market.

5

Bowling & Billiards segment sales comprised approximately 7 percent of the Company’s total international sales in 2005. BB&B sellsits products worldwide, has sales offices in Germany, Hong Kong and the United Kingdom, and has a plant that manufactures pinsetters inHungary. BB&B expects its Reynosa, Mexico, bowling ball plant to begin operations in late 2006. BB&B operates bowling centers inAustria, Canada and Germany, and holds a 50 percent interest in an entity that sells bowling equipment and operates bowling centers inJapan.
Raw Materials
The Company purchases raw materials from various sources. The Company is not currently experiencing any critical raw materialshortages, nor does the Company anticipate any. General Motors Corporation is the sole supplier of engine blocks used in themanufacture of the Company’s gasoline sterndrive and inboard engines. The Company has experienced increases in the cost ofaluminum, steel and resins used in its manufacturing processes during 2005. The Company continues to expand its global procurementoperations to leverage the Company’s purchasing power across its divisions and improve supply chain and cost efficiencies.
Intellectual Property
The Company has, and continues to obtain, patent rights covering certain features of the Company’s products and processes. By law,the Company’s patent rights, which consist of patents and patent licenses, have limited lives and expire periodically. The Companybelieves that its patent rights are important to its competitive position.
In the Boat segment, patent rights principally relate to processes for manufacturing fiberglass hulls, decks and components for theCompany’s boat products, as well as patent rights related to boat seats, interiors and other boat features and components.
In the Marine Engine segment, patent rights principally relate to features of outboard engines and inboard-outboard drives, includingdie-cast powerheads; cooling and exhaust systems; drive train, clutch and gearshift mechanisms; boat/engine mountings; shock-absorbingtilt mechanisms; ignition systems; propellers; marine vessel control systems; fuel and oil injection systems; supercharged engines;outboard mid-section structures; segmented cowls; hydraulic trim, tilt and steering; screw compressor charge air cooling systems; andairflow silencers. The patent rights of the Marine Engine segment also relate to electronic devices that utilize global positioning systemtechnology.
I n the Fitness segment, patent rights principally relate to fitness equipment designs and components, including patents coveringinternal processes, programming functions, displays, design features and styling.
In the Bowling & Billiards segment, patent rights principally relate to computerized bowling scorers and bowling center managementsystems, bowling lanes, lane conditioning machines and related equipment, bowling balls, and billiards table designs and components.
The following are among the Company’s primary trademarks:
Boat Segment: Albemarle, Attwood, Baja, Bayliner, Boston Whaler, Crestliner, Harris, Hatteras, Kayot, Kellogg, Land ‘N’ Sea,Lowe, Lund, Master Dealer, Maxum, Meridian, Palmetto, Princecraft, Sea Boss, Sea Pro, Sea Ray, Seachoice, Sealine, Swivl-Eze, Tritonand Trophy.
Marine Engine Segment: Integrated Dealer Systems, Mariner, MercNet, MerCruiser, Mercury, MercuryCare, Mercury Marine,Mercury Parts Express, Mercury Precision Parts, Mercury Propellers, Mercury Racing, MotorGuide, MotoTron, MX Marine, Navman,Northstar, OptiMax, Pinpoint, Quicksilver, SeaPro, SmartCraft, SportJet, Teignbridge Propellers, Valiant and Verado.
Fitness Segment: Flex Deck, Hammer Strength, Lifecycle, Life Fitness and ParaBody.
Bowling & Billiards Segment: Air Hockey, Anvilane Pro Lane, Brunswick, Brunswick Billiards, Brunswick Pavilion, BrunswickZone, Centennial, Contender by Brunswick, Cosmic Bowling, DBA Products, Dynamo, Gold Crown, Inferno, Lane Shield, Lightworx,Throbot, Tornado, U.S. Play by Brunswick, Valley, Vector, Viz-A-Ball, Zone and Brunswick Home and Billiard.
The Company’s trademarks have indefinite lives, and many of these trademarks are well known to the public and are considered
valuable assets of the Company.
6

Competitive Conditions and Position
The Company believes that it has a reputation for quality in its highly competitive lines of business. The Company competes in itsvarious markets by utilizing efficient production techniques; innovative technological advancements; effective marketing, advertising andsales efforts; providing high-quality products at competitive prices; and offering extensive after-market services.
Strong competition exists with respect to each of the Company’s product groups, but no single manufacturer competes with theCompany in all product groups. In each product area, competitors range in size from large, highly diversified companies to small, single-product businesses.
The following summarizes the Company’s competitive position in each segment:
Boat Segment: The Company believes it has the largest dollar sales and unit volume of pleasure boats in the world with the broadestarray of product offerings. There are several major manufacturers of pleasure and offshore fishing boats, along with hundreds of smallermanufacturers. Consequently, this business is both highly competitive and highly fragmented. The Company believes it has the broadestrange of boat product offerings in the world, with boats ranging from 10 to 100 feet, along with a parts and accessories business. In all ofits boat operations, the Company competes on the basis of product features, technology, quality, dealer service, performance, value,durability and styling, along with effective promotion, distribution and pricing.
Marine Engine Segment: The Company believes it has the largest dollar sales volume of recreational marine engines in the world.The marine engine market is highly competitive among several major international companies that comprise the majority of the market,and several smaller companies. Brunswick New Technologies faces many competitors in the marine accessories, electronics, enginecontrols, navigation systems a n d global positioning systems-based land navigation businesses, especially new entrants to globalpositioning systems-based businesses throughout the world. Competitive advantage in this segment is a function of product features,technological leadership, quality, service, performance and durability, along with effective promotion, distribution and pricing.
Fitness Segment: The Company believes it is the world’s largest manufacturer of commercial fitness equipment and a leadingmanufacturer of high-quality consumer fitness equipment. There are a few large manufacturers of fitness equipment and hundreds ofsmall manufacturers, which create a highly fragmented competitive landscape. Many o f the Company’s fitness equipment productsfeature industry-leading product innovations, and the Company places significant emphasis on new product introductions. Competitiveemphasis is also placed on product quality, marketing activities, pricing and service.
Bowling & Billiards Segment: The Company believes it is the world’s leading full-line designer and producer of bowling productsand billiards tables. There are several large manufacturers of bowling products, whereas the bowling retail market is highly fragmented.Competitive emphasis is placed on product innovation, quality, service, marketing activities and pricing. The Company also operates 128retail bowling centers worldwide, including those operated by the Company’s joint venture in Japan, where emphasis is placed onenhancing the bowling and entertainment experience, maintaining quality facilities and providing excellent customer service.
Research and Development
The Company strives to bolster its competitive position in all of its segments by continuously investing in research and developmentto drive innovation in its products and manufacturing technologies. The Company’s research and development investments support theintroduction of new products and enhancements to existing products. The Company’s research and development investments are shownbelow:
2005 2004 2003 (In millions) Boat $ 34.7 $ 27.2 $ 25.6 Marine Engine 89.9 82.0 70.0 Fitness 14.2 16.0 16.9 Bowling & Billiards 5.9 5.9 5.7
Total $ 144.7 $ 131.1 $ 118.2
7

Number of Employees
The approximate number of employees as of December 31, 2005, is shown below by segment:
Boat 13,000 Marine Engine 8,250 Fitness 1,250 Bowling & Billiards 4,700 Corporate 300
Total 27,500
As o f December 31, 2005, there were 61 employees in the Boat segment, 1,982 employees in the Marine Engine segment, 137employees in the Fitness segment, and 247 employees in the Bowling & Billiards segment represented by labor unions. The Companybelieves that it has good relations with these labor unions. The Boat segment renewed its existing labor union contracts with employees atits Lowell, Michigan, and Princeville, Quebec, Canada, facilities in November of 2005.
Environmental Requirements
See Item 3. Legal Proceedings for a description of certain environmental proceedings in which the Company is involved.
Available Information
The Company maintains an Internet web site at http://www.brunswick.com that includes links to the Company’s Annual Report onForm 10-K, Quarterly Reports on Form 10-Q, Current Reports on Form 8-K and any amendments to those reports (SEC Reports). TheSEC Reports are available without charge as soon as reasonably practicable following the time that they are filed with or furnished to theSEC. Shareholders and other interested parties may request email notification of the posting of these documents through the InvestorInformation section of the Company’s web site. Item 1A. Risk Factors General economic conditions, particularly in the United States and Europe, may adversely affect the Company’s results. TheCompany’s revenues may be affected by U.S. and international market conditions and consumer confidence. In particular, the Company’smarine businesses are cyclical and are dependent upon economic conditions and the overall level of consumer confidence. Any substantialdeterioration in general economic conditions that diminishes consumer confidence in any of the regions in which the Company competescould reduce the Company’s sales and adversely affect its business and financial results.
T h e Company’s profitability may suffer as a result of competitive product offerings and pricing pressures. Across all theCompany’s businesses, the introduction of lower-priced alternative products by other companies can hurt the Company’s competitiveposition. The Company is constantly subject to competitive pressures, particularly from Asian competitors in the outboard marine enginemarket worldwide and in Brunswick New Technologies’ land-based navigation electronics business. Such competitive pricing pressuresmay limit the Company’s ability to increase prices in response to raw material and other cost increases. The Company’s growth depends on the successful introduction of new product offerings. The Company’s ability to grow may beadversely affected by difficulties or delays in product development, such as an inability to develop viable new products, gain marketacceptance of new products or obtain adequate intellectual property protection for new products. To meet ever-changing consumerdemands, the timing of market entry and pricing of the Company’s new products are critical, especially for Brunswick NewTechnologies’ land-based navagation products, which generally have short product life cycles. Managing the transition to lower-margin products, particularly in its Marine Engine segment, is critical to the Company’soperating and financial results. The Company has historically derived a significant portion of its earnings from sales of higher-marginproducts, especially in its Marine Engine business. The Marine Engine segment is now completing a transition to manufacturing primarilylow-emission four-stroke engines, which have lower margins. The Company is addressing this margin pressure by relocating somemanufacturing to lower-cost areas. The Company’s inability to achieve lower-cost manufacturing, as well as increased competition in theproduct lines affected, could adversely impact the Company’s future operating and financial results. The Company’s financial results may be adversely affected if the Company is unable to maintain effective distribution. Becausethe Company sells the majority of its products through third parties such as dealers and distributors, the financial health of these dealersand distributors is critical to the Company’s continued success. The Company’s results can be negatively affected if dealers anddistributors experience higher operating costs that can result from rising interest rates, higher rents, labor costs a n d taxes, andcompliance with regulations. In addition, a substantial portion o f the Company’s marine engine sales are made to independentboatbuilders. Accordingly, the results of the Company’s Marine Engine segment can be influenced by the financial health of theseindependent boatbuilders, which can depend on the boatbuilders’ access to capital, ability to develop new products and ability tocompete effectively in the marketplace.

8

Inventory adjustments by the Company’s major dealers, retailers and independent boatbuilders adversely affect the Company’soperating margins. If the Company’s dealers and retailers, as well as independent boatbuilders who purchase the Company’s marineengine products, adjust their inventories downward in response to weakness in retail demand, wholesale demand for the Company’sproducts diminishes. In turn, the Company must reduce production, which results in lower rates of absorption of fixed costs and thuslower margins. Inventory reduction by dealers and customers can hurt the Company’s short-term sales and results of operations and limitthe Company’s ability to meet increased demand when economic conditions improve. Adverse weather conditions can have a negative impact on marine and retail bowling center revenues. Weather conditions can havea significant impact on the Company’s operating and financial results, especially in the marine and bowling retail businesses. Sales of theCompany’s marine products are generally stronger just before and during spring and summer, and favorable weather during these monthsgenerally has a positive effect on consumer demand. Conversely, unseasonably cool weather, excessive rainfall or drought conditionsduring these periods can reduce demand. Hurricanes and other storms can result in the disruption of the Company’s distribution channel,as occurred in 2004 and 2005 on the U.S. Atlantic and Gulf coasts. Since many of the Company’s boats are used extensively onreservoirs, the viability of reservoirs for boating is important to the Boat segment. In addition, severely inclement weather on weekendsand holidays, particularly during the winter months, can adversely affect patronage of the Company’s bowling centers and, therefore,revenues in the bowling retail business. The Company's ability to integrate acquisitions successfully may affect its financial results. Since 2001, the Company has acquired anumber of new businesses and entered into joint ventures, and it intends to continue to acquire additional businesses to complement itsexisting product portfolio. The Company’s success in effectively integrating these operations, including their financial, operational anddistribution practices and systems, will affect the contribution of these businesses to the Company’s consolidated results. There can be noassurance that any future acquisitions or joint ventures will be beneficial to the Company. Limited access to water can inhibit the Company’s ability to grow. Fo r various reasons, including environmental restrictions,permitting and zoning requirements, and the increasing cost of and competition for waterfront property, access to water for boating, aswell as marina and storage space, is limited in some regions. The Boat and Marine Engine segments can be adversely affected in areasthat do not have sufficient marina and storage capacity to satisfy demand. The Company’s marine engines may be subject to more stringent environmental regulations. The State of California has adoptedregulations requiring catalytic converters on the Company’s sterndrive and inboard engines by January 1, 2008. The Company expectsto comply fully with these regulations, but compliance will increase the cost of these products. Other environmental regulatory bodies inthe United States or other countries also may impose higher emissions standards in the future for the Company’s engines. Thesestandards could require catalytic converters, which would increase the cost of the Company's engines. Any increase in the cost of theCompany’s engines or unforeseen delays in compliance with environmental regulations affecting these products could have an adverseeffect on the Company’s results of operations. Higher energy costs can adversely affect the Company’s results and can hurt demand for the Company’s products, especially inthe marine and bowling center businesses. Higher energy costs increase the Company’s operating costs at its manufacturing facilitiesand the cost of shipping its products to customers. In addition, products in the Company’s Marine Engine segment are powered bygasoline or diesel fuel, and products in the Company’s Boat segment have gasoline or diesel engines. Any increase in the price ofpetroleum-based fuel, or the imposition of taxes or an interruption of supply, could reduce demand for the Company’s marine products.Finally, because heating, air conditioning and electricity comprise a significant part of the cost of operating a bowling center, any increasein the price of energy could adversely affect the operating margins of Brunswick bowling centers.
Higher interest rates can reduce demand, especially for marine products. The Company’s marine products, particularly boats, areoften financed. Rising interest rates can have an adverse effect on dealers’ and consumers’ ability to finance boat purchases, which canadversely affect the Company’s ability to sell its products and impact the profitability of the Company’s finance activities, includingBrunswick Acceptance Company. Changes in currency exchange rates can adversely affect the Company’s growth rate. Because the Company derives approximately35 percent of its revenues from sales outside the United States, its ability to realize projected growth rates can be adversely affectedwhen the U.S. dollar strengthens against other currencies. The Company manufactures its products primarily in the United States, andthe costs of its products are generally denominated in U.S. dollars, although manufacturing and sourcing outside the United States areincreasing. A strong U.S. dollar can make the Company’s products less price-competitive relative to local products in internationalmarkets.
9
The Company’s business is vulnerable to adverse international conditions. As the Company continues to focus on internationalgrowth, including in developing countries, and on lower-cost manufacturing outside the United States, it will become increasinglyvulnerable to the effects of political instability, adverse economic conditions and the possibility of terrorism, insurrection and militaryconflict around the world. Item 1B. Unresolved Staff Comments None. Item 2. Properties
The Company’s headquarters are located in Lake Forest, Illinois. The Company also maintains administrative offices in Chicago andVernon Hills, Illinois. The Company has numerous manufacturing plants, distribution warehouses, retail stores, sales offices and test siteslocated throughout the world. Research and development facilities are decentralized within the Company’s operating segments, and mostare located at individual manufacturing sites.
The Company believes its facilities are suitable and adequate for its current needs. The Company also believes its properties are wellmaintained and in good operating condition. Most plants and warehouses are of modern, single-story construction, providing efficientmanufacturing and distribution operations. The Company believes its manufacturing facilities have the capacity to meet current andanticipated demand. The Company’s headquarters and most of its principal plants are owned by the Company.
The Company’s primary facilities are in the following locations:
Boat Segment: Adelanto, California; Old Lyme, Connecticut; Edgewater, Merritt Island, Palm Coast, Pompano Beach and St.Petersburg, Florida; Fort Wayne, Indiana; Cumberland and Salisbury, Maryland; Lowell, Michigan; Little Falls, New York Mills andPipestone, Minnesota; Aberdeen, Mississippi; Lebanon, Missouri; Edenton, New Bern and Swansboro, North Carolina; Bucyrus, Ohio;Roseburg, Oregon; Newberry, South Carolina; Ashland City, Knoxville and Vonore, Tennessee; Lancaster, Texas; Arlington,Washington; Princeville, Quebec, Canada; Steinbach, Manitoba, Canada; Reynosa, Mexico; and Kidderminster, United Kingdom. All ofthese facilities are owned by the Company with the exception of the Pompano Beach, Florida; Lowell, Michigan; Aberdeen, Mississippi;and Lancaster, Texas, facilities, which are leased.
Marine Engine Segment: Torrance, Califorina; Miramar, Panama City and St. Cloud, Florida; Acton, Massachusetts; Stillwater andTulsa, Oklahoma; Fond du Lac, Brookfield and Oshkosh, Wisconsin; Raleigh, North Carolina; Melbourne and Sydney, Australia; PetitRechain and Wavre, Belgium; Pickering, Ontario, Canada; Suzhou and Zhuhai, Peoples Republic of China; Juarez, Mexico; Auckland andChristchurch, New Zealand; Vila Nova de Cerveira, Portugal; Illsfeld and Hannover, Germany; Singapore; and Newton Abbot andHorley, United Kingdom. The Acton, Massachusetts; Raleigh, North Carolina; Lake Forest, Illinois; Auckland and Christchurch, NewZealand; Horley, United Kingdom; Illsfeld and Hannover, Germany; Sydney, Australia; and Pickering, Ontario, Canada facilities areleased. The remaining facilities are owned by the Company.
Fitness Segment: Franklin Park and Schiller Park, Illinois; Falmouth, Kentucky; Ramsey, Minnesota; a n d Kiskoros andSzekesfehervar, Hungary. The Schiller Park office and a portion of the Franklin Park, Illinois, facility are leased. The remaining facilitiesare owned by the Company or, in the case of the Kiskoros, Hungary, facility, by a company in which the Company is the majority owner.
Bowling & Billiards Segment: Lake Forest, Illinois; Muskegon, Michigan; Richland Hills, Texas; Antigo and Bristol, Wisconsin;Szekesfehervar, Hungary; and Reynosa, Mexico; 113 Company-operated bowling recreation centers in the United States, Canada andEurope, and retail billiard stores in the suburbs of Chicago, Denver and Boston. Approximately 50 percent of BB&B’s bowling centers, aswell as the Richland Hills, Texas, manufacturing facility and the retail billiard stores are leased. The remaining facilities are owned by theCompany.
10

Item 3. Legal Proceedings
The Company accrues for litigation exposure based upon its assessment, made in consultation with counsel, of the likely range ofexposure stemming from the claim. In light of existing reserves, the Company’s litigation claims, when finally resolved, will not, in theopinion of management, have a material adverse effect on the Company’s consolidated financial position. If current estimates for the costof resolving any claims are later determined to be inadequate, results of operations could be adversely affected in the period i n whichadditional provisions are required.
Telephone Consumer Protection Act
The Company continues to defend itself against a 2004 lawsuit brought by plaintiffs who allegedly received unsolicited faxes from avendor of the Company’s Bowling & Billiards segment in violation of the Federal Telephone Consumer Protection Act. The Companydoes not believe the resolution of this lawsuit will have a material adverse effect on the Company's consolidated financial position orresults of operations.
Tax Case
In February 2003, the United States Tax Court issued a ruling upholding the disallowance by the Internal Revenue Service (IRS) ofcapital losses and other expenses for 1990 and 1991 related to two partnership investments entered into by the Company. In April 2003,the Company elected to pay the IRS $62 million (approximately $50 million after-tax), and in April 2004, the Company elected to pay theIRS an additional $10 million (approximately $8 million after-tax), in connection with this matter pending settlement negotiations. Thepayments were comprised of $33 million in taxes due and $39 million of pre-tax interest (approximately $25 million after-tax). TheCompany elected to make these payments to avoid future interest costs.
On March 9, 2005, the Company and the IRS reached a preliminary settlement of the issues involved in, and related to, this case, inwhich the Company agreed to withdraw its appeal of the tax ruling. All amounts due as a result of the settlement are covered by thepayments previously made to the IRS. In addition, all tax computations related to taxable years 1986 through 2001 have been calculatedand agreed to with the IRS at the examination level. The Company is awaiting final determination of tax and interest for these taxableyears. If there are no changes to the tax amounts agreed to with the IRS examination team for taxable years 1986 through 2001, theCompany expects to generate a tax benefit in future periods between $7 million and $16 million plus interest. The interest amount is beingcomputed by the IRS and is dependent upon the final tax assessed for sixteen tax years, 1986 through 2001, taking into account carrybackand carryforward of various tax credits, alternative minimum tax calculations and net operating loss carrybacks, and, therefore, is notquantifiable at this time. The final tax amount for these tax years is expected to be completed in the first half of 2006, while the finalinterest amount is not expected to be quantified until late in 2006.
Environmental Matters
The Company is involved in certain legal and administrative proceedings under t h e Comprehensive Environmental Response,Compensation and Liability Act of 1980 and other federal and state legislation governing the generation and disposal of certain hazardouswastes. These proceedings, which involve both on- and off-site waste disposal or other contamination, in many instances seekcompensation or remedial action from the Company as a waste generator under Superfund legislation, which authorizes action regardlessof fault, legality of original disposition or ownership of a disposal site. The Company has established reserves based on a range of costestimates for all known claims.
The environmental remediation and clean-up projects in which the Company is involved have an aggregate estimated range ofexposure of approximately $42 million to $63 million as of December 31, 2005. At December 31, 2005 and 2004, the Company hadreserves for environmental liabilities of $51.5 million and $54.1 million, respectively. There were environmental provisions of $1.5million, $0.0 million and $0.1 million for the years ended December 31, 2005, 2004 and 2003, respectively.
T h e Company accrues for environmental remediation related activities for which commitments or clean-up plans have beendeveloped and for which costs can be reasonably estimated. All accrued amounts are generally determined in coordination with third-party experts on an undiscounted basis and do not consider recoveries from third parties until such recoveries are realized. In light ofexisting reserves, the Company’s environmental claims, when finally resolved, will not, in the opinion of management, have a materialadverse effect on the Company’s consolidated financial position or results of operations.
11

Asbestos Class Actions
The Company has been named in a number of asbestos-related lawsuits, the majority of which involve Vapor Corporation, a formersubsidiary that the Company divested in 1990. Virtually all of the asbestos suits against the Company involve numerous other defendants.The claims generally allege that the Company sold products that contained components, such as gaskets, that included asbestos, and seekmonetary damages from the Company. Neither the Company nor Vapor is alleged to have manufactured asbestos. The Company’sinsurers have settled a number of asbestos claims for nominal amounts, while a number of other claims have been dismissed. No suit hasyet gone to trial. The Company does not believe that the resolution of these lawsuits will have a material adverse effect on the Company’sconsolidated financial position or results of operations.
Australia Trade Practices Investigation
In January 2005, the Company received a notice to furnish information to the Australian Competition and Consumer Commission(ACCC). The ACCC has sought information regarding a subsidiary of the Company, Navman Australia Pty Limited, with respect to salespractices from January 2001 through January 2005 and compliance with the Trade Practices Act of 1974. The Company has compliedwith the request of the ACCC for information and is cooperating with the investigation by the ACCC. The Company does not believe thatthe resolution of this matter with the ACCC will have a material adverse effect on the Company's consolidated financial position orresults of operations.
Chinese Supplier Dispute
The Company's Bowling & Billiards segment is involved in an arbitration proceeding in Hong Kong arising out of a commercialdispute with a former Chinese contract manufacturer, Shanghai Zhonglu Industrial Company Limited (Zhonglu). The Company filed thearbitration seeking damages based on Zhonglu's breach of a supply and distribution agreement pursuant to which Zhonglu agreed tomanufacture bowling equipment for the Company. Zhonglu has asserted counterclaims seeking damages for alleged breach of contractand the resolution of other claims. The arbitration tribunal heard final arguments in the matter in August 2005. The Company does notbelieve that this dispute will have a material adverse effect on the Company's consolidated financial condition or results of operations.
See Note 9. Commitments and Contingencies in the Notes to Consolidated Financial Statements for disclosure of the potential cashrequirements of environmental proceedings and other legal proceedings.
Item 4. Submission of Matters to a Vote of Security Holders
No matters were submitted to a vote of security holders during the fourth quarter of fiscal year 2005.
Executive Officers of the Registrant
The Company’s executive officers are listed in the following table:
Officer Present Position Age
Dustan E. McCoy Chairman and Chief Executive Officer 56Peter B. Hamilton Vice Chairman and President - Brunswick Boat Group 59Peter G. Leemputte Senior Vice President and Chief Financial Officer 48Kathryn J. Chieger Vice President - Corporate and Investor Relations 57Tzau J. Chung Vice President and President - Brunswick New Technologies 42William J. Gress Vice President - Supply Chain Management and President -
Brunswick Latin America Group 51
Warren N. Hardie President - Brunswick Bowling & Billiards 55B. Russell Lockridge Vice President and Chief Human Resources Officer 56Alan L. Lowe Vice President and Controller 54Patrick C. Mackey Vice President and President - Mercury Marine Group 59William L. Metzger Vice President and Treasurer 45Victoria J. Reich Vice President and President - Brunswick European Group 48Marschall I. Smith Vice President, General Counsel and Secretary 61John E. Stransky Vice President and President - Life Fitness Division 54Dale B. Tompkins Vice President - Strategy and Corporate Development 44Stephen M. Wolpert Vice President and President - US Marine Division 51Judith P. Zelisko Vice President - Tax 55
12

There are no familial relationships among these officers. The term of office of all elected officers expires May 3, 2006. The Group
and Division Presidents are appointed from time to time at the discretion of the Chief Executive Officer.
Dustan E. McCoy was named Chairman and Chief Executive Officer of the Company in December 2005. He was Vice President ofthe Company and President - Brunswick Boat Group from 2000 to 2005. From 1999 to 2000, he was Vice President, General Counsel andSecretary of the Company.
Peter B. Hamilton has been Vice Chairman of the Company since 2000. He was President of Brunswick Bowling & Billiards from2000 to February 2005, President, Life Fitness Division, from February 2005 to February 2006 and was named President - BrunswickBoat Group in February 2006.
Peter G. Leemputte has been Senior Vice President and Chief Financial Officer of the Company since August 2003. He was VicePresident and Controller of the Company from 2001 to 2003.
Kathryn J. Chieger has been Vice President - Corporate and Investor Relations of the Company since 1996.
Tzau J. Chung has been a Vice President of the Company since 2000 and was named President - Brunswick New Technologies, inFebruary 2002. Prior to that he was Vice President - Strategic Planning of the Company from 2000 to 2002, and was Senior VicePresident - Strategy and IT, for the Company’s Mercury Marine Group from 1997 to 2000.
William J. Gress was named President - Brunswick Latin America Group in June 2005. He also remains Vice President - SupplyChain Management of the Company, which he has been since 2001. From February 2000 to January 2001, he was Executive VicePresident of the Company’s Igloo business. Prior to that he was employed by Mercury Marine, where he was Vice President of itsMerCruiser Diesel business from 1999 to 2000.
Warren N. Hardie was named President - Brunswick Bowling & Billiards in February 2006. Previously, he was President - BowlingRetail from 1998 to February 2006. B. Russell Lockridge has been Vice President and Chief Human Resources Officer of the Company since 1999.
Alan L. Lowe has been Vice President and Controller of the Company since September 2003. Prior to joining Brunswick, he held anumber of senior financial positions with FMC Technologies, Inc., including, most recently, Director - Financial Control.
Patrick C. Mackey has been Vice President of the Company and President of its Mercury Marine Group since 2000.
William L. Metzger has been Vice President and Treasurer of the Company since 2001. From 2000 to 2001, he was Assistant VicePresident — Corporate Finance. From 1996 to 2000, he was Director - Corporate Accounting.
Victoria J. Reich has been Vice President and President - Brunswick European Group since August 2003. She was Senior VicePresident and Chief Financial Officer of the Company from 2000 to 2003, and Vice President and Controller of the Company from 1996to 2000.
Marschall I. Smith has been Vice President, General Counsel and Secretary of the Company since 2001. He joined Brunswick fromDigitas Inc., a leading e-commerce integrator, where he was General Counsel.
John E. Stransky was named Vice President and President - Life Fitness Division in February 2006. He was President of the Billiardsdivision from 1998 to 2005 and President - Brunswick Bowling & Billiards from February 2005 to February 2006.
Dale B. Tompkins has been Vice President - Strategy and Corporate Development since January 2003. He joined the Company in2000 as Vice President - Strategy and Business Development for the Mercury Marine Group.
Stephen M. Wolpert has been Vice President and President - US Marine Division since October 2003. From 2001 to 2003, he held anumber of positions with US Marine, including, most recently, Chief Operating Officer. Prior to joining Brunswick, he was VicePresident - Manufacturing Strategies and Industrial Automation for Emerson Electric Company.
Judith P. Zelisko has been Vice President - Tax of the Company since 1998. She was Staff Vice President - Tax from 1996 to 1998.
13

PART II
Item 5. Market for Registrant’s Common Equity; Related Stockholder Matters and Issuer Purchases of Equity Securities
The Company’s common stock is traded on the New York, Chicago, Pacific and London Stock exchanges. Quarterly informationwith respect to the high and low prices for the common stock and the dividends declared on the common stock is set forth in Note 19.Quarterly Data in the Notes to Consolidated Financial Statements. As of February 24, 2006, there were 14,143 shareholders of record ofthe Company’s common stock.
In October 2005, the Company announced its annual dividend on its common stock of $0.60 per share, payable in December 2005.The Company intends to continue t o pay annual dividends at the discretion of the Board of Directors, subject t o continued capitalavailability and a determination that cash dividends continue to be in the best interest of the Company’s stockholders. The Company’sdividend policy may be affected by, among other things, the Company’s views on potential future capital requirements, including thoserelating to investments and acquisitions.
On May 4, 2005, the Company’s Board of Directors authorized a $200 million share repurchase program, which will be funded withavailable cash. The Company expects to repurchase shares on the open market or in private transactions from time to time, depending onmarket conditions. The Company repurchased approximately 1.9 million shares under this program during the second half of 2005 for$76.0 million as discussed in Note 18. Share Repurchase Program in the Notes to the Consolidated Financial Statements.
The Company’s 1996 Preferred Share Purchase Right Plan will expire by its terms on April 1, 2006. See Note 16. Preferred SharePurchase Rights in the Notes to Consolidated Financial Statements for more details.
Issuer Purchases of Equity Securities
Total Numberof Shares (or
Units)Purchased
AveragePrice Paid
per Share (orUnit)
Total Number ofShares (or Units)
Purchased as Part ofPublicly AnnouncedPlans or Programs
Maximum Number (orApproximate Dollar
Value) that May Yet BePurchased Under thePlans or Programs (A)
(amounts in thousands)Period
10/1/05 - 10/31/05 1,000,000 $
37.77 1,000,000 $
146,51811/1/05 - 11/30/05 567,700 39.64 567,700 124,01312/1/05 - 12/31/05 — — — 124,013
Total Stock Repurchases 1,567,700 $ 38.45
1,567,700 $ 124,013
(A) On May 4, 2005, the Company’s Board of Directors authorized a $200 million share repurchase program, to be funded with available cash. The Company expectsto repurchase shares on the open market or in private transactions from time to time, depending on market conditions. The Company repurchased approximately1.9 million shares under this program during the second half of 2005 for $76.0 million as discussed in Note 18. Share Repurchase Program in the Notes to theConsolidated Financial Statements.
14

Item 6. Selected Financial Data
The selected historical financial data presented below as of and for the years ended December 31, 2005, 2004 and 2003, have beenderived from, and should be read in conjunction with, the historical consolidated financial statements of the Company, including the notesthereto, and Item 7. Management’s Discussion and Analysis of Financial Condition and Results of Operations, including the MattersAffecting Comparability section. The selected historical financial data presented below as of and for the years ended December 31,2002, 2001 and 2000, have been derived from the consolidated financial statements of the Company that are not included herein. Thefinancial data presented below have been restated to present the discontinued operations in accordance with Accounting Principles Board(APB) Opinion No. 30, “Reporting the Results of Operations — Reporting the Effects of a Segment of a Business, and Extraordinary,Unusual and Infrequently Occurring Events and Transactions.”
(In millions, except per share data) 2005 2004 2003 2002 2001 2000 Results of operations data Net sales $ 5,923.8 $ 5,229.3 $ 4,128.7 $ 3,711.9 $ 3,370.8 $ 3,811.9 Unusual charges $ — $ — $ — $ — $ — $ 55.1 Operating earnings $ 478.6 $ 400.7 $ 221.4 $ 196.6 $ 191.1 $ 397.1 Earnings before interest and taxes $ 534.0 $ 413.6 $ 230.7 $ 199.9 $ 179.5 $ 384.5 Earnings before income taxes $ 495.8 $ 378.5 $ 201.1 $ 161.6 $ 132.2 $ 323.3 Earnings from continuing operationsbeforeaccounting change
$ 385.4 $ 269.8 $ 135.2 $ 103.5 $ 84.7 $ 202.2
Discontinued operations: Loss from discontinuedoperations, net of tax
— — — — — (68.4)Loss from disposal of discontinuedoperations, net of tax
— — — — — (229.6)Cumulative effect of changes inaccountingprinciple, net of tax (A)
— — — (25.1) (2.9) —
Net earnings (loss) $ 385.4 $ 269.8 $ 135.2 $ 78.4 $ 81.8 $ (95.8)Basic earnings (loss) per commonshare:
Earnings from continuing operationsbeforeaccounting change
$ 3.95 $ 2.82 $ 1.48 $ 1.15 $ 0.96 $ 2.28
Discontinued operations:
Loss from discontinuedoperations, net of tax
— — — — — (0.77)Loss from disposal of discontinuedoperations, net of tax
— — — — — (2.59)Cumulative effect of changes inaccountingprinciple, net of tax (A)
— — — (0.28) (0.03) —
Net earnings (loss) $ 3.95 $ 2.82 $ 1.48 $ 0.87 $ 0.93 $ (1.08)Average shares used for computationofbasic earnings per share
97.6 95.6 91.2 90.0 87.8 88.7
Diluted earnings (loss) per commonshare:
Earnings from continuing operationsbeforeaccounting change
$ 3.90 $ 2.77 $ 1.47 $ 1.14 $ 0.96 $ 2.28
Discontinued operations: Loss from discontinuedoperations, net of tax
— — — — — (0.77)Loss from disposal of discontinuedoperations, net of tax — — — — — (2.59)
Cumulative effect of changes inaccountingprinciple, net of tax (A)
— — — (0.28) (0.03) —
Net earnings (loss) $ 3.90 $ 2.77 $ 1.47 $ 0.86 $ 0.93 $ (1.08)Average shares used for computation

ofdiluted earnings per share
98.8 97.3 91.9 90.7 88.1 88.7
(A) In 2002, the Company adopted SFAS No. 142, Goodwill and Other Intangible Assets, which resulted in a $25.1 million ($0.28 per share) charge as the cumulativeeffect of the change in accounting principle. In 2001, the Company adopted SFAS No. 133, Accounting for Derivatives and Hedging Activities, which resulted ina $2.9 million ($0.03 per share) charge as the cumulative effect of the change in accounting principle.
15

(In millions, except per share andother data)
2005 2004 2003 2002 2001 2000 Balance sheet data Total assets $ 4,621.5 $ 4,346.4 $ 3,602.5 $ 3,314.7 $ 3,157.5 $ 3,396.5 Debt
Short-term $ 1.1 $ 10.7 $ 23.8 $ 28.9 $ 40.0 $ 172.7 Long-term 723.7 728.4 583.8 589.5 600.2 601.8
Total debt 724.8 739.1 607.6 618.4 640.2 774.5 Common shareholders’ equity 1,978.8 1,712.3 1,323.0 1,101.8 1,110.9 1,067.1
Total capitalization $ 2,703.6 $ 2,451.4 $ 1,930.6 $ 1,720.2 $ 1,751.1 $ 1,841.6 Cash flow dataNet cash provided by operatingactivities of
continuing operations
$ 432.9 $ 415.2 $ 395.1 $ 413.0 $ 299.3 $ 251.0
Depreciation and amortization 162.2 157.5 150.6 148.4 160.4 148.8 Capital expenditures 233.6 171.3 159.8 112.6 111.4 156.0 Acquisitions of businesses 135.5 267.8 177.3 21.2 134.4 — Investments 23.3 16.2 39.3 8.9 — 38.1 Stock repurchases 76.0 — — — — 87.1 Cash dividends paid 57.3 58.1 45.9 45.1 43.8 44.3 Other dataDividends declared per share $ 0.60 $ 0.60 $ 0.50 $ 0.50 $ 0.50 $ 0.50 Book value per share 20.03 17.60 14.40 12.15 12.61 12.22 Return on beginning shareholders’equity 22.5% 20.4% 12.3% 7.0% 7.7% (7.4)%Effective tax rate 22.3% 28.7% 32.8% 36.0% 36.0% 37.5%Debt-to-capitalization rate 26.8% 30.2% 31.5% 35.9% 36.6% 42.1%Number of employees 27,500 25,600 23,225 21,015 20,700 23,200 Number of shareholders of record 14,143 14,952 15,373 16,605 13,200 13,800 Common stock price (NYSE)
High $ 49.50 $ 49.85 $ 32.08 $ 30.01 $ 25.01 $ 22.13 Low 35.09 31.25 16.35 18.30 14.03 14.75
Close (last trading day) 40.66 49.50 31.83 19.86 21.76 16.44
The Notes to Consolidated Financial Statements should be read in conjunction with the above summary.
16

Item 7. Management’s Discussion and Analysis of Financial Condition and Results of Operations
Certain statements in Management’s Discussion and Analysis are forward-looking as defined in the Private Securities LitigationReform Act of 1995. These statements are based on current expectations that are subject to risks and uncertainties. Actual results maydiffer materially from expectations as of the date of this filing because of factors discussed in Item 1A. Risk Factors in this AnnualReport.
Overview and Outlook
General
In 2005, the Company made significant progress toward achieving its strategic objective to solidify its leadership position in themarine, fitness and bowling & billiards industries by:
– Introducing innovative and new technologies to build reliable and high-quality products in all of the Company’s marketsegments;
– Focusing on cost reduction initiatives through global sourcing and realignment of the Company’s manufacturing footprint;
– Acquiring and investing in businesses that will expand and enhance the Company’s product offerings, particularly in boats andparts & accessories;
– Strengthening the Company’s relationships with its dealers by providing additional products and services that will make them
more successful, improve the customer experience and, in turn, make Brunswick more successful; and
– Continuing to expand and enhance the Company’s global manufacturing footprint to achieve the best-cost position.
While these activities are ongoing, the Company continued to see positive overall results from its efforts reflected in its financialperformance. Sales in 2005 increased 13 percent to $5,923.8 million, primarily due to organic growth across the Boat, Marine Engine andBowling & Billiards segments, and additional sales associated with acquisitions. Fitness segment sales decreased due to the divestiture ofthe Omni retail stores in 2004. Operating earnings for 2005 increased 19 percent to $478.6 million, primarily due to the sales gains, aswell as effective cost management efforts and global sourcing initiatives. These factors helped offset expenses associated with theacquisitions completed in 2005 and 2004, the transition to low-emission engines, which carry lower margins, in the Company's MarineEngine segment and decreased absorption of fixed costs due to lower production levels that resulted from successful efforts to maintainhealthy marine pipeline inventories. The Company also incurred additional costs for investments in research and development, newmanufacturing plant start-ups, marketing for the new product launches and international operations to support future growth. See theResults of Operations section below for further discussion.
Accomplishments in support of the Company’s strategic objectives in 2005 include:
New products:
– The continued rollout of Mercury Marine’s Verado, a family of supercharged four-stroke outboard engines, into smaller four-cylinder models ranging from 135 to 175 horsepower, complementing the larger six-cylinder models, ranging from 200 to 275horsepower introduced in 2004;
– Development of three new naturally aspirated four-stroke outboard engines from 75 to 115 horsepower introduced in February2006;
– New boat models across all boat divisions, including the Boston Whaler Montauk 150, the first model to fully utilize theCompany’s High Performance Product Development (HPPD) process to integrate the design, engineering and manufacturingprocesses from start to finish;
– New cardiovascular and strength training fitness product offerings, including the Circuit series, designed to simplify and speedup the workout experience;
– Continued expansion of the new concept, larger, showcase Brunswick Zones; and
17

– New product offerings from Brunswick New Technologies (BNT), especially in the personal car navigation business.
Manufacturing realignment:
– Completed expansion of the boat manufacturing facility in Reynosa, Mexico, which doubled capacity and allowed theCompany to increase production of the Bayliner 175, Bayliner 185 and other runabout models;
– Completion of a new engine plant in China for the production of outboard engines in the 40 to 60 horsepower range;
– Expansion of the Sea Ray facility in Vonore, Tennessee, to increase production capacity for closed-mold manufacturingproduction of boat hulls, decks and parts while decreasing environmental emissions;
– Acquisition of a 165,000-square-foot facility in Swansboro, North Carolina, to expand capacity to meet the strong demand forthe Company’s sportfishing convertible and motoryacht models;
– Announcement of the relocation of the Company’s bowling ball manufacturing operations from Muskegon, Michigan, toReynosa, Mexico; and
– Expansion of the Company’s Brunswick Home & Billiard retail stores into the Denver and Boston markets.
Acquisitions:
– Purchase of Triton Boats, which adds bass fishing boats to the Company’s product portfolio and complements the existingfreshwater and aluminum boat brands;
– Purchase of the Albemarle and Harris Kayot boat brands to strengthen the Company’s presence in the offshore sportfishingand pontoon market segments; and
– Acquisition of Benrock and Kellogg Marine, which added significant capacity to the Company’s parts and accessoriesbusiness and provides an essential distribution hub in the northeastern United States.
International Operations:
– Increased investments in operations in Europe, Asia-Pacific and Latin America supporting international sales, which nowrepresent approximately 35 percent of consolidated net sales; and
– Purchase of the remaining 51 percent of Valiant rigid inflatable boats in Europe.
Returning Value to Shareholders:
– Initiated a $200 million stock repurchase program, buying back approximately 1.9 million shares of Brunswick common stockfor $76 million during 2005; and
– Maintained an annual dividend payment of $0.60 per share.
Looking ahead to 2006, the Company expects domestic retail demand for marine products to be flat with 2005 levels. The Companyestimates that industry growth, coupled with market share gains, success of new products, improved pricing and the full-year impact ofacquisitions completed in 2005, is expected to result in a low- to mid-single digit increase in marine sales in 2006. Sales for BNT areexpected to continue at a growth rate higher than the Company's other businesses, primarily from increases in sales of the Company’spersonal car navigation products. Fitness and Bowling & Billiards segment sales are expected to increase in the mid-single digits. Overall,sales are expected to increase 6 to 8 percent.
Operating earnings are expected to improve in 2006, benefiting from higher pricing across most market segments and slightly highervolumes, as well as the Company’s ongoing focus on effective cost management. Margin improvement in 2006 will be limited not onlyby slowing growth as compared to 2005, but also by the continued transition to low-emission outboard engines which carry lowermargins. The Company will also incur higher material costs, especially for aluminum used in the production of boats and marine engines,expenses for stock options and higher variable compensation costs. The Company expects 2006 Equity earnings to remain relatively flatcompared with 2005. The Company’s effective tax rate in 2006 is expected to be approximately 31 percent.
18

Matters Affecting Comparability
Acquisitions. Approximately 38 percent of the sales increase in 2005, when compared with 2004, can be attributed to sales from thefollowing acquisitions:
Date Name/Description Segment
4/01/04 Lowe, Lund, Crestliner Boat12/31/04 Sea Pro, Sea Boss and Palmetto (Sea Pro) Boat2/07/05 Benrock, Inc. (Benrock) Boat2/28/05 Albemarle Boats, Inc. (Albemarle) Boat4/29/05 MX Marine, Inc. (MX Marine) Marine Engine5/27/05 Triton Boat Company, L.P. (Triton) Boat6/20/05 Supra-Industria Textil, Lda. (Valiant) - 51 percent Marine Engine7/07/05 Kellogg Marine, Inc. (Kellogg) Boat9/16/05 Harris Kayot Marine, LLC (Harris Kayot) Boat
The Lowe, Lund and Crestliner boat brands provided the Company with the opportunity to offer products in all major aluminum boatsegments and to leverage engine synergies with the Company’s Mercury Marine operations. The Sea Pro, Sea Boss and Palmetto boatbrands provide the Company with the opportunity to offer a distinctive array of offshore saltwater fishing boats. Benrock expands theCompany’s geographic coverage of its parts and accessories distribution network serving the central and southern United Stated markets.Albemarle provides the Company with the opportunity to offer a more complete range of offshore sportfishing boats, building onofferings of the Hatteras brand. MX Marine provides a new channel for the Company’s offerings of global-positioning systems,navigation systems and other marine electronics. Triton adds bass boats to the Company’s product lineup, as well as a broader range ofsaltwater and aluminum fishing boats. Kellogg complements the Company’s previous acquisitions of Benrock and Land ‘N’ Sea andprovides an essential distribution hub in the northeastern United States. The Valiant brand of rigid inflatable boats enhances theCompany’s offerings in Europe. Harris Kayot advances the Company’s position in the pontoon market and complements the Company’sexisting boat portfolio with premium runabout and deckboat product lines.
Approximately 40 percent of the sales increase in 2004, when compared with 2003, can be attributed to sales from the followingacquisitions:
Date Name/Description Segment
6/10/03 Valley-Dynamo, LP (Valley-Dynamo) Bowling &Billiards
6/23/03 Land ‘N’ Sea Corporation (Land ‘N’ Sea) Boat6/23/03 Navman NZ Limited (Navman) - 70 percent Marine Engine9/02/03 Attwood Corporation (Attwood) Boat9/15/03 Protokon, LLC (Protokon) - 80 percent Fitness4/01/04 Lowe, Lund, Crestliner Boat
Valley-Dynamo, a manufacturer of commercial and consumer billiards, Air Hockey and foosball tables, added new products anddistribution channels to the Company’s billiards operations. Land ‘N’ Sea, a distributor of marine parts and accessories, and Attwood, amanufacturer of marine hardware and accessories, provided the Company with the distribution network, manufacturing capabilities andinfrastructure to develop and expand a boat parts and accessories business. Navman, a manufacturer of marine electronics and globalpositioning systems-based products, complemented the Company’s expansion into marine-based electronics and integration. Protokon, aHungarian steel fabricator and electronic equipment manufacturer, allowed the Company to reduce costs and increase manufacturingcapacity of fitness equipment, while better serving its fitness customers in Europe. The Lowe, Lund and Crestliner boat brands providedthe Company with the opportunity to offer products in all major aluminum boat segments and to leverage engine synergies with theCompany’s Mercury Marine operations.
Refer to Note 5. Acquisitions in the Notes to Consolidated Financial Statements for a detailed description of these acquisitions.
19

Investment sale gain, tax items and litigation charge. The comparison of net earnings per diluted share between 2005, 2004 and 2003,is affected by the gain on the sale of an investment, tax items and a litigation charge, which are described below. The effect of these itemson diluted earnings per share is as follows:
2005 2004 2003
Net earnings per diluted share - asreported $ 3.90 $ 2.77 $ 1.47 Investment sale gain (0.32) — — Tax items (0.33) (0.10) Litigation charge — — 0.18
Net earnings per diluted share — asadjusted $ 3.25 $ 2.67 $ 1.65
Management believes that presentation of earnings per diluted share excluding these items provides a more meaningful comparison tocurrent-period and prior-period results because there were no comparable items in 2005, 2004 or 2003.
– Investment Sale Gain: On February 23, 2005, the Company sold its investment of 1,861,200 shares in MarineMax, Inc.(MarineMax), its largest boat dealer, for $56.8 million, net of $4.1 million of selling costs, which included $1.1 million ofaccrued expenses. The sale was made pursuant to a registered public offering by MarineMax. As a result of this sale, theCompany recorded an after-tax gain of $31.5 million ($0.32 per diluted share) after utilizing previously unrecognized capitalloss carryforwards.
– Tax Items: In 2005, the Company reduced its tax provision by $32.6 million ($0.33 per diluted share) due primarily to taxbenefits from refinements in the calculation of prior years' extraterritorial income and the foreign sales corporation taxbenefit, and reassessment of tax reserves for underlying exposures. Additionally in 2005, the Company made a change inthe assertion under APB No. 23, “Accounting for Income Taxes - Special Areas” (APB 23) for certain foreign subsidiaries.The Company determined that approximately $52 million of undistributed net earnings from these foreign subsidiarieswere indefinitely reinvested in operations outside the United States. These earnings will provide the Company with theopportunity to continue to expand its global manufacturing footprint, fund future growth in foreign locations and shift theCompany’s acquisition focus to Europe and Asia. The Company’s current intentions meet the indefinite investment criteriaof APB No. 23. Additionally, the Company’s 2005 tax rate benefited from utilization of previously unrecognized losscarryforwards applied in connection with the MarineMax investment sale gain discussed above. See Note 8. Income Taxesin the Notes to Consolidated Financial Statements for further details. In 2004, the Internal Revenue Service completed its routine audit of tax years 1998 through 2001. Following the completionof the examination of this four-year period, the Company reduced its tax reserves and, consequently, its tax provision by $10million ($0.10 per diluted share).
– Litigation Charge: In 2003, the Company’s Life Fitness division settled a cross trainer patent infringement lawsuit with
Precor Incorporated for $25.0 million and future royalty payments. The Company recorded a $25.0 million pre-taxlitigation charge ($0.18 per diluted share) in operating earnings in 2003. The Company paid $12.5 million in September2003 and $12.5 million in June 2004 related to the charge.
20

Results of Operations
Consolidated
The following table sets forth certain ratios and relationships calculated from the Consolidated Statements of Income for the yearsended December 31, 2005, 2004 and 2003:
2005 vs. 2004 2004 vs. 2003 Increase/(Decrease) Increase/(Decrease) 2005 2004 2003 $ % $ % (In millions, except per share data) Net sales $ 5,923.8 $ 5,229.3 $ 4,128.7 $ 694.5 13.3% $ 1,100.6 26.7%Gross margin(A) 1,424.6 1,314.2 997.1 110.4 8.4% 317.1 31.8%Operating earnings 478.6 400.7 221.4 77.9 19.4% 179.3 81.0%Net earnings $ 385.4 $ 269.8 $ 135.2 $ 115.6 42.8% $ 134.6 99.6%
Diluted earnings per share $ 3.90 $ 2.77 $ 1.47 $ 1.13 40.8% $ 1.30 88.4% Expressed as a percentage ofnet sales Gross margin(A) 24.0% 25.1% 24.2% (110) bpts 90 bpts Selling, general andadministrativeexpense
13.5% 14.9% 15.3% (140) bpts (40) bpts
Research & development 2.4% 2.5% 2.9% (10) bpts (40) bpts Operating margin 8.1% 7.7% 5.4% 40 bpts 230 bpts
__________
bpts = basis points
(A) Gross margin is defined as Net sales less Cost of sales as presented in the Consolidated Statements of Income.
2005 vs. 2004
The increase in net sales in 2005 was due to higher Boat, Marine Engine and Bowling & Billiards segment sales performance.Approximately 62 percent of the increase in net sales was from organic growth, defined as net sales from the Company’s businesses thathave operating results in comparable periods presented. The remaining growth was due to acquisitions completed in 2005 and 2004. Boththe Boat and Marine Engine segments benefited from an improved marine market, particularly in the first half of the year, and higherpricing in 2005. Organic sales growth from the Boat segment resulted from higher wholesale shipments to boat dealers domestically andinternationally, most notably for the Sea Ray, Boston Whaler and Hatteras brands, favorable pricing for US Marine and Sea Ray and apositive mix shift to higher-priced cruisers and sportyachts for Sea Ray. Marine Engine segment net sales, which includes the Company’sMercury Marine and Brunswick New Technologies (BNT) operations, increased primarily due to higher revenues from outboard enginesand sterndrives as a result of growth in international markets, growth in Mercury Marine's parts and service business and higher sales ofnavigation products in international markets.
International sales increased $360.0 million to $2,049.2 million in 2005. Sales increased across all international regions with thelargest impact coming from Europe and the Asia-Pacific region, which increased by $208.8 million and $59.5 million, respectively. Thisincrease was primarily due to an increase in sales of personal car navigation products, boats and outboard engines.
The Company’s gross margin percentage decreased 110 basis points in 2005 to 24.0 percent from 25.1 percent in 2004. This decreasewas the result of the transition to low-emission outboard engines in the second half of the year, which carry lower margins than thecarbureted two-stroke outboards they are replacing; lower fixed cost absorption and inefficiencies due to lower production rates during thesecond half of 2005 as a result of the Company’s effort to reduce marine customer inventory levels, especially for the Company’saluminum boat businesses; and costs required to start up the Company’s manufacturing capacity in China to produce outboard enginesand boats. These factors were partially offset by favorable pricing in the Boat and Marine Engine segment, a higher mix of BNT sales in2005, which generally carry a higher gross margin, and reduced warranty costs as a result of quality improvements.
21

Selling, general and administrative (SG&A) expenses as a percentage of net sales decreased 140 basis points to 13.5 percent of sales,down from 14.9 percent of sales in 2004. During 2005, SG&A expenses increased $18.9 million to $801.3 million, primarily due toacquisitions; research, development and marketing investments in new products; and expenses related to the dispute with a Chinesesupplier as discussed in Note 9. Commitments and Contingencies in the Notes to Consolidated Financial Statements recorded in theCompany’s Bowling & Billiards segment. These factors were largely offset by lower variable compensation expenses, $6.7 million inreduced compensation expense from the Company’s CEO transition and the elimination of operating expenses due to the divestiture of theOmni fitness retail stores in the fourth quarter of 2004. SG&A expenses also benefited from a reduction in bad debt reserves due toimproved international customer payment performance and the improved financial condition of certain domestic customers.
Operating earnings increased to $478.6 million in 2005 from $400.7 million in 2004. The increase in operating earnings wasprimarily due to the increase in sales, partially offset by the factors affecting gross margin percentage and SG&A expenses as discussedabove. Additionally, the Company increased its investment in research and development by $13.6 million in 2005 compared to 2004.
Interest expense increased $8.0 million in 2005 compared with 2004, primarily due to the full year impact of debt issued in mid-2004and the effects of higher short-term interest rates. See Note 12. Debt in the Notes to Consolidated Financial Statements for details on theissuance of the debt. Interest income increased $4.9 million in 2005 compared with 2004 as a result of higher average cash balances andhigher interest rates.
In 2005, the Company sold 1,861,200 shares of common stock of MarineMax, Inc. (MarineMax), its largest boat dealer. Proceedsfrom this stock sale totaled $56.8 million, net of $4.1 million of selling expenses, which included $1.1 million of accrued expenses. Thissale generated a pre-tax gain of $38.7 million for the Company. See Note 6. Investments in the Notes to Consolidated FinancialStatements for details on the sale of this investment.
The lower effective tax rate in 2005 was due primarily to refinements in the calculation of prior years' extraterritorial income andthe foreign sales corporation tax benefit, and reassessment of tax reserves for underlying exposures, offset by a reduction in tax reservesin 2004. Additionally in 2005, the Company made a change in the assertion under APB No. 23 for previously undistributed earnings ofcertain foreign subsidiaries. The Company determined that approximately $52 million of undistributed net earnings from these foreignsubsidiaries were indefinitely reinvested in operations outside the United States. These earnings will provide the Company with theopportunity to continue to expand its global manufacturing footprint, fund future growth in foreign locations and shift the Company’sacquisition focus to Europe and Asia. The Company’s current intentions meet the indefinite investment criteria of APB No. 23.Additionally, the Company’s 2005 tax rate benefited from utilization of previously unrecognized loss carryforwards applied inconnection with the MarineMax investment sale gain discussed above. The 2005 effective tax rate was further favorably impacted byhigher foreign earnings in lower effective tax rate jurisdictions. See Note 8. Income Taxes in the Notes to Consolidated FinancialStatements for further details
Excluding the tax benefits of these items, the Company’s effective tax rate for 2005 was 29.7 percent compared to 31.4 percent in2004, which also excludes the 2004 tax reserve reduction described in the following 2004 vs. 2003 section. Management believes thatpresentation of the effective tax rate, excluding the investment sale gain and other non-recurring tax benefits in both years, provides amore meaningful comparison because the investment sale gain and non-recurring tax benefits are unique to their respective periods, and,accordingly, there are no comparable items in either 2005 or 2004.
Net earnings and diluted earnings per share increased, primarily due to the same factors discussed above in operating earnings, thegain on sale of the Company’s investment in MarineMax and the lower effective tax rate. Excluding this gain, the tax reserve reductionand other non-recurring tax benefits, diluted earnings per share would have been $3.25 per diluted share in 2005 compared with $2.67 perdiluted share in 2004, which excludes the 2004 tax reserve reduction described in the following 2004 vs. 2003 section. Managementbelieves that presentation of the diluted earnings per share, excluding this gain and non-recurring tax benefits, provides a more meaningfulcomparison because the investment sale gain and non-recurring tax benefits are unique to their respective periods, and, accordingly, thereare no comparable items in either 2005 or 2004.
Weighted average common shares outstanding used to calculate diluted earnings per share increased to 98.8 million in 2005 from 97.3million in 2004. The increase in average shares outstanding was primarily due to the exercise of stock options during 2005 and 2004,partially offset by the repurchase of approximately 1.9 million shares in the second half of 2005 as discussed in Note 18. ShareRepurchase Program in the Notes to Consolidated Financial Statements.
22

2004 vs. 2003
Sales increased 26.7 percent as the Company reported sales gains across all reportable segments. Approximately 60 percent of theincrease in sales was from organic growth, defined as sales from the Company’s businesses that have operating results in comparableperiods presented. Both the Marine Engine and Boat segments benefited from an improved marine market. Organic sales growth for theMarine Engine segment was largely due to higher wholesale shipments of outboard and sterndrive engines in domestic markets, as well ashigher sales of GPS-based products at Navman and higher wholesale shipments of outboard engines in international markets. Organicsales growth for the Boat segment was due to higher shipments across most boat brands in both domestic and international markets due tothe success of new products, increased customer demand and favorable pricing. Organic sales growth for the Fitness segment was theresult of higher domestic and international commercial sales related to the success of new models. Organic sales growth for the Bowling& Billiards segment was due to higher sales volume of bowling capital equipment and consumer products, as well as higher bowlingcenter revenues and increased sales of billiard tables and equipment.
International sales increased $447.0 million to $1,689.2 million in 2004 compared with $1,242.2 million in 2003. Sales increasedacross all international regions, with the largest impact coming from Europe, the Pacific Rim and Canada, which increased by $245.1million, $92.4 million and $73.3 million, respectively. This increase is due to an increase in boat and outboard engine sales, the benefit ofa weaker U.S. dollar and additional revenues associated with acquisitions.
Gross margin percentage increased in 2004 compared with 2003 primarily due to the favorable impact associated with 2004 and 2003acquisitions; favorable pricing in the Boat and Marine Engine segments; increased sales of higher horsepower, higher margin engines;operational efficiencies due to higher production levels; the benefit of a weaker dollar and successful cost reduction initiatives. Thesefactors were partially offset by higher compensation costs, a mix shift in outboard engines to lower-margin, low-emission engines, and amix shift to lower margin strength equipment and higher materials costs in the Fitness segment. In addition, lower pension costs weremostly offset by higher healthcare and insurance costs.
Selling, general and administrative expenses, as a percentage of net sales, decreased 40 basis points in 2004 primarily due to theincrease in sales volume. SG&A expenses increased by $149.9 million to $782.4 million in 2004 from $632.5 million in 2003. Thisincrease is attributable to the acquisitions completed in 2004 and 2003, which accounted for approximately 36 percent of the increase,higher compensation costs and promotional expenses for new product launches.
Operating earnings increased to $400.7 million in 2004 from $246.4 million in 2003, excluding the previously mentioned 2003litigation charge. Management believes that presentation of operating earnings in 2003, excluding this litigation charge, provides a moremeaningful comparison to current-period results, because there was no comparable litigation charge in 2004 operating earnings. Theincrease in operating earnings was primarily due to the increase in sales volumes in all reportable segments and the factors affecting grossmargin percentage as described above. These factors were partially offset by the increase in SG&A expenses as discussed above, higherresearch and development expenses across most segments driven by acquisitions completed in 2004 and 2003, and competitive pricingpressures in the Asia-Pacific region in the Marine Engine segment.
Operating earnings were also unfavorably affected by approximately $25 million in 2004 compared with 2003, primarily attributableto the marketing and production start-up of the new Verado family of four-stroke outboard engines, start-up and other expenses associatedwith the construction of an outboard engine assembly plant in China, and expenses to develop a new boat design process to better integrateengine and marine electronics into original boat designs.
Interest expense increased by $4.2 million to $45.2 million in 2004 compared with $41.0 million in 2003, primarily due to theissuance of new debt described in Note 12. Debt in the Notes to Consolidated Financial Statements.
Equity earnings increased to $18.1 million in 2004 compared with $9.9 million in 2003, primarily due to improved results from theCummins MerCruiser Diesel Marine, LLC joint venture and holding a 49% interest in Brunswick Acceptance Company, LLC for the fullyear.
The Company’s effective tax rate was reduced to 28.7 percent in 2004 from 32.8 percent in 2003. The lower effective tax rate for theyear was primarily due to a tax reserve reassessment of $10.0 million arising from the completion of Federal tax audit examinations ofyears 1998 to 2001, and higher foreign a n d state earnings in lower effective tax rate jurisdictions. Excluding the $10.0 millionreassessment in tax reserves, the Company’s effective tax rate for 2004 was 31.4 percent. Management believes that the presentation ofthe effective tax rate in 2004, excluding this tax reserve reassessment, provides a more meaningful comparison to 2003, because there wasno comparable tax reserve reassessment in 2003.
Average common shares outstanding used to calculate diluted earnings per share increased to 97.3 million in 2004 from 91.9 millionin 2003. The increase in average diluted outstanding shares was due to the exercise of stock options and an increase in common stockequivalents due to an increase in the Company’s average stock price during the period. Segments
The Company operates in four reportable segments: Boat, Marine Engine, Fitness and Bowling & Billiards. Refer to Note 4.Segment Information in the Notes to Consolidated Financial Statements for details on the operations of these segments.

23

Boat Segment
The following table sets forth Boat segment results for the years ended December 31, 2005, 2004 and 2003:
2005 vs. 2004 2004 vs. 2003 Increase Increase 2005 2004 2003 $ % $ % (In millions) Net sales $ 2,769.8 $ 2,271.1 $ 1,616.9 $ 498.7 22.0% $ 654.2 40.5%Operating earnings $ 192.1 $ 149.3 $ 63.9 $ 42.8 28.7% $ 85.4 NM
Operating margin 6.9% 6.6% 4.0% 30 bpts 260bpts
Capital expenditures $ 74.6 $ 56.3 $ 38.5 $ 18.3 32.5% $ 17.8 46.2%__________ bpts=basis points
NM=not meaningful
2005 vs. 2004
Sales from the acquisitions completed in 2005 and 2004 accounted for approximately 52 percent of the increase in segment sales in2005. Organic sales growth, driven by an improved marine market particularly in the first half of 2005, resulted from higher wholesaleshipments to both domestic and international boat dealers, most notably for Sea Ray, Boston Whaler and Hatteras, favorable pricing acrossmost fiberglass boat brands and a positive mix shift to higher-priced cruisers and sportyachts for Sea Ray. These sales increases werepartially offset by lower sales of aluminum boats due to weak market conditions in the upper Midwest and actions taken by the Companyto reduce inventories held by dealers.
The increase in operating earnings was primarily due to the increase in sales, successful cost reduction initiatives and operationalefficiencies. Operating earnings also benefited from the favorable mix shift to more profitable cruisers and sportyachts and the 2004completion of the amortization of an intangible asset from the 1986 acquisition of Sea Ray. Boat segment operating earnings wereunfavorably impacted by higher research and development expenses, lower sales volume from the Company’s aluminum boat brands andhigher material costs. Operating earnings were also negatively affected in the second half of 2005 b y lower fixed cost absorption,resulting from the decrease in production volumes necessary to maintain healthy boat pipeline inventories, most notably for the aluminumboat brands.
The increase in capital expenditures was primarily for tooling for the production o f new models, acquisition of a manufacturingfacility in North Carolina to expand capacity for production of Hatteras sportfishing convertibles and motoryachts and capital spendingrelated to the acquisitions described above.
2004 vs. 2003
Sales from the Lund, Lowe, Crestliner, Attwood and Land ‘N’ Sea acquisitions completed in 2004 and 2003, accounted forapproximately 54 percent of the increase in Boat segment sales in 2004. Organic sales growth resulted from higher wholesale shipments toboat dealers domestically and internationally, most notably for Sea Ray, Bayliner and Boston Whaler, driven by an improved marinemarket, the successful introduction of new models and favorable pricing.
The increase in operating earnings was primarily due to the increase in sales, the impact of acquisitions completed in 2004 and 2003,favorable pricing, cost reduction initiatives and operational efficiencies. Also, operating earnings benefited from profitability at thesegment’s US Marine division compared with operating losses in the prior year. The turnaround in operating earnings for US Marine wasdriven by higher domestic and international sales volume across most of its boat brands due to the success of new models, highercustomer demand and operational efficiencies due to the higher production levels. Boat segment operating earnings were unfavorablyimpacted by expenses associated with the acquisitions completed in 2004 and 2003, an increase in compensation costs and higher researchand development expenses, which were primarily associated with acquisitions completed in 2004.
The increase in capital expenditures was primarily for tooling for the production o f new models, expansion of a Bayliner boat
manufacturing plant in Reynosa, Mexico, and capital expenditures associated with the acquisitions completed in 2004 and 2003.
24

Marine Engine Segment
The following table sets forth Marine Engine segment results for the years ended December 31, 2005, 2004 and 2003:
2005 vs. 2004 2004 vs. 2003 Increase/(Decrease) Increase 2005 2004 2003 $ % $ % (In millions) Net sales $ 2,638.7 $ 2,353.2 $ 1,908.9 $ 285.5 12.1% $ 444.3 23.3%Operating earnings $ 260.7 $ 243.2 $ 171.1 $ 17.5 7.2% $ 72.1 42.1%
Operating margin 9.9% 10.3% 9.0% (40) bpts 130bpts
Capital expenditures $ 101.5 $ 76.4 $ 68.1 $ 25.1 32.9% $ 8.3 12.2%__________
bpts=basis points
2005 vs. 2004
The Marine Engine segment includes the Company’s Mercury Marine and Brunswick New Technologies (BNT) operations. In 2005,net sales for Mercury Marine of $2,289.1 million increased primarily due to higher revenues from outboard engines and sterndrives as aresult of growth in international markets, higher sales prices resulting from a greater mix of low-emission outboard engines, which havehigher prices, and growth in the marine parts and service business. Net sales for BNT of $349.6 million increased 76 percent from $199.2million in 2004 as a result of higher demand for navigation products in international markets.
The increase in operating earnings of Mercury Marine was primarily due to the increase in sales, cost-containment actions, reducedwarranty costs as a result of quality improvements, a reduction in bad debt reserves due to improved international customer paymentperformance and the improved financial condition of certain domestic customers and lower variable compensation costs. These factorswere partially offset by strategic investments for increased marketing and promotional activities for the four-cylinder superchargedVerado engines and start-up costs associated with both the new outboard engine manufacturing facility in China, as well as expenses for anew four-stroke production line. In the second half of 2005, Mercury Marine operating earnings were also negatively impacted by thetransition to lower margin low-emission outboard engines and lower fixed cost absorption as a result of reduced production levels tomaintain balanced pipeline inventories. Higher operating earnings for BNT were primarily due to the increase in sales, especially fromglobal positioning systems-based products, which was largely offset by higher selling, general and administrative expenses to support thebusiness’ growth and an increase in BNT’s investment in research and development. In 2005, Marine Engine segment operating marginsalso decreased as a result of a higher mix of BNT sales, which, in 2005, had lower operating margins than the sales of Mercury Marine.
The increase in capital expenditures was primarily due to investments for the development of the new line of 75, 90 and 115horsepower naturally aspirated, four-stroke outboard engines to be launched in early 2006 and completion of the four-cylindersupercharged Verado engine for Mercury Marine.
2004 vs. 2003
Marine Engine segment sales benefited from an increase in wholesale shipments of outboard and sterndrive engines in domesticmarkets due to an improved marine market in 2004, the full year impact of the Navman acquisition and an increase in sales of parts andservice businesses, which includes non-traditional marine products, such as castings and rigging systems. International sales also increaseddue to higher wholesale shipments of outboard engines and the benefit of a weaker U.S. dollar.
Operating earnings increased primarily due to the increase in sales volume; the impact of a weaker U.S. dollar; additional revenuesassociated with sales of higher margin, higher horsepower engines; increased absorption of fixed costs due to higher production levels,and successful cost reduction initiatives. These benefits were partially offset by higher compensation costs; a mix shift in outboard enginesto lower margin, low-emission engines; marketing and start-up expenses and higher research and development expenses associated withthe new Verado family of four-stroke outboard engines; start-up and other costs associated with the construction of a new outboard enginemanufacturing facility in China; higher research and development expenses associated with BNT and competitive pricing pressures in theAsia-Pacific region.
The increase in capital expenditures was primarily due to investments in the new China plant for the production of four-strokeoutboard engines in the 40 to 60 horsepower range and a new Verado manufacturing line at a facility in Fond du Lac, Wisconsin.
25

Fitness Segment
The following table sets forth Fitness segment results for the years ended December 31, 2005, 2004 and 2003:
2005 vs. 2004 2004 vs. 2003 Increase/(Decrease) Increase/(Decrease) 2005 2004 2003 $ % $ % (In millions) Net sales $ 551.3 $ 558.3 $ 486.6 $ (7.0) (1.3)% $ 71.7 14.7%Operating earnings(A) $ 56.3 $ 45.2 $ 29.8 $ 11.1 24.6% $ 15.4 51.7%Operating margin(A) 10.2% 8.1% 6.1% 210 bpts 200 bpts Capital expenditures $ 11.1 $ 8.3 $ 14.9 $ 2.8 33.7% $ (6.6) (44.3)%
________
bpts=basis points
(A) Operating earnings and Operating margin for the year ended 2003 included a $25.0 million pre-tax litigation charge discussed in Note 9. Commitments andContingencies in the Notes to Consolidated Financial Statements and Matters Affecting Comparability above. Operating margin excluding the $25.0 millionpre-tax litigation charge was 11.3 percent.
2005 vs. 2004
The decrease in Fitness segment sales in 2005 was primarily attributable to the divestiture of the Omni retail stores in 2004.Excluding Omni, net sales increased by $12.6 million to $551.3 million from $538.7 million in 2004. Management believes thatpresentation of net sales excluding the net sales from Omni provides a more meaningful comparison to the prior period, as there were nocomparable net sales from Omni in 2005. This increase in net sales was primarily due to increased commercial sales of cardiovascularequipment in the domestic and international markets, partially offset by international competitive pricing pressures.
Operating earnings increased as a result of the positive mix shift to higher-margin cardiovascular equipment, lower manufacturingcosts, the absence of Omni operating expenses in 2005 and continued successful cost containment efforts. These factors were offset byhigher freight, distribution and raw material costs.
Capital expenditures for 2005 were primarily related to tooling and software costs f o r new product development, as well asequipment for the Hungary manufacturing facility.
2004 vs. 2003
Fitness segment sales increased in 2004 primarily due to greater demand for strength and cardiovascular equipment in both domesticand international markets partly due to the introduction of new models in late 2003. International sales also benefited from the weakerU.S. dollar. The increase in sales was partially offset by decreased retail sales at the Company’s Omni Fitness stores, which were soldduring 2004.
Operating earnings in 2003 include a $25.0 million litigation charge recorded in the first quarter of 2003. Management believes thatpresentation of operating earnings in 2003, excluding this litigation charge, provides a more meaningful comparison to the current-yearresults because there was no comparable litigation charge that affected 2004. Excluding this charge, operating earnings decreased $9.6million to $45.2 million in 2004 from $54.8 million in 2003, and operating margins decreased 320 basis points to 8.1 percent in 2004when compared with 2003. The decrease in operating earnings was driven by a mix shift toward lower-margin strength equipment, highersteel and other raw material costs, higher freight and distribution costs, competitive pricing pressures in the European commercial marketsand increased bad debt expense due to the bankruptcy filing of a consumer fitness retail chain. These factors were partially offset by theincrease in sales volume and successful cost containment efforts.
Capital expenditures in 2004 were primarily for the expansion of a plant in Hungary for the production of strength and cardiovascularequipment, including cross-trainers, operational improvements and product expansion programs.
26

Bowling & Billiards Segment
The following table sets forth Bowling & Billiards segment results for the years ended December 31, 2005, 2004 and 2003:
2005 vs. 2004 2004 vs. 2003 Increase/(Decrease) Increase/(Decrease) 2005 2004 2003 $ % $ % (In millions) Net sales $ 464.5 $ 442.4 $ 392.4 $ 22.1 5.0% $ 50.0 12.7%Operating earnings $ 37.2 $ 41.7 $ 25.6 $ (4.5) (10.8)% $ 16.1 62.9%Operating margin 8.0% 9.4% 6.5% (140) bpts 290 bpts Capital expenditures $ 36.8 $ 27.7 $ 34.8 $ 9.1 32.9% $ (7.1) (20.4)%
__________
bpts=basis points
2005 vs. 2004
Bowling & Billiards segment net sales increased due to higher sales volume of bowling equipment, primarily in Europe and Asia, andhigher bowling center revenues partly from three new bowling centers in 2005 and two new bowling centers in 2004. These increaseswere partially offset by the disposition of four bowling centers in 2005 and three bowling centers in 2004 and lower sales of billiard tables.
Operating earnings decreased $4.5 million primarily as a result of expenses related to the dispute with a Chinese supplier as discussedin Note 9. Commitments and Contingencies in the Notes to Consolidated Financial Statements, costs associated with the transfer ofbowling ball production from the segment’s Muskegon, Michigan, facility to Mexico, as well as higher distribution and freight costs forbilliard products. These factors were partially offset by the sales increase in bowling equipment, higher bowling center revenues,increased gains on the sale of bowling centers and a decrease in general liability expense and accruals as a result of positive claimsexperience from the implementation of successful safety initiatives in retail bowling centers.
Capital expenditures in 2005 were primarily related to the costs incurred in the acquisition and construction of new bowling centersand the normal capital requirements of existing centers, as well as costs incurred in the transfer of the Company’s bowling ball productionto Mexico.
2004 vs. 2003
Sales from the Valley-Dynamo acquisition completed in 2003 accounted for approximately 29 percent of the increase in segmentsales in 2004. Organic sales increased primarily due to increased sales volume of bowling equipment in both the domestic andinternational markets, driven by increased demand for new products, most notably the Vector scoring system, center management systemsand Inferno bowling balls, and an increase in consumer products partially offset by a decrease in after-market products. In addition, theincrease in sales was due to higher bowling center revenues, partially as a result of the opening of two new bowling centers, and highersales of billiard tables and equipment.
Operating earnings benefited primarily from the higher sales volume, cost reduction programs and the recognition of a gainassociated with the divestiture of three bowling centers. This benefit was partially offset by increased expenses to support and promotenew products, higher compensation costs and bad debt expense associated with the bankruptcy of a customer.
Capital expenditures includes the construction of two new bowling centers, completed i n the second quarter of 2004, and theconversion of eight bowling centers to Brunswick Zones, which are modernized bowling centers that offer a full array of family-orientedentertainment activities.
27

Cash Flow, Liquidity and Capital Resources
The following table sets forth an analysis of cash flow for the years ended December 31, 2005, 2004 and 2003:
2005 2004 2003 (In millions) Net cash provided by operating activities $ 432.9 $ 415.2 $ 395.1 Net cash provided by (used for):
Capital expenditures (233.6) (171.3) (159.8)Pre-tax investment sale proceeds 57.9 — — Proceeds on the sale of property, plant and equipment 13.4 13.4 7.5 Other, net (1.7) 2.0 (3.0)
Free cash flow* $ 268.9 $ 259.3 $ 239.8 __________
* The Company defines Free cash flow as cash flow from operating and investing activities (excluding cash used for acquisitions and investments) excludingfinancing activities. Free cash flow is not intended as an alternative measure of cash flow from operations, as determined in accordance with generally acceptedaccounting principles (GAAP) in the United States. The Company uses this financial measure, both in presenting its results to shareholders and the investmentcommunity, and in its internal evaluation and management of its businesses. Management believes that this financial measure and the information it provides areuseful to investors because it permits investors to view the Company’s performance using the same tool that management uses to gauge progress in achieving itsgoals. Management believes that the non-GAAP financial measure “Free cash flow” is also useful to investors because it is an indication of cash flow that may beavailable to fund further investments in future growth initiatives.
The Company’s major sources of funds for investments, acquisitions and dividend payments are cash generated from operatingactivities, available cash balances and selected borrowings. The Company evaluates potential acquisitions, divestitures and joint venturesin the ordinary course of business.
2005
In 2005, net cash provided by operating activities totaled $432.9 million compared with $415.2 million in 2004. This increase wasdriven by an increase in net earnings of $115.6 million, which included a $31.5 million after-tax gain from the sale of the Company’sinvestment in MarineMax. The proceeds recognized on this sale are recorded in investing activities. See Note 6. Investments in the Notesto Consolidated Financial Statements for details on the sale of this investment. In 2005, the Company also paid $54.9 million more intaxes, net of refunds, than in 2004. The Company also used operating cash flow to increase working capital, defined as non-cash currentassets less current liabilities, by $65.1 million in 2005 versus a $68.7 million increase in 2004.
The cash used to fund working capital in 2005 was primarily due to an increase in inventory to support higher sales volumes, anincrease in accounts receivable attributed to higher sales in 2005 and lower variable compensation accruals year over year. These factorswere partially offset by an increase in accounts payable in 2005.
Cash flows from investing activities included capital expenditures of $233.6 million in 2005, compared with $171.3 million in 2004.The increase in capital expenditures was attributable to investments for the development of the new line of 75, 90 and 115 horsepowernaturally aspirated, four-stroke outboard engines launched in February 2006, investment in a new manufacturing line for four-strokeoutboard engines for Mercury Marine, acquisition of a new boat manufacturing facility in Swansboro, North Carolina, the expansion of aboat manufacturing plant in Reynosa, Mexico, and tooling expenditures for new model introductions across all segments.
The Company expects to invest approximately the same amount or slightly less for capital expenditures in 2006. About 75 percent ofthe capital spending will be for investments in new and upgraded products, for plant capacity expansions and for the construction of newshowcase Brunswick Zones, with the balance targeted toward cost reductions and investments in information technology.
Cash paid for acquisitions, net of debt and cash acquired, totaled $135.5 million and $267.8 million in 2005 and 2004, respectively.S e e Note 5. Acquisitions in the Notes to Consolidated Financial Statements, for further details on the Company’s acquisitions.Additionally the Company invested $23.3 million and $16.2 million in 2005 and 2004, respectively, in various business ventures, whichare discussed further in Note 6. Investments in the Notes to Consolidated Financial Statements.
28

In 2005, the Company sold 1,861,200 shares of common stock of MarineMax, its largest boat dealer. Pre-tax proceeds from this stocksale totaled $56.8 million, net of $4.1 million of selling expenses, which included $1.1 million of accrued expenses. This sale generated$51.5 million of after-tax cash flow for the Company, which will be used for general corporate purposes, including possible acquisitions.See Note 6. Investments in the Notes to Consolidated Financial Statements for details on the sale of this investment.
Cash flow from financing activities used cash of $122.2 million in 2005, compared with providing cash of $178.6 million in 2004.This change was primarily due to the issuance of $150.0 million of debt in 2004 described below, partially offset by the commencementof the Company’s stock repurchase plan in 2005, which used $76.0 million to buy back approximately 1.9 million shares of theCompany’s common stock in 2005. The Company did not repurchase stock during 2004 or 2003. The Company received $17.1 millionfrom stock options exercised in 2005, compared with $99.5 million during 2004. An annual dividend of $0.60 per share was declared andpaid in both 2005 and 2004, resulting in dividend payments of $57.3 million and $58.1 million, respectively.
Cash and cash equivalents totaled $487.7 million at the end of 2005, which was a decrease of $12.1 million from $499.8 million atDecember 31, 2004. Total debt at December 31, 2005 decreased $14.3 million to $724.8 million versus $739.1 million at December 31,2004. The Company’s debt-to-capitalization ratio was 26.8 percent at December 31, 2005, compared with 30.2 percent at December 31,2004.
On May 5, 2005, the Company completed a new $650.0 million revolving credit facility (the “Facility”), which replaced the existing$350.0 million facility, as described i n Note 12. Debt in the Notes to Consolidated Financial Statements, that serves as support forcommercial paper borrowings. This new five-year facility contains improved pricing and has similar terms to the prior facility. Theincreased capacity reflects the growth in the Company’s business and desire to maintain liquidity sources at conservative levels. Therewere no borrowings under the Facility during 2005. The Company has the ability to issue up to $150.0 million in letters of credit underthe Facility. At December 31, 2005, the Company had $64.6 million in outstanding letters of credit under the Facility. Net of theseoutstanding letters of credit, the Company had borrowing capacity of $585.4 million under the terms of the Facility at December 31,2005. Under the terms of the Facility, the Company is subject to a leverage test, as well as restrictions on secured debt. The Companywas in compliance with these covenants at December 31, 2005. The borrowing rate, as calculated in accordance with the Facility, was4.74 percent at December 31, 2005. The Company also has $450.0 million available under a universal shelf registration statement filed in2001 with the Securities and Exchange Commission for the issuance of equity and/or debt securities.
In 2006, the Company intends to continue its stock repurchase plan. In addition to the amounts repurchased in 2005, the Companyhas repurchased approximately 1.6 million shares for $61.8 million as of February 28, 2006. The Company is authorized to repurchase anadditional $62.2 million of its common shares. Additional share repurchases will depend on market conditions and cash availability.
In 2006, the Company intends to continue to proactively fund its defined benefit plans in advance of Employee Retirement IncomeSecurity Act (ERISA) requirements. In addition to contributions required to fund nonqualified benefit payments, the Company anticipatesfunding up to $40.0 million of discretionary contributions to pension plans in 2006 to achieve the Company’s funding objectives. For2005, the Company contributed $27.4 million into its defined benefit plans, compared with $42.6 million of contributions in 2004. Theseamounts include contributions to fund payments made under the nonqualified plans of $2.4 million in 2005 and $2.6 million in 2004. SeeNote 13. Pension and Other Postretirement Benefits in the Notes to Consolidated Financial Statements for more details.
The funded status of the Company’s qualified pension plans, measured as a percentage of the projected benefit obligation, improvedto 91.8 percent in 2005 from 88.2 percent in 2004 as a result of positive equity market returns and discretionary pension contributions in2005. As of December 31, 2005, these plans were underfunded by $83.5 million on a projected benefit obligation basis.
The Company’s financial flexibility and access to capital markets is supported by its balance sheet position, investment-grade creditratings and ability to generate significant cash from operating activities. Management believes that there are adequate sources of liquidityto meet the Company’s short-term and long-term needs.
2004
In 2004, net cash provided by operating activities totaled $415.2 million compared with $395.1 million in 2003. This increase wasdriven by an increase in net earnings of $134.6 million and the net reduction of approximately $42 million in after-tax paymentsassociated with the United States Tax Court case, as described in Note 9. Commitments and Contingencies in the Notes to ConsolidatedFinancial Statements. These increases in cash flow were mostly offset by a $68.7 million increase in working capital, defined as non-cashcurrent assets less current liabilities, in 2004 versus a $100.8 million decrease in 2003.
29

The additional cash used to fund working capital in 2004 compared with 2003 was primarily due to an increase in inventory andaccounts receivable attributed t o higher sales and production volumes, and lower incremental cash flow from the sale of Mercury’sdomestic trade receivables to Brunswick Acceptance Company, LLC (BAC). The Company received a first time cash flow benefit when itbegan selling these receivables to BAC in the third quarter of 2003. These factors were partially offset by an increase in accounts payable,an increase in accrued expenses driven primarily by higher compensation expenses and an increase in dealer allowances on higher salesvolume.
Cash flows from investing activities included capital expenditures of $171.3 million in 2004, compared with $159.8 million in 2003.The increase in capital expenditures was attributable to investments in a new assembly plant in China for the production of four-strokeoutboard engines, the expansion of a boat manufacturing plant in Reynosa, Mexico and tooling expenditures for new model introductionsacross all segments.
Cash paid for acquisitions, net of debt and cash acquired, totaled $267.8 million and $177.3 million in 2004 and 2003, respectively.S e e Note 5. Acquisitions in the Notes to Consolidated Financial Statements, for further details on the Company’s acquisitions.Additionally, the Company invested $16.2 million and $39.3 million in 2004 and 2003, respectively, in various business ventures, whichare discussed further in Note 6. Investments in the Notes to the Consolidated Financial Statements. The Company will continue toevaluate acquisitions and other investment opportunities as they arise.
Cash flow from financing activities provided cash of $178.6 million in 2004, compared with a use of cash of $28.7 million in 2003.This increase was primarily due to the issuance of debt, as described below and an increase in proceeds from the exercise of stock options.The Company received $99.5 million from stock options exercised in 2004, compared with $39.9 million during 2003. An annualdividend of $0.60 per share was declared in October 2004 and paid in December 2004. The Company did not repurchase stock during2004 or 2003.
Cash and cash equivalents totaled $499.8 million at the end of 2004, which was an increase of $153.9 million from $345.9 million atDecember 31, 2003. Total debt at December 31, 2004 increased $131.5 million to $739.1 million versus $607.6 million at December 31,2003. The increase in cash and debt was primarily related to the issuance of $150.0 million of 5 percent notes due in 2011, as described inNote 12. Debt in the Notes to Consolidated Financial Statements. Additionally, the increase in cash is also attributed to strong cash flowduring 2004, partially offset by cash paid for acquisitions, investments and capital expenditures. The Company’s debt-to-capitalizationratio was 30.2 percent at December 31, 2004, compared with 31.5 percent at December 31, 2003.
The funded status of the Company’s qualified pension plans, measured as a percentage of the projected benefit obligation, improvedto 88.2 percent in 2004 from 87.5 percent in 2003. Improved equity market returns and discretionary pension contributions in 2004 wereoffset by a decrease in the discount rate and an increase in benefit obligations due to plan amendments negotiated in 2004. As of December31, 2004, these plans were underfunded by $115.6 million on a projected benefit obligation basis. While there was no legal requirementunder ERISA, the Company made discretionary contributions of $40.0 million in cash to the qualified pension plans and funded $2.6million to cover benefit payments in the unfunded nonqualified pension plan in 2004. Refer to Note 13. Pension and OtherPostretirement Benefits in the Notes to Consolidated Financial Statements for more details.
2003
Net cash provided by operating activities totaled $395.1 million in 2003, $285.8 million of which consisted of net earnings before thenon-cash impact of depreciation and amortization. Additionally, reductions in working capital, defined as non-cash current assets lesscurrent liabilities, provided cash of $100.8 million. The decrease in working capital was primarily due to the sale of accounts receivable(detailed in Financial Services below) to Brunswick Acceptance Company, LLC (BAC). The outstanding balance for receivables sold toBAC by the Company was $74.7 million at December 31, 2003. Also decreasing 2003 working capital was the establishment of thereserve for the previously discussed Fitness segment litigation charge. The Company paid $12.5 million in September of 2003 and $12.5million in June of 2004. Cash flow was also adversely impacted by the tax payment of $62.0 million ($50.0 million after-tax) in 2003.Refer to the Tax Case matter discussed in Note 9. Commitments and Contingencies in the Notes to Consolidated Financial Statements.
The Company invested $159.8 million in capital expenditures in 2003. The largest portion of these expenditures was made forinvestments to introduce new products and expand product lines in the Marine Engine, Fitness and Bowling & Billiards segments and toachieve improved production efficiencies and product quality. The most significant expenditures in 2003 relate to the equipment neededfor production of Verado, the Marine Engine segment’s new series of high-horsepower outboard engines introduced in 2004, and theconversion of 13 bowling centers to Brunswick Zones.
30

Cash paid for acquisitions, net of cash acquired, totaled $177.3 million in 2003. See Note 5. Acquisitions i n t h e Notes toConsolidated Financial Statements for further details on these acquisitions. Additionally, the Company invested $39.3 million in 2003 invarious business ventures, which are discussed further in Note 6. Investments in the Notes to Consolidated Financial Statements.
Cash and cash equivalents totaled $345.9 million at the end of 2003 and total debt a t year-end 2003 was $607.6 million. TheCompany decreased its total debt outstanding in 2003 by paying off its notes from the Sealine acquisition and making continued paymentsrelated to the Company’s ESOP debt. The Company’s debt-to-capitalization ratio was 31.5 percent at December 31, 2003, compared with35.9 percent at December 31, 2002. During 2003, the Company received $39.9 million from stock options exercised.
Improved equity market trends in 2003 had a favorable impact on the funded status of the Company’s qualified pension plans.Funding for the Company’s qualified pension plans improved to 87.5 percent in 2003 from 76.9 percent in 2002 on a projected benefitobligation basis. Underfunding for these plans at December 31, 2003, is $112.5 million on a projected benefit obligation basis. Whilethere was no legal requirement under ERISA, the Company made a discretionary contribution of $52.0 million in cash to the qualifiedpension plans and funded $2.4 million to cover benefit payments in the unfunded nonqualified pension plan in 2003.
Financial Services
The Company has a joint venture, Brunswick Acceptance Company, LLC (BAC), with GE Commercial Finance (GECF). Under theterms of the joint venture agreement, BAC provides secured wholesale floor-plan financing to the Company’s boat and engine dealers.BAC also purchases and services a portion of Mercury Marine’s domestic accounts receivable relating to its boat builder and dealercustomers.
In January of 2003, the Company’s subsidiary, Brunswick Financial Services Corporation (BFS), invested $3.3 million in BAC,which represented a 15 percent ownership interest. On July 2, 2003, BFS contributed an additional $19.5 million to increase its equityinterest in BAC to 49 percent, as provided for by the terms of the joint venture agreement. BFS’s contributed equity is adjusted monthlyto maintain a 49 percent equity interest in accordance with the capital provisions of the joint venture agreement. BFS’s investment in BACis accounted for by the Company under the equity method and is recorded as a component of Investments in its Consolidated BalanceSheets. The Company has funded its investment in BAC with a combination of cash contributions and reinvested earnings, which totaled$16.3 million, $13.9 million and $22.0 million for the years ended December 31, 2005, 2004 and 2003, respectively. The Companyrecords BFS’s share of income or loss in BAC based on its ownership percentage in the joint venture in Equity earnings in itsConsolidated Statements of Income.
BAC is funded in part through a loan from GECF and a securitization facility arranged by General Electric Capital Corporation, aGECF affiliate, and in part by a cash equity investment from both GECF (51 percent) and BFS (49 percent). BFS’s total investment inBAC at December 31, 2005 and 2004, was $52.2 million and $35.9 million, respectively. BFS’s exposure to losses associated with BACfinancing arrangements is limited to its funded equity in BAC
BFS recorded income related to the operations of BAC of $9.7 million, $4.3 million and $1.5 million for the years ended December31, 2005, 2004 and 2003, respectively. These amounts exclude the discount expense on the sale of Mercury Marine’s accounts receivableto the joint venture noted below.
Since 2003, the Company has sold a significant portion of its domestic Mercury Marine accounts receivable to BAC. Accountsreceivable totaling $913.3 million, $927.4 million and $501.2 million were sold to BAC in 2005, 2004 and 2003 respectively. Discountsof $7.0 million, $6.4 million and $3.7 million for the years ended December 31, 2005, 2004 and 2003, respectively, have been recorded asan expense in Other expense, net, in the Consolidated Statements of Income. The outstanding balance for receivables sold to BAC was$96.5 million as of December 31, 2005, down from $103.7 million as of December 31, 2004. Pursuant to the joint venture agreement,BAC reimbursed Mercury Marine $2.6 million, $2.3 million and $0.9 million in 2005, 2004 and 2003, respectively, for the related credit,collection, and administrative costs incurred in connection with the servicing of such receivables.
As of December 31, 2005 and 2004, the Company had a retained interest in $44.5 million and $45.7 million of the total accountsreceivable sold to BAC. The Company’s maximum exposure as of December 31, 2005 and 2004 related to these amounts was $28.5million and $25.0 million, respectively. In accordance with SFAS No. 140, “Accounting for Transfers and Servicing of Financial Assetsand Extinguishments of Liabilities,” (SFAS No. 140) the Company treats the sale of receivables in which the Company retains an interestas a secured obligation. Accordingly, the amount of the Company’s maximum exposure was recorded in Accounts and notes receivable,and Accrued expenses in the Consolidated Balance Sheets. These balances were included in the amounts in Note 9. Commitments andContingencies in the Notes to Consolidated Financial Statements.
31

Off-Balance Sheet Arrangements
Guarantees. Based on historical experience and current facts and circumstances, and in accordance with Financial AccountingStandards Board (FASB) Interpretation No. 45 (FIN 45), “Guarantor’s Accounting and Disclosure Requirements for Guarantees,Including Indirect Guarantees of Indebtedness of Others — An Interpretation of FASB Statements No. 5, 57, and 107 and Rescission ofFASB Interpretation No. 34,” the Company has reserves to cover potential losses associated with guarantees and repurchase obligations.Historical cash requirements and losses associated with these obligations have not been significant. See Note 9. Commitments andContingencies in the Notes to Consolidated Financial Statements for a description of these arrangements.
Contractual Obligations
The following table sets forth a summary of the Company’s contractual cash obligations as of December 31, 2005:
Payments due by period Less than More than (In millions) Total 1 year 1-3 years 3-5 years 5 years Contractual Obligations Short-term debt(1) $ 0.1 $ 0.1 $ - $ - $ - Long-term debt(1) 724.7 1.0 1.5 1.0 721.2 Interest payments on long-term debt 530.1 47.1 62.0 61.9 359.1 Capital leases(2) 0.5 0.2 0.3 - - Operating leases(3) 202.2 43.5 61.9 37.4 59.4 Purchase obligations(4) 308.7 292.5 12.0 2.6 1.6 Deferred pension liability(5) 35.3 2.5 6.0 6.2 20.6 Deferred management compensation(6) 75.6 8.4 5.0 6.3 55.9 Other long-term liabilities(7) 179.4 66.6 85.8 20.3 6.7
Total contractual obligations $ 2,056.6 $ 461.9 $ 234.5 $ 135.7 $ 1,224.5 _________
(1) See Note 12. Debt in the Notes to Consolidated Financial Statements for additional information on the Company’s debt.
(2) Includes principal and interest. See Note 12. Debt in the Notes to Consolidated Financial Statements for additional information on the Company’s capital leaseobligations.
(3) See Note 17. Leases in the Notes to Consolidated Financial Statements for additional information on the Company’s operating leases.
(4) Purchase obligations represent agreements with suppliers and vendors at the end of 2005 for raw materials and other supplies as part of the normal course ofbusiness.
(5) Amounts represent benefit payments expected to be made for the Company’s non-qualified pension plans. Although the Company anticipates makingdiscretionary contributions up to $40 million in 2006, there are no statutory required contributions for the domestic qualified pension plans. See Note 13. Pensionand Other Postretirement Benefits in the Notes to Consolidated Financial Statements.
(6) Amounts primarily represent long-term deferred compensation plans for Company management. Payments are assumed to be equal to the remaining liability andto be primarily paid out more than five years from December 31, 2005.
(7) Other long-term liabilities include amounts reflected on the balance sheet, which primarily includes certain agreements that provide for the assignment of leaseand other long-term receivables originated by the Company to third parties and are treated as a secured obligation under SFAS No. 140, deferred revenue onservice and extended warranty contracts, postretirement medical/life insurance benefits and other retirement obligations.
32

Legal Proceedings
See Note 9. Commitments and Contingencies in the Notes to Consolidated Financial Statements for disclosure of the potentialcash requirements related to legal and environmental proceedings.
Environmental Regulation
In its Marine Engine segment, the Company will continue to develop engine technologies to reduce engine emissions to complywith current and future emissions requirements. The costs associated with these activities and the introduction of low-emission engineswill have an adverse effect on Marine Engine segment operating margins and may affect short-term operating results. The State ofCalifornia has adopted regulations requiring catalytic converters on the Company's sterndrive and inboard engines by January 1, 2008.The Company expects to comply fully with these regulations, but compliance will increase the cost of these products. Otherenvironmental regulatory bodies in the United States and other countries also may impose higher emissions standards than are currentlyi n effect for the Company’s engines, which would require the Company to modify these engines, increasing their cost. T h e Boatsegment continues to pursue fiberglass boat manufacturing technologies and techniques to reduce air emissions at its boat manufacturingfacilities. The Company does not believe that compliance with federal, state and local environmental laws will have a material adverseeffect on the Company’s competitive position.
Critical Accounting Policies
The preparation of the consolidated financial statements in accordance with accounting principles generally accepted in the UnitedStates requires management to make certain estimates and assumptions that affect the amount o f reported assets and liabilities anddisclosure of contingent assets and liabilities at the date of the consolidated financial statements and revenues and expenses during theperiods reported. Actual results may differ from those estimates. The Company discussed the development and selection of the criticalaccounting policies with the Audit Committee of the Board of Directors and believes the following are the most critical accountingpolicies that could have an effect on the Company’s reported results.
Revenue Recognition and Sales Incentives. The Company’s revenue is derived primarily from the sale of boats, marine engines,global positioning systems-based products, marine electronics, fitness equipment, bowling products and billiard tables. Revenue isrecognized in accordance with the terms of the sale, primarily upon shipment to customers, once the sales price is fixed or determinableand collectibility is reasonably assured. The Company offers discounts and sales incentives that include retail promotional activities andrebates. The estimated liability for sales incentives is recorded at the later of the time of program communication to the customer or atthe time of sale in accordance with Emerging Issues Task Force (EITF) No. 01-9, “Accounting for Consideration Given by a Vendor to aCustomer (Including a Reseller of a Vendor’s Products).” The liability is estimated based on the costs for the incentive program, theplanned duration of the program and historical experience. If actual costs are different from estimated costs, the recorded value of theliability and revenue is adjusted.
Allowances for Doubtful Accounts. The Company records an allowance for uncollectible trade receivables based upon currentlyknown bad debt risks and provides reserves based on loss history, customer payment practices and economic conditions. Actualcollection experience may differ from the current estimate of reserves. The Company also provides a reserve based on historical,current and estimated future purchasing levels in connection with its long-term notes receivables for the Company’s supplyagreements. These assumptions are re-evaluated considering the customer's financial position and product purchase volumes. Changesto the allowance for doubtful accounts may be required if a future event or other circumstance results in a change in the estimate of theultimate collectibility of a specific account or note.
Reserve for Excess and Obsolete Inventories. The Company records a reserve for excess and obsolete inventories in order to ensureinventories are carried at the lower of cost or fair market value. Fair market value can be affected by assumptions about market demandand conditions, historical usage rates, model changes and new product introductions. If model changes or new product introductionscreate more or less than favorable market conditions, the reserve for excess and obsolete inventories may need to be adjusted.
Warranty Reserves. The Company records a liability for standard product warranties at the time revenue is recognized. The liabilityis recorded using historical warranty experience t o estimate projected claim rates and expected costs per claim. If necessary, theCompany adjusts its liability for specific warranty matters when they become known and are reasonably estimable. The Company’swarranty reserves are affected by product failure rates and material usage and labor costs incurred in correcting a product failure. If theseestimated costs differ from actual product failure rates and actual material usage and labor costs, a revision to the warranty reservewould be required.
33

Litigation. In the normal course of business, the Company is subject to claims and litigation, including obligations assumed orretained as part of acquisitions and divestitures. The Company accrues for litigation exposure based upon its assessment, made inconsultation with counsel, of the likely range of exposure stemming from the claim. In light of existing reserves, the Company’slitigation claims, when finally resolved, will not, in the opinion of management, have a material adverse effect on the Company’sconsolidated financial position. If current estimates for the cost of resolving any specific claims are later determined to be inadequate,results of operations could be adversely affected in the period in which additional provisions are required. The Company records areserve when it is probable that a loss has been incurred and the loss can be reasonably estimated. The Company establishes its reservebased on its best estimate within a range of losses. If the Company is unable to identify the best estimate, the Company records theminimum amount in the range.
Environmental. The Company accrues for environmental remediation-related activities for which commitments or clean-up planshave been developed and for which costs can be reasonably estimated. All accrued amounts are generally determined in coordinationwith third-party experts on an undiscounted basis and do not consider recoveries from third parties until such recoveries are realized. Inlight of existing reserves, the Company’s environmental claims, when finally resolved, will not, in the opinion of management, have amaterial adverse effect on the Company’s consolidated financial position or results of operations.
Self-Insurance Reserves. The Company records a liability for self-insurance obligations, which include employee-related health carebenefits and claims for workers’ compensation, product liability, general liability and auto liability. The liability is estimated based onclaims incurred as of the date of the financial statements. In estimating the obligations associated with self-insurance reserves, theCompany primarily uses loss development factors based on historical claim experience, which incorporate anticipated exposure forlosses incurred, but not yet reported. These loss development factors are used to estimate ultimate losses on incurred claims. Actualcosts associated with a specific claim can vary from an earlier estimate. If the facts were to change, the liability recorded for expectedcosts associated with a specific claim may need to be revised.
Pension, Postretirement and Postemployment Benefit Reserves. Pension, postretirement and postemployment costs and obligationsare actuarially determined and are affected by assumptions, including the discount rate, the estimated future return on plan assets, theannual rate of increase in compensation for plan employees, the increase in costs of health care benefits and other factors. The Companyevaluates assumptions used on a periodic basis and makes adjustments to these liabilities as necessary. Pension, postretirement andpostemployment benefit reserves are determined in accordance with SFAS No. 87, “Employers’ Accounting for Pensions,” SFAS No.106, “Employers’ Accounting for Postretirement Benefits Other Than Pensions,” and SFAS No. 112, “Employers’ Accounting forPostemployment Benefits,” respectively.
Income Taxes. Deferred taxes are recognized for the future tax effects of temporary differences between financial and income taxreporting using tax rates in effect for the years in which the differences are expected to reverse. The Company historically provideddeferred taxes on the undistributed earnings of foreign subsidiaries and unconsolidated affiliates. As of July 1, 2005, the Companydetermined that certain foreign subsidiaries’ undistributed net earnings were to be indefinitely reinvested in operations outside theUnited States. The Company estimates its tax obligations based on historical experience and current tax laws and litigation. Thejudgments made at any point in time may change based on the outcome of tax audits and settlements of tax litigation, as well as changesdue to new tax laws and regulations and the Company’s application of those laws and regulations. These factors may cause the tax ratefor the Company to increase or decrease.
Recent Accounting Pronouncements
In November 2004, the FASB issued SFAS No. 151, “Inventory Costs - an amendment of ARB No. 43 Chapter 4” (SFAS No. 151).SFAS No. 151 more clearly defines when excessive idle facility expense, freight, handling costs and spoilage are to be current-periodcharges. In addition, SFAS No. 151 requires the allocation of fixed production overhead to the cost of conversion to be based on thenormal capacity of the production facilities. SFAS No. 151 is effective for inventory costs incurred during fiscal years beginning afterJune 15, 2005. The Company does not expect SFAS No. 151 to have a material impact on the financial statements.
In December 2004, the FASB issued SFAS No. 123 (revised 2004), “Share-Based Payment,” (SFAS No. 123R). SFAS No. 123Reliminates the intrinsic value method under Accounting Principles Board Opinion (APB) No. 25, “Accounting for Stock Issued toEmployees,” and requires the Company to use a fair-value based method of accounting for share-based payments. Under APB No. 25,no compensation cost related to stock options is recognized in the Consolidated Statements of Income. SFAS No. 123R requires thatcompensation cost for employee services received in exchange for an award of equity instruments be recognized in the ConsolidatedStatements of Income based on the grant-date fair value of that award. The cost recognized at the grant date will be amortized in theConsolidated Statements of Income over the period during which an employee is required to provide service in exchange for that award(requisite service period). For the Company, SFAS No. 123R is effective as of the beginning of the first quarter of 2006. The Companycurrently anticipates the impact of adoption of SFAS No. 123R to increase operating expenses by approximately $7 million in 2006.
34

In December 2004, the FASB issued SFAS No. 153, “Exchanges of Nonmonetary Assets - an amendment of APB Opinion No. 29”(SFAS No. 153). SFAS No. 153 amends APB No. 29 to require that assets exchanged in a nonmonetary transaction are to be measuredat fair value except for those exchanges of nonmonetary assets that lack commercial substance. SFAS No. 153 is effective fornonmonetary asset exchanges occurring in fiscal years beginning after June 15, 2005. The Company does not expect SFAS No. 153 tohave a material impact on the financial statements.
In March 2005, the Financial Accounting Standards Board (FASB) issued FASB Interpretation No. 47, “Accounting for ConditionalAsset Retirement Obligations” (FIN No. 47). FIN No. 47 clarifies the accounting for conditional asset retirement obligations as used inStatement of Financial Accounting Standards (SFAS) No. 143, “Accounting for Asset Retirement Obligations.” A conditional assetretirement obligation is an unconditional legal obligation to perform an asset retirement activity in which the timing and (or) method ofsettlement are conditioned on a future event that may or may not be within the control of the entity. Therefore, an entity is required torecognize a liability for the fair value of a conditional asset retirement obligation under SFAS No. 143 if the fair value of the liabilitycan be reasonably estimated. The provisions of FIN No. 47 are effective for reporting periods ending after December 15, 2005. TheCompany is currently evaluating the impact of adopting FIN No. 47, but does not anticipate it will have a material impact on thefinancial statements.
Forward-Looking Statements
Certain statements in this Annual Report are forward-looking as defined in the Private Securities Litigation Reform Act of 1995.Forward-looking statements in this Annual Report may include words such as “expect,”“anticipate,”“believe,”“may,”“should,”“could”or “estimate.” These statements involve certain risks and uncertainties that may cause actual results to differ materially fromexpectations as of the date of this filing. These risks include, but are not limited to, those set forth under Item 1A - Risk Factors.
Caution should be taken not to place undue reliance on the Company’s forward-looking statements, which represent the Company’sviews only as of the date this report is filed. The Company undertakes no obligation to update publicly or revise any forward-lookingstatement, whether as a result of new information, future events or otherwise.
Item 7A. Quantitative and Qualitative Disclosures About Market Risk
The Company is exposed to market risk from changes in foreign currency exchange rates, interest rates and commodity prices. TheCompany enters into various hedging transactions to mitigate these risks in accordance with guidelines established by the Company’smanagement. The Company does not use financial instruments for trading or speculative purposes.
The Company uses foreign currency forward and option contracts to manage foreign exchange exposure related to anticipatedtransactions, and assets and liabilities that are subject to risk from foreign currency rate changes. The Company’s principal currencyexposures relate to the Euro, Japanese yen, British pound, Canadian dollar, Australian dollar, and New Zealand dollar. Hedging ofanticipated transactions is accomplished with financial instruments whose maturity date, along with the realized gain or loss, occurs onor near the execution of the anticipated transaction. Hedging of an asset or liability is accomplished through the use of financialinstruments such that the gain or loss on the hedging instrument offsets the gain or loss recognized on the asset or liability.
The Company uses interest rate swap agreements to mitigate the effect that changes in interest rates have on the fair market value ofthe Company’s debt and to lower the Company’s borrowing costs on current or anticipated issuances of debt. The Company’s netexposure to interest rate risk is primarily attributable to fixed-rate debt instruments. Interest rate risk management is accomplishedthrough the use of fixed-to-floating interest rate swaps and floating-rate instruments that are benchmarked to U.S. and European short-term money market interest rates.
Raw materials used by the Company are exposed to the effect of changing commodity prices. Accordingly, the Company usescommodity swap agreements and futures contracts to manage fluctuations in prices of anticipated purchases of certain raw materials,including aluminum and natural gas.
The Company uses a value-at-risk (VAR) computation to estimate the maximum one-day reduction in pre-tax earnings related to itsforeign currency, interest rate and commodity price-sensitive derivative financial instruments. The VAR computation includes theCompany’s debt, foreign currency hedge contracts, interest rate swap agreements, commodity swap agreements and futures contracts.
35

The amounts shown below represent the estimated reduction in fair market value that the Company could incur on its derivativefinancial instruments from adverse changes in foreign exchange rates, interest rates or commodity prices using the VAR estimationmodel. The VAR model uses the Monte Carlo simulation statistical modeling technique and uses historical foreign exchange rates,interest rates and commodity prices to estimate the volatility and correlation of these rates and prices in future periods. It estimates a lossin fair market value using statistical modeling techniques and includes substantially all market risk exposures. The estimated potentiallosses shown in the table below, for a time period of one day and confidence level of 95 percent, have no effect on the Company’s resultsof operations or financial condition.
2005 2004 2003 (In millions) Risk CategoryForeign exchange $ 2.0 $ 2.3 $ 0.7 Interest rates $ 7.9 $ 5.4 $ 4.3 Commodity prices $ 0.2 $ 0.4 $ 0.3
The 95 percent confidence level signifies the Company’s degree of confidence that actual losses would not exceed the estimatedlosses shown above. The amounts shown disregard the possibility that foreign currency exchange rates, interest rates and commodityprices could move in the Company’s favor. The VAR model assumes that all movements in rates and commodity prices will be adverse.Actual experience has shown that gains and losses tend to offset each other over time, and it is highly unlikely that the Company couldexperience losses such as these over an extended period of time. These amounts should not be considered projections of future losses, asactual results may differ significantly depending upon activity in global financial markets.
36

Item 8. Financial Statements and Supplementary Data
See Index to Financial Statements and Financial Statement Schedule on page 40.
Item 9. Changes in and Disagreements with Accountants on Accounting and Financial Disclosure
None.
Item9A.
Controls and Procedures
Conclusion Regarding the Effectiveness of Disclosure Controls and Procedures
Under the supervision and with the participation of the Company’s management, including the Chief Executive Officer and theChief Financial Officer of the Company (its principal executive officer and principal financial officer, respectively) the Company hasevaluated its disclosure controls and procedures (as defined in Securities Exchange Act Rules 12a -15(e) and 15d -15(e)) as of the end ofthe period covered by this annual report. Based upon that evaluation, the Chief Executive Officer and Chief Financial Officer haveconcluded that the Company’s disclosure controls and procedures are effective in ensuring that all material information required to befiled has been made known in a timely manner.
Management’s Report on Internal Control Over Financial Reporting
Pursuant to Section 404 of the Sarbanes-Oxley Act of 2002, the Company included a report of management’s assessment of thedesign and effectiveness of its internal controls as part of this Annual Report on Form 10-K for the fiscal year ended December 31,2005. The independent registered public accounting firm of the Company also attested to, and reported on, management’s assessment ofthe effectiveness of internal control over financial reporting. Management’s report and the independent registered public accountingfirm’s attestation report are included in the Company’s 2005 Financial Statements under the captions entitled “Report of Managementon Internal Control Over Financial Reporting” and “Report of Independent Registered Public Accounting Firm on Internal Control OverFinancial Reporting” and are incorporated herein by reference.
The Audit Committee of the Board of Directors, comprised entirely of independent directors, meets regularly with the independentpublic accountants, management and internal auditors to review accounting, reporting, internal control and other financial matters. TheCommittee regularly meets with both the internal and external auditors without members of management present.
Changes in Internal Control Over Financial Reporting
There has been no change in the Company’s internal control over financial reporting during the fourth quarter ended December 31,2005, that has materially affected, or is reasonably likely to materially affect, the Company’s internal control over financial reporting.
37

PART III
Item 10. Directors and Executive Officers of the Registrant
Information pursuant to this Item with respect to the Directors of the Company is incorporated by reference from the discussionunder the headings Proposal No. 1: Election of Directors and Corporate Governance in the Company’s proxy statement for the 2006Annual Meeting of Stockholders (Proxy Statement). Information pursuant to this Item with respect to the Company’s Audit Committeeand the Company’s code of ethics is incorporated by reference from the discussion under the heading Corporate Governance in theProxy Statement. Information pursuant to this Item with respect to compliance with Section 16(a) of the Securities Exchange Act of 1934is incorporated by reference from the discussion under the heading Section 16(a) Beneficial Ownership Reporting Requirements in theProxy Statement.
The information required by Item 401 of Regulation S-K regarding executive officers is included under “Executive Officers of theRegistrant” in Part I of this report following Item 4 of this Report.
Item 11. Executive Compensation
Information pursuant to this Item with respect to compensation paid to Directors of the Company is incorporated by reference fromthe discussion under the heading Corporate Governance-Director Compensation in the Proxy Statement. Information pursuant to thisItem with respect to executive compensation is incorporated b y reference from the discussion under the headings SummaryCompensation Table, Option Grants in 2005, Option Exercises and Year-End Value Table, Long-Term Incentive Plan-Awards During2005, Pension Plans and Employment Agreements and Other Transactions in the Proxy Statement.
Item 12. Security Ownership of Certain Beneficial Owners and Management and Related Stockholder Matters
Information pursuant to this Item with respect to the securities of the Company owned by the Directors and certain officers of theCompany, by the Directors and officers of the Company as a group and by the persons known to the Company to own beneficially morethan 5 percent of the outstanding voting securities of the Company is incorporated by reference from the discussion under the headingStock Held By Directors, Executive Officers And Our Largest Stockholders in the Proxy Statement. Information pursuant to this Itemwith respect to securities authorized for issuance under the Company’s equity compensation plans is hereby incorporated by referencefrom the discussion under the heading Equity Compensation Plan Information in the Proxy Statement.
Item 13. Certain Relationships and Related Transactions
Information pursuant to this Item with respect to certain relationships and related transactions is incorporated from the discussionunder the heading Employment Agreements and Other Transactions in the Proxy Statement.
Item 14. Principal Accounting Fees and Services
Information pursuant to this Item with respect to fees for professional services rendered by the Company’s independent registeredpublic accounting firm and the Audit Committee’s policy on pre-approval of audit and permissible non-audit services of the Company’sindependent registered public accounting firm is incorporated by reference from the discussion under the headings Proposal No. 2:Ratification of Independent Registered Public Accounting Firm-Fees Incurred for Services o f Ernst & Young and Proposal No. 2:Ratification of Independent Registered Public Accounting Firm-Approval of Services Provided by Independent Registered PublicAccounting Firm in the Proxy Statement.
38

PART IV
Item 15. Exhibits and Financial Statement Schedules
(a) 1. See Index to Financial Statements and Financial Statement Schedule on page 40.
See Exhibit Index on pages 81 to 82.
(b) Exhibits
See Exhibit Index on pages 81 to 82.
(c) Financial Statement Schedule
See Index to Financial Statements and Financial Statement Schedule on page 40.
39

Index to Financial Statements and Financial Statement Schedule
Brunswick Corporation
PageFinancial Statements: Report of Management on Internal Control over Financial Reporting 41Report of Independent Registered Public Accounting Firm on Internal Control over FinancialReporting
42
Report of Independent Registered Public Accounting Firm 43Consolidated Statements of Income for the Years Ended December 31, 2005, 2004 and 2003 44Consolidated Balance Sheets as of December 31, 2005 and 2004 45Consolidated Statements of Cash Flows for the Years Ended December 31, 2005, 2004 and 2003 47Consolidated Statements of Shareholders’ Equity for the Years Ended December 31, 2005, 2004 and2003
58
Notes to Consolidated Financial Statements 49 Financial Statement Schedule: Schedule II - Valuation and Qualifying Accounts 78
40

BRUNSWICK CORPORATION
REPORT OF MANAGEMENT ON INTERNAL CONTROL OVER FINANCIAL REPORTING
The Company’s management is responsible for the preparation, integrity and objectivity of the financial statements and other financialinformation presented in this report. The financial statements have been prepared in conformity with accounting principles generallyaccepted in the United States and reflect the effects of certain estimates and judgments made by management.
The Company’s management is also responsible for establishing and maintaining adequate internal control over financial reporting, asdefined in Securities Exchange Act Rule 13a-15(f). Under the supervision and with the participation of the Company’s management,including the Company’s Chief Executive Officer and the Chief Financial Officer, the Company conducted an evaluation of theeffectiveness of its internal control over financial reporting based on the framework in Internal Control - Integrated Framework issuedby the Committee of Sponsoring Organizations of the Treadway Commission.
Based o n the Company’s evaluation under the framework in Internal Control - Integrated Framework, management concluded thatinternal control over financial reporting was effective as of December 31, 2005. Management’s assessment of the effectiveness ofinternal control over financial reporting as of December 31, 2005, has been audited by Ernst & Young LLP, an independent registeredpublic accounting firm, as stated in their report, which is included herein.
Brunswick CorporationLake Forest, IllinoisFebruary 28, 2006
/s/ DUSTAN E. McCOY /s/ PETER G. LEEMPUTTEDustan E. McCoyChairman and Chief Executive Officer
Peter G. LeemputteSenior Vice President and Chief Financial Officer
41

BRUNSWICK CORPORATION
REPORT OF INDEPENDENT REGISTERED PUBLIC ACCOUNTING FIRM ON INTERNAL CONTROL OVERFINANCIAL REPORTING
Board of Directors and ShareholdersBrunswick Corporation
We have audited management’s assessment, included in the accompanying Report of Management on Internal Control Over FinancialReporting, that Brunswick Corporation maintained effective internal control over financial reporting as of December 31, 2005, based oncriteria established in Internal Control—Integrated Framework issued by the Committee of Sponsoring Organizations of the TreadwayCommission (the COSO criteria). Brunswick Corporation’s management is responsible for maintaining effective internal control overfinancial reporting and for its assessment of the effectiveness of internal control over financial reporting. Our responsibility is to expressan opinion on management’s assessment and an opinion on the effectiveness of the company’s internal control over financial reportingbased on our audit.
We conducted our audit in accordance with the standards of the Public Company Accounting Oversight Board (United States). Thosestandards require that we plan and perform the audit to obtain reasonable assurance about whether effective internal control overfinancial reporting was maintained in all material respects. Our audit included obtaining an understanding of internal control overfinancial reporting, evaluating management’s assessment, testing and evaluating the design and operating effectiveness of internalcontrol, and performing such other procedures as we considered necessary in the circumstances. We believe that our audit provides areasonable basis for our opinion.
A company’s internal control over financial reporting is a process designed to provide reasonable assurance regarding the reliability offinancial reporting and the preparation of financial statements for external purposes in accordance with generally accepted accountingprinciples. A company’s internal control over financial reporting includes those policies and procedures that (1) pertain t o themaintenance of records that, in reasonable detail, accurately and fairly reflect the transactions and dispositions of the assets of thecompany; (2) provide reasonable assurance that transactions are recorded as necessary to permit preparation of financial statements inaccordance with generally accepted accounting principles, and that receipts and expenditures of the company are being made only inaccordance with authorizations of management and directors of the company; and (3) provide reasonable assurance regarding preventionor timely detection of unauthorized acquisition, use, or disposition of the company’s assets that could have a material effect on thefinancial statements.
Because of its inherent limitations, internal control over financial reporting may not prevent or detect misstatements. Also, projections ofany evaluation of effectiveness to future periods are subject to the risk that controls may become inadequate because of changes inconditions, or that the degree of compliance with the policies or procedures may deteriorate.
In our opinion, management’s assessment that Brunswick Corporation maintained effective internal control over financial reporting as ofDecember 31, 2005, is fairly stated, in all material respects, based on the COSO criteria. Also, in our opinion, Brunswick Corporationmaintained, in all material respects, effective internal control over financial reporting as of December 31, 2005, based on the COSOcriteria.
We also have audited, in accordance with the standards of the Public Company Accounting Oversight Board (United States), theconsolidated balance sheets of Brunswick Corporation as of December 31, 2005 and 2004, and the related consolidated statements ofincome, shareholders’ equity, and cash flows for each of the three years in the period ended December 31, 2005 of BrunswickCorporation and our report dated February 28, 2006 expressed an unqualified opinion thereon. /s/ ERNST & YOUNG LLPChicago, IllinoisFebruary, 28, 2006
42

BRUNSWICK CORPORATION
REPORT OF INDEPENDENT REGISTERED PUBLIC ACCOUNTING FIRM
Board of Directors and ShareholdersBrunswick Corporation
We have audited the accompanying consolidated balance sheets of Brunswick Corporation as of December 31, 2005 and 2004, and therelated consolidated statements o f income, shareholders’ equity, and cash flows for each of the three years in the period endedDecember 31, 2005. Our audits also included the financial statement schedule listed in the Index at Item 15(a). These financialstatements and schedule are the responsibility of the Company’s management. Our responsibility is to express an opinion on thesefinancial statements and schedule based on our audits.
We conducted our audits in accordance with the standards of the Public Company Accounting Oversight Board (United States). Thosestandards require that we plan and perform the audit to obtain reasonable assurance about whether the financial statements are free ofmaterial misstatement. An audit includes examining, on a test basis, evidence supporting the amounts and disclosures in the financialstatements. An audit also includes assessing the accounting principles used and significant estimates made by management as well asevaluating the overall financial statement presentation. We believe that our audits provide a reasonable basis for our opinion.
In our opinion, the financial statements referred to above present fairly, in all material respects, the consolidated financial position ofBrunswick Corporation at December 31, 2005 and 2004, and the consolidated results of its operations and its cash flows for each of thethree years in the period ended December 31, 2005 in accordance with U.S. generally accepted accounting principles. Also, in ouropinion, the related financial statement schedule, when considered in relation to the basic financial statements taken as a whole, presentsfairly in all material respects the information set forth therein.
We also have audited, in accordance with the standards of the Public Company Accounting Oversight Board (United States), theeffectiveness of Brunswick Corporation's internal control over financial reporting as of December 31, 2005, based on criteria establishedin Internal Control—Integrated Framework issued by the Committee of Sponsoring Organizations of the Treadway Commission and ourreport dated February 28, 2006 expressed an unqualified opinion thereon.
/s/ ERNST & YOUNG LLPChicago, IllinoisFebruary, 28, 2006
43

BRUNSWICK CORPORATION
CONSOLIDATED STATEMENTS OF INCOME
For the Years Ended December 31 2005 2004 2003 (In millions, except per share data) Net sales $ 5,923.8 $ 5,229.3 $ 4,128.7 Cost of sales 4,499.2 3,915.1 3,131.6 Selling, general and administrative expense 801.3 782.4 632.5 Research and development expense 144.7 131.1 118.2 Litigation charge — — 25.0
Operating earnings 478.6 400.7 221.4 Equity earnings 18.1 18.1 9.9 Investment sale gain 38.7 — — Other expense, net (1.4) (5.2) (0.6)
Earnings before interest and income taxes 534.0 413.6 230.7 Interest expense (53.2) (45.2) (41.0)Interest income 15.0 10.1 11.4
Earnings before income taxes 495.8 378.5 201.1 Income tax provision 110.4 108.7 65.9
Net earnings $ 385.4 $ 269.8 $ 135.2 Earnings per common share:
Basic $ 3.95 $ 2.82 $ 1.48 Diluted $ 3.90 $ 2.77 $ 1.47
Weighted average shares used for computation of: Basic earnings per share 97.6 95.6 91.2 Diluted earnings per share 98.8 97.3 91.9 Cash dividends declared per common share $ 0.60 $ 0.60 $ 0.50
The Notes to Consolidated Financial Statements are an integral part of these consolidated statements.
44

BRUNSWICK CORPORATION
CONSOLIDATED BALANCE SHEETS
As of December 31 2005 2004 (In millions) AssetsCurrent assets
Cash and cash equivalents, at cost, which approximates market
$ 487.7 $ 499.8 Accounts and notes receivable, less allowances of $22.7 and $29.0 522.4 463.2 Inventories
Finished goods 426.2 389.9 Work-in-process 298.5 260.5 Raw materials 149.9 136.4
Net inventories 874.6 786.8 Deferred income taxes 274.8 292.7 Prepaid expenses and other 75.5 56.2
Current assets 2,235.0 2,098.7 Property
Land 76.7 68.8 Buildings and improvements 609.2 548.5 Equipment 1,125.3 1,071.8
Total land, buildings and improvements and equipment 1,811.2 1,689.1 Accumulated depreciation (994.2) (942.8)
Net land, buildings and improvements and equipment 817.0 746.3 Unamortized product tooling costs 153.2 130.1
Net property 970.2 876.4 Other assets
Goodwill 661.8 624.8 Other intangibles 361.3 328.0 Investments 143.6 182.9
Other long-term assets 249.6 235.6
Other assets 1,416.3 1,371.3
Total assets $ 4,621.5 $ 4,346.4
The Notes to Consolidated Financial Statements are an integral part of these consolidated statements.
45

BRUNSWICK CORPORATION
CONSOLIDATED BALANCE SHEETS
As of December 31 2005 2004 (In millions, except per share data) Liabilities and shareholders’ equityCurrent liabilities
Short-term debt, including current maturities of long-term debt
$ 1.1 $ 10.7 Accounts payable 472.2 387.9 Accrued expenses 831.9 855.2
Current liabilities 1,305.2 1,253.8 Long-term liabilities
Debt 723.7 728.4 Deferred income taxes 147.5 180.3 Postretirement and postemployment benefits 215.6 236.3 Other 250.7 235.3
Long-term liabilities 1,337.5 1,380.3 Shareholders’ equity
Common stock; authorized: 200,000,000 shares, $0.75 par value; issued:102,538,000 shares
76.9 76.9
Additional paid-in capital 368.3 358.8 Retained earnings 1,741.9 1,413.7 Treasury stock, at cost:
6,881,000 and 5,709,000 shares (136.0) (76.5)Unearned compensation and other (6.2) (6.3)Accumulated other comprehensive income (loss), net of tax:
Foreign currency translation 14.1 32.2 Minimum pension liability (88.0) (97.7)Unrealized investment gains (losses) (0.1) 23.2 Unrealized gains (losses) on derivatives 7.9 (12.0)Total accumulated other comprehensive loss (66.1) (54.3)
Shareholders’ equity 1,978.8 1,712.3
Total liabilities and shareholders’ equity $ 4,621.5 $ 4,346.4
The Notes to Consolidated Financial Statements are an integral part of these consolidated statements.
46
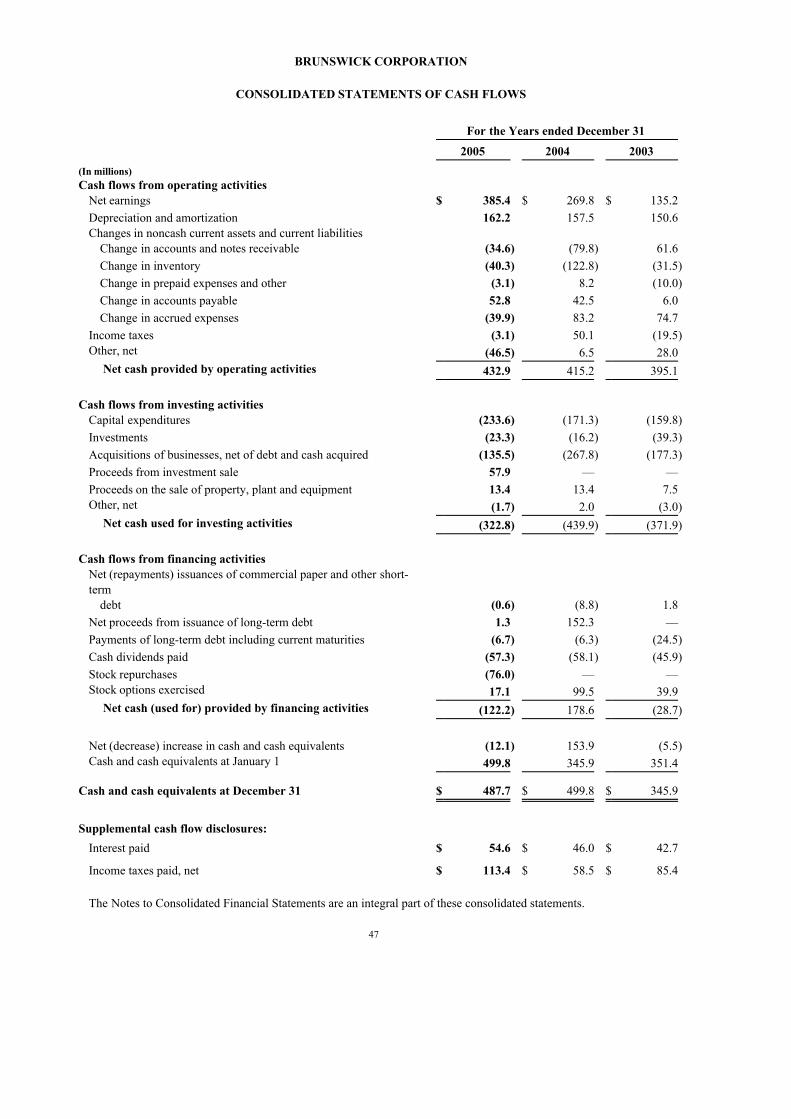
BRUNSWICK CORPORATION
CONSOLIDATED STATEMENTS OF CASH FLOWS
For the Years ended December 31 2005 2004 2003 (In millions) Cash flows from operating activities
Net earnings $ 385.4 $ 269.8 $ 135.2 Depreciation and amortization 162.2 157.5 150.6 Changes in noncash current assets and current liabilities
Change in accounts and notes receivable (34.6) (79.8) 61.6 Change in inventory (40.3) (122.8) (31.5)Change in prepaid expenses and other (3.1) 8.2 (10.0)Change in accounts payable 52.8 42.5 6.0 Change in accrued expenses (39.9) 83.2 74.7
Income taxes (3.1) 50.1 (19.5)Other, net (46.5) 6.5 28.0
Net cash provided by operating activities 432.9 415.2 395.1 Cash flows from investing activities
Capital expenditures (233.6) (171.3) (159.8)Investments (23.3) (16.2) (39.3)Acquisitions of businesses, net of debt and cash acquired (135.5) (267.8) (177.3)Proceeds from investment sale 57.9 — — Proceeds on the sale of property, plant and equipment 13.4 13.4 7.5 Other, net (1.7) 2.0 (3.0)
Net cash used for investing activities (322.8) (439.9) (371.9) Cash flows from financing activities
Net (repayments) issuances of commercial paper and other short-term
debt
(0.6) (8.8) 1.8
Net proceeds from issuance of long-term debt 1.3 152.3 — Payments of long-term debt including current maturities (6.7) (6.3) (24.5)Cash dividends paid (57.3) (58.1) (45.9)Stock repurchases (76.0) — — Stock options exercised 17.1 99.5 39.9
Net cash (used for) provided by financing activities (122.2) 178.6 (28.7)
Net (decrease) increase in cash and cash equivalents (12.1) 153.9 (5.5)Cash and cash equivalents at January 1 499.8 345.9 351.4
Cash and cash equivalents at December 31 $ 487.7 $ 499.8 $ 345.9 Supplemental cash flow disclosures:
Interest paid $ 54.6 $ 46.0 $ 42.7
Income taxes paid, net $ 113.4 $ 58.5 $ 85.4
The Notes to Consolidated Financial Statements are an integral part of these consolidated statements.
47

BRUNSWICK CORPORATION
CONSOLIDATED STATEMENTS OF SHAREHOLDERS’ EQUITY
Accumulated Additional Unearned Other Common Paid-in Retained Treasury Compensation Comprehensive Stock Capital Earnings Stock and Other Income (Loss) Total (In millions, except per share data) Balance, December 31, 2002 $ 76.9 $ 308.9 $ 1,112.7 $ (228.7) $ (22.2) $ (145.8) $ 1,101.8 Comprehensive income (loss)
Net earnings — — 135.2 — — — 135.2 Foreign currency translation
adjustments, net of tax — — — — — 19.4 19.4 Unrealized investment gains, netof tax — — — — — 8.7 8.7 Unrealized losses on derivatives,net of tax — — — — — (0.3) (0.3)Minimum pension liability
adjustment, net of tax — — — — — 45.8 45.8 Total comprehensive income (loss)-2003
— — 135.2 — — 73.6 208.8
Dividends ($0.50 per commonshare) — — (45.9) — — — (45.9)Tax benefit relating to stockoptions — 5.5 — — — — 5.5 Compensation plans and other — (4.4) — 45.1 12.1 — 52.8
Balance, December 31, 2003 $ 76.9 $ 310.0 $ 1,202.0 $ (183.6) $ (10.1) $ (72.2) $ 1,323.0 Comprehensive income (loss)
Net earnings — — 269.8 — — — 269.8 Foreign currency translation
adjustments, net of tax — — — — — 22.7 22.7 Unrealized investment gains, netof tax — — — — — 11.8 11.8 Unrealized losses on derivatives,net of tax
— — — — — (9.6) (9.6)
Minimum pension liabilityadjustment, net of tax — — — — — (7.0) (7.0)
Total comprehensive income (loss)-2004
— — 269.8 — — 17.9 287.7
Dividends ($0.60 per commonshare) — — (58.1) — — — (58.1)Common stock issued for Navmanacquisition — 7.2 — 9.4 — — 16.6 Tax benefit relating to stockoptions — 28.4 — — — — 28.4 Compensation plans and other — 13.2 — 97.7 3.8 — 114.7
Balance, December 31, 2004 $ 76.9 $ 358.8 $ 1,413.7 $ (76.5) $ (6.3) $ (54.3) $ 1,712.3 Comprehensive income (loss)
Net earnings — — 385.4 — — — 385.4 Foreign currency translation
adjustments, net of tax — — — — — (18.1) (18.1)Realized gain from investmentsale, net of tax — — — — — (24.2) (24.2)Unrealized investment gains, netof tax — — — — — 0.9 0.9 Unrealized gains on derivatives,net of tax — — — — — 19.9 19.9 Minimum pension liability

adjustment, net of tax — — — — — 9.7 9.7 Total comprehensive income (loss)-2005
— — 385.4 — — (11.8) 373.6
Dividends ($0.60 per commonshare) — — (57.3) — — — (57.3)Common stock repurchase program — — — (76.0) — — (76.0)Tax benefit relating to stockoptions — 5.6 — — — — 5.6
Compensation plans and other — 3.9 0.1 16.5 0.1 — 20.6
Balance, December 31, 2005 $ 76.9 $ 368.3 $ 1,741.9 $ (136.0) $ (6.2) $ (66.1) $ 1,978.8
The Notes to Consolidated Financial Statements are an integral part of these consolidated statements.
48

BRUNSWICK CORPORATION
NOTES TO CONSOLIDATED FINANCIAL STATEMENTS
1. Significant Accounting Policies
Principles of Consolidation. The consolidated financial statements of Brunswick Corporation (the Company) include the accountsof all consolidated domestic and foreign subsidiaries, after eliminating transactions between the Company and such subsidiaries.
Reclassifications. Certain previously reported amounts have been reclassified to conform with current-year reporting.
Use of Estimates. The preparation of the consolidated financial statements in accordance with accounting principles generallyaccepted in the United States requires management to make certain estimates. Actual results could differ materially from thoseestimates. These estimates affect:
– The reported amounts of assets and liabilities;
– The disclosure of contingent assets and liabilities at the date of the financial statements; and
– The reported amounts of revenues and expenses during the reporting periods.
Estimates in these consolidated financial statements include, but are not limited to:
– Allowances for doubtful accounts;
– Inventory valuation reserves;
– Reserves for dealer allowances;
– Warranty related reserves;
– Losses on litigation and other contingencies;
– Environmental reserves;
– Insurance reserves;
– Income tax reserves;
– Reserves related to restructuring activities; and
– Pension, postretirement and postemployment liabilities. Cash and Cash Equivalents. The Company considers all highly liquid investments with an original maturity of three months or less
when purchased to be cash equivalents.
Accounts Receivable and Allowance for Doubtful Accounts. The Company carries its accounts receivable at their face amounts lessan allowance for doubtful accounts. On a regular basis, the Company records an allowance for uncollectible receivables based uponknown bad debt risks and records general reserves based on past loss history, customer payment practices and economic conditions.Actual collection experience may differ from the current estimate of net receivables. A change to the allowance for doubtful accountsmay be required if a future event or other change in circumstances results in a change in the estimate of the ultimate collectibility of aspecific account.
49

Accounts receivable also include domestic accounts receivable sold with full and partial recourse by the Company’s MercuryMarine division to Brunswick Acceptance Company LLC, as discussed in Note 7. Financial Services. As of December 31, 2005 and2004, the Company had a retained interest in $44.5 million and $45.7 million, respectively, of the total accounts receivable sold to BAC.The Company’s maximum exposure as of December 31, 2005 and 2004 related to these amounts was $28.5 million and $25.0 million,respectively. In accordance with SFAS No. 140, “Accounting for Transfers and Servicing of Financial Assets and Extinguishments ofLiabilities,” the Company treats the sale of receivables in which the Company retains an interest as a secured obligation. Accordingly,the amount of the Company’s maximum exposure was recorded in Accounts and notes receivable, and Accrued expenses in theConsolidated Balance Sheets. These balances were included in the amounts in Note 9. Commitments and Contingencies.
Inventories. Inventories are valued at the lower of cost or market, with market based on replacement cost or net realizable value.Approximately 54 percent and 64 percent of the Company’s inventories were determined by the first-in, first-out method (FIFO) atDecember 31, 2005 and 2004, respectively. Inventories valued at the last-in, first-out method (LIFO), which results in a better matchingof costs and revenue, were $106.2 million and $95.9 million lower than the FIFO cost of inventories at December 31, 2005 and 2004,respectively. Inventory cost includes material, labor and manufacturing overhead.
Property. Property, including major improvements and product tooling costs, is recorded at cost. Product tooling costs principallycomprise the cost to acquire and construct various long-lived molds, dies and other tooling owned by the Company and used in itsmanufacturing processes. Design and prototype development costs associated with product tooling are expensed as incurred.Maintenance and repair costs are also expensed as incurred. Depreciation is recorded over the estimated service lives of the relatedassets, principally using the straight-line method. Buildings and improvements are depreciated over a useful life of five to forty years.Equipment is depreciated over a useful life of two to twenty years. Product tooling costs are amortized over the shorter of the useful lifeof the tooling or the useful life of the applicable product, for a period not to exceed eight years. Gains and losses recognized on the saleof property are included in selling, general and administrative (SG&A) expenses. The amount of gains and losses included in SG&A forthe years ended December 31 was as follows:
2005 2004 2003 (In millions) Gains on the sale of property $ 7.1 $ 4.1 $ 1.7 Losses on the sale of property (1.5) (4.7) (2.1)
Net gains (losses) on sale ofproperty $ 5.6 $ (0.6) $ (0.4)
Software Development Costs. T h e Company expenses all software development and implementation costs incurred until theCompany has determined that the software will result in probable future economic benefit and management has committed to fundingthe project. Once this is determined, external direct costs of material and services, payroll-related costs of employees working on theproject and related interest costs incurred during the application development stage are capitalized. These capitalized costs are amortizedover three to seven years. Training costs and costs to re-engineer business processes are expensed as incurred.
Goodwill and Other Intangibles. Goodwill and other intangible assets primarily result from business acquisitions. The excess of costover net assets of businesses acquired is recorded as goodwill. Under Statement of Financial Accounting Standards No. 142, “Goodwilland Other Intangible Assets,” (SFAS No. 142), while amortization of goodwill and indefinite-lived intangible assets is no longerpermitted, these accounts must be reviewed annually for impairment. The impairment test for goodwill is a two-step process. The firststep is to identify when goodwill impairment has occurred by comparing the fair value of a reporting unit with its carrying amount,including goodwill. If the fair value of a reporting unit exceeds its carrying amount, goodwill of the reporting unit is not consideredimpaired. If the carrying amount of the reporting unit exceeds its fair value, the second step of the goodwill test is performed to measurethe amount of the impairment loss, if any. In this second step, the implied fair value of the reporting unit’s goodwill is compared withthe carrying amount of the goodwill. If the carrying amount of the reporting unit’s goodwill exceeds the implied fair value of thatgoodwill, an impairment loss is recognized in an amount equal to that excess, not to exceed the carrying amount of the goodwill. During2005 and 2004, the Company tested its goodwill balances for impairment and no adjustments were recorded to goodwill as a result ofthose reviews.
50

Other intangibles consist of the following:
December 31, 2005 December 31, 2004 Gross Accumulated Gross Accumulated Amount Amortization Amount Amortization (In millions) Amortized intangible assets:
Customer relationships $ 264.2 $ (194.8) $ 265.5 $ (188.3)Other 41.1 (11.9) 30.1 (7.2)
Total $ 305.3 $ (206.7) $ 295.6 $ (195.5)
Indefinite-lived intangible assets: Trademarks/tradenames $ 245.5 $ (17.2) $ 205.3 $ (17.2)Pension intangible asset 34.4 — 39.8 —
Total $ 279.9 $ (17.2) $ 245.1 $ (17.2)
Gross amounts and related accumulated amortization amounts include adjustments related to the impact of foreign currencytranslation and changes in the fair value of net assets subject to purchase accounting adjustments, primarily arising from the Company’sacquisitions as described in Note 5. Acquisitions.
The costs of amortizable intangible assets are amortized over their expected useful lives using the straight-line method. Aggregateamortization expense for intangibles was $11.8 million, $18.9 million and $14.4 million for the years ended December 31, 2005, 2004and 2003, respectively. Patents, non-compete agreements and other intangible assets are included in Amortized intangible assets —Other.
Estimated amortization expense for intangible assets is $12.3 million for the year ended December 31, 2006 and $12.0 million peryear from 2007 through 2010. The reduction in amortization expense in 2005 compared with 2004 relates to the completion of intangibleamortization assigned to customer relationships from the 1986 acquisition of the Boat segment’s Sea Ray operations.
A summary of changes in the Company’s goodwill during the period ended December 31, 2005, by segment is as follows:
December31,
December31,
2004 Acquisitions Adjustments 2005 (In millions) Boat $ 284.9 $ 31.9 $ (3.6) $ 313.2 Marine Engine 59.3 10.1 (1.1) 68.3 Fitness 267.3 — (1.5) 265.8 Bowling & Billiards 13.3 1.2 — 14.5
Total $ 624.8 $ 43.2 $ (6.2) $ 661.8
A summary of changes in the Company’s goodwill during the period ended December 31, 2004, by segment is as follows:
December31,
December31,
2003 Acquisitions Adjustments 2004 (In millions) Boat $ 213.1 $ 71.8 $ 0.0 $ 284.9 Marine Engine 23.5 30.7 5.1 59.3 Fitness 265.6 0.3 1.4 267.3 Bowling & Billiards 12.9 0.4 — 13.3
Total $ 515.1 $ 103.2 $ 6.5 $ 624.8
Adjustments in 2005 and 2004 primarily relate to the impact of foreign currency translation and changes in the fair value of netassets subject to purchase accounting adjustments, primarily arising from the Company’s acquisitions as described in Note 5.Acquisitions. There were no impairment charges for the years ended December 31, 2005, 2004 and 2003.
Investments. For investments in which the Company owns or controls from 20 percent to 50 percent of the voting shares, whichincludes all of the Company’s unconsolidated joint venture investments, the equity method of accounting is used. The Company’s share

of net earnings or losses from equity method investments is outlined i n Note 6. Investments and is included in the ConsolidatedStatements of Income. The Company accounts for its long-term investments that represent less than 20 percent ownership using SFASNo. 115, “Accounting for Certain Investments in Debt and Equity Securities.” The Company has investments in certain equity securitiesthat have readily determinable market values and are being accounted for as available-for-sale equity investments in accordance withSFAS No. 115. Therefore, these investments are recorded at market value with changes reflected in Accumulated other comprehensiveincome (loss), a component of Shareholders’ equity, on an after-tax basis.
51

Other investments for which the Company does not have the ability to exercise significant influence and for which there is not areadily determinable market value are accounted for under the cost method of accounting. The Company periodically evaluates thecarrying value of its investments, and at December 31, 2005 and 2004, such investments were recorded at the lower of cost or fair value.
Long-Lived Assets. In accordance with SFAS No. 144, “Accounting for the Impairment or Disposal of Long-Lived Assets,” theCompany continually evaluates whether events and circumstances have occurred that indicate the remaining estimated useful lives of itsintangible assets, excluding goodwill, and other long-lived assets may warrant revision or that the remaining balance of such assets maynot be recoverable. The Company uses an estimate of the related undiscounted cash flows over the remaining life of the asset inmeasuring whether the asset is recoverable. During 2005 and 2004, the Company tested its intangible asset balances for impairment andno adjustments were recorded as a result of those reviews.
Other Long-Term Assets. Other long-term assets include pension assets, which are discussed in Note 13. Pension and OtherPostretirement Benefits, a n d long-term notes receivable. Long-term notes receivable include cash advances made to customers,principally boatbuilders and fitness equipment customers, or their owners, in connection with long-term supply arrangements. Thesetransactions have occurred in the normal course of business and are backed by secured or unsecured notes receivable that are reduced aspurchases of qualifying products are made. Credits earned by these customers through qualifying purchases are applied to theoutstanding note balance in lieu of payment. The reduction in the note receivable balance is recorded as a reduction in the Company’ssales revenue as a sales discount. In the event sufficient product purchases are not made, the outstanding balance remaining under thenotes is subject to full collection. Amounts outstanding related to these arrangements as of December 31, 2005 and 2004, totaled $40.7million and $36.9 million, respectively. One boatbuilder customer and its owner comprised approximately 55 percent and 75 percent ofboth of these amounts as of December 31, 2005 and 2004, respectively.
Other long-term notes receivable also include certain agreements that provide for the assignment of lease and other long-termreceivables originated by the Company to third parties. As of December 31, 2005 and 2004, these amounts totaled $123.1 million and$116.3 million, respectively. Under SFAS No. 140, “Accounting for Transfers and Servicing of Financial Assets and Extinguishments ofLiabilities,” the assignment is not treated as a sale of the associated receivables, but as a secured obligation. Accordingly, these amountswere recorded in the Consolidated Balance Sheets under Other long-term assets and Long-term liabilities — Other.
Revenue Recognition. The Company’s revenue is derived primarily from the sale of boats, marine engines, global positioningsystems-based products, fitness equipment, bowling products and billiard tables. Revenue is recognized in accordance with the terms ofthe sale, primarily upon shipment to customers, once the sales price is fixed or determinable and collectibility is reasonably assured. TheCompany offers discounts and sales incentives that include retail promotional activities, rebates and manufacturer coupons. Theestimated liability for sales incentives is recorded at the later of when the program has been communicated to the customer or at the timeof sale in accordance with Emerging Issues Task Force (EITF) No. 01-9, “Accounting for Consideration Given by a Vendor to aCustomer (Including a Reseller of a Vendor’s Products).” Revenues from freight are included as a part of Net sales in the ConsolidatedStatements of Income, whereas shipping, freight and handling costs are included in Cost of Sales.
Advertising Costs. Advertising and promotion costs, included in SG&A expenses, are expensed when the advertising first takesplace. Advertising and promotion costs were $74.3 million, $66.9 million and $56.9 million for the years ended December 31, 2005,2004 and 2003, respectively.
Foreign Currency. The functional currency for the majority of the Company’s operations is the U.S. dollar. All assets and liabilitiesof operations with a functional currency other than the U.S. dollar are translated at current rates. The resulting translation adjustmentsare charged to Accumulated other comprehensive income (loss) in the Consolidated Statements of Shareholders’ Equity, net of tax.Revenues and expenses of operations with a functional currency other than the U.S. dollar are translated at the average exchange ratesfor the period.
52

Comprehensive Income. Accumulated other comprehensive income (loss) includes minimum pension liability adjustments,currency translation adjustments and unrealized derivative and investment gains and losses. The net effect of these items reducedShareholders’ equity on a cumulative basis by $66.1 million at year-end 2005 and $54.3 million at year-end 2004. The $11.8 millionchange from 2004 to 2005 is primarily due to the change in unrealized investment gains of $23.3 million due to the sale of marketableequity securities and unfavorable foreign currency translation adjustments of $18.1 million, partially offset by unrealized gains onderivatives of $19.9 million. The tax effect included in Accumulated other comprehensive income (loss) was $43.0 million and $31.7million for the years ended December 31, 2005 and 2004, respectively.
Stock-Based Compensation. See Note 14. Stock Plans and Management Compensation for a description of the Company’s stock-
based compensation plans. The Company complies with the disclosure provisions of SFAS No. 148, “Accounting for Stock-BasedCompensation - Transition and Disclosure.” As it relates to stock options, the Company continues to apply the provisions of AccountingPrinciples Board Opinion (APB) No. 25, “Accounting for Stock Issued to Employees.” Under APB No. 25, the Company recognizes nocompensation cost related to stock options granted in its Consolidated Statements of Income because the option terms are fixed and theexercise price equals the market price of the underlying stock on the grant date. The cost of restricted stock awards is recognized on astraight-line basis over the requisite service period. In accordance with Statement of Financial Accounting Standards (SFAS) No. 123,“Accounting for Stock-Based Compensation,” the fair value of option grants is estimated on the date of grant using the Black-Scholesoption pricing model for pro forma footnote purposes.
The following table illustrates the effect on net income and earnings per share if the Company had applied the fair value recognitionprovisions of SFAS No. 123 to all its outstanding stock option plans during the years ended December 31:
2005 2004 2003 (In millions, except per share data) Net Earnings
As reported $ 385.4 $ 269.8 $ 135.2 Add: Stock-based employee compensation included in
reported earnings, net of tax 2.1 6.2 2.8
Less: Total stock-based employee compensation expensedetermined under fair value-based method for allawards, net of tax
9.1 11.2 8.2
Pro forma $ 378.4 $ 264.8 $ 129.8 Basic earnings per common share
As reported $ 3.95 $ 2.82 $ 1.48 Pro forma $ 3.88 $ 2.77 $ 1.42
Diluted earnings per common share As reported $ 3.90 $ 2.77 $ 1.47 Pro forma $ 3.83 $ 2.72 $ 1.41
Derivatives. The Company uses derivative financial instruments to manage its risk associated with movements in foreign currencyexchange rates, interest rates and commodity prices. These instruments are used in accordance with guidelines established b y theCompany’s management and are not used for trading or speculative purposes. All derivatives are recorded on the consolidated balancesheet at fair value. See Note 10. Financial Instruments for further discussion.
Recent Accounting Pronouncements. In November 2004, the FASB issued SFAS No. 151, “Inventory Costs - an amendment ofARB No. 43 Chapter 4.” SFAS No. 151 more clearly defines when excessive idle facility expense, freight, handling costs and spoilageare to be current-period charges. In addition, SFAS No. 151 requires the allocation of fixed production overhead to the cost ofconversion to be based on the normal capacity of the production facilities. SFAS No. 151 is effective for inventory costs incurred duringfiscal years beginning after June 15, 2005. The Company does not expect SFAS No. 151 to have a material impact on the financialstatements.
In December 2004, the FASB issued SFAS No. 123 (revised 2004), “Share-Based Payment,” (SFAS No. 123R). SFAS No. 123Reliminates the intrinsic value method under Accounting Principles Board Opinion (APB) No. 25, “Accounting for Stock Issued toEmployees,” and requires the Company to use a fair value-based method of accounting for share-based payments. Under APB No. 25,no compensation cost related to stock options is recognized in the Consolidated Statements of Income. SFAS No. 123R requires thatcompensation cost for employee services received in exchange for an award of equity instruments be recognized in the ConsolidatedStatements of Income based on the grant-date fair value of that award. The cost recognized at the grant date will be amortized in theConsolidated Statements of Income over the period during which an employee is required to provide service in exchange for that award(requisite service period). For the Company, SFAS No. 123R is effective as of the beginning of the first quarter of 2006. The Companycurrently anticipates the impact of adoption of SFAS No. 123R to increase operating expenses by approximately $7 million in 2006.
53

In December 2004, the FASB issued SFAS No. 153, “Exchanges of Nonmonetary Assets - an amendment of APB Opinion No. 29.”SFAS No. 153 amends APB No. 29 to require that assets exchanged in a nonmonetary transaction are to be measured at fair value exceptfor those exchanges of nonmonetary assets that lack commercial substance. SFAS No. 153 is effective for nonmonetary asset exchangesoccurring in fiscal years beginning after June 15, 2005. The Company does not expect SFAS No. 153 to have a material impact on thefinancial statements.
In March 2005, the Financial Accounting Standards Board (FASB) issued FASB Interpretation No. 47, “Accounting for Conditional
Asset Retirement Obligations” (FIN No. 47). FIN No. 47 clarifies the accounting for conditional asset retirement obligations as used inStatement of Financial Accounting Standards (SFAS) No. 143, “Accounting for Asset Retirement Obligations.” A conditional assetretirement obligation is an unconditional legal obligation to perform an asset retirement activity in which the timing and (or) method ofsettlement are conditional on a future event that may or may not be within the control of the entity. Therefore, an entity is required torecognize a liability for the fair value of a conditional asset retirement obligation under SFAS No. 143 if the fair value of the liabilitycan be reasonably estimated. The provisions of FIN No. 47 are effective for reporting periods ending after December 15, 2005. TheCompany is currently evaluating the impact of adopting FIN No. 47, but does not anticipate it will have a material impact on thefinancial statements.
2. Standardization of Vacation Policy
To encourage the mobility of talent, the Company has been implementing an initiative to standardize benefits across its divisions.Under this initiative, the Company approved a new policy related to salaried employee vacation pay during the second quarter of 2003.The new policy was communicated to employees and became effective June 1, 2003. Eligible employees now earn vacation pay ratablyover the course of the period during which services are rendered. The new policy provides for certain exceptions for long-servicedemployees approaching retirement age and to comply with state law.
Prior to June 1, 2003, certain divisions of the Company had a policy in which eligible employees received an annual vacation granton the last day of the year, to be taken in the next calendar year. Additionally, eligible employees were able to take vacationimmediately to the full extent of the grant. In the event of an employee’s termination, the employee was entitled to receive cashcompensation for vacation time not taken from the annual grant. As a result, the Company previously had accrued the full vacationliability as of the beginning of each year as required by SFAS No. 43, “Accounting for Compensated Absences.”
As a result of the change in the vacation policy, of the previously recorded vacation liability of $11.6 million existing as of June 1,2003, $6.1 million pre-tax ($4.0 million after-tax) was reversed and reflected as reductions in both Cost of sales, and Selling, general,and administrative expenses in the Consolidated Statements of Income for 2003. The policy does not have an impact on the futureamount of vacation expense recorded by the Company on an annual basis.
3. Earnings per Common Share
The Company calculates earnings per share in accordance with SFAS No. 128, “Earnings Per Share.” Basic earnings per share iscalculated by dividing net earnings by the weighted average number of common shares outstanding during the period. Diluted earningsper share is calculated similarly, except that the calculation includes the dilutive effect of stock options and nonvested restrictedshares. Average basic shares increased by 2.0 million in 2005 compared with 2004 primarily due to shares issued upon the exercise ofemployee stock options, partially offset by the stock repurchase program. Average basic shares increased by 4.4 million in 2004compared with 2003 primarily due to shares issued upon the exercise of employee stock options.
Basic and diluted earnings per share for the years ended December 31, are calculated as follows:
2005 2004 2003 (In millions, except per share data) Net earnings $ 385.4 $ 269.8 $ 135.2 Average outstanding shares — basic 97.6 95.6 91.2
Dilutive effect of common stock equivalents 1.2 1.7 0.7
Average outstanding shares — diluted 98.8 97.3 91.9
Earnings per share: Basic $ 3.95 $ 2.82 $ 1.48 Diluted $ 3.90 $ 2.77 $ 1.47
54
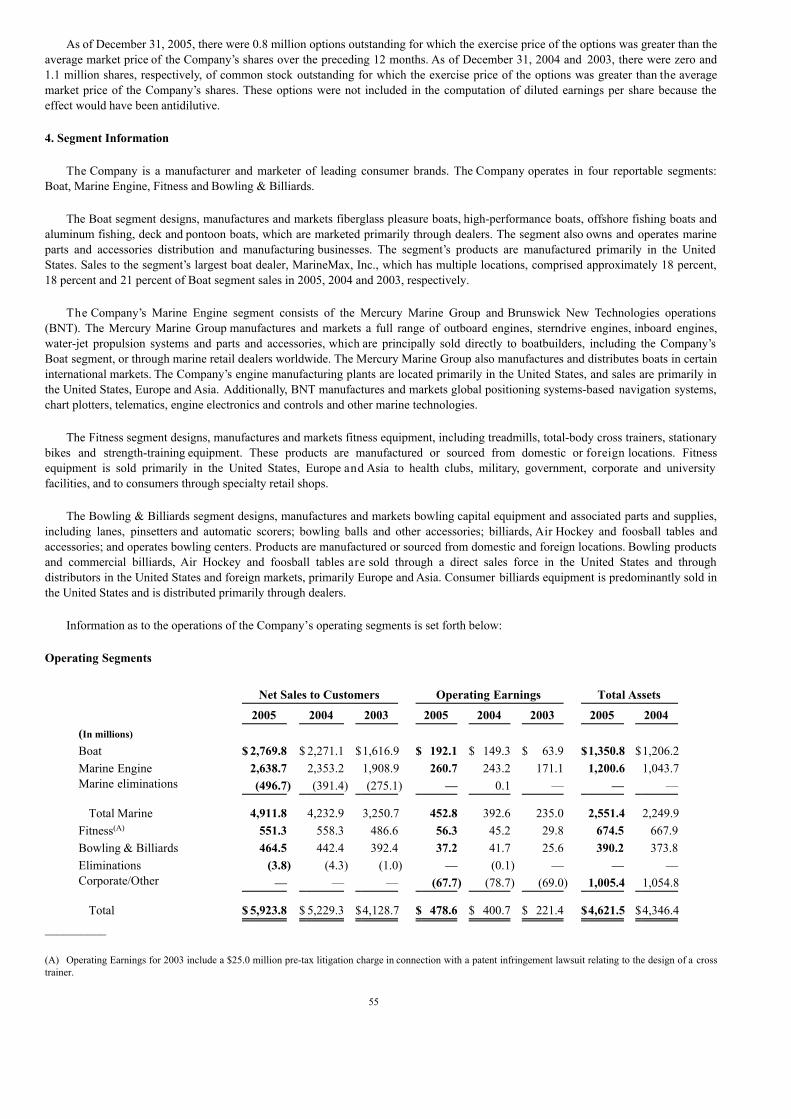
As of December 31, 2005, there were 0.8 million options outstanding for which the exercise price of the options was greater than theaverage market price of the Company’s shares over the preceding 12 months. As of December 31, 2004 and 2003, there were zero and1.1 million shares, respectively, of common stock outstanding for which the exercise price of the options was greater than the averagemarket price of the Company’s shares. These options were not included in the computation of diluted earnings per share because theeffect would have been antidilutive. 4. Segment Information
The Company is a manufacturer and marketer of leading consumer brands. The Company operates in four reportable segments:Boat, Marine Engine, Fitness and Bowling & Billiards.
The Boat segment designs, manufactures and markets fiberglass pleasure boats, high-performance boats, offshore fishing boats andaluminum fishing, deck and pontoon boats, which are marketed primarily through dealers. The segment also owns and operates marineparts and accessories distribution and manufacturing businesses. The segment’s products are manufactured primarily in the UnitedStates. Sales to the segment’s largest boat dealer, MarineMax, Inc., which has multiple locations, comprised approximately 18 percent,18 percent and 21 percent of Boat segment sales in 2005, 2004 and 2003, respectively.
The Company’s Marine Engine segment consists of the Mercury Marine Group and Brunswick New Technologies operations(BNT). The Mercury Marine Group manufactures and markets a full range of outboard engines, sterndrive engines, inboard engines,water-jet propulsion systems and parts and accessories, which are principally sold directly to boatbuilders, including the Company’sBoat segment, or through marine retail dealers worldwide. The Mercury Marine Group also manufactures and distributes boats in certaininternational markets. The Company’s engine manufacturing plants are located primarily in the United States, and sales are primarily inthe United States, Europe and Asia. Additionally, BNT manufactures and markets global positioning systems-based navigation systems,chart plotters, telematics, engine electronics and controls and other marine technologies.
The Fitness segment designs, manufactures and markets fitness equipment, including treadmills, total-body cross trainers, stationarybikes and strength-training equipment. These products are manufactured or sourced from domestic or foreign locations. Fitnessequipment is sold primarily in the United States, Europe and Asia to health clubs, military, government, corporate and universityfacilities, and to consumers through specialty retail shops.
The Bowling & Billiards segment designs, manufactures and markets bowling capital equipment and associated parts and supplies,including lanes, pinsetters and automatic scorers; bowling balls and other accessories; billiards, Air Hockey and foosball tables andaccessories; and operates bowling centers. Products are manufactured or sourced from domestic and foreign locations. Bowling productsand commercial billiards, Air Hockey and foosball tables are sold through a direct sales force in the United States and throughdistributors in the United States and foreign markets, primarily Europe and Asia. Consumer billiards equipment is predominantly sold inthe United States and is distributed primarily through dealers.
Information as to the operations of the Company’s operating segments is set forth below:
Operating Segments
Net Sales to Customers Operating Earnings Total Assets 2005 2004 2003 2005 2004 2003 2005 2004 (In millions) Boat $ 2,769.8 $ 2,271.1 $1,616.9 $ 192.1 $ 149.3 $ 63.9 $1,350.8 $1,206.2 Marine Engine 2,638.7 2,353.2 1,908.9 260.7 243.2 171.1 1,200.6 1,043.7 Marine eliminations (496.7) (391.4) (275.1) — 0.1 — — —
Total Marine 4,911.8 4,232.9 3,250.7 452.8 392.6 235.0 2,551.4 2,249.9 Fitness(A) 551.3 558.3 486.6 56.3 45.2 29.8 674.5 667.9 Bowling & Billiards 464.5 442.4 392.4 37.2 41.7 25.6 390.2 373.8 Eliminations (3.8) (4.3) (1.0) — (0.1) — — — Corporate/Other — — — (67.7) (78.7) (69.0) 1,005.4 1,054.8
Total $ 5,923.8 $ 5,229.3 $4,128.7 $ 478.6 $ 400.7 $ 221.4 $4,621.5 $4,346.4 __________
(A) Operating Earnings for 2003 include a $25.0 million pre-tax litigation charge in connection with a patent infringement lawsuit relating to the design of a crosstrainer.
55

Marine eliminations are eliminations between the Marine Engine and Boat segments for sales transactions consummated at arm’s
length. Corporate/Other includes such items as corporate staff and overhead, and financial results of the Company’s subsidiaryBrunswick Financial Services. Corporate/Other assets consist primarily of cash and marketable securities, prepaid income taxes andinvestments in unconsolidated affiliates.
Depreciation Amortization 2005 2004 2003 2005 2004 2003 (In millions) Boat $ 50.0 $ 45.5 $ 46.2 $ 8.5 $ 15.6 $ 12.6 Marine Engine 63.8 58.2 54.8 2.1 1.7 0.8 Fitness 11.8 11.9 12.5 0.3 0.6 0.4 Bowling & Billiards 20.5 20.1 19.4 0.9 1.0 0.6 Corporate/Other 4.3 2.9 3.3 — — —
Total $ 150.4 $ 138.6 $ 136.2 $ 11.8 $ 18.9 $ 14.4
Research & Development Capital Expenditures Expense 2005 2004 2003 2005 2004 2003 (In millions) Boat $ 74.6 $ 56.3 $ 38.5 $ 34.7 $ 27.2 $ 25.6 Marine Engine 101.5 76.4 68.1 89.9 82.0 70.0 Fitness 11.1 8.3 14.9 14.2 16.0 16.9 Bowling & Billiards 36.8 27.7 34.8 5.9 5.9 5.7 Corporate/Other 9.6 2.6 3.5 — — —
Total $ 233.6 $ 171.3 $ 159.8 $ 144.7 $ 131.1 $ 118.2
Geographic Segments
Net Sales to Customers Long-Lived Assets 2005 2004 2003 2005 2004 (In millions) United States $ 3,874.6 $ 3,540.1 $ 2,886.5 $ 1,878.8 $ 1,716.9International 2,049.2 1,689.2 1,242.2 296.4 278.1Corporate/Other — — — 211.3 252.7
Total $ 5,923.8 $ 5,229.3 $ 4,128.7 $ 2,386.5 $ 2,247.7
The Company evaluates performance based on business segment operating earnings. Operating earnings of segments do not includethe expenses of corporate administration, other expenses and income of a non-operating (including earnings from equity affiliates) orstrategic nature, interest expense or provisions for income taxes. Corporate/Other assets consist primarily of cash and marketablesecurities, prepaid income taxes and investments in unconsolidated affiliates.
56

5. Acquisitions
All acquisitions are accounted for under the purchase method and in accordance with SFAS No. 141, “Business Combinations.”
In 2005, cash paid for acquisitions, net of debt and cash acquired, was as follows:
(In millions)
Date
Name/Description
Net Cash
Consideration(A)
Other
Consideration
Total
Consideration
2/07/05 Benrock, Inc. $ 4.2 $ - $ 4.2 2/28/05 Albemarle Boats, Inc. 9.2 - 9.2 4/21/05 Sea Pro, Sea Boss and Palmetto boats 1.0 - 1.0 4/29/05 MX Marine, Inc. 2.4 - 2.4 5/27/05 Triton Boat Company, L.P. 58.4 4.4 62.8 6/20/05 Supra-Industria Textil, Lda. (51 percent) 7.8 0.9 8.7 6/27/05 Marine Innovations Warranty Corporation 2.3 - 2.3 7/07/05 Kellogg Marine, Inc. 41.7 - 41.7 9/16/05 Harris Kayot Marine, LLC 4.8 - 4.8
Miscellaneous 3.7 1.0 4.7
$ 135.5 $ 6.3 $ 141.8
(A) Net cash consideration is subject to subsequent changes resulting from final purchase agreement adjustments.
The Company acquired the receivables, inventory, property and equipment of Benrock, Inc. (Benrock) for $4.2 million. Benrock isa distributor of marine parts and expands the Company’s geographic coverage of its parts and accessories businesses distribution networkserving the central and southern United States markets. The post-acquisition results of Benrock are included in the Boat segment.
The Company acquired the outstanding stock of Albemarle Boats, Inc. (Albemarle) for $9.2 million. Albemarle produces offshoresportfishing boats ranging in length from 24 to 41 feet. The acquisition of Albemarle provides the Company with the opportunity to offera more complete range of offshore sportfishing boats and complements the sportfishing convertibles offered by Hatteras, whose productsstart at 50 feet. The post-acquisition results of Albemarle are included in the Boat segment.
The Company made a final payment of $1.0 million for the December 31, 2004, acquisition of Sea Pro, Sea Boss and Palmetto boats(Sea Pro). This payment was based on finalization of the closing balance sheet. The post-acquisition results of Sea Pro are included inthe Boat segment.
T h e Company acquired certain assets of MX Marine, Inc. (MX Marine) for $2.4 million. MX Marine manufactures globalpositioning systems, navigation systems and other marine electronics for the commercial market. The acquisition of MX Marineprovides a new channel for the Company’s offerings of global positioning systems, navigation systems and other marine electronics. Thepost-acquisition results of MX Marine are included in the Marine Engine segment.
The Company acquired the outstanding stock of Triton Boat Company, L.P. (Triton), a manufacturer of fiberglass bass andfreshwater boats, and aluminum fishing boats ranging in length from 12 to 35 feet. The Company funded this acquisition through cashconsideration of $58.4 million and the assumption of $4.4 million of debt. The acquisition of Triton adds freshwater bass boats to theCompany’s product lineup, as well as a broader range of saltwater and aluminum fishing boats. The post-acquisition results of Tritonare included in the Boat segment.
The Company exercised its contractual right to acquire its joint venture partner’s 51.0 percent interest in Supra-Industria Textil, Lda.(Valiant), a Portuguese manufacturer of the Valiant brand of rigid inflatable boats, for $7.8 million and the assumption of debt. TheCompany is now the sole owner of Valiant. The post-acquisition results of Valiant are included in the Marine Engine segment.
57

The Company made an additional payment of $2.3 million for the April 1, 2004, acquisition of Marine Innovations WarrantyCorporation (Marine Innovations). This payment was required under the purchase agreement as Marine Innovations fulfilled earningstargets. The post-acquisition results of Marine Innovations are included in the Boat segment.
The Company acquired the net assets of Kellogg Marine, Inc. (Kellogg) for $41.7 million. Kellogg is a leading distributor of marineparts and accessories headquartered in Old Lyme, Connecticut. The acquisition of Kellogg complements the Company’s previousacquisitions of Benrock and Land ‘N’ Sea and provides a distribution hub in the northeastern United States. The post-acquisition resultsof Kellogg are included in the Boat segment.
The Company acquired the outstanding stock of Harris Kayot Marine, LLC. (Harris Kayot), a builder of pontoon boats, fiberglass
runabouts and deckboats ranging in length from 20 to 26 feet, for $4.8 million. This acquisition advances the Company’s position in thepontoon market and complements the Company’s existing boat portfolio with premium runabout and deckboat product lines. The post-acquisition results of Harris Kayot are included in the Boat segment.
The 2005 acquisitions contributed to an increase in sales in the period-over-period comparisons, but were not material to theCompany’s results of operations or total assets. Accordingly, the Company’s consolidated results from operations would not differmaterially from historical performance.
In 2004, cash paid for acquisitions, net of debt and cash acquired, was as follows:
(In millions)
Date
Name/Description
Net Cash
Consideration(A)
Other
Consideration
Total
Consideration
3/19/04 Vulcan-Bowling Pin Company and
Vulcan-Brunswick Bowling Pin Company $ 1.3
$ —
$ 1.3
4/01/04 Lowe, Lund, Crestliner 191.0 — 191.0 4/01/04 Marine Innovations Warranty Corporation 5.4 — 5.4 6/01/04 Navman NZ Limited (30 percent) 16.4 16.6 33.0
12/31/04 Sea Pro, Sea Boss and Palmetto boats 50.1 — 50.1 Miscellaneous 3.6 — 3.6
$ 267.8 $ 16.6 $ 284.4
(A) Net cash consideration is subject to subsequent changes resulting from final purchase agreement adjustments.
The Company acquired its joint venture partner’s share of a bowling pin operation for $1.3 million, allowing the Company toincrease its ability to manufacture, distribute and market its own bowling pins. The post-acquisition results o f these businesses areincluded in the Bowling & Billiards segment.
The Company acquired the outstanding stock of four aluminum boat companies for $191.0 million. These companies include:Minnesota-based Crestliner, Inc. and Lund Boat Company; Lowe Boats, Inc., based in Missouri; and Lund Boats Canada, Inc., whichmanufactures and sells the Lund brand in Canada. They produce numerous models of aluminum fishing, pontoon, deck and utility boatsranging from 10 to 25 feet. These boat companies provide the Company with the opportunity to offer products in all major aluminumboat segments. The purchase agreement provides for additional consideration of up to $30 million to be paid in three years based on theachievement of a minimum 10 percent after-tax cash flow return on total investment over that time period. The post-acquisition resultsof the aluminum boat companies are included in the Boat segment.
The Company acquired the net assets, including working capital and other intangibles, of Marine Innovations Warranty Corporation(Marine Innovations), a provider of extended warranty protection for the marine industry, for $5.4 million. This acquisition expands thefinancial services offered by the Company to its dealers. The purchase agreement provides for additional consideration of up to $6.0million based on financial performance during the years 2004, 2005 and 2006. The post-acquisition results of Marine Innovations areincluded in the Boat segment.
The Company acquired the remaining 30 percent of outstanding stock of Navman NZ Limited (Navman), a New Zealand-basedmanufacturer of marine electronics a n d global positioning systems-based products. The Company purchased 70 percent o f theoutstanding stock of Navman in 2003 (detailed below). Consideration for the remaining outstanding stock of Navman was fundedthrough cash and 410,287 shares of the Company’s common stock. The acquisition of Navman complements the Company’s expansioninto marine-based electronics and integration. The results of operations of Navman post-acquisition are included in the Marine Enginesegment.
58

The Company acquired the outstanding stock of Sea Pro Boats, Inc., (Sea Pro) and net assets, including working capital and otherintangibles, of Sea Boss Boats, LLC, (Sea Boss) manufacturers of the Sea Pro, Palmetto and Sea Boss brands of saltwater fishing boatsat December 31, 2004. These acquisitions were funded through cash consideration of $50.1 million. These acquisitions provide theCompany with the opportunity to offer a distinctive array of offshore saltwater fishing boats. The post-acquisition results of Sea Pro andSea Boss are included in the Boat segment in 2005.
The 2004 acquisitions did contribute to an increase in sales in the period-over-period comparisons, but were not material to theCompany’s results of operations or total assets. Accordingly, the Company’s consolidated results from operations would not differmaterially from historical performance.
In 2003, cash paid for acquisitions, net of cash acquired, and other consideration provided was as follows:
(In millions)
Date
Company Name
Cash
Consideration(A)
Other
Consideration
Total
Consideration
6/10/03 Valley-Dynamo, LP $ 33.7 $ — $ 33.7 6/23/03 Land ‘N’ Sea Corporation 30.4 23.4 53.8 6/23/03 Navman NZ Limited (70 percent) 37.3 — 37.3 7/01/03 New Eagle Software LLC 1.5 — 1.5 9/02/03 Attwood Corporation 47.5 — 47.5 9/15/03 Protokon, LLC (80 percent) 7.0 — 7.0 9/17/03 Hatteras Yachts, Inc. 19.4 — 19.4 9/30/03 Accelerate Performance Products, LLC 0.5 — 0.5
$ 177.3 $ 23.4 $ 200.7
(A) Net of cash acquired. Cash consideration includes debt of acquired entities retired immediately after the close of the transactions.
The Company acquired the net assets, including working capital and fixed assets, o f Valley-Dynamo LP (Valley-Dynamo), amanufacturer of commercial and consumer billiards, Air Hockey and foosball tables, for $33.7 million in cash. The acquisition ofValley-Dynamo added new products and distribution channels to the Company’s billiards operations. The results of operations ofValley-Dynamo post-acquisition are included in the Bowling & Billiards segment.
The Company acquired the outstanding stock of Land ‘N’ Sea Corporation (Land ‘N’ Sea), a distributor of marine parts andaccessories. The Company funded this acquisition through cash consideration of $30.4 million, which consisted of a $9.0 millionpayment and the assumption and immediate retirement of $21.4 million of Land ‘N’ Sea debt. Total consideration of $53.8 million paidfor Land ‘N’ Sea also includes $12.0 million in notes issued to the seller and a previously held equity interest. Land ‘N’ Sea providedthe Company with the infrastructure and distribution network for its boat parts and accessories business. The results of operations ofLand ‘N’ Sea post-acquisition are included in the Boat segment.
The Company acquired 70 percent of the outstanding stock of Navman NZ Limited (Navman), a New Zealand-based manufacturerof marine electronics and global positioning systems-based products. This acquisition was funded through cash consideration of $37.3million, which consisted of a $32.6 million payment and the assumption and immediate retirement of $4.7 million of debt.
The Company acquired the net assets, including working capital, of New Eagle Software LLC (New Eagle), a systems consultingand software provider, for $1.5 million in cash. The acquisition of New Eagle enhanced the Company’s ability to leverage BNT’sMotoTron engine control technology. The results of operations of New Eagle post-acquisition are included in the Marine Enginesegment.
T h e Company acquired the net assets, including working capital and fixed assets, o f Attwood Corporation (Attwood), amanufacturer of marine hardware and accessories, for $47.5 million in cash. The acquisition of Attwood provided the Company with themanufacturing capabilities and infrastructure to develop and expand its boat parts and accessories business. The results of operations ofAttwood post-acquisition are included in the Boat segment.
The Company acquired 80 percent of the outstanding stock of Protokon LLC (Protokon), a Hungarian steel fabricator and electronicequipment manufacturer, which was funded through cash consideration of $7.0 million. The acquisition of Protokon will allow theCompany to manufacture fitness equipment closer to the European marketplace, thereby reducing freight costs and offering betterservice t o fitness customers in Europe. The Company has an option to acquire the remaining interest in Protokon under certaincircumstances. The results of operations of Protokon post-acquisition are included in the Fitness segment.
59

The Company acquired the net assets, including working capital, of Accelerate Performance Products, LLC (APP), a power-trainsoftware tool provider, for $0.5 million. This acquisition complements BNT’s MotoTron engine control technology. The results ofoperations of APP post-acquisition are included in the Marine Engine segment.
Acquisitions in 2003 did contribute to an increase in sales in the period-over-period comparisons, but were not material to theCompany’s results of operations and total assets. Accordingly, the Company’s consolidated results from operations would not differmaterially from historical performance.
I n addition to the acquisitions listed above, the Company made a final payment o f $19.4 million in 2003 related to the 2001acquisition of Hatteras Yachts, Inc. (Hatteras). This payment was required under the purchase agreement as Hatteras fulfilled earningstargets.
Purchase price allocations for acquisitions are subject to adjustment, pending final third party valuations, up to one year from thedate of acquisition. Any adjustments are not expected to be material to the Consolidated Balance Sheets. The following table shows thegross amount of goodwill and intangible assets recorded as of December 31 for the acquisitions completed in 2005, 2004 and 2003:
Weighted Average
Value Assigned toCurrent Year Acquisitions
Useful Life Assigned toCurrent YearAcquisitions
2005 2004 2003 2005 2004 (In millions) Indefinite-lived:
Goodwill $ 43.2 $ 103.2 $ 59.2 Trademarks/tradenames $ 26.9 $ 113.9 $ 35.5
Amortizable: Customer relationships $ 19.9 $ 19.5 $ 32.7 11 years 15 years Other $ 6.0 $ 13.2 $ 6.9 6 years 7 years
6. Investments
The Company has certain unconsolidated foreign and domestic affiliates that are accounted for using the equity method. Refer toNote 7. Financial Services for more details on the Company’s Brunswick Acceptance Company, LLC joint venture. The Company alsocontributed $0.2 million and $4.2 million to other existing joint ventures in 2005 and 2004, respectively.
In January of 2003, the Company paid $9.4 million to acquire a 36 percent equity interest in Bella-Veneet OY (Bella), a boatmanufacturer located in Finland. The Company has the option to acquire the remaining equity interest in Bella in 2007. In July of 2003,the Company paid $5.5 million to acquire a 49 percent equity interest in Rayglass Sales and Marketing Limited (Rayglass), a boatmanufacturer located in New Zealand. The Company has the option to acquire the remaining equity interest in Rayglass in 2008. Also,in July of 2003, the Company paid $2.4 million for a 50 percent equity interest to establish a joint venture with Cummins Marine(Cummins), a division of Cummins Inc., to form Cummins MerCruiser Diesel South Pacific Pty Limited (CMDSP). CMDSP offers afu l l range of diesel marine propulsion systems in Australia and other South Pacific regions. All the above investments areunconsolidated and are accounted for under the equity method.
The Company received dividends from its unconsolidated affiliates of $12.3 million, $13.1 million and $6.8 million for the yearsended December 31, 2005, 2004 and 2003, respectively.
The Company’s sales to and purchases from its investments, along with the corresponding receivables and payables, were notmaterial to the Company’s overall results of operations for the years ended December 31, 2005, 2004 and 2003, respectively, and itsfinancial position as of December 31, 2005 and 2004.
On February 23, 2005, the Company sold its investment of 1,861,200 shares in MarineMax, Inc. (MarineMax), its largest boatdealer, for $56.8 million, net of $4.1 million of selling costs, which included $1.1 million of accrued expenses. The sale was madepursuant to a registered public offering by MarineMax. As a result of this sale, the Company recorded an after-tax gain of $31.5 millionafter utilizing previously unrecognized capital loss carryforwards.
60

As of December 31, 2004, the Company’s investment in MarineMax was recorded in the Consolidated Balance Sheets in Otherassets-Investments at its fair market value of $55.4 million, with the unrealized after-tax gain of $22.8 million ($37.3 million pre-tax)included as a part of Shareholders’ equity in Accumulated other comprehensive loss. 7. Financial Services
The Company has a joint venture, Brunswick Acceptance Company, LLC (BAC), with GE Commercial Finance (GECF). Under theterms of the joint venture agreement, BAC provides secured wholesale floor-plan financing to the Company’s boat and engine dealers.BAC also purchases and services a portion of Mercury Marine’s domestic accounts receivable relating to its boat builder and dealercustomers.
In January of 2003, the Company’s subsidiary, Brunswick Financial Services Corporation (BFS), invested $3.3 million in BAC,which represented a 15 percent ownership interest. On July 2, 2003, BFS contributed an additional $19.5 million to increase its equityinterest in BAC to 49 percent, as provided for by the terms of the joint venture agreement. BFS’s contributed equity is adjusted monthlyto maintain a 49 percent equity interest in accordance with the capital provisions of the joint venture agreement. BFS’s investment inBAC is accounted for by the Company under the equity method and is recorded as a component of Investments in its ConsolidatedBalance Sheets. The Company has funded its investment in BAC with a combination of cash contributions and reinvested earnings,which totaled $16.3 million, $13.9 million and $22.0 million for the years ended December 31, 2005, 2004 and 2003, respectively. TheCompany records BFS’s share of income or loss in BAC based on its ownership percentage in the joint venture in Equity earnings in itsConsolidated Statements of Income.
BAC is funded in part through a loan from GECF and a securitization facility arranged by General Electric Capital Corporation, aGECF affiliate, and in part by a cash equity investment from both GECF (51 percent) and BFS (49 percent). BFS’s total investment inBAC at December 31, 2005 and 2004, was $52.2 million and $35.9 million, respectively. BFS’s exposure to losses associated with BACfinancing arrangements is limited to its funded equity in BAC
BFS recorded income related to the operations of BAC of $9.7 million, $4.3 million and $1.5 million for the years ended December31, 2005, 2004 and 2003, respectively. These amounts exclude the discount expense on the sale of Mercury Marine’s accountsreceivable to the joint venture noted below.
Since 2003, the Company has sold a significant portion of its domestic Mercury Marine accounts receivable to BAC. Accountsreceivable totaling $913.3 million, $927.4 million and $501.2 million were sold to BAC in 2005, 2004 and 2003 respectively. Discountsof $7.0 million, $6.4 million and $3.7 million for the years ended December 31, 2005, 2004 and 2003, respectively, have been recordedas an expense in Other expense, net, in the Consolidated Statements of Income. The outstanding balance for receivables sold to BACwas $96.5 million as of December 31, 2005, down from $103.7 million as of December 31, 2004. Pursuant to the joint ventureagreement, BAC reimbursed Mercury Marine $2.6 million, $2.3 million and $0.9 million in 2005, 2004 and 2003, respectively, for therelated credit, collection and administrative costs incurred in connection with the servicing of such receivables.
As of December 31, 2005 and 2004, the Company had a retained interest in $44.5 million and $45.7 million of the total accountsreceivable sold to BAC. The Company’s maximum exposure as of December 31, 2005 and 2004, related to these amounts was $28.5million and $25.0 million, respectively. In accordance with SFAS No. 140, “Accounting for Transfers and Servicing of Financial Assetsand Extinguishments of Liabilities,” the Company treats the sale of receivables in which the Company retains an interest as a securedobligation. Accordingly, the amount of the Company’s maximum exposure was recorded in Accounts and notes receivable, and Accruedexpenses in the Consolidated Balance Sheets. These balances were included in the amounts in Note 9. Commitments andContingencies.
61

8. Income Taxes
The sources of earnings before income taxes are as follows:
2005 2004 2003 (In millions) United States $ 434.9 $ 336.9 $ 165.9 Foreign 60.9 41.6 35.2
Earnings before income taxes $ 495.8 $ 378.5 $ 201.1
The income tax provision consisted of the following:
2005 2004 2003 (In millions) Current tax expense:
U.S. Federal $ 94.9 $ 89.2 $ 40.1 State and local 8.0 4.5 7.4 Foreign 17.7 12.3 16.8
Total current 120.6 106.0 64.3 Deferred tax expense:
U.S. Federal (9.2) (6.3) 7.2 State and local — 8.1 (1.2)Foreign (1.0) 0.9 (4.4)
Total deferred (10.2) 2.7 1.6
Total provision $ 110.4 $ 108.7 $ 65.9
Temporary differences and carryforwards that give rise to deferred tax assets and liabilities at December 31 were as follows:
2005 2004 (In millions) Current deferred tax assets: Product warranties $ 66.9 $ 73.2 Sales incentives and discounts 44.4 41.5 Litigation and environmental reserves 22.0 24.0 Insurance reserves 19.3 21.7 Loss carryforwards 47.1 60.0 Bad debts 14.4 14.0 Other 73.1 78.3 Valuation allowance (12.4) (20.0)
Total current deferred tax assets $ 274.8 $ 292.7 Non-current deferred tax liabilities (assets): Depreciation and amortization $ 144.4 $ 134.5 Pension 37.0 40.3 Other assets and investments 21.5 25.2 Other 75.8 113.1
Non-current deferred tax liabilities 278.7 313.1 Deferred compensation (26.1) (17.5)Minimum pension liability adjustment (56.0) (62.2)Postretirement and postemployment benefits (44.6) (44.7)Other (4.5) (8.4)

Non-current deferred tax assets (131.2) (132.8)
Total non-current deferred tax liabilities $ 147.5 $ 180.3
62

At December 31, 2005, the tax impact of the Company’s Loss carryforwards totaling $47.1 million was available to reduce futuretax liabilities. This deferred tax asset was comprised of $36.3 million of the tax benefit of state net operating loss (NOL) carryforwardsand $10.8 million of the tax benefit of foreign NOL carryforwards. NOL carryforwards of $37.3 million expire at various intervalsbetween the years 2006 and 2024. The remaining NOL carryforwards of $9.8 million have an unlimited life. At December 31, 2005, thevaluation allowance totaling $12.4 million was comprised of $5.4 million for state NOL carryforwards and $7.0 million for foreignNOL carryforwards. At December 31, 2004, the valuation allowance totaling $20.0 million was comprised of $6.3 million for stateNOL carryforwards, $7.1 million of foreign NOL carryforwards and $6.6 million for capital loss carryforwards.
The Company does not believe other valuation allowances are necessary, because deductible temporary differences will be utilizedprimarily by carryback to prior years’ taxable income, or as charges against reversals of future taxable temporary differences. Basedupon prior earnings history, the Company expects that future taxable income will be sufficient to utilize the remaining deductibletemporary differences.
The Company has historically provided deferred taxes under APB No. 23, “Accounting for Income Taxes - Special Areas,” for thepresumed ultimate repatriation to the United States of earnings from all foreign subsidiaries and unconsolidated affiliates. APB No. 23allows the Company to overcome that presumption to the extent the earnings are indefinitely reinvested outside the United States.
As of December 31, 2004, as well as through June 30, 2005, the Company provided deferred taxes for the undistributed net earningsfor all of its foreign subsidiaries and unconsolidated affiliates, as such earnings may have been repatriated to the United States in futureyears. As of July 1, 2005, the Company determined that approximately $52 million of certain foreign subsidiaries’ undistributed netearnings would now be indefinitely reinvested in operations outside the United States. These earnings will provide the Company withthe opportunity to continue to expand its global manufacturing footprint, fund future growth in foreign locations and shift the Company’sacquisition focus to Europe and Asia. The Company’s current intentions meet the indefinite investment criteria of APB No. 23. As aresult of the APB No. 23 change in assertion and related refinements in its tax calculations, the Company reduced its deferred taxliabilities related to undistributed foreign earnings.
The Company has undistributed earnings of foreign subsidiaries of $62.5 million at December 31, 2005, for which deferred taxeshave not been provided. Such earnings are indefinitely reinvested in the foreign subsidiaries. If such earnings were repatriated,additional tax may result. The Company continues to provide deferred taxes, as required, on the undistributed net earnings o f foreignsubsidiaries and unconsolidated affiliates that are not indefinitely reinvested in operations outside the United States.
The difference between the actual income tax provision and the tax provision computed by applying the statutory Federal incometax rate to earnings before taxes is attributable to the following:
2005 2004 2003 (In millions) Income tax provision at 35% $ 173.5 $ 132.5 $ 70.4 State and local income taxes, net of Federal income tax effect 9.1 8.2 4.0 Change in estimates related to 2004 and prior years' amended taxreturn filings (15.0) — — Extraterritorial income and foreign sales corporation benefit (12.2) (8.5) (4.0)Taxes related to foreign income, net of credits (11.6) (5.0) (0.3)Change in APB No. 23 assertion (10.5) — — Research and development credit (9.8) (7.3) (5.2)Tax reserve reassessment (7.1) (10.0) — Investment sale capital loss utilization (6.6) — — Other 0.6 (1.2) 1.0
Actual income tax provision $ 110.4 $ 108.7 $ 65.9 Effective tax rate 22.3% 28.7% 32.8%
In 2005, the Company lowered its effective tax rate from 28.7 percent to 22.3 percent primarily due to $32.6 million of current
year tax benefits of: $15.0 million attributed primarily to refinements in the prior years’ extraterritorial income and foreign salescorporation benefit included above in Change in estimates related to the 2004 and prior years' amended tax return filings; $10.5 millionfrom a change in the assertion under APB No. 23 for certain foreign subsidiaries as discussed above; and $7.1 million attributed to Taxreserve reassessment o f underlying exposures. This current year benefit is partially offset by the $10.0 million Tax reservereassessment in 2004. Additionally, the Company’s 2005 tax rate benefited from a $6.6 million utilization of previously unrecognizedloss carryforwards incurred in connection with the investment sale gain, as discussed in Note 6. Investments. The 2005 effective taxrate was further favorably impacted by higher foreign earnings in lower effective tax rate jurisdictions.
63
The Company lowered its effective tax rate from 32.8 percent in 2003 to 28.7 percent in 2004 primarily due to the 2004 Tax reservereassessment of $10.0 million arising from the completion of Federal tax audit examinations of years 1998 to 2001, and higher foreignand state earnings in lower effective tax rate jurisdictions.
9. Commitments and Contingencies
Financial Commitments. The Company has entered into guarantees of indebtedness of third parties, which are primarily comprisedof arrangements with financial institutions in connection with customer financing programs. Under these arrangements, the Companyhas guaranteed customer obligations to the financial institutions in the event of customer default, generally subject to a maximumamount, which is less than total obligations outstanding. The Company has also guaranteed payments t o third parties that havepurchased customer receivables from the Company and, in certain instances, has guaranteed secured term financing of its customers. Inmost instances, upon repurchase of the debt obligation, the Company receives rights to the collateral securing the financing. Themaximum potential liability associated with these customer financing arrangements was approximately $121 million andapproximately $129 million a t December 31, 2005 and 2004, respectively. Any potential payments on these customer financingarrangements would extend over several years in accordance with the Company’s agreements.
The Company has also entered into arrangements with third-party lenders where it has agreed, in the event of a default by the
customer, to repurchase from the third-party lender Company products repossessed from the customer. These arrangements are typicallysubject to a maximum repurchase amount. The Company’s risk under these arrangements is mitigated by the value of the productsrepurchased as part of the transaction. T h e maximum amount of collateral the Company could be required to purchase wasapproximately $208 million and approximately $188 million at December 31, 2005 and 2004, respectively.
Based on historical experience and current facts and circumstances, and in accordance with FASB Interpretation No. 45 (FIN 45),“Guarantor’s Accounting and Disclosure Requirements for Guarantees, Including Indirect Guarantees of Indebtedness of Others - AnInterpretation of FASB Statements No. 5, 57, and 107 and Rescission of FASB Interpretation No. 34,” the Company has recorded thefair market value of these guarantee and repurchase obligations as a liability on the consolidated balance sheets. Historical cashrequirements and losses associated with these obligations have not been significant.
Financial institutions have issued standby letters of credit and surety bonds conditionally guaranteeing obligations on behalf of theCompany totaling approximately $84 million and approximately $86 million as of December 31, 2005 and 2004, respectively. Thisamount is primarily comprised of standby letters of credit and outstanding surety bonds issued in connection with the Company’s self-insured workers’ compensation program as required by its insurance companies and various state agencies. The Company has recordedreserves to cover liabilities associated with these programs. Under certain circumstances, such as an event of default under theCompany’s revolving credit facility or, in the case of surety bonds, which totaled $18.9 million and $27.1 million at December 31, 2005and 2004, respectively, a ratings downgrade below investment grade, the Company could be required to post collateral to support theoutstanding letters of credit and surety bonds. The 2004 amount included $9.8 million in surety bonds associated with the Yamahacontract dispute, which were released in 2005.
Product Warranties. The Company records a liability for product warranties at the time revenue i s recognized. The liability isestimated using historical warranty experience, projected claim rates and expected costs per claim. The Company adjusts its liability forspecific warranty matters when they become known and the exposure can be estimated. The Company’s warranty reserves are affectedby product failure rates and material usage and labor costs incurred in correcting a product failure. If these estimated costs differ fromactual costs, a revision to the warranty reserve would be required.
Additionally, marine engine customers may purchase a contract from the Company that extends product protection beyond thestandard product warranty period. For certain extended warranty contracts in which the Company retains the warranty obligation, adeferred liability is recorded based on the aggregate sales price for contracts sold. The deferred liability is reduced and revenue isrecognized over the contract period as costs are expected to be incurred.
64

The following activity related to product warranty liabilities was recorded in Accrued expenses and Long-term liabilities - other atDecember 31:
2005 2004 (In millions) Balance at January 1 $ 164.6 $ 160.0 Payments made (111.5) (101.8)Provisions/additions for contracts issued/sold 107.4 106.6 Aggregate changes for preexisting warranties (2.1) (0.2)
Balance at December 31 $ 158.4 $ 164.6
Deferred revenue associated with contracts sold by the Company that extend product protection beyond the standard productwarranty period, not included in the table above, was $25.0 million and $25.8 million at December 31, 2005 and 2004, respectively.
Legal and Environmental. The Company accrues for litigation exposure based upon its assessment, made i n consultation withcounsel, of the likely range of exposure stemming from the claim. In light of existing reserves, the Company’s litigation claims, whenfinally resolved, will not, in the opinion of management, have a material adverse effect on the Company’s consolidated financialposition. If current estimates for the cost of resolving any claims are later determined to be inadequate, results of operations could beadversely affected in the period in which additional provisions are required.
Telephone Consumer Protection Act
The Company continues to defend itself against a 2004 lawsuit brought by plaintiffs who allegedly received unsolicited faxes from avendor of the Company’s Bowling & Billiards segment in violation of the Federal Telephone Consumer Protection Act. The Companydoes not believe the resolution of this lawsuit will have a material adverse effect on the Company's consolidated financial position orresults of operations.
Tax Case
In February 2003, the United States Tax Court issued a ruling upholding the disallowance by the Internal Revenue Service (IRS) ofcapital losses and other expenses for 1990 and 1991 related to two partnership investments entered into by the Company. In April 2003,the Company elected to pay the IRS $62 million (approximately $50 million after-tax), and in April 2004, the Company elected to paythe IRS an additional $10 million (approximately $8 million after-tax), in connection with this matter pending settlement negotiations.The payments were comprised of $33 million in taxes due and $39 million of pre-tax interest (approximately $25 million after-tax). TheCompany elected to make these payments to avoid future interest costs.
On March 9, 2005, the Company and the IRS reached a preliminary settlement of the issues involved in, and related to, this case, inwhich the Company agreed to withdraw its appeal of the tax ruling. All amounts due as a result of the settlement are covered by thepayments previously made to the IRS. In addition, all tax computations related to taxable years 1986 through 2001 have been calculatedand agreed to with the IRS at the examination level. The Company is awaiting final determination of tax and interest for these taxableyears. If there are no changes to the tax amounts agreed to with the IRS examination team for taxable years 1986 through 2001, theCompany expects a tax benefit in future periods between $7 million and $16 million plus interest. The interest amount is beingcomputed by the IRS and is dependent upon the final tax assessed for sixteen tax years, 1986 through 2001, taking into accountcarryback and carryforward o f various tax credits, alternative minimum tax calculations and net operating loss carrybacks, and,therefore, is not quantifiable at this time. The final tax amount for these tax years is expected to be finalized in the first half of 2006,while the final interest amount is not expected to be finalized until late in 2006.
Environmental Matters
The Company is involved in certain legal and administrative proceedings under the Comprehensive Environmental Response,Compensation and Liability Act of 1980 and other federal and state legislation governing the generation and disposal o f certainhazardous wastes. These proceedings, which involve both on- and off-site waste disposal or other contamination, in many instances seekcompensation or remedial action from the Company as a waste generator under Superfund legislation, which authorizes action regardlessof fault, legality of original disposition or ownership of a disposal site. The Company has established reserves based on a range of costestimates for all known claims.
65

The environmental remediation and clean-up projects in which the Company is involved have an aggregate estimated range ofexposure of approximately $42 million to $63 million as of December 31, 2005. At December 31, 2005 and 2004, the Company hadreserves for environmental liabilities of $51.5 million and $54.1 million, respectively. There were environmental provisions of $1.5million, $0.0 million and $0.1 million for the years ended December 31, 2005, 2004 and 2003, respectively.
T h e Company accrues for environmental remediation-related activities for which commitments or clean-up plans have beendeveloped and for which costs can be reasonably estimated. All accrued amounts are generally determined in coordination with third-party experts on an undiscounted basis and do not consider recoveries from third parties until such recoveries are realized. In light ofexisting reserves, the Company’s environmental claims, when finally resolved, will not, in the opinion of management, have a materialadverse effect on the Company’s consolidated financial position or results of operations.
Asbestos Class Actions
The Company has been named in a number of asbestos-related lawsuits, the majority of which involve Vapor Corporation, a formersubsidiary that the Company divested in 1990. Virtually all of the asbestos suits against the Company involve numerous otherdefendants. The claims generally allege that the Company sold products that contained components, such as gaskets, that includedasbestos, and seek monetary damages from the Company. Neither the Company nor Vapor is alleged to have manufactured asbestos.The Company’s insurers have settled a number of asbestos claims for nominal amounts, while a number of other claims have beendismissed. No suit has yet gone to trial. The Company does not believe that the resolution of these lawsuits will have a material adverseeffect on the Company’s consolidated financial position or results of operations.
Australia Trade Practices Investigation
In January 2005, the Company received a notice to furnish information to the Australian Competition and Consumer Commission(ACCC). The ACCC has sought information regarding a subsidiary of the Company, Navman Australia Pty Limited, with respect tosales practices from January 2001 through January 2005 and compliance with the Trade Practices Act of 1974. The Company hascomplied with the request of the ACCC for information and is cooperating with the investigation by the ACCC. The Company does notbelieve that the resolution of this matter with the ACCC will have a material adverse effect on the Company's consolidated financialposition or results of operations.
Chinese Supplier Dispute
The Company's Bowling & Billiards segment is involved in an arbitration proceeding in Hong Kong arising out of a commercialdispute with a former Chinese contract manufacturer, Shanghai Zhonglu Industrial Company Limited (Zhonglu). The Company filedthe arbitration seeking damages based on Zhonglu's breach of a supply and distribution agreement pursuant to which Zhonglu agreed tomanufacture bowling equipment for the Company. Zhonglu has asserted counterclaims seeking damages for alleged breach of contractand the resolution of other claims. The arbitration tribunal heard final arguments on the matter in August 2005. The Company does notbelieve that this dispute will have a material adverse effect on the Company's consolidated financial condition or results of operations.
10. Financial Instruments
The Company operates domestically and internationally, with manufacturing and sales facilities in various locations around theworld. Due to the Company’s global operations, the Company engages in activities involving both financial and market risks. TheCompany utilizes its normal operating and financing activities, along with derivative financial instruments to minimize these risks.
Derivative Financial Instruments. T h e Company uses derivative financial instruments to manage its risks associated withmovements in foreign currency exchange rates, interest rates and commodity prices. Derivative instruments are not used for trading orspeculative purposes. On the date a derivative contract is entered into, the Company designates the derivative as either a hedge of aforecasted transaction (cash flow hedge) or a hedge of a recognized asset or liability (fair value hedge). The Company formallydocuments its hedge relationships, including identification of t h e hedging instruments and the hedged items, as well as its riskmanagement objectives and strategies for undertaking the hedge transaction. This process includes linking derivatives that aredesignated as hedges to specific assets, liabilities or forecasted transactions. The Company also assesses, both at the inception and atleast quarterly thereafter, whether the derivatives used in hedging transactions are highly effective in offsetting the changes in the fairvalue or cash flows of the hedged item. Any ineffective portion of a derivative instrument’s change in fair value is recorded directly inOther expense, net, in the period of change. There were no material adjustments as a result of ineffectiveness to the results of operationsfor the years ended December 31, 2005, 2004 and 2003. If the hedging relationship ceases to be highly effective, or it becomes probablethat a forecasted transaction is no longer expected to occur, gains and losses on the derivative are recorded in Other expense, net. Thefair market value of derivative financial instruments is determined through market-based valuations and may not be representative of theactual gains or losses that will be recorded when these instruments mature due to future fluctuations in the markets in which they aretraded. The effects of derivative and financial instruments are not expected to be material to the Company’s financial position or resultsof operations when considered together with the underlying exposure being hedged.
66

Fair Value Hedges. During 2005 and 2004, the Company entered into foreign currency derivative contracts, which qualify as fairvalue hedges under the requirements of SFAS Nos. 133/138. The Company enters into foreign currency forward contracts to hedge thechanges in the fair value of assets or liabilities caused by changes in the exchange rates of foreign currencies. A fair value hedgerequires that the change in the fair value of the foreign currency derivative contract and the corresponding change in the fair value of theasset or liability of the Company be recorded through earnings, with any difference reflecting the ineffectiveness of the hedge.
Cash Flow Hedges. Certain derivative instruments qualify as cash flow hedges under the requirements of SFAS Nos. 133/138. TheCompany executes forward contracts and options, based on forecasted transactions, to manage foreign exchange exposure mainly relatedt o inventory purchase and sales transactions. The Company also enters into commodity swap agreements, based on anticipatedpurchases of certain raw materials, and natural gas forward contracts, based on projected purchases, to manage exposure related to riskfrom price changes. The Company has also entered into forward starting interest rate swaps to hedge the interest rate risk associated withthe anticipated issuance of debt.
A cash flow hedge requires that as changes in the fair value of derivatives occur, the portion of the change deemed to be effective isrecorded temporarily in Accumulated other comprehensive income (loss), an equity account, and reclassified into earnings in the sameperiod or periods during which the hedged transaction affects earnings.
The following activity related to cash flow hedges was recorded in Accumulated other comprehensive income (loss) as of December31:
Accumulated Unrealized Derivative Gains (Losses) 2005 2004 Pre-tax After-tax Pre-tax After-tax (In millions) Beginning balance $ (17.5) $ (12.0) $ (3.6) $ (2.4)Net change associated with current period hedgingactivity 21.6 15.1 (19.2) (13.2)Net amount recognized into earnings 7.1 4.8 5.3 3.6
Ending balance $ 11.2 $ 7.9 $ (17.5) $ (12.0)
The Company estimates that $2.5 million of after-tax net realized losses from derivatives that have been settled and deferred inAccumulated other comprehensive income (loss) at December 31, 2005, will be realized in earnings over the next twelve months. AtDecember 31, 2005, the term of derivative instruments hedging forecasted transactions ranges from one to eighteen months.
Foreign Currency Hedging. The Company enters into forward exchange contracts and options to manage foreign exchange exposurerelated to forecasted transactions, and assets and liabilities that are subject to risk from foreign currency rate changes. These includeproduct costs; revenues and expenses; associated receivables and payables; intercompany obligations and receivables; and other relatedcash flows. Forward exchange contracts outstanding at December 31, 2005 and 2004, had notional contract values of $313.3 million and$254.9 million, respectively. The approximate fair value of forward exchange contracts was a net asset of $2.9 million and a $10.6million net liability at December 31, 2005 and 2004, respectively. Option contracts outstanding at December 31, 2005 and 2004, hadnotional contract values of $130.5 million and $149.3 million, respectively. The approximate fair value of options contracts outstandingwas a net asset of $4.3 million and a $6.0 million net liability at December 31, 2005 and 2004, respectively. The forward and optionscontracts outstanding at December 31, 2005, mature during 2006 and 2007 and primarily relate to the Euro, Canadian dollar, Britishpound, Australian dollar, Japanese yen and New Zealand dollar.
Interest Rate Hedging. The Company utilizes fixed-to-floating interest rate swaps to mitigate the interest rate risk associated with itslong-term debt. These swaps had a notional value of $275.0 million as of December 31, 2005 and 2004 and an associated fair marketvalue of a loss of $5.2 million as of December 31, 2005, and a gain of $2.8 million as of December 31, 2004. In 2002, the Companyterminated fixed to floating swaps entered into in 2001 at a gain of $12.2 million. This gain was deferred and will be amortized through2006 based upon the underlying debt, reducing interest expense. The unrecognized portion is included as a component of long-termdebt, with a balance of $2.8 million and $5.7 million as of December 31, 2005 and 2004, respectively.
67

In 2005, the Company entered into $200.0 million notional forward starting interest rate swaps to hedge interest rate risk associatedwith the anticipated issuance of long-term debt. As of December 31, 2005, these swaps were an asset which had a fair market value of$3.9 million.
Commodity Price Hedging. The Company uses commodity swap and futures contracts to hedge anticipated purchases of certain rawmaterials. Commodity swap contracts outstanding at December 31, 2005 and 2004, had notional values of $9.1 million and $13.9million, respectively. At December 31, 2005 and 2004, the estimated fair value of these swap contracts was a net asset of $1.6 millionand $2.8 million, respectively. The contracts outstanding at December 31, 2005, mature throughout 2006. The Company also usesfutures contracts to manage its exposure to fluctuating natural gas prices, which had a notional contract value of $0.6 million and $1.7million outstanding at December 31, 2005 and 2004, respectively. The estimated fair value of the futures contracts was a net asset of$0.1 million compared with a net liability of $0.4 million at December 31, 2005 and 2004, respectively.
Concentration of Credit Risk. The Company enters into financial instruments with banks and investment firms with which theCompany has continuing business relationships and regularly monitors the credit ratings of its counterparties. The Company sells abroad range of active recreation products to a worldwide customer base and extends credit to its customers based upon an ongoing creditevaluation program. Concentrations o f credit risk with respect to accounts receivable are not material to the Company’s financialposition, due to the large number of customers comprising the Company’s customer base and their dispersion across many differentgeographic areas, with the exception of one boatbuilder customer. This customer had trade accounts receivable and long-term notesreceivable, in connection with a supply agreement, with net credit exposure of $48.4 million and $48.6 million at December 31, 2005and 2004, respectively.
Fair Value of Other Financial Instruments. The carrying values of the Company’s short-term financial instruments, including cashand cash equivalents, accounts and notes receivable and short-term debt, approximate their fair values because of the short maturity ofthese instruments. At December 31, 2005 and 2004, the fair value of the Company’s long-term debt was approximately $761.0 millionand $801.0 million, respectively, as estimated using quoted market prices or discounted cash flows based on market rates for similartypes of debt.
11. Accrued Expenses
Accrued Expenses at December 31 were as follows:
2005 2004 (In millions) Accrued compensation and benefit plans $ 170.8 $ 228.7 Product warranties 152.9 149.1 Sales incentives and discounts 162.8 138.2 Accrued recourse/repurchase 57.4 60.1 Insurance reserves 49.0 57.6 Deferred revenue 63.8 39.4 Environmental reserves 51.5 54.1 Other 123.7 128.0
Total accrued expenses $ 831.9 $ 855.2
12. Debt
Short-Term Debt at December 31 consisted of the following:
2005 2004 (In millions) Notes payable $ 0.1 $ 9.2 Current maturities of long-term debt 1.0 1.5
Total short-term debt $ 1.1 $ 10.7
68

Long-Term Debt at December 31 consisted of the following:
2005 2004 (In millions) Notes, 6.75% due 2006, net of discount of $0.2 and $0.4 $ 249.8 $ 249.6 Notes, 7.125% due 2027, net of discount of $1.0 and $1.1 199.0 198.9 Notes, 5.0% due 2011, net of discount of $0.7 and $0.7 149.3 149.3 Debentures, 7.375% due 2023, net of discount of $0.5 and $0.6 124.5 124.4 Notes, 1.82% to 4.00% payable through 2015 4.2 4.1 Interest rate swaps and other (2.1) 3.6
724.7 729.9 Current maturities (1.0) (1.5)
Long-term debt $ 723.7 $ 728.4 Scheduled maturities
2007 0.8 2008 0.7 2009 0.7 2010 0.3 Thereafter 721.2
Total long-term debt $ 723.7
I n 2004, the Company issued senior unsubordinated notes in the aggregate principal amount of $150.0 million, receiving netproceeds of $149.1 million, net of discount and before $0.9 million of expenses. The notes mature on June 1, 2011, and interest on thenotes is required to be paid semi-annually at an annual rate of 5.0 percent, beginning December 1, 2004. The Company has the option toredeem some or all of the notes prior to maturity.
I n 2002, the Company deferred a realized gain of $12.2 million on the termination o f interest rate swaps in advance of theirscheduled termination date. This deferred gain was reported in long-term debt and is included in Interest rate swaps and other. Thedeferred gain will be amortized through 2006 based upon the underlying debt, reducing interest expense. The amount of deferred gainincluded in Interest rate swaps and other was $2.8 million and $5.7 million at December 31, 2005 and 2004, respectively. Also includedin Interest rate swaps and other is the estimated aggregate market value related to the fixed-to-floating interest rate swaps discussed inNote 10. Financial Instruments.
In the second quarter of 2005, the Company and certain of its domestic and foreign subsidiaries entered into a new $650.0 millionrevolving credit facility (the “Facility”). The Facility has a term of five years, with the option to extend the term for an additional oneyear on each anniversary of the Facility. Under the terms of the Facility, the Company has multiple borrowing options, includingborrowing at the greater of the prime rate as announced by JPMorgan Chase Bank, N.A., or the Federal Funds effective rate plus 50basis points, or a rate tied to LIBOR. The Company pays a facility fee of 10 basis points per annum, which is subject to adjustment basedon credit ratings. Under the terms of the Facility, the Company is subject to a leverage test, as well as restrictions on secured debt. TheCompany was in compliance with these covenants at December 31, 2005. There were no borrowings under the Facility during 2005, andthe Facility continues to serve as support for any outstanding commercial paper borrowings. The Company has the ability to issue up to$150.0 million in letters of credit under the Facility. The Company had borrowing capacity of $585.4 million under the terms of thisagreement at December 31, 2005, net of outstanding letters of credit. The Company also has $450.0 million available under a universalshelf registration statement filed in 2001 with the SEC for the issuance of equity and/or debt securities.
At December 31, 2005, $250.0 million of the Company’s 6.75% Notes due December 2006 was classified as long-term, based onthe Company’s intent and ability, including use of the Facility, if necessary, to refinance the Notes on a long-term basis during 2006.
13. Pension and Other Postretirement Benefits
The Company has defined contribution plans, qualified and nonqualified pension plans, and other postretirement benefit planscovering substantially all of its employees. The Company’s domestic pension and retiree health care and life insurance benefit plans,which are discussed below, provide benefits based on years of service, and for some plans, the average compensation prior to retirement.The Company uses a December 31 measurement date for these plans. The Company’s salaried pension plan was closed to newparticipants effective April 1, 1999. This plan was replaced with a defined contribution plan for certain employees not meeting age andservice requirements and for new hires. The Company’s foreign benefit plans are not significant individually or in the aggregate.
69

In December 2003, the Medicare Prescription Drug, Improvement and Modernization Act of 2003 (the Act) was signed into law.The Act introduces a prescription drug benefit under Medicare as well as a subsidy to sponsors of retiree health care benefit plans thatprovides a benefit that is at least actuarially equivalent to Medicare Part D. The Company’s postretirement benefit obligation and netperiodic benefit cost do not reflect the effects of the Act, as the Company does not anticipate qualifying for the subsidy based on itscurrent plan designs.
Costs. Pension and other postretirement benefit costs included the following components for 2005, 2004 and 2003:
Other Postretirement Pension Benefits Benefits 2005 2004 2003 2005 2004 2003 (In millions) Service cost $ 18.6 $ 17.3 $ 14.2 $ 2.7 $ 2.4 $ 1.4 Interest cost 58.3 56.9 56.2 5.7 5.7 4.8 Expected return on plan assets (72.6) (66.0) (53.7) — — — Amortization of prior service costs 7.3 6.0 5.6 (2.1) (2.1) (2.1)Amortization of net actuarial loss 13.5 13.5 19.4 0.8 0.7 — Curtailment loss 0.8 — — — — —
Net pension and other benefit costs $ 25.9 $ 27.7 $ 41.7 $ 7.1 $ 6.7 $ 4.1
Benefit Obligations and Funded Status. A reconciliation of the changes in the plans’ benefit obligations and fair value of assets overthe two-year period ending December 31, 2005, and a statement of the funded status at December 31 for these years for the Company’spension and other postretirement benefit plans follow:
Other Postretirement Pension Benefits Benefits 2005 2004 2005 2004 (In millions) Reconciliation of benefit obligation:
Benefit obligation at previous December 31 $ 1,016.8 $ 925.5 $ 100.6 $ 80.2 Service cost 18.6 17.3 2.7 2.4 Interest cost 58.3 56.9 5.7 5.7 Participant contributions — — 1.0 1.0 Plan amendments — 15.2 — — Curtailment (0.3) — — — Acquisition — 0.3 — — Actuarial losses 12.4 49.2 2.7 17.2 Benefit payments (54.8) (47.6) (7.3) (5.9)
Benefit obligation at December 31 $ 1,051.0 $ 1,016.8 $ 105.4 $ 100.6 Reconciliation of fair value of plan assets:
Fair value of plan assets at previous December 31 $ 867.9 $ 785.0 $ — $ — Actual return on plan assets 91.3 87.1 — — Employer contributions 27.4 42.6 6.3 4.9 Participant contributions — — 1.0 1.0 Asset transfer due to acquisition — 0.8 — — Benefit payments (54.8) (47.6) (7.3) (5.9)
Fair value of plan assets at December 31 $ 931.8 $ 867.9 $ — $ — Funded status:
Funded status at December 31 $ (119.2) $ (148.9) $ (105.4) $ (100.6)Unrecognized prior service cost (credit) 39.1 47.2 (10.4) (12.5)Unrecognized actuarial losses 200.9 221.0 20.1 18.2
Net amount recognized $ 120.8 $ 119.3 $ (95.7) $ (94.9)

70
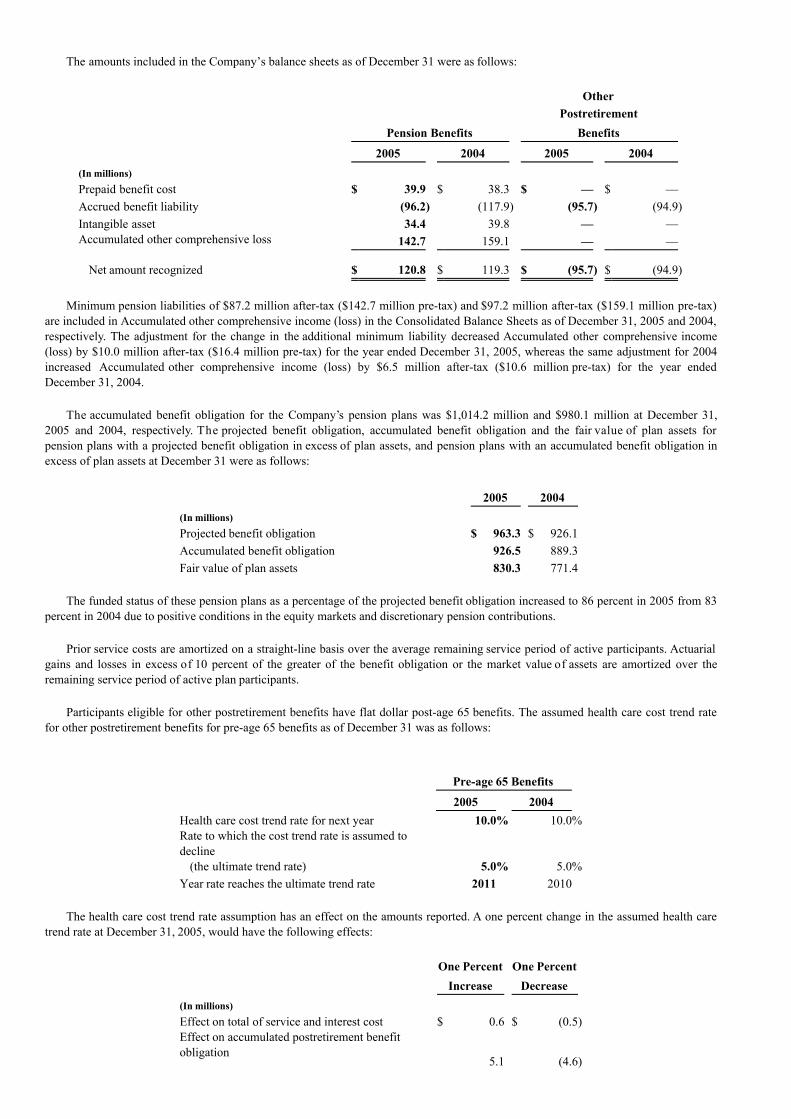
The amounts included in the Company’s balance sheets as of December 31 were as follows:
Other Postretirement Pension Benefits Benefits 2005 2004 2005 2004 (In millions) Prepaid benefit cost $ 39.9 $ 38.3 $ — $ — Accrued benefit liability (96.2) (117.9) (95.7) (94.9)Intangible asset 34.4 39.8 — — Accumulated other comprehensive loss 142.7 159.1 — —
Net amount recognized $ 120.8 $ 119.3 $ (95.7) $ (94.9)
Minimum pension liabilities of $87.2 million after-tax ($142.7 million pre-tax) and $97.2 million after-tax ($159.1 million pre-tax)are included in Accumulated other comprehensive income (loss) in the Consolidated Balance Sheets as of December 31, 2005 and 2004,respectively. The adjustment for the change in the additional minimum liability decreased Accumulated other comprehensive income(loss) by $10.0 million after-tax ($16.4 million pre-tax) for the year ended December 31, 2005, whereas the same adjustment for 2004increased Accumulated other comprehensive income (loss) by $6.5 million after-tax ($10.6 million pre-tax) for the year endedDecember 31, 2004.
The accumulated benefit obligation for the Company’s pension plans was $1,014.2 million and $980.1 million at December 31,2005 and 2004, respectively. The projected benefit obligation, accumulated benefit obligation and the fair value of plan assets forpension plans with a projected benefit obligation in excess of plan assets, and pension plans with an accumulated benefit obligation inexcess of plan assets at December 31 were as follows:
2005 2004 (In millions) Projected benefit obligation $ 963.3 $ 926.1 Accumulated benefit obligation 926.5 889.3 Fair value of plan assets 830.3 771.4
The funded status of these pension plans as a percentage of the projected benefit obligation increased to 86 percent in 2005 from 83percent in 2004 due to positive conditions in the equity markets and discretionary pension contributions.
Prior service costs are amortized on a straight-line basis over the average remaining service period of active participants. Actuarialgains and losses in excess of 10 percent of the greater of the benefit obligation or the market value of assets are amortized over theremaining service period of active plan participants.
Participants eligible for other postretirement benefits have flat dollar post-age 65 benefits. The assumed health care cost trend ratefor other postretirement benefits for pre-age 65 benefits as of December 31 was as follows:
Pre-age 65 Benefits 2005 2004 Health care cost trend rate for next year 10.0% 10.0%Rate to which the cost trend rate is assumed todecline
(the ultimate trend rate)
5.0% 5.0%Year rate reaches the ultimate trend rate 2011 2010
The health care cost trend rate assumption has an effect on the amounts reported. A one percent change in the assumed health caretrend rate at December 31, 2005, would have the following effects:
One Percent One Percent Increase Decrease (In millions) Effect on total of service and interest cost $ 0.6 $ (0.5)Effect on accumulated postretirement benefitobligation
5.1 (4.6)

The Company monitors the cost of health care and life insurance benefit plans and reserves the right to make additional changes orterminate these benefits in the future.
71

Weighted average assumptions used to determine pension and other postretirement benefit obligations at December 31 were asfollows:
2005 2004
Discount rate 5.75% 5.90%Rate of compensation increase(A) 3.75% 3.75%
(A) Assumption used in determining pension benefit obligation only.
Weighted average assumptions used to determine net pension and other postretirement benefit costs for the years ended December31 were as follows:
2005 2004 2003
Discount rate 5.90% 6.25% 6.75%Long-term rate of return on plan assets(A) 8.50% 8.50% 8.50%Rate of compensation increase(A) 3.75% 3.75% 4.50%
__________
(A) Assumption used in determining pension benefit cost only. The Company utilized a long-term corporate bond model to determine the discount rate used to calculate plan liabilities. The
corporate bond model calculated the yield of a portfolio of bonds whose cash flows approximated the plans’ expected benefitpayments. The yield of this portfolio was compared to the Moody’s Aa Corporate Bond Yield Index at a comparable measurement dateto determine the yield differential, which was 27 basis points in 2005 and 16 basis points in 2004. This differential was added to theyear-end Moody’s index to determine the discount rate. Moody’s Aa long-term corporate bond yield was used as a basis fordetermining the discount rate in 2003 with a yield adjustment made for the longer duration of the Company’s benefit obligations and afurther adjustment to reflect annual yields.
The Company evaluates its assumption regarding the estimated long-term rate o f return on plan assets based on historicalexperience and future expectations of investment returns. The Company’s long-term rate of return on assets assumption of 8.5 percentin 2005, 2004 and 2003, reflects recent market trends and the historical weighted average total return actually achieved by the plans’assets.
Assets of the Company’s Master Pension Trust (Trust) are invested solely in the interest of the plan participants for the purpose ofproviding benefits to participants and their beneficiaries. Investment decisions within the Trust are made after giving appropriateconsideration to the prevailing facts and circumstances that a prudent person acting in a like capacity would use in a similar situation,and follow the guidelines and objectives established within the investment policy statement for the Trust. The Trust strategicallydiversifies its investments among various asset classes in order to reduce risks and enhance returns. Long-term strategic weightings forthe total Trust of 67 percent equity securities, 23 percent for interest-sensitive investments (debt securities and other) and 10 percent forreal estate are within the Company’s target allocation ranges. The ranges are 55 percent to 75 percent, 12 percent to 35 percent, and 5percent to 15 percent for equity securities, interest-sensitive investments and real estate, respectively. All investments are continuallymonitored and reviewed, with evaluation considerations focusing on strategic target allocations, investment vehicles and performance ofthe individual investment managers, as well as overall Trust performance. Actual asset allocations within the Trust are described below.
Plan Assets. The Company’s asset allocation for its qualified pension plans at December 31 by asset category was as follows:
Percentage of Plan Assets 2005 2004 Asset CategoryEquity securities 67% 68%Debt securities 16 15 Real estate 11 10 Other 6 7
Total 100% 100%
Equity securities do not include any shares of the Company’s common stock at December 31, 2005 and 2004.
72

The Company’s nonqualified pension plan and other postretirement benefit plans are not funded.
Expected Cash Flows. The expected cash flows for the Company’s pension and other postretirement benefit plans follow:
Pension
Benefits
Other Post-retirement
Benefits (In millions) Company contributions expected to be made in 2006 (A) $ 42.4 $ 6.0 Expected benefit payments (which reflect future service): 2006 55.1 7.0 2007 58.1 7.4 2008 61.1 7.7 2009 64.0 8.1 2010 66.5 8.4 2011-2015 366.6 43.4
(A) The Company currently anticipates making discretionary funding up to approximately $40.0 million to the qualified pension plans and $2.4 million to coverbenefit payments in the unfunded, nonqualified pension plan in 2006. This is subject to change based on market conditions or Company discretion.
The Company’s contributions to its defined contribution plans are based on various percentages of compensation, and in someinstances are based on the amount of the employees’ contributions to the plans. The expense related to these plans was $46.5 million,$43.0 million and $37.4 million in 2005, 2004 and 2003, respectively. Company contributions to multiemployer plans were $0.5 million,$0.4 million and $0.7 million in 2005, 2004 and 2003, respectively.
14. Stock Plans and Management Compensation
Under the 2003 Stock Incentive Plan, the Company may grant stock options, stock appreciation rights, restricted stock and othertypes of awards to executives and other management employees. Issuances under the plans may be from either authorized but unissuedshares or treasury shares. As of December 31, 2005, these plans allow for the issuance of a maximum of 4.1 million shares. Sharesavailable for grant totaled 1.7 million at December 31, 2005.
Stock options issued are generally exercisable over a period of 10 years, or a s determined by the Human Resources andCompensation Committee of the Board of Directors. Options vest over three, four or five years, or immediately in the event of a changein control, upon death or disability of the optionee, or if the optionee’s age and years of service equal 65 or more. Vesting on futureoption grants will occur immediately in the event of a change in control, upon death or disability of the optionee, or if age and years ofservice equals 70 or more on termination of employment. The option price per share cannot be less than the fair market value at the dateof grant. The Company has additional stock and stock option plans to provide for compensation of non-employee directors. Stock optionactivity for all plans for the three years ended December 31 was as follows:
2005 2004 2003
(Options in thousands)
StockOptions
Outstanding
WeightedAverageExercise
Price
StockOptions
Outstanding
WeightedAverageExercise
Price
StockOptions
Outstanding
WeightedAverageExercise
Price Outstanding on January 1 3,702 $ 24.59 7,615 $ 22.97 9,266 $ 22.51 Granted 934 $ 45.90 446 $ 38.77 454 $ 23.13 Exercised (740) $ 23.17 (4,294) $ 23.19 (1,877) $ 20.49 Forfeited (52) $ 34.04 (65) $ 24.92 (228) $ 24.64
Outstanding on December31 3,844 $ 29.91 3,702 $ 24.59 7,615 $ 22.97
Exercisable on December31 2,312 $ 23.45 1,980 $ 22.93 5,028 $ 23.58
73

The following table summarizes information about stock options outstanding at December 31, 2005:
Range of ExercisePrice
NumberOutstanding
WeightedAverage
ContractualLife
WeightedAverageExercise
Price
NumberExercisable
WeightedAverageExercise
Price (Options in thousands) (Options in thousands)
$16.97 to $20.00 895 4.6 years $ 19.62 886 $ 19.63$20.01 to $30.00 1,426 5.7 years $ 23.28 1,097 $ 23.09$30.01 to $40.00 596 6.0 years $ 36.26 318 $ 34.62$40.01 to $49.27 927 9.1 years $ 45.98 11 $ 43.97
The weighted average fair value of individual options granted during 2005, 2004 and 2003 was $17.40, $12.51 and $7.23,respectively. The fair value of each option grant was estimated on the date of grant using the Black-Scholes option pricing model withthe following weighted average assumptions used for 2005, 2004 and 2003, respectively:
2005 2004 2003
Risk-free interest rate 3.7% 3.1% 2.7%Dividend yield 1.4% 1.3% 2.2%Volatility factor 34.1% 34.7% 37.9%Weighted average expected life 5 years 5 years 5 years
Restricted stock awards (restricted stock shares were issued for grants prior to April 30, 2003, and subsequently restricted stock unitswere issued) are issued to directors and key employees as determined by the Human Resources and Compensation Committee of theBoard of Directors. Restricted awards vest at the end of a three- to five-year period subject to continued employment, or immediately ona change in control of the Company, or upon death or disability of the optionee. Restricted stock units are forfeited in the eventemployment terminates prior to vesting, except there is prorata vesting if age and years of service equals 65 or more on termination ofemployment. Prorata vesting on future grants will occur if age and years of service equals 70 or more on termination of employment.Although participants’ restricted stock award dividends are automatically reinvested, restricted stock units are non-voting, and all awardshave restrictions on the sale or transfer of such awards during the restricted period. The cost of restricted stock awards is recognized ona straight-line basis over the requisite service period. During 2005, 2004 and 2003, $3.4 million, $10.2 million and $4.2 million,respectively, was charged to compensation expense under these plans. The decrease in 2005 was due to the forfeiture of restricted stockawards and resulting reversal of previously recognized compensation expense due to the Company’s CEO transition.
The weighted average price per restricted award at grant date was $45.90, $38.64 and $22.35 for the restricted awards granted in2005, 2004 and 2003, respectively. Restricted stock awards activity for all plans for the three years ended December 31, was as follows:
2005 2004 2003 (Restricted stock awards in thousands) Outstanding on January 1 824 426 221 Granted 94 514 320 Dividends 9 10 7 Released (101) (113) (110)Forfeited (307) (13) (12)
Outstanding on December 31 519 824 426 The Company maintained a leveraged employee stock ownership plan (ESOP) that covered all domestic employees of the Company
who had been employed by the Company on or before the first day of the ESOP’s year and on December 1 of the ESOP’s year and hadcompleted at least 1,000 hours of service during the year. In April 1989, the ESOP borrowed $100 million to purchase 5,095,542 sharesof the Company’s common stock at $19.625 per share. The debt of the ESOP was guaranteed by the Company and was recorded in theCompany’s financial statements. As a result of the retirement of this debt in 2004, all ESOP shares that were maintained in a suspenseaccount at December 31, 2003, were released in 2004 and allocated to participants’ accounts, at which time the leveraged ESOP wasterminated.
Under the grandfathered provisions of Statement of Position (SOP) 93-6, “Employers’ Accounting for Employee Stock OwnershipPlans,” the expense recorded by the Company was based on cash contributed or committed to be contributed by the Company to theESOP during the year, net of dividends received. Dividends were primarily used by the ESOP to pay down debt.
74

The Company’s contributions to the ESOP, along with related expense amounts, were as follows:
2004 2003 (In millions) Compensation expense $ 5.4 $ 8.9 Interest expense 0.2 0.9 Dividends — 1.4
Total debt service payments $ 5.6 $ 11.2
The Company has a severance plan that becomes effective upon a change in control o f the Company, which would result incompensation expense in the period if a change in control occurs.
15. Treasury and Preferred Stock
Treasury stock activity for the past three years was as follows:
2005 2004 2003 (Shares in thousands) Balance at January 1 5,709 10,408 12,377 Common stock repurchase program 1,943 — — Compensation plans and other (771) (4,699) (1,969)
Balance at December 31 6,881 5,709 10,408
At December 31, 2005, 2004 and 2003, the Company had no preferred stock outstanding (12.5 million shares authorized, $0.75 parvalue at December 31, 2005, 2004 and 2003).
16. Preferred Share Purchase Rights
In February 1996, the Board of Directors declared a dividend of one Preferred Share Purchase Right (Right) on each outstandingshare of the Company’s common stock. Under certain conditions, each holder of Rights may purchase one one-thousandth of a share of anew series of junior participating preferred stock at an exercise price of $85 for each Right held. The Rights expire on April 1, 2006.
The Rights become exercisable at the earlier of (1) a public announcement that a person or group acquired or obtained the right toacquire 15 percent or more of the Company’s common stock or (2) 15 days (or such later time as determined by the Board of Directors)after commencement or public announcement of an offer for more than 15 percent of the Company’s common stock. After a person orgroup acquires 15 percent or more of the common stock of the Company, other shareholders may purchase additional shares of theCompany at 50 percent of the current market price. These Rights may cause substantial ownership dilution to a person or group whoattempts to acquire the Company without approval of the Company’s Board of Directors.
The Rights, which do not have any voting rights, may be redeemed by the Company at a price of $.01 per Right at any time prior toa person’s or group’s acquisition of 15 percent or more of the Company’s common stock. A Right also will be issued with each share ofthe Company’s common stock that becomes outstanding prior to the time the Rights become exercisable or expire.
In the event that the Company is acquired in a merger or other business combination transaction, provision will be made so thateach holder of Rights will be entitled to buy the number of shares of common stock of the surviving Company that at the time of suchtransaction would have a market value of two times the exercise price of the Rights.
17. Leases
The Company has various lease agreements for offices, branches, factories, distribution and service facilities, certain Company-operated bowling centers and certain personal property. The longest of these obligations extends through 2032. Most leases containrenewal options, some contain purchase options or escalation clauses, and many provide for contingent rentals based on percentages ofgross revenue.
75

No leases contain restrictions on the Company’s activities concerning dividends, additional debt or further leasing. Rent expenseconsisted of the following:
2005 2004 2003 (In millions) Basic expense $ 48.1 $ 54.1 $ 48.0 Contingent expense 2.3 2.1 1.7 Sublease income (1.6) (0.9) (1.5)
Rent expense, net $ 48.8 $ 55.3 $ 48.2
Future minimum rental payments at December 31, 2005, under agreements classified as operating leases with non-cancelable termsin excess of one year, were as follows:
(In millions) 2006 $ 43.5 2007 34.4 2008 27.5 2009 20.7 2010 16.7 Thereafter 59.4
Total (not reduced by minimum sublease rentals of$1.3) $ 202.2
18. Share Repurchase Program
In the second quarter of 2005, the Company’s Board of Directors authorized a $200 million share repurchase program, to be fundedwith available cash. The Company expects to repurchase shares on the open market or in private transactions from time to time,depending on market conditions. The Company repurchased approximately 1.9 million shares under this program during 2005 for $76.0million. As of December 31, 2005, the Company is authorized to repurchase an additional $124.0 million of its shares.
76

19. Quarterly Data (unaudited)
Quarter 1st 2nd 3rd 4th Year (In millions, except per share data) 2005Net sales
$ 1,401.1 $ 1,598.6 $ 1,434.6 $ 1,489.5 $ 5,923.8 Gross margin (A) $ 341.9 $ 412.6 $ 333.0 $ 337.1 $ 1,424.6 Net earnings $ 94.6 $ 114.1 $ 88.4 $ 88.3 $ 385.4 Basic earnings per common share: Net earnings $ 0.97 $ 1.16 $ 0.90 $ 0.91 $ 3.95 Diluted earnings per common share: Net earnings $ 0.96 $ 1.15 $ 0.89 $ 0.90 $ 3.90 Dividends declared $ — $ — $ — $ 0.60 $ 0.60 Common stock price (NYSE symbol: BC):
High $ 48.57 $ 49.50 $ 46.70 $ 42.09 $ 49.50 Low $ 43.94 $ 41.63 $ 36.98 $ 35.09 $ 35.09
2004Net sales
$ 1,199.6 $ 1,422.7 $ 1,273.2 $ 1,333.8 $ 5,229.3 Gross margin (A) $ 297.3 $ 367.8 $ 317.0 $ 332.1 $ 1,314.2 Net earnings $ 48.0 $ 90.1 $ 72.9 $ 58.8 $ 269.8 Basic earnings per common share: Net earnings $ 0.51 $ 0.94 $ 0.76 $ 0.60 $ 2.82 Diluted earnings per common share: Net earnings $ 0.50 $ 0.93 $ 0.75 $ 0.59 $ 2.77 Dividends declared $ — $ — $ — $ 0.60 $ 0.60 Common stock price (NYSE symbol: BC):
High $ 41.85 $ 43.63 $ 46.20 $ 49.85 $ 49.85 Low $ 31.25 $ 38.14 $ 34.51 $ 44.64 $ 31.25
(A) Gross margin is defined as Net sales less Cost of sales as presented in the Consolidated Statements of Income.
20. Subsequent Event
In February 2006, the Company acquired certain assets of Cabo Yachts, Inc. (Cabo) for approximately $65 million. Cabo buildsoffshore sportfishing boats ranging from 31 to 52 feet. The purchase of Cabo complements the Company’s previous acquisitions ofHatteras and Albemarle and allows the Company to offer a full range of sportfishing convertibles and motoryachts from 24 to 90 feet.The post-acquisition results of Cabo will be included in the Boat segment.
77

BRUNSWICK CORPORATION
SCHEDULE II - VALUATION AND QUALIFYING ACCOUNTS(In millions)
Allowances for
losses on receivables
Balance atbeginning
of year
Charges to
profit and loss
Write-offs
Recoveries
Other
Balance atend of year
2005 $ 29.0 $ (0.7) $ (6.1) $ 0.1 $ 0.4 $ 22.7
2004 $ 31.3 $ 4.9 $ (8.7) $ 1.7 $ (0.2) $ 29.0
2003 $ 31.8 $ 5.5 $ (6.7) $ 0.8 $ (0.1) $ 31.3
Deferred tax asset
valuation allowance (A)
Balance atbeginning
of year
Charges to
profit and loss
Write-offs
Recoveries
Other
Balance atend of year
2005 $ 20.0 $ (7.6) $ — $ — $ — $ 12.4
2004 $ 13.0 $ — $ — $ — $ 7.0 $ 20.0
2003 $ 13.6 $ — $ — $ — $ (0.6) $ 13.0
(A) State and foreign net operating loss carryforwards that are not expected to be utilized.
78

SIGNATURES
Pursuant to the requirements of Section 13 or 15(d) of the Securities Exchange Act of 1934, the registrant has duly causedthis report to be signed on its behalf by the undersigned, thereunto duly authorized. BRUNSWICK CORPORATION
By: /s/ ALAN L. LOWE Alan L. Lowe Vice President and Controller Date: February 28, 2006
Pursuant to the requirements of the Securities Exchange Act of 1934, this report has been signed below by the followingpersons on behalf of the registrant and in the capacities and on the date indicated.
Signature Signature
/s/ DUSTAN E. McCOY /s/ MANUEL A. FERNANDEZ*
Dustan E. McCoy Manuel A. FernandezChairman and Chief Executive Officer Director
(Principal Executive Officer) and Director /s/ PETER B. HAMILTON*
/s/ PETER G. LEEMPUTTE Peter B. Hamilton
Peter G. Leemputte Vice Chairman and President -Senior Vice President and Chief Financial Life Fitness Division and Director
Officer (Principal Financial Officer) /s/ PETER HARF*
/s/ ALAN L. LOWE Peter Harf
DirectorAlan L. Lowe
Vice President and Controller (Principal /s/ GRAHAM H. PHILLIPS*Accounting Officer)
Graham H. Phillips/s/ NOLAN D. ARCHIBALD* Director
Nolan D. Archibald /s/ ROGER W. SCHIPKE*
Director Roger W. Schipke
/s/ JEFFREY L. BLEUSTEIN* Director
Jeffrey L. Bleustein /s/ RALPH C. STAYER*Director
Ralph C. Stayer/s/ MICHAEL J. CALLAHAN* Director
Michael J. Callahan /s/ LAWRENCE A. ZIMMERMAN*
Director Lawrence A. Zimmerman Director
79

*Peter G. Leemputte, pursuant to a Power of Attorney (executed by each of the officers and directors identified above with anasterisk and filed with the Securities and Exchange Commission), by signing his name hereto does hereby sign and execute this report ofBrunswick Corporation on behalf of each of the officers and directors named above in the capacities in which the names of each appearabove.
By: /s/ PETER G. LEEMPUTTE Peter G. Leemputte Senior Vice President and Chief Financil Officer Date: February 28, 2006
80

EXHIBIT INDEX
Exhibit No. Description3.1 Restated Certificate of Incorporation of the Company filed as Exhibit 19.2 to the Company’s
Quarterly Report on Form 10-Q for the quarter ended June 30, 1987, and hereby incorporated by reference.
3.2 Certificate of Designation, Preferences and Rights of Series A Junior Participating Preferred Stock filed as Exhibit 3.2 to the Company’s Annual Report on Form 10-K for 1995, and hereby incorporated by reference.
3.3 By-Laws of the Company filed as Exhibit 3.3 to the Company’s Annual Report on Form 10-K for 2002, and hereby incorporated by reference.
4.1 Indenture dated as of March 15, 1987, between the Company and Continental Illinois National Bank and Trust Company of Chicago filed as Exhibit 4.1 to the Company’s Quarterly Report on Form 10-Q for the quarter ended March 31, 1987, and hereby incorporated by reference.
4.2 Officers’ Certificate setting forth terms of the Company’s $125,000,000 principal amount of 7 3/8% Debentures due September 1, 2023, filed as Exhibit 4.3 to the Company’s Annual Report on Form 10-K for 1993, and hereby incorporated by reference.
4.3 Form of the Company’s $250,000,000 principal amount of 6 3/4% Notes due December 15, 2006, filed as Exhibit 4.1 to the Company’s Current Report on Form 8-K dated December 10, 1996, and hereby incorporated by reference.
4.4 Form of the Company’s $200,000,000 principal amount of 7 1/8% Notes due August 1, 2027, filed as Exhibit 4.1 to the Company’s Current Report on Form 8-K dated August 4, 1997, and hereby incorporated by reference.
4.5 The Company’s agreement to furnish additional debt instruments upon request by the Securities and Exchange Commission filed as Exhibit 4.10 to the Company’s Annual Report on Form 10-K for 1980, and hereby incorporated by reference.
4.6 Form of the Company’s $150,000,000 principal amount of 5% Notes due 2011, filed as Exhibit 4.1 to the Company’s Current Report on Form 8-K dated May 26, 2004, and hereby incorporated by
reference.4.7 Rights Agreement dated as of February 5, 1996, between the Company and Harris Trust and
Savings Bank filed as Exhibit 1 to the Company’s Registration Statement for Preferred Share Purchase Rights on Form 8-A dated March 13, 1996, and hereby incorporated by reference.
4.8 Amendment to Rights Agreement dated as of February 16, 2004 between the Company and LaSalle Bank National Association filed as Exhibit 4.2 to the Company’s Amended Registration Statement for Preferred Share Purchase Rights on Form 8-A/A dated February 18, 2004, and hereby incorporated by reference.
4.9 Credit Agreement dated as of November 15, 2002, setting forth the terms of the Company’s $350,000,000 Revolving Credit and Competitive Bid Loan Facility with JPMorgan Chase Bank, administrative agent, and other lenders identified in the Credit Agreement, filed as Exhibit 4.8 to
4.10
the Company’s Annual Report on Form 10-K for 2002, and hereby incorporated by reference.Credit Agreement dated as of April 29, 2005, setting forth the terms of the Company’s $650,000,000Revolving Credit and Competitive Bid Loan Facility with JPMorgan Chase Bank, administrative agent,and other lenders identified in the Credit Agreement, filed as Exhibit 10.4 to the Company’s QuarterlyReport on Form 10-Q for the quarter ended March 31, 2005, and hereby incorporated by reference.
10.1* Form of Change of Control Agreement by and between the Company and each of K. J. Chieger, T.J. Chung, W. J. Gress, P. B. Hamilton, P. G. Leemputte, B. R. Lockridge, P. C. Mackey, D.E. McCoy, W. L. Metzger, V. J. Reich, A. L. Lowe, M. I. Smith, J. E. Stransky, D. B.
Tompkins, C. Trudell, S. M. Wolpert and J. P. Zelisko, filed as Exhibit 10.5 to the Company’s Annual Report on
Form 10-K for the year ended December 31, 2000, and hereby incorporated by reference.10.2* 1994 Stock Option Plan for Non-Employee Directors filed as Exhibit A to the Company’s
definitive Proxy Statement dated March 25, 1994, for the Annual Meeting of Stockholders on April 27, 1994, and hereby incorporated by reference.
10.3* Supplemental Pension Plan filed as Exhibit 10.7 to the Company’s Quarterly Report on Form 10-Q for the quarter ended September 30, 1998, and hereby incorporated by reference.
10.4* Form of Indemnification Agreement by and between the Company and each of N. D. Archibald, J. L. Bleustein, M. J. Callahan, M. A. Fernandez, P. Harf, G.H. Phillips, R.W. Schipke, R. C. Stayer and L. A. Zimmerman, filed as Exhibit 19.2 to the Company’s Quarterly Report on Form
10-Q for the quarter ended September 30, 1986, and hereby incorporated by reference.
81

10.5* Form of Indemnification Agreement by and between the Company and each of K. J. Chieger, T.J. Chung, W. J. Gress, P. B. Hamilton, P. G. Leemputte, B. R. Lockridge, A. L. Lowe, P. C. Mackey, D. E. McCoy, W. L. Metzger, V. J. Reich, M. I. Smith, D.B. Tompkins, J. E. Stransky, C. Trudell, S. M. Wolpert and J. P. Zelisko, filed as Exhibit 19.4 to the
Company’s Quarterly Report on Form 10-Q for the quarter ended September 30, 1986, and hereby incorporated by reference.
10.6* 1991 Stock Plan filed as Exhibit 10 to the Company’s Quarterly Report on Form 10-Q for the quarter ended June 30, 1999, and hereby incorporated by reference.
10.7* Change in Control Severance Plan filed as Exhibit 10.6 to the Company’s Quarterly Report on Form 10-Q for the quarter ended September 30, 1998, and hereby incorporated by reference.
10.8* Brunswick Performance Plan for 2004 filed as Exhibit 10.16 to the Company’s Annual Report on Form10-K for 2003, and hereby incorporated by reference.
10.9* Brunswick Performance Plan for 2005 filed as Exhibit 10.1 to the Company’s Current Report on Form8-K filed February 3, 2005, and hereby incorporated by reference.
10.10* Brunswick Strategic Incentive Plan for 2004-2005 filed as Exhibit 10.21 to the Company’s AnnualReport on Form 10-K for 2003, and hereby incorporated by reference.
10.11* Brunswick Strategic Incentive Plan for 2005-2006 filed as Exhibit 10.2 to the Company’s CurrentReport on Form 8-K filed February 3, 2005 and hereby incorporated by reference.
10.12* 1997 Stock Plan for Non-Employee Directors filed as Exhibit 10.3 to the Company’s Quarterly Report on Form 10-Q for the quarter ended September 30, 1998, and hereby incorporated by reference.
10.13* Elective Deferred Compensation Plan filed as Exhibit 4.6 to the Company’s Registration Statement on Form S-8 (333-112880) filed February 17, 2004, and hereby incorporated by reference.
10.14* Automatic Deferred Compensation Plan filed as Exhibit 10.24 to the Company’s Annual Report onForm 10-K for 2003 and hereby incorporated by reference.
10.15* Brunswick Restoration Plan filed as Exhibit 4.7 to the Company’s Registration Statement on Form S-8 (333-112880) filed February 17, 2004, and hereby incorporated by reference.
10.16* Brunswick 2003 Stock Incentive Plan filed as Exhibit 4.5 to the Company’s Registration Statement onForm S-8 (333-112880) filed February 17, 2004, and hereby incorporated by reference.
12.1 Statement regarding computation of ratios.21.1 Subsidiaries of the Company.23.1 Consent of Independent Registered Public Accounting Firm.24.1 Power of Attorney.31.1 Certification of Chief Executive Officer Pursuant to Section 302 of the Sarbanes-Oxley Act of 2002.31.2 Certification of Chief Financial Officer Pursuant to Section 302 of the Sarbanes-Oxley Act of 2002.32.1 Certification of Chief Executive Officer Pursuant to Section 906 of the Sarbanes-Oxley Act of 2002.32.2 Certification of Chief Financial Officer Pursuant to Section 906 of the Sarbanes-Oxley Act of 2002.
__________
* Management contract or compensatory plan or arrangement required to be filed as an exhibit to this Annual Report on Form 10-Kpursuant to Item 14(c) of this Report.
82


Exhibit 12.1
Brunswick Corporation Computation of Ratio of Earnings to FixedCharges(A) (In millions) Year Ended December 31, 2005 2004 2003 2002 2001 Earnings as Adjusted
Earnings from continuing operations $ 385.4 $ 269.8 $ 135.2 $ 103.5 $ 84.7 Add: Income tax provision 110.4 108.7 65.9 53.4 45.8
Interest and other financial chargesincluded in expense 53.2 45.2 41.0 43.3 52.9 Interest portion of rent expense 16.4 16.2 14.4 14.2 13.4 Dividends received from 50%-or-less-owned affiliates 12.3 13.1 6.8 0.5 -
Subtract: Earnings from 50%-or-less-ownedaffiliates (18.1) (18.1) (9.9) (2.6) 4.0
$ 559.6 $ 434.9 $ 253.4 $ 212.3 $ 200.8 Fixed Charges
Interest and other financial charges $ 53.2 $ 45.2 $ 41.0 $ 43.3 $ 52.9 Interest portion of rent expense 16.4 16.2 14.4 14.2 13.4 Capitalized interest 1.4 1.2 1.5 - -
$ 71.0 $ 62.6 $ 56.9 $ 57.5 $ 66.3 Ratio of earnings to fixed charges 7.9 x 6.9 x 4.5x 3.7 x 3.0 x
(A) For computation of the ratio of earnings to fixed charges, earnings have been calculated byadding fixed charges to earnings from continuing operations before income taxes anddividends received from equity affiliates, then deducting the undistributed earnings ofaffiliates. Fixed charges consist of interest expense, estimated interest portion of rentalexpense and capitalized interest.

Exhibit 21.1
Subsidiaries of the Company
Company Name Jurisdiction of Incorporation
Advanced Exercise Equipment, LLC ColoradoAlbemarle Boats, Inc. North CarolinaAppletree Ltd. BermudaAshland City Land & Brand Partners, G.P. TennesseeAskeladden Marine AS NorwayAttwood Corporation DelawareBaja Marine Corporation DelawareBBG Logistics, Inc. DelawareBCMM Holdings, Inc. DelawareBella-Veneet Oy FinlandBluewater Marine Group, Inc. South CarolinaBNT Marine Limited England and WalesBoston Whaler, Inc. DelawareBRIG Holdings, Inc. DelawareBrunswick Acceptance Company, LLC DelawareBrunswick AG SwitzerlandBrunswick Automotive Europe GmbH GermanyBrunswick Bermuda International Holdings Limited BermudaBrunswick Bermuda Limited BermudaBrunswick Billiards Recreation, Inc. DelawareBrunswick Boat Manufacturing (Zhuhai) Company Limited ChinaBrunswick Boats, Inc. DelawareBrunswick Bowling & Billiards (U.K.) Limited England and WalesBrunswick Bowling & Billiards Corporation DelawareBrunswick Bowling & Billiards Ltda. BrazilBrunswick Bowling Pin Corporation DelawareBrunswick Centres, Inc. CanadaBrunswick China Limited Hong KongBrunswick Commercial & Government Products, Inc. DelawareBrunswick Companias de Mexico, S.A. de C.V. MexicoBrunswick Corporation ArkansasBrunswick Europe Holdings Limited England and WalesBrunswick European Group SPRL BelgiumBrunswick Family Boat Co., Inc. DelawareBrunswick Financial Services Corporation DelawareBrunswick France S.A. FranceBrunswick GmbH GermanyBrunswick GmbH AustriaBrunswick Hungary Manufacturing and Trading Limited Liability Company HungaryBrunswick Iberia, S.A. Sociedad Unipersonal SpainBrunswick International (Canada) Limited CanadaBrunswick International GmbH GermanyBrunswick International Holdings, Inc. DelawareBrunswick International Limited DelawareBrunswick International Sales Corporation U.S. Virgin IslandsBrunswick International Trading (Shanghai) Co., Ltd. ChinaBrunswick Marina, LLC DelawareBrunswick Marine Sales Corporation DelawareBrunswick Mercury Marine Equipment (Suzhou) Co., Ltd. ChinaBrunswick Netherlands B.V. NetherlandsBrunswick New Technologies Asia Pte. Ltd. SingaporeBrunswick New Technologies, Inc. DelawareBrunswick of Canada Limited Ontario, CanadaBrunswick Oslo Marine AS NorwayBrunswick Portugal, Lda. PortugalBrunswick Product Protection Corporation DelawareBrunswick Product Protection Corporation of Florida DelawareBrunswick Product Protection Corporation of California DelawareBrunswick Riverview Club, Inc. DelawareBrunswick Singapore Holdings Pte. Ltd. Singapore

Brunswick Sports Facilities (Shanghai) Co. Ld. ChinaBrunswick Sports Garden Co. Ltd. JapanCarolina Lanes Lounge, Inc. South CarolinaCentennial Assurance Company Ltd. BermudaChartus Corporation DelawareColumbia Lounge, Inc. MarylandCummins Mercruiser Diesel (French Branch) FranceCummins Mercruiser Diesel Europe Sprl BelgiumCummins Mercruiser Diesel Marine, LLC DelawareCummins Mercruiser Diesel South Pacific Pty Limited AustraliaCummins Mercruiser Diesel U.K. Limited England and WalesE.W. Driessen B.V. NetherlandsFibratrim Limited England and WalesGulfport Marina, LLC DelawareHarrigan Limited British Virgin IslandsHarris Kayot Marine, LLC IndianaHenrik J. Askviks Sonner AS NorwayIntegrated Dealer Systems Canada, Ltd. New Brunswick, CanadaKellogg Marine, Inc. ConnecticutL’Aigle D’or, Inc. (d/b/a 11th Frame Lounge, Inc.) MarylandLand ‘N’ Sea Corporation DelawareLand ‘N’ Sea Distributing, Inc. FloridaLand ‘N’ Sea Midwest, Inc. IllinoisLeiserv, Inc. DelawareLife Fitness (Atlantic) B.V. NetherlandsLife Fitness (U.K.) Limited England and WalesLife Fitness Asia Pacific Limited Hong KongLife Fitness China Limited Hong KongLife Fitness Europe GmbH GermanyLife Fitness International Sales, Inc. DelawareLife Fitness Italia S.r.L. ItalyLife Fitness Japan, Ltd. JapanLife Fitness Recreation, LLC DelawareLife Fitness Shared Services Center, B.V. NetherlandsLife Fitness Vertriebs GmbH AustriaLife Fitness, Inc. DelawareLund Boat Company DelawareLund Boats Canada, Inc. CanadaMarine Power Australia Pty Limited AustraliaMarine Power Deutschland GmbH GermanyMarine Power Europe, Inc. DelawareMarine Power International Limited DelawareMarine Power International Pty Limited DelawareMarine Power Italia S.p.A. ItalyMarine Power Nederland B.V. NetherlandsMarine Power New Zealand Limited DelawareMarine Power Sweden AB SwedenMercury Marine de Mexico, S.A. de C.V. MexicoMercury Marine do Brasil Industria e Comercio Ltda. BrazilMercury Marine Limited Ontario, CanadaMercury Marine Sdn Bhd MalaysiaMercury Marine Singapore Pte. Ltd. SingaporeMercury Marine Technology Suzhou Company Ltd. ChinaMercury Sales Corporation DelawareMonolith Corporation North CarolinaMototron Corporation DelawareNaviart Limited Hong KongNavman Australia Pty Limited AustraliaNavman Europe Limited England and WalesNavman New Zealand New ZealandNavman USA, Inc. DelawareNavman Wireless UK Limited England and WalesNew Zealand Holdings New ZealandNippon Brunswick Company Limited JapanNormalduns B.V. NetherlandsNormandy Restaurants, Inc. MarylandOBC International Holdings, Inc. DelawareOld Orchard Industrial Corp. Delaware

Oy Brunswick Finland FinlandPerformance Motor Yachts England and WalesPerry Hall Lounge, Inc. MarylandPrincecraft Boats, Inc. CanadaProductos Marine de Mexico, S.A. de C.V. MexicoProtokon Manufacturing Developing and Trading Limited Liability Company HungaryQuality Bowling Corporation CaliforniaRayglass Sales & Marketing Limited New ZealandRoadmaster Mexico, S.A. de C.V. MexicoRose Corporation Rhode IslandSBC International Holdings, Inc. DelawareSea Ray Boats, Inc. ArizonaSea Ray Boats, Inc. FloridaSealine International Limited England and WalesSealine Sales (UK) Limited England and WalesSealine Sales Balearic Islands SpainSealine Sales Deutschland GermanySkokie Investment Corporation DelawareSummit Marine, LLC MississippiSupra Industria Textil, Lda. PortugalSuzhou Taihu Mercury Club and Marina Co. Ltd. ChinaTechCom Car Communications AG GermanyTeignbridge Propellers (Australia) Pty. Limited AustraliaTeignbridge Propellers, Inc. DelawareTeignbridge Propellers Limited England and WalesTeignbridge Propellers Nederland B.V. NetherlandsTeignbridge Propulsion Gulf LLC DubaiTexas Operations Holding Company, Inc. TexasTexas Operations, LLC TexasThousand Oaks Company TexasTohatsu Marine Corporation JapanTriton Boat Company, L.P. TennesseeUttern Batar Aktiebolag SwedenValley-Dynamo, L.P. DelawareWintergreen Finance, Inc. DelawareWoodward Mototron Systems, LLC Delaware

Exhibit 23.1
Consent of Independent Registered Public Accounting Firm
We consent to the incorporation by reference in the Registration Statements (Forms S-3 No. 333-71344 and Forms S-8 No. 33-55022, No.33-56193, No. 33-61835, No. 333-04289, No. 333-27157, No. 333-112877, No. 333-112878, No. 333-112879, No. 333-112880 and No.333-77457), as amended, of Brunswick Corporation and in the related Prospectuses of our reports dated February 28, 2006, with respect tothe consolidated financial statements and schedule of Brunswick Corporation, Brunswick Corporation management’s assessment of theeffectiveness of internal control over financial reporting, and the effectiveness of internal control over financial reporting of BrunswickCorporation, included in this Annual Report (Form 10-K) for the year ended December 31, 2005.
/s/ ERNST & YOUNG LLPChicago, IllinoisFebruary 28, 2006

Exhibit 24.1
POWER OF ATTORNEY
The undersigned directors and officers of Brunswick Corporation, a Delaware corporation (the “Company”), do herebynominate, constitute and appoint Dustan E. McCoy, Peter G. Leemputte and Marschall I. Smith, and each of them individually, the true andlawful attorney or attorneys of the undersigned, with power to act with or without the other and with full power of substitution andresubstitution, to execute in the name and on behalf of the undersigned as directors and officers of the Company, the Annual Report of theCompany on Form 10-K for the fiscal year ended December 31, 2005 and any and all amendments thereto; and each of the undersignedhereby ratifies and approves all that said attorneys or any of them shall do or cause to be done by virtue hereof. IN WITNESS WHEREOF, each of the undersigned has executed this Power of Attorney in one or more counterparts on the date setopposite his or her name.
Capacity Signature Date Director /s/ NOLAN D. ARCHIBALD
Nolan D. Archibald February 7, 2006 Director /s/ JEFFREY L. BLEUSTEIN
Jeffrey L. Bleustein February 7, 2006 Director /s/ MICHAEL J. CALLAHAN
Michael J. Callahan February 7, 2006 Director /s/ MANUEL A. FERNANDEZ
Manuel A. Fernandez February 7, 2006 Vice Chairman and Director /s/ PETER B. HAMILTON
Peter B. Hamilton February 7, 2006 Director /s/ PETER HARF
Peter Harf February 7, 2006 Director /s/ GRAHAM H. PHILLIPS
Graham H. Phillips February 7, 2006 Director /s/ ROGER W. SCHIPKE
Roger W. Schipke February 7, 2006 Director /s/ RALPH C. STAYER
Ralph C. Stayer February 7, 2006 Director /s/ LAWRENCE A. ZIMMERMAN
Lawrence A. ZimmermanFebruary 7, 2006

Exhibit 31.1
Certification of Chief Executive Officer
I, Dustan E. McCoy, certify that:
1. I have reviewed this Annual Report on Form 10-K of Brunswick Corporation;
2. Based on my knowledge, this report does not contain any untrue statement of a material fact or omit to state a material factnecessary to make the statements made, in light of the circumstances under which such statements were made, not misleadingwith respect to the period covered by this report;
3. Based on my knowledge, the financial statements, and other financial information included in this report, fairly present in allmaterial respects the financial condition, results of operations and cash flows of the registrant as of, and for, the periods presentedin this report;
4. The registrant’s other certifying officer and I are responsible for establishing and maintaining disclosure controls and procedures(as defined in Exchange Act Rules 13a-15(e) and 15d-15(e)) and internal control over financial reporting (as defined in ExchangeAct Rules 13a-15(f) and 15d-15(f)) for the registrant and we have:
a) designed such disclosure controls and procedures, or caused such disclosure controls and procedures to be designed underour supervision, to ensure that material information relating to the registrant, including its consolidated subsidiaries, is madeknown to us by others within those entities, particularly during the period in which this report is being prepared;
b) designed such internal controls over financial reporting, or caused such internal control over financial reporting to bedesigned under our supervision t o provide reasonable assurance regarding the reliability of financial reporting and thepreparation of financial statements for external purposes in accordance with generally accepted accounting principles;
c) evaluated the effectiveness of the registrant’s disclosure controls and procedures and presented in this report our conclusionsabout the effectiveness of the disclosure controls and procedures, as of the end of the period covered by this report based onsuch evaluation; and
d) disclosed in this report any change in the registrant’s internal control over financial reporting that occurred during theregistrant’s most recent fiscal quarter that has materially affected, or is reasonably likely to materially affect, the registrant’sinternal control over financial reporting; and
5. The registrant’s other certifying officer and I have disclosed, based on our most recent evaluation of internal control overfinancial reporting, to the registrant’s auditors and the audit committee of registrant’s board of directors (or persons performingthe equivalent functions):
a) all significant deficiencies and material weaknesses in the design or operation of internal control over financial reportingwhich are reasonably likely to adversely affect the registrant’s ability to record, process, summarize and report financialinformation; and
b) any fraud, whether or not material, that involves management or other employees who have a significant role in theregistrant’s internal control over financial reporting.
Date: February 28, 2006
/s/ DUSTAN E. McCOY Dustan E. McCoy
Chairman and Chief Executive Officer

Exhibit 31.2
Certification of Chief Financial Officer
I, Peter G. Leemputte, certify that:
1. I have reviewed this Annual Report on Form 10-K of Brunswick Corporation;
2. Based on my knowledge, this report does not contain any untrue statement of a material fact or omit to state a material factnecessary to make the statements made, in light of the circumstances under which such statements were made, not misleadingwith respect to the period covered by this report;
3. Based on my knowledge, the financial statements, and other financial information included in this report, fairly present in allmaterial respects the financial condition, results of operations and cash flows of the registrant as of, and for, the periods presentedin this report;
4. The registrant’s other certifying officer and I are responsible for establishing and maintaining disclosure controls and procedures(as defined in Exchange Act Rules 13a-15(e) and 15d-15(e)) and internal control over financial reporting (as defined in ExchangeAct Rules 13a-15(f) and 15d-15(f)) for the registrant and we have:
a) designed such disclosure controls and procedures, or caused such disclosure controls and procedures to be designed underour supervision, to ensure that material information relating to the registrant, including its consolidated subsidiaries, is madeknown to us by others within those entities, particularly during the period in which this report is being prepared;
b) designed such internal controls over financial reporting, or caused such internal control over financial reporting to bedesigned under our supervision t o provide reasonable assurance regarding the reliability of financial reporting and thepreparation of financial statements for external purposes in accordance with generally accepted accounting principles;
c) evaluated the effectiveness of the registrant’s disclosure controls and procedures and presented in this report our conclusionsabout the effectiveness of the disclosure controls and procedures, as of the end of the period covered by this report based onsuch evaluation; and
d) disclosed in this report any change in the registrant’s internal control over financial reporting that occurred during theregistrant’s most recent fiscal quarter that has materially affected, or is reasonably likely to materially affect, the registrant’sinternal control over financial reporting; and
5. The registrant’s other certifying officer and I have disclosed, based on our most recent evaluation of internal control overfinancial reporting, to the registrant’s auditors and the audit committee of registrant’s board of directors (or persons performingthe equivalent functions):
a) all significant deficiencies and material weaknesses in the design or operation of internal control over financial reportingwhich are reasonably likely to adversely affect the registrant’s ability to record, process, summarize and report financialinformation; and
b) any fraud, whether or not material, that involves management or other employees who have a significant role in theregistrant’s internal control over financial reporting.
Date: February 28, 2006
By: /s/ PETER G. LEEMPUTTE Peter G. Leemputte
Senior Vice President and Chief Financial Officer

Exhibit 32.1
Certification Pursuant to Section 1350 of Chapter 63of Title 18 of the United States Code
I, Dustan E. McCoy, Chief Executive Officer of Brunswick Corporation, certify that (i) Brunswick Corporation’s Annual Reporton Form 10-K for the year ended December 31, 2005, fully complies with the requirements of Section 13(a) or 15(d) of the SecuritiesExchange Act of 1934 and (ii) the information contained in Brunswick Corporation’s Annual Report on Form 10-K for the year endedDecember 31, 2005, fairly presents, in all material respects, the financial condition and results of operations of Brunswick Corporation. By: /s/ DUSTAN E. McCOY Dustan E. McCoy
Chairman and Chief Executive OfficerFebruary 28, 2006

Exhibit 32.2
Certification Pursuant to Section 1350 of Chapter 63of Title 18 of the United States Code
I, Peter G. Leemputte, Chief Financial Officer of Brunswick Corporation, certify that (i) Brunswick Corporation’s AnnualReport on Form 10-K for the year ended December 31, 2005, fully complies with the requirements of Section 13(a) or 15(d) of theSecurities Exchange Act of 1934 and (ii) the information contained in Brunswick Corporation’s Annual Report on Form 10-K for the yearended December 31, 2005, fairly presents, in all material respects, the financial condition and results of operations of BrunswickCorporation. By: /s/ PETER G. LEEMPUTTE Peter G. Leemputte
Senior Vice President and Chief Financial OfficerFebruary 28, 2006