Bruno Crépon - econstor.eu
57
econstor Make Your Publications Visible. A Service of zbw Leibniz-Informationszentrum Wirtschaft Leibniz Information Centre for Economics Behaghel, Luc; Crépon, Bruno; Le Barbanchon, Thomas Working Paper Unintended Effects of Anonymous Resumes IZA Discussion Papers, No. 8517 Provided in Cooperation with: IZA – Institute of Labor Economics Suggested Citation: Behaghel, Luc; Crépon, Bruno; Le Barbanchon, Thomas (2014) : Unintended Effects of Anonymous Resumes, IZA Discussion Papers, No. 8517, Institute for the Study of Labor (IZA), Bonn This Version is available at: http://hdl.handle.net/10419/103483 Standard-Nutzungsbedingungen: Die Dokumente auf EconStor dürfen zu eigenen wissenschaftlichen Zwecken und zum Privatgebrauch gespeichert und kopiert werden. Sie dürfen die Dokumente nicht für öffentliche oder kommerzielle Zwecke vervielfältigen, öffentlich ausstellen, öffentlich zugänglich machen, vertreiben oder anderweitig nutzen. Sofern die Verfasser die Dokumente unter Open-Content-Lizenzen (insbesondere CC-Lizenzen) zur Verfügung gestellt haben sollten, gelten abweichend von diesen Nutzungsbedingungen die in der dort genannten Lizenz gewährten Nutzungsrechte. Terms of use: Documents in EconStor may be saved and copied for your personal and scholarly purposes. You are not to copy documents for public or commercial purposes, to exhibit the documents publicly, to make them publicly available on the internet, or to distribute or otherwise use the documents in public. If the documents have been made available under an Open Content Licence (especially Creative Commons Licences), you may exercise further usage rights as specified in the indicated licence. www.econstor.eu
Transcript of Bruno Crépon - econstor.eu

econstorMake Your Publications Visible.
A Service of
zbwLeibniz-InformationszentrumWirtschaftLeibniz Information Centrefor Economics
Behaghel, Luc; Crépon, Bruno; Le Barbanchon, Thomas
Working Paper
Unintended Effects of Anonymous Resumes
IZA Discussion Papers, No. 8517
Provided in Cooperation with:IZA – Institute of Labor Economics
Suggested Citation: Behaghel, Luc; Crépon, Bruno; Le Barbanchon, Thomas (2014) :Unintended Effects of Anonymous Resumes, IZA Discussion Papers, No. 8517, Institute for theStudy of Labor (IZA), Bonn
This Version is available at:http://hdl.handle.net/10419/103483
Standard-Nutzungsbedingungen:
Die Dokumente auf EconStor dürfen zu eigenen wissenschaftlichenZwecken und zum Privatgebrauch gespeichert und kopiert werden.
Sie dürfen die Dokumente nicht für öffentliche oder kommerzielleZwecke vervielfältigen, öffentlich ausstellen, öffentlich zugänglichmachen, vertreiben oder anderweitig nutzen.
Sofern die Verfasser die Dokumente unter Open-Content-Lizenzen(insbesondere CC-Lizenzen) zur Verfügung gestellt haben sollten,gelten abweichend von diesen Nutzungsbedingungen die in der dortgenannten Lizenz gewährten Nutzungsrechte.
Terms of use:
Documents in EconStor may be saved and copied for yourpersonal and scholarly purposes.
You are not to copy documents for public or commercialpurposes, to exhibit the documents publicly, to make thempublicly available on the internet, or to distribute or otherwiseuse the documents in public.
If the documents have been made available under an OpenContent Licence (especially Creative Commons Licences), youmay exercise further usage rights as specified in the indicatedlicence.
www.econstor.eu
DI
SC
US
SI
ON
P
AP
ER
S
ER
IE
S
Forschungsinstitut zur Zukunft der ArbeitInstitute for the Study of Labor
Unintended Effects of Anonymous Resumes
IZA DP No. 8517
September 2014
Luc BehaghelBruno CréponThomas Le Barbanchon
Unintended Effects of Anonymous Resumes
Luc Behaghel Paris School of Economics - INRA
and IZA
Bruno Crépon CREST and IZA
Thomas Le Barbanchon
CREST
Discussion Paper No. 8517 September 2014
IZA
P.O. Box 7240 53072 Bonn
Germany
Phone: +49-228-3894-0 Fax: +49-228-3894-180
E-mail: [email protected]
Any opinions expressed here are those of the author(s) and not those of IZA. Research published in this series may include views on policy, but the institute itself takes no institutional policy positions. The IZA research network is committed to the IZA Guiding Principles of Research Integrity. The Institute for the Study of Labor (IZA) in Bonn is a local and virtual international research center and a place of communication between science, politics and business. IZA is an independent nonprofit organization supported by Deutsche Post Foundation. The center is associated with the University of Bonn and offers a stimulating research environment through its international network, workshops and conferences, data service, project support, research visits and doctoral program. IZA engages in (i) original and internationally competitive research in all fields of labor economics, (ii) development of policy concepts, and (iii) dissemination of research results and concepts to the interested public. IZA Discussion Papers often represent preliminary work and are circulated to encourage discussion. Citation of such a paper should account for its provisional character. A revised version may be available directly from the author.

IZA Discussion Paper No. 8517 September 2014
ABSTRACT
Unintended Effects of Anonymous Resumes* We evaluate an experimental program in which the French public employment service anonymized resumes for firms that were hiring. Firms were free to participate or not; participating firms were then randomly assigned to receive either anonymous resumes or name-bearing ones. We find that participating firms become less likely to interview and hire minority candidates when receiving anonymous resumes. We show how these unexpected results can be explained by the self-selection of firms into the program and by the fact that anonymization prevents the attenuation of negative signals when the candidate belongs to a minority. JEL Classification: J71, J78 Keywords: anonymous applications, discrimination, randomized experiment Corresponding author: Thomas Le Barbanchon CREST 15 Boulevard Gabriel Peri 92245 Malakoff Cedex France E-mail: [email protected]
* We thank participants at various conferences (SOLE 2012, ESPE 2012, ESEM 2012, EALE 2012, ASSA 2013, NORFACE 2013) and seminar participants at MIT, Columbia University, Harvard University, IZA, IAB, CREST, CEE, Cergy University, INED, and Paris School of Economics for their helpful comments. We are especially grateful to Kate Antonovics, David Autor, Marianne Bertrand, David Blau, Raj Chetty, Laurent Davezies, Larry Katz, Liam Wren-Lewis, Philip Oreopoulos, Manasa Patnam, Roland Rathelot for comments on earlier drafts of this paper. We thank the French public employment service, Pôle Emploi, for its commitment in implementing this experiment. Pôle Emploi also provided access to data and financial support for this study. We thank Andrea Lepine, Julie Moschion and Pascal Achard for excellent research assistance, Abderrazak Chebira, Yann Algan, Corinne Prost and Hélène Garner for very helpful discussion on the measurement of applicants’ origin.

1 Introduction
Discrimination persists in today’s labor markets, a fact that has been exposed in different
contexts by correspondence testing, experiments that send out matched pairs of bogus re-
sumes and show that minority candidates receive fewer interview offers (Riach and Rich,
2002; Bertrand and Mullainathan, 2004; Duguet et al., 2010).1 Such evidence has led to a
renewed interest for “blind” hiring procedures of various forms. In some cases, the full hiring
process can take place through a screen: Goldin and Rouse (2000) famously showed that
American orchestras conducting blind auditions hired more women. In other cases, only the
first stage of the recruitment is made anonymous: this is the case in anonymous application
procedures, such as the masking of identifying characteristics in resumes (Aslund and Skans,
2012; Krause et al., 2012). Clearly, such procedures may be costly to operate, so an impor-
tant issue is whether or not to make them mandatory. To our knowledge, no government
has passed and enforced laws mandating anonymous resumes. This paper analyzes a mid-
dle ground between laissez-faire and mandatory anonymization by evaluating a program in
which the French government promoted anonymous resumes with the explicit goal of making
blind procedures a “reflex” to employers. The program was implemented in 2010 through
Pole Emploi (the main public employment agency) which offered to send anonymous resumes
(instead of name-bearing ones) of pre-screened candidates to firms posting jobs.
The public debate about the use of anonymous resumes is often quite contentious. In order
to improve the hiring prospects of minority candidates, anonymous resumes should not only
impact the screening of resumes, but also hiring decisions once the candidate’s minority
status is revealed. Proponents of the measure argue that this will be the case if the nature of
discrimination is implicit in the first place: recruiters make quick decisions when screening
resumes and may implicitly attribute bad signals to minority workers (Bertrand et al., 2005);
1In what follows, we will describe as “discrimination” situations where recruiters treat candidates differ-ently based on their origin (country of birth or of citizenship, or place of residence), keeping other informationon the candidates constant. With this definition, a situation in which changing the applicant’s name froma majority-sounding one into a minority-sounding one reduces callback rates is described as “discriminationagainst the minority.” Similarly, a situation in which hiding minority-sounding and majority-sounding namesby anonymizing resumes improves the relative callback rates of candidates with minority-sounding names isdescribed as “discrimination against the minority.”
1

this will not occur during interviews, as they have more time to make decisions. Opponents
argue that if employers consider that a majority type is a positive signal or characteristic,
anonymous procedures will not prevent them from using that information at the interview
stage. They may even interview more candidates when all the resumes they receive are
anonymous, in order to make sure to see at least one candidate of their preferred group.
In addition, “race-blind” screening processes are not necessarily “race-neutral”: if there is a
correlation between minority status and other elements in the resume, it may not be difficult
for recruiters to reconstruct missing information and continue to discriminate.2
In this paper, we evaluate an experimental program in which the French public employ-
ment agency, Pole Emploi, offered firms a voluntary anonymous resume procedure for their
recruitments. The design was as follows: when Pole Emploi identified a suitable vacancy, it
asked the recruiter to participate in the program. Firms that refused benefited from the stan-
dard service by Pole Emploi, and received the regular, name-bearing resumes of pre-screened
candidates. When a firm accepted, Pole Emploi’s caseworkers first went through the stan-
dard pre-screening process to come up with a suitable pool of candidates. The matched-up
vacancy/candidate pool was then assigned either to a group with a standard recruitment
procedure or to a group where all candidates’ resumes were made anonymous (the upper
block of the resume was suppressed: name, address, nationality, ID picture...). Candidates
and caseworkers did not know whether resumes would be anonymized or not, guaranteeing
that the impact of anonymous resumes on firms’ reactions was not confounded by changes
in the pool of candidates.
We analyze the impact of anonymous resumes on the interview and hiring rates of mi-
nority candidates – namely residents of deprived neighborhoods, immigrants, or children of
immigrants – compared to other (majority) candidates. Drawing on a sample of about 600
firms participating in the program, we find the surprising result that anonymization leads
to a large and significant widening of the gap in interview rates: the interview rate of mi-
nority candidates decreases, while that of majority candidates increases. We also find that
2See for instance Persico (2009). Similarly, Autor and Scarborough (2008) study the conditions underwhich “race-blind” job testing are not necessarily “race-neutral.”
2

the hiring rate gap widens, but the effect is smaller than that of interview rates, and only
significant at the 10% level. This adverse effect on minority candidates is the exact opposite
effect to what policymakers had hoped, and a surprising result given existing evidence from
correspondence testing in France (Duguet et al., 2010), which shows discrimination against
minority candidates for some jobs, no discrimination for others, but never discrimination
against majority candidates.3
We consider two mechanisms that could explain these results. First, we document firm
selection into the program. Among client firms of Pole Emploi posting suitable jobs, 62%
accepted the invitation to participate in the program. Participating firms are similar to
refusing firms in most observable dimensions, with a significant exception: they tend to
interview and hire relatively more minority candidates (when using standard resumes). These
facts suggest that the non-mandatory program acted as a separating device which led firms
that tend to treat minority candidates less favorably to decline participation, and those that
treat them more favorably to accept. Anonymization then prevented selected firms from
treating minority candidates more favorably during the experiment.
As a second step, we analyze how participating firms value resume attributes in the stan-
dard and anonymous procedures. In particular, we test the implications of statistical discrim-
ination models a la Aigner and Cain (1977), in which the returns to resume characteristics
may depend on the candidate’s minority or majority status. Minority candidates with neg-
ative signals (e.g. unemployment spells) can be penalized if anonymous resumes prevent
recruiters from interpreting those signals in the light of the circumstances faced by the can-
didates (e.g. adverse labor market conditions faced by minorities). To test this hypothesis,
we took all the resumes involved in the experiment, anonymized them, and asked counselors
from the public employment agency to rate them in the way recruiters would do. Along with
the rating, we also obtained auxiliary information on candidates such as adequate experience
and consistency of applicant skills with the position, among others. Consistent with Aigner
3Importantly, we follow control firms after the program and document that their recruitment behavior isnot different during its duration. Thus, the results are not an artifact of the experiment due to a change inthe behavior of the control group. Accordingly, had we conducted a correspondence study (in which firmsdo not know that they are observed) on the firms participating to the program, it is likely that we wouldhave found that, in these firms, minority candidates are more often interviewed than majority ones.
3
and Cain (1977), we find that some attributes have differential returns between minority
and majority candidates. This is the case for interrupted labor market histories (possibly
signaling unemployment spells), which are strongly negatively valued for majority candidates
but not for minority candidates. We also find that recruiters examining anonymous resumes
update the value they attach to a particular attribute by averaging across the minority and
majority groups. As a consequence, interrupted work histories, for example, are now nega-
tively valued for minority candidates under anonymization, and penalize majority candidates
less. The change in the valuation of the resumes under treatment and control explains more
than half of the change in the interview gap between majority and minority candidates.
The paper unfolds as follows. Section 2 provides some information about the political
context in which the program took place. Section 3 presents the experimental design, data
collection and description. Section 4 shows impacts on interview and hiring gaps, and on
other outcomes related to the hiring process and match quality. Section 5 analyzes firms’
selection into the program and how participating firms value resumes in the standard and
anonymous procedures. The last section concludes.
2 Institutional background
The first significant mention of anonymous resumes in the French political discourse was in
an official report by Claude Bebear (2004), the CEO of AXA, the main French insurance
company, which had for several years been using this procedure for its own recruitment.4
The recommendation to use anonymous resumes in this report came along with several
other suggestions aimed at sensitizing recruiters and developing reporting tools on ethnic
diversity within companies, despite the fact that collecting explicit data on race is forbidden
by French law (even in surveys, individuals cannot be asked whether they are Black or White,
Caucasian or African, etc.). At that stage, the purpose of anonymous resumes was to prevent
hiring discrimination against women and older workers as much as against ethnic minorities
or residents of deprived neighborhoods. Following Bebear’s report, Parliament debated and
4In French: http://www.larevueparlementaire.fr/pages/RP875/RP875 AN enbref.htm.
4

rejected a legislative amendment put forward by a conservative member that would have
made anonymous resumes mandatory for firms with more than 250 workers. Bebear himself
did not support the amendment, arguing that “All the recommendations in my report are
based on firms’ volunteering.... A law might even be counterproductive.”
The debate on anonymous resumes was revived after the riots that took place in the
greater Paris area in November 2005. A law passed in April 2006 (the Equality of Chances
Act) made anonymous resumes mandatory for firms with more than 50 employees. But the
government did not issue the “application decrees” needed to enforce the law.5 In 2009, it
finally decided to launch a program where firms would be invited to adopt an anonymous
resume hiring procedure for their recruitments made through the public employment service.
Having the program implemented by Pole Emploi was in line with its traditionally important
role in labor market intermediation: until 2005, Pole Emploi had had a legal monopoly on
the placement of unemployed job seekers and, at least in theory, all vacancies were supposed
to be posted by the agency.6 Furthermore, Pole Emploi had developed several advanced
free services for businesses, such as pre-screening candidates before sending their resumes to
hiring firms.
3 Experiment and data collection
3.1 Program and experimental design
In this section, we present the program and the experimental design used to measure the
impact of anonymous resumes. The program was conducted over ten months in eight (out
5The law itself specified neither who was supposed to actually anonymize resumes (and what this meantin practice), nor what sanctions would be levied against those who do not comply.
6In 2009, 2,438,700 jobs lasting more than one month were posted through Pole Emploi. This correspondsto 36% of hires concerning the same type of jobs. Bessy and Marchal (2007) show that public intermediaries(mostly, Pole Emploi) are the third channel of recruitment (spontaneous job applications and firm networkcome first and second), and represent 19% of recruitments in indefinite duration contracts. The use of thepublic employment services (PES) does not differ significantly by industry or firm size; it is however morefrequent for firms with a high turnover who set up more standardized recruitment processes and hire at lowerwages (close to the minimum wage); it is less frequent for managerial positions.
5

of 100) French departements, at branches of the public employment service (PES) located in
urban areas. It proceeded as follows:
1. Firm entry in the program. Firms posting vacancies at the PES have the option to
ask for a PES agent to make a first screening of applicants based on their resume.
About 50% ask for this service, and subsequently receive only selected resumes from
Pole Emploi (from a couple to a dozen, in most cases), instead of resumes sent directly
by applicants. This service is free. During the period of the program, all firms with
more than 50 employees posting a job lasting at least three months and asking for this
service are eligible for the program. They are told that their vacancy will be randomly
assigned to the anonymous or standard procedure, with probability 1/2. Firms are free
to decline to participate. A given firm enters the program at most once: firms that
have already participated are no longer offered the program.
2. Matching of resumes with vacancies. The PES posts the vacancy on a variety of
media, including a public website asking interested job seekers to apply through the
PES branch. On the webpage of the vacancy, one sentence informs job seekers that
there is an experiment going on.7 The PES agent selects resumes from these applicants
and from internal databases of job seekers. A first pool of resumes is thus matched
with the vacancy.
3. Randomization and anonymization. The resumes are sent to research assistants in
charge of the randomization at the central PES offices. Vacancies and their first pool
of resumes are together randomly assigned (using a random number generator) to
treatment or control group, with probability 1/2. If the vacancy is assigned to the
treatment group, all the resumes are given a number and anonymized by the research
assistant8; then they are sent back to the PES agent in charge of the vacancy follow-up.
4. Selection of resumes by the employer. The employer selects the resumes of applicants
7Except for this sentence, the experiment is not advertised among job seekers. Still, it could be thatthis sentence attracted minority candidates (“calling effect”). We do not find evidence for this: the share ofapplicants with an African- or Muslim-sounding name is the same in vacancies participating in the experimentas in those not participating.
8The degree of anonymization is described below.
6

she would like to interview. Control group employers contact the applicants directly;
treatment group employers give the PES agent the resumes’ numbers so that it is
the PES agent who sets up the hiring interviews, in order to maintain applicants’
anonymity.9
This experimental design calls for a few comments:
Anonymization is limited. Anonymization consisted in erasing the top part of the resume:
name, address, gender, nationality, ID picture, age, marital status and number of children.
However, it did not imply any further standardization of the content of the resume. In
particular, information on gender could be gathered from gender-specific terms used in the
main part of the resume, neighborhood of residence and age could be partly inferred from
information on where and when the applicant graduated from high school, and ethnicity
could be spotted from foreign language skills. To further anonymize resumes would have
implied much more complex logistics during the experimental program, and in any case it
was felt that such complex procedures could not have been standardized on a large scale.10
Randomization occurs after firms have agreed to participate. The estimated impact of
anonymous resumes only holds for this potentially selected group of firms. But this design
also allows us to increase statistical power, as there is perfect compliance in the experimental
sample.
Randomization occurs at the vacancy level. For a given vacancy, all resumes sent to
recruiters by the PES are treated identically (either anonymous, or standard). This level
of randomization ensures that, within the pool of candidates applying through the PES,
anonymous resumes do not compete with standard resumes. However, the PES is not the
only channel for recruitment: firms may also receive applicants from other sources, and
these resumes are not anonymized. We measure below whether firms substitute these other
channels for the PES in response to anonymization.
9If the employer could not fill the position with the first pool of resumes, she requests additional pools.The PES sends a new pool of selected resumes with the same format as for the first pool. Our main analysisexcludes the additional pools, as PES counselors knowing the format could have altered their selection.
10Supplementary Figure A-1 provides an example of a (short) anonymous resume; notice that the genderof the applicant can be inferred from gender-specific terms used; also, given the date of graduation from highschool, the person was probably about 25 at the time of the program.
7

Randomization occurs after matching resumes to vacancies. Had the pre-screening of re-
sumes by the PES occurred after randomization, the PES agent could have selected different
applicants for vacancies with anonymous resumes (consciously or not). This would have
affected the comparability of treatment and control applicants. To avoid this, a first pool
of resumes was selected before randomization occurred. All analyses below are restricted to
this first pool, as it contains resumes that are by construction statistically identical in the
control and treatment groups.
During the 10 months of the program (November 2009 to September 2010), 1,613 firms
were invited to enter the program. 1,005 (62.3%) agreed to participate, and the remaining
608 (37.7%) declined. Whether participating firms self-selected on characteristics related to
discrimination is one of the questions of the evaluation, and is analyzed in detail below. In
what follows, we first describe the data collection.
3.2 Data collection
We collected both administrative and survey data. The administrative data cover all firms
and all job seekers who used the public employment services in the experimental areas during
(and after) the program. It includes basic information on the firm (size, sector), on the job
position offered (occupation level, type of contract) and limited information on candidates
(unless the candidate is filed as unemployed).11 In what follows, the administrative data are
mostly used to characterize the population of firms entering the program, compared with
the broader population of firms interacting with the PES.
We conducted telephone interviews with all firms entering the program and with a sub-
sample of firms that declined to participate. We also interviewed subsamples of applicants
to these two groups of firms. Lastly, a subsample of applicants to vacancies posted after
the program by the control group and non-participating firms was also interviewed: as de-
tailed below, the goal was to check whether control firms behaved differently because they
11It also provides a follow-up of the recruitment process until the position is filled or the vacancy iswithdrawn; however, the quality of that follow-up is weak, and some critical information is missing. (Inparticular, the data do not show whether the candidate was interviewed before the firm rejected his/herapplication.)
8

knew they were in an experiment. The surveys used for applicants (respectively, for firms)
were similar across subsamples. We will describe these two surveys briefly here, and present
specific questions when they contribute to the subsequent analysis.12
As shown in Table 1, there are four groups of sampled firms. 385 control and 366 treat-
ment firms participated in the experimental program and went through the randomization.
254 firms accepted the program but were not randomly assigned to treatment or control;
they canceled or filled the job opening before a first pool of resumes was collected and ran-
domization could take place.13 All were sampled; response rates are around 60%, and the
response rate difference between control and treatment firms is not statistically significant.
608 firms declined to participate in the program and were sampled with lower sampling rates.
Response rates are also somewhat lower, as might be expected.
INSERT TABLE 1 HERE
The lower panel of Table 1 details the sample of applicants. Overall, response rates of
applicants to participating firms are around 65%; even if they are higher in the control
group, the difference is not statistically significant (the p-value is .27). The survey thus
yields a total sample of 1,268 applicants to participating firms, which constitutes our main
sample to analyze the impact of anonymous resumes. This main sample is complemented
with 203 applicants to non-participating firms, sampled at significantly lower rate, yielding
a secondary sample with 1,471 observations which we use to describe the recruitments that
were offered to participate in the program.14
The firm survey has two main functions. The first is to measure additional characteristics
of the vacancy and of the recruiter (characteristics that could be associated with a differential
treatment of candidates). Second, the survey includes detailed questions on the result of the
recruitment. It measures the time to hiring and the match quality. The first column of Table
12Survey tools are available upon request.13This underscores the fact that many firms actually fill their positions quickly without any help from the
PES, a point we will discuss below.14At that stage, applicants at risk of discrimination are identified from the administrative information
as those living in a deprived neighborhood or with an African- or Muslim-sounding name. They are givenhigher sampling weights, in order to maximize statistical power.
9

2 presents descriptive statistics on firms that were invited to participate in the program.15
The upper panel uses administrative data, while the bottom one uses information from the
firm survey (on the sample of 721 responding firms, see Table 1). With the administrative
data, it is possible to compare firms targeted by the program16 to the broader sample of
firms posting jobs at the PES in the experimental areas and around, during the program.17
Note that only firms with more than 50 employees were invited to participate, resulting in a
sample skewed toward large firms: half have more than 200 employees, compared to only one
third among the rest of PES client firms. Most of them deliver services: 57% in the market
sector and 24% in the non-market sector. Most firms in the program offer skilled positions
with open-ended contracts.18
INSERT TABLE 2 HERE
Table 3 reports some descriptive statistics on candidates, pooling together firms that did
and did not participate in the program. We first consider majority and minority candidates
together (column a). 46% of the candidates are women, 21% are younger than 26, and 8%
are over 50.19 We call “minority” individuals residing in deprived neighborhoods or having
a foreign background. This is exactly the target group of the anonymization law that was
implemented in response to the 2005 riots in Paris. To characterize deprived neighborhoods
of residence, we use administrative classifications of neighborhoods defined as a means to
target subsidies or tax exemptions, since their boundaries closely match socioeconomic geo-
graphical disparities.20 Moreover, one of the alleged perverse effects of such administrative
15This table pools all firms irrespective of their decision to participate in the program or not. The self-selection of participating firms is analyzed below.
16The sample of firms targeted by the program is further disaggregated to compare participating firmswith firms that refused to participate: see Section 5.1 below.
17The available administrative data do not allow us to isolate the geographical area covered by the program.This explains the large number of observations (45,283).
18Note that firms posting a job lasting under three months were not eligible to the program.19As noted in the above example (Figure A-1), indications of the candidate’s gender are likely to appear in
the resume even when its upper part is erased. Age can also be guessed – from the date of the last diplomaobtained. In this paper we do not consider the effect of anonymization on the differential treatment basedon gender or age, but our results are robust to adding these dimensions in the analysis.
20They are known as“zones urbaines sensibles”(ZUS) and“quartiers en contrat urbain de cohesion sociale”(CUCS); these zoning schemes are comparable to “enterprise zones” in the US. About 7% of the Frenchpopulation lives in ZUS, and 12% in ZUS or CUCS.
10

classifications is to create a stigma effect, making them particularly relevant to assess the
impact of anonymization. The next issue is to measure discrimination risk associated with
foreign origin or ethnicity, given that French law forbids the use of ethnic categories that
would label someone as White, Black, or African-French, for instance. Instead, we take
a twofold approach. First, in the spirit of correspondence testing studies (Bertrand and
Mullainathan, 2004), we code whether the applicants’ first names have a foreign-sounding
origin. Following research by Felouzis (2003), we use the etymology of the name. Muslim
first names are identified from a database created by Chebira (2005). Second, we use the
place of birth and the citizenship at birth. Immigrants are defined as those born abroad who
did not have French citizenship at birth. Children of immigrants are those whose father was
born abroad and did not have French citizenship at birth.21 The two approaches – based
upon name or the migration status – are complementary. In some cases, a foreign-sounding
name is the only signal that appears on the resume. But in other cases, immigrants may
have a French-sounding first name although their origin can be inferred from other signals
on the resume (for instance, their last name or an ID picture).
INSERT TABLE 3 HERE
In Table 3, roughly one applicant in four lives in a deprived neighborhood; the same
proportion has a Muslim- or African-sounding name. One in five is an immigrant, and that
proportion rises to two in five if the category is enlarged to be immigrants or children of
immigrants.22 The different measures of origin are correlated. Of particular interest is the
correlation between the name and the migration status: clearly, African- or Muslim-sounding
names correspond to applicants with a foreign origin (90%); however, a significant fraction of
migrants (including those from Africa) do not have African- or Muslim-sounding first names
(55%). The variables based on immigration (as declared during the surveys) may better
capture the risk of discrimination when that origin can be inferred from other signals in the
21Specific questions are used for the special case of individuals from former French colonies, who mightdeclare they were French citizens at birth if they were born before independence; they are classified asforeigners if they took the citizenship of their new country at independence.
22Among immigrants or children of immigrants, 45% come from North African or oriental countries, 29%from the rest of Africa, 9% from Southern Europe, and 6% from Eastern Europe. Other zones (Asia, America,Western Europe) are marginally represented (less than 3%).
11

resume. We perform robustness checks with these alternative measures below. In Table 3,
we also describe the resumes of the majority and minority candidates.23 Minority applicants
are more frequently men. They have less work experience relevant to the job vacancy. There
are no significant difference in terms of age, education and duration of unemployment.
As a last source of information, we had access to the resumes of a subsample of candidates
associated to firms that participated in the experiment. Specifically, we had access to resumes
that were submitted in pdf or doc formats (this excludes a minority of applications that went
through an online form on the PES website, to which we did not have access): this amounts
to 1140 resumes out of 1268 resumes in the main sample. We then asked 16 PES counselors
to act as recruiters and to code the resumes, by answering a dozen questions about the
adequacy of the qualification, experience and education of the candidates. Finally, the PES
counselors were asked to give an overall grade to the candidate and state whether they were
certain or not about that grade. In the analysis, we use four binary variables stemming from
this coding exercise, indicating whether the candidate has adequate skills, adequate work
experience, whether there are unexplained interruptions in his/her work history (possibly
signaling unemployment spells), and whether the quality of the application is particularly
uncertain.24 The lower part of Table 3 shows no significant differences in these characteristics.
Overall, the table shows limited differences between minority and majority candidates in the
experimental sample. One should keep in mind that all this concerns a sample of candidates
who have been pre-screened by PES agents. Differences between the minority and majority
may be much larger in the whole population of candidates.
4 Impact of anonymous resumes
Our experimental design allows us to directly estimate the impact of anonymous resumes
on recruitment outcomes in participating firms. We focus on the program’s impact on the
gap between interview (or hiring) rates of minority and majority applicants. Denote Y
23In Table A-2 in the online appendix, we compare majority and minority candidates applying to vacanciesparticipating in the experiment and to vacancies not participating.
24The questions of the grid used to code the resumes are available upon request.12

the variable measuring the fact that the applicant was received in interview, D ∈ {0, 1}
the indicator variable corresponding to the candidate being from the minority group, and
An ∈ {0, 1} the indicator variable corresponding to candidates applying to a vacancy with
anonymous applications (treatment group). The parameter of interest can be written as:
δ =(Y
An=1,D=1 − Y An=1,D=0)−(Y
An=0,D=1 − Y An=0,D=0), (1)
and can be estimated as the coefficient on Di × Anj in a regression of Yij on Di, Anj and
Di × Anj (where candidates are indexed by i and vacancies by j).
4.1 Interview rates
We first contrast the interview rate of candidates applying to control vacancies with that of
candidates whose resumes were sent in anonymous form to recruiters. Due to the experi-
mental design, this comparison can be interpreted as causal.25 Table 4 shows the interview
rates for different samples (first row for the control group and second row for the treat-
ment group). The average interview rate in the control group is around 10.5%. Recruiters
are quite selective when they screen resumes. The average interview rate in the treatment
group is 11.3%. The difference between the two interview rates is not statistically significant
(standard errors are clustered at the vacancy level). This means that the average number of
interviews per vacancy does not significantly increase when resumes are anonymous.
INSERT TABLE 4 HERE
In column 2 of Table 4, we report interview rates for the minority group. The interview
rate drops from 9.3% in the control group to 4.7% in the treated group. The difference
is statistically significant at the 5% level. Minority workers are actually harmed by the
anonymization procedure. In column 3, the interview rate of majority workers increases
25Tables A-3 and A-4 in the online appendix show that the treatment and control samples are balanced,with two exceptions: candidates in treatment firms have significantly more adequate skills and work expe-rience. We check below that our results are robust to controlling for these differences (column 3 of TableA-8).
13

from 11.6% to 17.7% due to anonymization. This increase is not statistically significant.
Both effects imply that the gap in interview rates between majority and minority candidates
actually widens by 10.7 percentage points (statistically significant at the 5% level, see column
4). This increase in the interview gap against minority candidates is the exact opposite
impact to what policymakers intended.26
4.2 Hiring rates
The lower panel of Table 4 reports hiring rates for minority and majority candidates. The
difference between the first and second row can be interpreted as causal, because these are
unconditional hiring rates.27 The hiring rate of minority workers is 2.3% in the standard pro-
cedure. It decreases to 1.7% in the anonymous procedure. The difference is not statistically
significant. The hiring rate of majority workers increases from 2.1% in the control group to
5.2% in the treatment group. Again the difference is not significant. However, the estimate
of the program impact on the hiring gap, −3.7 percentage points, is statistically significant
at the 10% level. This suggests that the negative relative impact of anonymous resumes
on minority candidates persists until the recruitment stage, even though it is less precisely
estimated. This finding goes against the argument of opponents to anonymous applications
who argue that the practice will only postpone discrimination behavior to later stages of the
recruitment, when the applicant’s type is revealed.
4.3 Recruitment success
The first two panels of Table 5 show the time needed to fill the vacancy, and the share of
vacancies that remain unfilled. This may provide indirect evidence on whether anonymous
26Note that the gap in interview rates in the standard procedure is small (−2.4 percentage points) and notstatistically significant. This is qualitatively close to Table 7, even though the sample is slightly different.Again, this cannot be interpreted as evidence that there is little discrimination (or of any kind of differentialtreatment of candidates according to their type), as the effect of the candidate’s type may be confoundedby differences in credentials as shown on the resumes (observed by the recruiter and not by the econometri-cian). As a robustness check, we introduce control variables in the analysis below. We further discuss theinterpretation of the results with regard to covariates in Section 5.
27Difference between hiring rates computed on the population actually interviewed can be biased asanonymization changes the composition of the pool of interviews.14

resumes affected the firms’ profits. We do not find any effect, however. Four recruitments out
of five are successful in both treatment and control groups, and half of successful recruitment
processes lasted less than 48 days, whatever the procedure.
A related question is whether receiving anonymous resumes from the PES led some re-
cruiters to rely more on other recruitment channels. The middle panel in Table 5 shows
that PES candidates only represent one third of hirings, illustrating the importance of other
recruitment channels (such as staff referrals, unsolicited applications, etc.). However, that
share is not reduced by the introduction of anonymous resumes. As such, there is no evidence
of a crowding-out effect (a frequent fear at the beginning of the program).
INSERT TABLE 5 HERE
Lastly, thanks to the recruiters’ survey, we have proxy measures for the quality of the
candidate eventually hired. Each new contract starts with a trial period (of up to three
months). We asked recruiters whether the recruitment was confirmed at the end of the trial
period and whether they are satisfied with the performance of the hired candidate over that
period. In the bottom panel of Table 5, we report the impact of anonymous resumes on the
corresponding variables. Around 80% of recruiters hire the candidate past their trial period
and recruiters rate candidates on average 7 (on a 1-10 scale). The anonymous procedure
does not significantly affect indicators for the quality of the match. The wage paid to the
hired candidate is another potential measure of the match quality. Wages paid to new hires
do not seem to be affected by anonymous resumes; the same fraction of hired candidates are
paid minimum wage in the treatment and control groups. For those paid above minimum
wage, the median wage is around 1,700 euros per month in both groups.
Overall, even though anonymous resumes did change the types of candidates interviewed
and also probably the types of candidates hired, we do not find any significant impact on
the satisfaction of recruiters, the negotiated wage, or other measures of recruitment success.
Even though the estimates are not very precise, they allow us, in a context where the PES
was in charge of the anonymization, to reject the claim that this procedure would have a
very high cost for firms.
15

4.4 Robustness checks
We perform a variety of tests to check the robustness of our key results to potential threats
to the experimental design, as well as to alternative measurement and model specifications.
A possible issue with the experimental design is the fact that participating firms knew
that they were part of an experiment. This in itself could affect their behavior. The risk
is particularly acute for control firms: they know they were observed; they also know the
identity of the applicants. They may therefore artificially select more minority applicants
in order to signal to the PES that they do not discriminate. This type of effect is known
as a “John Henry” effect, by which the control group makes extra efforts to perform well.
Such an effect could explain why treated firms appear less favorable to minority applicants:
the negative difference would not be due to a negative impact of anonymous resumes on
treatment firms, but to the positive impact of monitoring firms in the control group.
To test for the presence of such an effect, we ask whether control firm changed behavior
after the experiment, once they believe they are no longer observed. To do so, we sur-
veyed a subsample of applicants to 148 vacancies that were posted by control firms after the
experiment.28
INSERT TABLE 6 HERE
Table 6 shows no evidence of a John Henry effect. If anything, control firms were more,
rather than less, favorable to minority applicants when the experiment stopped. Of course, a
John Henry effect may persist over time (once firms know they have been observed, they are
durably more cautious); but one would expect the effect to subside. This is not the case. It is
also possible that control firms that hire minority workers because they are observed during
the experiment continue to do so afterwards because they have learned that minorities are
not such bad hires after all; although that would imply a large change in beliefs, we cannot
fully rule out that interpretation.29
28Note that relying on applicants for information on interview and hiring decisions made by the firmremoves any concern of firms becoming aware that we continue to observe them.
29Instead of focusing on vacancies posted by control firms after the experiment, one could have looked at
16

Another issue with the program is imperfect anonymization. The treatment consists of re-
moving the upper part of the resume, leaving its main part unaltered. As a consequence, one
may spot minority candidates from three characteristics on the resumes: languages skills (in
particular Arabic), foreign education, or work experience abroad. Imperfect anonymization
may result in attenuation bias; but it may also result in artificially large effects if firms feel
more free to discriminate against minority candidates when this status is imperfectly hidden,
as they could claim that they did not know the identity of the candidate. In practice, we do
not find that the impact of anonymous resumes on minority candidates depends on whether
the minority status could be identified from elements of the resume’s main part.30
In our main analysis, the applicant’s background enters in a quite specific way, exerting
the same effect for being of foreign background (immigrant or child of immigrant), residing
in deprived neighborhoods, and cumulating the two characteristics. We decomposed our
minority population into three sub-populations: being of foreign background and residing
in a deprived neighborhood, being of foreign background and not residing in a deprived
neighborhood, and residing in a deprived neighborhood but not being of foreign background.
The estimated impacts on both interview and hiring gaps for these three populations were
found homogeneous.31
As discussed above, there are also several ways to measure foreign background. We con-
sidered three alternative measures – being an immigrant, being the child of an immigrant, or
having a Muslim- or African-sounding first name. They yield similar results to our preferred
measure (which groups immigrants and children of immigrants). Point estimates, however,
tend to be lower, and the effect is no longer statistically significant when considering only a
Muslim- or African-sounding name.32
We checked that results are robust to alternative methods of inference, in particular by
vacancies posted before the experiment that would be fully exempt from any John Henry effect. However,this turns out not to be feasible. Indeed, administrative information being insufficient, we would need torun a survey of applicants on these past vacancies. These surveys would often occur with a significant delay– to identify control firms, one needs to wait for them to enter into the experiment! – which would creatememory bias among respondents.
30See Supplementary Table A-5 in the online appendix.31Results are shown in the Supplementary Table A-6 of the online appendix.32Results are shown in the Supplementary Table A-7 of the online appendix.
17

conducting permutation tests, drawing placebo treatment statuses at the job posting level.
Interestingly, the estimated changes in interview gaps and in hiring gaps become significant at
the 1% and 5% levels, respectively, when permutation tests are used (detailed results available
upon request). Lastly, results are robust overall to specification checks with covariates,
weights and functional form.33
5 Mechanisms
The results so far may seem at odds with existing evidence on firms’ hiring practices, in
France and elsewhere. Indeed, even though correspondence studies are less frequent in France
than in the US or Canada, existing ones often find statistically larger callback rates for
majority candidates, and we are not aware of any finding of a statistically larger callback rates
for minority candidates.34 In this section, we analyze what can explain this discrepancy. We
first show suggestive evidence that the voluntary nature of the program has led to a specific
population of firms – potentially an important difference with correspondence studies. We
then analyze how anonymization changes the way these firms screen resumes.
5.1 Firms’ participation decision
As explained above, targeted firms were free to participate or not in the program, and about
40% of them declined to participate. In this subsection, we document the firms’ self-selection
and assess whether this can explain the estimates. It should be stressed that this self-selection
comes as a second layer of selection, as the program was only offered to a specific pool of
33Specifically, Supplementary Table A-8 in the online appendix shows that estimated impacts on interviewrates and hiring rates are robust to controlling for the whole set of administrative and survey variableslisted in Tables 2 and 3, as well as for covariates coded from their resumes. Adding vacancy fixed effectsdoes not change the estimates but reduces precision: the coefficient on T × D remains stable but it is nolonger statistically significant (p-value: .20). We suspect that in the presence of vacancy fixed effects, robuststandard errors clustered at the vacancy level may be overly conservative. Indeed, with permutation tests asan alternative inference method (drawing placebo treatment status at the vacancy level), the p-value falls to.05. Removing sampling weights makes the coefficient become smaller and marginally significant only, whichunderscores the fact that treatment effects are smaller among applicants with a Muslim- or African-soundingname, who have been oversampled (see Supplementary Table A-7).
34See the special issue of Annals of Economics and Statistics (Duguet et al., 2010).
18

large firms, located in urban labor markets and used to relying on the Public employment
services to screen candidates. The specific features of firms targeted by the program have
been documented above, with the limited available data. What follows only considers factors
associated with the firm’s decision to participate in the program, when offered to do so. It
uses the much more detailed data that were collected through surveys.
Table 7 shows that non-participating firms strongly differ from participating ones by inter-
viewing and hiring significantly fewer minority candidates. Specifically, the table compares
interview and hiring rates of minority and majority candidates applying to vacancies posted
by firms that accepted to participate in the program but received name-bearing resumes (i.e.,
control firms) with the rates of those applying to firms that declined to participate. This
allows us to assess whether interview and hiring gaps differ in the two groups of firms, before
anonymous resumes are actually put in place.
INSERT TABLE 7 HERE
The upper panel displays interview rates. Participating and non-participating firms in-
terview the same proportion of candidates (about 14% on average).35 However this hides
considerable difference between the interview rates of minority and majority candidates. De-
fine the raw interview gap between minority and majority candidates in participating firms
as YP=1,D=1 − Y
P=1,D=0, with similar notations as in the previous section and P = 1 for
participating firms. This gap is small (0.6 percentage points) and non-significant. By con-
trast, minority candidates are much less likely to be interviewed than majority candidates in
non-participating firms (7.3% vs. 21%). The resulting interview gap, YP=0,D=1 − Y P=0,D=0
,
is large in absolute terms (-13.7 percentage points, significant at the 5% level). Finally,
the difference in interview gaps across the two types of firms,(Y
P=1,D=1 − Y P=1,D=0)−(
YP=0,D=1 − Y P=0,D=0
), is large and significant (14.3 percentage points, significant at the
5% level). The lower panel displays similar results for hiring rates: hiring rates of minority
35The sample in Table 7 only includes control firms and non-participating firms that posted at least asecond vacancy in the six months that followed the experimental program. This is due to the fact that thesample was initially used to analyze the firms’ behavior after the experiment was over (see the analysis ofTable 6, detailed below). As shown below, the behavior during and after the program are similar; Table7 therefore pools vacant jobs during the program and vacant jobs after the program, in order to increasestatistical power. Using only vacant jobs during the program yields similar results.
19

and majority candidates do not differ in control firms, but they are significantly lower for
minority candidates in non-participating firms (a 9.5 percentage point difference), so that
the hiring gap difference amounts to 8.7 percentage points (significant at the 5% level).36
Table 7 is not sufficient to conclude that participating firms self-selected from among those
that prefer minority candidates as such (or have a weaker preference for majority ones): the
large difference in interview and hiring gaps between participating and non participating
firms may be due to characteristics of the candidates that are observed by the recruiter
and not by the analyst.37 However, combined with the experimental results in the previous
section, they suggest a consistent story in which firms participating in the experiment had a
positive valuation of minority candidates’ resumes, so that anonymous resumes made their
decision become less favorable to those candidates. The next subsection further documents
these mechanisms.
5.2 Resume valuation by participating firms
In this subsection, we provide additional evidence on two questions, using detailed infor-
mation on candidates (coded from their resumes). First, how do participating employers
rate candidates in the standard procedure? Second, what are the exact mechanisms through
which anonymous resumes change the interview decisions of these employers? In particular,
we test whether a model of statistical discrimination a la Aigner and Cain (1977) can explain
the results. In such a model, recruiters may interpret resumes’ characteristics differently for
minority and majority candidates. They may for instance penalize candidates with unem-
ployment spells less when they are from the minority, as those candidates face more adverse
36Supplementary Table A-9 provides robustness checks. In particular, the results are robust to controllingfor resume attributes.
37Supplementary Table A-10 shows that firms’ participation is not correlated with the frequency of cus-tomer contact or the prevalence of teamwork in the job, aspects which are often thought to be respectivelyassociated with taste-based customer discrimination and taste-based employee discrimination. The back-ground of the recruiter (education and foreign origin) also does not predict firm’s participation, with theexception perhaps of a negative, marginally significant effect of being a woman. Lastly, the recruiter wasasked to name five friends as a way to assess his social network, and then to name five colleagues as a wayto measure the ethnic composition of the firm. The corresponding variables do not have a significant effect.Interestingly, even though the variables of Table A-10 constitute an unusually rich set of information onfirms, none allows us to interpret the differences in recruitment behavior observed in Table 7.
20
labor market conditions. In such a case, anonymous resumes can harm minority candidates
with negative signals as they prevent recruiters from interpreting those signals in the light
of the adverse circumstances faced by the candidates.
We start from a simple framework to analyze employer interview decisions under the
standard and anonymous procedures. We denote by X the information set available to the
recruiter in the resume, besides minority status (which we denote by the indicator D, equal
to 1 for minority candidates).
Consider the standard procedure first. The recruiter values resumes based on (X,D).
Assume that the potential valuation of a candidate V St(X,D) can be written as:
V St(X,D) = (1−D)×XβSt0 +D ×XβSt
1 + αD, (2)
where βSt0 and βSt
1 are the two vectors of returns to signals X for majority and minority
candidates.38
Equation 2 covers different standard cases of interest. If βSt0 = βSt
1 and α = 0, participating
recruiters do not value the resumes of minority and majority candidates differently and there
is no discrimination in the standard procedure. In a second case, βSt0 = βSt
1 and α > 0:
recruiters tend to value minority candidates more highly, even after controlling for all the
information available in the resumes, but they interpret signals X similarly for both types
of candidates. This occurs in models of taste-based discrimination where the preference for
minority candidates applies uniformly to all minority candidates, irrespective of their other
observable characteristics. It can also arise in some models of statistical discrimination, in
which minority and majority candidates are known (or believed) to have different average
productivity. The third and last case of interest is βSt0 6= βSt
1 . This occurs in particular in
models of statistical discrimination with heterogeneous signal quality, such as Aigner and
Cain (1977) and Cornell and Welch (1996), where signals are perceived to be more or less
informative depending on the candidate’s type.39
38To simplify notations, we normalize V St(0, 0) = 0. Estimations below include an intercept, though.39Clearly, this corresponds to pure cases, and may not hold in more general models; for instance, if the
magnitude of taste-based discrimination varies across groups of candidates, then taste-based discriminationcorresponds to the third case.
21

Estimates of the different parameters in equation 2 can be used to understand the valuation
of resumes under the anonymous procedure. In that procedure, recruiters do not have
direct information on the minority status of the candidate, D. Through Bayesian updating,
however, they can infer the expected value of a candidate characterized by X based on their
prior on the conditional distribution of D given X:
V An(X) = Pr(D = 1|X)V St(X, 1) + Pr(D = 0|X)V St(X, 0)
= p(X)× (XβSt1 + α) + (1− p(X))×XβSt
0 , (3)
where p(X) ≡ Pr(D = 1|X) reflects the recruiter’s prior on the probability that a candidate
with characteristics X is from the minority. When recruiters believe that a given character-
istic Xk is evenly distributed among minority and majority candidates, equation 3 implies
that the return to Xk is a weighted average of the returns in the standard and anonymous
cases. This is no longer the case when observing Xk induces the recruiter to update her prior
on whether the candidate is from the minority.40
The different parameters are estimated assuming linear probability models:
E(IStij |Xi, Di, j) = (1−Di)×XiβSt0 +Di ×Xiβ
St1 + αDi + cStj (4)
E(IAnij |Xi, Di, j) = Xiβ
An + cAnj , (5)
where Isij is an indicator variable equal to 1 if candidate i is interviewed by firm j, and s
denotes the recruitment procedure type (s = St or s = An). βAn is the return to X under the
anonymous procedure. With Bayesian updating, XβAn is a linear approximation of p(X)×
(XβSt1 +α)+(1−p(X))×XβSt
0 . Consistent estimates of 4 and 5 require accounting for firms
and candidates specific heterogeneity. Unobserved firm heterogeneity is captured by the job
posting effects csj , which can control for the fact that minority and majority candidates may
apply to different types of firms. Note that the csj are allowed to have different distributions
40Formally, ∂V An(X)∂Xk
= pβSt1k + (1 − p)βSt
0k if p(X) = p. But if p varies X, then ∂V An(X)∂Xk
also depends on∂p(X)∂Xk
. Figure A-2 illustrates that ∂V An(X)∂Xk
can be negative even when βSt1k and βSt
0k are both positive. Weare grateful to an anonymous referee for suggesting this illustration.
22

in the anonymous and standard procedures, as firms may change their recruitment strategy
in response to anonymization. Accounting for candidate specific heterogeneity requires that
the vector X, included in the equation, contains all the relevant information available to
the recruiters. To ensure this, we collected all the candidate information from the resumes
so as to match the exact information set available to recruiters. As detailed in section 3.2,
1140 resumes were made anonymous and coded by PES counselors. X includes almost all
“intermediate” items introduced in the grid used to code resumes (adequate skills, adequate
work experience, interrupted work history, information content of the resume).41
Resumes’ valuation under the standard procedure: where do the high interview rates of
minority candidates come from?
The first three columns of Table 8 present the estimation results of model 4, in the standard
procedure. The third column presents the p-values for the test that the coefficients of columns
1 and 2 are equal.42
INSERT TABLE 8 HERE
Overall, estimated effects tend to go in the expected direction. In particular, interview
rates increase when the candidate has adequate skills to perform tasks advertised in the
vacant job. The increase is large in magnitude and significant at the 5% level for majority
candidates: having adequate skills increases the interview rate by 14.4 percentage points
(this is the largest point estimate in the model). The return is smaller and not statistically
significant for minority candidates. The effect of unexplained interruptions in the candidate’s
labor market history – the fact that the resume shows gaps other than those explained by
education or maternity leave – is statistically insignificant in both the majority and minority
groups. However, the parameter estimate is negative for the majority group and positive
for the minority group, so that their difference is statistically significant (at the 10% level).
41We restrict the number of covariates to avoid potential multicollinearity problems. As robustness check,we include the overall rating made by the caseworkers evaluating the resumes. Doing so allows to capture allrelevant information missing in our grid. Supplementary Table A-11 in the Appendix shows that this doesnot qualitatively affect the main results.
42Note that the coefficients of columns 1 and 2 come from the same regression.
23
The larger returns for majority candidates are suggestive evidence in favor of the statistical
discrimination model with heterogeneous signal quality (Aigner and Cain, 1977). The non-
significant effect of interrupted labor market history for minority candidates also corroborates
the findings by Kroft et al. (2012) that recruiters attach less importance to unemployment
spells when they can be explained by adverse labor market conditions (in our case, high
unemployment rates in deprived neighborhoods). Lastly, job counselors were asked whether
they were certain/confident in their rating of each candidate. Their answer is a proxy for
the level of information conveyed by the resumes. They were told to declare their rating
“uncertain” when they found they had insufficient information to unambiguously rate the
candidate. We find no statistically significant effect of the “uncertainty” variable in the
minority and majority groups. The estimates are not significantly different.
Resumes’ valuation under the anonymous procedure: how do participating recruiters ex-
tract information?
The fourth column of Table 8 presents the estimation results of model 5, in the anonymous
procedure. As discussed above, the relationship with the returns in the standard procedure
(columns 1-2) depends on whether recruiters believe that the candidates’ characteristics
(X) help predict his minority status (Pr(D = 1|X) varies with X). Table 3 shows no
significant correlation between X and D. If there is Bayesian updating and recruiters’ priors
are consistent with the observed pool of candidates, we therefore expect the return to each
characteristic under the anonymous procedure to be close to the average of the returns
for minority and majority candidates in the standard procedure. This prediction holds
concerning the return to unexplained interruption in labor market history. The average of the
returns between minority and majority candidates is around -0.03 (= −0.09×0.5+0.03×0.5,
where 0.5 is the actual fraction of minority candidates), which is close to the actual return
estimated in the anonymous sample (−0.045 in the column 4). Some minority candidates are
actually harmed by anonymization, because they have an interrupted labor market history.
However, the Bayesian updating model is rejected in the case of “uncertainty,” which has a
significantly negative impact in the anonymous procedure, while coefficients were insignificant
and positive in the standard procedure, both for minority and majority candidates. In that
24
dimension, it seems that when the amount of information conveyed in the anonymous resume
is low, recruiters are “scared” and reject the candidates.
A decomposition of anonymous resumes’ impact
We have shown that minority candidates are adversely affected by anonymization because
some negative signals in their resumes, such as interrupted work history, are not attenuated
as they are in the standard procedure. Minority candidates can also be adversely affected
because recruiters reject candidates with low-information resumes when resumes are anony-
mous. If the resumes of minority candidates are less informative than those of the majority
candidates43, the former would be more adversely affected by anonymization than the latter.
To quantify these effects, we perform a decomposition exercise. We use estimates reported
in the previous table to decompose the change in the interview gap. Let us consider first
anonymous resumes. Using model 5, the gap in interview rates can be expressed as:
Gap(An) = E(Iij|An = 1, D = 1)− E(Iij|An = 1, D = 0)
= (E(Xi|An = 1, D = 1)− E(Xi|An = 1, D = 0)) βAn+
E(cj|An = 1, D = 1)− E(cj|An = 1, D = 0)+
E(νij|An = 1, D = 1)− E(νij|An = 1, D = 0).
There are therefore three components. The first is the effect of differences in endowments
of characteristics X, valued using the estimated β’s. The second is the vacancy effect: job
seekers from the minority may apply to vacant jobs that in average receive more (or less)
candidates than vacant jobs to which candidates from the majority are applying. The last
component is the contribution of the residuals (νij): there may be characteristics missing
that are correlated with minority.
43Table 3 shows a small difference in that direction, even though not statistically significant.
25

A similar decomposition can be produced for the standard procedure:
Gap(St) = E(Iij|An = 0, D = 1)− E(Iij|An = 0, D = 0)
= α +(E(Xi|An = 0, D = 1)βSt
1 − E(Xi|An = 0, D = 0)βSt0
)+
E(cj|An = 1, D = 1)− E(cj|An = 1, D = 0).
There are several differences in this decomposition compared to the previous one. First,
the effect of belonging to the minority (α) directly enters the decomposition; second, the
returns to each item are allowed to differ between minority and majority candidates; and
last, there is no residual effect. All these changes reflect the fact that the recruiter knows
the minority/majority type of the candidate.
Results are reported in Table 9. The first column reports elements of the decomposition
of the interview gap under the anonymous procedure, the second presents the decomposition
of the interview gap under the standard procedure, and the third gives the decomposition of
the change in gap. For each variable, as well as for the vacant job fixed effects, we compute
a net effect by subtracting column 2 from column 1.
INSERT TABLE 9 HERE
The first line provides the two interview gaps as well as the difference between them.
Closely related to the previous results presented in Table 4, the change-in-gap to explain is
a widening of 7 points.44 The contributions of the different signals to the minority/majority
gap in the anonymous sample are low (column 1). They are all negative and small, so
that their sum amounts to −0.3 percentage points. This is not surprising, as there are
few differences in the signals distribution between minority and majority candidates (see
Table 3). The contribution of vacant job fixed effects is larger, almost 7 percentage points.
This may reflect the self-selection of minority candidates (who tend to apply to job offers
where interview rates are low) or selection by the PES counselors in charge of the initial
44The difference between our estimate in the previous section and this estimate is due to the restriction ofthe sample from 1268 to 1140 individuals. We exclude candidates who did not send their resumes as PDFsor docs, but went through an on-line application form on the website.
26

matching of vacant jobs with candidates. Lastly, the contribution of residuals is lower, but
still important: -2.6 percentage points. Even if PES counselors coded the resumes that were
sent to recruiters, some signals correlated to the minority status are still missing from our
analysis.
In contrast to the decomposition in the anonymous sample, the contributions of the dif-
ferent signals in the nominative sample (column 2) are sizable: the total amounts to 3.6 per-
centage points (to be compared to an average interview rate of about 10%).45 This mainly
reflects the fact that returns to signals differ between the majority and minority candidates.
For example, the attenuation of the negative signal conveyed by an interrupted work history
leads to an increase by 3.7 points in the interview rates of minority candidates. Vacancy
fixed effects have the same contribution in the nominative sample than in the anonymous
sample, and the contribution of residuals is by construction equal to 0 in the nominative
sample.
As a consequence, it appears in column 3 that the main component of our change-in-gap
estimate is due to signal extraction, more precisely to the uniformization of returns between
majority and minority groups following anonymization. Out of the -7 points of our change-
in-gap estimate, -3.9 can be explained by difference in signal valuation. The contribution
of vacant job fixed effects vanishes as it is the same in both nominative and anonymous
samples. Finally, a relatively small fraction of our change-in-gap estimate is left unexplained
(-2.6); this may reflect remaining unobserved heterogeneity.
6 Conclusion
We have analyzed the first large-scale randomized experiment on the effects of anonymous
applications. The program was implemented among client firms of the French public em-
ployment agency, which were free to participate or not. Among 600 participating firms, 50%
received resumes where the upper block was suppressed. In anonymous resumes, recruiters
45As noted above, α is nothing else than the return to minority status for a reference individual. Itscontribution is therefore included in this subtotal.
27

could not read names, addresses, nationality, or other identifying items. Results show that
minority candidates are actually harmed by anonymous applications. The gap in interview
rate between minority and majority candidates worsens by around 10 percentage points when
resumes are made anonymous. The effect seems to persist beyond resumes’ screening, as the
hiring gap also widens by 4 points (only significant at the 10% level). Interestingly, anony-
mous resumes do not make recruiters interview more candidates, and the overall quality of
the job match does not seem to be affected.
The findings of the experiment led the PES to stop the program. However, the government
went one step further: it also abandoned the idea of making anonymous resumes mandatory,
an option that had not been evaluated. Our results concern volunteer firms and should not
be extrapolated to all firms, as we show that a significant number that usually interview
relatively few minority workers decided not to participate. This raises the suspicion that the
sample of participating firms did not include those less favorable to minority candidates –
providing a plausible reason why a policy unable to reach these firms failed to help minority
candidates.
Our results provide insights on the way recruiters in participating firms evaluate the can-
didates’ credentials in resumes, and how they extract information when receiving anonymous
resumes. In particular, we find evidence in favor of statistical discrimination models with
heterogeneous signal quality a la Aigner and Cain (1977): unexplained interruptions in work
histories cause less penalization to minority candidates, as should be the case if such inter-
ruptions are more frequent in that group, and therefore less informative on the skills of a
particular candidate. We also find evidence of Bayesian updating when resumes are made
anonymous. However, the finding that uncertainty on the candidate’s skills is strongly pe-
nalized when resumes are anonymous is harder to reconcile with statistical discrimination
and Bayesian updating. Confirming and combining these findings on recruiters’ behavior is
a stimulating avenue for further research.
28

References
Aigner, D. J. and Cain, G. G. (1977), ‘Statistical theories of discrimination in labor markets’,
Industrial and Labor Relations Review 30(2), 175–187.
Aslund, O. and Skans, O. N. (2012), ‘Do anonymous job application procedures level the
playing field?’, Industrial and Labor Relations Review 65(1), 82–107.
Autor, D. H. and Scarborough, D. (2008), ‘Does job testing harm minority workers? evidence
from retail establishments’, The Quarterly Journal of Economics 123(1), 219–277.
Bertrand, M., Chugh, D. and Mullainathan, S. (2005), ‘Implicit discrimination’, American
Economic Review 95(2), 94–98.
Bertrand, M. and Mullainathan, S. (2004), ‘Are emily and greg more employable than lak-
isha and jamal? a field experiment on labor market discrimination’, American Economic
Review 94(4), 991–1013.
Bessy, C. and Marchal, E. (2007), L’usage des canaux de recrutement par les entreprises,
Working Paper 89, Centre d’etudes de l’emploi.
Chebira, A. (2005), L’indispensable manuel orthographique des prenoms francais d’origine
arabe et musulmane, Technical report, Ed APIC.
Cornell, B. and Welch, I. (1996), ‘Culture, information, and screening discrimination’, Jour-
nal of Political Economy 104(3), 542–71.
Duguet, E., L’Horty, Y., Meurs, D. and Petit, P. (2010), ‘Measuring discriminations: an
introduction’, Annals of Economics and Statistics (99-100), 991–1013.
Felouzis, G. (2003), ‘La segregation ethnique au college et ses consequences’, Revue Francaise
de Sociologie 44(3), 413–447.
Goldin, C. and Rouse, C. (2000), ‘Orchestrating impartiality: the impact of blind auditions
on female musicians’, American Economic Review 90(4), 715–741.
29

Krause, A., Rinne, U. and Zimmermann, K. F. (2012), ‘Anonymous job applications of fresh
ph.d. economists’, Economics Letter 117(2), 441–444.
Kroft, K., Lange, F. and Notowidigdo, M. J. (2012), Duration dependence and labor market
conditions: Theory and evidence from a field experiment, Working Paper 18387, National
Bureau of Economic Research.
Persico, N. (2009), ‘Racial profiling? detecting bias using statistical evidence’, Annual Review
of Economics 1(1), 229–54.
Riach, P. A. and Rich, J. (2002), ‘Field experiments of discrimination in the market place’,
Economic Journal 112(483), 480–518.
30

Table 1: Sample size and response rates in the applicant and firm surveys
Population # sampled # of Sampling Responsesize (a) for survey (b) respondents (c) rate (b/a) rate (c/b)
A. FirmsParticipating 1,005 1,005 575 1.00 0.57
Control 385 385 229 1.00 0.60Treatment 366 366 212 1.00 0.58Withdrew before 254 254 134 1.00 0.53randomization (*)
Not participating 608 335 146 0.55 0.44
Total 1,613 1,340 721 0.83 0.54
B. ApplicantsIn participating firms 3,965 1,957 1,268 0.49 0.65
Control 2,035 1,003 660 0.49 0.66Treatment 1,930 954 608 0.49 0.64
In non-participating firms 8,583 378 203 0.04 0.54
Total 12,548 2,335 1,471 0.18 0.63
Notes: The upper panel displays population and sample size among firms invited to participate
in the program. They are split into participating and non-participating firms; participating firms
are then subdivided into firms that receive anonymous resumes (treatment) or not (control) and
firms that withdrew their vacancies before randomization. The lower panel displays corresponding
numbers for candidates applying to those firms. For participating firms, we restrict the population
to the first pool of candidates sent to the recruiter (pre-screened before randomization). This
cannot be done for non-participating firms. As a result, the total numbers of candidates in
participating and non-participating firms displayed in the table are not comparable. For the
survey of applicants in non-participating firms, the sampling was twofold: first we selected a
subsample of vacancies among firms that posted vacancies both during and after the experiment
(this enabled us to test for potential John Henry effect below) and then from among those job
vacancies, we selected a subsample of applicants.
(*) This corresponds to firms accepting to participate which canceled or filled the opening before
a first pool of resumes was collected and randomization could take place. By definition, there are
no candidates to survey in the sample of firms withdrawn before randomization.
31

Table 2: Characteristics of firms and vacanciesOffered to Other clientparticipate firms of
in the program the PES
Administrative data
Firm with fewer than 100 employees 0.31 0.64Firm with 100 to 200 employees 0.16 0.02Firm with more than 200 employees 0.53 0.34
Non-market services 0.24 0.18Market services 0.57 0.56Manufacturing 0.13 0.08Construction 0.03 0.09
Upper occupations 0.07 0.03Intermediary occupations 0.24 0.11Skilled white or blue collar 0.59 0.63Unskilled white or blue collar 0.11 0.23
Indefinite duration contract 0.64 0.51Temporary contract for more than 6 months 0.19 0.25
Observations 1,613 45,283
Firm survey
Involves teamwork 0.81Frequent customer contact 0.71
Recruiters’ characteristicsWoman 0.63College graduate 0.58French as mother tongue 0.96Immigrant 0.03Child of immigrant 0.08At least one friend (in 5) with Muslim or Afr. name 0.26At least one colleague (in 5) with Muslim or Afr. name 0.27
Observations 721
Source: PES administrative file (upper panel) and firm survey (lower panel). All vacant jobs.
Notes: The two columns present mean values of each variable on the population of firms eligible
to enter the program and those ineligible.
32

Table 3: Candidates’ characteristicsAll Majority Minority Diff-test
p-valuea b c b-c
Candidates’ SurveyWomen 0.46 0.55 0.36 0.01Under 26 years old 0.21 0.22 0.21 0.72Over 50 years old 0.08 0.07 0.09 0.57
Deprived neighborhood (1) 0.24 0.50Immigrant (2) 0.22 0.45Child of immigrant (3) 0.17 0.36Minority: (1), (2) or (3) 0.48 1.00African- or Muslim-sounding name 0.21 0.02 0.42 0.00
Professional degree 0.27 0.25 0.28 0.63High school diploma 0.19 0.17 0.21 0.20Upper education degree 0.47 0.50 0.42 0.19Relevant experience (years) 4.16 4.57 3.71 0.04Long-term unemployed 0.42 0.40 0.45 0.40Reservation wage is min wage 0.51 0.51 0.50 0.93
Nb of observations 1,471 658 813
Coding of resumesInterrupted work history 0.33 0.34 0.32 0.70Adequate skills 0.55 0.53 0.56 0.51Adequate work experience 0.58 0.61 0.56 0.27Uncertain rating 0.54 0.52 0.56 0.26
Nb of observation 1,140 636 504Source: Candidates’ survey. Notes: The first column presents mean values of each variable on
the population of candidates applying to vacant jobs eligible to the program (control, treatment
or non-participating firms; firms without randomization have no candidates sent through the
PES). Columns (b) and (c) compare majority and minority candidates applying to vacancies
participating to the program (p-value of the test for identity in the last column). Columns (d)
and (e) compare majority and minority candidates applying to vacancies not participating to the
program. Survey sampling weights are used.
33

Table 4: Impact of anonymous applications on interview and hiring rates gaps betweenminority and majority applicants
All Minority (D) Majority (ND) gap (D-ND)Interview rates
Standard (c) 0.105 0.093 0.116 -0.024(0.016) (0.017) (0.026) (0.031)
Anonymous (t) 0.113 0.047 0.177 -0.130***(0.017) (0.011) (0.030) (0.032)
Effect (t-c) 0.008 -0.046** 0.061 -0.107**(0.020) (0.020) (0.040) (0.045)
Nb of candidates 1,268 696 572 1,268Nb of vacant jobs 598 418 385 598
Hiring rates
Standard (c) 0.022 0.023 0.021 0.002(0.006) (0.008) (0.009) (0.012)
Anonymous (t) 0.035 0.017 0.052 -0.035**(0.010) (0.007) (0.017) (0.018)
Effect (t-c) 0.013 -0.006 0.031 -0.037*(0.011) (0.010) (0.019) (0.021)
Nb of candidates 1,268 696 572 1,268Nb of vacant jobs 598 418 385 598
Source: Candidates’ survey. Notes: The upper panel considers interview rates, the lower panel
considers hiring rates. For the upper panel, for example, the first column gives the interview rate
in standard vacant jobs (first row), in vacant jobs with anonymous applications (second row) and
the difference between the two (third row). The second column (D) does the same computations
but for applicants from the minority while the third column (ND) does it for applicants from the
majority. The last column considers the difference between column (D) and column (ND). Survey
sampling weights are used. Standard errors are clustered at the vacant job level.
34
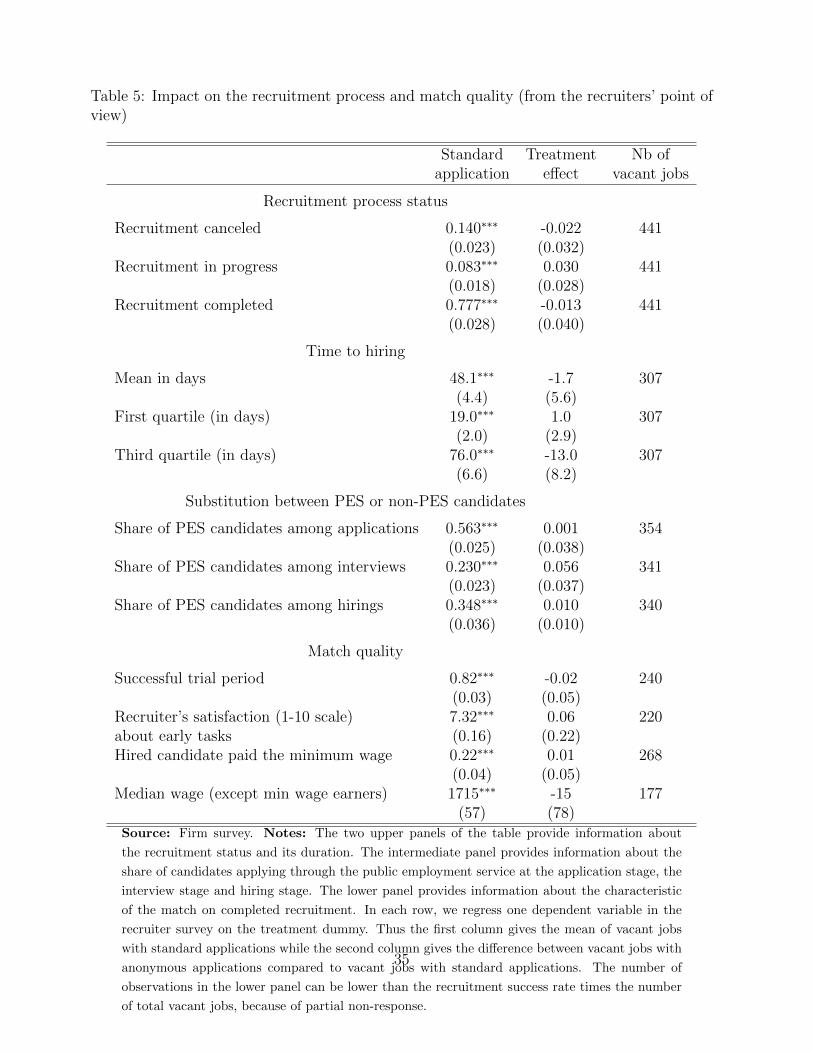
Table 5: Impact on the recruitment process and match quality (from the recruiters’ point ofview)
Standard Treatment Nb ofapplication effect vacant jobs
Recruitment process status
Recruitment canceled 0.140∗∗∗ -0.022 441(0.023) (0.032)
Recruitment in progress 0.083∗∗∗ 0.030 441(0.018) (0.028)
Recruitment completed 0.777∗∗∗ -0.013 441(0.028) (0.040)
Time to hiring
Mean in days 48.1∗∗∗ -1.7 307(4.4) (5.6)
First quartile (in days) 19.0∗∗∗ 1.0 307(2.0) (2.9)
Third quartile (in days) 76.0∗∗∗ -13.0 307(6.6) (8.2)
Substitution between PES or non-PES candidates
Share of PES candidates among applications 0.563∗∗∗ 0.001 354(0.025) (0.038)
Share of PES candidates among interviews 0.230∗∗∗ 0.056 341(0.023) (0.037)
Share of PES candidates among hirings 0.348∗∗∗ 0.010 340(0.036) (0.010)
Match quality
Successful trial period 0.82∗∗∗ -0.02 240(0.03) (0.05)
Recruiter’s satisfaction (1-10 scale) 7.32∗∗∗ 0.06 220about early tasks (0.16) (0.22)Hired candidate paid the minimum wage 0.22∗∗∗ 0.01 268
(0.04) (0.05)Median wage (except min wage earners) 1715∗∗∗ -15 177
(57) (78)Source: Firm survey. Notes: The two upper panels of the table provide information about
the recruitment status and its duration. The intermediate panel provides information about the
share of candidates applying through the public employment service at the application stage, the
interview stage and hiring stage. The lower panel provides information about the characteristic
of the match on completed recruitment. In each row, we regress one dependent variable in the
recruiter survey on the treatment dummy. Thus the first column gives the mean of vacant jobs
with standard applications while the second column gives the difference between vacant jobs with
anonymous applications compared to vacant jobs with standard applications. The number of
observations in the lower panel can be lower than the recruitment success rate times the number
of total vacant jobs, because of partial non-response.
35

Table 6: Interview rates in control firms during and after the experiment
Minority (D) Majority (ND) Gap (D-ND)During the experiment (c) 0.123 0.137 -0.014
(0.028) (0.029) (0.039)After the experiment (a) 0.166 0.145 0.021
(0.033) (0.036) (0.051)
Difference (a-c) -0.043 -0.008 -0.035(0.044) (0.048) (0.065)
Nb of candidates 442 365 807Nb of vacant jobs 220 218 296Nb of firms 134 132 146
Source: Candidates’ survey. Notes: The table as the same difference-in-difference structure as
Table 4. It only involves control firms which received standard resumes during the experiment. It
compares interview rates for vacant jobs during the experiment, first row (i.e. the experimental
vacant jobs analyzed in Table 4) and vacant jobs posted later (second row). Only control firms
that resubmitted a vacant job to the public employment services in the months following the
experiment are included (explaining the minor difference with Table 4). Survey sampling weights
are used. Standard errors are clustered at the vacant job level. More details on the sample
characteristics can be found in Supplementary Table A-1.
36

Table 7: Interview and hiring rates in firms accepting to participate (and randomized in thecontrol group) and in refusing firms
All Minority (D) Majority (ND) Gap (D-ND)Interview rates
Participating (only controls) firms (c) 0.143 0.146 0.140 0.006(0.015) (0.021) (0.031) (0.031)
Non-participating firms (r) 0.146 0.073 0.210 -0.137**(0.038) (0.028) (0.059) (0.063)
Difference (c-r) -0.004 0.073** -0.070 0.143**(0.041) (0.035) (0.063) (0.070)
Nb of candidates 1,378 759 619 1,378Nb of vacant jobs 507 374 376 507
Hiring rates
Participating (only controls) firms (c) 0.042 0.038 0.046 - 0.007(0.009) (0.012) (0.012) (0.018)
Non-participating firms (r) 0.085 0.034 0.129 -0.095**( 0.025) ( 0.018) (0.042) (0.046)
Difference (c-r) -0.043 0.004 -0.083* 0.087*(0.027) (0.022) (0.044) (0.049)
Nb of candidates 1,378 759 619 1,378Nb of vacant jobs 507 374 376 507
Source: Candidates’ survey. Note: This table displays interview (upper panel) and hiring (lower
panel) rates of candidates applying to control firms and to firms that declined to participate to the
program. The difference in interview rates between the two types of firms is in the third row. In
the first column minority and majority candidates are pooled together, while the second column
restricts to minority candidates (D) and the third to majority candidates (ND). In the last column,
we compute the difference between minority and majority candidate. Thus, the difference in the
minority/majority gap between firms with and without proposition can be found in the third
row, last column. Survey sampling weights are used. Standard errors are clustered at the vacant
job level. We pool candidates applying during and after the experiment to different vacant jobs
posted by eligible firms. Candidates to non-participating firms were sampled among firms that
posted vacancies during and after the experiment (this allows us to conduct the analysis of Table
6, detailed below). Similarly, only control firms that also posted vacancies after the experiment are
included here. For control firms, we pool candidates applying before or after randomization on the
same vacant job. For those reasons, the pool of candidates analyzed on control firms is different
from that of our main sample of analysis. However, the minority/majority gap in interview rates
is the same as in our main sample of analysis. More details on the sample characteristics can be
found in Supplementary Table A-1.
37

Table 8: Effects of different elements of the resume on the interview decisionStandard application Test Anonymous TestMajority Minority p-value All candidates p-valueβ0(St) β1(St) β0(St) = β1(St) β(An) β0(St) = β1(St) = β(An)
(1) (2) (3) (4) (5)Minority effect (α) -0.019
(0.087)
Has interrupted -0.094 0.028 0.088* -0.045 0.198work history (0.061) (0.046) (0.040)
Adequate skills 0.144** 0.073 0.360 0.054 0.419(0.058) (0.048) (0.037)
Adequate work -0.034 0.028 0.367 0.034 0.524experience (0.051) (0.046) (0.035)
High uncertainty 0.040 0.069 0.678 -0.106** 0.030**(0.052) (0.048) (0.050)
Nb of candidates 252 334 554Nb of vacant jobs 283 270
Source: Candidates’ survey and resumes’ coding. Notes : We estimate the effects of resumes’
signals on the interview rate in a model with vacant job fixed effect. Standard errors are clustered
at the vacant job level. Columns 1 and 2 show returns to signals X when resumes bear names
(estimation of Iij = (1 − Di) × Xiβ0(St) + αDi + Di × Xijβ
1(St) + cj + νij , where i indexes
candidates, j indexes vacant jobs and D indicates minority status), and column 4 when resumes
are anonymous (estimation of Iij = Xiβ(An) + cj + νij). Column 1 concerns majority candidates
(results for β0(St)), column 2 minority candidates (results for α and β1(St)). In column 3, we
report the p-value of the test of equality in returns between columns 1 and 2. In column 5,
we report the p-value of the test of equality between columns 1, 2 and 4. For example, when
nominative resumes show unexplained interruption of labor market history, the interview rate of
majority candidates decreases by 9.4 points and that of minority candidate increases by 2.8 points.
38

Table 9: Decomposition of interview gaps between minority and majority candidates
Anonymous Standard Difference-in-differences(a) (n) (a)-(n)
Raw interview gap -0.098*** -0.028 -0.070(0.033) (0.029) (0.043)
Signals/Characteristics (X):Interrupted work history -0.000 0.037* -0.037*
(0.002) (0.022) (0.023)
Adequate skills -0.001 -0.034 0.033(0.003) (0.040) (0.040)
Adequate work experience -0.000 0.035 -0.035(0.002) (0.038) (0.038)
High uncertainty -0.001 0.018 -0.019(0.005) (0.036) (0.036)
Minority effect (constant) 0.000 -0.019 0.019(0.000) (0.087) (0.087)
Subtotal over X (incl. constant) -0.003 0.036 -0.039(0.007) (0.037) (0.038)
Vacancy fixed effects -0.069*** -0.065** -0.005(0.026) (0.030) (0.038)
Residuals -0.026 -0.000 -0.026(0.018) (0.000) (0.018)
Source: Candidates’ survey and resumes’ coding. Notes: We report the minority/majority gap
in interview rates when resumes are anonymous in column 1 and when resumes are nominative in
column 2. In column 3, we compute the change in minority/majority gap due to anonymization.
The raw gap in interview rates (line 1) is decomposed between contributions due to difference in
signal valuations (from line 3 to 7), difference in type of vacant jobs and unexplained difference
(line 2 and last line). Contributions are obtained from estimates in Table 8. To obtain standard
errors, we bootstrap the decomposition 500 times clustering at the vacant job level.
39
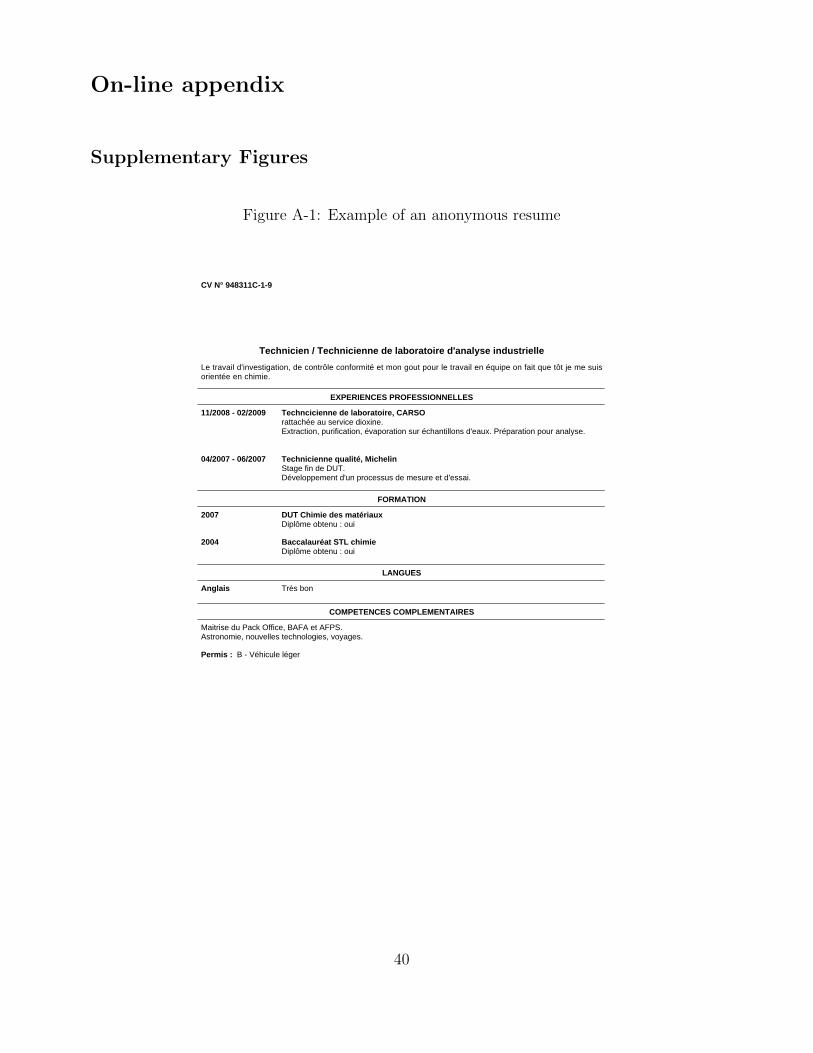
On-line appendix
Supplementary Figures
Figure A-1: Example of an anonymous resume
CV N° 948311C-1-9
Technicien / Technicienne de laboratoire d'analyse industrielle
Le travail d'investigation, de contrôle conformité et mon gout pour le travail en équipe on fait que tôt je me suisorientée en chimie.
EXPERIENCES PROFESSIONNELLES
11/2008 - 02/2009 Techncicienne de laboratoire, CARSOrattachée au service dioxine.Extraction, purification, évaporation sur échantillons d'eaux. Préparation pour analyse.
04/2007 - 06/2007 Technicienne qualité, MichelinStage fin de DUT.Développement d'un processus de mesure et d'essai.
FORMATION
2007 DUT Chimie des matériauxDiplôme obtenu : oui
2004 Baccalauréat STL chimieDiplôme obtenu : oui
LANGUES
Très bonAnglais
COMPETENCES COMPLEMENTAIRES
Maitrise du Pack Office, BAFA et AFPS.Astronomie, nouvelles technologies, voyages.
Permis : B - Véhicule léger
40

Figure A-2: Signal extraction with anonymous resumes
V
X
�
�1
An
St
�1St
�0St
D=1
D=0
Notes: The figure illustrates signal extraction with anonymous resumes when the signal X is
negatively correlated with minority status (D = 1). Even though the resume valuation V is
positively correlated with X conditional on D (returns βSt1 > 0 and βSt
0 > 0), the unconditional
correlation is negative (βAn < 0).
41

Supplementary Tables
Table A-1: Sample size and response rates in the applicants’ survey for the analysis of thedecision to participate and John Henry effect
Population # sampled # of Sampling Responsesize (a) for survey (b) respondents (c) rate (b/a) rate (c/b)
A. Sample for Table 7 (applicants in firms inside and outside the experiment)Participating (control firms) 4,451 1,651 981 0.37 0.59Refused to participate 2,389 717 397 0.30 0.55Total 6,840 2,368 1,378 0.34 0.56
B. Sample for Table 6 (applicants in control firms with job postings after the experiment)During the experiment 1,903 815 420 0.43 0.52After the experiment 2,548 836 387 0.33 0.46Total 4,451 1,651 807 0.37 0.49
Notes:This table is restricted to firms that posted vacancies during and after the experiment. Candidates to non-
participating firms were sampled among those firms. This explains why the population size of non-participating firms
(2,389) is lower than that in Table 1, although we consider candidates both during and after the experiment. Indeed
only 84 non-participating firms are included here. Similarly, only control firms that also posted vacancies after the
experiment (around 200) are included here. Note also that all candidates to those control firms are included (this table
is not restricted to the first pool of candidate sent to the recruiter). This is why the number of candidates in control
firms during the experiment (1,903) is not significantly lower than that in Table 1, although this table considers fewer job
vacancies. Finally, Table 6 only uses responding candidates in firms that have responding candidates during and after the
experiment, so as to have a balanced panel of firms. This explains why only 807 candidates are considered as respondents
(instead of 981). However, the results of Table 6 are qualitatively unchanged if one uses 981 responding candidates and
an unbalanced panel of firms.
42

Tab
leA
-2:
Can
did
ates
’ch
arac
teri
stic
sP
arti
cipat
ing
Non
-par
tici
pat
ing
All
Majo
rity
Min
orit
yD
iff-t
est
Majo
rity
Min
orit
yD
iff-t
est
p-v
alue
p-v
alue
ab
cb-c
de
d-e
Wom
en0.
457
0.56
10.
425
0.00
00.
534
0.31
70.
067
Under
26ye
ars
old
0.21
40.
268
0.31
00.
236
0.18
80.
131
0.38
3O
ver
50ye
ars
old
0.07
80.
104
0.11
80.
600
0.04
50.
064
0.67
1
Dep
rive
dnei
ghb
orhood
(1)
0.24
00.
484
0.50
6Im
mig
rant
(2)
0.21
80.
449
0.45
5C
hild
ofim
mig
rant
(3)
0.17
10.
337
0.37
0M
inor
ity:
(1),
(2)
or(3
)0.
481
1.00
01.
000
Afr
ican
-or
Musl
im-s
oundin
gnam
e0.
209
0.01
70.
451
0.00
00.
026
0.38
80.
000
Pro
fess
ional
deg
ree
0.26
80.
206
0.19
40.
706
0.28
60.
348
0.54
2H
igh
school
dip
lom
a0.
188
0.21
00.
246
0.33
50.
134
0.19
00.
334
Upp
ered
uca
tion
deg
ree
0.46
50.
553
0.47
90.
065
0.46
90.
385
0.38
8R
elev
ant
exp
erie
nce
(yea
rs)
4.15
64.
494
3.55
80.
001
4.61
83.
813
0.24
4L
ong-
term
unem
plo
yed
0.42
10.
298
0.31
70.
603
0.46
90.
538
0.42
5R
eser
vati
onw
age
ism
inw
age
0.50
50.
468
0.64
00.
000
0.53
80.
401
0.31
4
Nb
ofob
serv
atio
ns
1,47
157
269
686
117
Source:
Can
did
ates
’su
rvey
.Notes:
The
firs
tco
lum
np
rese
nt
mea
nva
lues
of
each
vari
able
on
the
pop
ula
tion
ofca
ndid
ate
sap
ply
ing
tova
cant
jobs
elig
ible
toth
epro
gra
m(c
ontr
ol,
trea
tmen
t
orn
on-p
arti
cipat
ing
firm
s;fi
rms
wit
hout
ran
dom
izati
on
hav
en
oca
ndid
ate
sse
nt
thro
ugh
the
PE
S).
Col
um
ns
(b)
and
(c)
com
pare
majo
rity
an
dm
inori
tyca
ndid
ate
sapp
lyin
gto
vaca
nci
es
par
tici
pat
ing
toth
epro
gra
m(p
-valu
eof
the
test
for
iden
tity
inth
ela
stco
lum
n).
Colu
mns
(d)
and
(e)
com
par
em
ajo
rity
and
min
ori
tyca
nd
idate
sapp
lyin
gto
vaca
nci
esn
ot
part
icip
atin
gto
the
pro
gram
.Su
rvey
sam
pling
wei
ghts
are
use
d.
43

Table A-3: Balancing test: Firms’ and vacant jobs’ characteristics
Treatment Control Diff-testp-value
a b a-b
Administrative data
Firm with fewer than 100 employees 30.9 29.0 0.56Firm with 100 to 200 employees 15.1 15.6 0.85Firm with more than 200 employees 54.0 55.5 0.69
Non-market services 24.7 23.2 0.64Market services 55.6 54.4 0.74Manufacturing 13.8 16.9 0.23Construction 3.4 3.6 0.90
Upper occupations 9.9 6.3 0.07Intermediary occupations 24.4 26.0 0.63Skilled white or blue collar 55.3 58.7 0.34Unskilled white or blue collar 10.4 9.0 0.53
Indefinite duration contract 66.5 62.6 0.26Contract for more than 6 months 86.0 82.2 0.16
Nb of resumes sent by the PES 5.5 5.5 0.90
Observations 385 366
Firm survey
Involves teamwork 85.2 75.4 0.01Frequent customer contact 71.9 67.9 0.41
Recruiters’ characteristicsWoman 63.8 57.8 0.18College graduate 59.0 62.1 0.48
French as mother tongue 97.8 97.6 0.90Immigrant 2.6 2.4 0.86Immigrant or daughter of immigrant 11.4 10.0 0.62At least one friend (out of 5)with Muslim or Afr. name 24.6 22.0 0.55At least one colleague (out of 5)with Muslim or Afr. name 27.5 27.0 0.88
Observations 229 212
Source: PES administrative file (upper panel) and firm survey (lower panel). Notes: First three
columns present mean values of each variable on the population of firms assigned to treatment
and control as well as the p-value of the test of identity.
44

Table A-4: Balancing test: Candidates’ characteristics
Treatment Control Diff-testp-value
a b a-b
Candidates’ Survey
Women 0.488 0.520 0.531Under 26 years old 0.299 0.294 0.885Over 50 years old 0.093 0.134 0.156
Deprived neighborhood (1) 0.241 0.224 0.557Immigrant (2) 0.218 0.215 0.926Child of immigrant (3) 0.157 0.169 0.661Minority: (1), (2) or (3) 0.474 0.492 0.649African- or Muslim-sounding name 0.225 0.228 0.922
Professional degree 0.181 0.223 0.243High school diploma 0.247 0.204 0.224Upper education degree 0.514 0.521 0.873Relevant experience (years) 4.09 3.99 0.746Long-term unemployed 0.281 0.340 0.122Reservation wage is min wage 0.569 0.606 0.404
Nb of observations 608 660
Coding of resumes
Adequate skills 0.480 0.619 0.000Adequate work experience 0.538 0.634 0.018Interrupted work history 0.324 0.336 0.751Uncertain rating 0.530 0.542 0.790
Nb of observations 586 554Source: Candidates’ survey and resumes coding. Notes: First three columns present mean values
of each variable on the population of candidates applying to vacant jobs assigned to treatment
and control as well as the p-value of the test of identity.
45

Table A-5: Impact of anonymous applications on minority applicants, by quality ofanonymization
Interview rate
Intercept 0.096*** 0.107*** 0.108*** 0.099*** 0.112***(0.017) (0.020) (0.020) (0.019) (0.023)
Anonymous (T) -0.046** -0.051** -0.048* -0.045* -0.051*(0.020) (0.024) (0.025) (0.023) (0.028)
Has studied abroad (I) -0.053(0.039)
T x I 0.022(0.045)
Has worked abroad (I) -0.049(0.039)
T x I 0.011(0.045)
Speak Arabic (I) -0.033(0.044)
T x I 0.001(0.047)
Resume imperfectly -0.044anonymized (Score) (0.035)T x Score 0.008
(0.041)
Vacant job controls Yes Yes Yes Yes YesObservations 696 617 636 649 597
Source: Candidates’ survey. Notes: This table restricts the sample to minority candidates. In
the first column, we estimate the average treatment effect controlling for vacant job characteristics
(note that there are almost no difference with estimates in Table 4, where we do not control for
any covariates). In the following columns, we introduce one-by-one some characteristics of the
resumes to explore treatment effect heterogeneity. In columns 2 to 4, the characteristics analyzed
are easy to read from the resume. In the last column, we compute a score of minority status based
on all signals available in the resume. When the score is over a certain threshold, the resume is
said imperfectly anonymized. Survey sampling weights are used. Samples are smaller in columns
2 to 5, because not all resumes were available as hard copy and, as already discussed, coding is
thus partial. Standard errors are clustered at the vacant job level.
46

Table A-6: Robustness analysis: interaction between foreign background and residence status
Interview rates Hiring ratesBaseline Interaction Baseline Interaction
(1) (2) (3) (4)Intercept .116∗∗∗ .116∗∗∗ .021∗∗ .021∗∗
(.026) (.026) (.009) (.009)
Minority (I or D) -.024 .002(.031) (.012)
Immigrant (or child of) (I) -.034 .006(.035) (.015)
Deprived neighborhood (D) .017 .002(.050) (.023)
I × D -.019 -.013(.062) (.028)
Anonymous (T) .061 .061 .031 .031(.040) (.040) (.019) (.019)
T × (I or D) -.107∗∗ -.037∗
(.045) (.021)
T × I -.111∗∗ -.053∗∗
(.048) (.023)
T × D -.148∗∗ -.038(.061) (.029)
T × I × D .197∗∗ .088∗∗
(.079) (.042)
Nb. of obs. 1268 1268 1268 1268Source: Candidates’ survey. Notes: In this table, we decompose our minority indicator in
its two main components: foreign background (immigrant or child of immigrant) and residence
status. In column 1 (3), we recall our baseline difference-in-difference estimation for the interview
(hiring) rates. In column 2 and 4, we distinguish candidates with foreign background (row 3),
those residing in deprived neighborhood (row 4) and those who cumulate both (row 5). For
example, in the control group, candidates with foreign background but not residing in deprived
neighborhood have an interview rate that is -3.4 points lower than majority candidates. The effects
of anonymization on the interview (hiring) rates of candidates with only one ”discriminatory”
characteristics are not statistically different whether the candidate has a foreign or lives in a
deprived neighborhood: -11.1 vs. -14.8 points (-5.3 vs. -3.8 points). OLS estimation without any
covariates. Survey sampling weights are used. Standard errors are clustered at the vacant job
level.
47

Table A-7: Robustness analysis: different measures of foreign statusImmigrant Immigrant Child of Muslim- or African-or child of immigrant soundingimmigrant names
Interview rates
Intercept 0.116*** 0.111*** 0.109*** 0.116***(0.026) (0.022) (0.022) (0.023)
Minority (D) -0.024 -0.016 -0.013 -0.029(0.031) (0.030) (0.030) (0.030)
Anonymous (T) 0.061 0.037 0.037 0.031(0.040) (0.034) (0.032) (0.034)
T × D -0.107** -0.075* -0.087** -0.063(0.045) (0.041) (0.040) (0.041)
Observations 1,268 1,268 1,268 1,268Hiring rates
Intercept 0.021** 0.025*** 0.019*** 0.022***(0.009) (0.008) (0.007) (0.008)
Minority (D) 0.002 -0.008 0.007 -0.000(0.012) (0.011) (0.013) (0.012)
Anonymous (T) 0.031 0.018 0.022 0.022(0.019) (0.016) (0.015) (0.016)
T × D -0.037* -0.015 -0.027 -0.024(0.021) (0.019) (0.020) (0.020)
Observations 1,268 1,268 1,268 1,268Source: Candidates’ survey. Notes: Survey sampling weights are used. Standard errors are
clustered at the vacant job level. We verify the robustness of our analysis when we change how
the foreign status is measured. In the first column, we recall our baseline estimate where an
individual is considered foreign when he is immigrant or child of immigrant. In column 2 (3),
foreign status is restricted to immigrant (to child of immigrant). In column 4, we consider as
foreigners candidates with Muslim- or African-sounding first names. In each column, a candidate
belongs to the minority if he has a foreign status or if he lives in a deprived neighborhood.
48

Table A-8: Robustness analysis: different specifications
Baseline Basic Controls (3) + Without Probitcontrols resume vacancy sampling
coding effects weight(1) (2) (3) (4) (5) (6)
Interview rates
Intercept .116∗∗∗ .139 .158 .135∗∗∗
(.026) (.113) (.116) (.020)
Minority -.024 -.011 -.015 .010 -.028 -.023(.031) (.032) (.032) (.053) (.026) (.030)
Anonymous (T) .061 .061 .055 .058∗ .048(.040) (.038) (.035) (.033) (.032)
T × minority -.107∗∗ -.094∗∗ -.087∗∗ -.097 -.073∗ -.089∗∗∗
(.045) (.045) (.044) (.075) (.040) (.026)
Nb. of obs. 1268 1268 1268 1268 1268 1268
Hiring rates
Intercept .021∗∗ .095 .079 .035∗∗∗
(.009) (.074) (.075) (.011)
Minority .002 .001 .001 .012 -.002 .002(.012) (.013) (.013) (.025) (.014) (.014)
Anonymous (T) .031 .026 .021 .022 .026∗
(.019) (.018) (.018) (.017) (.016)
T × minority -.037∗ -.026 -.024 -.038 -.026 -.025∗
(.021) (.021) (.021) (.038) (.021) (.011)
Nb. of obs. 1268 1268 1268 1268 1268 1268Source: Candidates’ survey. Notes: The table provides different estimations of the difference-
in-gap equation: Yij = α0 + αDDi + αAnAnj + δDi × Anj + εij . The first column considers
estimation of the equation using sampling weights. It provides the reference results also reported
in Table 4. The second column adds the following control variables (listed in Tables 2 and 3): firm
size and industries, occupations and type of contracts offered, candidates’ gender, age, education,
experience, unemployment status and dummies for each 15 PES’ local branches. The third column
adds covariates coded on a subsample of 1,140 resumes (indicators for interrupted labor market
histories, adequate work experience, adequate skills, and uncertain rating). The fourth columns
adds vacancy fixed effects. The fifth uses the same specification as in the first column, but without
sampling weights. The sixth column reports marginal effects of a probit estimation based on the
specification of the first column. Survey sampling weights are used (except in column 5). Standard
errors are clustered at the vacant job level.
49

Table A-9: Robustness analysis of firms’ participation: different specifications
Baseline With Without Logitcontrols sampling
weight(1) (2) (3) (4)
Interview rates
Intercept 0.210*** 0.200*** 0.140***(0.059) (0.047) (0.028)
Minority -0.137** -0.115** -0.049 -0.142**(0.062) (0.049) (0.033) (0.061)
Participating (P) -0.070 -0.056 0.007 -0.058(0.063) (0.052) (0.033) (0.050)
P × minority 0.143** 0.113** 0.044 0.190*(0.069) (0.057) (0.040) (0.104)
R2 0.162 0.220 0.138Nb. of obs. 1,378 1,378 1,378 1,378
Hiring rates
Intercept 0.129*** 0.128*** 0.101***(0.042) (0.037) (0.024)
Minority -0.095** -0.092** -0.065** -.076**(0.045) (0.040) (0.026) (.036)
Participating (P) -0.083* -0.078** -0.042 -.060**(0.044) (0.037) (0.027) (0.030)
P × minority 0.087* 0.076* 0.046 .091(0.049) (0.040) (0.030) (0.077)
R2 0.090 0.136 0.061Nb. of obs. 1,378 1,378 1,378 1,378
Source: Candidates’ survey. Notes: The table provides different estimations of the difference-
in-gap equation: Yij = α0 +αDDi +α1Pj +α2Di×Pj +εij . The first column considers estimation
of the equation using sampling weights. It provides the reference results also reported in Table 7.
The second column adds the whole set of variables listed in Tables 2 and 3 as control variables (firm
size and industries, occupations and type of contracts offered, candidates’ gender, age, education,
work experience and unemployment status). The third column estimates the previous equation
without sampling weights. The fourth column reports marginal effects of a logit estimation.
Survey sampling weights are used (except in the third column). Standard errors are clustered at
the vacant job level.
50
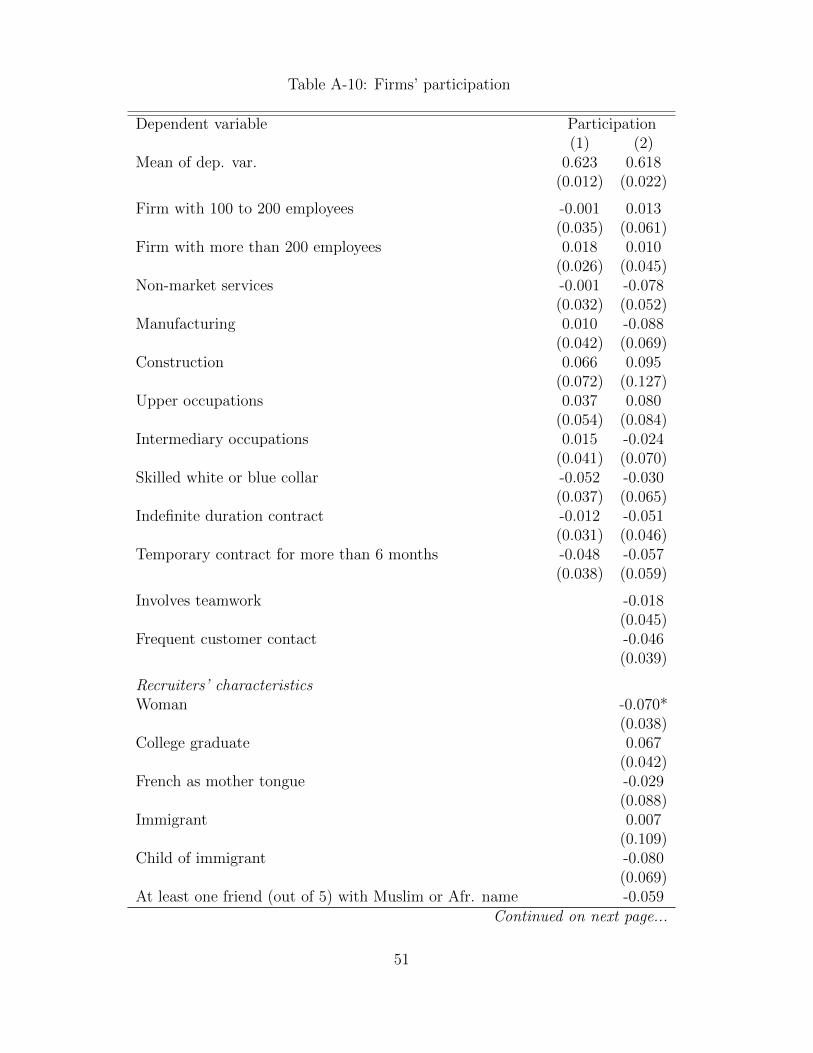
Table A-10: Firms’ participation
Dependent variable Participation(1) (2)
Mean of dep. var. 0.623 0.618(0.012) (0.022)
Firm with 100 to 200 employees -0.001 0.013(0.035) (0.061)
Firm with more than 200 employees 0.018 0.010(0.026) (0.045)
Non-market services -0.001 -0.078(0.032) (0.052)
Manufacturing 0.010 -0.088(0.042) (0.069)
Construction 0.066 0.095(0.072) (0.127)
Upper occupations 0.037 0.080(0.054) (0.084)
Intermediary occupations 0.015 -0.024(0.041) (0.070)
Skilled white or blue collar -0.052 -0.030(0.037) (0.065)
Indefinite duration contract -0.012 -0.051(0.031) (0.046)
Temporary contract for more than 6 months -0.048 -0.057(0.038) (0.059)
Involves teamwork -0.018(0.045)
Frequent customer contact -0.046(0.039)
Recruiters’ characteristicsWoman -0.070*
(0.038)College graduate 0.067
(0.042)French as mother tongue -0.029
(0.088)Immigrant 0.007
(0.109)Child of immigrant -0.080
(0.069)At least one friend (out of 5) with Muslim or Afr. name -0.059
Continued on next page...
51

... table A-10 continued
Dependent variable Participation(1) (2)
(0.050)At least one colleague (out of 5) with Muslim or Afr. name 0.018
(0.045)
Local PES branch fixed effects Yes Yes
Observations 1,613 721R-squared 0.277 0.484
Source: PES administrative file and firm survey. Notes: We estimate linear probability models
of the firms’ decision to participate. The reference group is made up of firms with fewer than 100
employees selling services in the market sector and posting a vacancy for an unskilled position.
Column 1 relies on characteristics available in the administrative file (exhaustive population). In
column 2, we add covariates obtained from the firm survey (restricting the sample to respondents).
Thus survey sampling weights are used in column 2. Robust standard errors are in parentheses.
We compute the F-test of the joint nullity of the coefficients in column 1 (resp. in column 2) related
to size 0.73 (0.97), industries 0.83 (0.28), occupations 0.04 (0.44) and contracts 0.39 (0.52). In
column 2, we also compute the test related to work type 0.39 and recruiters’ characteristics 0.22.
52

Table A-11: Effects of different elements of the resume on the interview decisionStandard application Test Anonymous TestMajority Minority p-value All candidates p-valueβ0(St) β1(St) β0(St) = β1(St) β(An) β0(St) = β1(St) = β(An)
(1) (2) (3) (4) (5)Minority effect (α) -0.014
(0.090)High overall rating 0.078 0.074* 0.961 0.044 0.853
(0.066) (0.038) (0.044)Has interrupted -0.090 0.038 0.070* -0.044 0.156work history (0.060) (0.046) (0.040)Adequate skills 0.120** 0.044 0.304 0.032 0.428
(0.056) (0.045) (0.040)Adequate work -0.056 0.007 0.416 0.031 0.444experience (0.059) (0.049) (0.035)High uncertainty 0.0636 0.076 0.862 -0.098** 0.024**
(0.055) (0.047) (0.050)Nb of candidates 252 334 554Nb of vacant jobs 283 270
Source: Candidates’ survey and resumes’ coding. Notes : Robustness analysis for Table 8.We
estimate the effects of resumes’ signals on the interview rate in a model with vacant job fixed effect.
Standard errors are clustered at the vacant job level. Columns 1 and 2 show returns to signals x
when resumes bear names (estimation of Iij = (1−Di)×Xiβ0(St)+αDi+Di×Xijβ
1(St)+cj+νij ,
where i indexes candidates, j indexes vacant jobs and D indicates minority status), and column
4 when resumes are anonymous (estimation of Iij = Xiβ(An) + cj + νij). Column 1 concerns
majority candidates (results for β0(St)), column 2 minority candidates (results for α and β1(St)).
In column 3, we report the p-value of the test of equality in returns between columns 1 and
2. In column 5, we report the p-value of the test of equality between columns 1, 2 and 4.
For example, when nominative resumes display an interruption in labor market history of the
candidate, the interview rate of majority candidates decreases by 9 points and that of minority
candidates increases by 3.8 points.
53