Bruk av prosjektsamarbeidsmodeller i konkurranser underlagt anskaffelsesreglene

T. J. Brukilacchio, Ph.D. Thesis 2003
69
Chapter 4
Design of a Time-Domain Optical Breast Imaging System
A comprehensive review of the literature detailed in Chapter 3 indicated that no
other clinical-ready time-domain mammographic optical imaging system exists that is
capable of acquiring three-dimensional image data within a two to three minute period
with multiple wavelengths and high source and detector spatial resolution. The Time-
Domain Optical Breast Imaging System detailed in this dissertation is matched in
capability by no other system and offers a unique opportunity to advance the state-of-the-
art in optical mammography.
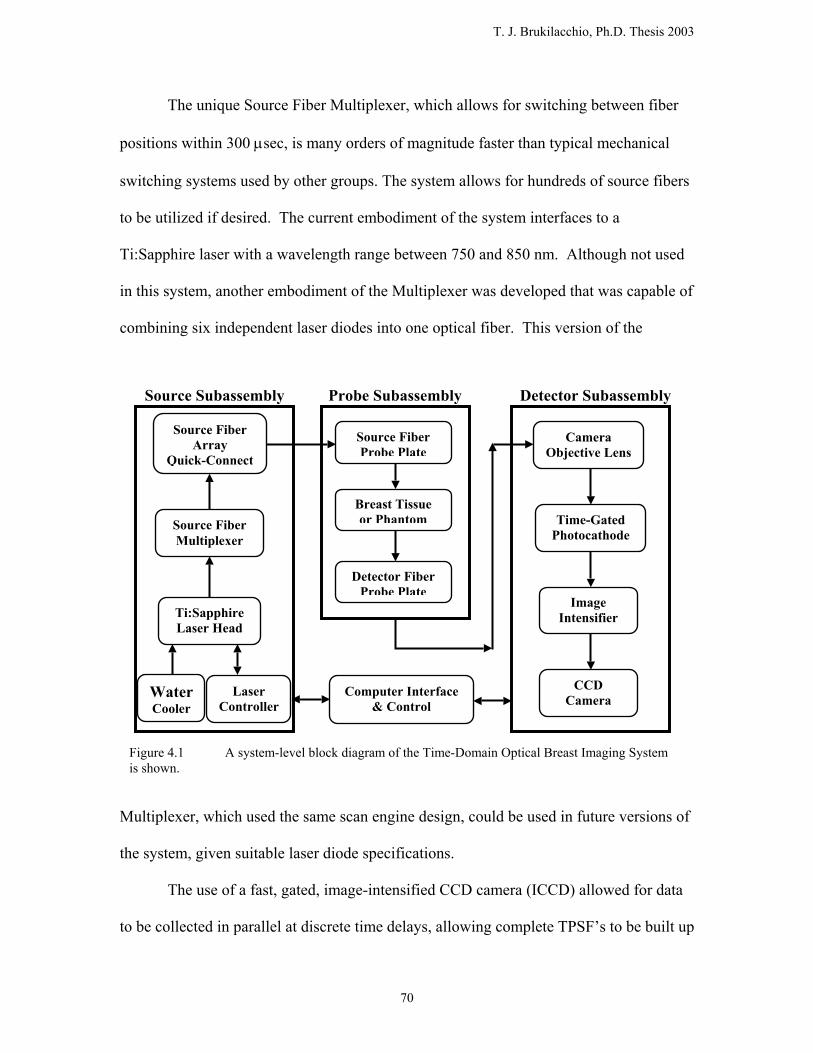
A system-level functional block diagram of the Time-Domain Optical Breast
Imaging System is shown in Figure 4.1. The Source Subassembly is comprised of a
mode-locked pulsed Ti:Sapphire laser with it’s associated water cooling and control
electronics interfaced to a Source Fiber Multiplexer, which switches the laser output into
one of 150 fibers in the Source Fiber Array Quick-Connect. A fiber bundle connects the
Source Subassembly to the Probe Subassembly, which is comprised of Source and
Detector Fiber Probe Plates configured in transmission geometry. Both probe plates have
quick-release features to enable the co-registration of an X-ray image. A second fiber
bundle connects the Probe Subassembly to the Detector Subassembly, which is
comprised of an objective lens that images the array of detection fibers onto a time-gated,
image-intensified charge coupled device camera (ICCD).
T. J. Brukilacchio, Ph.D. Thesis 2003
70
The unique Source Fiber Multiplexer, which allows for switching between fiber
positions within 300 µsec, is many orders of magnitude faster than typical mechanical
switching systems used by other groups. The system allows for hundreds of source fibers
to be utilized if desired. The current embodiment of the system interfaces to a
Ti:Sapphire laser with a wavelength range between 750 and 850 nm. Although not used
in this system, another embodiment of the Multiplexer was developed that was capable of
combining six independent laser diodes into one optical fiber. This version of the
Multiplexer, which used the same scan engine design, could be used in future versions of
the system, given suitable laser diode specifications.
The use of a fast, gated, image-intensified CCD camera (ICCD) allowed for data
to be collected in parallel at discrete time delays, allowing complete TPSF’s to be built up
Laser Controller
Source Fiber Multiplexer
Computer Interface& Control
Source Fiber Array
Quick-Connect
WaterCooler
Source Fiber Probe Plate
Ti:SapphireLaser Head
Detector FiberProbe Plate
Breast Tissue or Phantom
Camera Objective Lens
Time-Gated Photocathode
Image Intensifier
CCD Camera
Source Subassembly Probe Subassembly Detector Subassembly
Figure 4.1 A system-level block diagram of the Time-Domain Optical Breast Imaging System is shown.

T. J. Brukilacchio, Ph.D. Thesis 2003
71
for multiple source-detector positions. The third enabling feature of the system was the
custom designed, high performance, unit magnification ICCD objective lens that
permitted the massively parallel acquisition of 313 detection fibers.
The fourth enabling system feature was the compact source and detector fiber
optic probe with unique quick-release features mounted within modified compression
plates. The probe was designed to mate to a digital tomosynthesis X-ray mammography
system to allow for co-registered multi-modality optical and X-ray images.
The details of the Time-Domain Optical Breast Imaging System are reviewed in
the following sections. The first section discusses the system-level design and integration.
The source subsystem is detailed next, followed by the detector subsystem and then the
probe design. The last section reviews the design and fabrication of the homogeneous
and heterogeneous phantoms and a Phantom Test Stand used to characterize the system
in a laboratory setting.
4.1 System-Level Design of the Time-Domain Optical Breast Imaging System
The instrumentation for the Time-Domain Optical Breast Imaging System is shown
in Figure 4.2, below. The fiber optic probe, which was a critically important part of the
system, is not shown in the diagram. The probe is discussed in detail in Section 4.4.
The central thesis of this dissertation states that optical imaging of diffuse tissues
must be combined in co-registration with a recognized gold standard of mammographic
screening, i.e. X-ray mammography, to gain wide acceptance in the clinical environment.
This multi-modality imaging approach promises to overcome the deficiencies of both
imaging modalities by drawing on the strengths of each. Functional and structural image
contrast would be provided by optical and high-resolution structural contrast by X-ray.

T. J. Brukilacchio, Ph.D. Thesis 2003
72
Furthermore, the structural information provided by the radiocontrast of X-ray could be
used to improve the optical image reconstruction by providing boundary information and
soft constraints for weakly correlated structural contrast. Ultimately, image-processing
techniques could be developed to provide the radiologist with a three-dimensional image
indicative of both optical and X-ray contrast that would provide much greater information
content than either modality alone.
Portable Cart
Computer
Source Multiplexer
Water Cooler
Power Conditioners
Camera Controls
ICCD Camera & Objective
Ti:Sapphire Laser Head
Laser Controller & Heat Exchanger
Figure 4.2 The Time-Domain Breast Imaging System instrument is shown housed in a wheeled cart. The probe is not shown.

T. J. Brukilacchio, Ph.D. Thesis 2003
73
With reference to Figure 4.2, all instrumentation for the Time-Domain Optical Breast
Imaging System resided on a portable wheeled cart, with the exception of the probe,
computer monitor, and keyboard. The lower shelf housed the power conditioning units
on the left, the laser water cooler in the middle and the laser controller and heat
exchanger on the right. The middle shelf held the Source Subassembly, consisting of the
Source Fiber Multiplexer on the left and the Ti:Sapphire laser head on the right, both
mounted on a sturdy optical bench. The bench was mounted on shock mounts to
minimize shock and vibration that could have occurred during transportation. The laser
head was attached to an umbilical containing electrical power and control lines and
water-cooling hoses. The top shelf held the computer on the left, the ICCD camera
system in the middle, connected to the probe by a black-jacketed fiber bundle, and the
gate and image intensifier controllers on the right.
Software was written in the C language to provide for computer control of the laser
and ICCD camera, data acquisition, data storage, and a user interface. The software was
written and maintained by Jonathan Stott, Ph. D., of the Photon Migration Lab at
Harvard’s Massachusetts General Hospital. The Photon Migration Imaging (PMI)
MatLab toolbox used for image reconstructions was primarily written by David Boas, Ph.
D., Director of the Photon Migration Lab. Jonathan Stott was also responsible for many
of the modifications to the toolbox for time-domain imaging.
4.2 Time-Domain Source Subsystem
The Time-Domain Source Subsystem is shown in rendered view in Figure 4.3. The
laser head was the Mai-Tai mode-locked Ti:Sapphire laser diode pumped system from

T. J. Brukilacchio, Ph.D. Thesis 2003
74
Spectra Physics Corporation. It was modulated at 80 MHz and provided an average
linearly polarized power between 700 and 1000 mW over the wavelength range between
750 and 850 nm. A synchronization pulse was provided out of the laser head to allow for
precise control of the ICCD gate delay.
The output of the laser passed through a solenoid-activated safety shutter before
entering the Source Fiber Multiplexer. The safety shutter was only open when the power
was on and the top and front access doors were closed. There was also a switch on the
front panel of the Multiplexer that allowed the shutter to be closed, even if all safety
interlocks were engaged. The top door allowed for access to the galvanometers and
Fiber Source Multiplexer
Ti:Sapphire Laser Head
Portable Optical Table
Quick-Connect Fiber Array Access Door Intensity Adjustment
Safety Shutter
Figure 4.3 The laser source Assembly is shown in rendered view. The Mai-Tai Spectra Physics Ti:Sapphire laser head is shown on the right and the custom designed Source Fiber Multiplexer on the left. A safety shutter is shown as an interface between the two. Both devices were solidly mounted on top of an optical table.
T. J. Brukilacchio, Ph.D. Thesis 2003
75
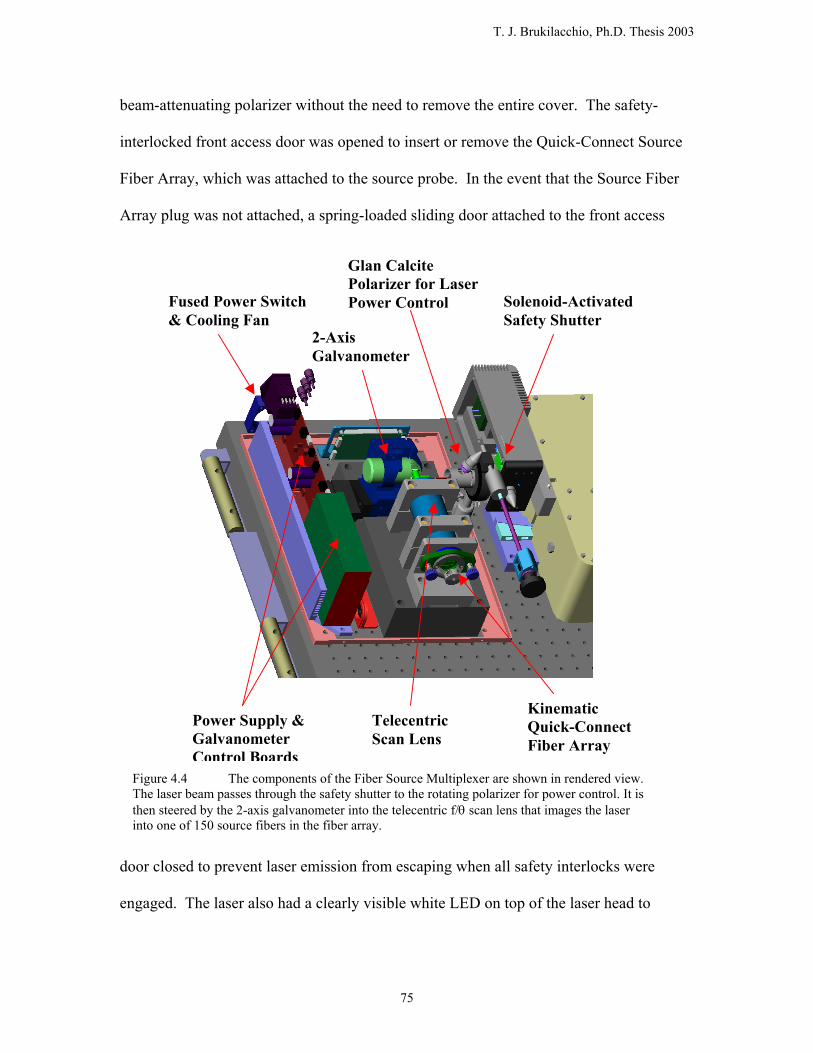
beam-attenuating polarizer without the need to remove the entire cover. The safety-
interlocked front access door was opened to insert or remove the Quick-Connect Source
Fiber Array, which was attached to the source probe. In the event that the Source Fiber
Array plug was not attached, a spring-loaded sliding door attached to the front access
door closed to prevent laser emission from escaping when all safety interlocks were
engaged. The laser also had a clearly visible white LED on top of the laser head to
2-Axis Galvanometer
Solenoid-Activated Safety Shutter
Glan Calcite Polarizer for Laser Power Control
Telecentric Scan Lens
Kinematic Quick-Connect Fiber Array
Power Supply & Galvanometer Control Boards
Fused Power Switch & Cooling Fan
Figure 4.4 The components of the Fiber Source Multiplexer are shown in rendered view. The laser beam passes through the safety shutter to the rotating polarizer for power control. It is then steered by the 2-axis galvanometer into the telecentric f/θ scan lens that images the laser into one of 150 source fibers in the fiber array.

T. J. Brukilacchio, Ph.D. Thesis 2003
76
indicate emission from the laser. Additionally, the laser had a shutter built inside the
laser head, which could be controlled by the user interface software routine.
A 10-turn knob was provided on the front panel of the Multiplexer to provide a 10x
attenuation of the laser output, if desired. The knob caused a Glan Laser cube polarizer
to rotate with respect to the linearly polarized output of the laser. The laser output was
attenuated according to Malus’s law, which decreases as the square of the cosine of the
angle between the linear polarization axis of the laser output and that of the polarizing
cube beamsplitter. The polarizer was attached to a precision rotation stage and had a
beam dump to absorb power deviated by the polarizing beamsplitter as shown in Figure
4.4.
After passing through the polarizer assembly, the laser beam was deflected by a pair
of galvanometers into the telecentric scan lens, which in turn focused the laser beam into
one of 150 source fibers. The entire assembly was mounted on a solid aluminum base,
which was attached to a rigid optical bench as indicated in Figure 4.3. No mirrors were
used in the system other than the galvanometer mirrors to minimize alignment stability
issues. The cover of the Multiplexer was compartmentalized to section off the optics
from the power supply and galvanometer control boards. The power supply compartment
had a cooling fan. The purpose of separating the compartments was to minimize the
exposure of the optics to dust.
A close up of the Source Fiber Array Quick-Connect assembly is shown in Figure
4.5. The 150 fused silica source fibers had a core diameter of 200 µm and were plastic
clad with a fluoropolymer providing a numerical aperture (NA) of 0.39. This numerical
aperture was much higher than required by the very small image space NA of the

T. J. Brukilacchio, Ph.D. Thesis 2003
77
telecentric scan lens. It was chosen over the 0.22 NA all-fused silica fiber due to cost
considerations and insensitivity of the temporal dispersion in transmitting through the 4
meters of source fiber. The very low NA (0.01) of the scan lens rendered the temporal
dispersion within the source fibers to be under 10 psec over a 4-meter length, which was
deemed insignificant. Thus, there was no benefit to using graded index fibers on the
source side. The fibers were individually ferruled and positioned within a 10 x 15 array
Alignment Balls
Fiber Bundle Stain Relief
Quick-Connect Knobs
15 x 10 Array of 200 µm Fused Silica Fibers of 0.39 NA
Alignment Pins
Figure 45 The Source Fiber Array Quick-Connect is shown. A 15 x 10 array of individually ferruled 200 µm diameter core fused silica fibers are held in very precise positional tolerance by kinematic mounting features. The knobs allow the connector to be quickly removed or attached with a positional repeatability within 5 µm.
T. J. Brukilacchio, Ph.D. Thesis 2003
78
on 1.5 mm centers as shown in Figure 4.5. The ferrules were held in the assembly by a
silicone compression pad that held the ferrules tightly in the assembly upon compression
by the three lock-down screws. This allowed the individual fibers to be replaced in the
event of a broken fiber. A C-shaped collar provided strain relief against the black-
jacketed fiber bundle. The three ball bearings indicated in Figure 4.5 interfaced to
kinematic groves in the mating block within the Multiplexer, providing a positional
repeatability to within 5 µm. This eliminated the need to recalibrate the positions of the
fibers each time the source fiber array was removed and re-inserted. The two knurled
knobs allowed the Quick-Connector to be attached or removed within seconds.
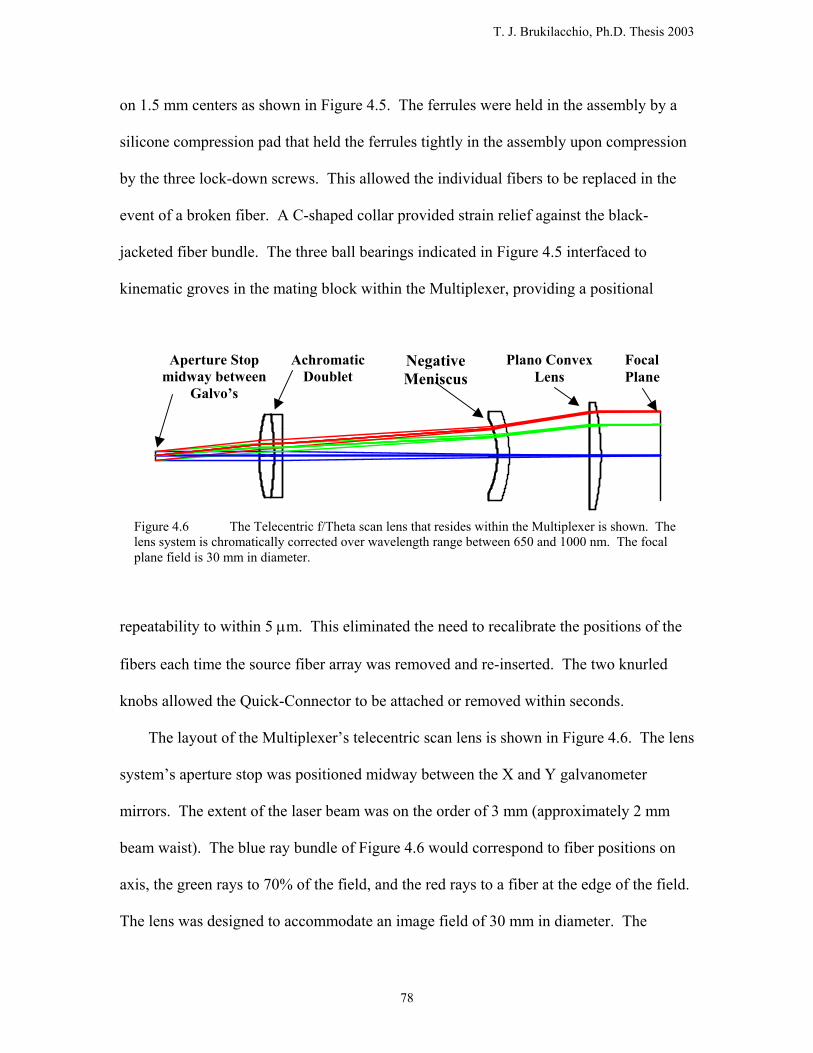
The layout of the Multiplexer’s telecentric scan lens is shown in Figure 4.6. The lens
system’s aperture stop was positioned midway between the X and Y galvanometer
mirrors. The extent of the laser beam was on the order of 3 mm (approximately 2 mm
beam waist). The blue ray bundle of Figure 4.6 would correspond to fiber positions on
axis, the green rays to 70% of the field, and the red rays to a fiber at the edge of the field.
The lens was designed to accommodate an image field of 30 mm in diameter. The
Achromatic Doublet
Aperture Stop midway between
Galvo’s
Negative Meniscus
Plano Convex Lens
Focal Plane
Figure 4.6 The Telecentric f/Theta scan lens that resides within the Multiplexer is shown. The lens system is chromatically corrected over wavelength range between 650 and 1000 nm. The focal plane field is 30 mm in diameter.

T. J. Brukilacchio, Ph.D. Thesis 2003
79
prescription of the lens system is proprietary to the author’s company, Innovations in
Optics, Inc., and will not be shown. The basic layout and performance data, however, are
shown below. The first lens group consisted of an achromatic doublet that balanced
chromatic aberrations against those induced by the last two elements. High index
materials were used to reduce coma, astigmatism, and spherical aberrations. The lens
was designed to be achromatic over the spectral range from 650 to 1000 nm. It was also
designed to accommodate a 10 mm diameter aperture stop. In the event that smaller
diameter source fibers were desired, a three or four to one beam expander could be used
to result in a smaller diffraction limited image. The third element consisted of a negative
meniscus lens, which worked in concert with the last element, a plano-convex lens, and
resulted in telecentricity in the image space. The telecentric condition was necessary to
assure that the central ray of each fiber input was aligned to the fiber axis. This assured
Figure 4.7 The Multiplexer scan lens spot diagram is shown for 3 field positions. The diffraction-limited Airy disk diameter is shown as 84.7 µm, indicating that the system is diffraction-limited for all field positions and all wavelengths.

T. J. Brukilacchio, Ph.D. Thesis 2003
80
that the propagation through all fibers was as similar as possible. Strictly speaking, this
was not necessary due to the t0 fitting, but it is a good general practice.
It is clear from Figure 4.6, that the path length differences between the central and
edge fiber positions caused a relative temporal shift on the order of a few psec, but again
this is negligible and below the resolution of the system.
Figure 4.7 shows a spot diagram of the scan lens system for wavelengths ranging
from 650 to 980 nm. The diffraction-limited Airy disk diameter is shown as a reference
and had a magnitude on the order of 85 µm. A small degree of change in magnification
with field, a parameter referred to as coma, is observed versus wavelength. This is also
evident in the transverse ray fan plot of Figure 4.8 in the saggital (Y) plane for the two
off-axis field points (10 and 15 mm). The geometric aberrations of the scan lens were
small relative to the diameter of the Airy disk, thus this system would be referred to as a
Figure 4.8 The transverse ray aberrations are shown for the Multiplexer scan lens for 3 field positions.
T. J. Brukilacchio, Ph.D. Thesis 2003
81
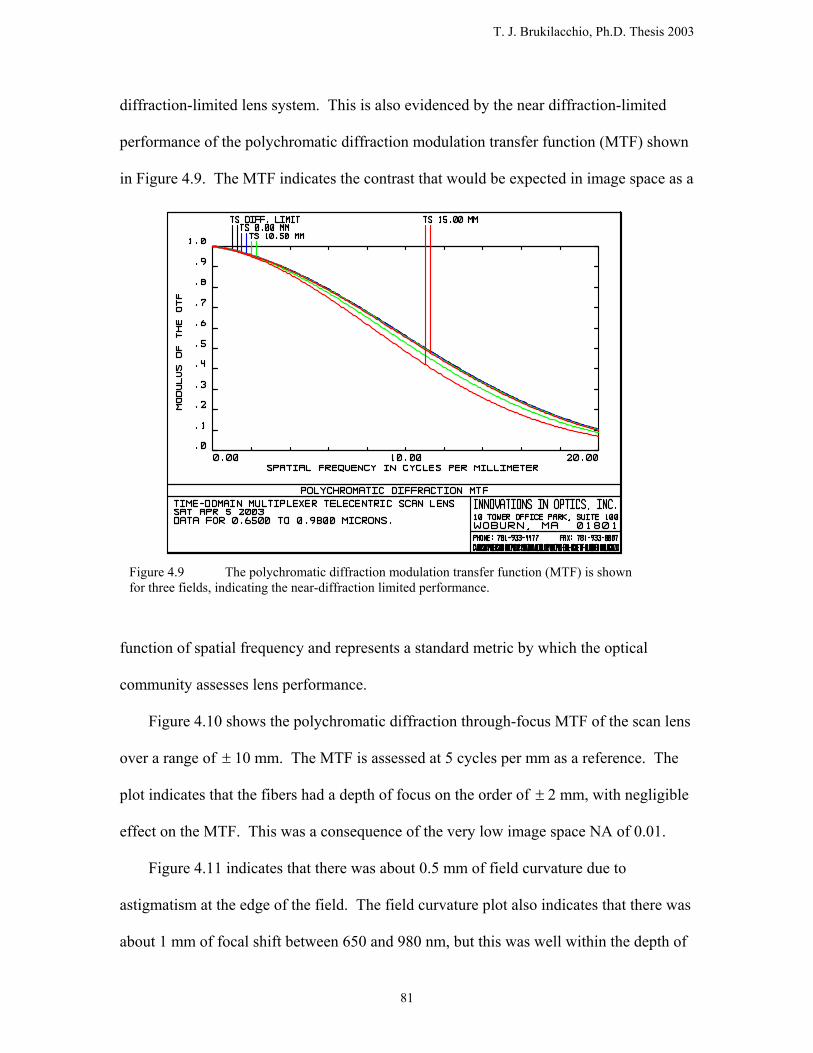
diffraction-limited lens system. This is also evidenced by the near diffraction-limited
performance of the polychromatic diffraction modulation transfer function (MTF) shown
in Figure 4.9. The MTF indicates the contrast that would be expected in image space as a
function of spatial frequency and represents a standard metric by which the optical
community assesses lens performance.
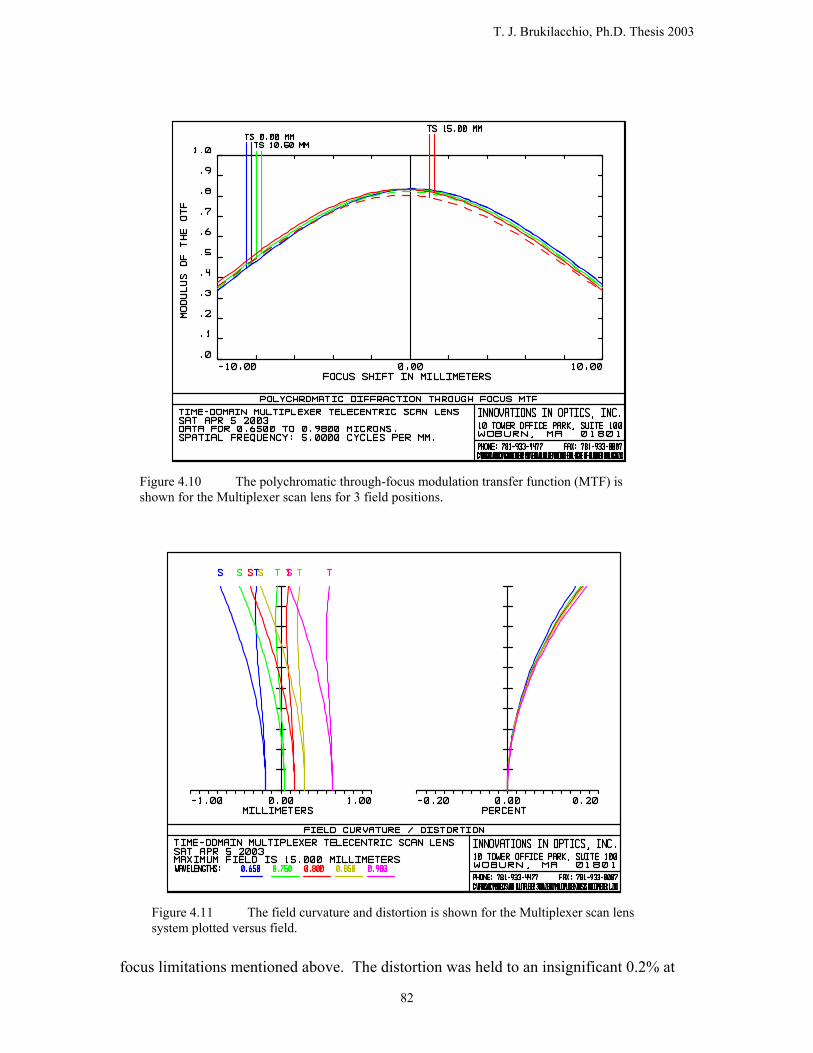
Figure 4.10 shows the polychromatic diffraction through-focus MTF of the scan lens
over a range of ± 10 mm. The MTF is assessed at 5 cycles per mm as a reference. The
plot indicates that the fibers had a depth of focus on the order of ± 2 mm, with negligible
effect on the MTF. This was a consequence of the very low image space NA of 0.01.
Figure 4.11 indicates that there was about 0.5 mm of field curvature due to
astigmatism at the edge of the field. The field curvature plot also indicates that there was
about 1 mm of focal shift between 650 and 980 nm, but this was well within the depth of
Figure 4.9 The polychromatic diffraction modulation transfer function (MTF) is shown for three fields, indicating the near-diffraction limited performance.
T. J. Brukilacchio, Ph.D. Thesis 2003
82
focus limitations mentioned above. The distortion was held to an insignificant 0.2% at
Figure 4.10 The polychromatic through-focus modulation transfer function (MTF) is shown for the Multiplexer scan lens for 3 field positions.
Figure 4.11 The field curvature and distortion is shown for the Multiplexer scan lens system plotted versus field.

T. J. Brukilacchio, Ph.D. Thesis 2003
83
the edge of the field. Absence of distortion in the image plane of the scan lens was not a
strict requirement, as the galvanometer could be mapped to any position, but it did
simplify the fiber position locating routines and assured that the acceleration profile from
fiber to fiber was constant over the full field. In general, it is a good practice to minimize
any difference the lens system may have on the launch conditions from fiber to fiber.
Any of the lens system aberrations would become more important for the case of a larger
aperture stop that would be used for smaller source fiber diameters. Given the high
average power available from the laser, smaller source fibers could be used by rotating
the polarizer to make up for coupling losses into smaller fibers, as limited by diffraction.
Substantial reflections off the fiber ferrules, however, may produce unacceptably high
cross talk between fibers due to retro-reflections off the lens elements.
Figure 4.12 shows an actual scan of the laser over one fiber near the center of the
array and one near the edge of the array. The fiber diameter was 200 µm. The curves
Figure 4.12 The normalized intensity is shown for the image of the laser scanned over a central and edge source fiber at a wavelength of 750 nm within the Multiplexer. The source fiber had a core diameter of 200 microns.
0.000.100.200.300.400.500.600.700.800.901.00
0 50 100 150 200 250 300 350 400Scan Position [µm]
Nor
mal
ized
Inte
nsity
Central Fiber Edge Fiber
Fiber Width200 µm

T. J. Brukilacchio, Ph.D. Thesis 2003
84
represent the convolution of the fiber aperture with the image of the laser. The curves
fall off within about 80 µm of the edge of the fiber diameter on both sides indicating the
diffraction-limited laser spot was consistent with that shown in the spot diagram of
Figure 4.7. The increased width at the edge fiber resulted from the slightly larger
aberrations at the edge of the field.
4.3 Time-Domain Detection Subsystem
The primary components of the Time-Domain Detection Subsystem are indicated in
Figure 4.13. The fiber bundle of 313, 400 µm diameter core, plastic-clad fused silica
fibers of 0.39 NA, is shown interfaced to the left side of the objective lens. The custom,
Objective Lens Image Intensifier and Relay Lens
TE Cooled CCD Camera
Delay Unit Intensifier Control
Figure 4.13 The gated, image-intensified CCD (ICCD) system is shown. The PicoStar HR housing contains the time-gated photocathode, microchannel plate (MCP) intensifier, and a 2:1 relay lens to image the intensifier output on the CCD. The custom 1:1 fiber-array imaging lens is shown mounted to the front of the ICCD. The delay unit and intensifier control are shown on theright.
T. J. Brukilacchio, Ph.D. Thesis 2003
85
unit magnification objective is shown attached to the image intensifier and relay lens box,
which itself, was attached to the thermoelectrically (TE) cooled charged couple device
(CCD) camera. The details of the operation of the image intensifier are covered in
Chapter 5. The ICCD PicoStar HR system was manufactured by LaVision, of
Goettingen, Germany. The array of fibers from the detection probe was imaged with unit
magnification to the photocathode of the image intensifier. The photocathode was time-
gated by application of a positive potential relative to the front face of the intensifier,
effectively turning its response on and off. This gate could be modulated at speeds up to
about 1 GHz with a maximum duty cycle of 50%. The intensifier consisted of a
proximity focused microchannel plate (MCP), which provided electron amplification of
the photoelectrons ejected from the photocathode. The resulting cascade of electrons
excited a phosphor at the proximal end of the MCP. The phosphor signal was then
imaged by a 2:1 relay lens within the LaVision housing, onto the CCD camera. The laser
operated at 80 MHz, which was much faster than the response of the CCD. Thus, the
CCD was simply acting to integrate the signal that was in phase with the particular gate
delay. The gate was delayed with respect to the time of incidence of the laser pulse on
the tissue or tissue phantom. The gate control electronics are shown on the lower right of
Figure 4.13. The controller allowed the selection of the gate voltage, the trigger mode,
trigger offset, and gate width. The gate was adjustable in width between about 200 and
1000 psec, although it was found to be unstable for gate widths under 600 psec. Thus, all
the work in this dissertation was done at a gate width of 600 psec. Also shown in the top
right of Figure 4.13 is the gate delay controller, which could be adjusted by the computer.
The time required to switch the delay was on the order of 500 msec.
T. J. Brukilacchio, Ph.D. Thesis 2003
86
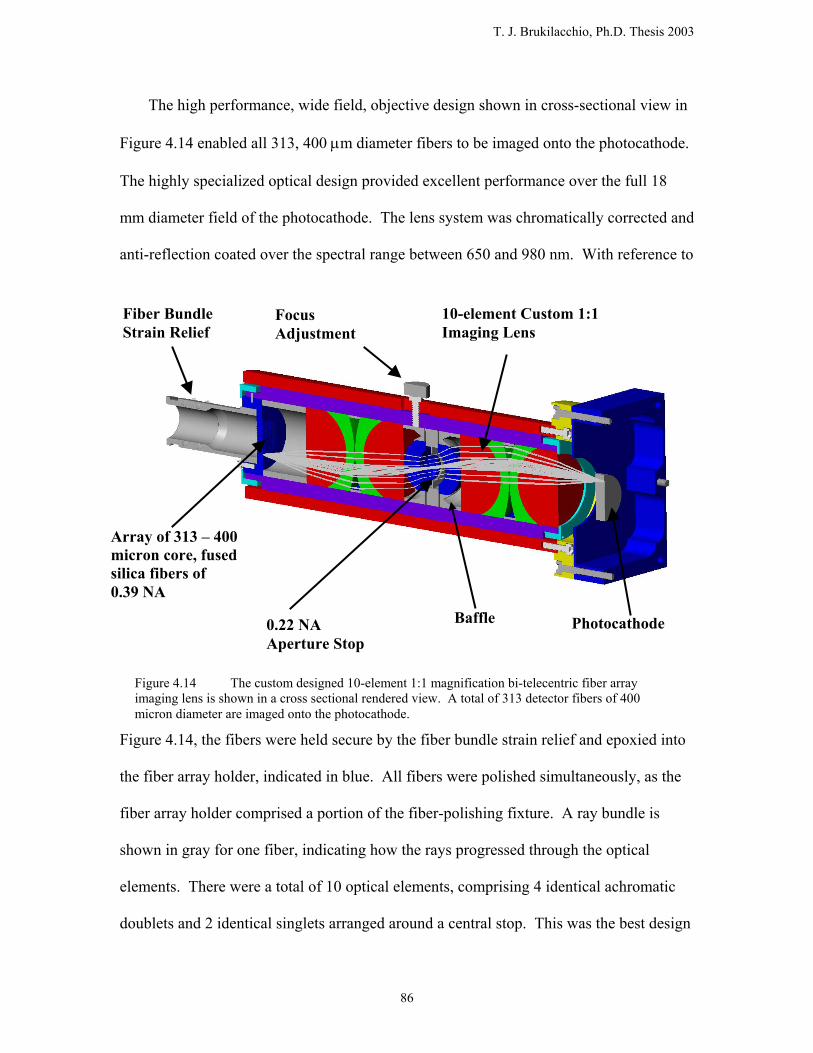
The high performance, wide field, objective design shown in cross-sectional view in
Figure 4.14 enabled all 313, 400 µm diameter fibers to be imaged onto the photocathode.
The highly specialized optical design provided excellent performance over the full 18
mm diameter field of the photocathode. The lens system was chromatically corrected and
anti-reflection coated over the spectral range between 650 and 980 nm. With reference to
Figure 4.14, the fibers were held secure by the fiber bundle strain relief and epoxied into
the fiber array holder, indicated in blue. All fibers were polished simultaneously, as the
fiber array holder comprised a portion of the fiber-polishing fixture. A ray bundle is
shown in gray for one fiber, indicating how the rays progressed through the optical
elements. There were a total of 10 optical elements, comprising 4 identical achromatic
doublets and 2 identical singlets arranged around a central stop. This was the best design
Fiber Bundle Strain Relief
Focus Adjustment
10-element Custom 1:1 Imaging Lens
Array of 313 – 400 micron core, fused silica fibers of 0.39 NA
Photocathode 0.22 NA Aperture Stop
Baffle
Figure 4.14 The custom designed 10-element 1:1 magnification bi-telecentric fiber array imaging lens is shown in a cross sectional rendered view. A total of 313 detector fibers of 400 micron diameter are imaged onto the photocathode.
T. J. Brukilacchio, Ph.D. Thesis 2003
87
approach, as the symmetry about the centrally located stop caused many of the on-axis
aberrations to cancel [1,2]. It would have been simpler to allow all the lenses to optimize
to unique radii and thicknesses, but following good design practice, they were forced to
be identical to minimize production costs.
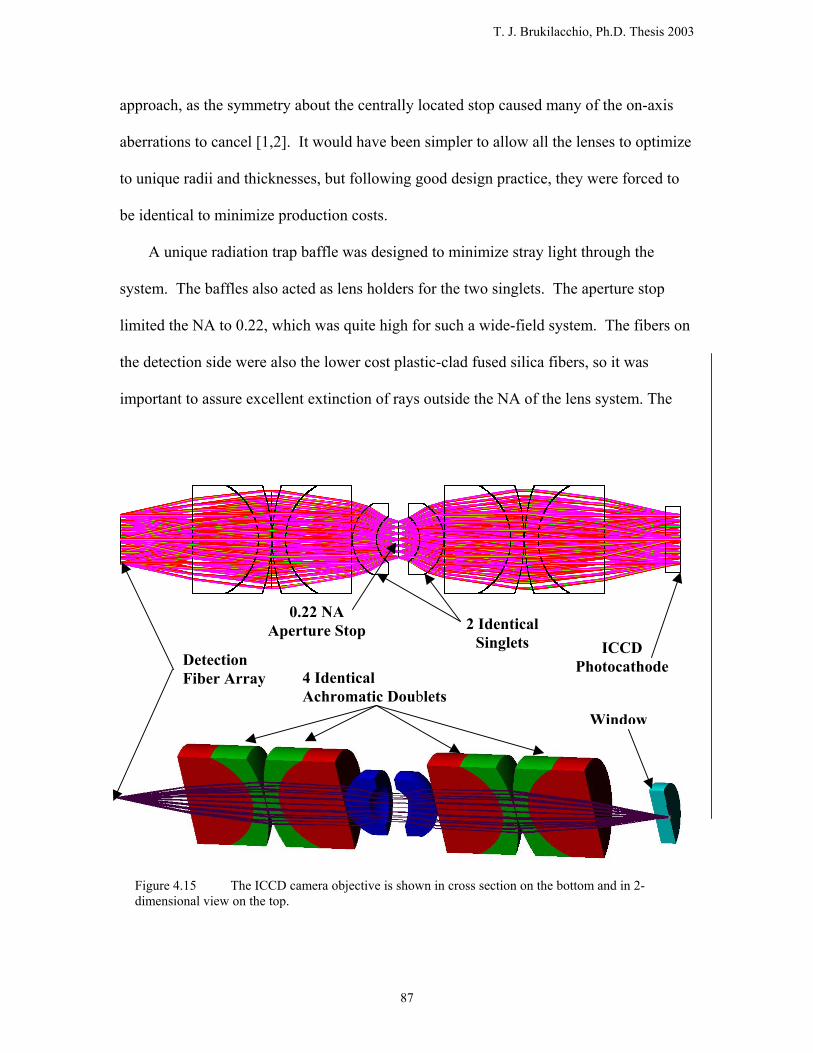
A unique radiation trap baffle was designed to minimize stray light through the
system. The baffles also acted as lens holders for the two singlets. The aperture stop
limited the NA to 0.22, which was quite high for such a wide-field system. The fibers on
the detection side were also the lower cost plastic-clad fused silica fibers, so it was
important to assure excellent extinction of rays outside the NA of the lens system. The
Figure 4.15 The ICCD camera objective is shown in cross section on the bottom and in 2-dimensional view on the top.
Detection Fiber Array
0.22 NA Aperture Stop
Window
ICCD Photocathode
2 Identical Singlets
4 Identical Achromatic Doublets
T. J. Brukilacchio, Ph.D. Thesis 2003
88
ratio percent of light passed by the system to that entering through the fibers was 30%.
The excellent cross talk performance of the system discussed in the Chapter 6 is a
testament to the efficacy of the baffle design.
The objective lens was housed in a tube that provided a means of focus adjustment.
The lens was attached to the ICCD housing by four bolts. All hardware components were
black anodized to cut down on stray light.
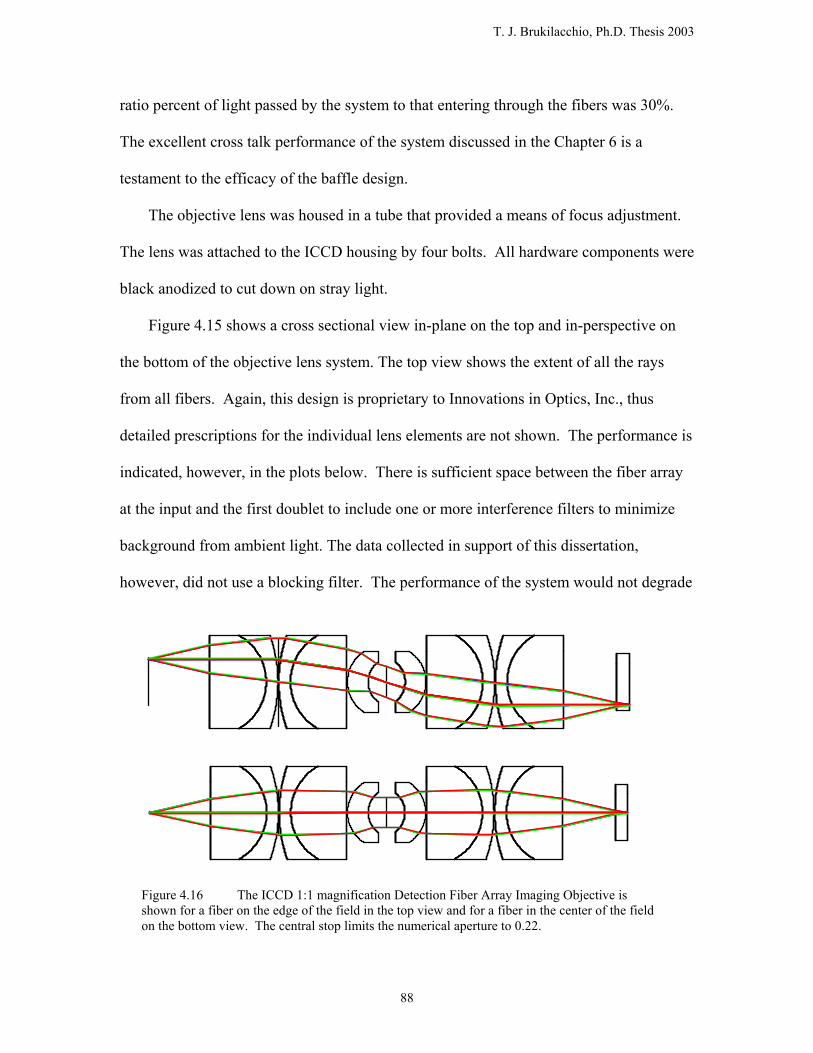
Figure 4.15 shows a cross sectional view in-plane on the top and in-perspective on
the bottom of the objective lens system. The top view shows the extent of all the rays
from all fibers. Again, this design is proprietary to Innovations in Optics, Inc., thus
detailed prescriptions for the individual lens elements are not shown. The performance is
indicated, however, in the plots below. There is sufficient space between the fiber array
at the input and the first doublet to include one or more interference filters to minimize
background from ambient light. The data collected in support of this dissertation,
however, did not use a blocking filter. The performance of the system would not degrade
Figure 4.16 The ICCD 1:1 magnification Detection Fiber Array Imaging Objective is shown for a fiber on the edge of the field in the top view and for a fiber in the center of the field on the bottom view. The central stop limits the numerical aperture to 0.22.

T. J. Brukilacchio, Ph.D. Thesis 2003
89
from inclusion of a filter, in fact, it would improve just slightly, as the addition of a
window near the fiber array would increase the system’s symmetry due to the window in
front of the photocathode.
Figure 4.16 shows a comparison of ray bundles for a fiber at the edge of the field
(top view) and a fiber at the center (lower view). The lens system was telecentric in both
object and image space. This helped minimize distortion that would have resulted for
small defocuses for such a fast lens system. This was important because otherwise, the
pixel map corresponding to detector fiber positions in the CCD image file would change
as a function of focus.
Figures 4.17 through 4.23 indicate the performance of the camera objective. Figure
4.17 shows spot diagrams for wavelengths ranging between 650 and 980 nm for three
field positions; on axis, 5 mm, and 8.6 mm, representing the edge of the field. The circle
Figure 4.17 The spot diagrams for the ICCD objective lens are shown referenced to a 400 µm diameter fiber for three field positions and wavelengths from 650 to 980 nm.

T. J. Brukilacchio, Ph.D. Thesis 2003
90
is a reference indicating the 400 µm size of the detection fiber relative to the geometric
spot size. Clearly, the lens system performs well for this size fiber over the full spectral
band and full field.
Figure 4.18 shows the transverse ray fan plot of the camera objective lens system.
The primary on-axis aberrations were spherical aberration, indicated by the characteristic
S-shaped curve and chromatic focal shift, indicated by the change in slope with
wavelength. Slight amounts of astigmatism and coma are evidenced for the off-axis
fields. The saggital plane at the edge of the field also shows some fifth-order spherical
aberration.
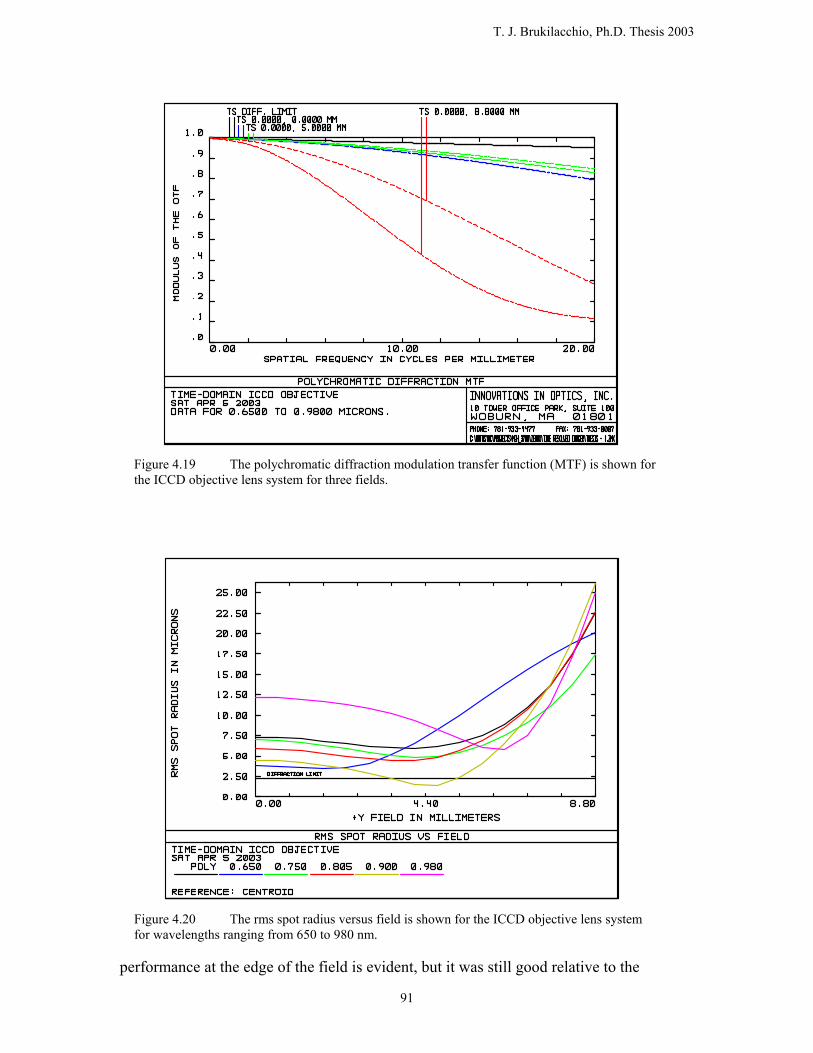
Figure 4.19 shows the polychromatic diffraction MTF out to a spatial frequency of
20 cycles per mm, which would correspond to 25 µm between lines. The slight drop in
Figure 4.18 The transverse ray fan plot for the ICCD objective lens system is shown for three fields and wavelengths ranging from 650 to 980 nm.
T. J. Brukilacchio, Ph.D. Thesis 2003
91
performance at the edge of the field is evident, but it was still good relative to the
Figure 4.19 The polychromatic diffraction modulation transfer function (MTF) is shown for the ICCD objective lens system for three fields.
Figure 4.20 The rms spot radius versus field is shown for the ICCD objective lens system for wavelengths ranging from 650 to 980 nm.

T. J. Brukilacchio, Ph.D. Thesis 2003
92
requirements of imaging a 400 µm diameter fiber with minimal blur.
Figure 4.20 shows the rms spot size in µm versus field. In general this lens system
was not diffraction limited, as was the scan lens, but it did not need to be. Designing this
lens for diffraction-limited performance over the spectral range, large field, and large
NA, would not have been feasible. Any lens design represents many trade offs and it is
important to keep perspective on the critical requirements.
The lens system was very sensitive to focus due to the large NA as indicated in
Figure 4.21 showing the polychromatic diffraction through-focus MTF. Focus had to be
held to within a few hundred µm to maintain good performance. The shift in focus
between the center field points and the edge of the field is also shown. Thus, the MTF of
Figure 4.19 for the edge of the field could have been improved at the expense of
Figure 4.21 The polychromatic diffraction through-focus modulation transfer function (MTF) is shown to indicate focus sensitivity for the 0.22 NA ICCD camera objective lens system.

T. J. Brukilacchio, Ph.D. Thesis 2003
93
performance at the center of the field. In practice, the instrument operator would adjust
the lens by eye. The edge of the field only applies to a handful of positions, so it is likely
that the focus would be adjusted to be optimal closer to the center of the field. Focus
adjustment was accomplished by slight movements of a lock-down knurled screw on top
of the lens barrel. It may be useful for future versions of this system to have a more
precise way to adjust focus, such as a rotating focus wheel that allows for greater focus
resolution and control.
Figure 4.22 shows plots of field curvature and distortion versus field for the camera
objective. The field curvature was the primary cause of decreased performance near the
edge of the field. The distortion was held to well under 0.10% at the edge of the field.
This was deliberate, as if the design had not been constrained to minimize distortion, it
could have been as much as 10 to 15 % at the edge of the field. Many systems do have
Figure 4.22 The field curvature and distortion for the ICCD objective lens system is shown for wavelengths ranging from 650 to 980 nm.
T. J. Brukilacchio, Ph.D. Thesis 2003
94
significant distortion, such as endoscopes, or wide field camera lenses. For this system,
however, low distortion meant that all fibers would map onto an equal number of pixels
and the distance from center to center of the detection fibers on the image file would be
uniform. This simplified calculations considerably.
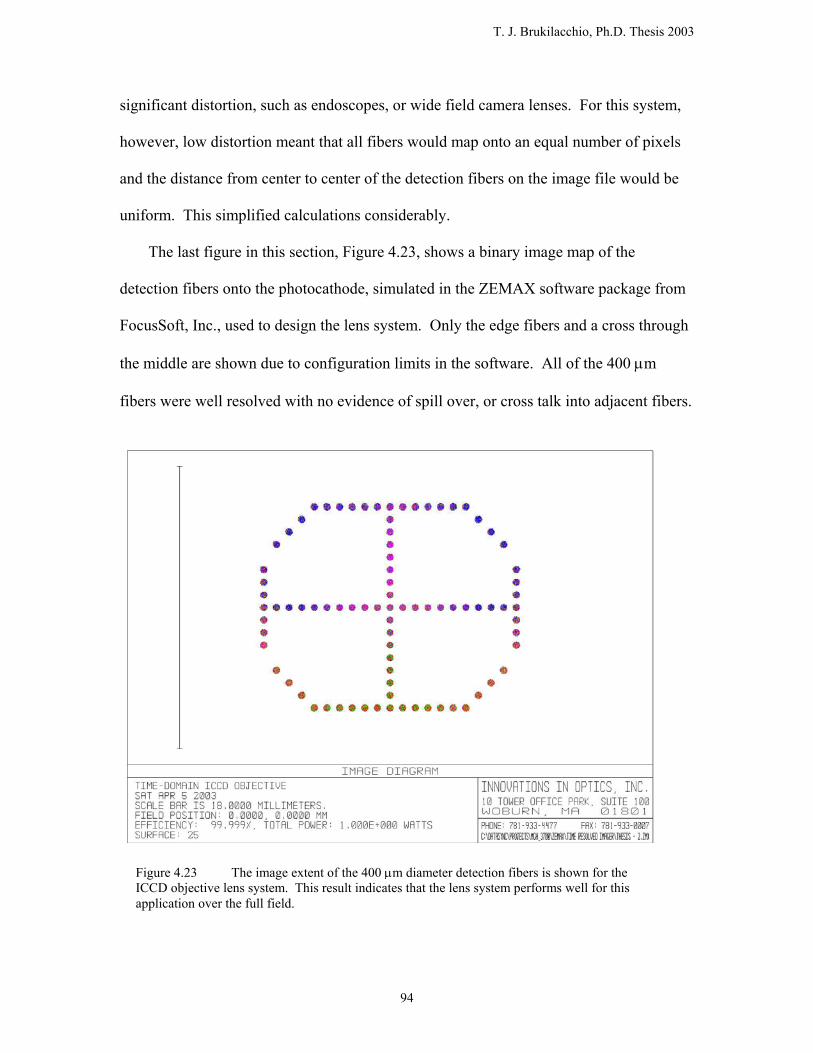
The last figure in this section, Figure 4.23, shows a binary image map of the
detection fibers onto the photocathode, simulated in the ZEMAX software package from
FocusSoft, Inc., used to design the lens system. Only the edge fibers and a cross through
the middle are shown due to configuration limits in the software. All of the 400 µm
fibers were well resolved with no evidence of spill over, or cross talk into adjacent fibers.
Figure 4.23 The image extent of the 400 µm diameter detection fibers is shown for the ICCD objective lens system. This result indicates that the lens system performs well for this application over the full field.
T. J. Brukilacchio, Ph.D. Thesis 2003
95
Only the four fibers at the top and bottom corners showed any sign of distortion. This
was due to the very nonlinear behavior of distortion at the edge of the field.
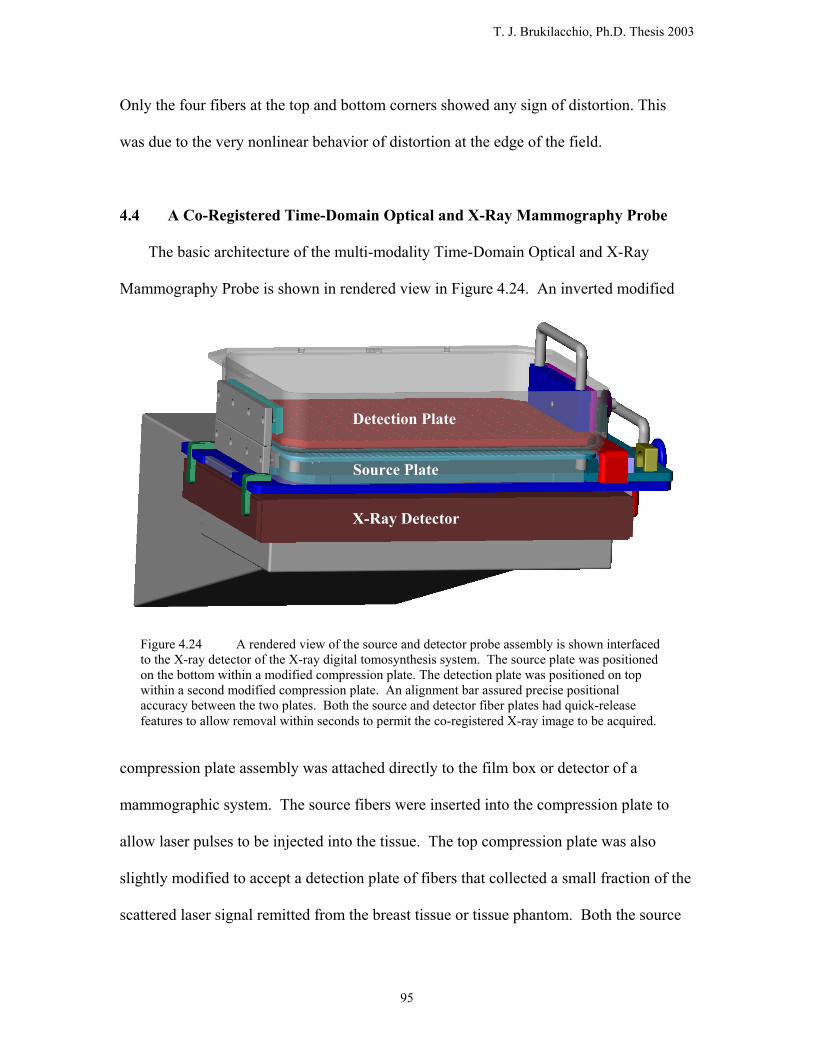
4.4 A Co-Registered Time-Domain Optical and X-Ray Mammography Probe
The basic architecture of the multi-modality Time-Domain Optical and X-Ray
Mammography Probe is shown in rendered view in Figure 4.24. An inverted modified
compression plate assembly was attached directly to the film box or detector of a
mammographic system. The source fibers were inserted into the compression plate to
allow laser pulses to be injected into the tissue. The top compression plate was also
slightly modified to accept a detection plate of fibers that collected a small fraction of the
scattered laser signal remitted from the breast tissue or tissue phantom. Both the source
X-Ray Detector
Detection Plate
Source Plate
Figure 4.24 A rendered view of the source and detector probe assembly is shown interfacedto the X-ray detector of the X-ray digital tomosynthesis system. The source plate was positioned on the bottom within a modified compression plate. The detection plate was positioned on top within a second modified compression plate. An alignment bar assured precise positional accuracy between the two plates. Both the source and detector fiber plates had quick-release features to allow removal within seconds to permit the co-registered X-ray image to be acquired.

T. J. Brukilacchio, Ph.D. Thesis 2003
96
and detection fiber plates were designed to be removed by quick release features to allow
for acquisition of a co-registered X-ray image within seconds of finishing the collection
of the optical data. The source plate had a knob that was turned by 180 degrees to allow
removal. The purpose of the rotating knob was to allow the fibers to slide by the
compression plate without scratching its surface. When the source plate was fully
inserted into the modified compression plate, the rotation of the knob caused the whole
source plate to move up against the inside of the compression plate to minimize coupling
from one source position to another. The design and fabrication method for applying a
black mask to the surfaces of both the source and detector compression plates was
investigated. It was not done, however, due to budget constraints. The purpose of the
mask, that would have been comprised of a black layer applied to both sides of the
Detection Fiber Probe Positioned within Modified Upper Compression Plate
Source Fiber Probe Positioned within Modified Lower Compression Plate
4.25 The fiber optic source and detector probes are shown attached to the Phantom Stand.
T. J. Brukilacchio, Ph.D. Thesis 2003
97
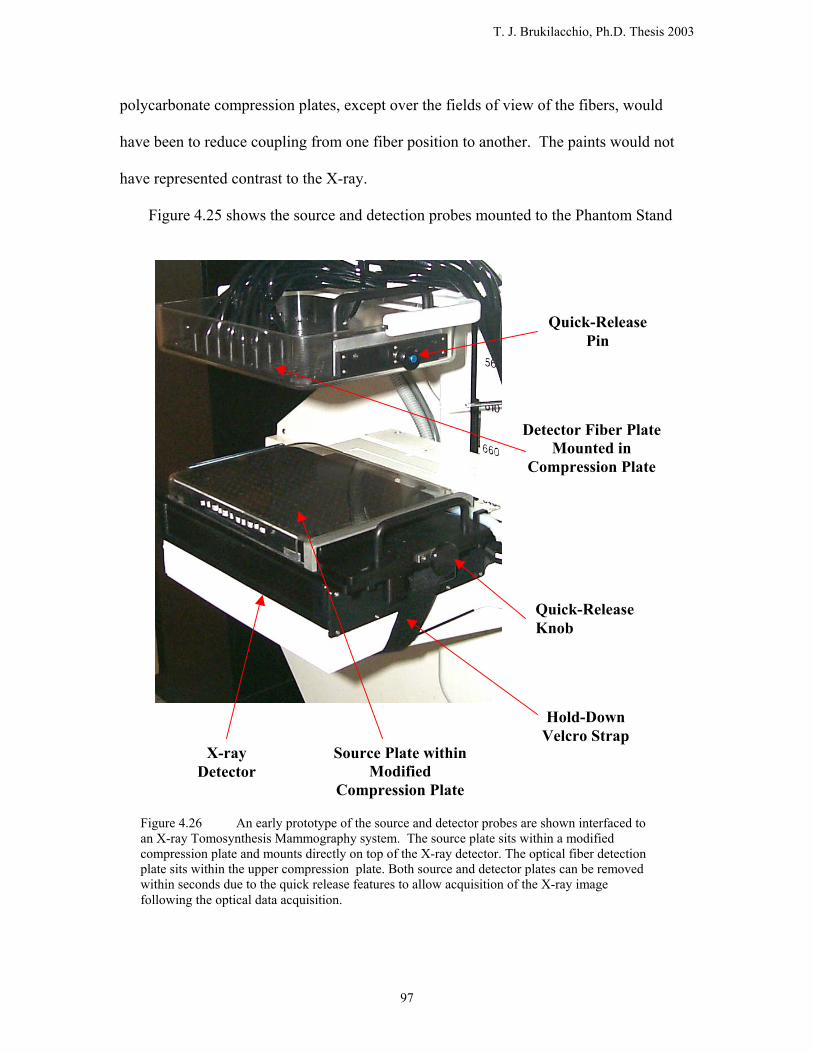
polycarbonate compression plates, except over the fields of view of the fibers, would
have been to reduce coupling from one fiber position to another. The paints would not
have represented contrast to the X-ray.
Figure 4.25 shows the source and detection probes mounted to the Phantom Stand
Quick-Release Pin
Quick-Release Knob
X-ray Detector
Source Plate within Modified
Compression Plate
Hold-Down Velcro Strap
Detector Fiber Plate Mounted in
Compression Plate
Figure 4.26 An early prototype of the source and detector probes are shown interfaced to an X-ray Tomosynthesis Mammography system. The source plate sits within a modified compression plate and mounts directly on top of the X-ray detector. The optical fiber detection plate sits within the upper compression plate. Both source and detector plates can be removed within seconds due to the quick release features to allow acquisition of the X-ray image following the optical data acquisition.

T. J. Brukilacchio, Ph.D. Thesis 2003
98
that is described in the next section. All exposed sides of both the source and detection
probes were encased in metal to prevent damage to the fibers. All fiber bundles were
strain relieved to prevent damage to the fibers.
Figure 4.26 shows an early prototype probe mounted to an X-ray digital
tomosythesis system at Harvard’s Massachusetts General Hospital, under the direction of
Daniel Kopans, MD. The source probe on the bottom was mounted to the X-ray detector,
and held in position by a Velcro strap. The quick-release knob on the source plate and
the quick-release pin on the detection plate are clearly visible. The general procedure
was first to compress the patient’s breast between the compression plates and acquire an
optical image within a period of about 2 minutes. Following the optical image, the
source and detection plates were removed from their modified compression plates. The
X-ray tomosythesis image was then acquired in co-registration with no movement of the
patient.
A detailed view of the source detection plate is shown in Figure 4.27. The modified
compression plate is shown on the right with the source fiber plate removed and sitting to
the left. The compression plate assembly had two alignment slots to allow the source
plate to be attached in two different directions to facilitate the measurement of medial
lateral oblique (MLO) views, for which the source plate could not be removed in the
direction of the patients shoulder. The source plate had an array of holes on 5 mm
centers to allow source fibers to be positioned in any desired pattern. This probe was
actually a combined time-domain, RF, and CW probe, so it contained a total of several
hundred individual fibers. There were two sets of 150 fibers that could be used for the
time-domain system, one set at a time. The inset in the bottom of Figure 4.26 shows the

T. J. Brukilacchio, Ph.D. Thesis 2003
99
mechanism by which the ferrules were attached to the source plate. The ferrule was
positioned within the desired hole and then a small O-ring was placed over the tip of the
ferrule, locking it in place. The O-rings could be readily removed if desired, to allow
adjustment of fiber positions, or replacement, in the event of a damaged fiber.
O-ring Fiber Ferrule Retainer
Modified Source Compression Plate Alignment
Slots
Bifurcated Source Fiber Bundle Quick-Release
Knob
Velcro Hold-Down Strap
Source Plate with holes on 5 mm
centers
Handle
Figure 4.27 The quick-release source fiber plate and modified compression plate are shown for the Time-Domain Breast Imaging System.

T. J. Brukilacchio, Ph.D. Thesis 2003
100
4.5 Phantom Design
Three phantoms were made to allow for system characterization as described in
Chapters 6 and 7. The phantom mold is shown in Figure 4.28. The dimensions of the
phantoms were 24 cm in length, 18 cm in width, and 6 cm in thickness. Two
homogeneous and one heterogeneous phantom were fabricated. The hollow fused silica
spheres, which comprised the heterogeneities, ranged in diameter from 1.5 to 2.5 cm.
They are shown suspended at various positions by 2 mm diameter ID silicone tubing.
The silicone tubing for each sphere was separate to allow either dependent or
independent flow through the different spheres. The phantoms were made of a two-part
silicone elastomer (R-2615 from Nusil Technology of Carpinteria, CA) with a refractive
Figure 4.28 The 24 x 18 cm by 6 cm thick phantom mold is shown. The mold was used to make both homogeneous and heterogeneous phantoms. The heterogeneities were comprised of hollow fused silica spheres ranging from 1.5 to 2.5 cm in diameter, which were connected to the outside and supported by silicone tubing. A suspension of TiO2 particles and carbon black was used in the silicone matrix to simulate typical background optical properties of breast tissue.
T. J. Brukilacchio, Ph.D. Thesis 2003
101
index nd of 1.41, a pot life of 2 hours, a viscosity of 6000 cP, and a cure time of 2 hours at
65 Celsius. The elastomer was water clear over the full visible spectrum, even for several
cm in thickness. The scattering was accomplished by the addition of TiO2 (stock# 39953
with a 30 nm APS, from Alfa Aesar of Ward Hill, MA, 800-343-0660). The absorption
was accomplished by the addition of carbon black (acetylene, 50% compressed,
stock#39724 from Alfa Aesar). The carbon black extinction was determined by
transmission through a standard 1 cm cuvette when mixed with part B of the silicone.
The desired absorption was then obtained by titration. The TiO2 was first mixed with the
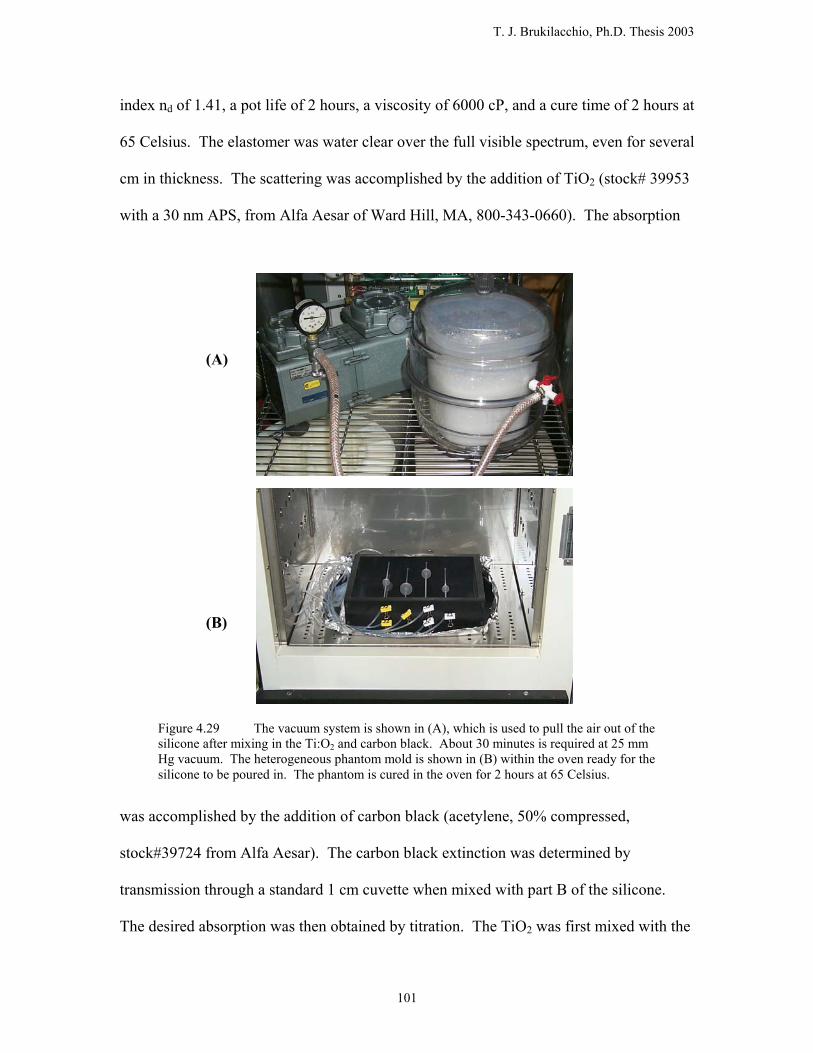
(A)
(B)
Figure 4.29 The vacuum system is shown in (A), which is used to pull the air out of the silicone after mixing in the Ti:O2 and carbon black. About 30 minutes is required at 25 mm Hg vacuum. The heterogeneous phantom mold is shown in (B) within the oven ready for the silicone to be poured in. The phantom is cured in the oven for 2 hours at 65 Celsius.
T. J. Brukilacchio, Ph.D. Thesis 2003
102
balance of part B (100 cP), followed by 30 minutes sonication in an ultrasonic bath. All
ingredients were then combined in a 6-liter plastic tub and mixed thoroughly for 15
minutes. It was very important to pull all the trapped air out of the mix by placing the
entire tub in a large vacuum chamber; otherwise, unintended scattering could have been
caused by scattering from the trapped air bubbles. The mix was held at a vacuum of 25
mm Hg for a period of 45 minutes. The vacuum system is shown in Figure 4.29 (A).
Following air removal, the mix was carefully poured into the mold within the oven, as
shown in Figure 4.29 (B). A large glass plate was placed over the top and weights were
placed over the glass plate. Without the glass plate positioned on the top, the silicone
would have expanded in the middle, resulting in a non-uniform thickness. The phantom
was cured at a temperature of 65 Celsius for a period of 2 hours. The phantom was
allowed to cool slowly in the oven over a period of 30 minutes. The phantom mold had a
silicone mold release sprayed onto the black anodized walls and bottom to facilitate easy
removal.
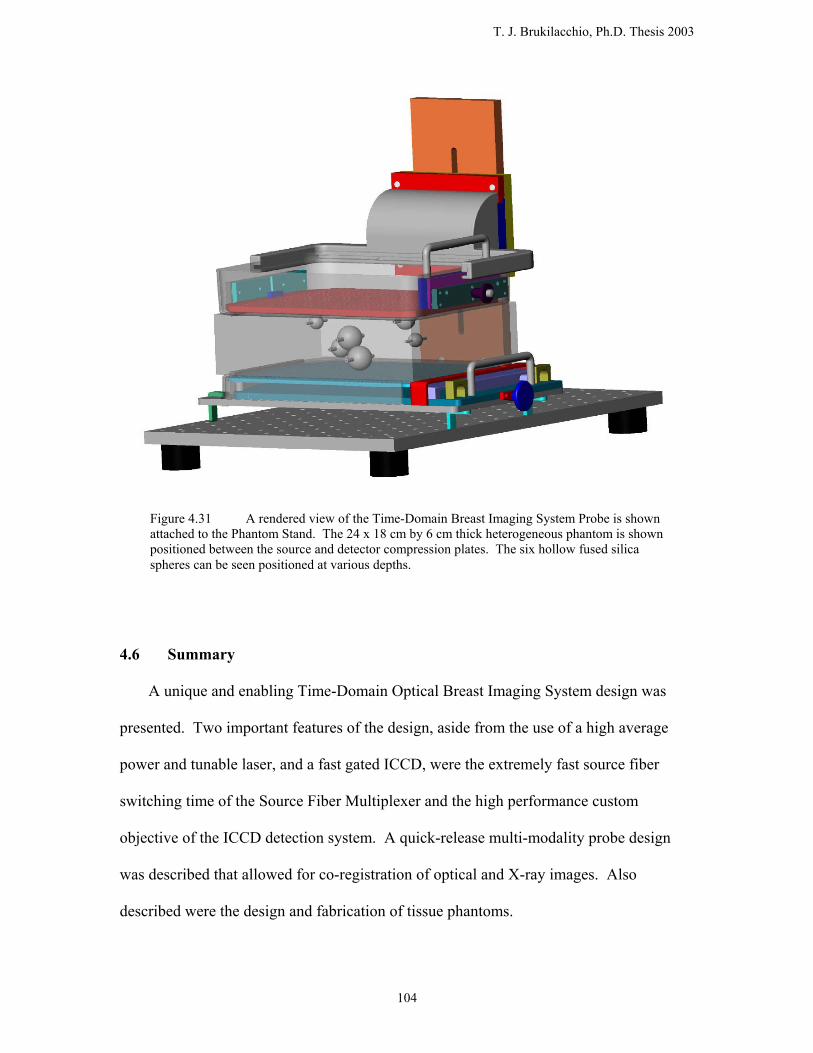
The homogeneous phantom is shown in Figure 4.30 positioned between the source
and detector probes. The silicone tubes connecting the phantom were covered with
black tubing to prevent ambient light from coupling in through the tubes and to form a
complete black periphery around the outside of the phantom. A Phantom Stand was
constructed as shown in Figures 4.30 and 4.31 to allow the compression plate system to
be used in the laboratory environment. The relative positions of the phantom
heterogeneities can be seen in the rendered view of Figure 4.31.

T. J. Brukilacchio, Ph.D. Thesis 2003
103
Detection Fiber Array Plate with Cover
Heterogeneous Phantom sitting on top of Source Plate within Modified
Compression Plate
Compression Plate Support Attached to
Phantom Stand
Figure 4.30. The Time-Domain Probe is shown attached to the Phantom Stand with the heterogeneous phantom positioned between the source and detector compression plates. The tubes out the side of the phantom are for fluid flow to the heterogeneities.
T. J. Brukilacchio, Ph.D. Thesis 2003
104
4.6 Summary
A unique and enabling Time-Domain Optical Breast Imaging System design was
presented. Two important features of the design, aside from the use of a high average
power and tunable laser, and a fast gated ICCD, were the extremely fast source fiber
switching time of the Source Fiber Multiplexer and the high performance custom
objective of the ICCD detection system. A quick-release multi-modality probe design
was described that allowed for co-registration of optical and X-ray images. Also
described were the design and fabrication of tissue phantoms.
Figure 4.31 A rendered view of the Time-Domain Breast Imaging System Probe is shown attached to the Phantom Stand. The 24 x 18 cm by 6 cm thick heterogeneous phantom is shown positioned between the source and detector compression plates. The six hollow fused silica spheres can be seen positioned at various depths.

T. J. Brukilacchio, Ph.D. Thesis 2003
105
Chapter 4 References 1. R. Kingslake, Lens Design Fundamentals, Academic Press, New York, 1978. 2. W. J. Smith, Modern Optical Engineering: The Design of Optical Systems,
Second Edition, McGraw-Hill, Inc., New York, 1990.


![Integrated imaging of [11C]-PBR28 ... - scholar.harvard.edu · Integrated imaging of [11C]-PBR28 PET, ... aA. A. Martinos Center for Biomedical Imaging, Department of Radiology, Massachusetts](https://static.fdocuments.us/doc/165x107/5eb89548cc5b0920be1c729a/integrated-imaging-of-11c-pbr28-integrated-imaging-of-11c-pbr28-pet-.jpg)