Bruce A. Bracken, PhD The University of Memphis R. Steve McCallum, PhD University of Tennessee,...
145
Bruce A. Bracken, PhD The University of Memphis R. Steve McCallum, PhD University of Tennessee, Knoxville Nonverbal Assessment of Intelligence: Introduction to the Universal Nonverbal Intelligence Test (UNIT) right © 1998 by The Riverside Publishing Company. ission is granted to reproduce or download pages for informational or educational use.
-
Upload
nicholas-brown -
Category
Documents
-
view
218 -
download
0
Transcript of Bruce A. Bracken, PhD The University of Memphis R. Steve McCallum, PhD University of Tennessee,...

Bruce A. Bracken, PhDThe University of Memphis
R. Steve McCallum, PhDUniversity of Tennessee, Knoxville
Nonverbal Assessment of Intelligence:
Introduction to the Universal Nonverbal Intelligence Test (UNIT)
Copyright © 1998 by The Riverside Publishing Company. Permission is granted to reproduce or download pages for informational or educational use.

UNIT Authors
Bruce A. Bracken, PhDProfessor of PsychologyDirector, Child and Family StudiesThe University of Memphis
Department of PsychologyCampus Box 52640Memphis, TN 38152-6400(901) 678-2143bbracken @ memphis.edu
Copyright © 1998 by The Riverside Publishing Company. Permission is granted to reproduce or download pages for informational or educational use.
UNIT Authors
R. Steve McCallum, PhDProfessor and ChairPsychoeducational Studies
DepartmentUniversity of Tennessee, Knoxville
434 Claxton AdditionUniversity of TennesseeKnoxville, TN 37996(423) 974-5405mccallum @ utkux.utk.edu
Copyright © 1998 by The Riverside Publishing Company. Permission is granted to reproduce or download pages for informational or educational use.
Part I: Nonverbal Assessment of Intelligence Why nonverbal assessment matters What is nonverbal assessment? How can you evaluate nonverbal tests? For whom is nonverbal assessment appropriate? Why is nonverbal assessment needed? Assessment options when a language-loaded test is inappropriate Current controversies A list of nonverbal intelligence tests
What This Presentation Covers…
Copyright © 1998 by The Riverside Publishing Company. Permission is granted to reproduce or download pages for informational or educational use.

Copyright © 1998 by The Riverside Publishing Company. Permission is granted to reproduce or download pages for informational or educational use.
What This Presentation Covers…
Part II: An Introduction to the UNIT Theoretical Underpinnings Scales and Subtests Administration Features UNIT Standardization and Technical Properties
(Reliability, Validity, and Special Psychometric Properties)
Fairness Clinical Use and Interpretation

Why Nonverbal Assessment Matters… U.S.A. Resident Population (12/1/97)
Number Percent of Total
White 222,104,000 82.6African American 34,143,000 12.7Native American 2,338,000 0.9Asian/Pacific Islanders 10,181,000 3.8Hispanic Origin (any race) 28,802,000 11.1
Source: U.S. Bureau of the Census, Internet Release Date 2/6/98.
Copyright © 1998 by The Riverside Publishing Company. Permission is granted to reproduce or download pages for informational or educational use.
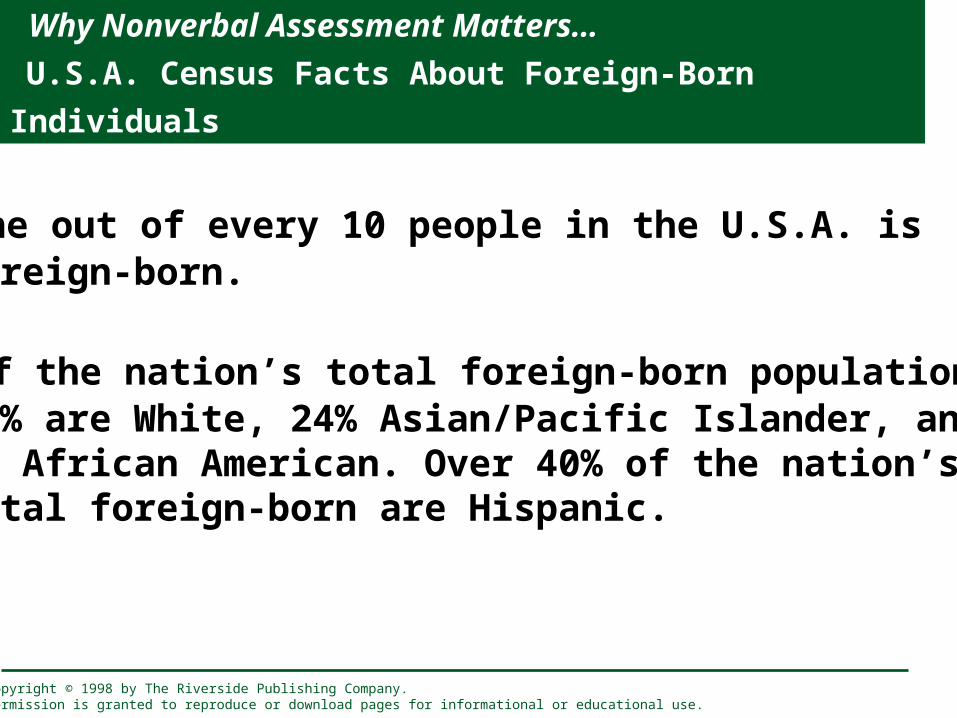
Why Nonverbal Assessment Matters…
U.S.A. Census Facts About Foreign-Born Individuals
• One out of every 10 people in the U.S.A. is foreign-born.
• Of the nation’s total foreign-born population, 68% are White, 24% Asian/Pacific Islander, and 8% African American. Over 40% of the nation’s total foreign-born are Hispanic.
Copyright © 1998 by The Riverside Publishing Company. Permission is granted to reproduce or download pages for informational or educational use.

Why Nonverbal Assessment Matters… U.S.A. Census Growth Trends
• By the middle of the next century, the nation’s Hispanic population is expected to reach 96.5 million (24.5 % of the total population).
• Through 2020, the Asian/Pacific Islander population is expected to grow faster than the nation’s other race groups or the Hispanic-origin population.
Copyright © 1998 by The Riverside Publishing Company. Permission is granted to reproduce or download pages for informational or educational use.

What is Nonverbal Assessment?
Testing that requires no spoken language by the examiner and examinee
Nonverbal refers to the method of administration and the nature of the response, not the abilities being assessed and the strategies used to arrive at solutions
Copyright © 1998 by The Riverside Publishing Company. Permission is granted to reproduce or download pages for informational or educational use.
Criteria for Evaluating Nonverbal Assessments
Verbal instructions should be absent Examinee responses should be nonverbal
(e.g., pointing, constructing, gesturing) Administration procedures should be easily
understood by individuals of varying cultures Multiple aspects of cognition should be assessed Tasks should be balanced between those requiring
symbolic (language-related) and nonsymbolic mediational strategies
Copyright © 1998 by The Riverside Publishing Company. Permission is granted to reproduce or download pages for informational or educational use.
For Whom Is Nonverbal Assessment Appropriate?
Individuals with speech or language impairments Individuals with hearing impairments Individuals from diverse cultural or linguistic
backgrounds Individuals who are verbally uncommunicative
or whose verbalizations are unreliable Any individual for whom verbal performance
may underestimate the optimal level of functioning
Copyright © 1998 by The Riverside Publishing Company. Permission is granted to reproduce or download pages for informational or educational use.

Individuals with speech or language impairments
Articulation Disorders Expressive Language Disorders Mixed Expressive Language Disorders Language-Related Learning Disabilities Post-Traumatic Language Impairment
(i.e., after Traumatic Brain Injury) Language Impairment after Stroke
Copyright © 1998 by The Riverside Publishing Company. Permission is granted to reproduce or download pages for informational or educational use.
Individuals with hearing impairments
Hard of hearing describes individuals with mild to moderate hearing losses who still retain sufficient residual hearing for communication through spoken language
Deaf is the term preferred by deaf people to refer to individuals with severe hearing losses who use sign language as their primary means of communication
Copyright © 1998 by The Riverside Publishing Company. Permission is granted to reproduce or download pages for informational or educational use.
Individuals from diverse cultural or linguistic backgrounds
Limited English Proficiency is a condition which includes individuals who have difficulty reading, writing, or understanding the English language because they
• were born outside of the U.S.A. or have a native language that is not English
• come from an environment where a language other than English is dominant
Copyright © 1998 by The Riverside Publishing Company. Permission is granted to reproduce or download pages for informational or educational use.
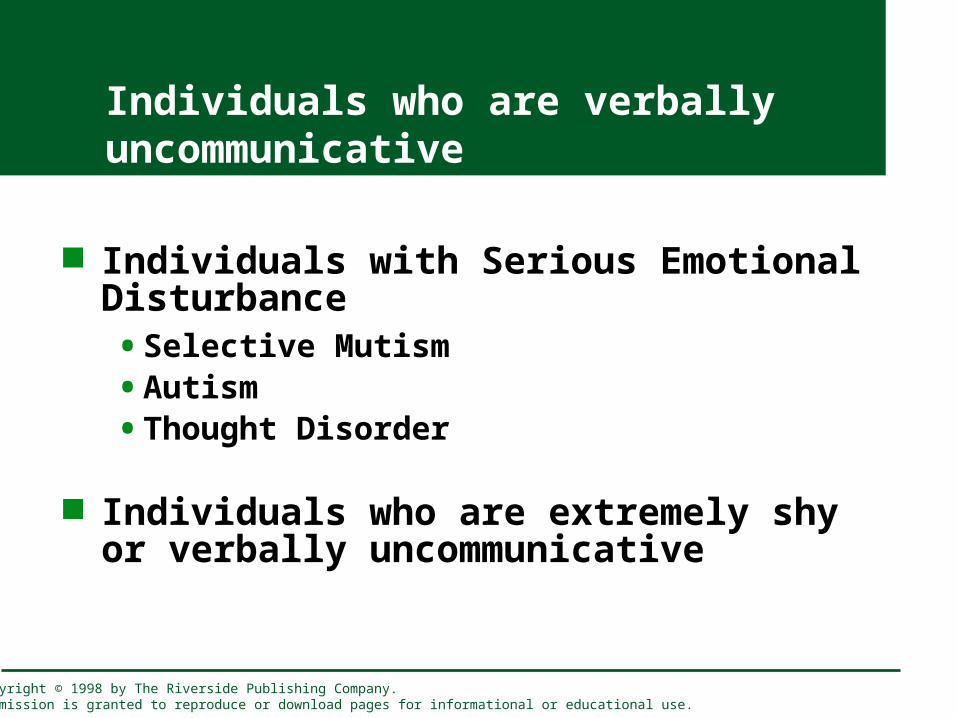
Individuals with Serious Emotional Disturbance• Selective Mutism
• Autism
• Thought Disorder
Individuals who are extremely shy or verbally uncommunicative
Individuals who are verbally uncommunicative
Copyright © 1998 by The Riverside Publishing Company. Permission is granted to reproduce or download pages for informational or educational use.
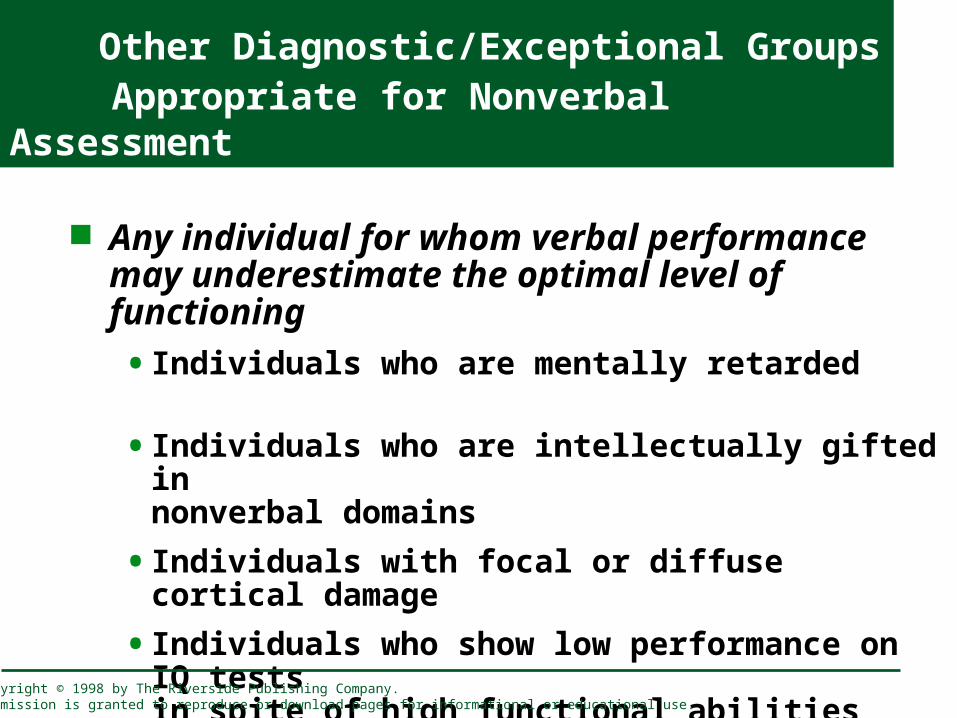
Other Diagnostic/Exceptional Groups Appropriate for Nonverbal Assessment
Any individual for whom verbal performance may underestimate the optimal level of functioning
• Individuals who are mentally retarded
• Individuals who are intellectually gifted in nonverbal domains
• Individuals with focal or diffuse cortical damage
• Individuals who show low performance on IQ tests in spite of high functional abilities
Copyright © 1998 by The Riverside Publishing Company. Permission is granted to reproduce or download pages for informational or educational use.
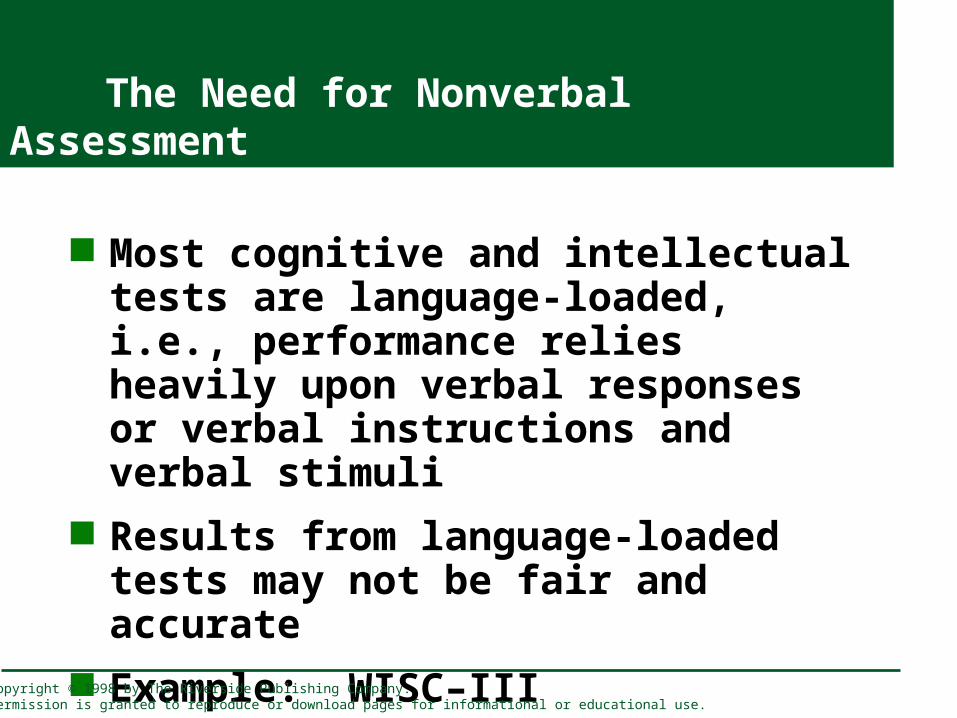
The Need for Nonverbal Assessment
Most cognitive and intellectual tests are language-loaded, i.e., performance relies heavily upon verbal responses or verbal instructions and verbal stimuli
Results from language-loaded tests may not be fair and accurate
Example: WISC–III
Copyright © 1998 by The Riverside Publishing Company. Permission is granted to reproduce or download pages for informational or educational use.
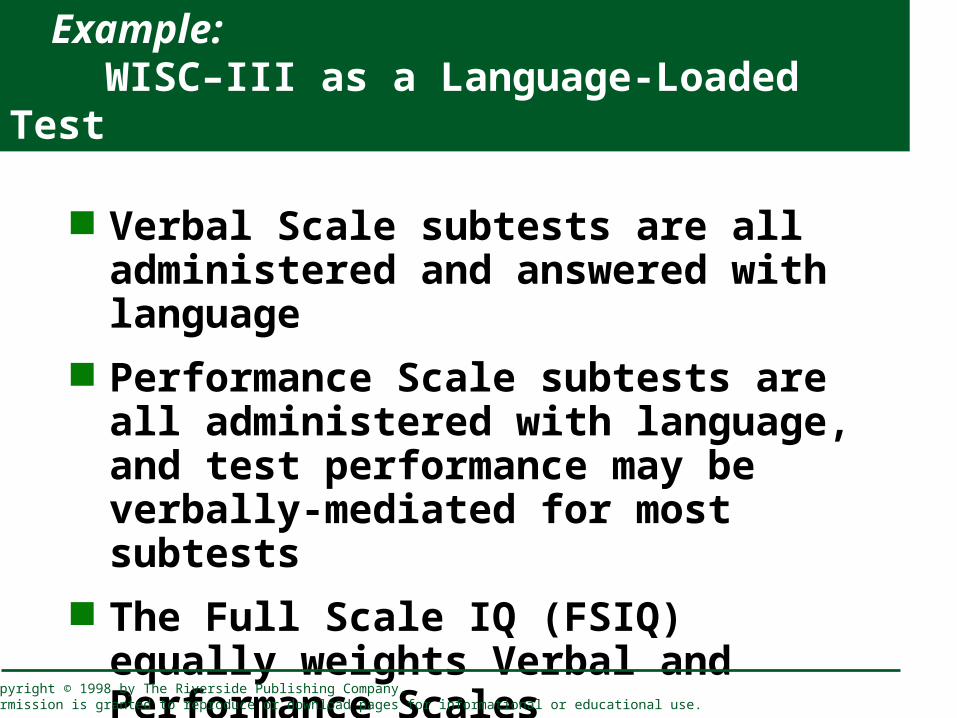
Example: WISC–III as a Language-Loaded Test
Verbal Scale subtests are all administered and answered with language
Performance Scale subtests are all administered with language, and test performance may be verbally-mediated for most subtests
The Full Scale IQ (FSIQ) equally weights Verbal and Performance Scales
Copyright © 1998 by The Riverside Publishing Company. Permission is granted to reproduce or download pages for informational or educational use.
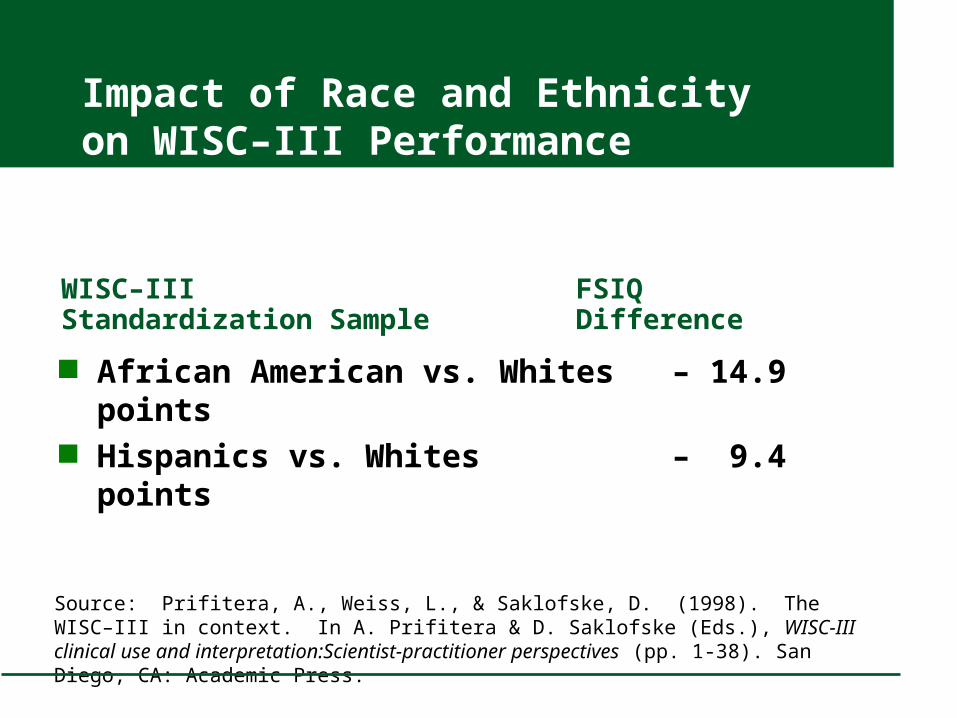
Impact of Race and Ethnicity on WISC–III Performance
WISC–III FSIQStandardization Sample Difference
African American vs. Whites – 14.9 points Hispanics vs. Whites – 9.4 points
Source: Prifitera, A., Weiss, L., & Saklofske, D. (1998). The WISC–III in context. In A. Prifitera & D. Saklofske (Eds.), WISC-III clinical use and interpretation:Scientist-practitioner perspectives (pp. 1-38). San Diego, CA: Academic Press.
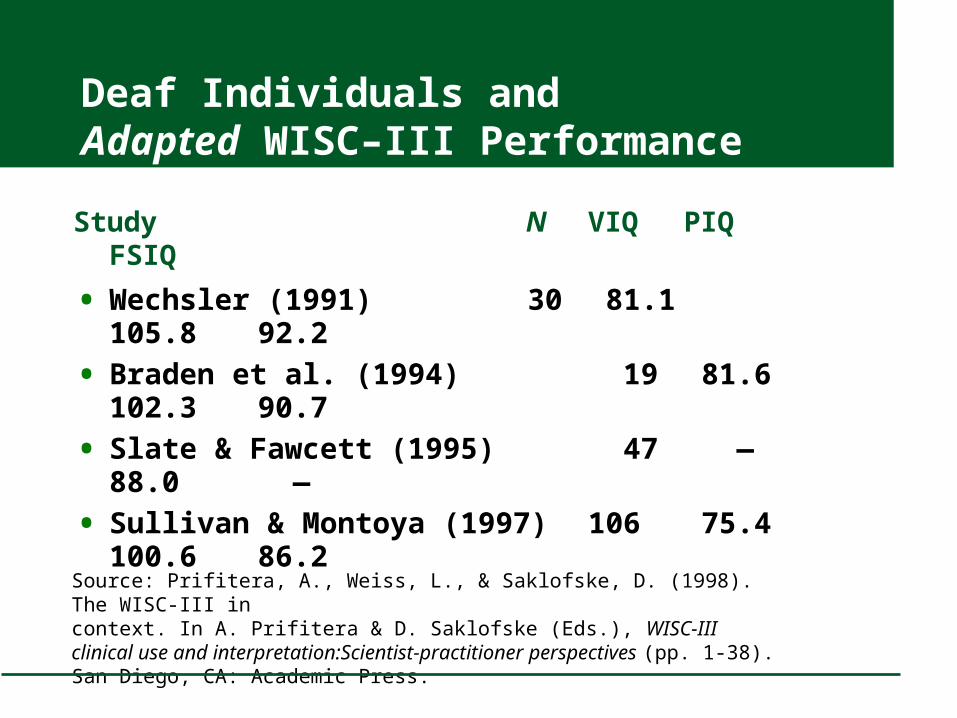
Deaf Individuals and Adapted WISC–III Performance
Study N VIQ PIQFSIQ
• Wechsler (1991) 30 81.1 105.8 92.2
• Braden et al. (1994) 19 81.6 102.3 90.7
• Slate & Fawcett (1995) 47 — 88.0 —
• Sullivan & Montoya (1997) 106 75.4 100.6 86.2
Source: Prifitera, A., Weiss, L., & Saklofske, D. (1998). The WISC-III in context. In A. Prifitera & D. Saklofske (Eds.), WISC-III clinical use and interpretation:Scientist-practitioner perspectives (pp. 1-38). San Diego, CA: Academic Press.
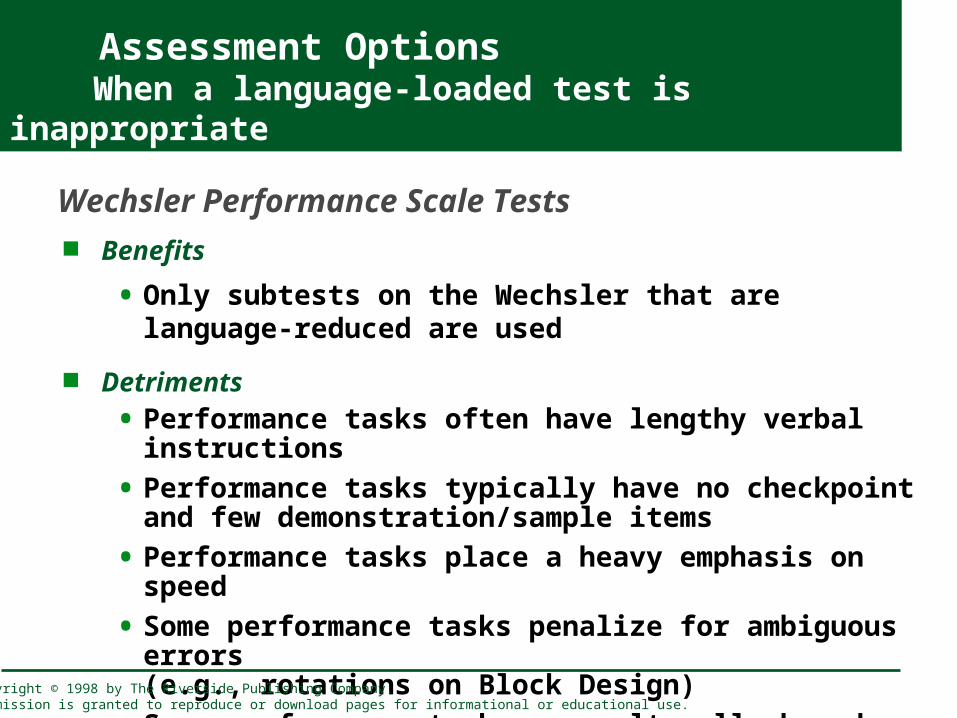
Assessment Options When a language-loaded test is inappropriate
Benefits
• Only subtests on the Wechsler that are language-reduced are used
Detriments
• Performance tasks often have lengthy verbal instructions
• Performance tasks typically have no checkpoint and few demonstration/sample items
• Performance tasks place a heavy emphasis on speed
• Some performance tasks penalize for ambiguous errors (e.g., rotations on Block Design)
• Some performance tasks are culturally-bound (e.g., Picture Arrangement)
Wechsler Performance Scale Tests
Copyright © 1998 by The Riverside Publishing Company. Permission is granted to reproduce or download pages for informational or educational use.
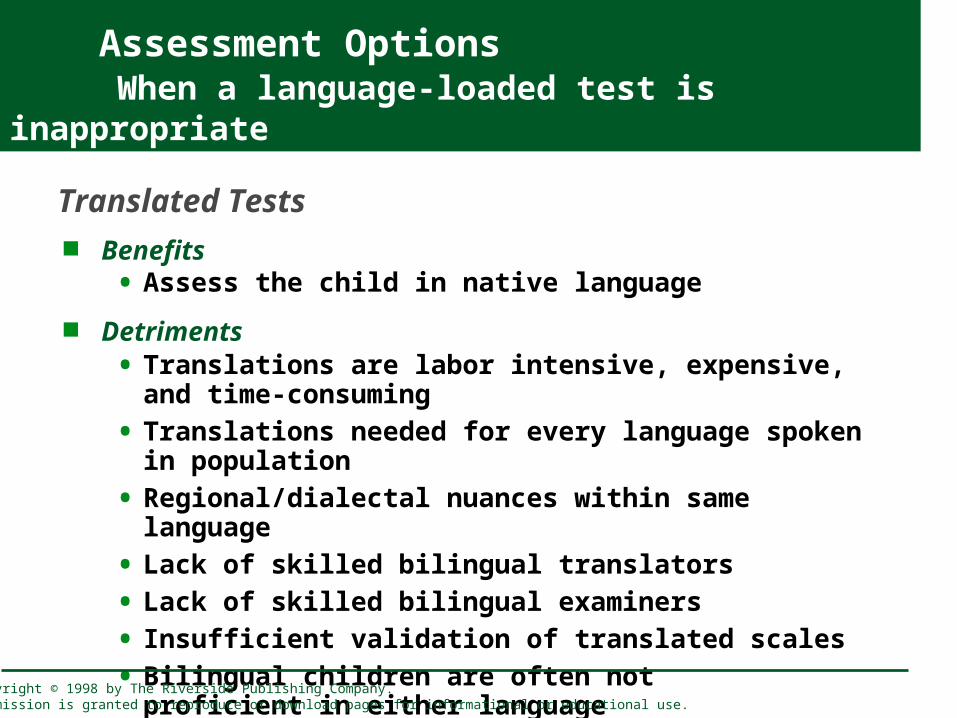
Assessment Options When a language-loaded test is inappropriate
Benefits• Assess the child in native language
Detriments• Translations are labor intensive, expensive, and time-consuming
• Translations needed for every language spoken in population
• Regional/dialectal nuances within same language
• Lack of skilled bilingual translators
• Lack of skilled bilingual examiners
• Insufficient validation of translated scales
• Bilingual children are often not proficient in either language
Translated Tests
Copyright © 1998 by The Riverside Publishing Company. Permission is granted to reproduce or download pages for informational or educational use.
Assessment Options When a language-loaded test is inappropriate
Benefits
• Test is modified to meet the special needs of examinee
Detriments
• Adaptation often changes the basic nature of the construct being assessed
• Test has not been normed as adapted
• Test usually has not been validated as adapted
Adapted Tests
Copyright © 1998 by The Riverside Publishing Company. Permission is granted to reproduce or download pages for informational or educational use.

Assessment Options When a language-loaded test is inappropriate
Benefits
• Test is administered, normed, and validated as a nonverbal measure
• Test requires no examinee receptive or expressive language abilities
• Test requires no second language skill of examinee
• Test is appropriate for all children
Detriments
• Often unidimensional assessment of a single construct (e.g., matrix reasoning)
• Historically poor predictor of academic achievement
• Verbal demands on many “nonverbal” tests
Nonverbal Measures
Copyright © 1998 by The Riverside Publishing Company. Permission is granted to reproduce or download pages for informational or educational use.
Current Controversies: Verbal Mediation of Nonverbal Tests
Many nonverbal procedures have nonsymbolic, abstract material
Few nonverbal procedures have symbolic, verbally-mediated material
Best Practice is to find a test that balances or otherwise compares performance on both verbally- and nonverbally-mediated tasks
Copyright © 1998 by The Riverside Publishing Company. Permission is granted to reproduce or download pages for informational or educational use.
Current Controversies: Symbol & Gesture Comprehension in Language-Impaired Individuals
Aphasia and language impairment affect central processing of symbolic information that is essential to language
In varying degrees, aphasic individuals may have difficulty understanding spoken, written, and even gestural communications
Best Practice is to build multiple indicators into a test to ensure that the examinee understands what is being asked of him or her (e.g., sample items, demonstration items, and checkpoint items)
Copyright © 1998 by The Riverside Publishing Company. Permission is granted to reproduce or download pages for informational or educational use.

Current Controversies: Nonverbal Assessment Compared With Use of Translated Tests
Advantages of Nonverbal Tests• One test can be used across cultures and languages
• Bypasses the effect of bilingualism or differential language competencies
• Solves the problem of translational inconsistencies
• Solves the problem of poorly normed test translations
• Solves the problem of examinee competence in language
Copyright © 1998 by The Riverside Publishing Company. Permission is granted to reproduce or download pages for informational or educational use.

A List of Nonverbal Intelligence Tests
First Generation Nonverbal Intelligence Tests Matrices-Based Nonverbal Cognitive Procedures The New Generation of Multidimensional
Nonverbal Cognitive Procedures
Copyright © 1998 by The Riverside Publishing Company. Permission is granted to reproduce or download pages for informational or educational use.

First Generation Nonverbal Intelligence Tests
Draw A Person (Goodenough, 1926) Raven’s Progressive Matrices (originally
1938) Wechsler Performance Scales
(originally 1939) Leiter International Performance Scale
(originally 1948)
Copyright © 1998 by The Riverside Publishing Company. Permission is granted to reproduce or download pages for informational or educational use.
Matrices-Based Nonverbal Cognitive Procedures
Raven’s Progressive Matrices Matrix Analogies Test Naglieri Nonverbal Ability Test Comprehensive Test of Nonverbal Intelligence Test of Nonverbal Intelligence–3rd Edition
Copyright © 1998 by The Riverside Publishing Company. Permission is granted to reproduce or download pages for informational or educational use.
The New Generation of Multidimensional Nonverbal Intelligence Tests
Universal Nonverbal Intelligence Test (UNIT) by B. A. Bracken & R. S. McCallum (1998)
Leiter International Performance Scale–Revised by G. H. Roid & L. J. Miller (1997)
Copyright © 1998 by The Riverside Publishing Company. Permission is granted to reproduce or download pages for informational or educational use.
Copyright © 1998 by The Riverside Publishing Company. Permission is granted to reproduce or download pages for informational or educational use.
Universal NonverbalIntelligence Test
An Introduction to the UNIT
Top Ten Goals in UNIT Development Theoretical Underpinnings Scales and Subtests Administration Features UNIT Standardization and Technical Properties
(Reliability, Validity, and Special Psychometric Properties)
Fairness Clinical Use and Interpretation
Copyright © 1998 by The Riverside Publishing Company. Permission is granted to reproduce or download pages for informational or educational use.
Top Ten Goals in UNIT Development
10. Answer the pressing need for cross-cultural assessment instruments.
9. Create a multipurpose test for use whenever language is an issue or concern.
8. Create a test that is entirely nonverbal, with no receptive or expressive language requirements.
7. Develop tasks that comprehensively measure general intelligence.
6. Develop tasks that measure important subdomains of intelligence.
Copyright © 1998 by The Riverside Publishing Company. Permission is granted to reproduce or download pages for informational or educational use.
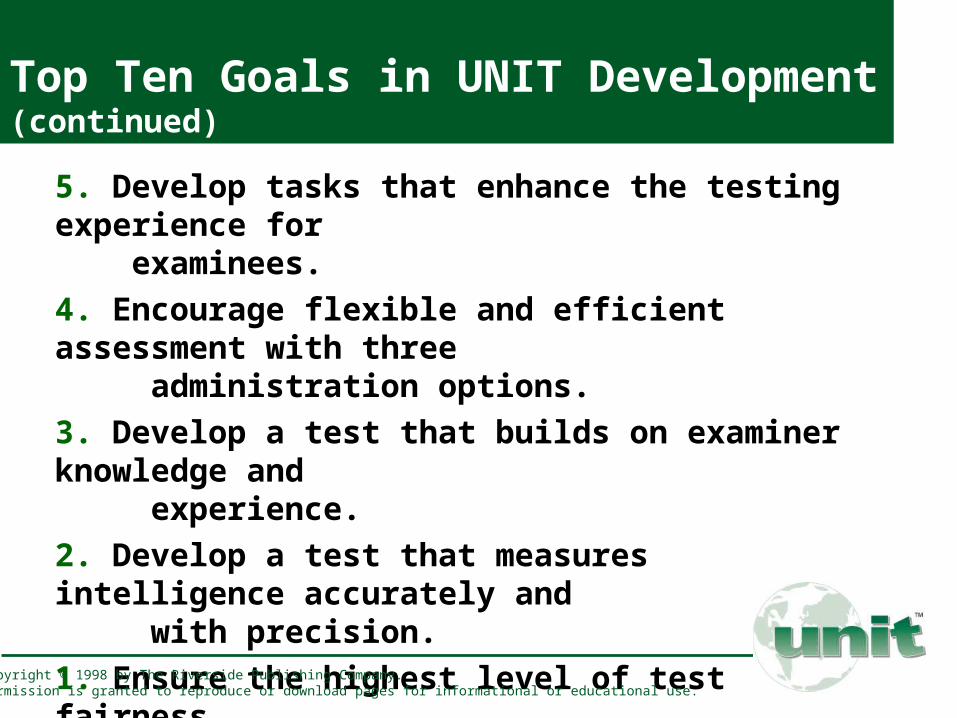
Top Ten Goals in UNIT Development (continued)
5. Develop tasks that enhance the testing experience for examinees.
4. Encourage flexible and efficient assessment with three administration options.
3. Develop a test that builds on examiner knowledge and experience.
2. Develop a test that measures intelligence accurately and with precision.
1. Ensure the highest level of test fairness.
Copyright © 1998 by The Riverside Publishing Company. Permission is granted to reproduce or download pages for informational or educational use.
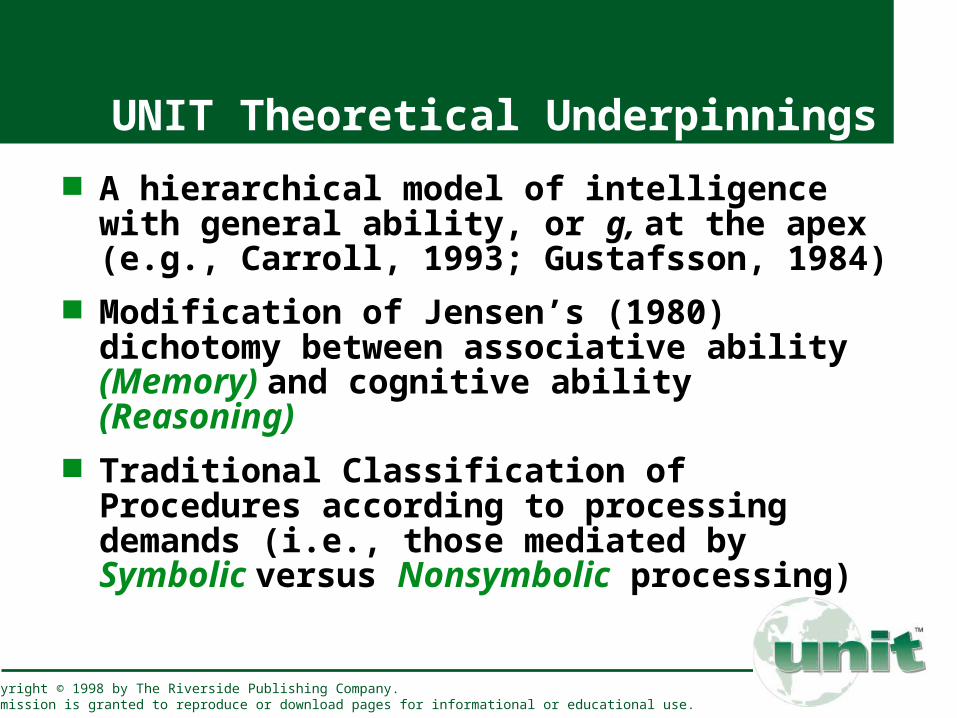
UNIT Theoretical Underpinnings
A hierarchical model of intelligence with general ability, or g, at the apex (e.g., Carroll, 1993; Gustafsson, 1984)
Modification of Jensen’s (1980) dichotomy between associative ability (Memory) and cognitive ability (Reasoning)
Traditional Classification of Procedures according to processing demands (i.e., those mediated by Symbolic versus Nonsymbolic processing)
Copyright © 1998 by The Riverside Publishing Company. Permission is granted to reproduce or download pages for informational or educational use.
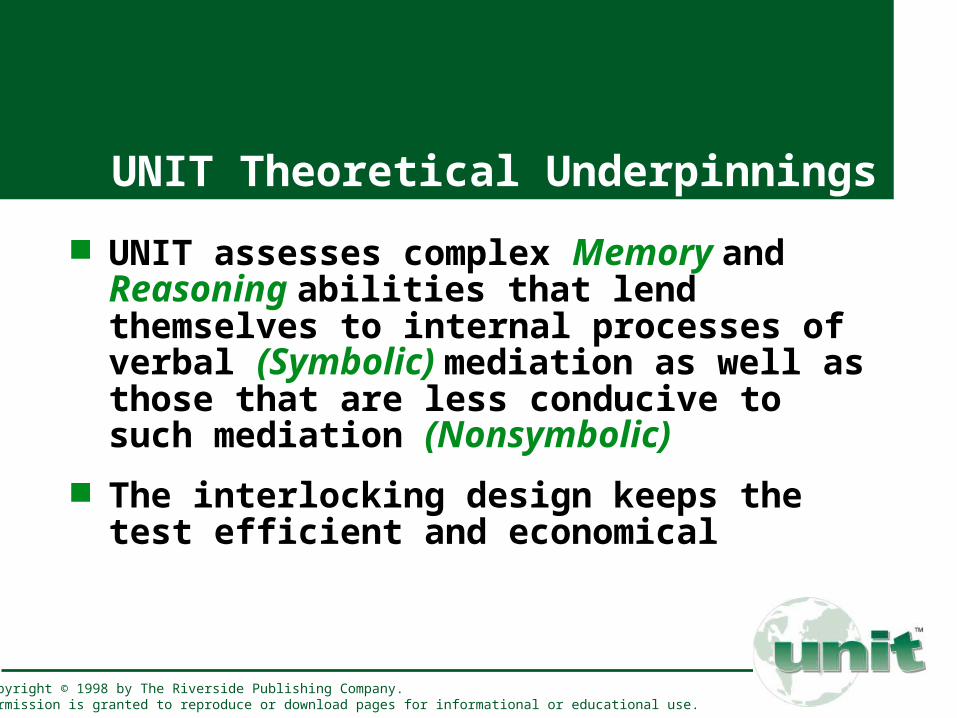
UNIT Theoretical Underpinnings
UNIT assesses complex Memory and Reasoning abilities that lend themselves to internal processes of verbal (Symbolic) mediation as well as those that are less conducive to such mediation (Nonsymbolic)
The interlocking design keeps the test efficient and economical
Copyright © 1998 by The Riverside Publishing Company. Permission is granted to reproduce or download pages for informational or educational use.
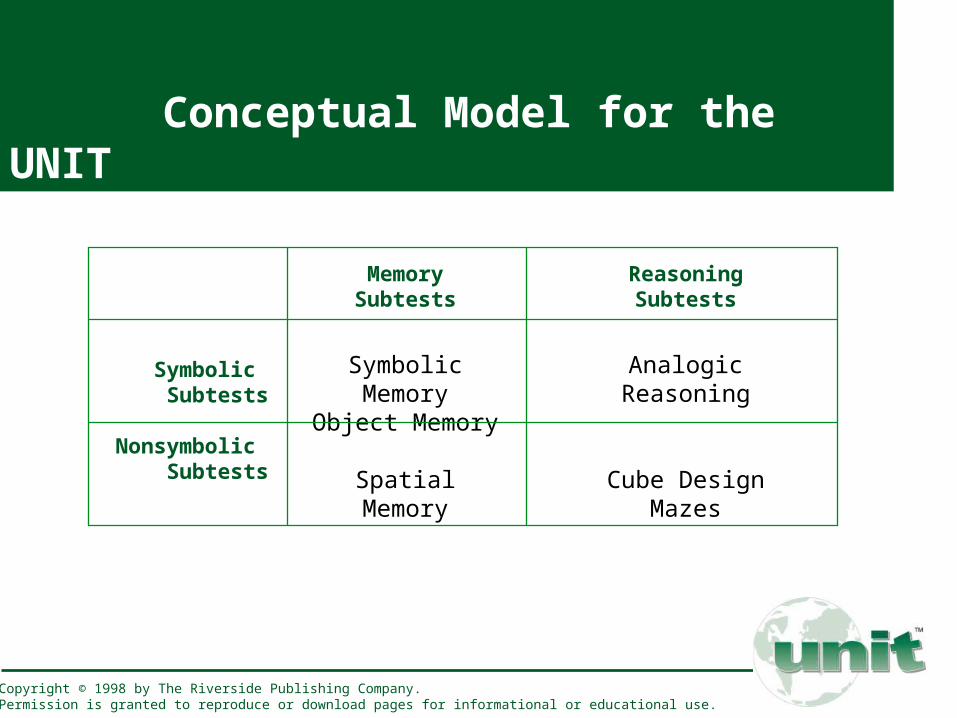
Conceptual Model for the UNIT
Symbolic Subtests
Nonsymbolic Subtests
MemorySubtests
Symbolic Memory
Object Memory
Spatial Memory
ReasoningSubtests
Analogic Reasoning
Cube DesignMazes
Copyright © 1998 by The Riverside Publishing Company. Permission is granted to reproduce or download pages for informational or educational use.

UNIT Scales
Memory Quotient (MQ) Reasoning Quotient (RQ) Symbolic Quotient (SQ) Nonsymbolic Quotient (NSQ) Full Scale Intelligence Quotient (FSIQ)
Copyright © 1998 by The Riverside Publishing Company. Permission is granted to reproduce or download pages for informational or educational use.
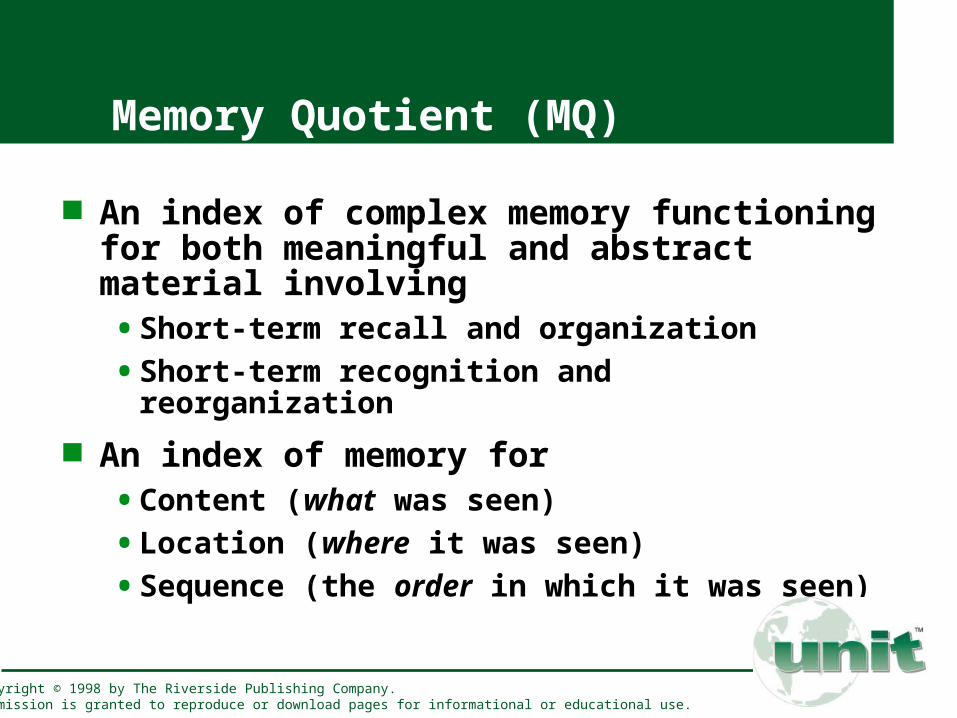
Memory Quotient (MQ)
An index of complex memory functioning for both meaningful and abstract material involving• Short-term recall and organization
• Short-term recognition and reorganization
An index of memory for• Content (what was seen)
• Location (where it was seen)
• Sequence (the order in which it was seen)
Copyright © 1998 by The Riverside Publishing Company. Permission is granted to reproduce or download pages for informational or educational use.

Reasoning Quotient (RQ)
An index of thinking and problem-solving abilities for• Familiar situations
• Unfamiliar situations
An index that requires• Pattern processing
• Understanding of relationships
• Planning abilities
Copyright © 1998 by The Riverside Publishing Company. Permission is granted to reproduce or download pages for informational or educational use.

Symbolic Quotient (SQ)
An index of processing and problem-solving with material that is• Meaningful in content
• Conducive to internal verbal mediation
Internal verbal mediation includes• Labeling
• Organizing
• Categorizing
Copyright © 1998 by The Riverside Publishing Company. Permission is granted to reproduce or download pages for informational or educational use.

Nonsymbolic Quotient (NSQ)
An index of processing and problem-solving with material that is• Abstract in content
• Not very meaningful
• Not easily conducive to verbal mediation
Copyright © 1998 by The Riverside Publishing Company. Permission is granted to reproduce or download pages for informational or educational use.
UNIT Subtests
Symbolic Memory Cube Design Spatial Memory Analogic Reasoning Object Memory Mazes
Copyright © 1998 by The Riverside Publishing Company. Permission is granted to reproduce or download pages for informational or educational use.

Description of
Symbolic Memory Subtest
The examinee views a sequence of universal symbols for a period of 5 seconds. After the stimulus is removed, the examinee recreates the sequence using the Symbolic Memory Response Cards. Each item is a series of universal symbols for baby, girl, boy, woman, and man, depicted in green or black. Symbolic Memory is primarily a measure of short-term visual memory and complex sequential memory for meaningful material.
Copyright © 1998 by The Riverside Publishing Company. Permission is granted to reproduce or download pages for informational or educational use.
Administration at a Glance
Symbolic Memory
Place the response cards in two rows, black at the top and green atthe bottom, and in the following order from left to right: Baby, Girl, Boy,Woman, Man. Place Stimulus Book 1 12"–18" in front of the examinee.The space between the stimulus book and the response cards is the workarea. Make eye contact with the examinee, present the stimulus page for 5seconds, and point to the stimulus figures. After 5 seconds, turn thescreening page to cover the stimulus page, wave a hand over the work areaand response cards, and use the open-handed shrug. After completinga demonstration item, re-expose the stimulus page to demonstratethe correct response(s).
.
Copyright © 1998 by The Riverside Publishing Company. Permission is granted to reproduce or download pages for informational or educational use.

Arrangement of Test Materials for Symbolic Memory
Copyright © 1998 by The Riverside Publishing Company. Permission is granted to reproduce or download pages for informational or educational use.
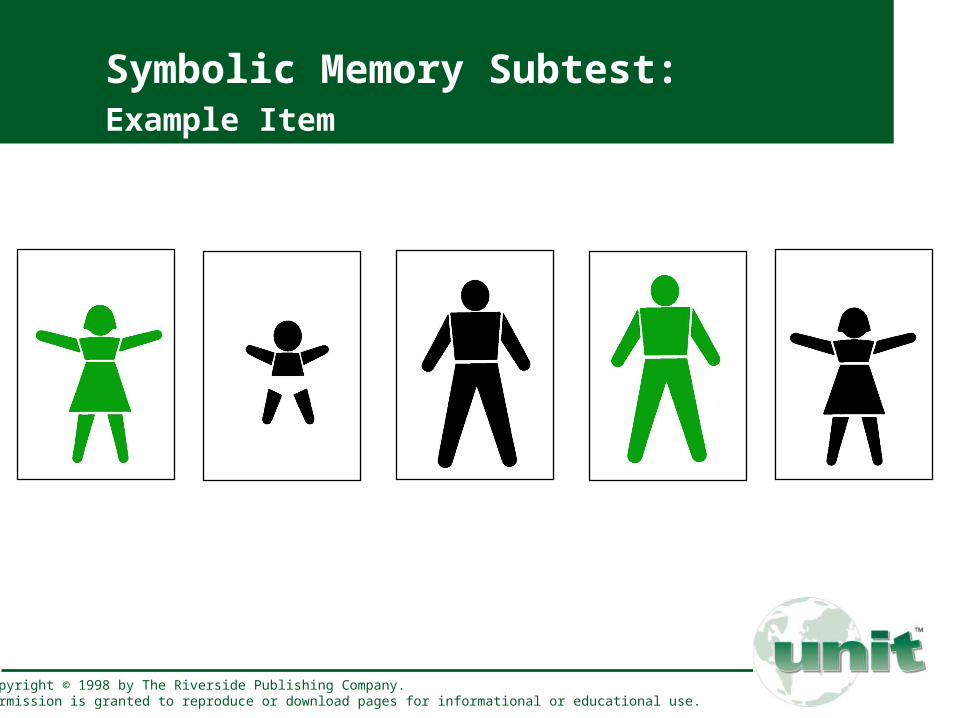
Symbolic Memory Subtest: Example Item
Copyright © 1998 by The Riverside Publishing Company. Permission is granted to reproduce or download pages for informational or educational use.
Description of
Cube Design Subtest
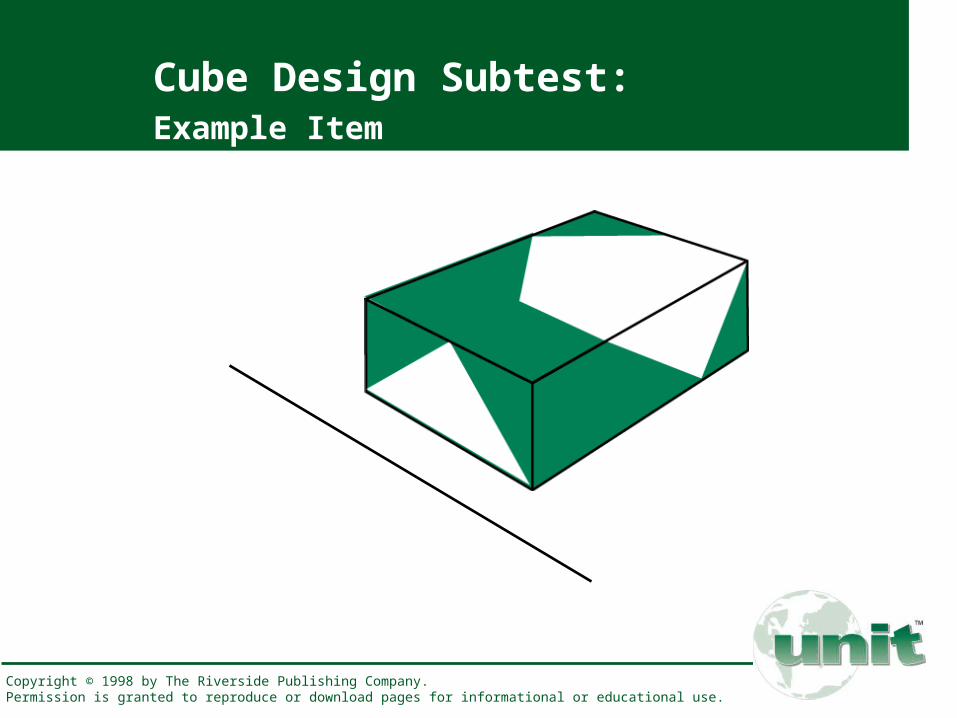
Cube Design involves the presentation and direct reproduction of two-color, abstract, geometric designs. While viewing the stimulus design, the examinee reconstructs the design directly on the stimulus book or response mat, using green-and-white one-inch cubes. Cube Design is primarily a measure of visual-spatial reasoning.
Copyright © 1998 by The Riverside Publishing Company. Permission is granted to reproduce or download pages for informational or educational use.
Administration at a Glance
Cube Design
For Demonstration 1 through Item 2, place Stimulus Book 1 flat, directly in front of the examinee. (Use the back of the response mat to cover Spatial Memory items.) For Demonstration 3 through Item 15, place Stimulus Book 1 in its easel position 12"–18" in front of the examinee, and the response mat between the examinee and the stimulus book. For each item, place the required number of cubes beside the stimulus book or response mat, expose the stimulus page, start the stopwatch deliberately, and use the open-handed shrug. After completing demonstration items, stop the stopwatch and point to the side(s) of the cube(s) and the corresponding side(s) of the stimulus design.
Copyright © 1998 by The Riverside Publishing Company. Permission is granted to reproduce or download pages for informational or educational use.
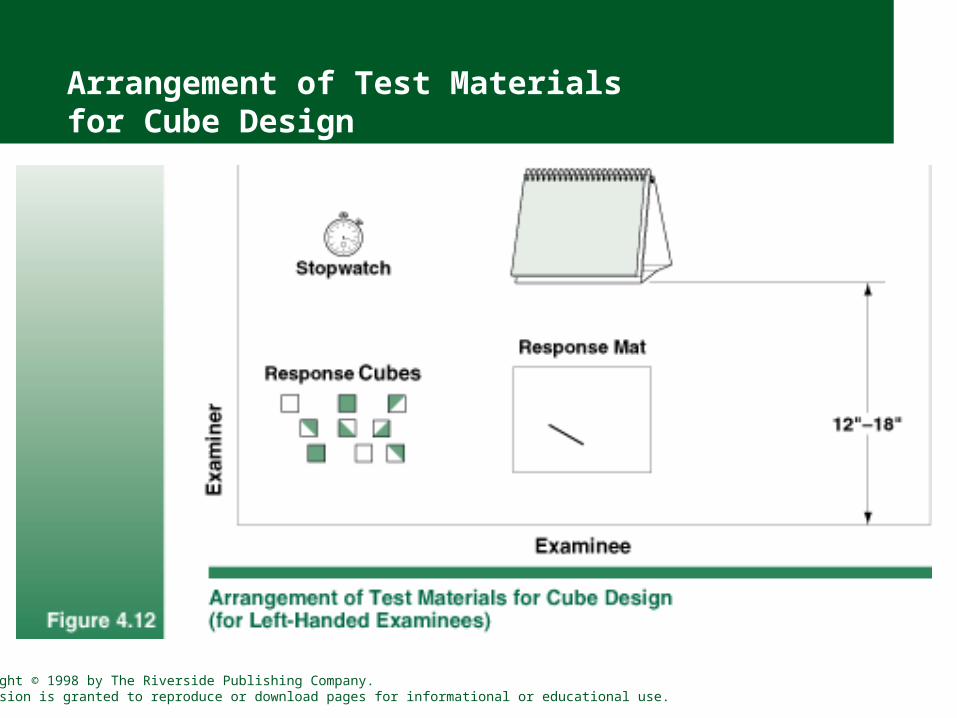
Arrangement of Test Materials for Cube Design
Copyright © 1998 by The Riverside Publishing Company. Permission is granted to reproduce or download pages for informational or educational use.
Cube Design Subtest: Example Item
Copyright © 1998 by The Riverside Publishing Company. Permission is granted to reproduce or download pages for informational or educational use.
Description of
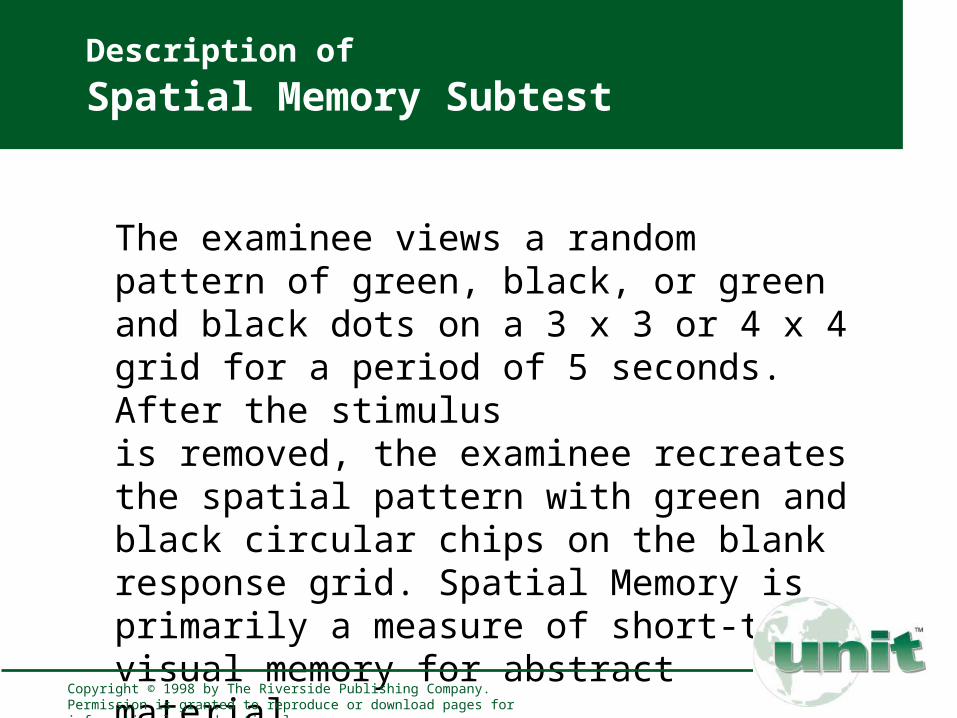
Spatial Memory Subtest
The examinee views a random pattern of green, black, or green and black dots on a 3 x 3 or 4 x 4 grid for a period of 5 seconds. After the stimulus is removed, the examinee recreates the spatial pattern with green and black circular chips on the blank response grid. Spatial Memory is primarily a measure of short-term visual memory for abstract material.
Copyright © 1998 by The Riverside Publishing Company. Permission is granted to reproduce or download pages for informational or educational use.
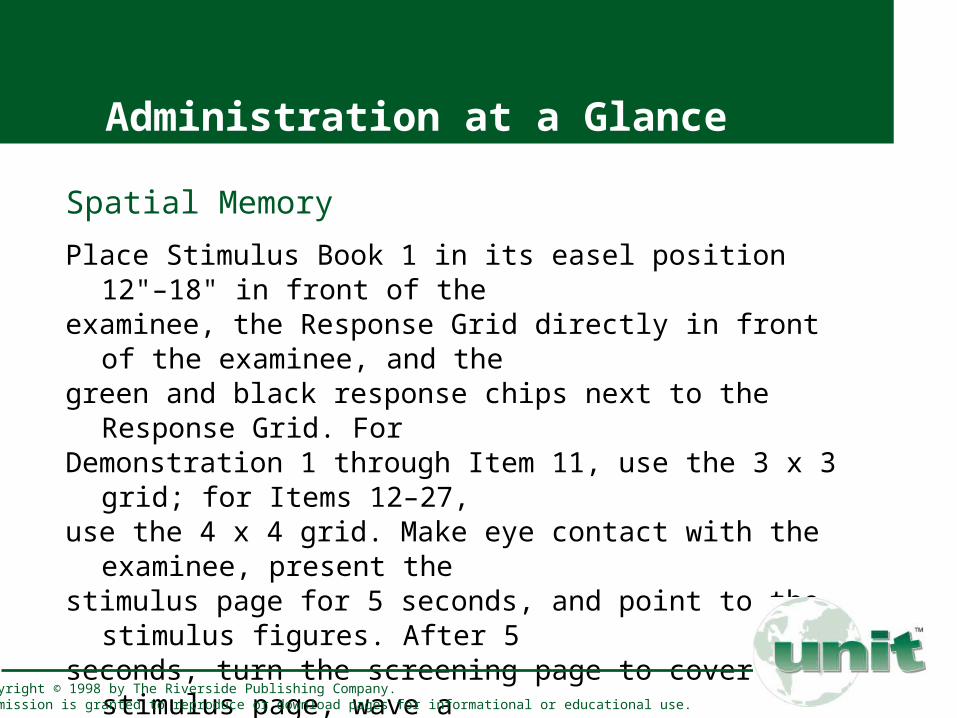
Administration at a Glance
Spatial Memory
Place Stimulus Book 1 in its easel position 12"–18" in front of theexaminee, the Response Grid directly in front of the examinee, and thegreen and black response chips next to the Response Grid. ForDemonstration 1 through Item 11, use the 3 x 3 grid; for Items 12–27,use the 4 x 4 grid. Make eye contact with the examinee, present thestimulus page for 5 seconds, and point to the stimulus figures. After 5seconds, turn the screening page to cover the stimulus page, wave ahand over the response grid and response chips, and use theopen-handed shrug. After completing a demonstration item,re-expose the stimulus page to demonstrate the correctresponse(s).
.
Copyright © 1998 by The Riverside Publishing Company. Permission is granted to reproduce or download pages for informational or educational use.
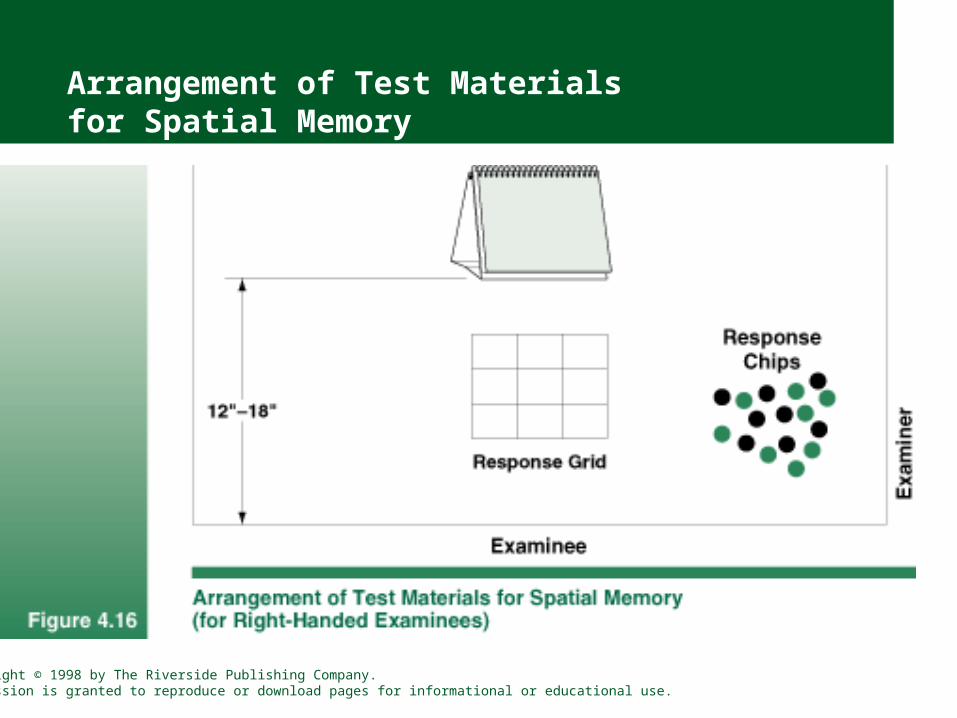
Arrangement of Test Materials for Spatial Memory
Copyright © 1998 by The Riverside Publishing Company. Permission is granted to reproduce or download pages for informational or educational use.
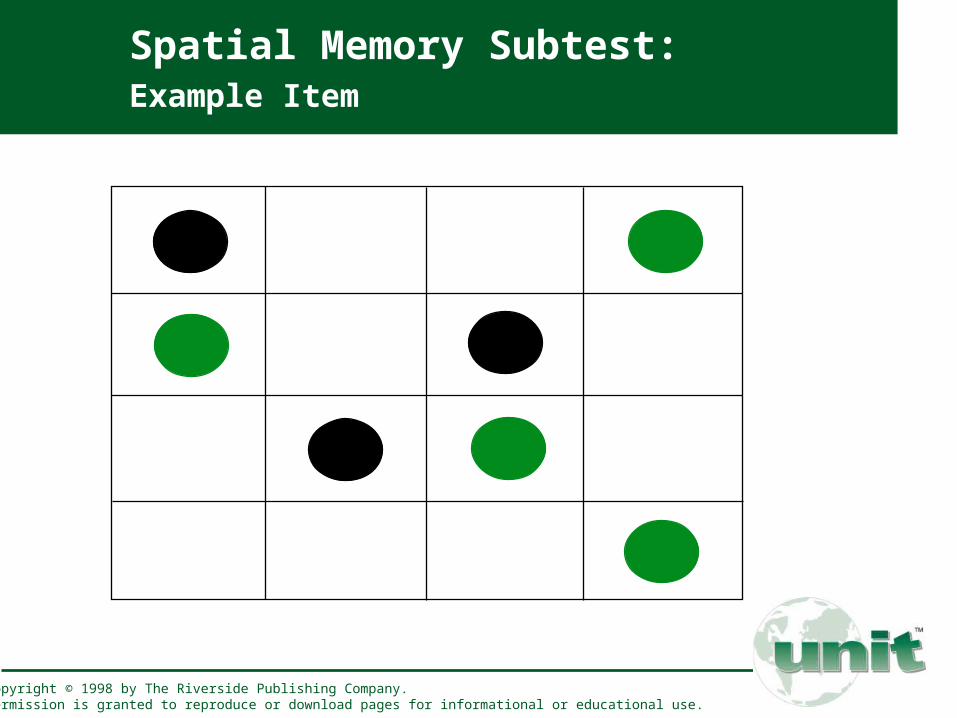
Spatial Memory Subtest: Example Item
Copyright © 1998 by The Riverside Publishing Company. Permission is granted to reproduce or download pages for informational or educational use.
Description of
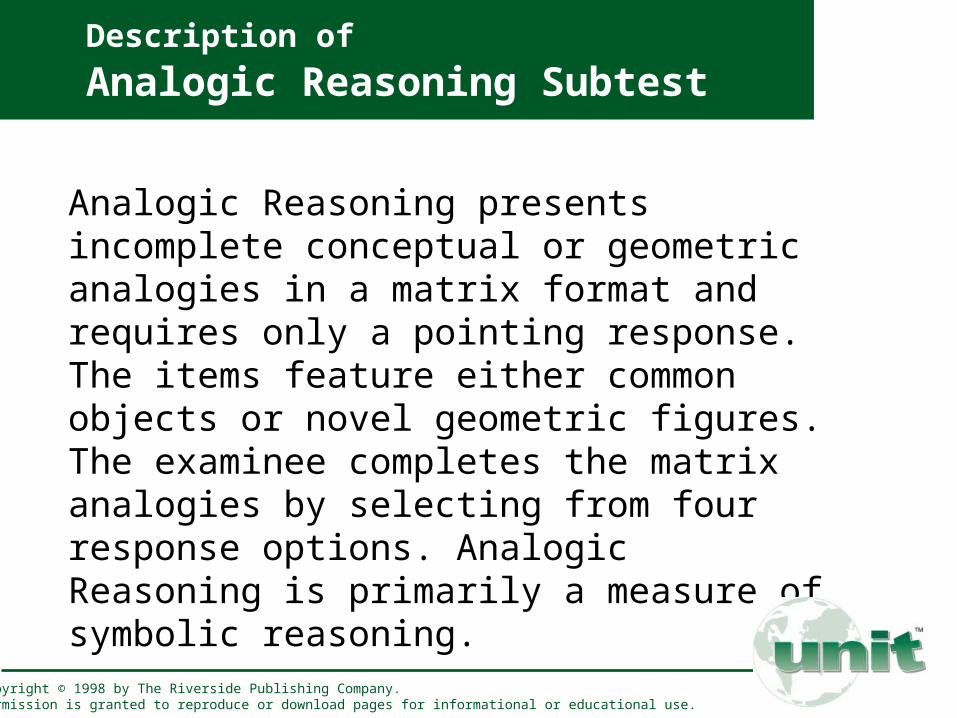
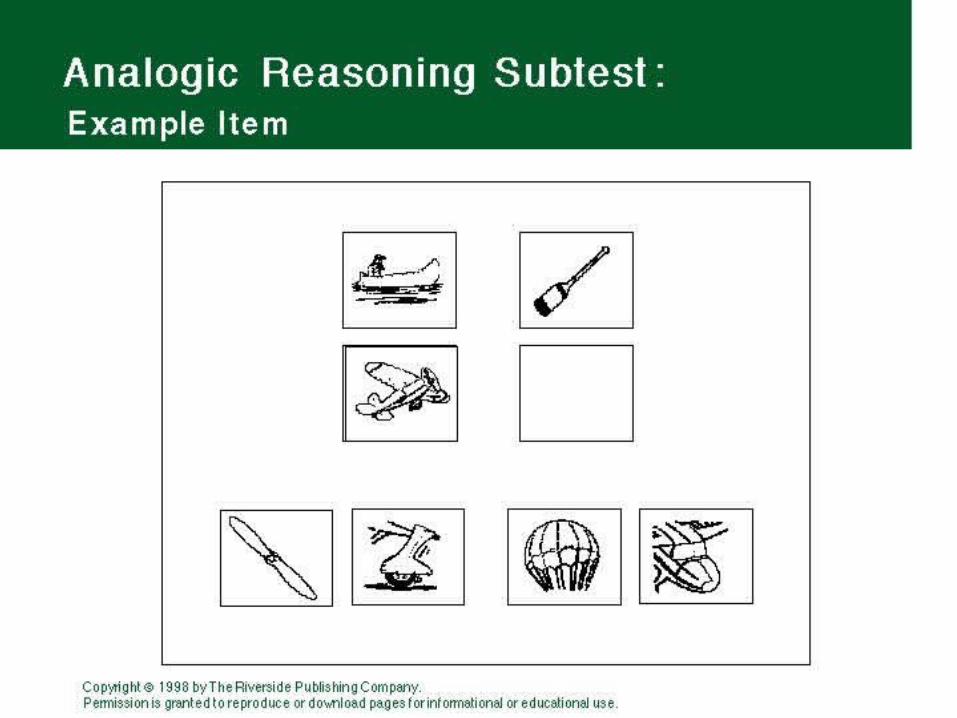
Analogic Reasoning Subtest
Analogic Reasoning presents incomplete conceptual or geometric analogies in a matrix format and requires only a pointing response. The items feature either common objects or novel geometric figures. The examinee completes the matrix analogies by selecting from four response options. Analogic Reasoning is primarily a measure of symbolic reasoning.
Copyright © 1998 by The Riverside Publishing Company. Permission is granted to reproduce or download pages for informational or educational use.
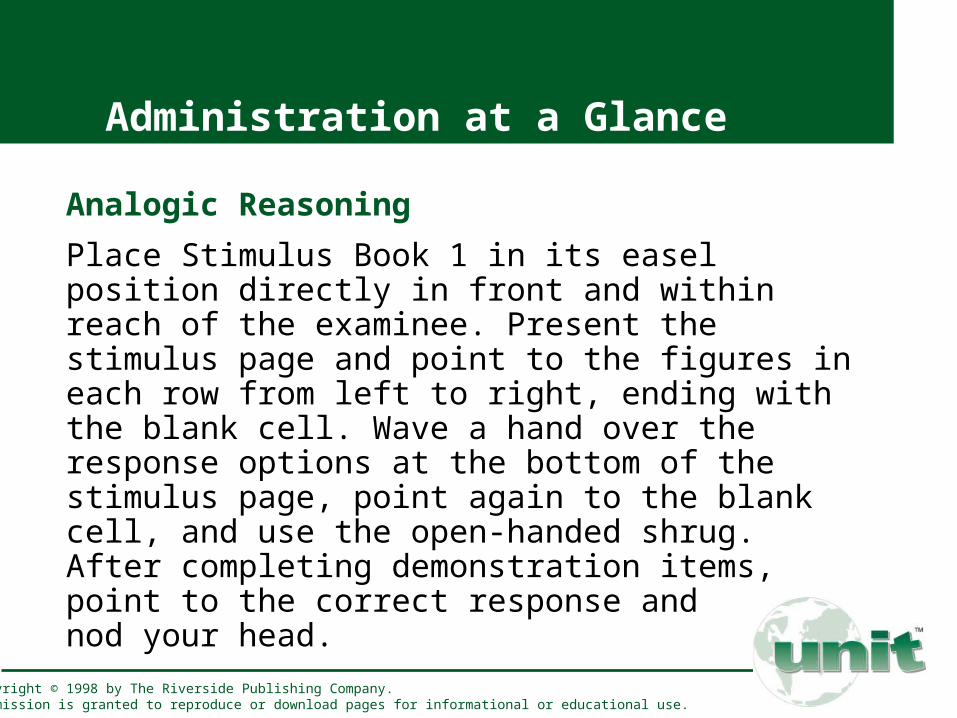
Administration at a Glance
Analogic Reasoning
Place Stimulus Book 1 in its easel position directly in front and within reach of the examinee. Present the stimulus page and point to the figures in each row from left to right, ending with the blank cell. Wave a hand over the response options at the bottom of the stimulus page, point again to the blank cell, and use the open-handed shrug. After completing demonstration items, point to the correct response and nod your head.
Copyright © 1998 by The Riverside Publishing Company. Permission is granted to reproduce or download pages for informational or educational use.
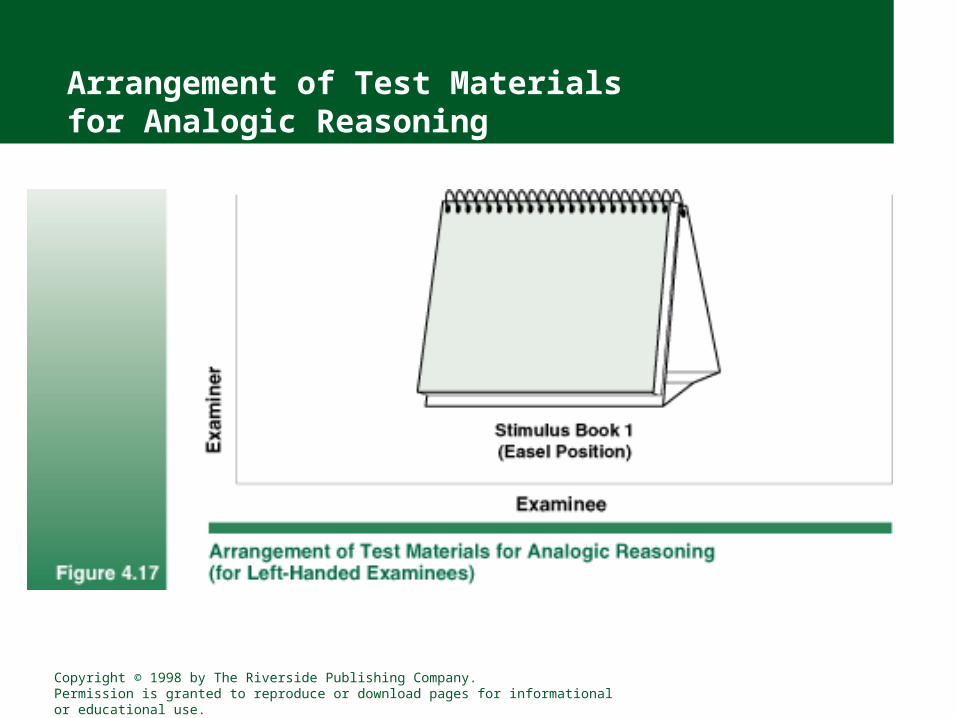
Arrangement of Test Materials for Analogic Reasoning
Copyright © 1998 by The Riverside Publishing Company. Permission is granted to reproduce or download pages for informational or educational use.
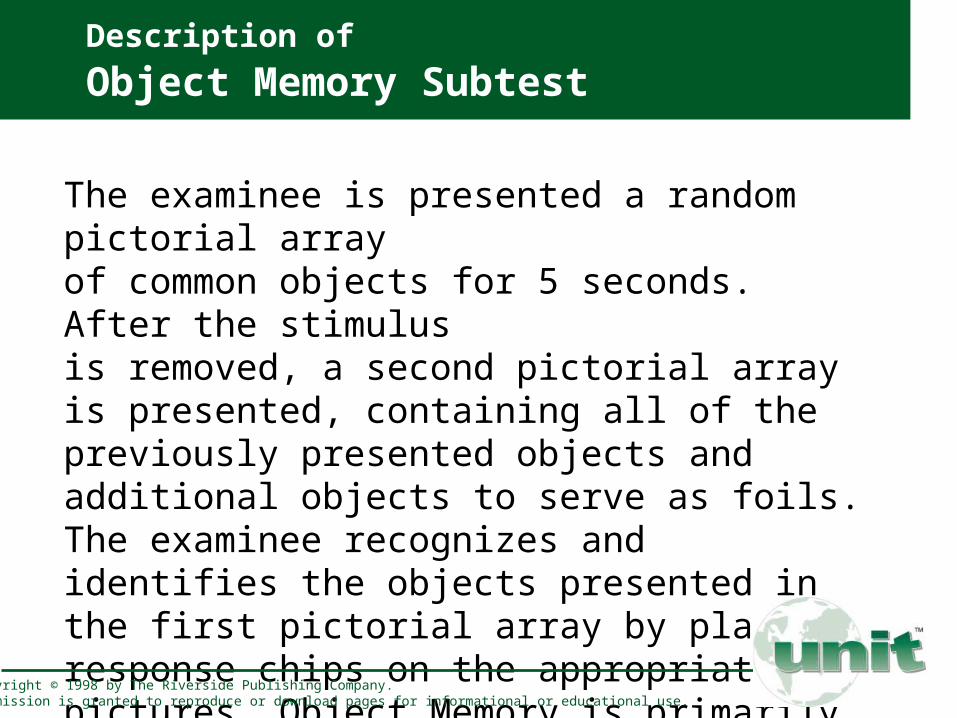
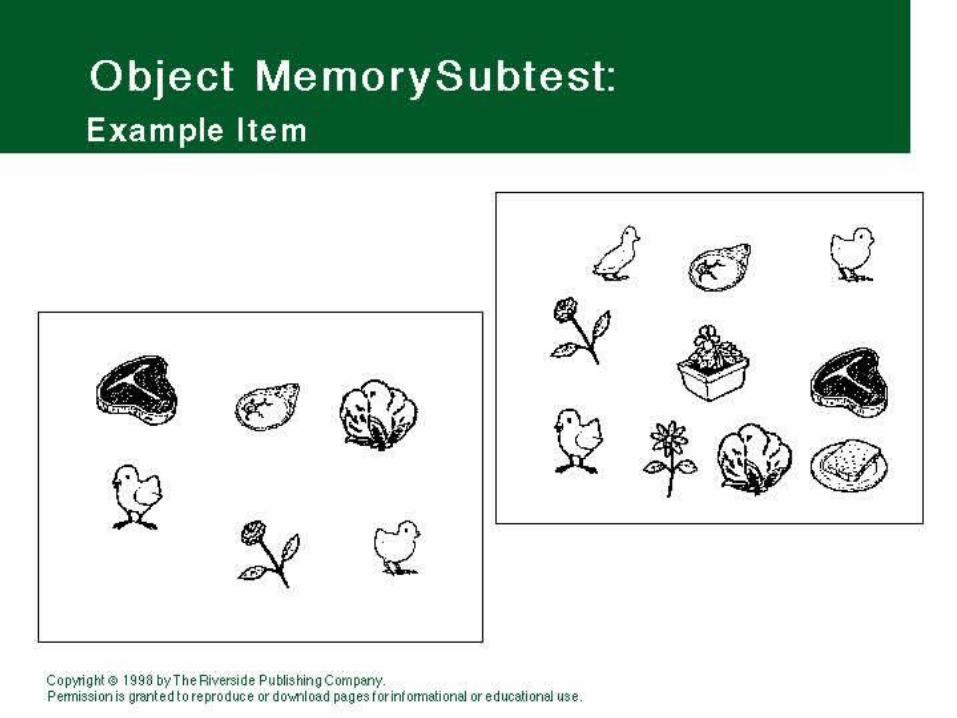
Description of
Object Memory Subtest
The examinee is presented a random pictorial array of common objects for 5 seconds. After the stimulus is removed, a second pictorial array is presented, containing all of the previously presented objects and additional objects to serve as foils. The examinee recognizes and identifies the objects presented in the first pictorial array by placing response chips on the appropriate pictures. Object Memory is primarily a measure of short-term recognition and recall of meaningful symbolic material.
Copyright © 1998 by The Riverside Publishing Company. Permission is granted to reproduce or download pages for informational or educational use.

Administration at a Glance
Object Memory
Place Stimulus Book 2 flat, directly in front of the examinee and eight black response chips beside the stimulus book. Makeeye contact with the examinee, present the stimulus page for 5seconds, and point to the stimulus figures. After 5 seconds,present the response page, wave a hand over the response pageand response chips, and use the open handed shrug. Aftercompleting demonstration items, re-expose the stimulus page todemonstrate the correct response(s).
Copyright © 1998 by The Riverside Publishing Company. Permission is granted to reproduce or download pages for informational or educational use.
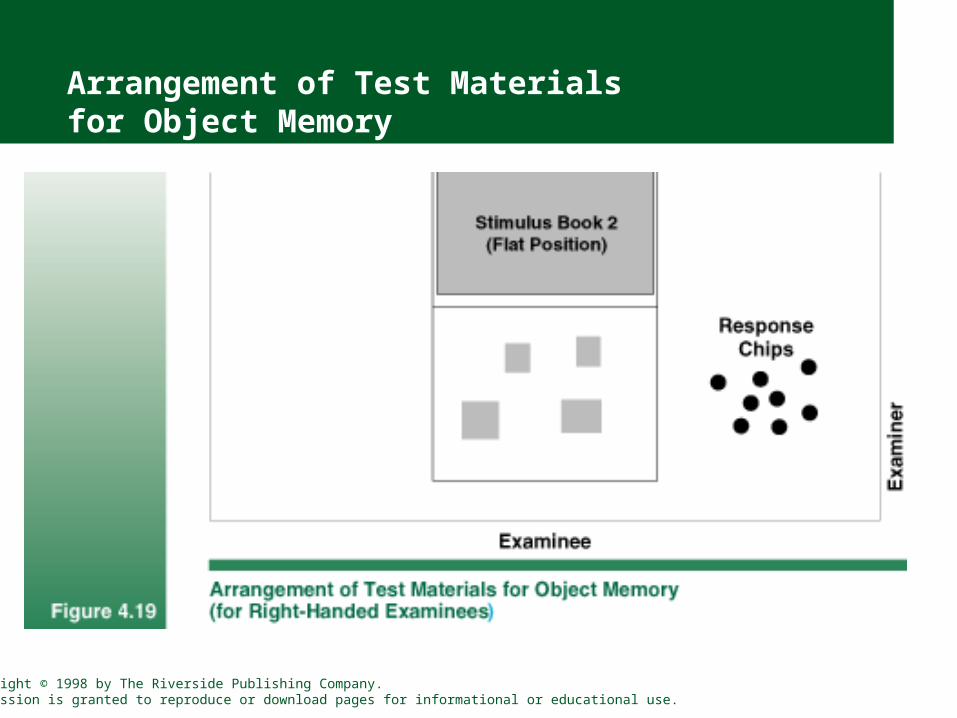
Arrangement of Test Materials for Object Memory
Copyright © 1998 by The Riverside Publishing Company. Permission is granted to reproduce or download pages for informational or educational use.
Description of
Mazes Subtest
The examinee uses paper and pencil to navigate and exit mazes by tracing a path from the center starting point of each maze to the correct exit, without making incorrect decisions en route. Increasingly complex mazes are presented. Mazes is primarily a measure of reasoning and planful behavior.
Copyright © 1998 by The Riverside Publishing Company. Permission is granted to reproduce or download pages for informational or educational use.
Administration at a Glance
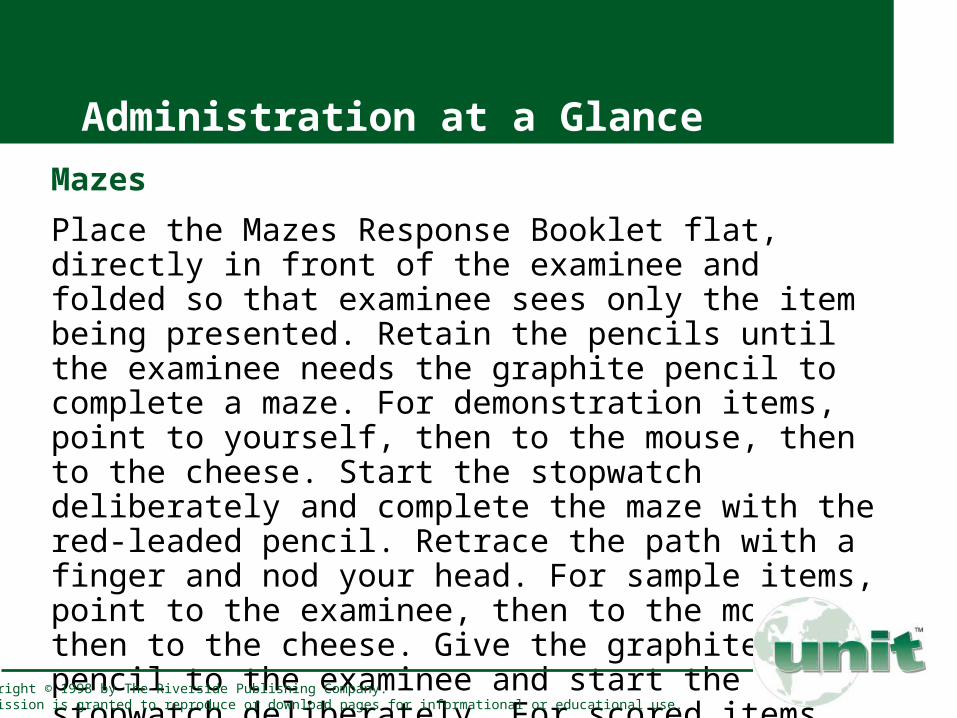
Mazes
Place the Mazes Response Booklet flat, directly in front of the examinee and folded so that examinee sees only the item being presented. Retain the pencils until the examinee needs the graphite pencil to complete a maze. For demonstration items, point to yourself, then to the mouse, then to the cheese. Start the stopwatch deliberately and complete the maze with the red-leaded pencil. Retrace the path with a finger and nod your head. For sample items, point to the examinee, then to the mouse, then to the cheese. Give the graphite pencil to the examinee and start the stopwatch deliberately. For scored items, point to the examinee and to the mouse, but not to the cheese.
Copyright © 1998 by The Riverside Publishing Company. Permission is granted to reproduce or download pages for informational or educational use.

Arrangement of Test Materials for Mazes
Copyright © 1998 by The Riverside Publishing Company. Permission is granted to reproduce or download pages for informational or educational use.

Mazes Subtest: Example Item
Copyright © 1998 by The Riverside Publishing Company. Permission is granted to reproduce or download pages for informational or educational use.

UNIT Administration Features
100% nonverbal administration Flexible administration with three options
(Abbreviated, Standard, or Extended Batteries) depending on your needs
Administration at a Glance card Use of relatively universal and cross-cultural
nonverbal gestures Demonstration items, Sample items, and
Checkpoint items for fair administration
Copyright © 1998 by The Riverside Publishing Company. Permission is granted to reproduce or download pages for informational or educational use.
100% Nonverbal Administration
UNIT is the only multidimensional IQ test which may be administered completely nonverbally
But you always have the freedom to talk with a child to build and maintain rapport, so long as the discussion is not about the test!
Copyright © 1998 by The Riverside Publishing Company. Permission is granted to reproduce or download pages for informational or educational use.
Flexible Administration Abbreviated, Standard, Extended Batteries
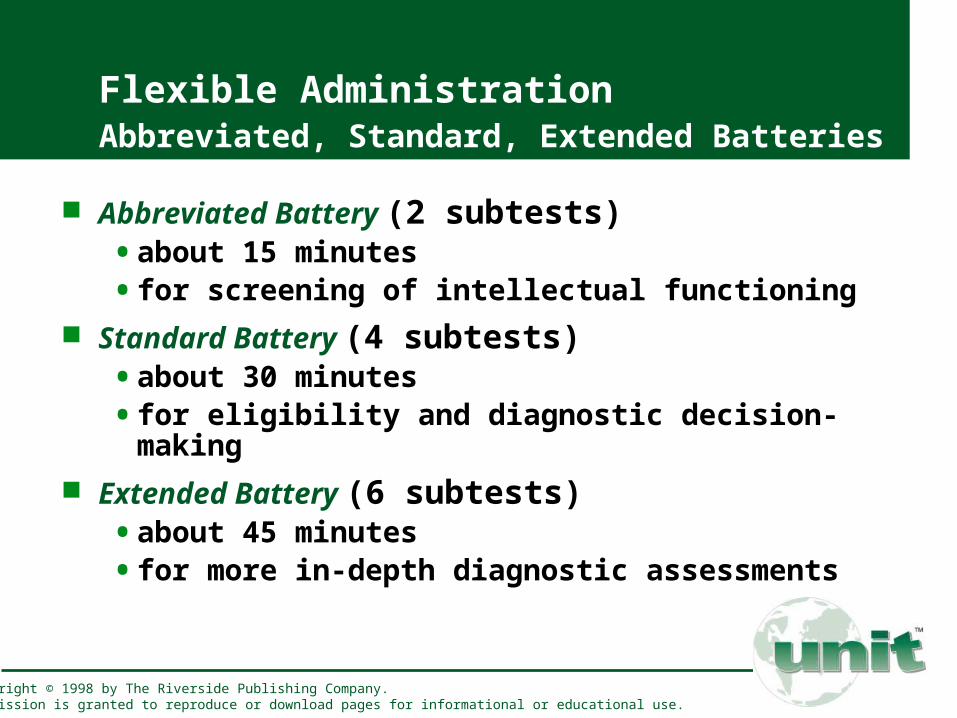
Abbreviated Battery (2 subtests)• about 15 minutes
• for screening of intellectual functioning Standard Battery (4 subtests)
• about 30 minutes
• for eligibility and diagnostic decision-making Extended Battery (6 subtests)
• about 45 minutes
• for more in-depth diagnostic assessments
Copyright © 1998 by The Riverside Publishing Company. Permission is granted to reproduce or download pages for informational or educational use.
Administration at a Glance
Copyright © 1998 by The Riverside Publishing Company. Permission is granted to reproduce or download pages for informational or educational use.
Administration Gestures
Copyright © 1998 by The Riverside Publishing Company. Permission is granted to reproduce or download pages for informational or educational use.
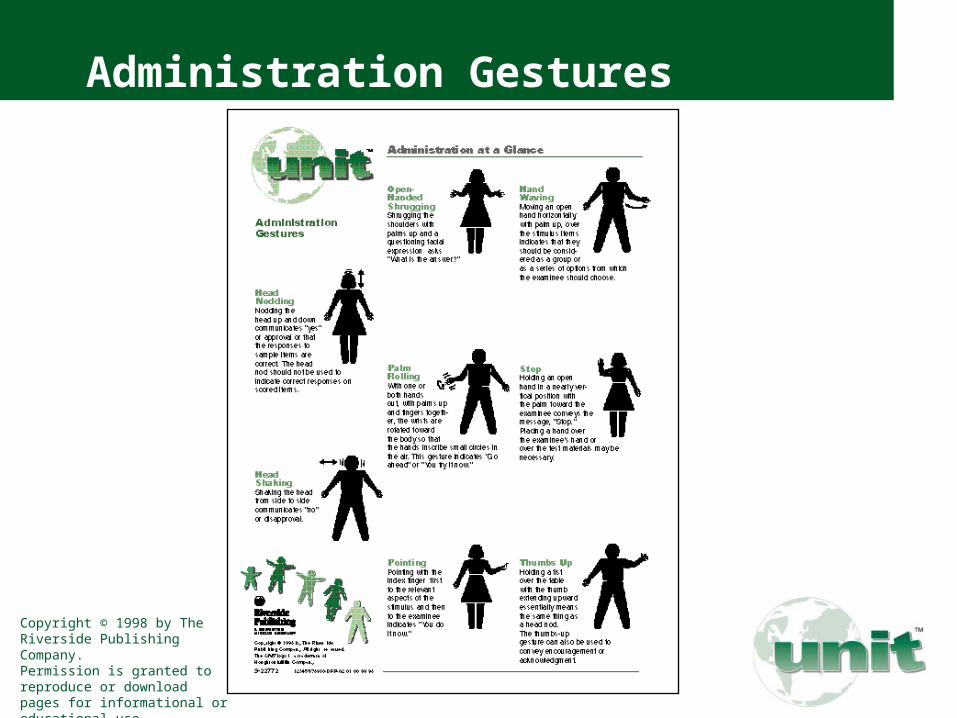
Administration Gestures
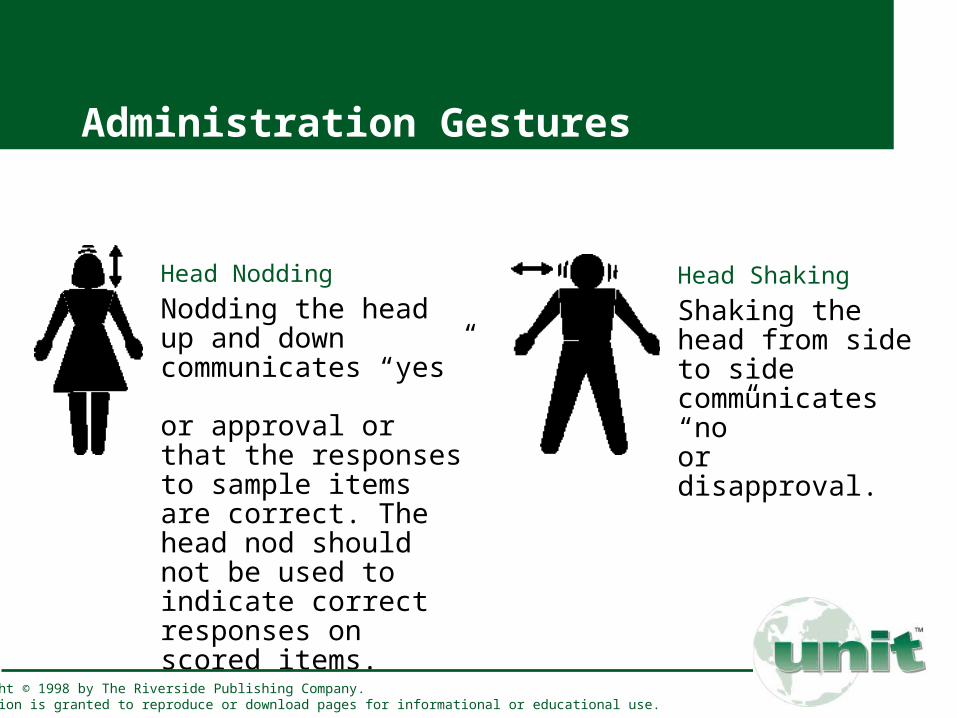
Head Nodding
Nodding the head up and down communicates “yes” or approval or that the responses to sample items are correct. The head nod should not be used to indicate correct responses on scored items.
Head Shaking
Shaking the head from side to side communicates “no” or disapproval.
Copyright © 1998 by The Riverside Publishing Company. Permission is granted to reproduce or download pages for informational or educational use.
Administration Gestures
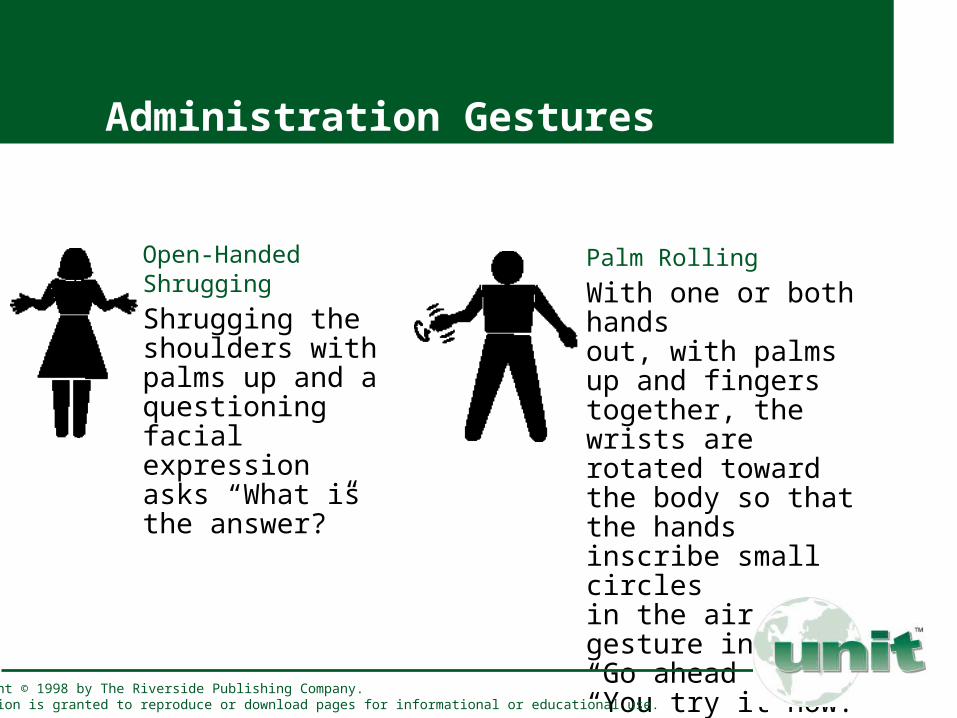
Open-Handed Shrugging
Shrugging the shoulders with palms up and a questioning facial expression asks “What is the answer?”
Palm Rolling
With one or both hands out, with palms up and fingers together, the wrists are rotated toward the body so that the hands inscribe small circles in the air. This gesture indicates “Go ahead” or “You try it now.”
Copyright © 1998 by The Riverside Publishing Company. Permission is granted to reproduce or download pages for informational or educational use.
Administration Gestures
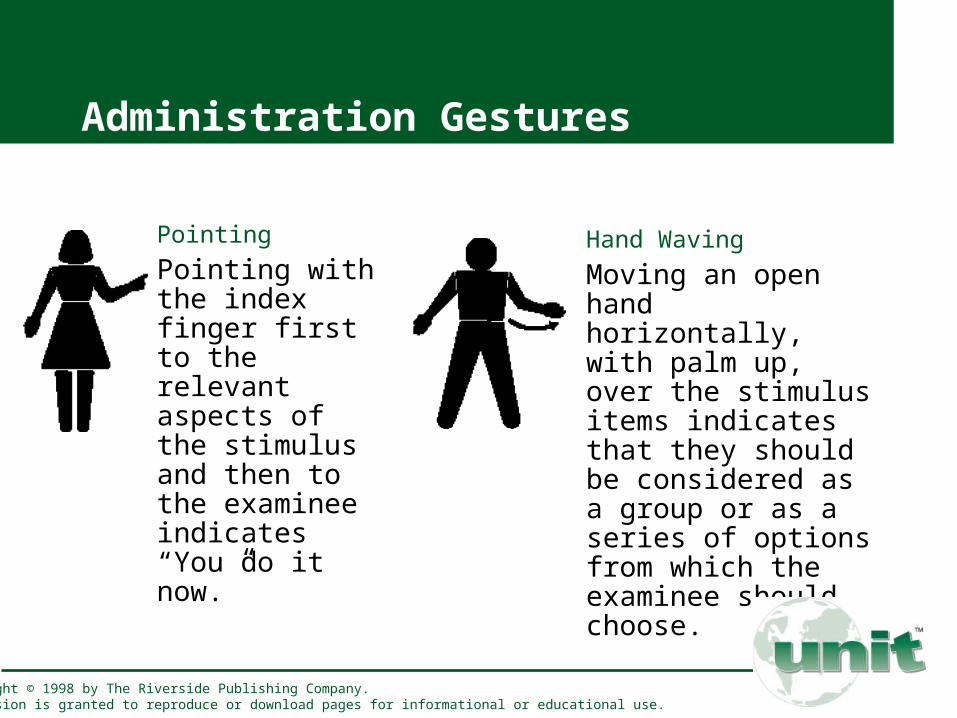
Pointing
Pointing with the index finger first to the relevant aspects of the stimulus and then to the examinee indicates “You do it now.”
Hand Waving
Moving an open hand horizontally, with palm up, over the stimulus items indicates that they should be considered as a group or as a series of options from which the examinee should choose.
Copyright © 1998 by The Riverside Publishing Company. Permission is granted to reproduce or download pages for informational or educational use.
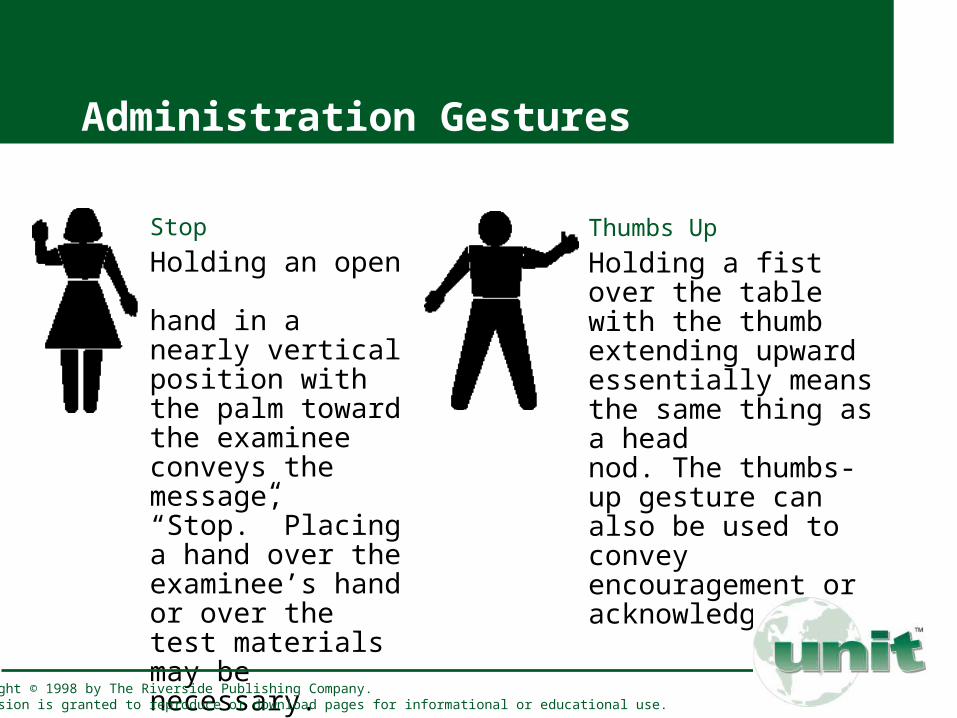
Administration Gestures
Stop
Holding an open hand in a nearly vertical position with the palm toward the examinee conveys the message, “Stop.” Placing a hand over the examinee’s hand or over the test materials may be necessary.
Thumbs Up
Holding a fist over the table with the thumb extending upward essentially means the same thing as a head nod. The thumbs-up gesture can also be used to convey encouragement or acknowledgment.
Copyright © 1998 by The Riverside Publishing Company. Permission is granted to reproduce or download pages for informational or educational use.
Teaching Procedures for Fair Administration
Demonstration Items
• Completed by the examiner to show the examinee how to approach each item type
Sample Items
• Completed by the examinee to demonstrate that he or she understands the problem; corrective feedback by the examiner is allowed
Checkpoint Items
• Scored items completed by the examinee that allow the examiner to provide feedback about incorrect responses
Copyright © 1998 by The Riverside Publishing Company. Permission is granted to reproduce or download pages for informational or educational use.
UNIT Standardization and Technical Properties
Standardization Sample Reliability Studies
• Internal Consistency
• Reliabilities at Decision-Making Points
• Test-Retest Stability
Floors, Ceilings, and Difficulty Gradients Validity Studies
Copyright © 1998 by The Riverside Publishing Company. Permission is granted to reproduce or download pages for informational or educational use.
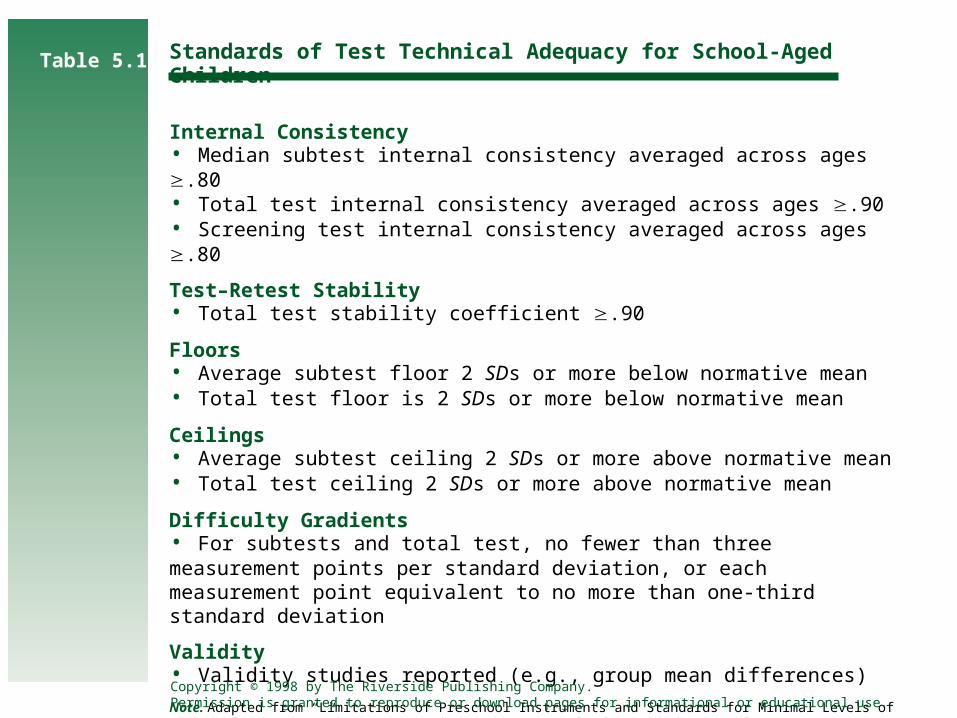
Standards of Test Technical Adequacy for School-Aged Children
Internal Consistency• Median subtest internal consistency averaged across ages .80• Total test internal consistency averaged across ages .90• Screening test internal consistency averaged across ages .80
Test–Retest Stability• Total test stability coefficient .90
Floors• Average subtest floor 2 SDs or more below normative mean• Total test floor is 2 SDs or more below normative mean
Ceilings• Average subtest ceiling 2 SDs or more above normative mean• Total test ceiling 2 SDs or more above normative mean
Difficulty Gradients• For subtests and total test, no fewer than three measurement points per standard deviation, or each measurement point equivalent to no more than one-third standard deviation
Validity• Validity studies reported (e.g., group mean differences)
Note. Adapted from “Limitations of Preschool Instruments and Standards for Minimal Levels of Technical Adequacy,” by B. A. Bracken, 1987, Journal of Psychoeducational Assessment, 5, pp. 313–326. Copyright 1987 by the Journal of Psychoeducational Assessment.
Table 5.1
Copyright © 1998 by The Riverside Publishing Company. Permission is granted to reproduce or download pages for informational or educational use.
UNIT Standardization Sample
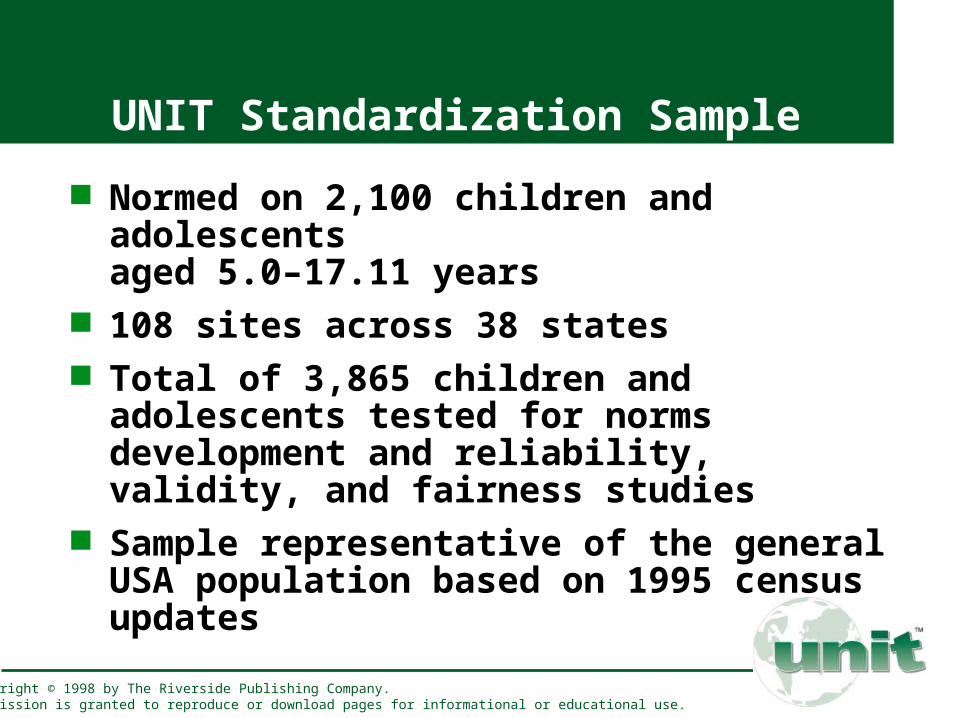
Normed on 2,100 children and adolescents aged 5.0–17.11 years
108 sites across 38 states Total of 3,865 children and adolescents tested for
norms development and reliability, validity, and fairness studies
Sample representative of the general USA population based on 1995 census updates
Copyright © 1998 by The Riverside Publishing Company. Permission is granted to reproduce or download pages for informational or educational use.
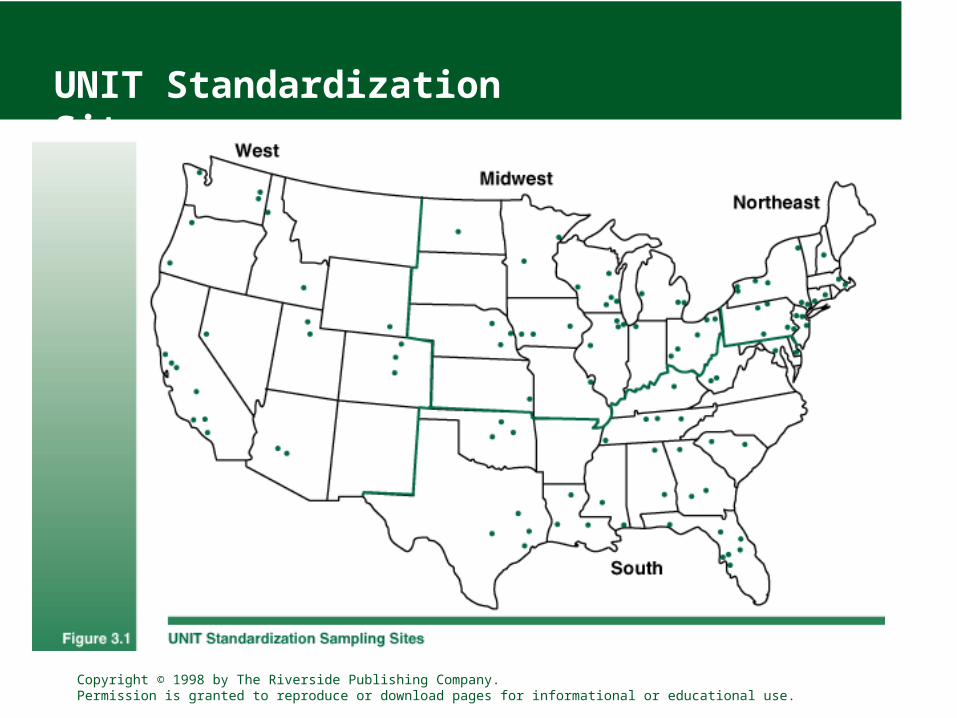
UNIT Standardization Sites
Copyright © 1998 by The Riverside Publishing Company. Permission is granted to reproduce or download pages for informational or educational use.
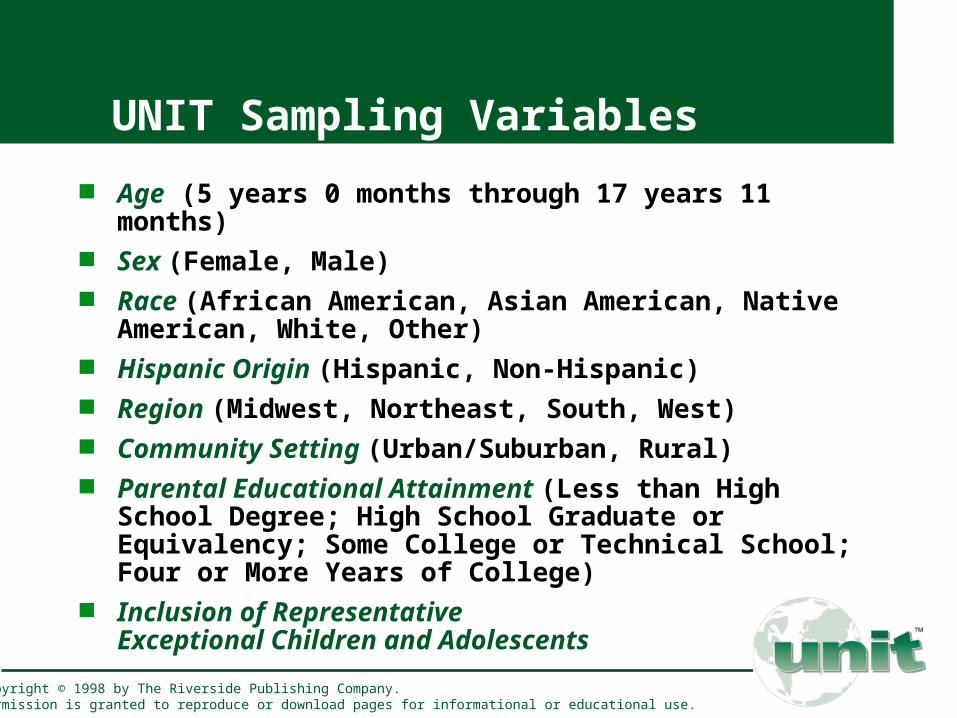
UNIT Sampling Variables
Age (5 years 0 months through 17 years 11 months) Sex (Female, Male) Race (African American, Asian American, Native American,
White, Other) Hispanic Origin (Hispanic, Non-Hispanic) Region (Midwest, Northeast, South, West) Community Setting (Urban/Suburban, Rural) Parental Educational Attainment (Less than High School
Degree; High School Graduate or Equivalency; Some College or Technical School; Four or More Years of College)
Inclusion of Representative Exceptional Children and Adolescents
Copyright © 1998 by The Riverside Publishing Company. Permission is granted to reproduce or download pages for informational or educational use.
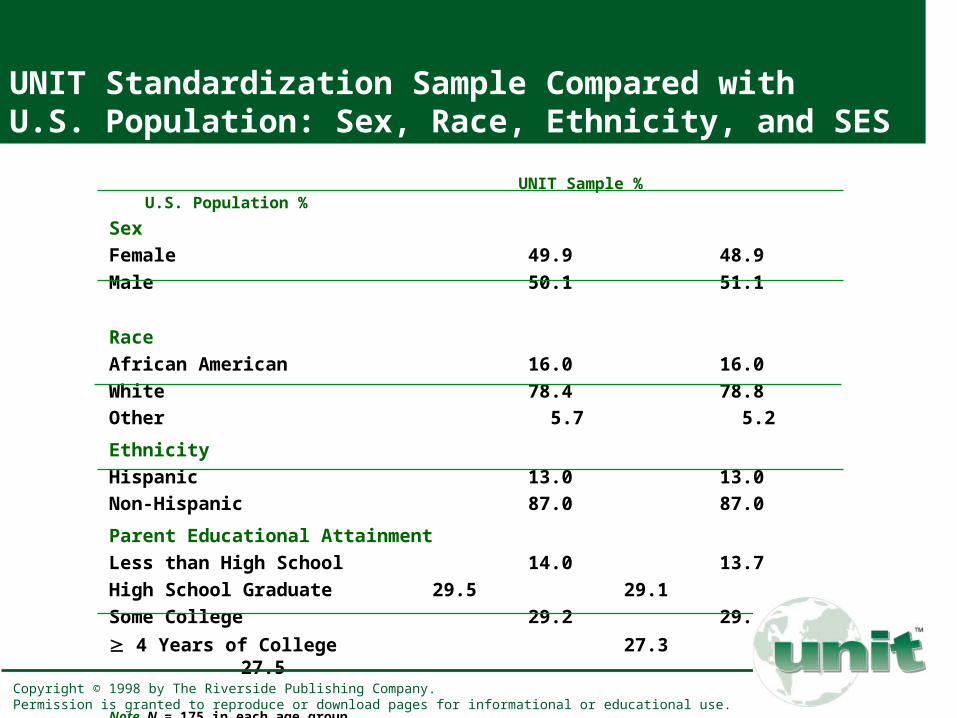
UNIT Standardization Sample Compared with U.S. Population: Sex, Race, Ethnicity, and SES
UNIT Sample % U.S. Population %
Sex
Female 49.9 48.9
Male 50.1 51.1
Race
African American 16.0 16.0
White 78.4 78.8
Other 5.7 5.2
Ethnicity
Hispanic 13.0 13.0
Non-Hispanic 87.0 87.0
Parent Educational Attainment
Less than High School 14.0 13.7
High School Graduate 29.5 29.1
Some College 29.2 29.7
4 Years of College 27.3 27.5
Note. N = 175 in each age group.Copyright © 1998 by The Riverside Publishing Company. Permission is granted to reproduce or download pages for informational or educational use.
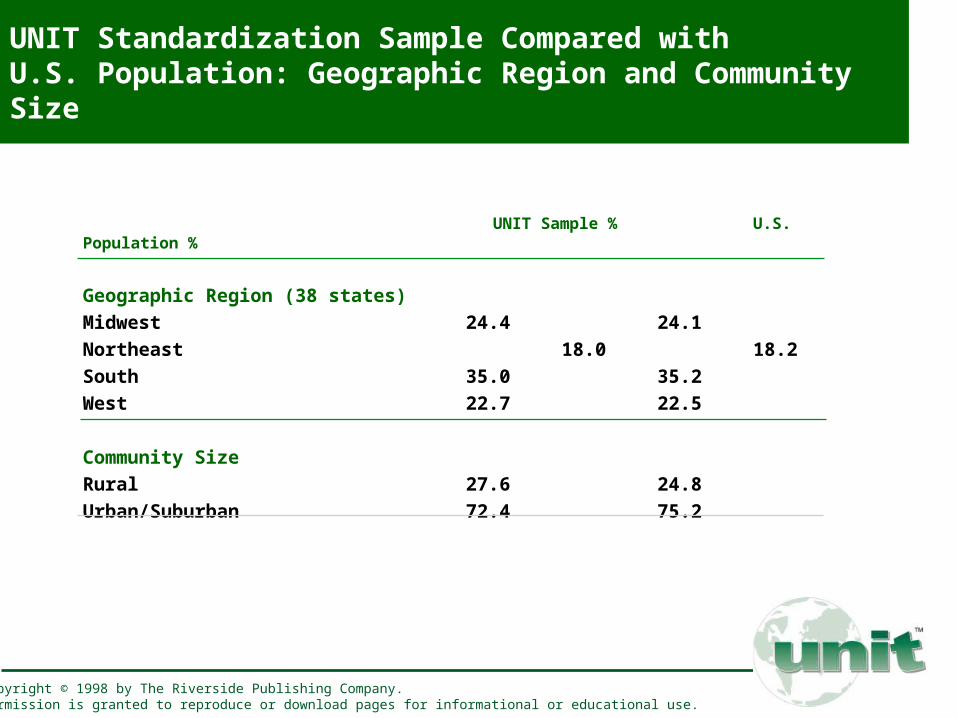
UNIT Standardization Sample Compared with U.S. Population: Geographic Region and Community Size
UNIT Sample % U.S. Population %
Geographic Region (38 states)
Midwest 24.4 24.1
Northeast 18.0 18.2
South 35.0 35.2
West 22.7 22.5
Community Size
Rural 27.6 24.8
Urban/Suburban 72.4 75.2
Copyright © 1998 by The Riverside Publishing Company. Permission is granted to reproduce or download pages for informational or educational use.
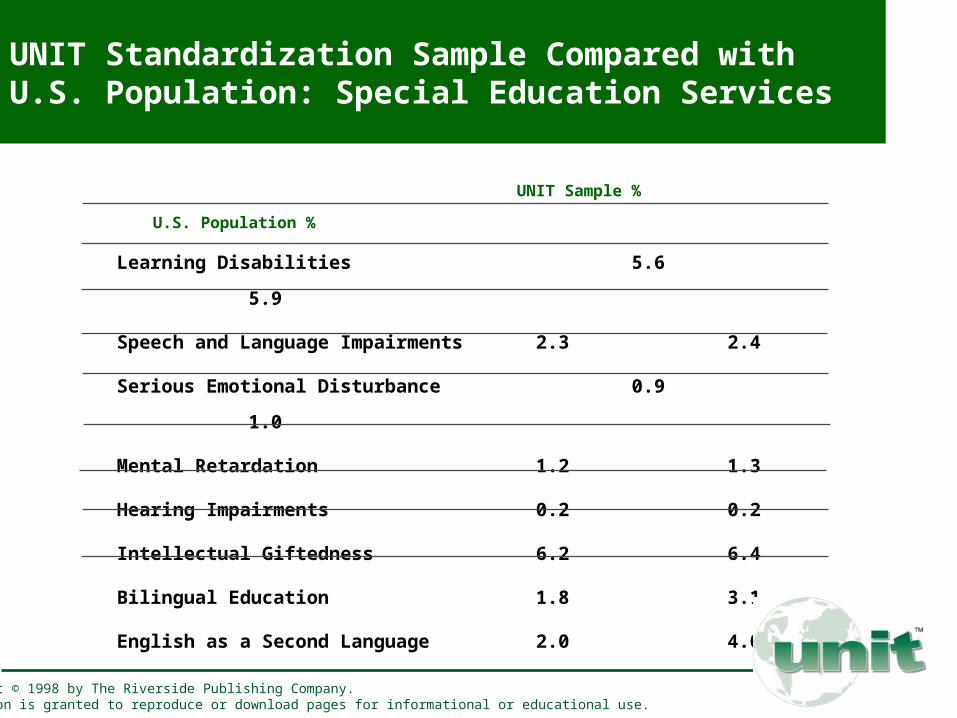
UNIT Standardization Sample Compared with U.S. Population: Special Education Services
UNIT Sample % U.S. Population %
Learning Disabilities 5.6 5.9
Speech and Language Impairments 2.3 2.4
Serious Emotional Disturbance 0.9 1.0
Mental Retardation 1.2 1.3
Hearing Impairments 0.2 0.2
Intellectual Giftedness 6.2 6.4
Bilingual Education 1.8 3.1
English as a Second Language 2.0 4.0
Copyright © 1998 by The Riverside Publishing Company. Permission is granted to reproduce or download pages for informational or educational use.
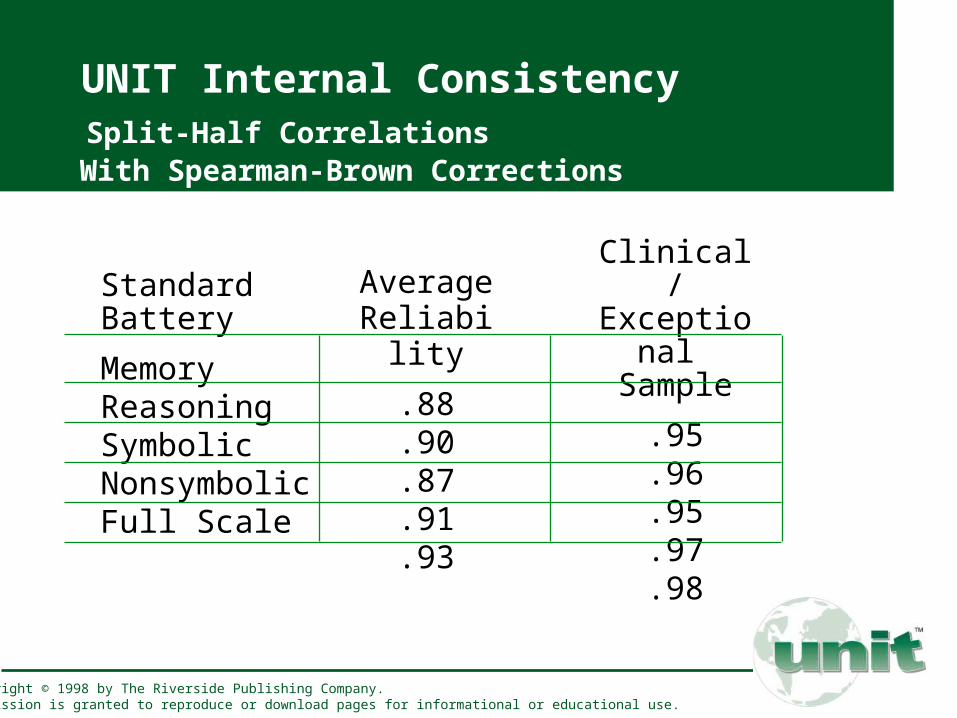
UNIT Internal Consistency Split-Half Correlations With Spearman-Brown Corrections
Standard Battery
MemoryReasoningSymbolicNonsymbolicFull Scale
AverageReliabilit
y
.88
.90
.87
.91
.93
Clinical/Exception
al Sample
.95
.96
.95
.97
.98
Copyright © 1998 by The Riverside Publishing Company. Permission is granted to reproduce or download pages for informational or educational use.
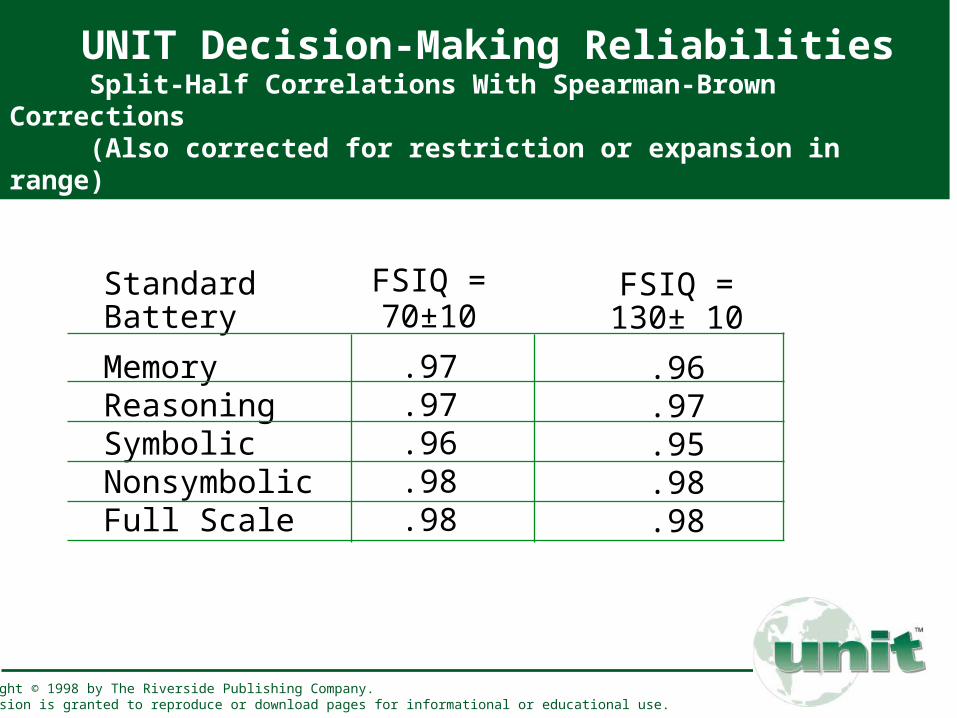
UNIT Decision-Making Reliabilities Split-Half Correlations With Spearman-Brown Corrections (Also corrected for restriction or expansion in range)
Standard Battery
MemoryReasoningSymbolicNonsymbolicFull Scale
FSIQ = 70±10
.97
.97
.96
.98
.98
FSIQ = 130± 10
.96
.97
.95
.98
.98
Copyright © 1998 by The Riverside Publishing Company. Permission is granted to reproduce or download pages for informational or educational use.
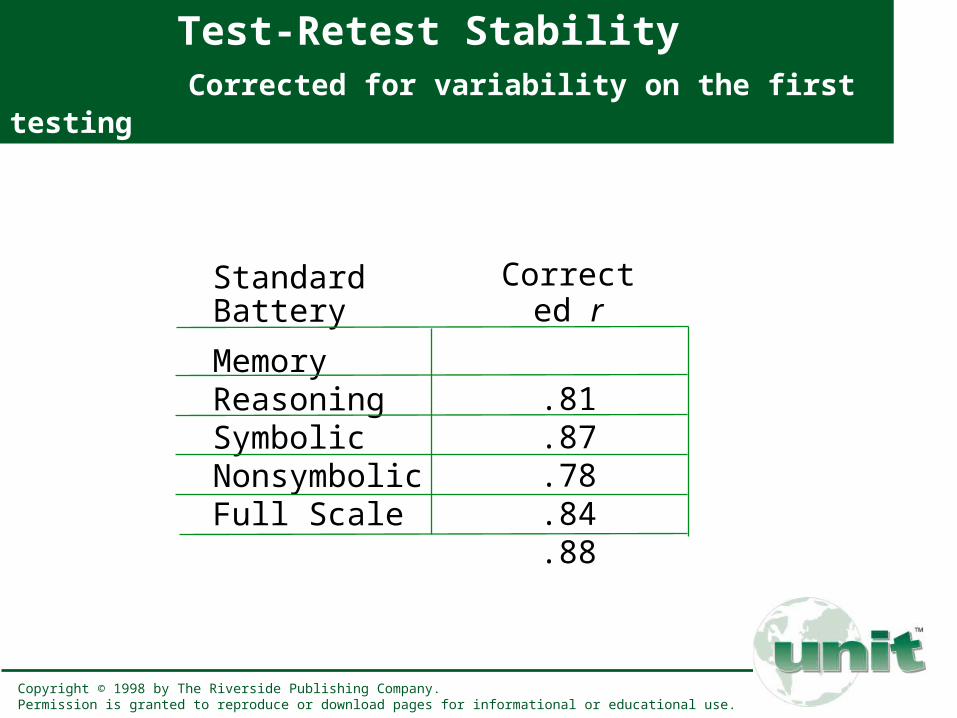
Test-Retest Stability Corrected for variability on the first testing
Standard Battery
MemoryReasoningSymbolicNonsymbolicFull Scale
Corrected r
.81
.87
.78
.84
.88
Copyright © 1998 by The Riverside Publishing Company. Permission is granted to reproduce or download pages for informational or educational use.
UNIT Floors and Ceilings
Floors: A term describing the extent to which there are a sufficient number of easy items to distinguish between examinees of delayed to very delayed ability
Ceilings: A term describing the extent to which there are a sufficient number of difficult items to distinguish between examinees of superior and very superior ability
Copyright © 1998 by The Riverside Publishing Company. Permission is granted to reproduce or download pages for informational or educational use.
UNIT Floors and Ceilings
Floors: UNIT subtests have very good to excellent floors for low ability examinees across the entire age range, with the exception of the Abbreviated Battery at the youngest ages
Ceilings: UNIT subtests have consistently excellent ceilings, even for the oldest and highest ability examinees
Copyright © 1998 by The Riverside Publishing Company. Permission is granted to reproduce or download pages for informational or educational use.

UNIT Item Difficulty Gradients
Difficulty Gradients: A term describing the steepness of the gradations in item difficulty. An increase or decrease in a single raw score point should not result in a standard score change of more than one-third SD
UNIT Difficulty Gradients: Average item gradients for UNIT subtests equal or exceed standards for every age level, indicating UNIT’s sensitivity to subtle differences in ability levels (with the exception of one subtest at the earliest ages)
Copyright © 1998 by The Riverside Publishing Company. Permission is granted to reproduce or download pages for informational or educational use.
UNIT Internal Validity Studies
Evidence of Content Validity Structural Evidence of Validity
• Development and Growth Curves
• Subtest Unidimensionality Studies
• Subtest and Scale Intercorrelation Studies
• Comparison among the three UNIT Batteries
• Factor Analytic Investigations• Exploratory Factor Analyses• Confirmatory Factor Analyses
Copyright © 1998 by The Riverside Publishing Company. Permission is granted to reproduce or download pages for informational or educational use.

0.00
10.00
20.00
30.00
40.00
50.00
60.00
70.00
5 6 7 8 9 10 11 12 13 14 15 16-17
Age in Years
Me
an S
ub
tes
t R
aw S
core
Symbolic Memory
Cube Design
Spatial Memory
Analogic Reasoning
Object Memory
Mazes
Age Progression of UNIT Subtests:Mean Raw Scores By Age
Copyright © 1998 by The Riverside Publishing Company. Permission is granted to reproduce or download pages for informational or educational use.
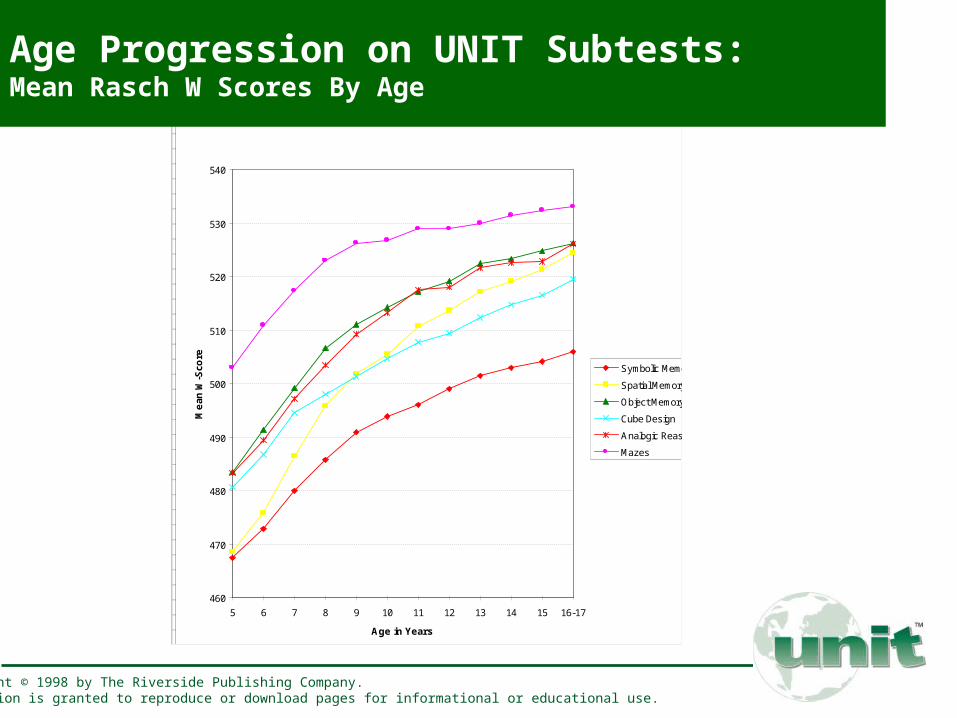
460
470
480
490
500
510
520
530
540
5 6 7 8 9 10 11 12 13 14 15 16-17
Age in Years
Me
an W
-Sco
re
Symbolic Memory
Spatial Memory
Object Memory
Cube Design
Analogic Reasoning
Mazes
Age Progression on UNIT Subtests:Mean Rasch W Scores By Age
Copyright © 1998 by The Riverside Publishing Company. Permission is granted to reproduce or download pages for informational or educational use.

475
480
485
490
495
500
505
510
515
520
5 6 7 8 9 10 11 12 13 14 15 16-17
Age in Years
Me
an W
-sco
res
460
470
480
490
500
510
520
530
540
5 6 7 8 9 10 11 12 13 14 15 16-17
Age in Years
Me
an W
-Sco
re
Symbolic Memory
Spatial Memory
Object Memory
Cube Design
Analogic Reasoning
Mazes
Age Progression of UNIT Standard Battery FSIQ:Mean Rasch W Score By Age
Copyright © 1998 by The Riverside Publishing Company. Permission is granted to reproduce or download pages for informational or educational use.
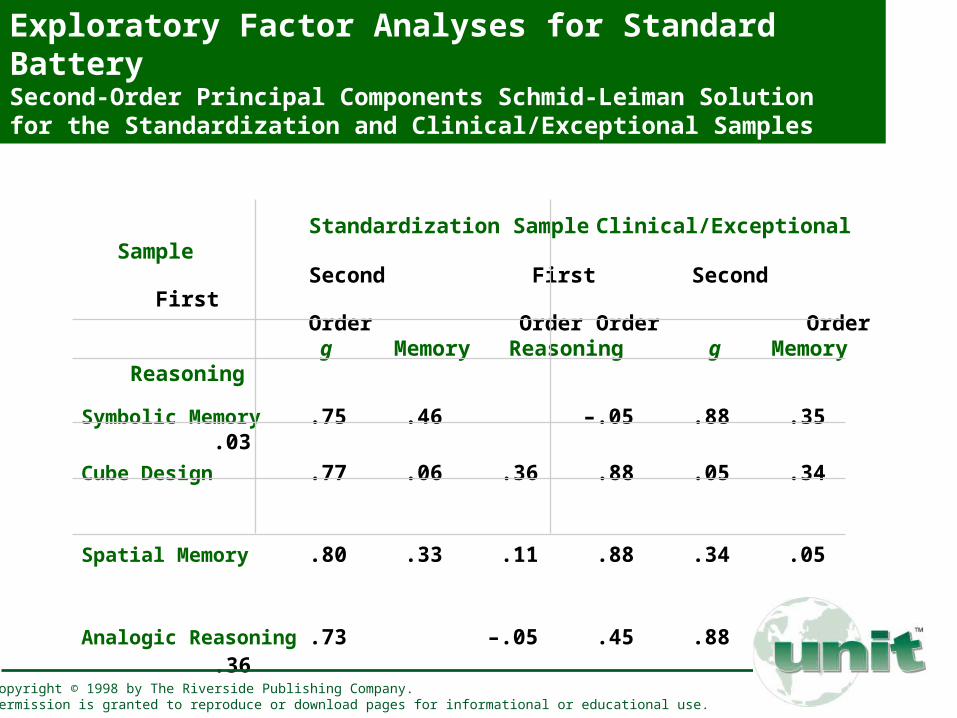
Exploratory Factor Analyses for Standard BatterySecond-Order Principal Components Schmid-Leiman Solution for the Standardization and Clinical/Exceptional Samples
Standardization Sample Clinical/Exceptional SampleSecond First Second First
Order Order Order Order g Memory Reasoning g Memory Reasoning
Symbolic Memory .75 .46 –.05 .88 .35 .03
Cube Design .77 .06 .36 .88 .05 .34
Spatial Memory .80 .33 .11 .88 .34 .05
Analogic Reasoning .73 –.05 .45 .88 .03 .36
Copyright © 1998 by The Riverside Publishing Company. Permission is granted to reproduce or download pages for informational or educational use.
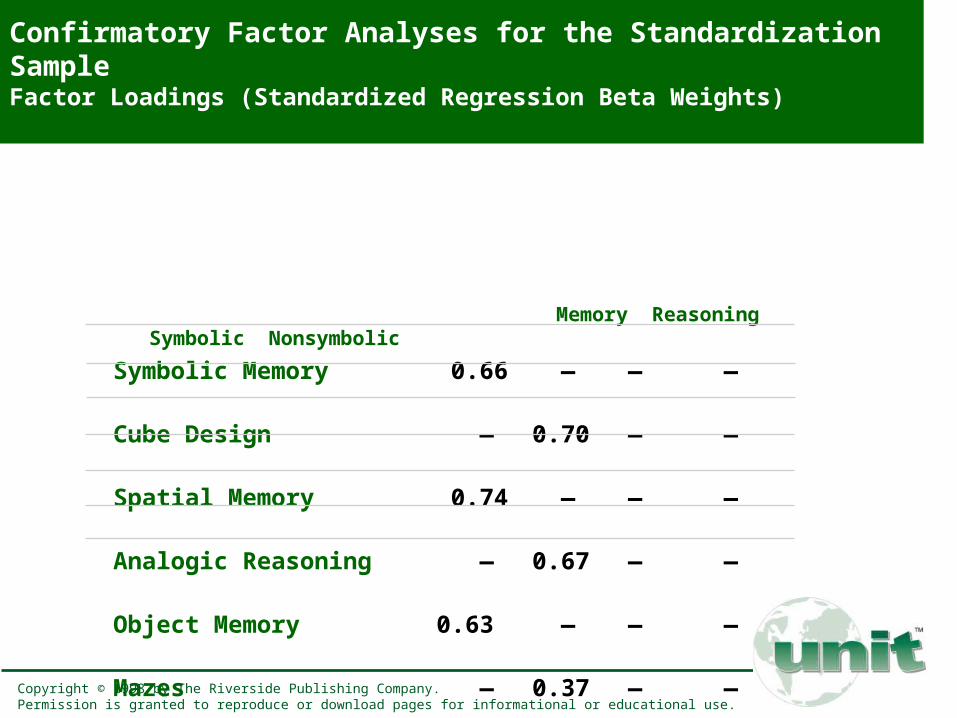
Confirmatory Factor Analyses for the Standardization Sample Factor Loadings (Standardized Regression Beta Weights)
Memory Reasoning Symbolic Nonsymbolic
Symbolic Memory 0.66 — — —
Cube Design — 0.70 — —
Spatial Memory 0.74 — — —
Analogic Reasoning — 0.67 — —
Object Memory 0.63 — — —
Mazes — 0.37 — —
Copyright © 1998 by The Riverside Publishing Company. Permission is granted to reproduce or download pages for informational or educational use.

Confirmatory Factor Analyses for the Standardization Sample Factor Loadings (Standardized Regression Beta Weights)
Memory Reasoning Symbolic Nonsymbolic
Symbolic Memory — — 0.66 —
Cube Design — — — 0.68
Spatial Memory — — — 0.75
Analogic Reasoning — — 0.65 —
Object Memory — — 0.63 —
Mazes — — — 0.36
Copyright © 1998 by The Riverside Publishing Company. Permission is granted to reproduce or download pages for informational or educational use.
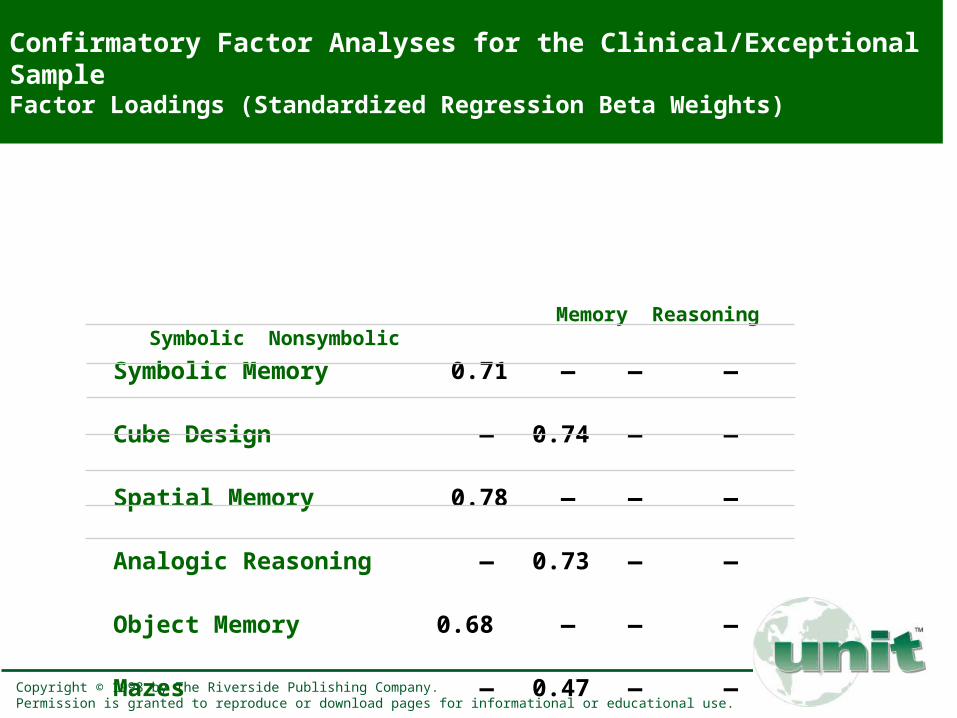
Confirmatory Factor Analyses for the Clinical/Exceptional SampleFactor Loadings (Standardized Regression Beta Weights)
Memory Reasoning Symbolic Nonsymbolic
Symbolic Memory 0.71 — — —
Cube Design — 0.74 — —
Spatial Memory 0.78 — — —
Analogic Reasoning — 0.73 — —
Object Memory 0.68 — — —
Mazes — 0.47 — —
Copyright © 1998 by The Riverside Publishing Company. Permission is granted to reproduce or download pages for informational or educational use.
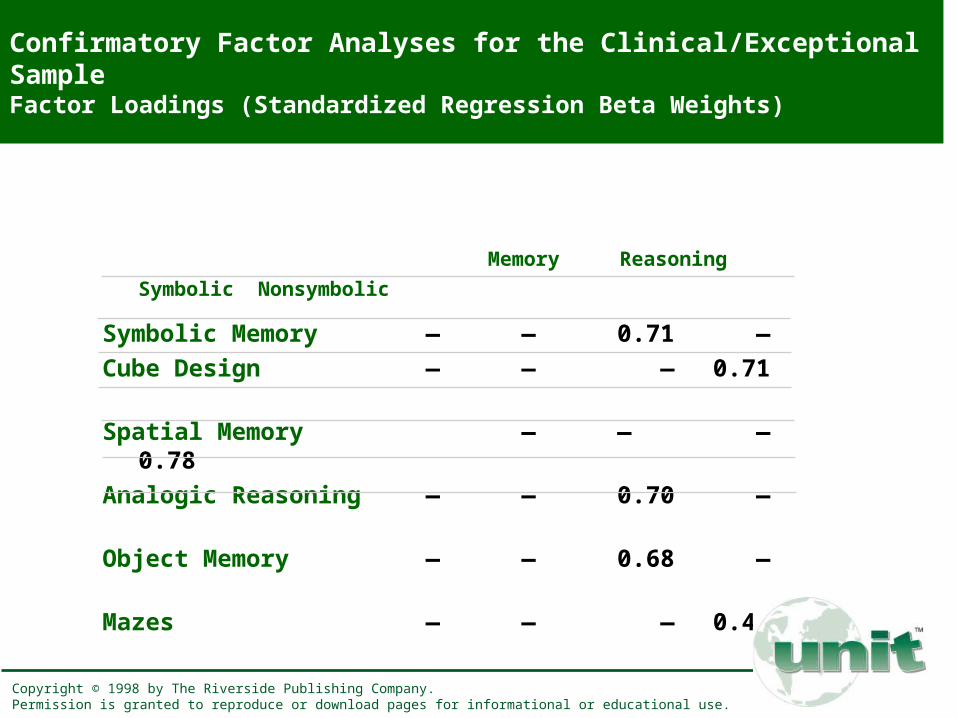
Confirmatory Factor Analyses for the Clinical/Exceptional SampleFactor Loadings (Standardized Regression Beta Weights)
Memory Reasoning Symbolic Nonsymbolic
Symbolic Memory — — 0.71 —
Cube Design — — — 0.71
Spatial Memory — — — 0.78
Analogic Reasoning — — 0.70 —
Object Memory — — 0.68 —
Mazes — — — 0.47
Copyright © 1998 by The Riverside Publishing Company. Permission is granted to reproduce or download pages for informational or educational use.

UNIT External Validity Studies
Correlational Studies• Measures of Intelligence
• Measures of Academic Achievement
Studies with Clinical and Exceptional Samples• Speech and Language Impairment (N = 57)
• Learning Disabilities (N = 205)
• Mental Retardation (N = 84)
• Intellectually Gifted (N = 160)
• Serious Emotional Disturbance (N = 23)
Copyright © 1998 by The Riverside Publishing Company. Permission is granted to reproduce or download pages for informational or educational use.

UNIT Standard FSIQ Correlations with Other IQs
WISC-III FSIQ across four samples (Learning Disabled, Mentally Retarded, Intellectually Gifted, and Native American).81–.84
WJ-R Tests of Cognitive Ability BCA (Est): .83
K-BIT IQ Composite: .82
Matrix Analogies Test Standard Score: .83
Raven’s Standard Progressive Matrices T-Score: .56
TONI-2 Quotient: .63Note: All correlations are corrected to control for restriction or expansion in range.
r
Copyright © 1998 by The Riverside Publishing Company. Permission is granted to reproduce or download pages for informational or educational use.
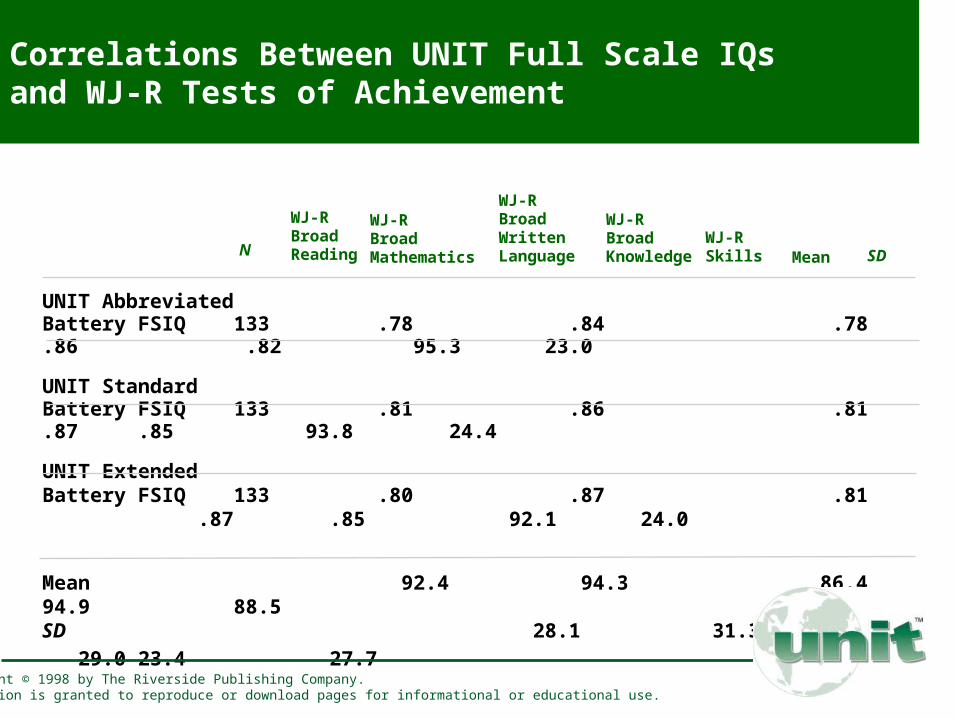
Correlations Between UNIT Full Scale IQs and WJ-R Tests of Achievement
UNIT Abbreviated Battery FSIQ 133 .78 .84 .78 .86 .82 95.3 23.0
UNIT Standard Battery FSIQ 133 .81 .86 .81 .87 .85 93.8 24.4
UNIT Extended Battery FSIQ 133 .80 .87 .81 .87 .85 92.1 24.0
Mean 92.4 94.3 86.4 94.9 88.5
SD 28.1 31.3 29.0 23.4 27.7
N
WJ-RBroadReading
WJ-RBroadMathematics
WJ-RSkills
WJ-RBroadWrittenLanguage
WJ-RBroadKnowledge Mean SD
Copyright © 1998 by The Riverside Publishing Company. Permission is granted to reproduce or download pages for informational or educational use.
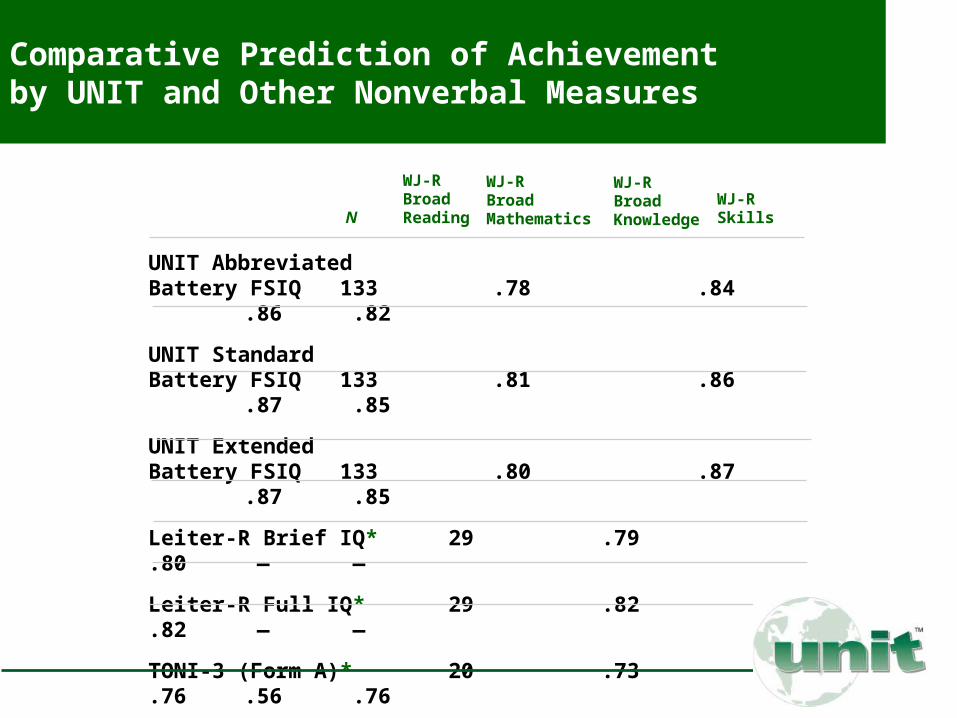
Comparative Prediction of Achievement by UNIT and Other Nonverbal Measures
UNIT Abbreviated Battery FSIQ 133 .78 .84 .86 .82
UNIT Standard Battery FSIQ 133 .81 .86 .87 .85
UNIT Extended Battery FSIQ 133 .80 .87 .87 .85
Leiter-R Brief IQ* 29 .79 .80 — —
Leiter-R Full IQ* 29 .82 .82 — —
TONI-3 (Form A)* 20 .73 .76 .56 .76
TONI-3 (Form B)* 20 .71 .74 .55 .70
*Note. These data come from each test's manual.
N
WJ-RBroadReading
WJ-RBroadMathematics
WJ-RBroadKnowledge
WJ-RSkills

UNIT Validity Studies: Diagnoses and Exceptionalities
Speech and Language Impairment (N = 57)
Learning Disabilities (N = 205)
Mental Retardation (N = 84)
Intellectually Gifted (N = 160)
Serious Emotional Disturbance (N = 23)
Copyright © 1998 by The Riverside Publishing Company. Permission is granted to reproduce or download pages for informational or educational use.
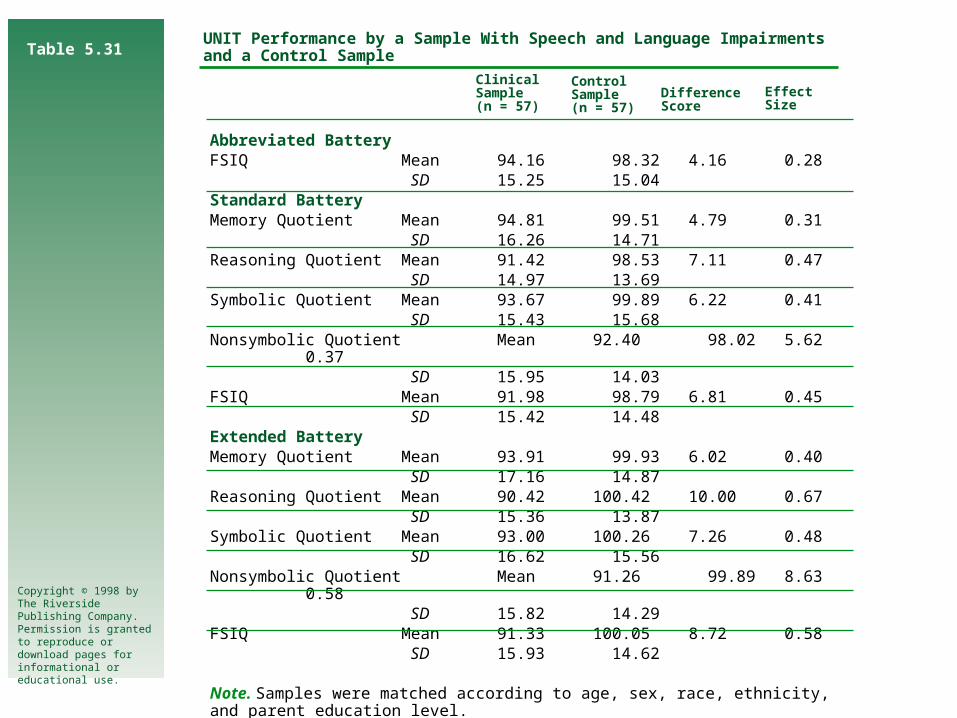
Table 5.31
Abbreviated BatteryFSIQ Mean 94.16 98.32 4.16 0.28
SD 15.25 15.04Standard BatteryMemory Quotient Mean 94.81 99.51 4.79 0.31
SD 16.26 14.71Reasoning Quotient Mean 91.42 98.53 7.11 0.47
SD 14.97 13.69Symbolic Quotient Mean 93.67 99.89 6.22 0.41
SD 15.43 15.68Nonsymbolic Quotient Mean 92.40 98.02 5.62 0.37
SD 15.95 14.03FSIQ Mean 91.98 98.79 6.81 0.45
SD 15.42 14.48Extended BatteryMemory Quotient Mean 93.91 99.93 6.02 0.40
SD 17.16 14.87Reasoning Quotient Mean 90.42 100.42 10.00 0.67
SD 15.36 13.87Symbolic Quotient Mean 93.00 100.26 7.26 0.48
SD 16.62 15.56Nonsymbolic Quotient Mean 91.26 99.89 8.63 0.58
SD 15.82 14.29FSIQ Mean 91.33 100.05 8.72 0.58
SD 15.93 14.62
Note. Samples were matched according to age, sex, race, ethnicity, and parent education level.
UNIT Performance by a Sample With Speech and Language Impairments and a Control Sample
ClinicalSample(n = 57)
Control Sample(n = 57)
DifferenceScore
Effect Size
Copyright © 1998 by The Riverside Publishing Company. Permission is granted to reproduce or download pages for informational or educational use.
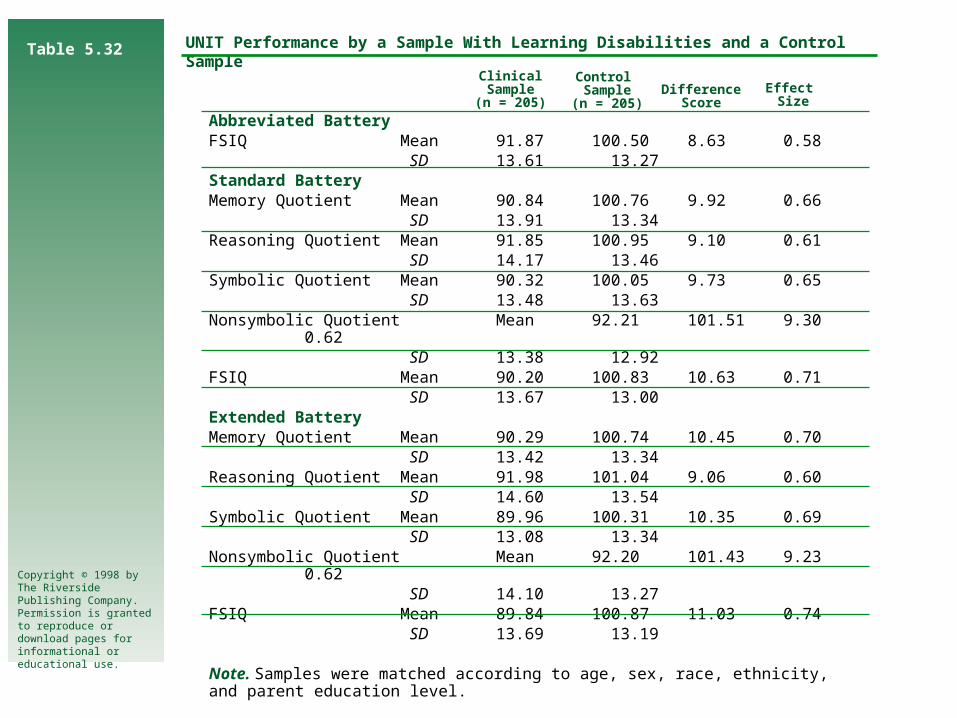
Table 5.32
Abbreviated BatteryFSIQ Mean 91.87 100.50 8.63 0.58
SD 13.61 13.27Standard BatteryMemory Quotient Mean 90.84 100.76 9.92 0.66
SD 13.91 13.34Reasoning Quotient Mean 91.85 100.95 9.10 0.61
SD 14.17 13.46Symbolic Quotient Mean 90.32 100.05 9.73 0.65
SD 13.48 13.63Nonsymbolic Quotient Mean 92.21 101.51 9.30 0.62
SD 13.38 12.92FSIQ Mean 90.20 100.83 10.63 0.71
SD 13.67 13.00Extended BatteryMemory Quotient Mean 90.29 100.74 10.45 0.70
SD 13.42 13.34Reasoning Quotient Mean 91.98 101.04 9.06 0.60
SD 14.60 13.54Symbolic Quotient Mean 89.96 100.31 10.35 0.69
SD 13.08 13.34Nonsymbolic Quotient Mean 92.20 101.43 9.23 0.62
SD 14.10 13.27FSIQ Mean 89.84 100.87 11.03 0.74
SD 13.69 13.19
Note. Samples were matched according to age, sex, race, ethnicity, and parent education level.
UNIT Performance by a Sample With Learning Disabilities and a Control Sample
ClinicalSample(n = 205)
Control Sample(n = 205)
DifferenceScore
Effect Size
Copyright © 1998 by The Riverside Publishing Company. Permission is granted to reproduce or download pages for informational or educational use.
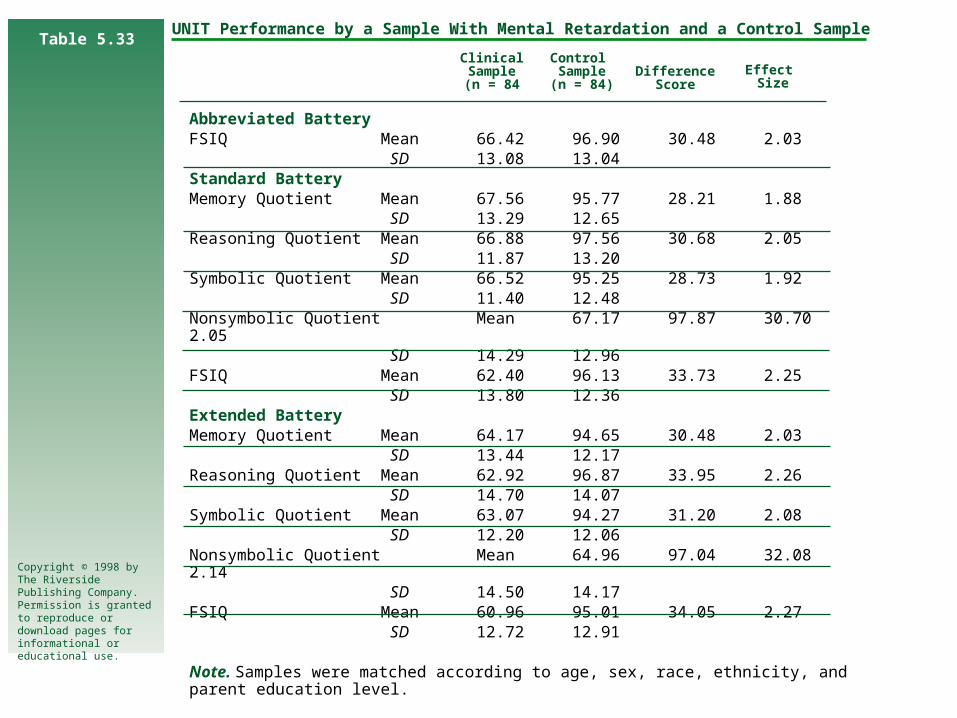
Table 5.33
Abbreviated BatteryFSIQ Mean 66.42 96.90 30.48 2.03
SD 13.08 13.04Standard BatteryMemory Quotient Mean 67.56 95.77 28.21 1.88
SD 13.29 12.65Reasoning Quotient Mean 66.88 97.56 30.68 2.05
SD 11.87 13.20Symbolic Quotient Mean 66.52 95.25 28.73 1.92
SD 11.40 12.48Nonsymbolic Quotient Mean 67.17 97.87 30.70 2.05
SD 14.29 12.96FSIQ Mean 62.40 96.13 33.73 2.25
SD 13.80 12.36Extended BatteryMemory Quotient Mean 64.17 94.65 30.48 2.03
SD 13.44 12.17Reasoning Quotient Mean 62.92 96.87 33.95 2.26
SD 14.70 14.07Symbolic Quotient Mean 63.07 94.27 31.20 2.08
SD 12.20 12.06Nonsymbolic Quotient Mean 64.96 97.04 32.08 2.14
SD 14.50 14.17FSIQ Mean 60.96 95.01 34.05 2.27
SD 12.72 12.91
Note. Samples were matched according to age, sex, race, ethnicity, and parent education level.
UNIT Performance by a Sample With Mental Retardation and a Control Sample
ClinicalSample(n = 84
Control Sample(n = 84)
DifferenceScore
Effect Size
Copyright © 1998 by The Riverside Publishing Company. Permission is granted to reproduce or download pages for informational or educational use.
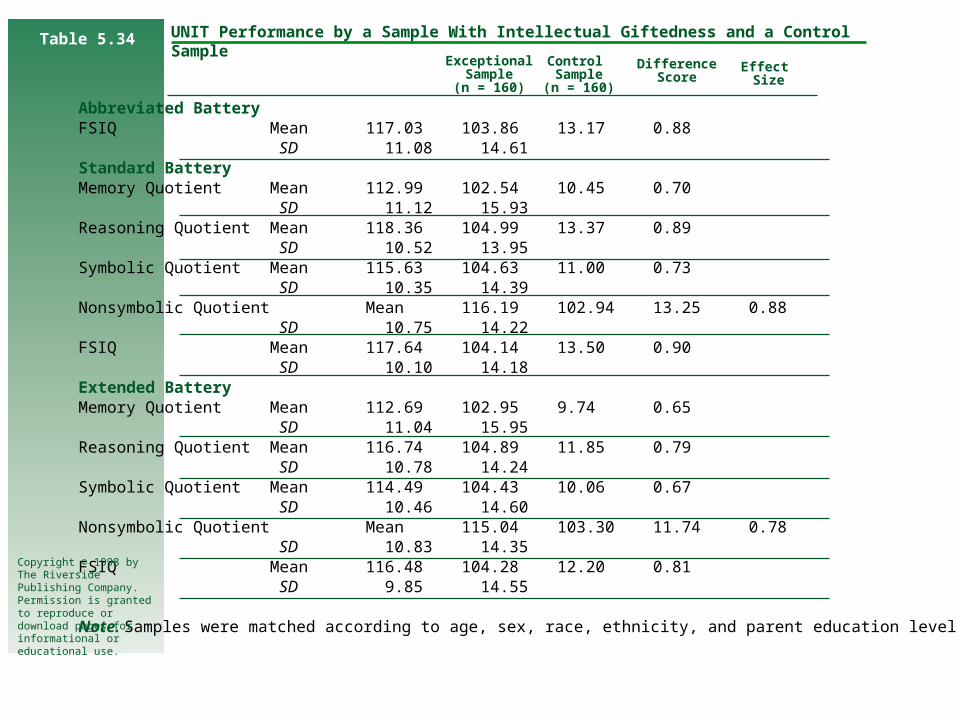
Table 5.34Control Sample(n = 160)
ExceptionalSample(n = 160)
DifferenceScore
Effect Size
Abbreviated BatteryFSIQ Mean 117.03 103.86 13.17 0.88
SD 11.08 14.61Standard BatteryMemory Quotient Mean 112.99 102.54 10.45 0.70
SD 11.12 15.93Reasoning Quotient Mean 118.36 104.99 13.37 0.89
SD 10.52 13.95Symbolic Quotient Mean 115.63 104.63 11.00 0.73
SD 10.35 14.39Nonsymbolic Quotient Mean 116.19 102.94 13.25 0.88
SD 10.75 14.22FSIQ Mean 117.64 104.14 13.50 0.90
SD 10.10 14.18Extended BatteryMemory Quotient Mean 112.69 102.95 9.74 0.65
SD 11.04 15.95Reasoning Quotient Mean 116.74 104.89 11.85 0.79
SD 10.78 14.24Symbolic Quotient Mean 114.49 104.43 10.06 0.67
SD 10.46 14.60Nonsymbolic Quotient Mean 115.04 103.30 11.74 0.78
SD 10.83 14.35FSIQ Mean 116.48 104.28 12.20 0.81
SD 9.85 14.55
Note. Samples were matched according to age, sex, race, ethnicity, and parent education level.
UNIT Performance by a Sample With Intellectual Giftedness and a Control Sample
Copyright © 1998 by The Riverside Publishing Company. Permission is granted to reproduce or download pages for informational or educational use.

Table 5.35 UNIT Performance by a Sample With Serious Emotional Disturbance and a Control Sample
Abbreviated BatteryFSIQ Mean 93.57 93.35 -0.22 0.01
SD 13.27 14.18Standard BatteryMemory Quotient Mean 94.57 95.52 0.95 0.06
SD 15.65 15.14Reasoning Quotient Mean 92.43 92.65 0.22 0.01
SD 13.03 14.24Symbolic Quotient Mean 93.48 94.87 1.39 0.09
SD 14.71 14.54Nonsymbolic Quotient Mean 93.43 92.96 -0.47 0.03
SD 12.91 13.70FSIQ Mean 92.65 93.09 0.44 0.03
SD 13.97 13.67Extended BatteryMemory Quotient Mean 95.09 95.65 0.56 0.04
SD 15.02 14.31Reasoning Quotient Mean 92.91 92.78 -0.13 0.01
SD 13.51 15.07Symbolic Quotient Mean 94.26 95.30 1.04 0.07
SD 14.90 14.04Nonsymbolic Quotient Mean 93.57 93.00 -0.57 0.04
SD 12.63 14.93FSIQ Mean 93.13 93.43 0.30 0.02
SD 14.24 14.18
Note. Samples were matched according to age, sex, race, ethnicity, and parent education level.
Control Sample(n = 23)
ClinicalSample(n = 23)
DifferenceScore
Effect Size
Copyright © 1998 by The Riverside Publishing Company. Permission is granted to reproduce or download pages for informational or educational use.
UNIT and Test Fairness
UNIT was designed to optimize fairness for individuals varying in age, sex, race, ethnicity, language, and nationality
UNIT was also designed to be fair for individuals with hearing impairment, language disabilities, and color-vision deficiencies
Copyright © 1998 by The Riverside Publishing Company. Permission is granted to reproduce or download pages for informational or educational use.

UNIT Fairness Features
UNIT’s underlying theoretical model has direct implications for fairness
Expert bias and sensitivity reviews of item and subtest content were conducted
UNIT’s instructional sets, task composition, and response modes were designed to reduce situational sources of test bias
Copyright © 1998 by The Riverside Publishing Company. Permission is granted to reproduce or download pages for informational or educational use.
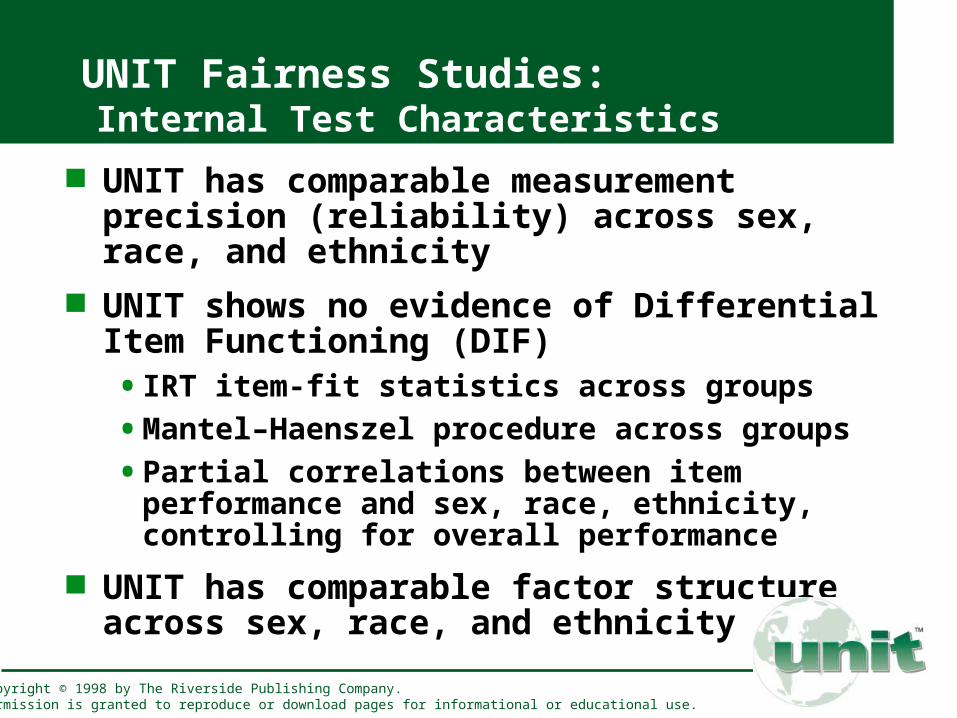
UNIT Fairness Studies: Internal Test Characteristics
UNIT has comparable measurement precision (reliability) across sex, race, and ethnicity
UNIT shows no evidence of Differential Item Functioning (DIF)• IRT item-fit statistics across groups
• Mantel–Haenszel procedure across groups
• Partial correlations between item performance and sex, race, ethnicity, controlling for overall performance
UNIT has comparable factor structure across sex, race, and ethnicity
Copyright © 1998 by The Riverside Publishing Company. Permission is granted to reproduce or download pages for informational or educational use.

UNIT Fairness Studies: External Criterion Analyses
The UNIT manual contains eight comparative studies of group mean performances, including fairness studies by sex, race, ethnicity, and language.
UNIT has established fairness in the prediction of an external variable, academic achievement. Prediction from UNIT of performance on the WJ-R Tests of Achievement was similar for females and males, and African Americans and Whites.
Copyright © 1998 by The Riverside Publishing Company. Permission is granted to reproduce or download pages for informational or educational use.
UNIT Fairness Studies: Comparisons of Group Mean Performances
Females and Males Ecuadorians Hispanics African Americans Asian Americans/Pacific Islanders Native Americans Individuals in Bilingual and ESL Classrooms Individuals who are Deaf/Hearing-Impaired
Copyright © 1998 by The Riverside Publishing Company. Permission is granted to reproduce or download pages for informational or educational use.
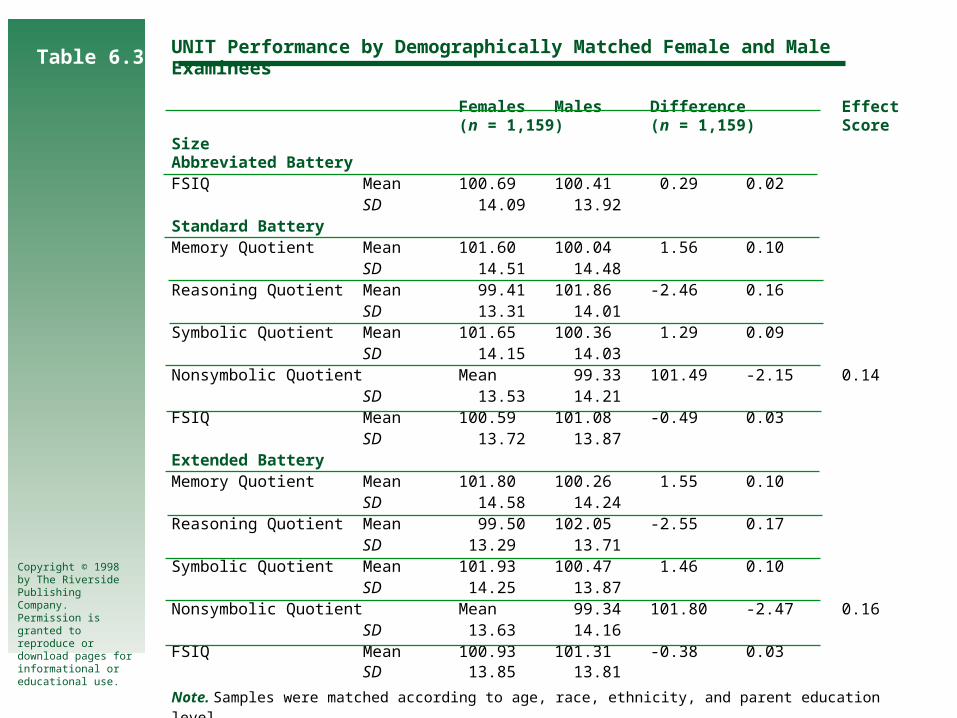
Table 6.3 UNIT Performance by Demographically Matched Female and Male Examinees
Females Males Difference Effect(n = 1,159) (n = 1,159) Score
SizeAbbreviated BatteryFSIQ Mean 100.69 100.41 0.29 0.02
SD 14.09 13.92Standard BatteryMemory Quotient Mean 101.60 100.04 1.56 0.10
SD 14.51 14.48Reasoning Quotient Mean 99.41 101.86 -2.46 0.16
SD 13.31 14.01Symbolic Quotient Mean 101.65 100.36 1.29 0.09
SD 14.15 14.03Nonsymbolic Quotient Mean 99.33 101.49 -2.15 0.14
SD 13.53 14.21FSIQ Mean 100.59 101.08 -0.49 0.03
SD 13.72 13.87Extended BatteryMemory Quotient Mean 101.80 100.26 1.55 0.10
SD 14.58 14.24Reasoning Quotient Mean 99.50 102.05 -2.55 0.17
SD 13.29 13.71Symbolic Quotient Mean 101.93 100.47 1.46 0.10
SD 14.25 13.87Nonsymbolic Quotient Mean 99.34 101.80 -2.47 0.16
SD 13.63 14.16FSIQ Mean 100.93 101.31 -0.38 0.03
SD 13.85 13.81
Note. Samples were matched according to age, race, ethnicity, and parent education level.
Copyright © 1998 by The Riverside Publishing Company. Permission is granted to reproduce or download pages for informational or educational use.
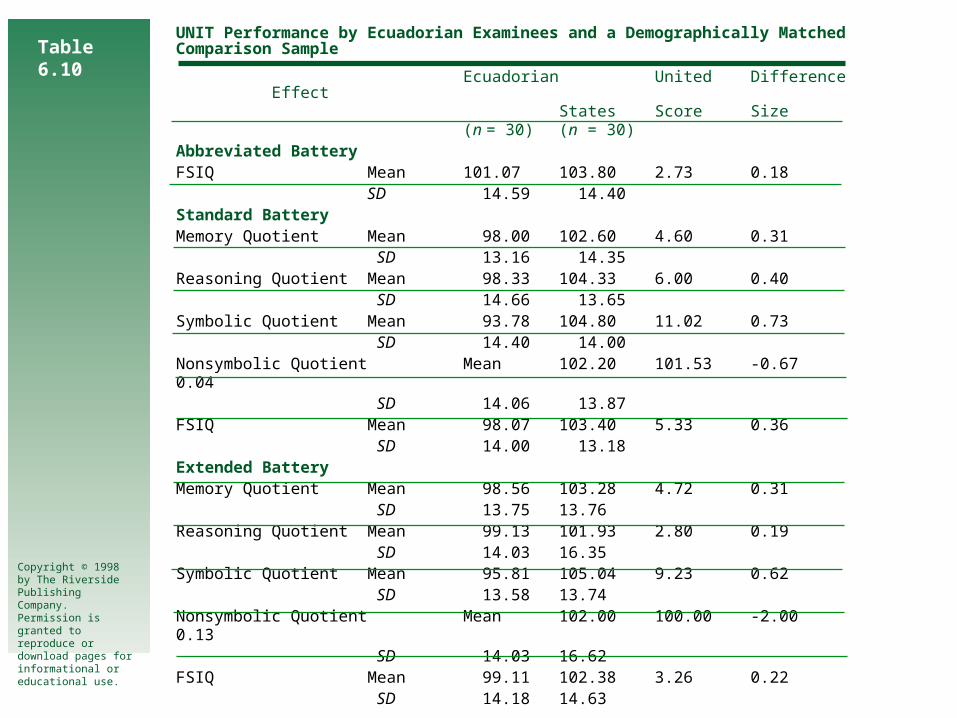
Table 6.10
UNIT Performance by Ecuadorian Examinees and a Demographically Matched Comparison Sample
Ecuadorian United Difference EffectStates Score Size
(n = 30) (n = 30)Abbreviated BatteryFSIQ Mean 101.07 103.80 2.73 0.18
SD 14.59 14.40Standard BatteryMemory Quotient Mean 98.00 102.60 4.60 0.31
SD 13.16 14.35Reasoning Quotient Mean 98.33 104.33 6.00 0.40
SD 14.66 13.65Symbolic Quotient Mean 93.78 104.80 11.02 0.73
SD 14.40 14.00Nonsymbolic Quotient Mean 102.20 101.53 -0.67 0.04
SD 14.06 13.87FSIQ Mean 98.07 103.40 5.33 0.36
SD 14.00 13.18Extended BatteryMemory Quotient Mean 98.56 103.28 4.72 0.31
SD 13.75 13.76Reasoning Quotient Mean 99.13 101.93 2.80 0.19
SD 14.03 16.35Symbolic Quotient Mean 95.81 105.04 9.23 0.62
SD 13.58 13.74Nonsymbolic Quotient Mean 102.00 100.00 -2.00 0.13
SD 14.03 16.62FSIQ Mean 99.11 102.38 3.26 0.22
SD 14.18 14.63
Note. Samples were matched according to age, sex, and parent education level.
Copyright © 1998 by The Riverside Publishing Company. Permission is granted to reproduce or download pages for informational or educational use.
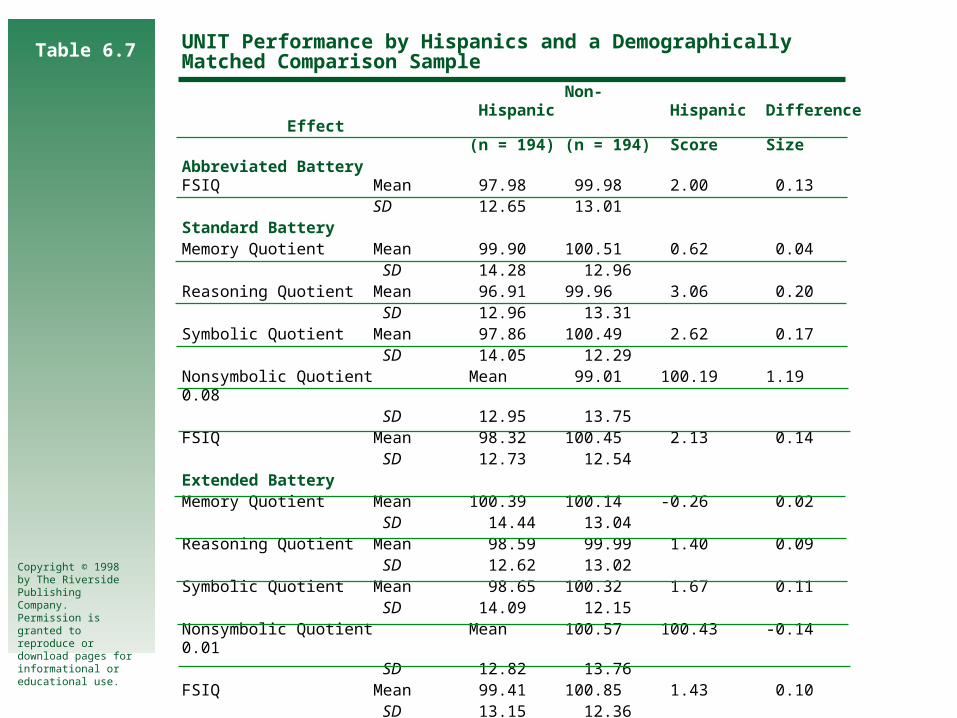
Table 6.7 UNIT Performance by Hispanics and a Demographically Matched Comparison Sample
Non- Hispanic Hispanic Difference
Effect (n = 194) (n = 194) Score Size
Abbreviated BatteryFSIQ Mean 97.98 99.98 2.00 0.13
SD 12.65 13.01Standard BatteryMemory Quotient Mean 99.90 100.51 0.62 0.04
SD 14.28 12.96Reasoning Quotient Mean 96.91 99.96 3.06 0.20
SD 12.96 13.31Symbolic Quotient Mean 97.86 100.49 2.62 0.17
SD 14.05 12.29Nonsymbolic Quotient Mean 99.01 100.19 1.19 0.08
SD 12.95 13.75FSIQ Mean 98.32 100.45 2.13 0.14
SD 12.73 12.54Extended BatteryMemory Quotient Mean 100.39 100.14 -0.26 0.02
SD 14.44 13.04Reasoning Quotient Mean 98.59 99.99 1.40 0.09
SD 12.62 13.02Symbolic Quotient Mean 98.65 100.32 1.67 0.11
SD 14.09 12.15Nonsymbolic Quotient Mean 100.57 100.43 -0.14 0.01
SD 12.82 13.76FSIQ Mean 99.41 100.85 1.43 0.10
SD 13.15 12.36
Note. Samples were matched according to age, sex, and parent education level.
Copyright © 1998 by The Riverside Publishing Company. Permission is granted to reproduce or download pages for informational or educational use.
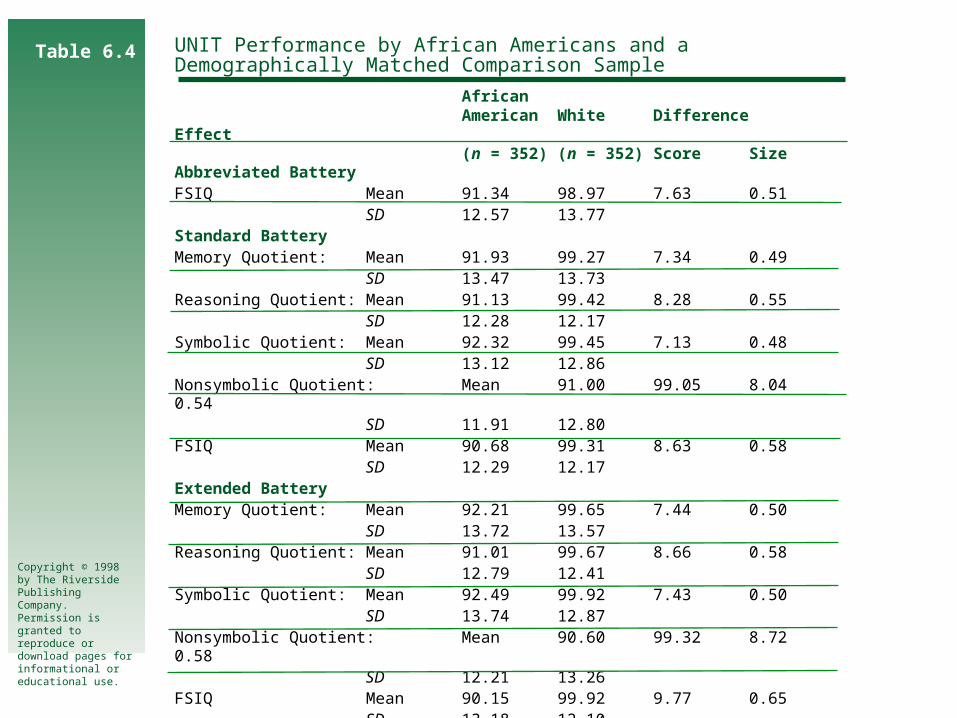
UNIT Performance by African Americans and a Demographically Matched Comparison Sample
African American White Difference Effect(n = 352) (n = 352) Score Size
Abbreviated BatteryFSIQ Mean 91.34 98.97 7.63 0.51
SD 12.57 13.77Standard BatteryMemory Quotient: Mean 91.93 99.27 7.34 0.49
SD 13.47 13.73Reasoning Quotient: Mean 91.13 99.42 8.28 0.55
SD 12.28 12.17Symbolic Quotient: Mean 92.32 99.45 7.13 0.48
SD 13.12 12.86Nonsymbolic Quotient: Mean 91.00 99.05 8.04 0.54
SD 11.91 12.80FSIQ Mean 90.68 99.31 8.63 0.58
SD 12.29 12.17Extended BatteryMemory Quotient: Mean 92.21 99.65 7.44 0.50
SD 13.72 13.57Reasoning Quotient: Mean 91.01 99.67 8.66 0.58
SD 12.79 12.41Symbolic Quotient: Mean 92.49 99.92 7.43 0.50
SD 13.74 12.87Nonsymbolic Quotient: Mean 90.60 99.32 8.72 0.58
SD 12.21 13.26FSIQ Mean 90.15 99.92 9.77 0.65
SD 13.18 12.10
Note. Samples were matched according to age, sex, ethnicity, and parent education level .
Table 6.4
Copyright © 1998 by The Riverside Publishing Company. Permission is granted to reproduce or download pages for informational or educational use.
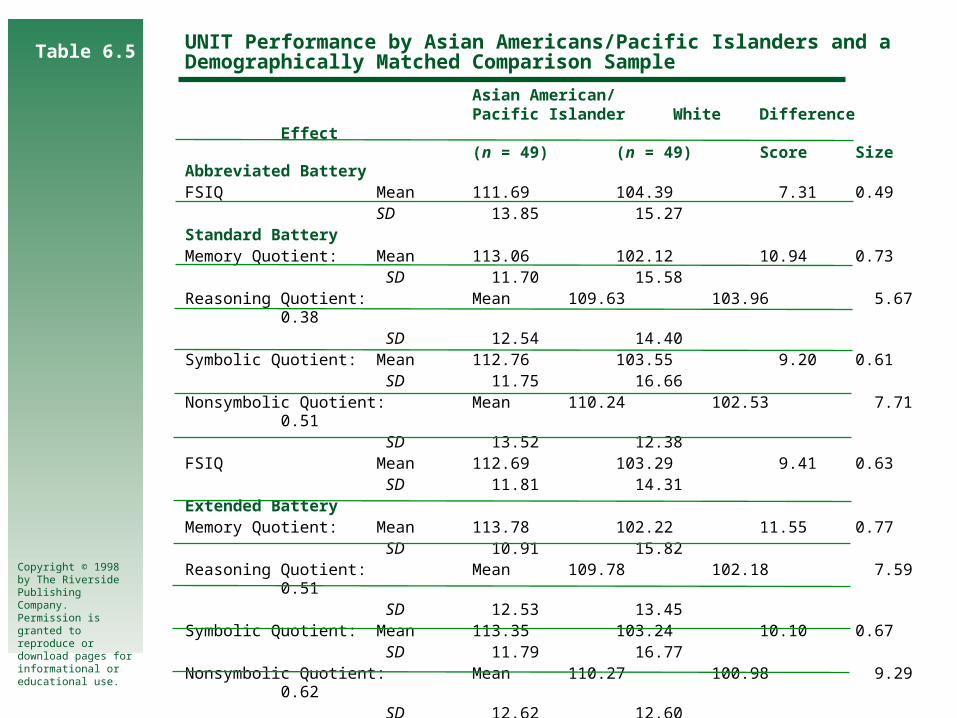
UNIT Performance by Asian Americans/Pacific Islanders and a Demographically Matched Comparison Sample
Asian American/Pacific Islander White Difference Effect(n = 49) (n = 49) Score Size
Abbreviated BatteryFSIQ Mean 111.69 104.39 7.31 0.49
SD 13.85 15.27Standard BatteryMemory Quotient: Mean 113.06 102.12 10.94 0.73
SD 11.70 15.58Reasoning Quotient: Mean 109.63 103.96 5.67 0.38
SD 12.54 14.40Symbolic Quotient: Mean 112.76 103.55 9.20 0.61
SD 11.75 16.66Nonsymbolic Quotient: Mean 110.24 102.53 7.71 0.51
SD 13.52 12.38FSIQ Mean 112.69 103.29 9.41 0.63
SD 11.81 14.31Extended BatteryMemory Quotient: Mean 113.78 102.22 11.55 0.77
SD 10.91 15.82Reasoning Quotient: Mean 109.78 102.18 7.59 0.51
SD 12.53 13.45Symbolic Quotient: Mean 113.35 103.24 10.10 0.67
SD 11.79 16.77Nonsymbolic Quotient: Mean 110.27 100.98 9.29 0.62
SD 12.62 12.60FSIQ Mean 113.18 102.22 10.96 0.73
SD 11.06 14.19Note. Samples were matched according to age, sex, and parent education level.
Table 6.5
Copyright © 1998 by The Riverside Publishing Company. Permission is granted to reproduce or download pages for informational or educational use.
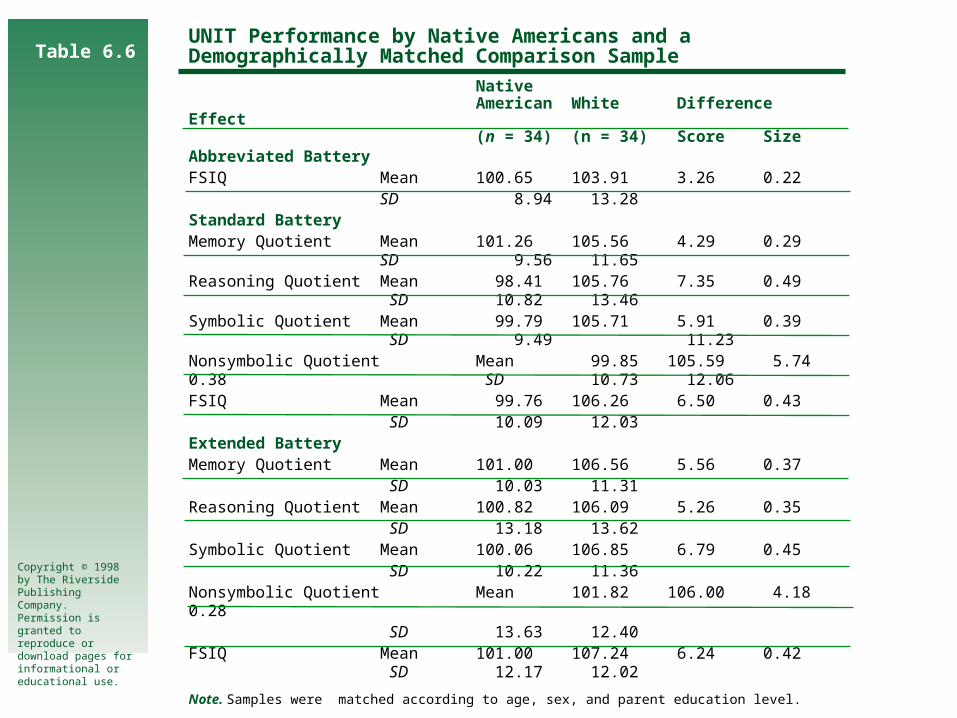
Table 6.6UNIT Performance by Native Americans and a Demographically Matched Comparison Sample
NativeAmerican White Difference
Effect(n = 34) (n = 34) Score Size
Abbreviated BatteryFSIQ Mean 100.65 103.91 3.26 0.22
SD 8.94 13.28Standard BatteryMemory Quotient Mean 101.26 105.56 4.29 0.29
SD 9.56 11.65Reasoning Quotient Mean 98.41 105.76 7.35 0.49
SD 10.82 13.46Symbolic Quotient Mean 99.79 105.71 5.91 0.39
SD 9.49 11.23Nonsymbolic Quotient Mean 99.85 105.59 5.74 0.38
SD 10.73 12.06FSIQ Mean 99.76 106.26 6.50 0.43
SD 10.09 12.03Extended BatteryMemory Quotient Mean 101.00 106.56 5.56 0.37
SD 10.03 11.31Reasoning Quotient Mean 100.82 106.09 5.26 0.35
SD 13.18 13.62Symbolic Quotient Mean 100.06 106.85 6.79 0.45
SD 10.22 11.36Nonsymbolic Quotient Mean 101.82 106.00 4.18 0.28
SD 13.63 12.40FSIQ Mean 101.00 107.24 6.24 0.42
SD 12.17 12.02
Note. Samples were matched according to age, sex, and parent education level.
Copyright © 1998 by The Riverside Publishing Company. Permission is granted to reproduce or download pages for informational or educational use.
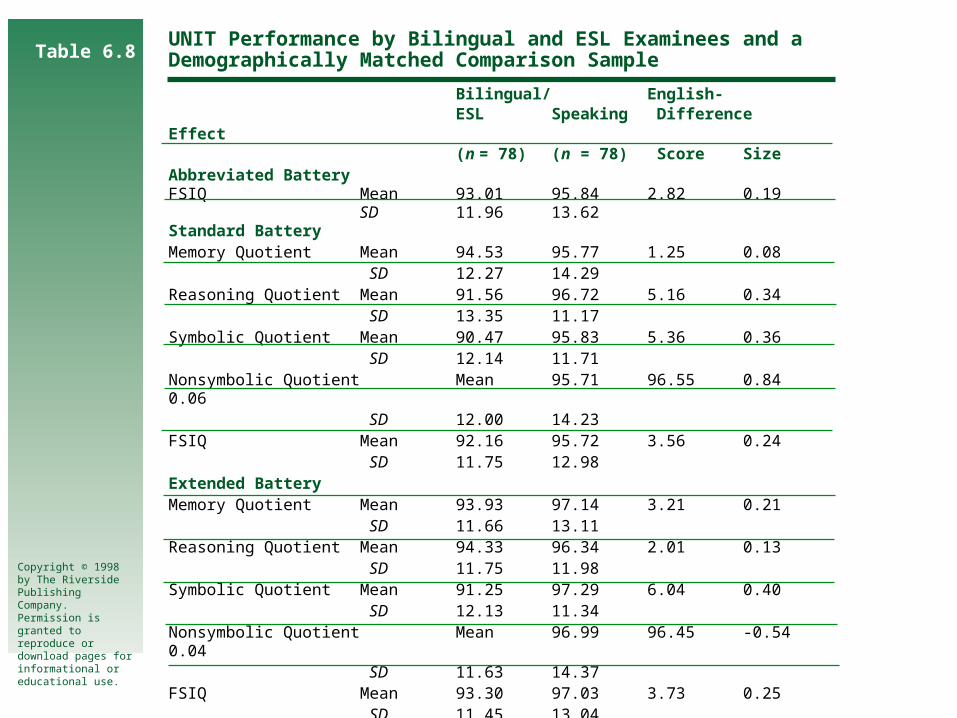
Table 6.8UNIT Performance by Bilingual and ESL Examinees and a Demographically Matched Comparison Sample
Bilingual/ English-ESL Speaking Difference
Effect(n = 78) (n = 78) Score Size
Abbreviated BatteryFSIQ Mean 93.01 95.84 2.82 0.19
SD 11.96 13.62Standard BatteryMemory Quotient Mean 94.53 95.77 1.25 0.08
SD 12.27 14.29Reasoning Quotient Mean 91.56 96.72 5.16 0.34
SD 13.35 11.17Symbolic Quotient Mean 90.47 95.83 5.36 0.36
SD 12.14 11.71Nonsymbolic Quotient Mean 95.71 96.55 0.84 0.06
SD 12.00 14.23FSIQ Mean 92.16 95.72 3.56 0.24
SD 11.75 12.98Extended BatteryMemory Quotient Mean 93.93 97.14 3.21 0.21
SD 11.66 13.11Reasoning Quotient Mean 94.33 96.34 2.01 0.13
SD 11.75 11.98Symbolic Quotient Mean 91.25 97.29 6.04 0.40
SD 12.13 11.34Nonsymbolic Quotient Mean 96.99 96.45 -0.54 0.04
SD 11.63 14.37FSIQ Mean 93.30 97.03 3.73 0.25
SD 11.45 13.04Note. Samples were matched according to age, sex, and parent education level.
Copyright © 1998 by The Riverside Publishing Company. Permission is granted to reproduce or download pages for informational or educational use.

Table 6.9 UNIT Performance by Deaf and Hearing-Impaired Examinees and a Demographically Matched Comparison Sample
Hearing- Non-Hearing- Difference EffectImpaired Impaired Score Size(n = 106) (n = 106)
Abbreviated BatteryFSIQ Mean 94.92 98.52 3.59 0.24
SD 14.10 14.77Standard BatteryMemory Quotient Mean 93.43 97.77 4.34 0.29
SD 16.06 14.51Reasoning Quotient Mean 91.35 97.23 5.88 0.39
SD 13.40 15.74Symbolic Quotient Mean 92.38 97.57 5.19 0.35
SD 14.46 14.26Nonsymbolic Quotient Mean 92.59 97.42 4.83 0.32
SD 14.62 15.15FSIQ Mean 91.40 97.60 6.20 0.41
SD 14.72 14.57Extended BatteryMemory Quotient Mean 92.67 98.00 5.33 0.36
SD 16.25 14.30Reasoning Quotient Mean 93.48 99.40 5.92 0.39
SD 13.83 14.72Symbolic Quotient Mean 91.96 97.85 5.90 0.39
SD 14.63 14.31Nonsymbolic Quotient Mean 93.78 99.80 6.03 0.40
SD 15.36 14.04FSIQ Mean 90.90 98.91 8.01 0.53
SD 14.83 14.02
Note. Samples were matched according to age, sex, race, ethnicity, and parent education level.
Copyright © 1998 by The Riverside Publishing Company. Permission is granted to reproduce or download pages for informational or educational use.
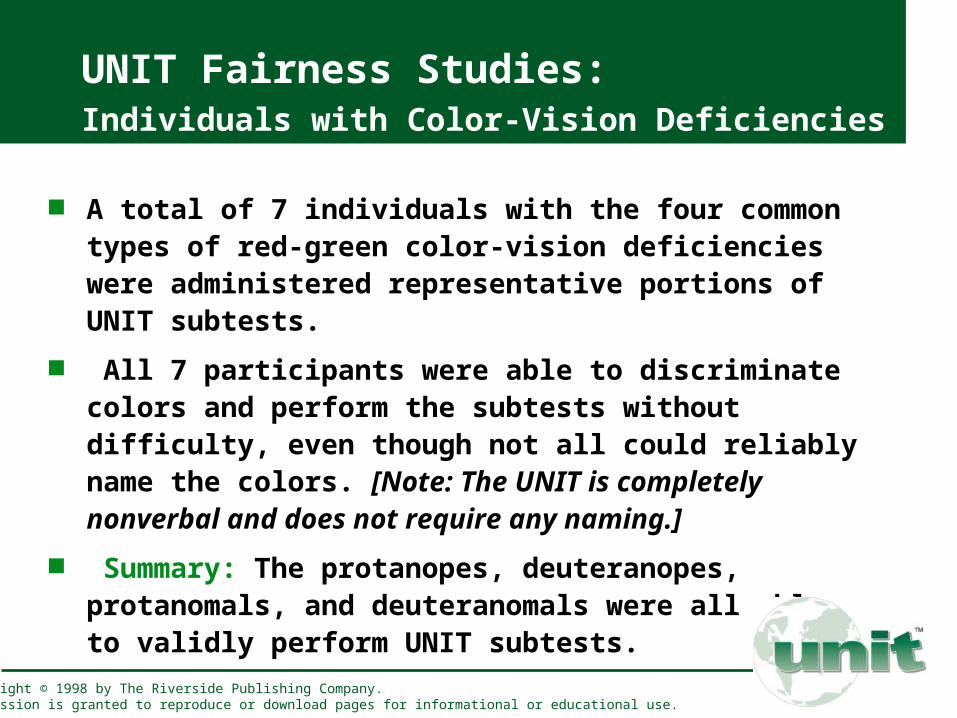
UNIT Fairness Studies: Individuals with Color-Vision Deficiencies
A total of 7 individuals with the four common types of red-green color-vision deficiencies were administered representative portions of UNIT subtests.
All 7 participants were able to discriminate colors and perform the subtests without difficulty, even though not all could reliably name the colors. [Note: The UNIT is completely nonverbal and does not require any naming.]
Summary: The protanopes, deuteranopes, protanomals, and deuteranomals were all able to validly perform UNIT subtests.
Copyright © 1998 by The Riverside Publishing Company. Permission is granted to reproduce or download pages for informational or educational use.
Clinical Use and Interpretation
1. Interpret FSIQ first
2. Interpret Primary and Secondary Scales
3. Interpret Subtests Ipsatively and Normatively
Copyright © 1998 by The Riverside Publishing Company. Permission is granted to reproduce or download pages for informational or educational use.

Clinical Use and Interpretation: FSIQ
Copyright © 1998 by The Riverside Publishing Company. Permission is granted to reproduce or download pages for informational or educational use.
Table 7.1 Descriptive Classifications of UNIT Scales Standard Scores
Percent IncludedTheoreticalNormal Abbreviated Standard Extended
Standard Scores Classification Curve FSIQ FSIQ FSIQ130 and above Very Superior 2.2 1.9 1.9 1.9120-129 Superior 6.7 8.2 6.7 6.5110-119 High Average 16.1 14.5 19.3 19.890-109 Average 50.0 51.3 50.2 50.080-89 Low Average 16.1 15.5 14.3 13.470-79 Delayed 6.7 6.0 5.5 5.669 and below Very Delayed 2.2 2.7 2.2 2.8
Delayed
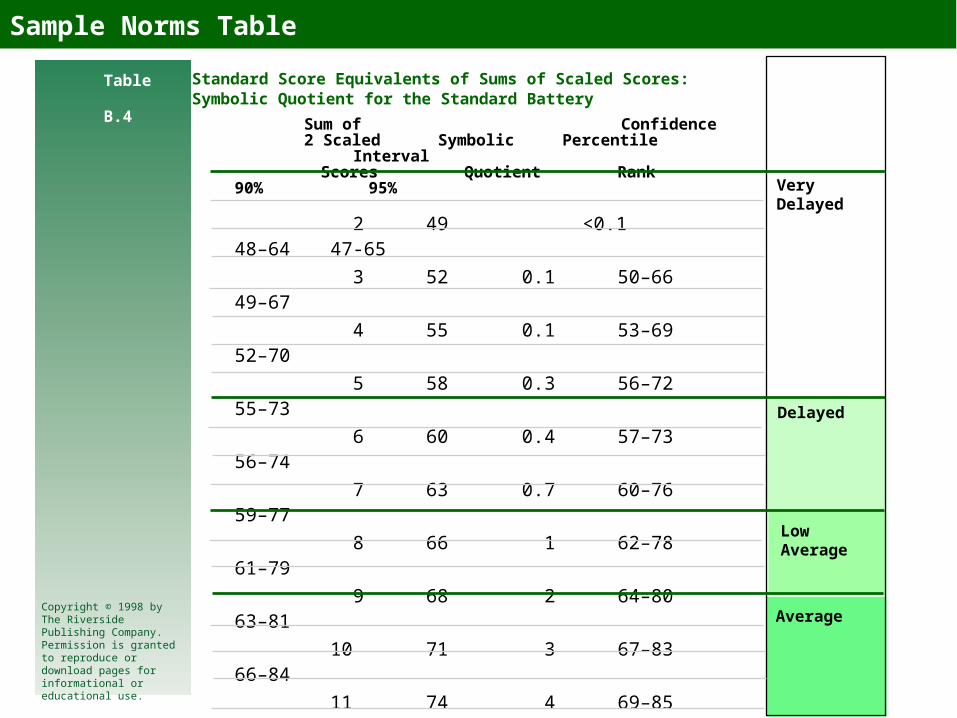
Sample Norms Table
Sum of Confidence 2 Scaled Symbolic Percentile Interval
Scores Quotient Rank 90% 95%
2 49 <0.1 48–64 47-65
3 52 0.1 50–66 49–67
4 55 0.1 53–69 52–70
5 58 0.3 56–72 55–73
6 60 0.4 57–73 56–74
7 63 0.7 60–76 59–77
8 66 1 62–78 61–79
9 68 2 64–80 63–81
10 71 3 67–83 66–84
11 74 4 69–85 68–86
12 76 5 71–87 70–88
13 79 8 74–90 73–91
14 82 12 76–92 75–93
15 85 16 79–95 78–96
16 87 19 81–97 80–98
17 90 25 83–99 82–100
18 93 32 86–102 85–103
19 97 42 89–105 88–106
20 100 50 92–108 91–109
VeryDelayed
LowAverage
Average
Table B.4 Standard Score Equivalents of Sums of Scaled Scores:Symbolic Quotient for the Standard Battery
Copyright © 1998 by The Riverside Publishing Company. Permission is granted to reproduce or download pages for informational or educational use.

Memory > Reasoning
1. Examinee's short-term memory skills are better developed than nonverbal reasoning.
2. Examinee's ability to comprehend and reproduce visual stimuli is better developed than the ability to analyze, synthesize, or reorganize visual stimuli.
3. Examinee's attention to relevant details is better developed than concentrated problem-solving abilities.
Individuals with this pattern of scale scores may learn best through exposure to concrete, factual information, with memory aids, as opposed to discovery learning activities. For example, reading instruction might include considerable sight-word repetition, as opposed to a more whole-language approach; instruction in higher order knowledge (e.g., comprehension, synthesis, evaluation) should be based on well-learned rules, principles, and laws (e.g., science principles, grammar rules); learning may be aided through the use of mnemonics (e.g., “a pint's a pound the world round”); generalizations of previously learned material to new problems or contexts might be facilitated by reminding students of basic concepts that guide problem solving (e.g., the area of complex geometric designs can be computed by reducing the design to a combination of familiar shapes, such as squares, rectangles, and triangles).
Interpretive Hypotheses to Guide Comparisons Between UNIT Scales
Copyright © 1998 by The Riverside Publishing Company. Permission is granted to reproduce or download pages for informational or educational use.

Interpretive Hypotheses to Guide Comparisons Between UNIT Scales
Reasoning > Memory
1. Examinee's nonverbal reasoning is better developed than short-term memory.
2. Examinee's ability to analyze, synthesize, or reorganize visual stimuli is better developedthan the ability to comprehend and reproduce visual stimuli.
3. Examinee's ability to concentrate during problem-solving activities is better than theability to attend to relevant visual details.
Individuals with this pattern of scale scores may be adept at solving unique problems thatare not highly dependent on previously learned information. Knowledge to be learnedmight best be presented through the use of relationships, comparisons, underlyingprinciples, extrapolations, and discovery learning. Memory of information should befacilitated by combining new content into existing taxonomies, categories, and strategies,with an emphasis on understanding relationships.
Copyright © 1998 by The Riverside Publishing Company. Permission is granted to reproduce or download pages for informational or educational use.
Interpretive Hypotheses to Guide Comparisons Between UNIT Scales
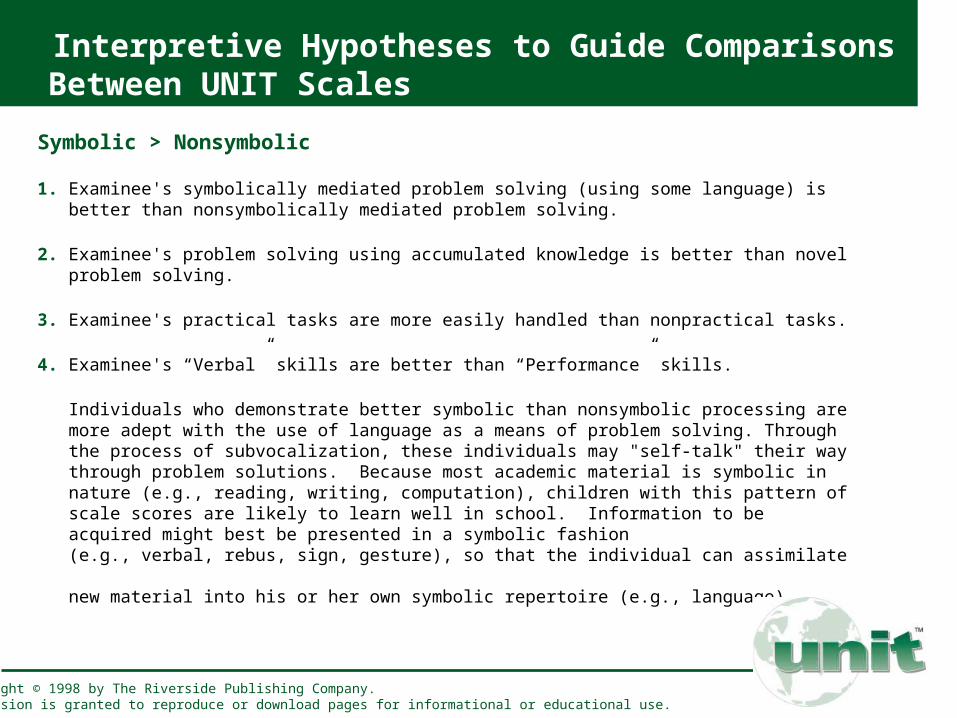
Symbolic > Nonsymbolic
1. Examinee's symbolically mediated problem solving (using some language) is better than nonsymbolically mediated problem solving.
2. Examinee's problem solving using accumulated knowledge is better than novel problem solving.
3. Examinee's practical tasks are more easily handled than nonpractical tasks.
4. Examinee's “Verbal” skills are better than “Performance” skills.
Individuals who demonstrate better symbolic than nonsymbolic processing are more adept with the use of language as a means of problem solving. Through the process of subvocalization, these individuals may "self-talk" their way through problem solutions. Because most academic material is symbolic in nature (e.g., reading, writing, computation), children with this pattern of scale scores are likely to learn well in school. Information to be acquired might best be presented in a symbolic fashion (e.g., verbal, rebus, sign, gesture), so that the individual can assimilate new material into his or her own symbolic repertoire (e.g., language).
Copyright © 1998 by The Riverside Publishing Company. Permission is granted to reproduce or download pages for informational or educational use.

Interpretive Hypotheses to Guide Comparisons Between UNIT Scales
Nonsymbolic > Symbolic
1. Examinee's nonverbal problem solving is better than symbolically mediated problem solving (language facility).
2. Examinee's immediate problem solving is better than problem solving using knowledge from accumulated experience (particularly symbols of language).
3. Examinee may have a language deficit.
4. Examinee may find practical tasks more difficult than nonpractical tasks.
5. Examinee's “Performance” skills are better than “Verbal” skills.
Individuals who demonstrate this pattern of scale scores may be adept at discerning the relationships between abstract, figural stimulus characteristics. These individuals may acquire and process information especially well through nonverbal means. In new learning situations, a visual presentation may facilitate this student's acquisition of new material (e.g., graphs, drawings). Concrete and experiential exploratory learning approaches may be especially meaningful for students with this pattern of scores.
Copyright © 1998 by The Riverside Publishing Company. Permission is granted to reproduce or download pages for informational or educational use.
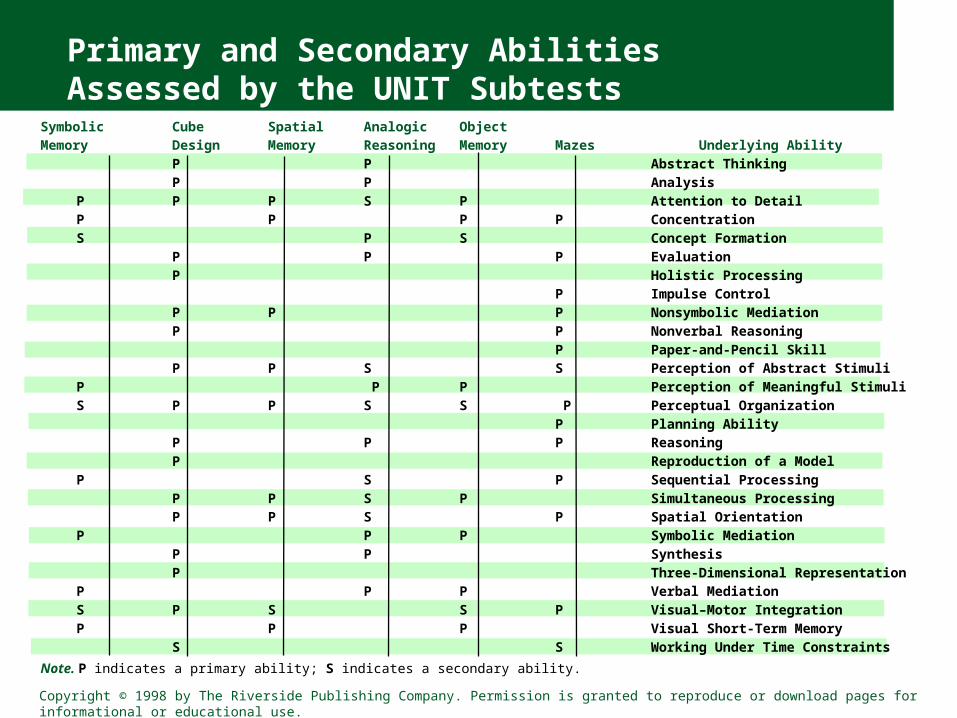
Primary and Secondary Abilities Assessed by the UNIT Subtests
Symbolic Cube Spatial Analogic Object
Memory Design Memory Reasoning Memory Mazes Underlying Ability
P P Abstract Thinking
P P Analysis
P P P S P Attention to Detail
P P P P Concentration
S P S Concept Formation
P P P Evaluation
P Holistic Processing
P Impulse Control
P P P Nonsymbolic Mediation
P P Nonverbal Reasoning
P Paper-and-Pencil Skill
P P S S Perception of Abstract Stimuli
P P P Perception of Meaningful Stimuli
S P P S S P Perceptual Organization
P Planning Ability
P P P Reasoning
P Reproduction of a Model
P S P Sequential Processing
P P S P Simultaneous Processing
P P S P Spatial Orientation
P P P Symbolic Mediation
P P Synthesis
P Three-Dimensional Representation
P P P Verbal Mediation
S P S S P Visual–Motor Integration
P P P Visual Short-Term Memory
S S Working Under Time Constraints
Note. P indicates a primary ability; S indicates a secondary ability.
Copyright © 1998 by The Riverside Publishing Company. Permission is granted to reproduce or download pages for informational or educational use.

Symbolic Memory
Reliability
Split-Half .85 Test–Retest .72
g Loading
Standard Battery .74 (Good)Extended Battery .73 (Good)
Subtest Specificity vs. 32%Error Variance 15%
Most Related to Spatial Memory
Least Related to Mazes
Primary Abilities
Shared With Other Subtests• Attention to Detail• Concentration• Perception of Meaningful Stimuli• Sequential Processing• Symbolic Mediation• Verbal Mediation• Visual Short-Term Memory
Secondary Abilities Shared With Other Subtests• Concept Formation• Perceptual Organization• Visual–Motor Integration
Copyright © 1998 by The Riverside Publishing Company. Permission is granted to reproduce or download pages for informational or educational use.

Symbolic Memory
Correlates of Subtest PerformanceAs a measure of short-term sequential and symbolic memory, an examinee’s performance on the Symbolic Memory subtest may predict such behaviors as the examinee’s ability to attend to and distinguish important from irrelevant information; organize, recall, and follow multistep directions; sequence verbal information meaningfully (e.g., story telling; reading decoding); understand and compute multistep mathematics story problems; ignore extraneous, competing information during problem solving; and, concentrate on the interrelationships between salient variables.
Copyright © 1998 by The Riverside Publishing Company. Permission is granted to reproduce or download pages for informational or educational use.

Reliability
Split-Half .91
Test–Retest .85
g Loading
Standard Battery .78 (Good)Extended Battery .73 (Good)
Subtest Specificity vs. 37%Error Variance 9%
Most Related to Spatial Memory and Analogic Reasoning
Least Related to Object Memory and Mazes
Cube Design
Copyright © 1998 by The Riverside Publishing Company. Permission is granted to reproduce or download pages for informational or educational use.
Primary Abilities Shared With Other Subtests
• Abstract Thinking • Perceptual Organization
• Analysis • Reasoning
• Attention to Detail • Reproduction of a Model
• Evaluation • Simultaneous Processing
• Holistic Processing • Spatial Orientation
• Nonsymbolic Mediation • Synthesis
• Nonverbal • Three-Dimensional
Reasoning Representation • Perception of • Visual–Motor Integration Abstract Stimuli
Secondary Abilities Shared With Other Subtests• Working Under Time Constraints

Cube Design
Correlates of Subtest PerformancePerformance on the Cube Design subtest may predict the examinee’s mechanical or graphic (e.g., artistic, drafting, geometry) competence; ability to divide aspects of problems into discrete parts for examination and recombination to provide a viable solution; tenacity in complex future problem-solving situations; reaction to activities that have deadlines or specific time limits; flexibility in evaluating and modifying solution strategies; and ability to orient in and around his or her environment (e.g., reading maps, following spatial directions).
Copyright © 1998 by The Riverside Publishing Company. Permission is granted to reproduce or download pages for informational or educational use.
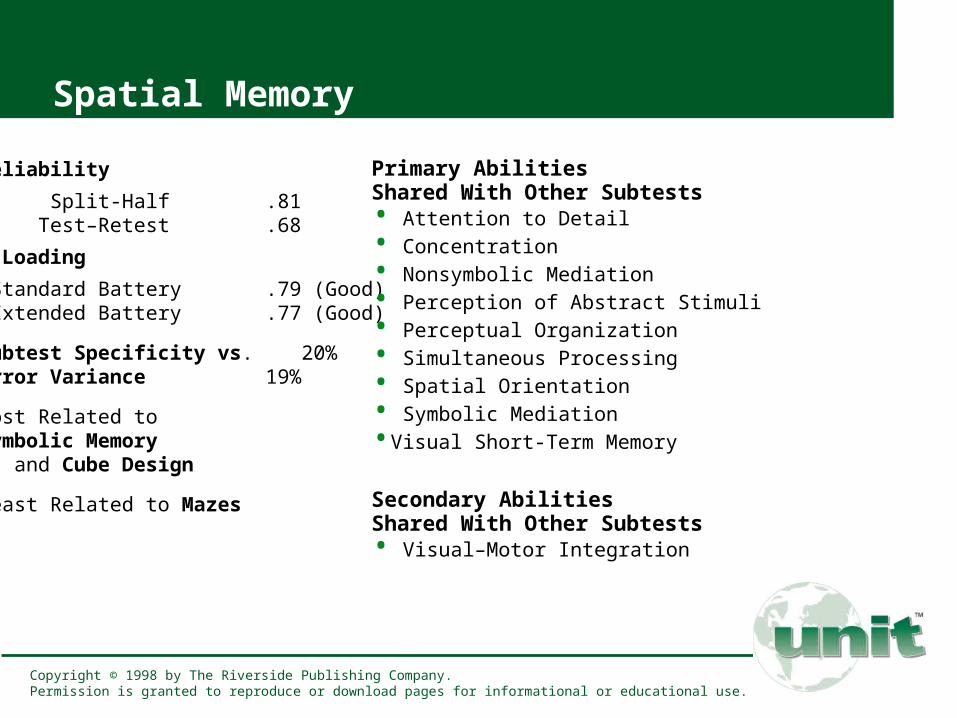
Spatial Memory
Reliability
Split-Half .81 Test–Retest .68
g Loading
Standard Battery .79 (Good) Extended Battery .77 (Good)
Subtest Specificity vs. 20%Error Variance 19%
Most Related to Symbolic Memory and Cube Design
Least Related to Mazes
Primary Abilities Shared With Other Subtests• Attention to Detail
• Concentration
• Nonsymbolic Mediation
• Perception of Abstract Stimuli
• Perceptual Organization
• Simultaneous Processing
• Spatial Orientation
• Symbolic Mediation
•Visual Short-Term Memory
Secondary Abilities Shared With Other Subtests• Visual–Motor Integration
Copyright © 1998 by The Riverside Publishing Company. Permission is granted to reproduce or download pages for informational or educational use.
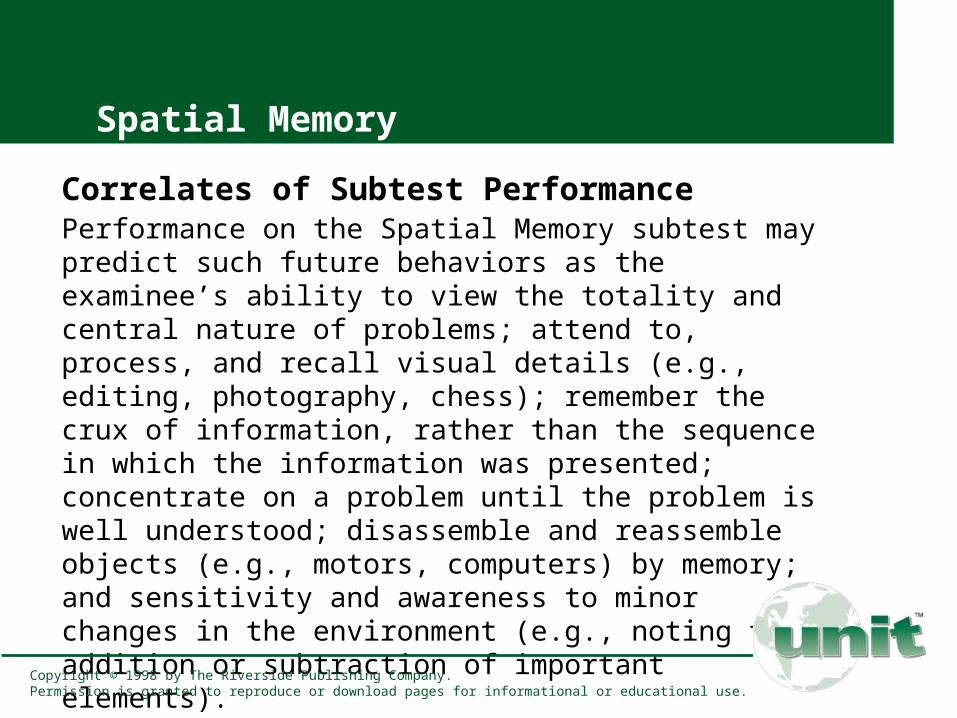
Spatial Memory
Correlates of Subtest PerformancePerformance on the Spatial Memory subtest may predict such future behaviors as the examinee’s ability to view the totality and central nature of problems; attend to, process, and recall visual details (e.g., editing, photography, chess); remember the crux of information, rather than the sequence in which the information was presented; concentrate on a problem until the problem is well understood; disassemble and reassemble objects (e.g., motors, computers) by memory; and sensitivity and awareness to minor changes in the environment (e.g., noting the addition or subtraction of important elements).
Copyright © 1998 by The Riverside Publishing Company. Permission is granted to reproduce or download pages for informational or educational use.
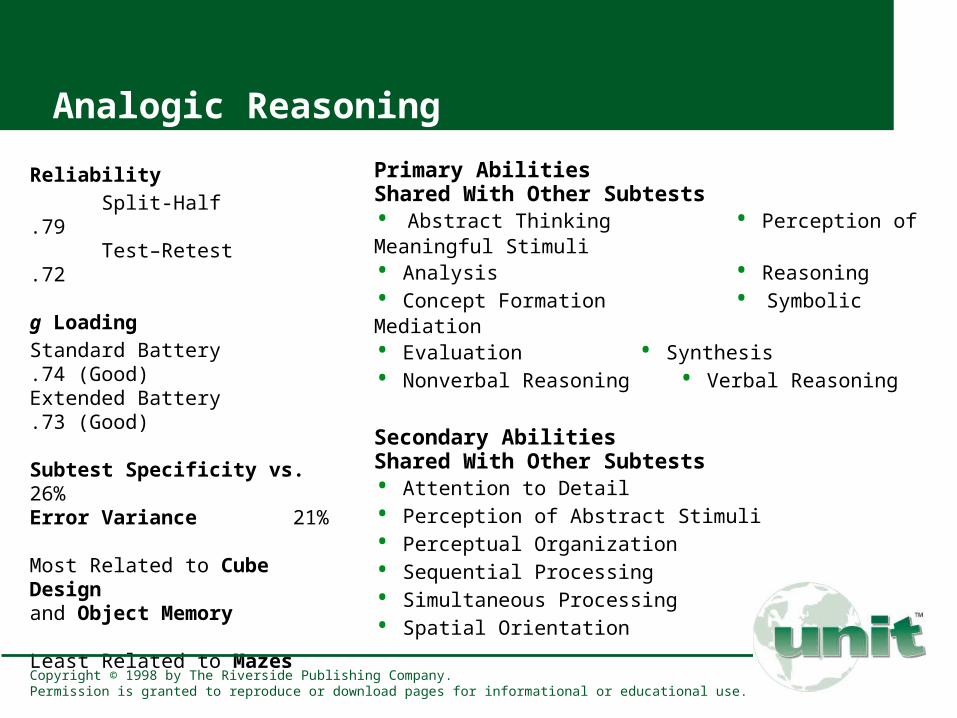
Analogic Reasoning
Reliability
Split-Half .79 Test–Retest .72
g Loading
Standard Battery .74 (Good)Extended Battery .73 (Good)
Subtest Specificity vs. 26%Error Variance 21%
Most Related to Cube Design and Object Memory
Least Related to Mazes
Primary Abilities Shared With Other Subtests• Abstract Thinking • Perception of Meaningful Stimuli
• Analysis • Reasoning
• Concept Formation • Symbolic Mediation
• Evaluation • Synthesis
• Nonverbal Reasoning • Verbal Reasoning
Secondary AbilitiesShared With Other Subtests• Attention to Detail
• Perception of Abstract Stimuli
• Perceptual Organization
• Sequential Processing
• Simultaneous Processing
• Spatial Orientation
Copyright © 1998 by The Riverside Publishing Company. Permission is granted to reproduce or download pages for informational or educational use.
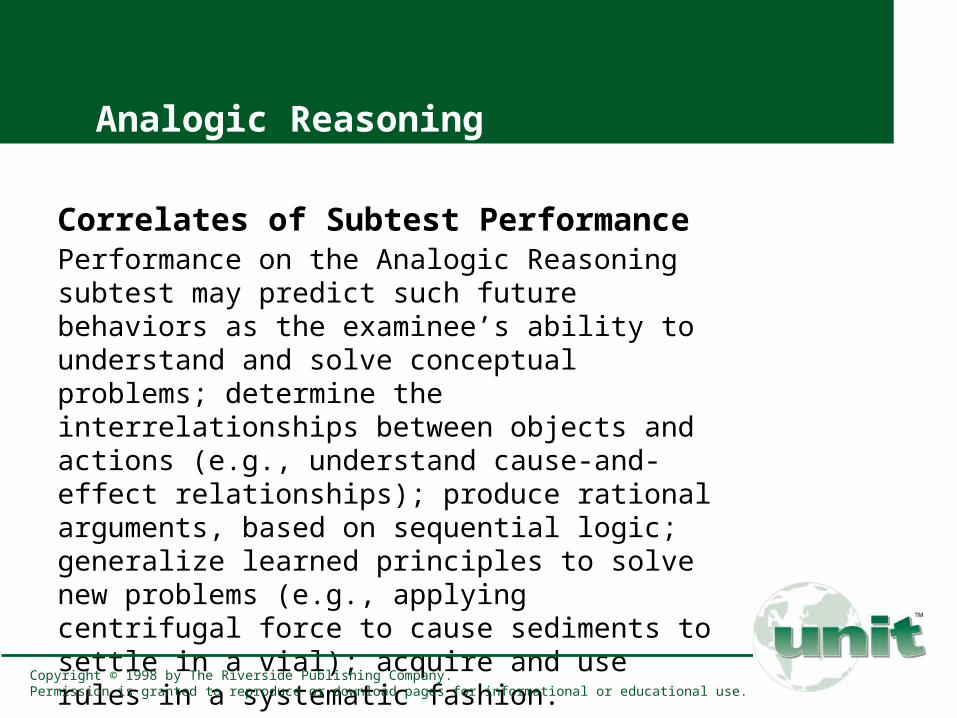
Analogic Reasoning
Correlates of Subtest PerformancePerformance on the Analogic Reasoning subtest may predict such future behaviors as the examinee’s ability to understand and solve conceptual problems; determine the interrelationships between objects and actions (e.g., understand cause-and-effect relationships); produce rational arguments, based on sequential logic; generalize learned principles to solve new problems (e.g., applying centrifugal force to cause sediments to settle in a vial); acquire and use rules in a systematic fashion.
Copyright © 1998 by The Riverside Publishing Company. Permission is granted to reproduce or download pages for informational or educational use.
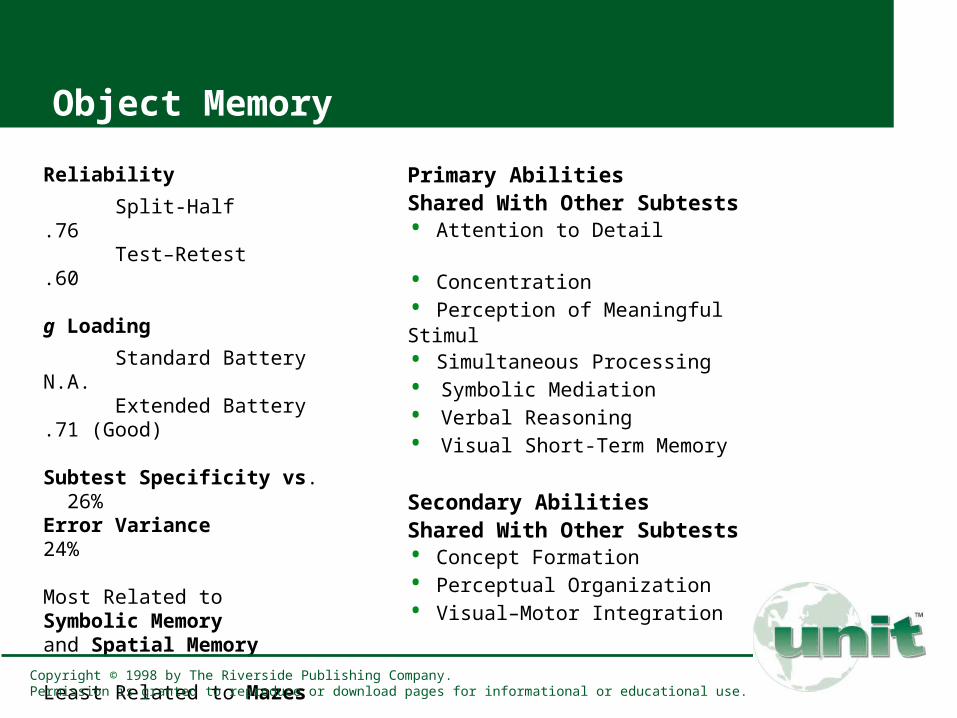
Object Memory
Reliability
Split-Half .76 Test–Retest .60
g Loading
Standard Battery N.A. Extended Battery .71 (Good)
Subtest Specificity vs. 26%Error Variance 24%
Most Related to Symbolic Memory and Spatial Memory
Least Related to Mazes
Primary Abilities Shared With Other Subtests• Attention to Detail
• Concentration
• Perception of Meaningful Stimul
• Simultaneous Processing
• Symbolic Mediation
• Verbal Reasoning
• Visual Short-Term Memory
Secondary Abilities Shared With Other Subtests• Concept Formation
• Perceptual Organization
• Visual–Motor Integration
Copyright © 1998 by The Riverside Publishing Company. Permission is granted to reproduce or download pages for informational or educational use.
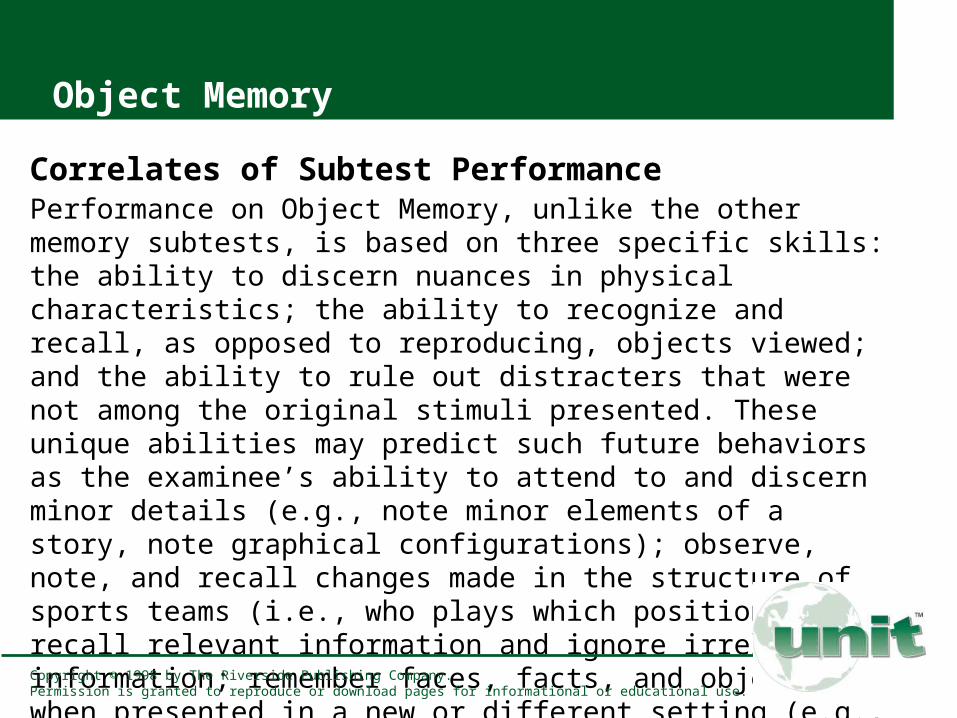
Object Memory
Correlates of Subtest PerformancePerformance on Object Memory, unlike the other memory subtests, is based on three specific skills: the ability to discern nuances in physical characteristics; the ability to recognize and recall, as opposed to reproducing, objects viewed; and the ability to rule out distracters that were not among the original stimuli presented. These unique abilities may predict such future behaviors as the examinee’s ability to attend to and discern minor details (e.g., note minor elements of a story, note graphical configurations); observe, note, and recall changes made in the structure of sports teams (i.e., who plays which position); recall relevant information and ignore irrelevant information; remember faces, facts, and objects when presented in a new or different setting (e.g., recognizing people across social contexts); and discern when something (e.g., plan, budget, scene) has been altered.
Copyright © 1998 by The Riverside Publishing Company. Permission is granted to reproduce or download pages for informational or educational use.

Mazes
Reliability
Split-Half .64Test–Retest .58
g Loading
Standard Battery N.A.Extended Battery .44 (Poor)
Subtest Specificity vs. 45%Error Variance 36%
Most Related to Cube Design and Spatial Memory
Least Related to Object Memory
Primary Abilities Shared With Other Subtests• Concentration• Evaluation• Impulse Control• Nonsymbolic Mediation• Nonverbal Reasoning• Paper-and-Pencil Skill• Perceptual Organization• Planning Ability• Reasoning• Sequential Processing• Spatial Orientation• Visual–Motor Integration
Secondary Abilities SharedWith Other Subtests• Perception of Abstract Stimuli• Working Under Time Constraints
Copyright © 1998 by The Riverside Publishing Company. Permission is granted to reproduce or download pages for informational or educational use.
Mazes
Correlates of Subtest PerformancePerformance on the Mazes subtest may predict such specific behaviors as the examinee’s ability to make, execute, and evaluate future plans; employ a reflective versus impulsive problem-solving style; concentrate and make sense of diffuse and confusing problems; make decisions after considering potential consequences; orient and organize one’s environment spatially (e.g., follow directions, read maps, follow topographical outlines); apply a logical and sequential approach to solving problems; and work under time constraints.
Copyright © 1998 by The Riverside Publishing Company. Permission is granted to reproduce or download pages for informational or educational use.