Worldwide BRT Systems: Applicability of BRT Systems in Turkey

Steering CommitteePeoria/Riverside Transit Study
February 15, 2013
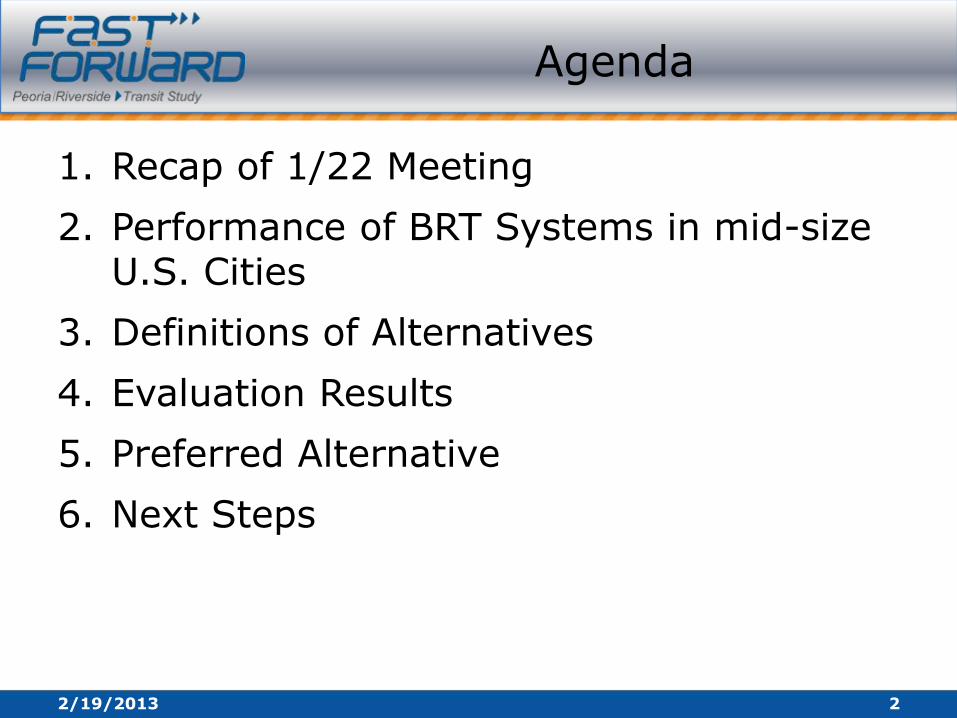
Agenda
1. Recap of 1/22 Meeting
2. Performance of BRT Systems in mid-size U.S. Cities
3. Definitions of Alternatives
4. Evaluation Results
5. Preferred Alternative
6. Next Steps
2/19/2013 2

Performance of Bus Rapid Transit Systems in the U.S.
Peoria Alternatives Analysis Steering Committee
February 15, 2013
James Wagner, AICPTransportation Projects Coordinator
INCOG
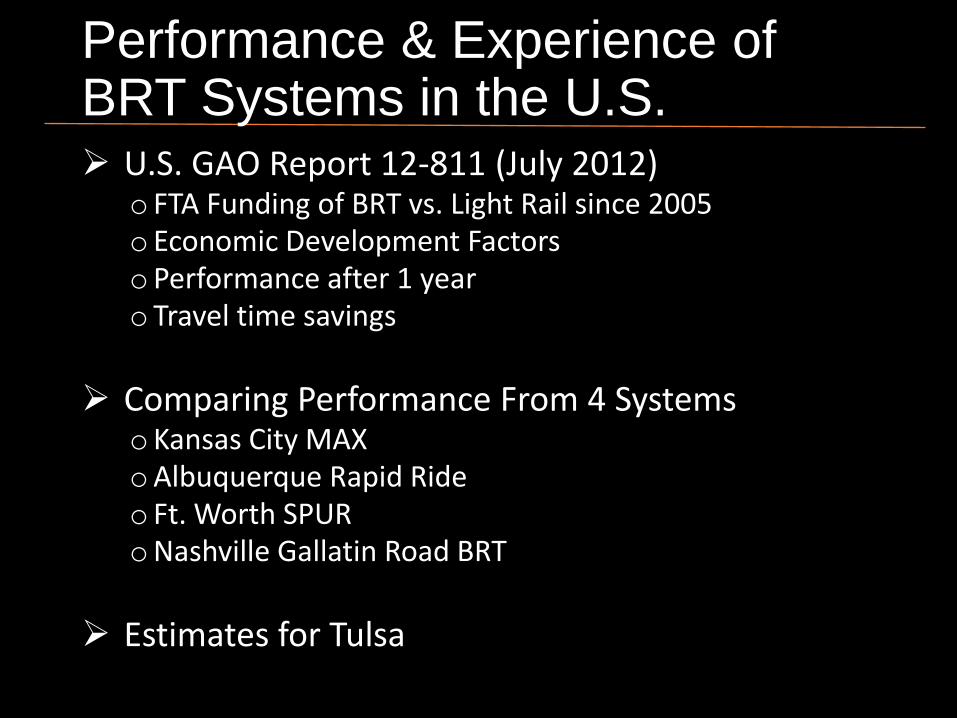
Performance & Experience of BRT Systems in the U.S. U.S. GAO Report 12-811 (July 2012)
o FTA Funding of BRT vs. Light Rail since 2005o Economic Development FactorsoPerformance after 1 yearo Travel time savings
Comparing Performance From 4 SystemsoKansas City MAXoAlbuquerque Rapid Rideo Ft. Worth SPURoNashville Gallatin Road BRT
Estimates for Tulsa
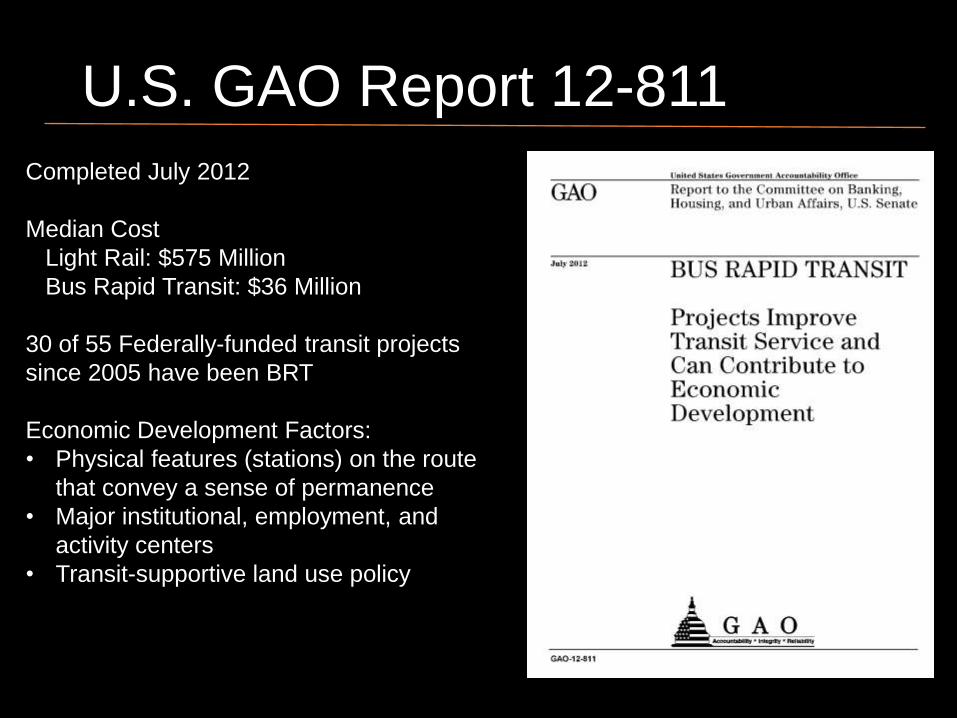
U.S. GAO Report 12-811
Completed July 2012
Median Cost
Light Rail: $575 Million
Bus Rapid Transit: $36 Million
30 of 55 Federally-funded transit projects
since 2005 have been BRT
Economic Development Factors:
• Physical features (stations) on the route
that convey a sense of permanence
• Major institutional, employment, and
activity centers
• Transit-supportive land use policy

Bus Rapid Transit Performance after 1 year
Source: GAO Report 12-811: Bus Rapid Transit: Projects Improve Transit Service and Can Contribute to Economic
Development, July 2012
80%
70% 70% 70%68%
49%
38%
21%17%
10% 9% 9%4%

Travel Time Savings
Source: GAO Report 12-811: Bus Rapid Transit: Projects Improve Transit Service and Can Contribute to Economic
Development, July 2012

BRT vs. Rail (1st Year Ridership)
Source: GAO Report 12-811: Bus
Rapid Transit: Projects Improve Transit
Service and Can Contribute to
Economic Development, July 2012

Comparison Systems & Cities
Kansas City MAX (2005)
Albuquerque Rapid Ride (2005)
Ft. Worth SPUR (2010)
Nashville Gallatin Road BRT (2009)

MAX Bus Rapid Transit – Kansas City

MAX Bus Rapid Transit – Kansas City

MAX Bus Rapid Transit Kansas City
Operating Frequency
Peak: 9 minOff Peak: 15 minEvening: 30 min
Hour Span 5am – 1am
Saturday Yes (15 min.)
Sunday Yes (30 min.)
Fare $1.50 (regular fare)
Length 8.2 miles
Cost $21 Million
Operatingstart year
2005
2004 (before BRT)Ridership: 3,622Service Hrs: 131
2011 (after BRT)Ridership: 5,483 ( 51%)Service Hrs: 201 ( 53%)
20% travel time reduction
23% of riders new to transit
Source: J. Gulbranson, Kansas City Area Transit Authority, 24 Jan 2013
Underlying Local Service: No

Rapid Ride - Albuquerque

Green Rapid
Red Rapid
Albuquerque Rapid Ride | Red and Green
Route 66 (local): 10 min. weekday
Red Route: 16 min. weekday
Green Route: 16 min. weekday
Route
Frequency

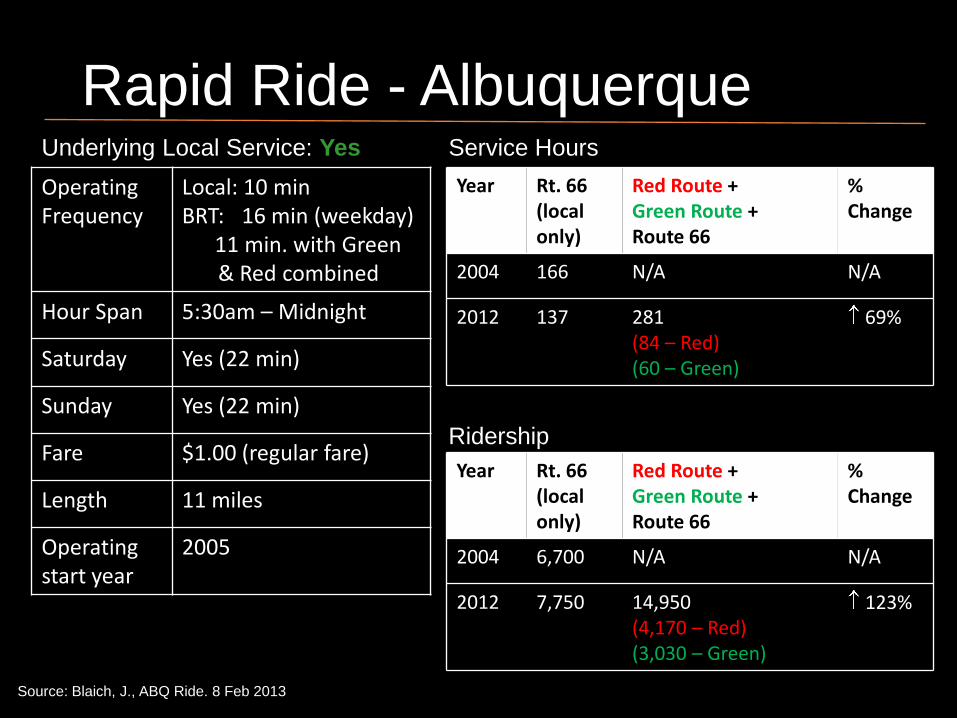
Rapid Ride - Albuquerque
Source: Blaich, J., ABQ Ride. 8 Feb 2013
Rapid Ride - Albuquerque
Source: Blaich, J., ABQ Ride. 8 Feb 2013
Operating Frequency
Local: 10 minBRT: 16 min (weekday)
11 min. with Green & Red combined
Hour Span 5:30am – Midnight
Saturday Yes (22 min)
Sunday Yes (22 min)
Fare $1.00 (regular fare)
Length 11 miles
Operatingstart year
2005
Year Rt. 66 (local only)
Red Route + Green Route + Route 66
% Change
2004 6,700 N/A N/A
2012 7,750 14,950(4,170 – Red)(3,030 – Green)
123%
Year Rt. 66 (local only)
Red Route + Green Route + Route 66
% Change
2004 166 N/A N/A
2012 137 281(84 – Red)(60 – Green)
69%
Service Hours
Ridership
Underlying Local Service: Yes

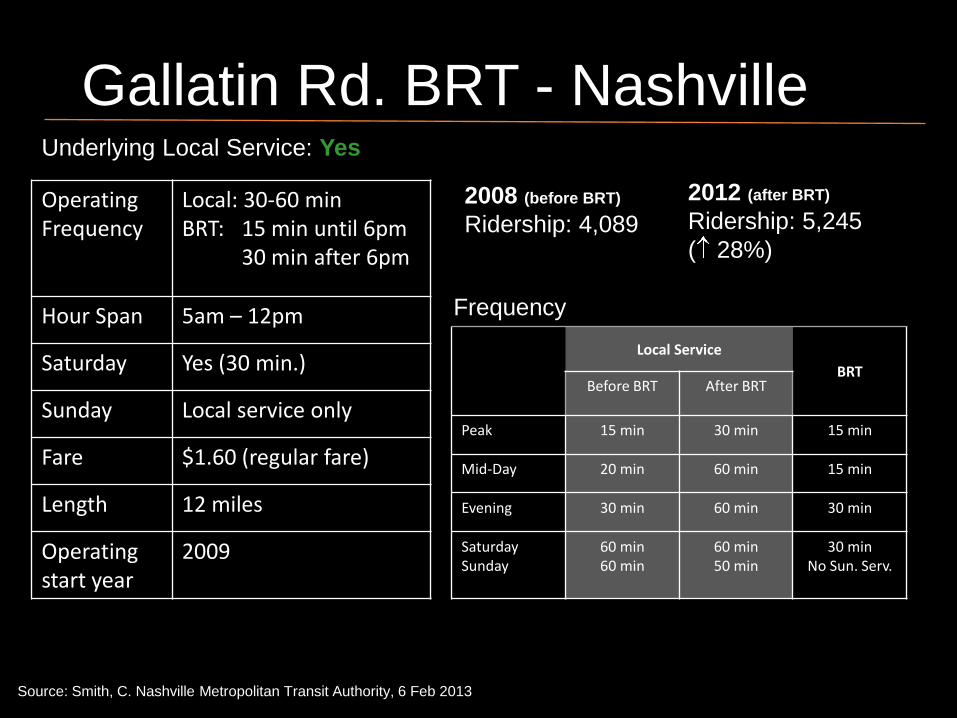
Gallatin Rd. BRT - Nashville
Gallatin Rd. BRT - Nashville
Operating Frequency
Local: 30-60 minBRT: 15 min until 6pm
30 min after 6pm
Hour Span 5am – 12pm
Saturday Yes (30 min.)
Sunday Local service only
Fare $1.60 (regular fare)
Length 12 miles
Operatingstart year
2009
Source: Smith, C. Nashville Metropolitan Transit Authority, 6 Feb 2013
2008 (before BRT)
Ridership: 4,089
Frequency
Local Service
BRTBefore BRT After BRT
Peak 15 min 30 min 15 min
Mid-Day 20 min 60 min 15 min
Evening 30 min 60 min 30 min
SaturdaySunday
60 min60 min
60 min 50 min
30 minNo Sun. Serv.
2012 (after BRT)
Ridership: 5,245
( 28%)
Underlying Local Service: Yes

SPUR – Ft. Worth
Source: Dupler, P. Ft. Worth Transit Authority “The T” 29 January 2013

SPUR – Ft. Worth
Source: Dupler, P. Ft. Worth Transit Authority “The T” 29 January 2013
Operating Frequency
Local: None*BRT: 15 min until 7pm
30 min after 7pm
Hour Span 5:00am – 1:30pm
Saturday Yes (30 min.)
Sunday Yes (60 min.)
Fare $1.75 (regular fare)
Length 7 miles
Operatingstart year
2010
Route Frequency
2009: 15 min.
2012: 15 min.
Daily Ridership
2009: 3,600
2011: 3,900( 8%)
2012: 4,300 ( 19%)
*no local service on ¾ of the route
Underlying Local Service: No
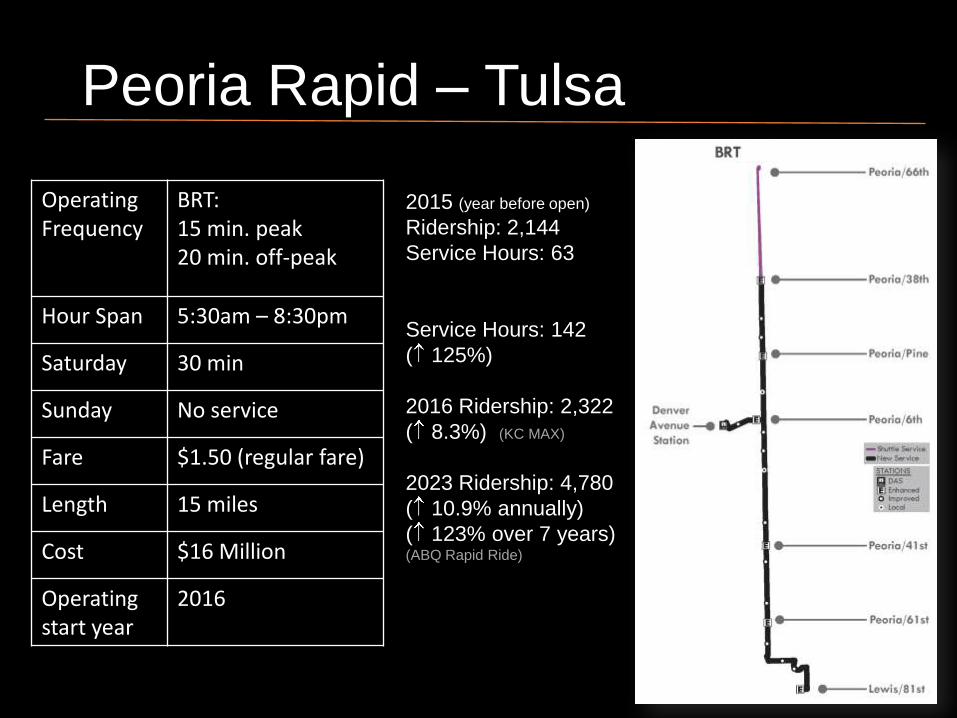
Peoria Rapid – Tulsa
Operating Frequency
BRT: 15 min. peak20 min. off-peak
Hour Span 5:30am – 8:30pm
Saturday 30 min
Sunday No service
Fare $1.50 (regular fare)
Length 15 miles
Cost $16 Million
Operatingstart year
2016
2015 (year before open)
Ridership: 2,144
Service Hours: 63
Service Hours: 142
( 125%)
2016 Ridership: 2,322
( 8.3%) (KC MAX)
2023 Ridership: 4,780
( 10.9% annually)
( 123% over 7 years) (ABQ Rapid Ride)

Ridership & Productivity
1,908 2,022 2,144
2,322 2,574
2,854
3,164
3,508
3,889
4,312
4,780
-
5.00
10.00
15.00
20.00
25.00
30.00
35.00
40.00
45.00
50.00
-
1,000
2,000
3,000
4,000
5,000
6,000
2013 2014 2015 2016 2017 2018 2019 2020 2021 2022 2023
Rid
ers
Per
Ho
ur
(Wee
kday
)
Rid
ersh
ip (
Wee
kday
)
2013-2023 Ridership Estimates - Peoria Corridor
Ridership Riders per Hour
Op
en
ing Y
ea
r
System-Wide
Riders/Hour:
17.5
System-Wide Riders
per Hour
Estimates based on experience with Kansas City MAX and Albuquerque Rapid Ride after 7 years of service and similar revenue hours increases

Sources:
Bus Rapid Transit: Projects Improve Transit Service and Can Contribute to
Economic Development. U.S. Government Accountability Office. GAO
Report GAO-12-811. July 2012. http://www.gao.gov/products/GAO-12-811
Performance and Lessons from the Implementation of BRT in the United
States. Darido, G., Diaz, R., Kim, E., Schimek, P. Transportation Research
Board Annual Meeting Proceedings, 2007.
BRT Update. Kaiser, K. Mass Transit. April/May 2011.
J. Gulbranson, Kansas City Area Transit Authority, 24 Jan 2013
Dupler, P. Ft. Worth Transit Authority “The T” 29 January 2013
Blaich, J., ABQ Ride. 8 Feb 2013


![[A4] XIAOMEI_Guangzhou BRT and New BRT in China - Ed](https://static.fdocuments.us/doc/165x107/577ce47b1a28abf1038e73a0/a4-xiaomeiguangzhou-brt-and-new-brt-in-china-ed.jpg)